Cabot Oil & Gas Slide Presentation at Merrill Lunch Energy Conference
22
INVESTOR PRESENTATION BAML Global Energy Conference November 13, 2014
-
Upload
marcellus-drilling-news -
Category
News & Politics
-
view
646 -
download
3
description
The slide presentation used by Cabot Oil & Gas at the November 2014 Merrill Lynch Energy Conference in Miami, FL. The slides provide an update on Cabot's Marcellus Shale drilling program in Susquehanna County, PA, along with details on their new and growing Eagle Ford drilling program.
Transcript of Cabot Oil & Gas Slide Presentation at Merrill Lunch Energy Conference

INVESTOR PRESENTATION BAML Global Energy Conference November 13, 2014
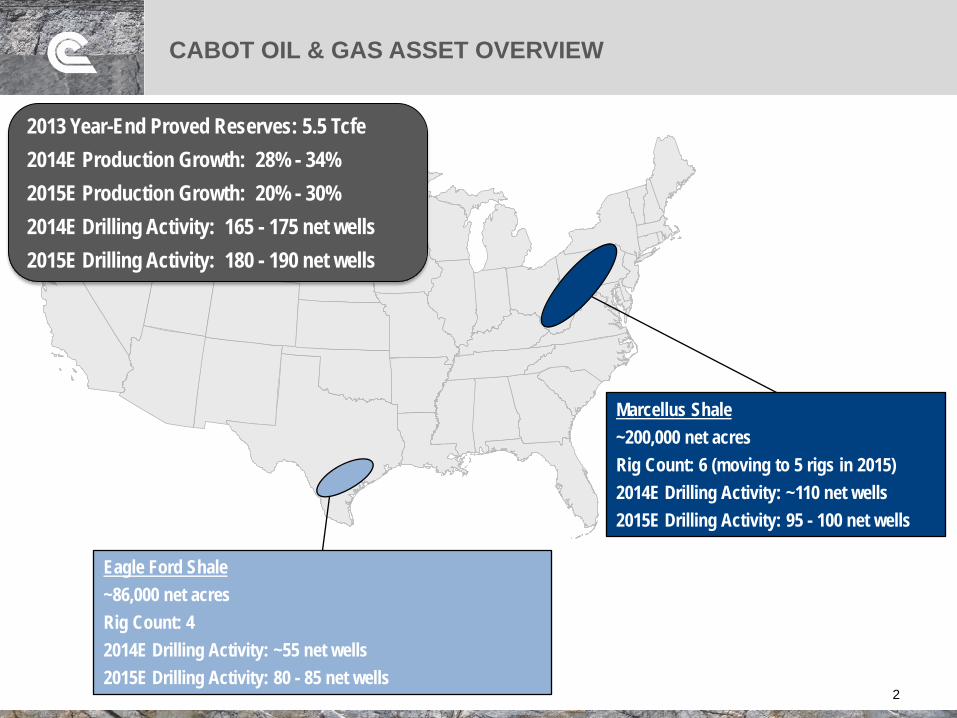
CABOT OIL & GAS ASSET OVERVIEW
2
Marcellus Shale ~200,000 net acres Rig Count: 6 (moving to 5 rigs in 2015) 2014E Drilling Activity: ~110 net wells 2015E Drilling Activity: 95 - 100 net wells
Eagle Ford Shale ~86,000 net acres Rig Count: 4 2014E Drilling Activity: ~55 net wells 2015E Drilling Activity: 80 - 85 net wells
2013 Year-End Proved Reserves: 5.5 Tcfe 2014E Production Growth: 28% - 34% 2015E Production Growth: 20% - 30% 2014E Drilling Activity: 165 - 175 net wells 2015E Drilling Activity: 180 - 190 net wells

WELL POSITIONED TO NAVIGATE A CHALLENGING MARKET IN 2015
3
Cabot’s best-in-class asset base provides competitive rates-of-return at “downside” commodity prices
– Marcellus: ~37% IRR at $2.00/Mmbtu realized price
– Eagle Ford: ~34% IRR at $70.00/Bbl realized price
Strategy is to provide returns-focused growth as opposed to “growth for the sake of growth”
– Cabot expects to generate >20% production growth in 2015 despite a challenged commodity price environment based on relatively flat drilling and completion spending
– However, we will remain flexible and may call an audible, if necessary, if our outlook changes throughout the year
– Anticipate top-tier return-on-capital despite lower realizations
– Modest level of outspend anticipated under budgeted commodity price realizations
Strong balance sheet provides financial flexibility in a low commodity price environment
– Conservative leverage position: Debt / LTM EBITDAX of 1.2x as of 9/30/2014
– Ample liquidity: $1.4 billion revolving credit facility undrawn as of 9/30/2014
– Hedge position provides downside protection: ~25% of 2015E Marcellus natural gas production hedged

KEY INVESTMENT HIGHLIGHTS
4
Extensive Inventory of Low-Risk, High-Return Drilling Opportunities
Top-Tier Production and Reserve Growth
Low Cost Structure
Strong Financial Position and Financial
Flexibility
– Over 3,000 locations in the sweet spot of the Marcellus Shale, implying 25+ years of inventory at current drilling levels
– Peer-leading rates of return and EUR per lateral foot in the Marcellus Shale
– Oil-focused initiative in the Eagle Ford Shale with 1,050 – 1,350 locations (based on 300’ to 400’ spacing)
– 2014 production growth guidance of 28% - 34%
– Initial 2015 production growth guidance of 20% - 30%
– 2013 proved reserve growth of 42% resulting in a three-year reserve CAGR of 26%
– 2013 total company all-sources finding costs of $0.55 per Mcfe
– 2013 Marcellus-only all-sources finding costs of $0.40 per Mcf
– 2014 total company per unit cash cost1 guidance of ~$1.25 per Mcfe
– 2014 Marcellus-only per unit cash cost1 guidance of ~$0.75 per Mcf
– Target investment grade leverage metrics (Debt / LTM EBITDAX2 of 1.2x as of 9/30/2014)
– $1.4 billion of borrowing capacity available under our credit facility as of 9/30/2014
– Continue to opportunistically add to our 2015 hedge position (~25% of 2015E Marcellus production is currently hedged)
1Excludes DD&A, exploration expense, stock-based compensation and pension termination expenses 2 EBITDAX is a non-GAAP measure calculated as follows: Net income + Depreciation, depletion and amortization + (Gain)/loss on sale of assets + Exploration expense + Unrealized (gain)/loss on derivative instruments + Stock-based compensation + (Earnings)/loss on equity method investments + Interest expense + Income tax expense
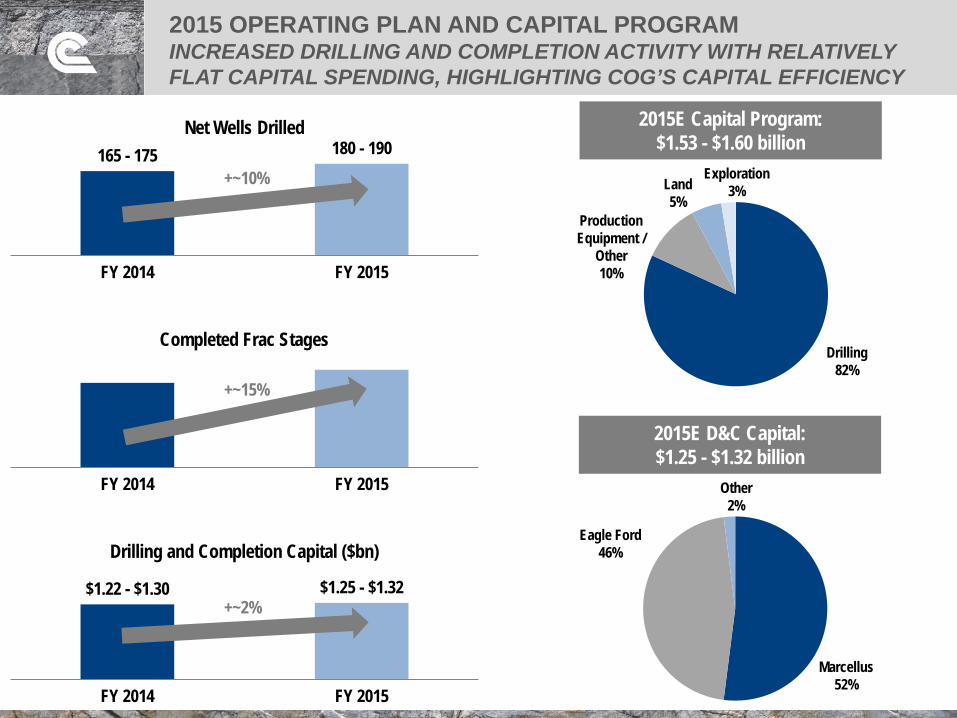
2015E Capital Program: $1.53 - $1.60 billion
Land 5%
Drilling 82%
Production Equipment /
Other 10%
Exploration 3%
2015 OPERATING PLAN AND CAPITAL PROGRAM INCREASED DRILLING AND COMPLETION ACTIVITY WITH RELATIVELY FLAT CAPITAL SPENDING, HIGHLIGHTING COG’S CAPITAL EFFICIENCY
FY 2014 FY 2015
Completed Frac Stages
165 - 175 180 - 190
FY 2014 FY 2015
Net Wells Drilled
$1.22 - $1.30 $1.25 - $1.32
FY 2014 FY 2015
Drilling and Completion Capital ($bn)
+~10%
+~15%
+~2%
2015E D&C Capital: $1.25 - $1.32 billion
Marcellus 52%
Eagle Ford 46%
Other 2%

PROVEN TRACK RECORD OF PRODUCTION GROWTH…
6
130.6
187.5
267.7
413.6
0
100
200
300
400
500
600
700
2010 2011 2012 2013 2014E 2015E
Bcfe
LiquidsGas
43.5%
42.8%
54.5%
2014 Guidance: 28% - 34%
2015 Guidance: 20% - 30%
~7% liquids in 2015, up from ~5% in 2014

…AND RESERVE GROWTH
7
2.7 3.0
3.8
5.5
0.0
1.0
2.0
3.0
4.0
5.0
6.0
7.0
8.0
9.0
2010 2011 2012 2013 2014E 2015E
Tcfe
LiquidsGas
12.3%
26.7%
41.9%
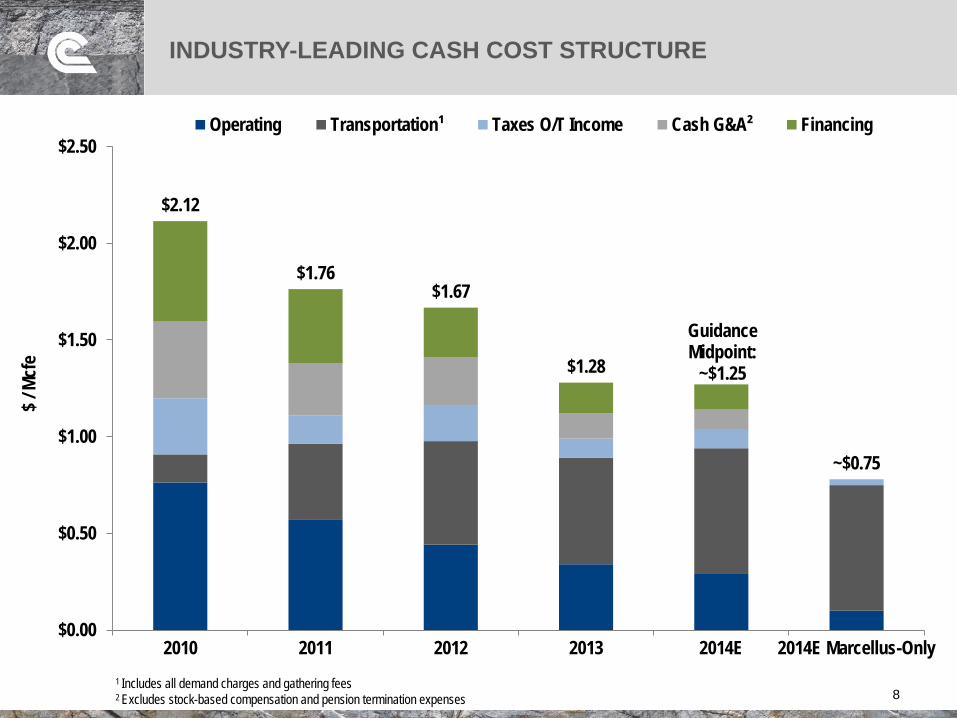
INDUSTRY-LEADING CASH COST STRUCTURE
8
$2.12
$1.76 $1.67
$1.28
Guidance Midpoint:
~$1.25
~$0.75
$0.00
$0.50
$1.00
$1.50
$2.00
$2.50
2010 2011 2012 2013 2014E 2014E Marcellus-Only
$ / M
cfe
Operating Transportation¹ Taxes O/T Income Cash G&A² Financing
1 Includes all demand charges and gathering fees 2 Excludes stock-based compensation and pension termination expenses
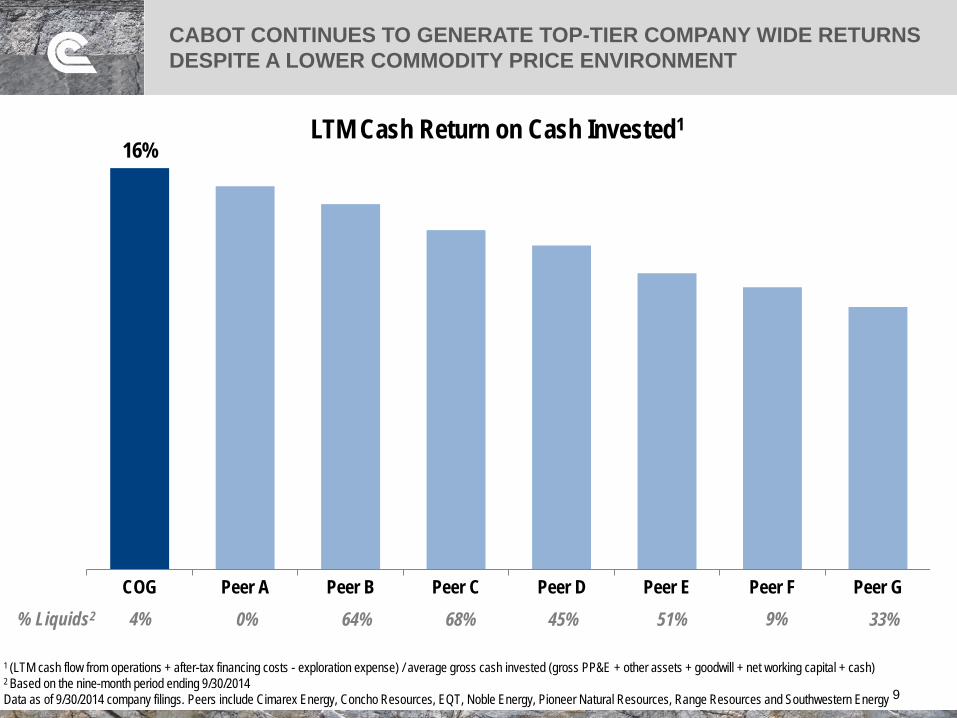
CABOT CONTINUES TO GENERATE TOP-TIER COMPANY WIDE RETURNS DESPITE A LOWER COMMODITY PRICE ENVIRONMENT
16%
COG Peer A Peer B Peer C Peer D Peer E Peer F Peer G
LTM Cash Return on Cash Invested1
% Liquids2 4% 0% 64% 68% 45% 51% 9% 33%
1 (LTM cash flow from operations + after-tax financing costs - exploration expense) / average gross cash invested (gross PP&E + other assets + goodwill + net working capital + cash) 2 Based on the nine-month period ending 9/30/2014 Data as of 9/30/2014 company filings. Peers include Cimarex Energy, Concho Resources, EQT, Noble Energy, Pioneer Natural Resources, Range Resources and Southwestern Energy
9

FOCUSED ON ENHANCING SHAREHOLDER VALUE
Repurchased 4.3mm shares YTD and 9.1mm shares since Q3 2013
10
Added 33,000 net acres in the Eagle Ford during 2014
High-graded our asset portfolio through non-core asset sales totaling over $365mm since Q3 2013 with proceeds used to
fund share repurchases and Eagle Ford expansion
Currently testing downspacing in both the Marcellus and Eagle Ford, potentially resulting in further resource / NAV expansion
Continue to test exploration concepts throughout our portfolio
Continue to optimize operating efficiencies resulting in continued cost savings

CABOT’S MARCELLUS SHALE SUMMARY
~200,000 net acres
Operated rig count: 6 (decreasing to 5 in 2015)
2015E drilling activity: 95 - 100 net wells
2015E gross daily production: 1.8 – 2.0 Bcf/d
– Production levels will ultimately be dictated by price realizations
– Flexibility to accelerate / decelerate completion capital throughout the year
Reduction in drilling and completion activity in 2015 is predicated on lower anticipated natural gas price realizations throughout Appalachia as we await the in-service of new takeaway capacity
COG plans to re-accelerate activity upon the in-service of Constitution Pipeline in late 2015 / 2016
COG’s best-in-class Marcellus assets generate >80% IRR at our 2015 budget price realization of $2.80
Currently testing 500’ downspacing between laterals, which would increase inventory / resource potential / NAV, if successful
1.5 - 1.6 1.8 – 2.0
FY 2014 FY 2015
Gross Marcellus Production (Bcf/d)
6 5
FY 2014 FY 2015
Marcellus Rig Count
$800 - $850 $650 - $700
FY 2014 FY 2015
Marcellus Drilling and Completion Capital ($mm)

2,190
1,418
824 751 746 634
498 385 346 321
Peer A COG Peer B Peer C Peer D Peer E Peer F Peer G Peer H Peer I
1H 2014 Daily Gross Production From Unconventional Horizontal Wells in Pennsylvania (Mmcfe/d)
# of Hz producing wells 656 307 693 212 262 281 387 152
Source: PA DEP Website; Peers include Anadarko Petroleum, Chesapeake Energy, Chevron, EQT, Range Resources, Seneca Resources, Southwestern Energy, Shell and Talisman 12
223 296
HIGHLY PRODUCTIVE, LOW CAPITAL INTENSITY MARCELLUS ASSETS
13 of the top 20 wells (January to June 2014) 17 of the top 20 wells (July to December 2013) 15 of the top 20 wells (January to June 2013) 10 of the top 20 wells (July to December 2012) 14 of the top 20 wells (January to June 2012) 15 of the top 20 wells (July to December 2011) 7 of the top 20 wells (January to June 2011) 10 of the top 20 wells (July to December 2010)

0%
2%
4%
6%
8%
10%
12%
14%
16%
0
500
1,000
1,500
2,000
2,500
3,000
3,500
4,000
4,500
5,000
2H 2010 1H 2011 2H 2011 1H 2012 2H 2012 1H 2013 2H 2013 1H 2014
% o
f well
s / p
rodu
ctio
n
# of p
rodu
cing
horiz
onta
l well
s
# of COG Wells # of Total Wells COG % of Wells COG % of Total Production
Source: PA DEP Website; based on horizontal producing wells only 13
CABOT HAS ACCOUNTED FOR ~14% OF PENNSYLVANIA’S PRODUCTION FROM ONLY ~6% OF THE TOTAL PRODUCING WELLS

CABOT’S EUR PER FOOT AND F&D COSTS REMAIN BEST-IN-CLASS IN THE MARCELLUS AND UTICA
$0.40
$0.60
$0.80
$1.00
$1.20
0.5
1.0
1.5
2.0
2.5
3.0
3.5
4.0
Impl
ied F
&D C
ost (
$/Mcf
e)
EUR
per 1
,000 f
t. of
late
ral (
Bcfe
)
Source: Company presentations; peers include Antero Resources, EQT Corporation, Gulfport Energy, Noble Energy, Range Resources, and Rice Energy 14
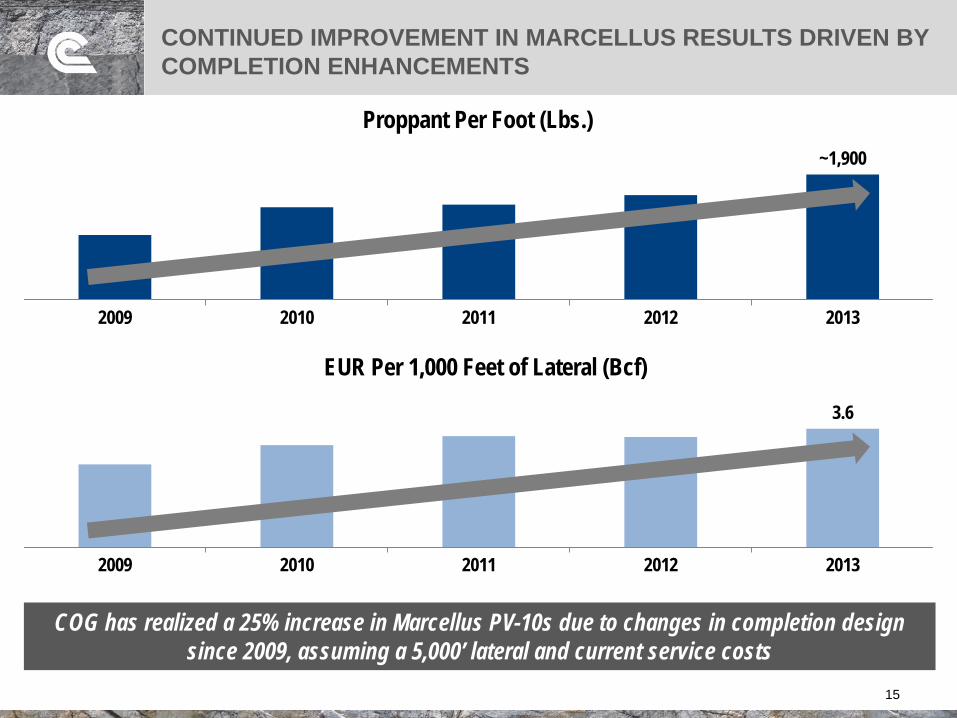
CONTINUED IMPROVEMENT IN MARCELLUS RESULTS DRIVEN BY COMPLETION ENHANCEMENTS
15
~1,900
2009 2010 2011 2012 2013
Proppant Per Foot (Lbs.)
3.6
2009 2010 2011 2012 2013
EUR Per 1,000 Feet of Lateral (Bcf)
COG has realized a 25% increase in Marcellus PV-10s due to changes in completion design since 2009, assuming a 5,000’ lateral and current service costs

CABOT’S MARCELLUS SHALE ECONOMICS
16
Typical Marcellus Well Parameters (Based on 2013 Program)
EUR: 16.9 Bcf
Well Cost: $7.0 million
Lateral Length: 4,666’
Number of Stages Per Well: 23
Average Working Interest: 100%
Average Revenue Interest: 85%
37% 65%
102%
150%
206%
0%
50%
100%
150%
200%
250%
$2.00 $2.50 $3.00 $3.50 $4.00
BTA
X %
IRR
Realized Natural Gas Price ($/Mmbtu)
Typical Marcellus Well IRR Sensitivity
Cabot plans to drill longer laterals in 2014 relative to the 2013 program
>80% rate of return at 2015 budget realized price of $2.80

600 - 800
1,050 - 1,350
Gross Drilling Locations
~53,000
~86,000
Net Acres
CABOT’S EAGLE FORD SHALE SUMMARY
17
Frio
La Salle
Atascosa
McMullen
COG Eagle Ford Shale Acreage Position
Buckhorn ~75K net acres
Q1 2014 Current
~86,000 net acres
– Buckhorn: ~75,000 net acres
– Presidio: ~11,000 net acres
– ~11,000 net acres of additional exploratory acreage not included in acreage totals
Operated rig count: 4
Q3 2014 net production: 10,347 Boe/d
Plan to place 15 wells on production during Q4 2014
2015E drilling activity: 80 - 85 net wells
2015E net liquids production: 18,000 - 20,000 Bbls/d
Currently testing 300’ downspacing, which would increase gross drilling inventory from ~1,050 to ~1,350
~11 years of drilling inventory at 400’ spacing and ~14 years of drilling inventory at 300’ spacing (based on 2015 drilling program)
Presidio ~11K net acres
1
1 Gross drilling location ranges based on the difference between 300’ and 400’ spacing

0
10,000
20,000
30,000
40,000
50,000
0 30 60 90
Cum
ulat
ive O
il Pro
duct
ion
(Bbl
)
Days on Production
YTD 2014 Program (27 wells) 2013 Program (18 wells) 500 Mboe Type Curve
CABOT’S 2014 EAGLE FORD SHALE PROGRAM CONTINUES TO OUTPERFORM
18 Note: Production data has been normalized to a 7,000’ lateral; not all 27 wells included in the YTD 2014 population have 90 days of production data
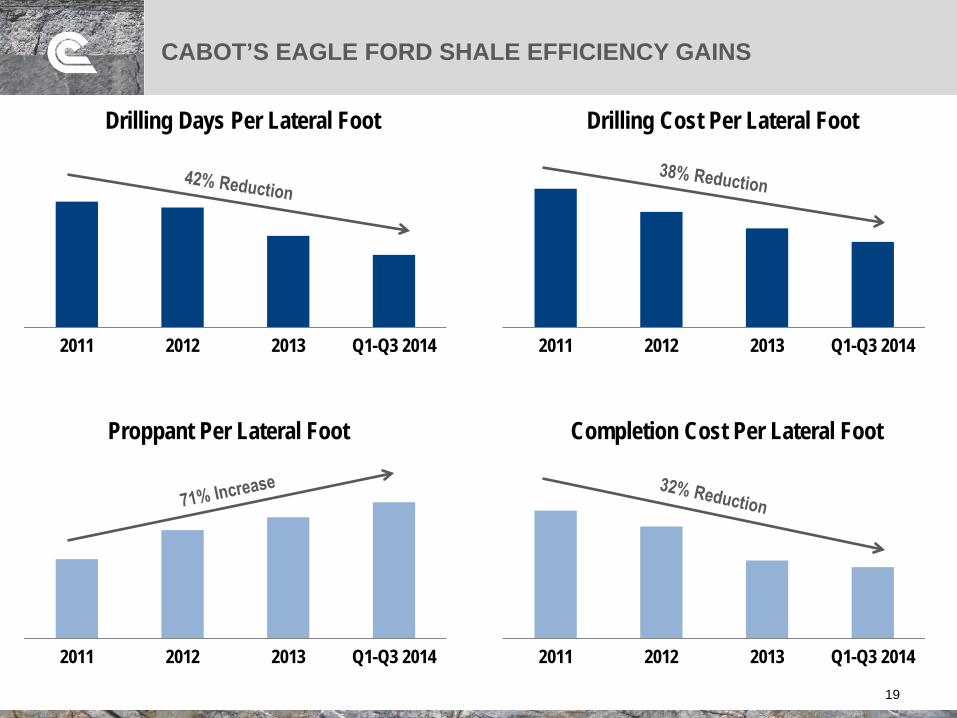
2011 2012 2013 Q1-Q3 2014
Drilling Days Per Lateral Foot
CABOT’S EAGLE FORD SHALE EFFICIENCY GAINS
19
2011 2012 2013 Q1-Q3 2014
Drilling Cost Per Lateral Foot
2011 2012 2013 Q1-Q3 2014
Proppant Per Lateral Foot
2011 2012 2013 Q1-Q3 2014
Completion Cost Per Lateral Foot

34% 48%
66%
86%
0%
20%
40%
60%
80%
100%
$70.00 $80.00 $90.00 $100.00
BTA
X %
IRR
WTI Oil Price ($/Bbl)
CABOT’S EAGLE FORD SHALE ECONOMICS
20
Typical Eagle Ford Well Parameters
EUR: ~500 MBoe
Well Cost: $7.0 million
Lateral Length: 7,000’
Product Mix: ~80% oil / 12% NGL / 8% natural gas
Average Working Interest: 100%
Average Revenue Interest: 75%
Typical Eagle Ford Well IRR Sensitivity
Note: Economics include facilities costs. Assumes Henry Hub price of $4.00 and NGL price of 40% of WTI. 1 2015 WTI strip as of 11/8/2014
>45% rate of return at current 2015 WTI strip of $791

UPDATE ON FUTURE TAKEAWAY / MARKETING OPPORTUNITIES
Constitution Pipeline • FERC issued Final Environmental Impact
Statement (EIS) on Oct. 24th • EIS confirmed that Constitution Pipeline can be
constructed in a manner that minimizes environmental impact
• FERC Order expected as early as Dec. 2014 • Target in-service: Late-2015 through 2016 • Impact to COG: ~500 Mmcf/d of firm capacity
to premium markets in Boston and Long Island
21
Future takeaway projects provide line-of-sight to over 3 Bcf/d of Cabot production by YE 2017
Leidy Southeast Expansion • FERC issued Environmental Assessment (EA)
on Aug. 11th • Target in-service: December 2015 • Impact to COG: ~125 Mmcf/d of firm sales to
shippers on Leidy Southeast; project will move ~525 Mmcf/d off of the Leidy Line and down the Atlantic Seaboard, which could be supportive to Leidy Line prices
Atlantic Sunrise (Central Penn Line) • Currently in the pre-filing process; expected to
file formal application with FERC in Mar. 2015 • ~85% of the preliminary route already surveyed • Target in-service: 2H 2017 • Impact to COG: ~850 Mmcf/d of firm capacity
(100% of volumes already sold under long-term sales contracts); project will move ~1.7 Bcf/d out of the Marcellus producing region, which could be supportive to Appalachia prices
Cove Point LNG Export Project • Dominion accepted FERC order in Sep. 2014 • Initial construction began in Oct. 2014 • Target in-service: 2H 2017 • Impact to COG: ~350 Mmcf/d of long-term
sales to Pacific Summit at Cove Point; project should be supportive to domestic natural gas prices

Thank you
The statements regarding future financial performance and results and the other statements which are not historical facts contained in this presentation are forward-looking statements that involve risks and uncertainties, including, but not limited to, market factors, the market price of natural gas and oil, results of future drilling and marketing activity, future production and costs, and other factors detailed in the Company’s Securities and Exchange Commission filings.
22