CA - Drilldown Reporting - comsoftit.com Reporting.pdf · Example: Creating a Form (EC-EIS/CO-PC)...
286
™ CA - Drilldown Reporting HELP.CAREP Release 4.6C
Transcript of CA - Drilldown Reporting - comsoftit.com Reporting.pdf · Example: Creating a Form (EC-EIS/CO-PC)...

™
CA - Drilldown Reporting
HE
LP
.C
AR
EP
Re lease 4 .6C

CA - Drilldown Reporting SAP AG
2 April 2001
Copyright
© Copyright 2000 SAP AG. All rights reserved.
No part of this brochure may be reproduced or transmitted in any form or for any purpose withoutthe express permission of SAP AG. The information contained herein may be changed withoutprior notice.
Some software products marketed by SAP AG and its distributors contain proprietary softwarecomponents of other software vendors.
Microsoft®, WINDOWS®, NT®, EXCEL®, Word® and SQL Server® are registered trademarks ofMicrosoft Corporation.
IBM®, DB2®, OS/2®, DB2/6000®, Parallel Sysplex®, MVS/ESA®, RS/6000®, AIX®, S/390®,AS/400®, OS/390®, and OS/400® are registered trademarks of IBM Corporation.
ORACLE® is a registered trademark of ORACLE Corporation, California, USA.
INFORMIX®-OnLine for SAP and Informix® Dynamic ServerTM
are registered trademarks ofInformix Software Incorporated.
UNIX®, X/Open®, OSF/1®, and Motif® are registered trademarks of The Open Group.
HTML, DHTML, XML, XHTML are trademarks or registered trademarks of W3C®, World WideWeb Consortium, Laboratory for Computer Science NE43-358, Massachusetts Institute ofTechnology, 545 Technology Square, Cambridge, MA 02139.
JAVA® is a registered trademark of Sun Microsystems, Inc. , 901 San Antonio Road, Palo Alto,CA 94303 USA.
JAVASCRIPT® is a registered trademark of Sun Microsystems, Inc., used under license fortechnology invented and implemented by Netscape.
SAP, SAP Logo, mySAP.com, mySAP.com Marketplace, mySAP.com Workplace, mySAP.comBusiness Scenarios, mySAP.com Application Hosting, WebFlow, R/2, R/3, RIVA, ABAP, SAPBusiness Workflow, SAP EarlyWatch, SAP ArchiveLink, BAPI, SAPPHIRE, ManagementCockpit, SEM, are trademarks or registered trademarks of SAP AG in Germany and in severalother countries all over the world. All other products mentioned are trademarks or registeredtrademarks of their respective companies.

SAP AG CA - Drilldown Reporting
April 2001 3
Icons
Icon Meaning
Caution
Example
Note
Recommendation
Syntax
Tip

CA - Drilldown Reporting SAP AG
4 April 2001
Contents
CA - Drilldown Reporting .............................................................................................. 8Introduction to Drilldown Reporting.......................................................................................................... 9Functional Overview.................................................................................................................................. 10Architecture of Drilldown Reporting........................................................................................................ 11Basic Concepts of Drilldown Reporting.................................................................................................. 12Basic Reports and Form Reports ............................................................................................................ 14
Basic Report ........................................................................................................................................... 17Report using a Form............................................................................................................................... 19
Report ......................................................................................................................................................... 23Creating/Changing a Report ..................................................................................................................... 25
Functions for Defining Reports............................................................................................................... 26Choosing Key Figures ............................................................................................................................ 29Choosing Characteristics........................................................................................................................ 30
Characteristic Values<0} ................................................................................................................... 31Choose Hierarchy.............................................................................................................................. 33Hierarchy Node ................................................................................................................................. 34
Replacing Variables................................................................................................................................ 35Output Type............................................................................................................................................ 37
Setting the Output Type .................................................................................................................... 39Defining HTML Templates ................................................................................................................ 41Creating an HTML Template............................................................................................................. 43
Creating an HTML Template: Special Information....................................................................... 44Report Assignment ................................................................................................................................. 46Selecting Data Step by Step................................................................................................................... 47Settings................................................................................................................................................... 48
Number Format ................................................................................................................................. 49Variables..................................................................................................................................................... 50
Variables for Characteristic Values ........................................................................................................ 52Variables for Hierarchies and Hierarchy Nodes ..................................................................................... 54Variables for Texts.................................................................................................................................. 55Variables for Formulas ........................................................................................................................... 57Defining Global Variables ....................................................................................................................... 58User Exits: Global Variables................................................................................................................... 59Example: Use of Variables ..................................................................................................................... 60Replacing Variables................................................................................................................................ 61
Maintaining Variables ........................................................................................................................ 63Characteristic Hierarchies ........................................................................................................................ 64
Entering and Using a Hierarchy Node.................................................................................................... 67Hierarchy Display ................................................................................................................................... 69Functions for Editing Hierarchies ........................................................................................................... 72
Currencies and Units of Measure ............................................................................................................ 74Example: Inverse Rates ......................................................................................................................... 77
Overview: Report/Report Interface .......................................................................................................... 79How to Use the Report/Report Interface ................................................................................................ 81Example: Report/Report Interface.......................................................................................................... 83

SAP AG CA - Drilldown Reporting
April 2001 5
Report/Report Interface: Transformation of Selection Data ................................................................... 84Forms.......................................................................................................................................................... 88Overview: Forms........................................................................................................................................ 89Creating/Changing a Form........................................................................................................................ 90
Example: Creating a Form (CO-PA)....................................................................................................... 92Example: Creating a Form (EC-EIS/CO-PC) ......................................................................................... 94Example: Creating a Form (FI)............................................................................................................... 96
Defining Elements ..................................................................................................................................... 98General Data Selection............................................................................................................................ 102Drilldown List and Defining Percentage Shares................................................................................... 103Form Settings........................................................................................................................................... 104Executing a Report .................................................................................................................................. 106Executing Reports with........................................................................................................................... 107Creating Variants and Variant Groups .................................................................................................. 108
Example of the Use of a Variant Group................................................................................................ 110Report Information .................................................................................................................................. 111
Report and Cell Parameters................................................................................................................. 112Key Figure Information ......................................................................................................................... 114Report Texts ......................................................................................................................................... 115Writing Comments ................................................................................................................................ 116
Highlight Comment.......................................................................................................................... 117Display Document ................................................................................................................................ 118Maintain Header ................................................................................................................................... 119Maintain Footer..................................................................................................................................... 120
Layout Display ......................................................................................................................................... 121Function Levels for Different Users....................................................................................................... 122How to Process Report Lists.................................................................................................................. 123Functions for Report Lists...................................................................................................................... 124Navigation ................................................................................................................................................ 130
Report List ............................................................................................................................................ 131Drilldown List ................................................................................................................................... 132Choose next level............................................................................................................................ 133Other characteristic ......................................................................................................................... 134-> Next level .................................................................................................................................... 135<- Go to previous level .................................................................................................................... 136Period screen .................................................................................................................................. 137Detail List......................................................................................................................................... 138Initial list (Report List)...................................................................................................................... 139
Scrolling Functions for Report Lists...................................................................................................... 140First Column.................................................................................................................................... 141Previous Column............................................................................................................................. 142Next Column.................................................................................................................................... 143Last Column .................................................................................................................................... 144Previous Page ................................................................................................................................. 145Next Page........................................................................................................................................ 146Other Characteristic Value .............................................................................................................. 147
Hierarchy .............................................................................................................................................. 149

CA - Drilldown Reporting SAP AG
6 April 2001
Expand ............................................................................................................................................ 150Expand to level................................................................................................................................ 151Expand all........................................................................................................................................ 152Collapse........................................................................................................................................... 153Set focus ......................................................................................................................................... 154Undo focus ...................................................................................................................................... 155Choose Hierarchy............................................................................................................................ 156Hierarchy Display ............................................................................................................................ 157
Report/Report Interface........................................................................................................................ 158Hide Characteristic ............................................................................................................................... 160Sort Characteristics .............................................................................................................................. 161Attributes............................................................................................................................................... 162Line Items ............................................................................................................................................. 163Display Master Data ............................................................................................................................. 164Find string............................................................................................................................................. 165Hotspots on the Report List .................................................................................................................. 166
Example: Navigating Using Hotspots.............................................................................................. 168Navigation in Graphical Reports........................................................................................................... 177
Defining Display Conditions................................................................................................................... 179Function Levels for Different Users ...................................................................................................... 180Creating a Ranking List ........................................................................................................................ 181Create Condition................................................................................................................................... 183
Processing Conditions..................................................................................................................... 184Overview: Exception Reporting ............................................................................................................ 185
Using Exceptions............................................................................................................................. 187Create Exception............................................................................................................................. 189
Editing Exceptions...................................................................................................................... 190Analysis Functions................................................................................................................................ 191
Functions Available on Report Lists ..................................................................................................... 192Number Format .................................................................................................................................... 193Currency ............................................................................................................................................... 194Characteristic Display........................................................................................................................... 195Totals row ............................................................................................................................................. 196
Undo totals row ............................................................................................................................... 197Totals rows... ................................................................................................................................... 198
Format Display On/Off.......................................................................................................................... 199Cumulative Display On/Off ................................................................................................................... 200Zero Display On/Off.............................................................................................................................. 202Column(s) On/Off ................................................................................................................................. 203Sort Columns........................................................................................................................................ 204Percentage/Absolute ............................................................................................................................ 205Maintain Footer..................................................................................................................................... 206Maintain Header ................................................................................................................................... 207Sort Ascending ..................................................................................................................................... 208Sort Descending ................................................................................................................................... 209Undo All Settings .................................................................................................................................. 210
Form Settings .................................................................................................................................. 211Saving, Printing, Exporting, Sending, Graphics................................................................................... 212Save........................................................................................................................................................... 213
SAP AG CA - Drilldown Reporting
April 2001 7
Freeze data .......................................................................................................................................... 214Save structure ...................................................................................................................................... 215Freezing Report Data in the Background Using Variants .................................................................... 216
Printing Reports....................................................................................................................................... 217Printing from the R/3 System ............................................................................................................... 219
Example: Mass Print Drilldown List................................................................................................. 222Printing from Word for Windows........................................................................................................... 225
Printing Graphics............................................................................................................................. 227Print Setup............................................................................................................................................ 228Printing Reports with Characteristic Hierarchies .................................................................................. 234Printing in the Background Using Variants........................................................................................... 237Setting the Print Parameters ................................................................................................................ 239Sample Printout .................................................................................................................................... 240Print Settings ........................................................................................................................................ 244
Print row by row............................................................................................................................... 245Print Preview ................................................................................................................................... 246Format Display On/Off .................................................................................................................... 247Maintain Footer ............................................................................................................................... 248Maintain Header .............................................................................................................................. 249Page break ...................................................................................................................................... 250Mass print settings .......................................................................................................................... 251Optimal / set .................................................................................................................................... 252Other settings... ............................................................................................................................... 253Column(s) On/Off ............................................................................................................................ 254Sort Columns................................................................................................................................... 255Set to default ................................................................................................................................... 256Set column width ............................................................................................................................. 257SAP Title Page On/Off .................................................................................................................... 258Maintain Title Page.......................................................................................................................... 259Underscore...................................................................................................................................... 260Number format ................................................................................................................................ 261
Exporting Reports ................................................................................................................................... 262Transferring Reports to XXL................................................................................................................. 264Transfer Page to XXL........................................................................................................................... 266Save as File.......................................................................................................................................... 267Transfer to MS Word ............................................................................................................................ 268
Graphic to Word On/Off .................................................................................................................. 269Copy to Report Portfolio ....................................................................................................................... 270
Send .......................................................................................................................................................... 271Graphics ................................................................................................................................................... 272Optimizing Performance ......................................................................................................................... 278Summarization Levels............................................................................................................................. 280Example: Optimizing Performance ........................................................................................................ 284Reorganization and Conversion ............................................................................................................ 285

CA - Drilldown Reporting SAP AG
CA - Drilldown Reporting
8 April 2001
CA - Drilldown Reporting
Introduction to Drilldown Reporting [Page 9]
Report [Page 23]
Form [Page 88]
Executing a Report [Page 106]
How to Process Report Lists [Page 123]
Saving, Printing, Exporting, Sending, Graphics [Page 212]
Optimizing Performance [Page 278]
Reorganization and Conversion [Page 285]

SAP AG CA - Drilldown Reporting
Introduction to Drilldown Reporting
April 2001 9
Introduction to Drilldown ReportingThis chapter explains the basic concepts of drilldown reporting as well as the most importantCustomizing settings.
Functional Overview [Page 10]
Architecture of Drill-Down Reporting [Page 11]
Basic Concepts of Drill-Down Reporting [Page 12]
Basic Reports and Form Reports [Page 14]
CA - Drilldown Reporting SAP AG
Functional Overview
10 April 2001
Functional OverviewWith drilldown reporting, SAP provides you with an interactive information system to let youevaluate the data collected in your application. This information system is capable of analyzing allthe data according to any of the characteristics that describe the data. You can also use any keyfigures you wish to categorize your data. You can display a number of objects for a given keyfigure, or a number of key figures for a given object. In addition, the system lets you carry out anynumber of variance analyses (such as plan/actual comparisons, fiscal year comparisons,comparisons of different objects, and so on).
You can produce both simple, data-directed lists (basic reports) and complex, formatted lists indrilldown reporting (form reports).
Drilldown report provides you with comfortable functions for navigating through your data. Forexample, you can jump to the next level of detail or the next report object on the same level, hideindividual levels and switch between the detail and drilldown lists. It also provides a number ofadditional functions which let you process lists interactively (sorting, conditions, ranking lists, andso on). SAP Graphics, SAPmail and the Excel List Viewer are also integrated into drilldownreporting.
The drilldown functions are divided into three groups which differ in the number of functionsavailable. That way each user can choose the functional level most suited for his requirements.
In addition to the online functions for displaying reports, drilldown reporting also providesfunctions which let you print reports. A number of formatting functions are available to let youdetermine the look of your printed reports (page breaks, headers and footers, underscores, andso on).
The menus and the functions available directly on the drilldown report make it easy to use theinformation system.

SAP AG CA - Drilldown Reporting
Architecture of Drilldown Reporting
April 2001 11
Architecture of Drilldown ReportingAs shown in the following diagram, you can use characteristics, key figures and forms to defineyour reports. When you create a report, the result is a series of lists and graphics which you candisplay on the screen. You can also print reports, send them by fax, e-mail them through theInternet, and save them as files for PC applications such as Microsoft Word or Excel.
Background
Key Figures Characteristics
Forms
Report NameCreateChangeExecute
ListsGraphics
PRINT SEND EXPORT
Online Fax MS WordMS ExcelInternet

CA - Drilldown Reporting SAP AG
Basic Concepts of Drilldown Reporting
12 April 2001
Basic Concepts of Drilldown Reporting
Characteristics and characteristic valuesCharacteristics determine how your data can be classified. The SAP organizational unitsControlling area, Company code, Business area, and Division are examples ofcharacteristics. The time reference (fiscal year, period) is also a characteristic.
The master data comprise the permitted values of a given characteristic, or so-calledcharacteristic values. In this documentation, a combination of characteristics or characteristicvalues will be referred to as a report object.
A report object defined with three characteristics can be represented graphically in the form of acube. The three dimensions of the cube represent the three characteristics: In the figure below,these characteristics are the region, the division, and the customer group. Each characteristichas a number of possible characteristic values, which are represented by the small cubeswithin the overall cube. Thus one possible report object could be the region "North", the division"Pharmaceuticals", and the customer group "Wholesale".
In a report, you could display the Sales, the Sales quantity the total Sales deductions, andother values for this combination of characteristics.
Sales: 256,000 USDSales: 4,260 PiecesSales ded.: 11,500 USD
Region: NorthDivision: PharmaceuticalsCust. grp: Wholesale
- R
eg
ion
-
- Division -
- Cust
omer
gro
up -
Key figuresYour application contains a number of key figures which may be relevant for analysis purposes.Key figures include not only stored values and quantities, but also values which are calculatedfrom these based on formulas which you can define.
Examples of key figures:
• Value: Costs, sales, sales deductions
• Quantity: Number of employees, sales quantity
• Calculated value: Sales per employee and contribution margin
FormsA form constitutes the basic content and formal structure of a report list. Forms can be seen assemi-finished products, which you complete when you define an individual report. You can use
SAP AG CA - Drilldown Reporting
Basic Concepts of Drilldown Reporting
April 2001 13
characteristics both in the form and in the report itself. Likewise, you can choose key figureseither in the form or in the report.
For information on the different types of forms, see Basic Reports and Form Reports [Page 14].To learn how to create a form, see Forms [Page 88].
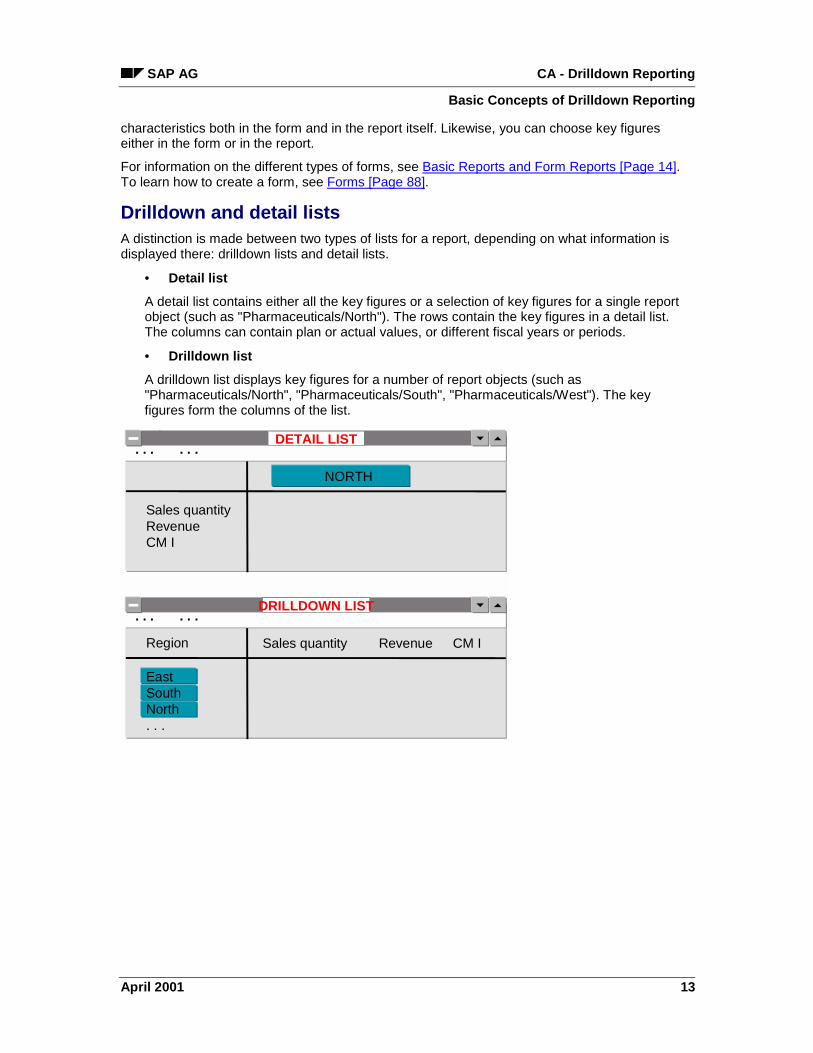
Drilldown and detail listsA distinction is made between two types of lists for a report, depending on what information isdisplayed there: drilldown lists and detail lists.
• Detail list
A detail list contains either all the key figures or a selection of key figures for a single reportobject (such as "Pharmaceuticals/North"). The rows contain the key figures in a detail list.The columns can contain plan or actual values, or different fiscal years or periods.
• Drilldown list
A drilldown list displays key figures for a number of report objects (such as"Pharmaceuticals/North", "Pharmaceuticals/South", "Pharmaceuticals/West"). The keyfigures form the columns of the list.
. . . . . .
NORTH
Sales quantityRevenueCM I
DETAIL LIST
. . . . . .
Sales quantity
EastSouthNorth. . .
DRILLDOWN LIST
Region Revenue CM I

CA - Drilldown Reporting SAP AG
Basic Reports and Form Reports
14 April 2001
Basic Reports and Form ReportsDrilldown reporting is designed to make it easy for you to define simple, ad-hoc reports while stillproviding you with all the functionality required for more complex ones.
Consequently, you can define two different types of reports:
• Basic report
This procedure is often useful when you spontaneously want to search for a specificeffect in your data without knowing in advance precisely what you are looking for orwhere to find it. The structure of the lists is simple and of a more general nature.
• Report with form or form report
In form reports the structure of the list is more complex but also allows you moreflexibility. This type is often used for official company reports, and is especially suitablefor printing reports.
Form reports are based on a structure of rows and columns called a “form”, which you defineseparately. Form reports are again divided according to the degree of complexity, depending onwhether they one axis or two, and whether or not a key figure is used in the form definition.
You can define forms with one axis to define either the row structure or the columnstructure for reports, and then mix and match these to create complete forms withtwo axes. If you do this, you can use these one-axis forms as often as you wish.
Basic report
The following text refers to the graphic Example: Basic Report [Page 17].
You do not need a form to create a basic report. When you define a basic report, you select thecharacteristics you want to report on and the key figures you are interested in seeing.
In the drilldown list, the key figures are displayed in the columns. The rows contain all thecharacteristic values of a single characteristic. For example, in the graphic, the values of thecharacteristic “Company” are displayed in the rows.
In the detail list, the key figures for the selected characteristic are listed vertically in the rows. Inthe graphic, these are the key figures for the company “Chemtech USA”.
Report using a form with one axis and without key figure
The following text refers to the graphic Example: Report Using a Form With One Axisand Without Key Figure.
In the form itself you only select characteristics for the columns. These characteristics are usedto specify the key figures more precisely (such as plan/actual or period from/to).
You choose the key figures and the drilldown characteristics (the characteristics through whosevalues you want to navigate in the report) when you define the report itself.

SAP AG CA - Drilldown Reporting
Basic Reports and Form Reports
April 2001 15
In the drilldown list, you obtain a two-line column header, in which the first line contains the keyfigures, and the second line contains the characteristics specified in the form. The values of thedrilldown characteristic are contained in the rows.
In the detail list, the characteristics specified in the form are in the columns, while the key figuresare listed in the rows. The detail list displays the results for one selected report object(“Chemtech USA” in the graphic).
Report using a form with one axis and key figure
The following text refers to the graphic Example: Report Using a Form With One Axisand Key Figure [Page 19].
Here the rows of the form contain the key figures (such as Revenue or Percentage of total).When you define the report, you choose the drilldown characteristics.
In the drilldown list, the key figures form the columns, while the values of the drilldowncharacteristics form the rows (regions “North” and “South” in the graphic).
The detail list has only one column, which contains the object which you are reporting on (region“North” in the graphic). The rows contain the key figures.
When you define a form, you define the layout of the detail list. That means that theposition of the rows and columns in the form corresponds to their position later in thedrilldown list.
Consequently, when you define a form with one axis and key figure, you define thekey figures in the rows, whereas with a form without key figure, you define theselected characteristics in the columns.
Report using a form with two axes and key figure
The following text refers to the graphic Example: Report Using a Form With TwoAxes and Key Figure.
In this type of form, you define both the rows and the columns. You can decide whether to put thekey figures and the characteristics in the rows or in the columns of the form.As with the other types of forms, you choose the drilldown characteristics when you define thereport.
In the graphic, the columns of the drilldown list have two levels. In the first row are the keyfigures, in the second row the characteristics you chose in the form. The values of the drilldowncharacteristic go in the rows.
In the detail list, the characteristics you chose in the form go in the columns, and the key figuresgo in the rows. The detail list contains information on one selected report object (region “North” inthe graphic).
To create a form, see Overview: Forms. To create a report, see Creating a Report [Page 25].

CA - Drilldown Reporting SAP AG
Basic Reports and Form Reports
16 April 2001

SAP AG CA - Drilldown Reporting
Basic Report
April 2001 17
Basic ReportFor basic reports, a form is not required. When defining a basic report, you choose thecharacteristics you want to report on. In addition to this, you choose the key figures you areinterested in.
These key figures are placed in columns in the drilldown list. The rows contain all characteristicvalues of the expanded characteristics (here, the characteristic Region).
The detail list contains the key figures for the chosen object (here, the object Illinois).
Example: Basic Report
. . . . . .
Illinois
Sales QuantityRevenueCM I
DETAIL LIST
. . . . . .
Sales Quantity
IllinoisNew Jersey. . .
DRILLDOWN LIST
REGION Revenue CM 1
DRILLDOWN CHARACTERISTICS
KEY FIGURES
E.g. DivisionRegion...
E.g. Sales QuantityRevenueDBI
REPORT DEFINITION

CA - Drilldown Reporting SAP AG
Basic Report
18 April 2001

SAP AG CA - Drilldown Reporting
Report using a Form
April 2001 19
Report using a Form
Report using a single-axis Form without Key FiguresIn a single-axis form without key figures, characteristics are only selected in the columns. Usinga formula, it is possible to define additional characteristics in the form (such as the variance as adifference between plan and actual). The characteristics selected in the form (such asplan/actual, plan/actual variance) determine which data is shown in the columns.
You choose the key figures and drilldown characteristics (that is, the characteristics whosevalues you want to choose to navigate through the report) during definition of the report. In theexample below, the characteristics branch and region are selected, together with the key figuresrevenue and contribution margin 1.
The drilldown list contains a two-row column title. The first row contains the key figures (such asrevenue) while the second row contains the selected characteristics (plan, actual, variance).The rows contain the values of the drilldown characteristics (here Illinois and New Jersey).
In the detail list, the columns contain the characteristics selected for the form, while the rowscontain the key figures. The detail list shows the result for an object for which a search has beencarried out (in this case, Illinois).

CA - Drilldown Reporting SAP AG
Report using a Form
20 April 2001
Example: Report using a single-axis form without key figures
. . . . . .
Illinois
RevenueCM I
DETAIL LIST
. . . . . .
IllinoisNew Jersey. . .
DRILLDOWN LIST
REGIONRevenue CM I
DRILLDOWN CHARACTERISTICS
KEY FIGURES
E.g. BranchRegion...
E.g. Sales QuantityRevenueCM I
Plan Act. Var.
Plan Act. Var. Plan Act. Var.
Plan Act. Var.
FORM REPORT DEFINITION
Report using a single-axis form with key figuresHere, the key figures (such as revenue, percentage of total) which appear in the rows withinthe form are determined. When defining the report, you choose the drilldown characteristics(e.g. branch, region).
In the drilldown list, the columns contains key figures, while the rows contain the values of thedrilldown characteristics (here Illinois and New Jersey).
The detail list has only one column and contains the selected object (here Illinois) which youwant to report on, while the rows contain the key figures.

SAP AG CA - Drilldown Reporting
Report using a Form
April 2001 21
Example: Report using a single-axis Form with Key
Figures
. . . . . .
Illinois
Revenue%: TotalTotal %.CM I
DETAILLISTE
. . . . . .
IllinoisNew Jersey. . .
DRILLDOWN LIST
REGION Revenue CM I
DRILLDOWN CHARACTERISTICS
E.g. BranchRegion...
FORM BERICHTSDEFINITION
% Total %
RevenuePerctge: TotalTotal PercentageCM I
Note that you set the detail list when defining a form. This means that the positionof the elements set in the form reflects those in the detail list.
For this reason, which a single-axis form with key figures, the key figures are set inthe rows. This is in contrast to the single-axis form without key figures, where thecharacteristics selected in the form are set in the columns.
Report using a two-axis Form with Key FiguresIn the two-axis form with key figures, both the rows and the columns are defines with key figuresor characteristics. These key figures can appear either in the rows or in the columns. If youchoose to have the key figures in the rows, the characteristics appear in the columns.
When defining the report, you choose the drilldown characteristics as with other types of report.

CA - Drilldown Reporting SAP AG
Report using a Form
22 April 2001
Example: Report using a two-axis Form with Key Figures
. . . . . .
Illinois
Revenue%: TotalTotal %CM I
DETAIL LIST
. . . . . .
IllinoisNew Jersey. . .
DRILLDOWN LIST
REGIONSales Quantity CM I
DRILLDOWN CHARACTERISTICS
E.g. BranchRegion...
FORM REPORT DEFINITION
Revenue
Sales QuantityRevenueCM I
1.Quart. 2.Quart. . . .
1.Quart. 2.Quart. 1.Quart. 2.Quart. 1.Quart. 2.Quart.
1.Quart. 2.Quart.
In the graphic shown here, the columns in the drilldown list contain two rows. The first rowcontains the key figures (sales quantity, revenue, contribution margin I), while the second rowcontains the selected characteristics (quarter). The rows contain the values of the drilldowncharacteristics (Illinois and New Jersey).
In the detail list, the columns contain the characteristics selected for the form, while the rowscontain the key figures. The detail list reports on a chosen object (in this case, Illinois).
For details of how to create a form, see Overview: Form.

SAP AG CA - Drilldown Reporting
Report
April 2001 23
ReportFunction What you need to know
Create report You use this function if you want to create a new report. For detaileddocumentation about this function, see Creating Reports [Page 25].
Display report You use this function if you want to display the definition of an existing report.
If you choose this function from within the definition of a report, the systemtakes you to the initial screen of the function for displaying report definitions.If you choose this function in a report list, leave the report currently beingexecuted and go to the initial screen of the function for displaying reportdefinitions. Before leaving the current screen, you can save your entriesusing a dialog box.
On the initial screen, enter the name of the desired report. You can display alist of existing reports using the Possible entries function.
You can display the various report components by scrolling through thedifferent screens. To switch back and forth between the change and displaymodes, choose Report → Display <-> Change .
Change report You use this function if you want to change the definition of an existing report.
If you choose this function from within the definition of a report, the systemtakes you to the initial screen of the function for displaying report definitions.If you choose this function in a report list, leave the report currently beingexecuted and go to the initial screen of the function for displaying reportdefinitions. Before leaving the current screen, you can save your entriesusing a dialog box.
On the initial screen, enter the name of the report you want to change. Youcan display the various report components by scrolling through the differentscreens.
You can change a number of report settings (such as the mass printsettings) directly from the report list, so that you do not have to leave the listand go to the report definition. To do this, make the desired changes to thedisplayed report, and then choose the function Save structure. If you want tochange the type of data selection (for example, by adding a characteristic ora key figure), you must use the function Report → Change.
Form settings You can use these functions to remove all formatting settings made for thereport, so that the system will again use the settings defined in the form.
Deleting report If you want to delete a report, you can do this under Change Report.However, if you want to delete a number of reports at the same time, if iseasier to do this using the Reorganization functions. For more information,see Reorganization and Conversion [Page 285]
See also:
Form [Page 88]

CA - Drilldown Reporting SAP AG
Report
24 April 2001

SAP AG CA - Drilldown Reporting
Creating/Changing a Report
April 2001 25
Creating/Changing a Report
Procedure1. Enter a name for the new report or the name of the report for which you wish to change
the definition.
2. If you are creating a new report, decide whether you would like to create a basic report ora form report.
3. If you want to create a form report, you must also enter the desired form.
4. If you would like to copy an existing report, enter the report you want to copy.
5. If you are creating a new report, choose Create, to go to Report Definition. If you wish tochange an existing report, choose Change. See the following sections:
− Choosing Key Figures [Page 29]
− Choosing Characteristics [Page 30]
− Replacing Variables [Page 61]
6. Once you have specified the desired settings for the report, save the report.
7. Now you can execute the report. For more information about executing reports, seeExecuting a Report [Page 106] or the corresponding chapter in the online documentation foryour application.
To read more about the different report types, see Basic Reports and Form Reports [Page 14].For more on creating forms, see Overview: Forms [Page 89].
See:
Report/Report Interface [Page 158]

CA - Drilldown Reporting SAP AG
Functions for Defining Reports
26 April 2001
Functions for Defining ReportsThe following table gives you an overview of the functions that you can use to define reports.
Display or change reportdefinition
You use this function to display or change the characteristics ofthe selected report. You are taken to a screen where you canmake all required settings, divided into the following sections:
• Choose key figures [Page 29]
• Choose characteristics [Page 30]
• Restrict characteristics [Page 31]
• Enter variables [Page 61]
• Output type [Page 37]
Form settings This function is only available when you define form reports. If youchanged the formatting in your report, this function lets youchange these settings back to those made in the definition of theform. The form settings thus become active again when youexecute the report.

SAP AG CA - Drilldown Reporting
Functions for Defining Reports
April 2001 27
Display <-> Change
The function Display <-> Change lets you switch back and forthbetween the display and change modes without leaving the screenyou are currently on.
When you create a report you are always in the change mode. Ifyou have made any changes to the report, the system first you ifyou want to save your changes before switching to the displaymode.
Execute report
With this function you can execute the desired report. The systemselects the data that meets the specified criteria and displays it ina number of report lists.
For more information, see Executing a Report [Page 106].
Layout display
This function allows you to obtain a quick impression of the layoutof the report, without having to make time-consuming dataselections.
For more information, see Layout display [Page 121].
Report parameters
This function displays a list containing all the information about thereport and its definition. This includes specifications which do notalways appear on the list.
For more information, see Report and Cell Parameters [Page112].
Choose hierarchy
This function is only active if hierarchies have been defined forcharacteristics. It lets you choose a specific hierarchy for displayor switch between hierarchical display and a normal drilldown list.
For more information, see Choose Hierarchy [Page 156].
Sortcharacteristics/keyfigures
This function lets you sort the drilldown characteristics that willappear in the navigation block of your report list. The firstcharacteristic here is the one whose values are displayed on theinitial drilldown list. The way in which the key figures are sortedaffects the order of the columns in the report.
For more information, see Sort Characteristics [Page 161].
Entering variables
On the Variables tab page, you can replace variables manually.You can only replace those variables which were defined withEnter when executing. Other variables are replaced automaticallyby the system.
For more information, see Replacing Variables [Page 61].
Variable on/off
You can insert a variable for the characteristic on which the cursoris positioned. When you display the possible entries, the systemdisplays any global variables which already exist for thatcharacteristic. You can choose one of these, or you can enter alocal variable.
For more information, see Variable on/off [Ext.].

CA - Drilldown Reporting SAP AG
Functions for Defining Reports
28 April 2001
Delete report
This function lets you delete the report which you are currentlyediting.
Maintain header
This function lets you create a header for the report. This headeris shown on the printout when you print the report. You can alsochange existing headers with this function.
Maintain comment
This function lets you maintain a comment for the report. You canalso change existing comments with this function.
Report Assignment
With this function you can assign receiver reports to your report sothat you can call them up later through the report/report interface.
For more information, see Report assignment [Page 46].
Translate
With this function, you can translate the texts which are displayedin a report into a target language of your choice. This is normallyalready done in Customizing. You can use the function, however,to translate newly created texts or to check the completeness ofthe translation.
Transport
With this function, you generate a transport request in order totransport a report from the implementation system into aproductive system.
Other report This function takes you back to the initial screen of the function fordefining reports. There you can specify another report that youwant to process. That report definition is then opened in thecurrent mode (display or change mode).

SAP AG CA - Drilldown Reporting
Choosing Key Figures
April 2001 29
Choosing Key FiguresYou do not always need to specify which key figures you want to see when you define a report. Ifyou are defining a report that uses a form that already contains key figures, it is not possible tochoose key figures in the report definition.
When you create any other type of report, you must choose key figures here. On the KeyFigures tab page, the system displays a list of all the available key figures. The symbol appears next to each key figure. If you click on this symbol, the system displays the formulas forcalculated key figures. You can tell from this formula which basic key figures the key figure iscalculated from.
Which key figures you can choose from depends on the field catalog (in Customizing). There youcan define for each key figure whether that key figure should appear on this screen. You can alsospecify there that a key figure must be chosen on this screen. Key figures of this kind areautomatically displayed here for informational purposes, and cannot be changed.
The definition of each key figure also determines how that key figure is aggregated. Aggregationtypes include summation, average, and last value. For example, the definition of a non-cumulative value might be "average".
Some key figures require you to choose a certain characteristic to determine the currency inwhich the values for those key figures are displayed. When you select such a key figure, thesystem requires that a unique value for that characteristic always be specified either in the formor in the report itself. It may happen that such a key figure is not offered on this screen (forexample, if you have specified an interval instead of a unique value for the characteristic). If youchoose such a key figure and have not yet chosen the relevant characteristic, the systemautomatically does so, and you are required to enter a value for that characteristic on theCharacteristic Values tab page.
You can select key figures by key figure group. These key figure groups are defined inCustomizing. If no field for the key figure group appears on this tab page, this is because no keyfigure groups have been defined for your application in Customizing.
Sorting Key FiguresYou can use this function to sort the key figures into the desired order. This order determines theorder in which they will appear in the rows or columns of your report list.
See also:
Choosing Characteristics [Page 30]

CA - Drilldown Reporting SAP AG
Choosing Characteristics
30 April 2001
Choosing CharacteristicsOn the Characteristics tab page, the system displays a list of all the available characteristics. Youcan select those characteristics in the characteristics list which you want to use for your analysis,and add them to your report using the arrow keys. These are the drill-down characteristics,which you can navigate through freely in the report list.
The systems proposes characteristics depending on settings made in the field catalog (seeCustomizing). The settings made here determine - for each individual characteristic - whether itwill be proposed when you are choosing characteristics. With Profitability Analysis reports, anadditional column indicates whether each individual characteristic is article-related, customer-related or another type of characteristic. The type of characteristic displayed depends on thesettings made in the table which the report accesses.
Here, you can also determine that a characteristic must be selected. In this case, the selection isonly displayed in the report definition. It cannot therefore be changed. It cannot therefore bechanged. If a key figure has been selected, for which the currency is dependent on a certaincharacteristic, this characteristic is automatically added to the characteristics selected by you.For example, if you have selected the key figure 'Sales in company code currency' the currency-bearing characteristic is now 'company code'. It will be mandatory to enter the characteristicwhich determines the currency, which must therefore be limited to an explicit value.
The characteristics can be proposed in characteristic groups. These groups are also created inCustomizing. If there is no entry field for characteristic groups, this means that no characteristicgroup has yet been defined in Customizing.
With the function Choose hierarchy [Page 156] you can select one of the possible hierarchyvariants for each characteristic for which hierarchies have been created.
With the function Sort Characteristics [Page 161] you determine the order of the characteristics inthe navigation block of the report list in the executed report. The order of the characteristics isdecisive for the standard drilldown.
Note that the number of characteristics offered in the characteristic selection islimited by the selection criteria created in the form. If you have already explicitlyspecified a characteristic in the form, this characteristic will no longer appear in thecharacteristic selection.
When you select a characteristic, all values of this characteristic will be taken account of in thereport. There are a number of ways in which you can limit the value quantity of a characteristicfor display in the report. For further information, see Characteristic Values [Page 31].

SAP AG CA - Drilldown Reporting
Characteristic Values
April 2001 31
Characteristic Values
UseOn the Characteristics tab page, you can limit the characteristic values to be taken into accountin the report for each drilldown characteristic selected. There are various possibilities, dependingon the report definition and the selected characteristic. You can either make no entries, fix thecharacteristic to a characteristic value or a hierarchy node, use a variable for characteristicvalues or follow a system request to fix a characteristic to an explicit value.
Characteristics which been selected on the variables tab page previously, cannot befurther limited on the characteristics tab page. In such cases, the correspondingentry fields are deactivated. For further information, see Replacing variables [Page61].
• No entry
If you do not specify a value for a characteristic here, the system selects all thecharacteristic values when you run the report. For the characteristic 'Sector', for example,you will see all sectors. Otherwise, you would see only the characteristic value(s) enteredby you, in this case “Electronics” for example.
It is recommended that you fix as many characteristic values as possible, as thisreduces the amount data selected. This improves runtime.
• Fixing the characteristic to a characteristic value
If, for example, the only value of interest to you in the Sector column is valueElectronics, you can restrict the report to this. The characteristic and the characteristicvalue then appear above the navigation block in the report list, and are fixed, meaningthat the characteristic is not available as a drilldown characteristic.
• Fixing the characteristic to a hierarchy node
In the case of characteristics for which hierarchies have been defined, you can fix thecharacteristic to a hierarchy node. This allows you to report on a specific part of acharacteristic hierarchy. You do this using the function Hierarchy node [Page 34].If, for example, a hierarchy has been defined for the characteristic ‘Customer', you could,for example, select the hierarchy node ‘Retail' and so obtain all customers which areassigned to this hierarchy node. For further information on hierarchy nodes, see Enteringand Using a Hierarchy Node [Page 67].
• Using a variable for characteristic values
Instead of a concrete value, you can also use a variable for characteristic values. Byusing a variable, you ensure that the characteristic value does not have to be specifieduntil the report is executed. You can use global variables [Page 58], which you canobtain either form the system or using a user exit. For variables of this type, you can alsodefine simple mathematical operations. For example, you can use a global variable forthe period, which will provide the current month and subtract 1 from this value, to giveyou the value for the previous month.Alternatively, you can use variables (locale or global) which the user has to enter

CA - Drilldown Reporting SAP AG
Characteristic Values
32 April 2001
manually. These variables are displayed on the Variables tab page or in a dialog boxwhen you execute the report.
To enter variables, choose Edit →→→→ Variable on/off or the Variable on/off pushbutton. SeeVariable on/off [Ext.] for more information about this function. See also Variables forCharacteristic Values [Page 52].
Note the difference between the Variable entry screen and the Characteristicselection screen:
A selection criterion which was entered under Characteristic Values, basically affectsall columns and is therefore displayed in the list header. Settings made underVariable entry only affect the row or column in which the corresponding variable wasused. For example, if the customer group Retail was set for column 1 in thevariable entry, then the customer group Wholesale could appear in column 2, andall customer groups could appear in column 3.
• The system requests that you fix a characteristic to an explicit value
In the field catalog (Customizing), a setting can be made that a characteristic must berestricted. If you find a characteristic in the list, which must be restricted, this might bebecause it is a currency-bearing characteristic. If you have chosen a key figure, for whichthe currency is dependent on a certain characteristic, this characteristic will be added tothe report automatically by the system, and must be given an explicit value or amandatory variable here. For example, if you have chosen the key figure ‘Sales incompany code currency’, the currency-bearing characteristic will now be ‘company code’.This must always be selected and specified when the accompanying key figure isselected.
SAP AG CA - Drilldown Reporting
Choose Hierarchy
April 2001 33
Choose HierarchyThis function lets you choose a specific hierarchy for display or switch between hierarchicaldisplay and a normal drilldown list. This function is only active if hierarchies exist for acharacteristic.
When you choose this function, the system displays a dialog box listing every characteristic in thereport for which hierarchies exist. For each characteristic listed, you can choose one of thehierarchy variants or the option No hierarchy, or the option Enter when executing. (This lastoption only appears when you are defining the report.)
The system initially displays the hierarchy you chose in completely expanded form. You can thencollapse and expand nodes using the corresponding functions.
You can also change the appearance of the hierarchy (see Hierarchy Display [Page 69]) ordeactivate the hierarchy again to return to the “normal” non-hierarchical display.
To report only on a certain branch of a hierarchy, choose the hierarchy node [Page 34] function.
For detailed information about hierarchies, see:
Overview: Characteristic Hierarchies [Page 64]
Hierarchy display [Page 157]
Functions for Editing Hierarchies [Page 72]

CA - Drilldown Reporting SAP AG
Hierarchy Node
34 April 2001
Hierarchy NodeThis function makes it possible for you to report on selected parts of hierarchies, or so-called“hierarchy nodes”.
To report on a hierarchy node, you need to enter a hierarchy node instead of a characteristicvalue for the desired characteristic when you define either the form or the report itself. You dothis on the screen Characteristic values by pressing the icon.
when you drill down to that characteristic in the drilldown list, the system only displays thosevalues that belong to the selected hierarchy node. For example, if you select the node “Wagecosts” for the characteristic “Cost element”, the report will only contain those cost elements thatrepresent wage costs.
You can also select an entire hierarchy instead of just one node using the Choose hierarchy[Page 156] function.
See also:
Overview: Characteristic Hierarchies [Page 64]
Entering and Using a Hierarchy Node [Page 67]
SAP AG CA - Drilldown Reporting
Replacing Variables
April 2001 35
Replacing VariablesYou can replace variables manually on the variables tab page. Only variables which can bereplaced manually appear here. Other variables are replaced automatically and do not appearhere.
Characteristics which are selected on the variables tab page cannot be furtherspecified on the characteristics tab page. In such cases, the corresponding entryfields are deactivated. For further information, see Characteristic Values [Page 31].
The question of which variables you can enter depends on the type of report.
• For basic reports, there is no user-defined form. The systems proposes certain standardvariables (such as fiscal year, period, value type) depending on the application.
• For form reports, the system displays those fields which were defined using variables in theform for this report. These fields appear in the order defined under Extras → Variables → Sortin the form definition. If the field customer group has been defined with a variable, you usethe tab page to define which customer group you want to create the report for. When youhave made this entry, the system will perform the corresponding replacement wherever theparameter appears in the report.If the form definition contains no variables, or only those which will be replaced automatically,the system does not display this tab page.
Readiness for Input
You can either specify the selected variables immediately or later, when you execute the report.If you do not wish to specify a variable until you execute the report, this variable must be readyfor input. You can make each variable ready for input when the report is executed, by choosingEnter when executing. If at least one variable can be entered manually, the system displays adialog box when you execute the report. There you can enter values for the variables or changesthe defaults defined in the report definition. If you do not select the field Entry when executing forany variables, the system immediately executes the report and displays the resulting list.
When you enter variables, the system also replaces all variables which were setduring definition of the report on the characteristics tab page, using the functionVariable on/off [Ext.]. The status of these variables is always Entry when executing;this cannot be changed. With other variables, however, you can decide whether ornot they are still ready for input when executing.
Sort variables
You can change the order of the variables by choosing the sort variables pushbutton. When youexecute the report, the enter variables dialog box will display the variables in the order which youhave specified.
See also:
Choosing Characteristics [Page 30]

CA - Drilldown Reporting SAP AG
Replacing Variables
36 April 2001
Overview: Variables [Page 50]
Maintain Variables [Page 63]
Defining Global Variables [Page 58]

SAP AG CA - Drilldown Reporting
Output Type
April 2001 37
Output Type
UseIn this part of the report definition, you can decide how the report is to be displayed. The outputtype that you choose for the purpose of report definition is only a default setting here. When youexecute the report, the output type chosen by you is already selected. However, you can deviatefrom this default setting and choose a different output type for the report. The following section isintended as a quick guide, to help you choose the output type most suited to your requirements:
• Graphical report output
You use the graphical report output if you want the report data to be displayedattractively on the screen or if you require several views of the report data simultaneously(drilldown list and detail list, for example).
• Classic drilldown report
You use classic drilldown reports if you require a high level of performance (for reportswhich analyze a large volume of data, for example) or if you want the report data to beprinted.
• Object list
You use object lists if you want to display the corresponding characteristic values forevery report line. Object lists present the only possibility of displaying severalcharacteristics simultaneously in the lead column, with the value combinations of thereport characteristics multiplied together. For this reason, object lists are oftenconsiderably larger than classic or graphical reports using the same quantity of data.
• Transfer to XXL
You transfer the report to XXL (Extended Export of Lists) if you wish to process thereport data using a spreadsheet program, or if you wish to access the data when youhave no access to the R/3 system.
IntegrationThe output type setting determines which type of display will be the default when the report isexecuted.
PrerequisitesTo use the graphical report output type, you should normally have defined a suitable HTMLtemplate and saved this in the SAP system using the Business Document Navigator. To accessthe Business Document Navigator, choose Environment → HTML Templates. For moreinformation about the Business Document Navigator, see Help for the SAP ArchiveLink [Ext.].Alternatively, you can use the SAP standard template. You can also change this template, ifrequired.
FeaturesFor the graphical report output, you can set the required output areas and decide which HTMLtemplate is to be used for the report header (info area). Here, for example, you can integrate yourcompany logo into the report. The header and footer lines also appear here if they have been

CA - Drilldown Reporting SAP AG
Output Type
38 April 2001
defined and the HTML template has been prepared accordingly. The graphic below shows anexample of graphical report output from Profitability Analysis (CO-PA):
Information area
Navigationarea
Drilldownarea
Graphic area and/or detail area
For classic drilldown reports, you can decide which list type is to be used as the basic lists,whether headers and footers should be printed, and what these should contain.
If required, you can enable viewing of object lists with the ABAP List Viewer. This makes itpossible for you to generate reports containing several characteristic values in the lead column.You can also make use of the other functions in the ABAP List Viewer, such as flexible filter andsort options, definition of display variants and so on. For further information, see thedocumentation for the ABAP List Viewer [Ext.].
Finally, using the list export tool XXL, you can specify that the report is transferred directly to aspreadsheet program, without the report list being set up by R/3.
For further information, see Setting the Output Type [Page 39].

SAP AG CA - Drilldown Reporting
Setting the Output Type
April 2001 39
Setting the Output Type
UseIn this part of the report definition, you can decide how the report is to be displayed. The outputtype that you choose for the purpose of report definition is only a default setting here. When youexecute the report, the output type chosen by you is already selected. However, you can deviatefrom this default setting and choose a different output type for the report.
PrerequisitesTo use output type "graphical report output", an up-to-date SAP GUI (version 4.6 or higher) mustbe installed on the presentation server.
To use output type "XXL" one of the spreadsheet programs supported by XXL must be installedon the presentation server.
Procedure• graphical report output
1. Choose the combination of output areas you require from this list.
2. If you have chosen a combination containing an info area, you must also choose theHTML template which you want to be displayed in the report header.
The system only displays HTML templates which have been stored in the SAP systemusing the Business Document Navigator. You can use either the standard template or amodified one. For information on how to create an HTML template and store it in the SAPsystem, see Defining HTML Templates [Page 41].
• classic drilldown report
1. Decide which list type you want to appear as the basic list when the report is executed.This setting also determines the list type of the report if it is executed in the backgroundusing background processing.
2. In the Layout group box, decide whether the report is to have headers and footers. Ifrequired, choose Maintain to edit the text which you wish to display in the header andfooter.
3. Go to the Options tab page and make further settings in the Print Layout group box, to setthe print view for the report.
• Object list
You do not need to make any more entries. Note that the data import option Read foreach navigation step is not suitable for reports of this kind.
• XXL
You do not need to make any more entries. Note that the data import option Read foreach navigation step is not suitable for reports of this kind.
CA - Drilldown Reporting SAP AG
Setting the Output Type
40 April 2001
Output type XXL is different to all other output types in that the report list is not preparedand displayed by R/3. Instead, it is transferred directly to a spreadsheet program on thepresentation server.
ResultOnce you have set the output type, you need to save your entries. You can then execute thereport with the new settings you have chosen.
SAP AG CA - Drilldown Reporting
Defining HTML Templates
April 2001 41
Defining HTML Templates
UseYou define HTML templates in order to set the content and layout for the output type "graphicalreport output". The info area appears as a report header above the report list, and can containthe name of the report, graphics (your company logo for example) and other data.
You can avoid having to define your own HTML templates if you use the standardHTML template or if you use only those combinations of output areas which containno info areas.
PrerequisitesTo make your chosen HTML templates available for report definition, you must save thetemplates in the SAP system using the Business Document Navigator.
For more information about the Business Document Navigator, see Help for the SAP ArchiveLink[Ext.].
Procedure1. Create an HTML file - either using an external HTML editor, or by programming the HTML
code yourself - as a template for the report definition.
2. In the SAP R/3 report definition, choose Environment → Maintain HTML templates.
You are now taken to the initial screen of the Business Document Navigator.
3. On the Create tab page, in the Business Document Navigator, double-click on the documenttype HTML-Template.
A file selection dialog appears.
4. In the file selection dialog, enter the fully qualified name of the HTML file which you wish totake over into the SAP system, then close the dialog by clicking on OK.
5. Enter a descriptive text for the HTML template and choose the appropriate language. It isalso recommended that you create keywords for the template, so that the document can laterbe found later from within a large number of documents. Confirm your entries.
The name of the HTML template you created now appears in the list of available HTMLtemplates.
6. Choose Goto → Back to leave the Business Document Navigator and return to the reportdefinition.
ResultThe newly created HTML template now appears in the HTML template list field on the output typetab page, and can be used for the info area of a graphical report.
See also:

CA - Drilldown Reporting SAP AG
Defining HTML Templates
42 April 2001
Creating an HTML Template [Page 43]

SAP AG CA - Drilldown Reporting
Creating an HTML Template
April 2001 43
Creating an HTML Template
UseYou create an HTML file outside the SAP system, in order to transfer it to the SAP system lateras an HTML template, and to display it in the report header of graphical drilldown reports usingthe Business Document Navigator.
PrerequisitesYou have an external HTML-editing tool and/or sufficient knowledge of HTML programming tocreate and format HTML files without an HTML editing tool.
Procedure1. Create an HTML file on your PC or in a server directory.
2. Edit the file until it looks how you want it to: Enter text and graphics as required. Whendesigning the page, note that the HTML template will be displayed in the horizontal info areaon the report screen. This means that only a limited number of elements will be visible on thescreen at any one time. If you place a large amount of information on the page, this will onlybe visible if the user scrolls up and down in the info area.
3. If required, you can enter special elements in the HTML code: The system interprets these asvariables when you execute a drilldown report, and replaces them with values. The followinginformation can be displayed: Header and footer, report comment and selection date, generalselections. To find out how to integrate this information into an HTML template, see Creatingan HTML Template: Special Information [Page 44].
4. Save the file.
ResultYou can integrate your HTML file into the SAP system as an HTML template and assign it toreports in the report definition.
See also:
Defining HTML Templates [Page 41]

CA - Drilldown Reporting SAP AG
Creating an HTML Template: Special Information
44 April 2001
Creating an HTML Template: Special Information
UseYou can add special elements to an HTML template, so that further information can be displayeddynamically when the report is executed.
PrerequisitesYou have an external HTML-editing tool and/or sufficient knowledge of HTML programming tocreate and format HTML files without an HTML editing tool.
Procedure1. Call up the source code of the HTML file with an editing tool.
2. Add comment tags at the required positions in the HTML file. When you execute the report,the system will interpret these tags as variables and will replace them with correspondingvalues. In HTML files, comment tags must always be positioned at the very beginning of theline, before any other tags. This will ensure that they are recognized when the report isexecuted. The system can interpret the following comments:
Valid comment types:
Comment Meaning
<!%001> Report header
<!%002> Text comment for the report and selection date of the displayed data
<!%003> Values in the general report selections (fiscal year, controlling area etc.)
<!%004> Report footer
Note that the system replaces the comments with values in the same order as theyappear in the HTML code. This means that if you want to display the general reportselections first, followed by the comment, for example, you can do so by enteringcomment <!%003> first and then entering comment <!%002>. For the same reason,it normally makes sense to place comment <!%001> before comment <!%002>.
3. Save the HTML file.
ResultOnce you have integrated the HTML file into the SAP system as an HTML template, andassigned it to a report, the system will replace all comments in the template with current valueswhen you execute the report.
The HTML code might look something like this:
<HTML>
<HEAD>
<META HTTP-EQUIV="Content-Type" CONTENT="text/html; charset=iso-8859-1">

SAP AG CA - Drilldown Reporting
Creating an HTML Template: Special Information
April 2001 45
<META NAME="Author" CONTENT="SAP AG">
<META NAME="GENERATOR" CONTENT="Mozilla/4.05 [en] (WinNT; I)[Netscape]">
<TITLE>Demo HTML Template</TITLE>
</HEAD>
<A NAME="top"></A><IMG SRC=" enjoy_small.gif"ALIGN=TEXTTOP> <FONT FACE="Tahoma" SIZE=+1>
</FONT><FONT SIZE=+2>New Reporting Style</FONT></FONT>
<BR>
<HR>
<FONT SIZE=-2> <A HREF="#top">Go to top of page</A></FONT>
<hr>
<!%001>
<hr>
<!%002>
<hr>
<!%003>
<hr>
<!%004>
</HTML>

CA - Drilldown Reporting SAP AG
Report Assignment
46 April 2001
Report Assignment
UseWith this function you can assign receiver reports to your report so that you can call them up latervia the report/report interface.
PrerequisitesOther reports must exists, which you can assign as receiver reports. The receiver reports shouldnormally contain variables [Page 50], which should be filled with information from the senderreport. Such variables are not mandatory, however.
Procedure1. Define the sender report
2. Assign a receiver report to your report. To do so, choose Extras -→ Report assignment in thereport definition, or choose the function Report. You can also find this function on the Optionstab page.
3. Repeat this assignment for all receiver reports which you want to be accessible from thecurrent report.
4. Save your changes.
Result
To call up a receiver report from a displayed report list, press the icon or choose the functionCall up report [Ext.].
See also:
Overview: Report/Report Interface [Page 79]
How to use the Report/Report Interface [Page 158]
SAP AG CA - Drilldown Reporting
Selecting Data Step by Step
April 2001 47
Selecting Data Step by StepWhen you define a report, you can specify whether the system should select all the data for thereport when you execute it, or whether it should select the data for each navigation step whenyou carry out that step.
• Select all dataWhen you execute the report, the system selects the data at the lowest level of detailrequired for that report and loads that data in the main memory. The system then displaysthe report. In comparison with the option "Select data step by step", this setting has theadvantage that it does not prevent you from using any other report functions. However,performance problems may arise when processing large amounts of data.
• Select data step by stepThe system does not display all report data when you execute the report. At first, the systemonly displays data for the initial list. For each navigation function that you execute after that,the system selects the data required for the resulting list. This option improves responsetimes, but does not allow you to use certain functions which require all of the report data atonce (such as the download to XXL).
There are two places in which you can make these settings:
• On the Options tab page in the Data import group.
• In the dialog box when you first save the report definition (after creating a new report). Here,choose the required option.
See also:
Transfer report to XXL [Page 264]
Printing from the SAP System [Page 219]

CA - Drilldown Reporting SAP AG
Settings
48 April 2001
SettingsWhen you create a report, you can also define special information for the report, such as aheader and a footer. You can also make settings for the report, such as which list should bedisplayed first, or whether the header and footer should be displayed when you execute thereport online. You can also make settings for when you print the drilldown lists and detail lists.
See also:
Maintain Header [Page 249]
Maintain Footer [Page 248]
Initial list [Page 139]
Totals Rows [Page 198]
Mass Print Settings [Page 251]

SAP AG CA - Drilldown Reporting
Number Format
April 2001 49
Number FormatThe number format refers to the number of decimal places and the factor in which a figure isdisplayed.
The figure one million, displayed with one decimal place and a factor of 1000,reads: 1,000.0.
You can define the number format separately for individual rows, columns and cells of a report.Settings are possible at the following levels:
• You can make rough settings to use in all reports in the report line structure or the fieldcatalog. There, for example, you can specify that sales should always be displayed in1,000,000s.
• You can make settings which apply to all the reports which use a specific form by definingthe number format in the form itself. For example, you can specify that the third column of theform should always be displayed with no decimal places.
• You can make settings which only apply to a specific report in the report definition itself.
When you make settings at different levels, you define the number format separatelyfor the detail list and the drilldown list. When you make these settings, observe therelationship between the column groups and the individual columns of the drilldownlist and the rows, columns and cells of the form. For a form with two axes, thisrelationship is as follows:
Single column (drilldown list) <--> Cell (detail list)
Column group (drilldown list) <--> Row or column (detail list)
In case of conflicting number format settings, the system uses the setting which was last made.

CA - Drilldown Reporting SAP AG
Variables
50 April 2001
Variables
DefinitionVariables allow you more flexibility in defining your forms and reports. Variables are reportparameters which you do not want to specify until you define or execute the report. You can usedifferent methods for replacing variables. Depending on how often you want to use them, you candefine your variables globally or locally.
Global variables
If you use a variable frequently, you should define it globally. This makes it possible to use thevariable in all your forms and reports.
The entries you need to make may differ depending on the variable type you choose.
Note that when you change an existing global variable, this may affect a number of reports andforms which already use it.
You define global variables [Page 58] for most applications in Customizing byselecting Information System in the application in which you are working. Thecomponent EC-EIS is an exception. Here, you define global variables by choosingInformation System → Variables → Define Variables in the application menu.
Local variables
If you want to create a variable which you only need in one particular form or report, you cancreate a local variable. Local variables are only known within the relevant form or report. If youdefine a local variable in a form, it is also valid for every report which uses that form. On the otherhand, if you define a variable in the report definition, it is only valid for that one report.
The entries you need to make may differ depending on the variable type you choose. Forinformation about the entry fields, see the online help by pressing F1 for those fields.
You maintain local variables when you define the form or report itself in yourapplication.
Variable types
There are currently four different variable types:
• Variables for Characteristic Values [Page 52]
• Variables for Hierarchies and Hierarchy Nodes [Page 54]
• Variables for Texts [Page 55]
• Variables for Formulas [Page 57]

SAP AG CA - Drilldown Reporting
Variables
April 2001 51
Replacement types
You are required to enter a replacement type when you define a variable. The replacement typedetermines how the variable should be replaced -- automatically by the system or by manualentry.
The following replacement types are available:
• automatic replacement (allowed only for variables for texts and formulas)
• replacement by manual entry (when you execute the report)
• replacement by user exit (see User Exits: Global Variables [Page 59])
• replacement by SAP exit
• replacement by fixed value (taken from table TKESV)
Online documentation exists for the field Replacement type as well as other fieldsavailable when you define variables.
Naming conventions
The following naming conventions apply for variables:
• Global variables begin with &. Variables which are defined by SAP have a number in thesecond position. For user-defined global variables, the second character must be a letter.
• Local variables which you define in the form begin with &$.
However, if the symbol "variable on" appears before a field for a variable, do not enter "&". Insuch cases, the sign is set automatically.
For information on how the different types of variables are used, see also Example: Use ofVariables [Page 60].

CA - Drilldown Reporting SAP AG
Variables for Characteristic Values
52 April 2001
Variables for Characteristic ValuesIf you do not want to specify a fixed value for a characteristic in a report, you need to use avariable for a characteristic value. You can use these variables in both basic and form reports,and can define them in the form or in the report itself. Global variables of this sort are generallyused in the form, and replaced with a characteristic value in the report definition or when thereport is executed.
Certain variables for characteristic values, such as the current fiscal period &0FP (current fiscalperiod), are delivered with the standard R/3 system. The standard variables differ fromapplication to application. You can display these in variable maintenance. Use of variables forcharacteristic values
Using Variables for Characteristic ValuesTo define a variable for a characteristic value in a report, activate the indicator Variable on/off onthe entry field for the characteristic value. and choose the function Edit → Variable on/off.
If you want to use a variable for a characteristic value in a form, choose the pushbutton Variableson/off in the dialog box for characteristic values. The system then shows a dialog field, where youcan specify the variable to be used.
Global variables need to be defined in Customizing before you can use them in a report or form.For information about maintaining global variables, see Overview: Variables [Page 50].
Local variables are unique within the given form and for the given characteristic. Consequently,you can use the same variable name for local variables for two different characteristics.
Variables for characteristic values which apply to numerical fields (such as Year for the currentfiscal year 1999) can be added to constants (such as Year 1 for the previous year 1998). This ispossible for both global and local variables for characteristic values.
You want to create a form in which you define the first column with a variable for theyear. The second column should contain the previous year.
In the first column, choose the characteristic Fiscal year and specify it using thevariable Year. Year has already been defined as a global variable with mandatoryentry.
In the second column, choose the characteristic Fiscal year again, and enterYear 1 as the variable. When you later create or execute a report which uses thisform, the system will merely ask you to specify the variable Year, and determine theprevious year automatically.
Maintaining local variables for characteristic valuesYou create local variables by determining that an element is to be defined by a characteristicvalue variable.
When editing a form using the function Change form or Create form, you can obtain an overview
of all variables to be used in the form. To do this, click on or choose Extras → Variables →Variable definition. The system then displays a dialog box containing a list of the local and globalvariables used in the form. You can specify for each local variable whether or not it must be

SAP AG CA - Drilldown Reporting
Variables for Characteristic Values
April 2001 53
replaced with a fixed value in the report. If you do not maintain this, the system will assume that itis a mandatory entry. You can also maintain texts for local variables here.
In the transaction Create report, you maintain local variables by setting the Variable on/offindicator for a characteristic and then making the required entries in the following dialog box.
For an example of how to use variables for characteristic values, see Example: Use of Variables[Page 60].

CA - Drilldown Reporting SAP AG
Variables for Hierarchies and Hierarchy Nodes
54 April 2001
Variables for Hierarchies and Hierarchy NodesIf you define a form or report with a characteristic hierarchy, the system asks you to enter aspecific hierarchy variant or hierarchy node (see Entering and Using a Hierarchy Node [Page67]). In this field you can also enter a variable instead of a fixed value.
Variables for hierarchies and hierarchy nodes work just like variables for characteristic values.For more information, see Variables for Characteristic Values [Page 52].
Special features of variables for hierarchiesWhen you maintain a local variable for a hierarchy node, you only need to enter the replacementtype. If you want, you can also enter an identifier for the variable. For variables for hierarchies,you can only maintain an identifier, since replacement is automatically mandatory.
When you maintain global hierarchy variables and choose replacement type “2” (replacement bymanual entry), be sure to enter “3” (Mandatory variable which is not blank (technical)) in the fieldOptional entry.

SAP AG CA - Drilldown Reporting
Variables for Texts
April 2001 55
Variables for TextsIf you want to use variables to define the texts in the headers of columns or rows, you need touse text variables. For example, if you use a variable for a characteristic value when defining areport, the system does not yet know the text for this value. Here you can use a text variable.
Text variables can only be used in form reports. They are defined in the form itself and replacedwhen you execute the report.
Certain text variables, such as &0RESULT (text for the totals row in a report), are delivered withthe standard R/3 system. You can which standard text variables exist in your application in thetransaction for variable maintenance.
Using variables for textsYou can enter a text variable anywhere where you can enter texts in a form.
Global variables need to be defined in Customizing before you can enter them in a text field of aform. To maintain global variables, see Overview: Variables [Page 50].
For local variables, you need to enter $ followed by a name for the variable. You can enter thelocal variable in the row or column text itself, or in the dialog box where you enter short, mediumand long texts. Once you have entered a local variable, you need to maintain it.
Maintaining local variables for textsLike variables for characteristic values, you can maintain local text variables under the menuoption Extras → Variables → Characteristic value → Maintain variable. To edit local variables, click
on or choose Extras → Variables → Variable definition. The system then displays a dialog boxcontaining a list of the local and global variables used in the form. You can specify for each localvariable whether or not it must be replaced with a fixed value in the report. If you do not maintainthis, the system will assume that it is a mandatory entry. You can also maintain texts for localvariables here.
For variables for texts, the replacement type determines how you need to proceed. In mostcases you will probably choose to store a replacement path so that the system can determine thetext automatically from the master data. Note that the system can only automatically replacethose variables which refer to an element with characteristics, and only if you selected thedesired characteristic when you defined the element.
You need to specify the text length when you define the variable. The name of a local variablecan have up to 8 characters. If you choose, replacement by manual entry, the text length isidentical with the length of the variable name.
Note that in the characteristic field Period/year, the period is at the end of thefield. If you want to replace a text variable with the current period, you need to enterthe following in the Chosen field group in the Detail dialog box: value 6, length 3.
For a detailed example of how to use variables for texts, see Example: Use of Variables [Page60].

CA - Drilldown Reporting SAP AG
Variables for Texts
56 April 2001

SAP AG CA - Drilldown Reporting
Variables for Formulas
April 2001 57
Variables for FormulasIf you want use variables in the formulas of a form, you need to use formula variables. You canuse formula variables only in form reports, and must define them in the form itself. They can bereplaced in the same ways as text variables when you execute the report.
Formula variables make it easy for you to simulate and project data.
Using variables for formulasTo use a formula variable in a form, call up the formula editor when you define the relevantelement, and enter the variable there.
Global variables need to be defined in Customizing before you can use them in formulas. Usingthe pushbutton Switch text, you can display all the possible components of a formula. Tomaintain global variables, see Overview: Variables [Page 50].
For local variables, you need to enter &$ followed by a suitable name.
To define the properties of a variable, click on or choose Extras → Variables → Variabledefinition. The system then displays a dialog box containing a list of the local and global variablesused in the form.
For a detailed example of how to use formula variables, see Example: Use of Variables [Page60].

CA - Drilldown Reporting SAP AG
Defining Global Variables
58 April 2001
Defining Global Variables
UseIf you use a variable frequently, you should define it globally rather than in the context of a reportor a form. This makes it possible to use the variable in all your forms and reports. This isparticularly useful for characteristics which commonly figure in the general report selection, suchas period, business area etc.
Another reason for creating global variables is that it is only when using this type of variable thatyou can perform a multiple selection. This means that you can include or exclude freelyselectable values or ranges of values when executing reports. The features available in multipleselection can vary from application to application. When using local variables, you cannot usemultiple selection.
Procedure1. Call up the initial screen for maintaining variables.
In most applications, you define global variables by selecting Information System in theapplication in question. The component EC-EIS is an exception. Here, you define globalvariables by choosing Information System → Variables → Define Variables in theapplication menu.
2. To define a new variable, choose Edit → New Entries.
3. Enter the required variable type, a name and the replacement type.
Note that the name you choose for a global variable must always begin with &.Depending on the variable type and replacement type you choose, the system willprompt you to make various entries in additional fields.
4. If you want to use the variable for general report selections, enter S in the fieldParameter/Selectopt.
5. Make all necessary entries and save the variable.
ResultYou can use the variable in forms or reports. In fields where it is technically possible to use thevariable, it will be offered to you via possible entries (F4).

SAP AG CA - Drilldown Reporting
User Exits: Global Variables
April 2001 59
User Exits: Global VariablesWhen you work with global variables, you need to specify a replacement type to determine howthe variable should be replace with a value. In most cases, the replacement types provided bythe system (automatic, manual, SAP exit, fixed value from table) will be sufficient.
If you need to have a variable replace using a different method, you can program a user exit forglobal variables to define your own replacement type.
• deriving the current calendar year from the current fiscal year
• deriving a 7-digit period from the current period
You can read about the user exit by choosing Tools → ABAP Workbench → Utilities →Enhancements → Definition (enhancement KKDR0001) from the initial screen. There you will findthe technical information necessary for programming an exit as well as a code example.

CA - Drilldown Reporting SAP AG
Example: Use of Variables
60 April 2001
Example: Use of VariablesIn a form with two axes, you want the rows to contain four fiscal years and the columns tocontain revenues and a revenue value taking inflation into account, based on fiscal 2001:
Profitability report Revenue Test
$FYT XXX,XXX,XXX XXX,XXX,XXX
$FYT XXX,XXX,XXX XXX,XXX,XXX
$FYT XXX,XXX,XXX XXX,XXX,XXX
$FYT XXX,XXX,XXX XXX,XXX,XXX
The form contains variables for characteristic values, text variables and formula variables:
• The characteristic fiscal year is used in the rows. Four consecutive fiscal years will bedisplayed, the first of which you need to enter when you run the report.
For this you enter local variable &$FY in the first line of the dialog box for characteristicvalues. You then enter &$FY+1, &$FY+2 and &$FY+3 in the second, third and fourthlines, respectively. You cannot see the variables in the rows of the form.
• In the dialog box where you enter texts, enter the text variable $FYT in the correspondingtext fields. The text variable appears in the form (see above).
The text variable is to be replaced automatically in the report by the value of the fiscalyear in the row. To do this, choose or the menu option Extras → Variables →Variables definition. Set the variable $FYT to be replaced automatically with the value inthe From field of the characteristic ‘fiscal year’ (beginning in position 1 with a length of 4characters).
• The revenue value Test is adjusted for inflation by the formula:
X001 / ( 1 + &$INFL) ** ( &$FYN - 2000)
where X001 is the revenue column. You specify the inflation rate &$INFL. The variable&$FYN is replaced automatically by the fiscal year for the row.
Nothing more needs to be specified for the formula variable &$INFL. You define theformula variable &$FYN to be replaced automatically by the value in the From field of thecharacteristic Fiscal year (beginning in the first position with a length of 4 characters).
If you run the report with the value 0.04 for &$INFL and 1998 for &$FY, you will thus receive thefollowing detail list:
Profitability report Revenue Test
1998 950.00 1,155.82
1999 1,210.00 1,415.53
2000 1,380.00 1,552.31
2001 1,500.00 1,500.00

SAP AG CA - Drilldown Reporting
Replacing Variables
April 2001 61
Replacing VariablesYou can replace variables manually on the variables tab page. Only variables which can bereplaced manually appear here. Other variables are replaced automatically and do not appearhere.
Characteristics which are selected on the variables tab page cannot be furtherspecified on the characteristics tab page. In such cases, the corresponding entryfields are deactivated. For further information, see Characteristic Values [Page 31].
The question of which variables you can enter depends on the type of report.
• For basic reports, there is no user-defined form. The systems proposes certain standardvariables (such as fiscal year, period, value type) depending on the application.
• For form reports, the system displays those fields which were defined using variables in theform for this report. These fields appear in the order defined under Extras → Variables → Sortin the form definition. If the field customer group has been defined with a variable, you usethe tab page to define which customer group you want to create the report for. When youhave made this entry, the system will perform the corresponding replacement wherever theparameter appears in the report.If the form definition contains no variables, or only those which will be replaced automatically,the system does not display this tab page.
Readiness for Input
You can either specify the selected variables immediately or later, when you execute the report.If you do not wish to specify a variable until you execute the report, this variable must be readyfor input. You can make each variable ready for input when the report is executed, by choosingEnter when executing. If at least one variable can be entered manually, the system displays adialog box when you execute the report. There you can enter values for the variables or changesthe defaults defined in the report definition. If you do not select the field Entry when executing forany variables, the system immediately executes the report and displays the resulting list.
When you enter variables, the system also replaces all variables which were setduring definition of the report on the characteristics tab page, using the functionVariable on/off [Ext.]. The status of these variables is always Entry when executing;this cannot be changed. With other variables, however, you can decide whether ornot they are still ready for input when executing.
Sort variables
You can change the order of the variables by choosing the sort variables pushbutton. When youexecute the report, the enter variables dialog box will display the variables in the order which youhave specified.
See also:
Choosing Characteristics [Page 30]
CA - Drilldown Reporting SAP AG
Replacing Variables
62 April 2001
Overview: Variables [Page 50]
Maintain Variables [Page 63]
Defining Global Variables [Page 58]

SAP AG CA - Drilldown Reporting
Maintaining Variables
April 2001 63
Maintaining VariablesWith this function you can maintain local variables which you created when you defined thereport. (Global variables are defined in Customizing.) For each variable you can decide whetherthe user executing the report has to enter a value or not.
It may occur that some of the variables defined in the report cannot be maintained here. This canbe due to a number of reasons, such as that the variables involve compound characteristics orthat the variables are replaced internally.
For further information on how to use variables when creating a report, see Replacing Variables[Page 61].

CA - Drilldown Reporting SAP AG
Characteristic Hierarchies
64 April 2001
Characteristic HierarchiesIn both the Executive Information System (EC-EIS) and in Profitability Analysis (CO-PA), you candefine hierarchical structures for characteristics for use in drilldown reporting. You can createcharacteristic hierarchies yourself in your own application. Alternatively, you can use hierarchygroups which are defined in other applications, such as the cost element groups in Cost ElementAccounting or cost center groups in Cost Center Accounting. (For information about how tocreate master data hierarchies in EC-EIS, see Master Data Hierarchy [Ext.]. In CO-PA, youcreate these in Customizing.
In account-based Profitability Analysis, you can only use the cost element groupsfrom Cost Center Accounting.
A hierarchy lets you group values of a single characteristic together into a hierarchical structure.For example, you can group cost elements together according to personnel costs, material costs,administrative costs, and so on, and then differentiate them within each of these categories bydividing personnel costs into wages, salaries and additional personnel costs, and so on. Thegroup "Wages" might then contain direct labor costs, labor overhead, compensation for time lost,overtime and miscellaneous costs. Another good example is a hierarchy for the characteristicCompany, which consists of various sub-groups.
Hierarchy nodes and end nodesA characteristic hierarchy is made up of a number of hierarchy nodes. Hierarchy nodes areparts of a hierarchy and can contain further hierarchy nodes. Alternatively, if this is not the case,they can be end nodes. An end node can only contain values, either individual values or valueintervals. The cost types "direct labor costs", "labor overhead" and "other labor costs" areexamples of end nodes, as they contain only intervals of node values or individual values.

SAP AG CA - Drilldown Reporting
Characteristic Hierarchies
April 2001 65
Hierarchy for the characteristic Cost element
• PERSONNEL COSTS (hierarchy node)
Wages (hierarchy node)
Direct labor costs (end node)
420000 - 420999 (interval of values)
Labor overhead
421000 - 421999
Other labor costs
423000(single value)
Salaries
...
Other personnel costs
• MATERIA COSTS
• ADMINISTRATION COSTS
and so on.
The Choose hierarchy functionIf hierarchies exist for a characteristic, you can have the system display that characteristic in ahierarchy either when you define the report or after you have executed it. This function displaysthe chosen hierarchy in its entirety. The characteristic values not contained in the hierarchyappear in the report list in the row "Other characteristic values". You can also drill down on thisrow if you wish.
To do so, choose the function Extras → Choose hierarchy when you define the report or Edit →Hierarchy → Choose... after executing it. Both of these functions are also found under the
pushbutton . In each case, the system displays a list of the existing hierarchies for thatcharacteristic. This makes it possible to analyze the selected data interactively according todifferent hierarchies.
In addition, the option "No hierarchy" lets you return to a non-hierarchical display.
You can change the look of the hierarchy at any time from the report list using the function Edit →Hierarchy → Display. For more information, see Hierarchy Display [Page 69] and Functions forEditing Hierarchies [Page 72].
The function Hierarchy nodeThe function Edit → Hierarchy node lets you report on selected parts of a characteristic hierarchy.
To do so, choose the pushbutton Hierarchy node on/off when you define either the form or thereport. Then you can enter a hierarchy node in place of a characteristic value for the selectedcharacteristic. Instead of a characteristic value, choose a hierarchy node for the characteristic.When you execute the report, the system displays only those characteristic values that are

CA - Drilldown Reporting SAP AG
Characteristic Hierarchies
66 April 2001
attached to that node. For example, you can report on all the cost elements that belong to thegroup Wage costs.
If, on the other hand, you either enter a single characteristic values or choose all characteristicvalues by leaving the field blank, to receive all values instead of a hierarchy node when youdefine the report, the system displays the data for that single value or for all values.
Note that when you enter a hierarchy node for a characteristic, that characteristic becomes fixed,which means that it can no longer be a drilldown characteristic. The characteristic name and thehierarchy node chosen appear above the navigation area.
To be able to choose a group (profit center group, cost center group, cost elementgroup, and so on), you first need to set the controlling area.
See also:
Entering and using a hierarchy node [Page 67]
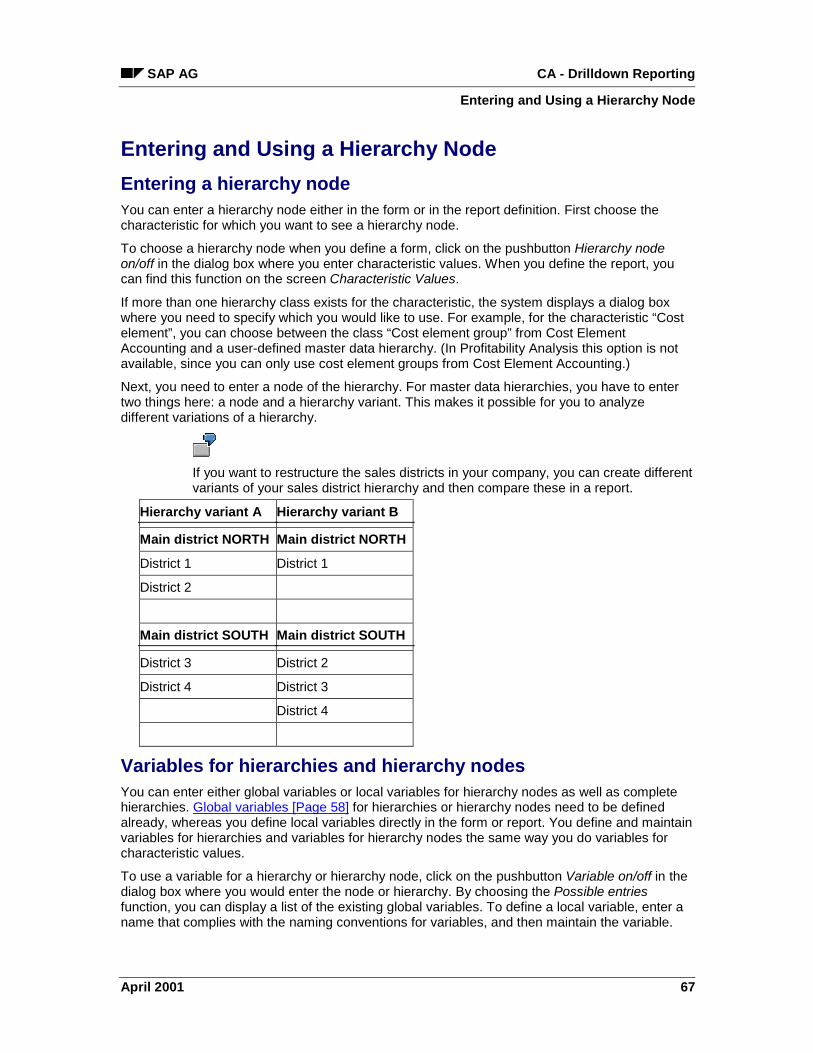
SAP AG CA - Drilldown Reporting
Entering and Using a Hierarchy Node
April 2001 67
Entering and Using a Hierarchy Node
Entering a hierarchy nodeYou can enter a hierarchy node either in the form or in the report definition. First choose thecharacteristic for which you want to see a hierarchy node.
To choose a hierarchy node when you define a form, click on the pushbutton Hierarchy nodeon/off in the dialog box where you enter characteristic values. When you define the report, youcan find this function on the screen Characteristic Values.
If more than one hierarchy class exists for the characteristic, the system displays a dialog boxwhere you need to specify which you would like to use. For example, for the characteristic “Costelement”, you can choose between the class “Cost element group” from Cost ElementAccounting and a user-defined master data hierarchy. (In Profitability Analysis this option is notavailable, since you can only use cost element groups from Cost Element Accounting.)
Next, you need to enter a node of the hierarchy. For master data hierarchies, you have to entertwo things here: a node and a hierarchy variant. This makes it possible for you to analyzedifferent variations of a hierarchy.
If you want to restructure the sales districts in your company, you can create differentvariants of your sales district hierarchy and then compare these in a report.
Hierarchy variant A Hierarchy variant B
Main district NORTH Main district NORTH
District 1 District 1
District 2
Main district SOUTH Main district SOUTH
District 3 District 2
District 4 District 3
District 4
Variables for hierarchies and hierarchy nodesYou can enter either global variables or local variables for hierarchy nodes as well as completehierarchies. Global variables [Page 58] for hierarchies or hierarchy nodes need to be definedalready, whereas you define local variables directly in the form or report. You define and maintainvariables for hierarchies and variables for hierarchy nodes the same way you do variables forcharacteristic values.
To use a variable for a hierarchy or hierarchy node, click on the pushbutton Variable on/off in thedialog box where you would enter the node or hierarchy. By choosing the Possible entriesfunction, you can display a list of the existing global variables. To define a local variable, enter aname that complies with the naming conventions for variables, and then maintain the variable.

CA - Drilldown Reporting SAP AG
Entering and Using a Hierarchy Node
68 April 2001
It makes sense to use variables for texts in connection with variables for hierarchiesor hierarchy nodes. For example, if you want to enter a variable for a hierarchyvariant, you can have the system enter the text for the variant automatically insteadof having to specify it immediately. To do this, define a text variable with automaticreplacement. When the system asks how the variable should be replaced, choose“Hierarchy field” and enter “Hierarchy variant”.
For more information about variables for hierarchies, see Variables for Hierarchies and HierarchyNodes [Page 54].
DisplayIn a basic report, the hierarchy node is displayed above the navigation area, just like the otherfixed characteristics. Thus the hierarchy node is not available as a drilldown characteristic. Thevalues in the report are shown summarized for that node.
If you entered a hierarchy node in the form, but then decide that you want to use it as a drilldowncharacteristic in the report, proceed as follows: When you define the report, choose the relevantcharacteristic but do not enter a characteristic value. Choose a type of display for the hierarchyusing the function Choose hierarchy. This makes the characteristic available as a drilldowncharacteristic.
You can choose between four different ways of displaying the hierarchy: compact display, linedisplay, asterisk display and line display with blank lines.
See also:
Hierarchy Display [Page 69]
Functions for Editing Hierarchies [Page 72]

SAP AG CA - Drilldown Reporting
Hierarchy Display
April 2001 69
Hierarchy DisplayYou can display the hierarchy of a characteristic in different ways:
• Compact display
• Asterisk display
• Line display
• Line display with blank line
Compact displayIn compact display, the first column contains symbols which show whether a row can beexpanded or collapsed, or whether a row has already been expanded as far as you can expandit. By double-clicking on one of these symbols you can expand an expandable row or collapse acollapsible row.
Cost element Value
- 120,963.00
- 109,563.00
> 700.00
> 1,100.00
> 107,763.00
- 10,300.00
> 3,000.00
> 7,300.00
+ 1,100.00
> 27,520.00
1 Total costs
2 Material costs
3 400001 Raw materials
3 400004 Finished products
3 400005 Semi-finished products
2 Personnel costs
3 431000 Wages
3 439000 Salaries
2 Imputed depreciations
1 Other costs
The hierarchy shown above consists of two branches. A branch always begins withthe first level. In the above graphic, the first branch contains a total of three levels.Level 2 (material costs) is expanded completely and can be reduced if desired (-).This would mean that the rows that follow, indicated with "Level 3" (raw materials,finished products and semi-finished products) would no longer be visible.
The item "Imputed depreciation" can be broken down further and is thereforedisplayed with the symbol for "collapsed" (+).
The row "Other costs" is a node at the highest level (Level 1) which cannot bebroken down any further. Thus it is also a node at the lowest level and isconsequently indicated with a (>).
The lead column (cost element) in compact display contains the hierarchy level in theform of a number. One (1) is always the highest level. The higher the number, the

CA - Drilldown Reporting SAP AG
Hierarchy Display
70 April 2001
deeper down the characteristic is divided. The lead column also contains the keyand/or name of the characteristic value.
Asterisk displayIn asterisk display as well, the first column contains symbols indicating whether the rows can beexpanded or collapsed, or whether the lowest level has been attained.
Cost element Value
- 120,963.00
- 109,563.00
> 700.00
> 1,100.00
> 107,763.00
- 10.300,00
> 3.000,00
> 7.300,00
+ 1.100,00
> 27.520,00
** Total costs
* Material costs
400001 Raw material
400004 Finished products
400005 Semi-finished products
* Personnel costs
431000 Wages
439000 Salaries
* Imputed depreciation
** Other costs
Line displayLine display corresponds to the type of display which you find in SAPmail and in many otherareas of the R/3 System. Symbols directly located on the nodes indicate whether the level can beexpanded or collapsed, or whether the lowest level has been attained.
Cost element Value
- 120,963.00
- 109,563.00
> 700.00
> 1,100.00
> 107,763.00
- 10,300.00
> 3,000.00
> 7,300.00
+ 1,100.00
> 27,520.00
Total costs
Material costs
400001 Raw material
400004 Finished products
400005 Semi-finished prod
Personnel costs
431000 Wages
439000 Salaries
Imputed depreciation
Other costs

SAP AG CA - Drilldown Reporting
Hierarchy Display
April 2001 71
Line display with blank lineThis type of display is the same as normal line display except that a blank line separates rows ofdifferent levels. Line display with blank lines is easier to read compared to normal line display,but can also lengthen your report considerably in some cases.
Cost element Value
- 120,963.00
- 109,563.00
> 700.00
> 1,100.00
> 107,763.00
- 10,300.00
> 3,000.00
> 7,300.00
+ 1,100.00
> 27,520.00
Total costs
Material costs
400001 Raw material
400004 Finished products
400005 Semi-finished prod
Personnel costs
431000 Wages
439000 Salaries
Imputed depreciation
Other costs

CA - Drilldown Reporting SAP AG
Functions for Editing Hierarchies
72 April 2001
Functions for Editing HierarchiesCharacteristics are displayed hierarchically using different levels. As shown above, the number oflevels to be displayed can be set using the symbols collapsed (+) and expanded (-).
• Expanding a hierarchy level means displaying one level below the level where the cursor ispositioned.
• Collapsing means reducing the display by one level.
It is also possible to process the levels of a hierarchy in greater detail using the menu. Thesefunctions are cursor-sensitive. Thus they let you process the rows in a specific branch.
See the graphic exemplifying compact display in the section Hierarchy Display [Page69].
• For example, in the graphic below, if you execute the function Collapse on Level 1 of the firstbranch, the system resets all the items which belong to that branch, and only displays Level1 of the branch. Other branches are not affected. If you execute this function on the row"Material costs", the items "Raw material", "Finished products" and "Semi-finished products"disappear.
->>>
- Total costsMaterial costs
Raw materialFinished productsSemi-finished prod.
>
-
+
>>
Personnel costsWagesSalaries
Imputed depreciationOther costs
439000431000
400005400004400001
120,963.00109,563.00
700.001,100.00
107,763.0010,300.00
3,000.007,300.001,100.00
27,520.00
Cost element
1
1
2
2
2
333
33
• The function Expand is likewise cursor-sensitive, and only applies to the next level.
• The function Expand all always displays all the levels contained in the branch.
• Expand to level lets you hide levels of the hierarchy which are of no interest at the time orunimportant.
• The function Set focus lets you choose a specific level that you are particularly interested in.For example, if you position the cursor on the row "Personnel costs" in the graphic, and thenchoose Set focus, the system displays only the expanded level, i.e. the rows "Personnelcosts", "labor costs" and "Salaries". You can jump from this focused view back to thehierarchy again by double-clicking on the corresponding field.
SAP AG CA - Drilldown Reporting
Functions for Editing Hierarchies
April 2001 73
Sorting a hierarchyYou can sort a report according to different criteria. Depending on where the cursor is standing,you can sort the rows according to the key, the name or the values of a certain key figure ineither ascending or descending order.
You can also sort a report hierarchically, provided that a characteristic was defined hierarchically.Again you can choose between ascending and descending order. The cursor must be positionedon a symbol (+, -, >) before you choose the function Ascending or Descending. The hierarchiesshown in the figures here are all sorted in descending order.
In compact display and asterisk display, there are also two ways to display the hierarchy. Youcan have the highest level (Level 1) above the lower levels, or you can place it at the bottom ofthe branch. The first case is referred to as top-down display, the second as bottom-up display.The figures shown here are displayed top-down.
Graphics for hierarchy listsOnly the line-related graphic types are available in a hierarchy list.
If you want to observe just one level of a hierarchy, using the function Hierarchy →Set level, all graphic types are available - depending on the cursor position - as in adrilldown list without a hierarchy.
See also:
Hierarchy... [Page 149]
Graphics [Page 272]
CA - Drilldown Reporting SAP AG
Currencies and Units of Measure
74 April 2001
Currencies and Units of MeasureWhen you define a form or report, you can determine whether different currencies and quantitiesshould be allowed in different columns or rows of the report:
• If you want to allow different currencies in different columns, you can use the currencytranslation function in the report.
• If you want to allow different currencies in different rows, currency translation is notpossible. In this case, you need to choose the currency as a drilldown characteristic inyour report.
Currencies and units of measure are handled differently in different applications. Formore information, see Customizing and the online documentation for yourapplication.
CurrenciesYou can work with different currencies in drilldown reporting. Note that the currency settings youmake are the same for both the drilldown and detail lists. That means that a single column of thedrilldown list has the same target currency and currency translation key as the cell of the detaillist which corresponds to that column.
Currency Translation
Currency translation is defined by the following values:
• Currency translation key
• Target currency
If a form contains formula columns which use different currencies, the system performs currencytranslation automatically using translation key 999.
If you perform currency translation on the detail list of a report, the system also translates thecorresponding column of the drilldown list.
If you use currency translation, it may make sense to define a dummy column which is ignoredduring translation. This makes it possible to still display the original currency.
(See also the standard report 0-SAP05 for account-based Profitability Analysis inoperating concern S001.)
A report consists of the following four columns:
• Column A uses the controlling area currency, USD.
• Column B uses the transaction currency, DEM, which is translated into USD(based on column C).
• Column C is defined as A minus B in USD.

SAP AG CA - Drilldown Reporting
Currencies and Units of Measure
April 2001 75
• Column D is defined as a dummy column with an additional characteristic todistinguish it from column B. The dummy column is not translated into DEM.Thus it still displays the original content of column B before translation.
Currency Translation Keys
Some currency translation keys already contain the target currency in their definition.
A few important currency translation keys are delivered with the standard R/3 System.These include:
Key: Description:
1 Mean rate, cutoff date today
2 Selling rate, cutoff date today
3 Buying rate, cutoff date today
4 Selling rate, cutoff date start of period
5 Mean rate, cutoff date start of period
6 Buying rate, cutoff date start of period
You can also define your own currency translation keys. The functions which let you do this arefound in Customizing.
The currency translation key fixes certain details of how the currency translation is to be carriedout. It represents a summary of various rules when carrying out a currency translation. Thesedetails, which you can combine in a translation key, are:
1. The exchange rate type (such as the bank buying rate or the average rate)
The valid exchange rate types are stored in a central R/3 table and can be maintainedthere.
2. The target currency into which you are translating
A distinction is made here between fixed and variable target currency. With a fixed targetcurrency, you can determine it later. It is recommended, however, that you leave thisfield blank in most cases. For example, in the transfer of external data to the transactiondata table, the target currency is normally implicitly known and can be determined by thetransfer program when it runs. If you often want to use the same translation key fordifferent target currencies when translating currency-dependent values in drilldownreporting, then only currency translation keys without a specific target currency aresuitable.
With a variable target currency, you must create a reference to a characteristic byentering the name of a table or field. For example, if you want to determine that selectionof the target currency is country-dependent, you enter the table with country data (T005)and the field with country keys (LAND1). To do this, the country key must be defined as acharacteristic in the operating concern.
3. Flag which indicates whether this is a fixed or variable translation
A fixed translation date is either the current date or a specific date from which theexchange rate is valid.
With a variable translation date, you specify the time reference (i.e. period begin, yearend).
CA - Drilldown Reporting SAP AG
Currencies and Units of Measure
76 April 2001
4. Flag which indicates whether the rate is inverted. A currency type with inverted rate isuseful if the amounts have already been translated and you want to display the originalvalues again in drilldown reporting.
5. From-currency. You leave this field empty for currency translation keys for drilldownreporting as the source currency is known for all values.
6. The time reference (only for time-dependent currency translation).
The following are supported:
a) Fiscal year end
b) Period end
c) Period begin
d) Week end
(not available for all applications)
e) Exact day
(only if the transaction data table contains characteristics with a time dimension - such as "tradingday").
The requirement for using these options for the time reference in a drilldown report is, that therelevant characteristics have been chosen for the report. Where the period is concerned, notethat it is only valid in the context of a fiscal year.
Inverse Exchange Rates
An exact reverse calculation is, however, only possible under certain conditions. In data transfer,several records with different exchange rates cannot be summarized to one record. The data forwhich the exchange rate is taken from the central SAP table, must either be a specific date (forexample, 12/31/97) or be derived from a characteristic, that is contained in a sender record aswell as in the drilldown report. To see how this works, see Example: Inverse Rates [Page 77].

SAP AG CA - Drilldown Reporting
Example: Inverse Rates
April 2001 77
Example: Inverse RatesThe three records to be transferred to the transaction data table should have the followingstructure:
Fisc. year Period Posting date Sales area Sales Currency
1995 001 1/5/95 B3Z 100 DEM
1995 001 1/5/95 A3F 200 DEM
1995 002 2/7/95 27A 200 DEM
The records are to be posted in USD to the transaction data table, which does not contain theposting day as a characteristic. The following possibilities arise:
1. Translation on a specific date, e.g. 12/31/1994, using the bank buying rate.
Example exchange rate is 0.7 USD/DEM.
The records in the transaction data table then appear as follows:
Fiscal year Period Sales area Sales
1995 001 B3Z 70
1995 001 A3F 140
1995 002 27A 140
Sales of 350 USD for fiscal year 1995 will be displayed in the drill- down report. You cancalculate this from the inverse exchange rate
1 / (0.7 USD/DEM) = (1 DEM)/(0.7 USD)
and get the value
350 USD * (1 DEM)/(0.,7 USD) = 500 DEM
i.e. the original amount.
Note that, the reverse calculation always works if you have translated with an exchangerate unique to a specific date during the data transfer.
2. Time-dependent translation at period end using the bank buying rate.
The example exchange rate for this is:
0.6 DEM/USD for 1/31/19950.8 DEM/USD for 2/28/1995.
The records in the transaction data table appear as follows:
Fiscal year Period Sales area Sales
1995 001 B3Z 60
1995 001 A3F 120
1995 002 27A 160
Sales of 340 USD for fiscal year 1995 are displayed in the drill- down report. If you chosethe fiscal year and the period or, alternatively, the 7-digit Period 'yyyymmm' when

CA - Drilldown Reporting SAP AG
Example: Inverse Rates
78 April 2001
defining the report, then you can also calculate the original amount from the inverseexchange rate. The drill down report works with the inverse period exchange rates
1 / (0.6 USD/DEM) = (1 DEM)/(0.6 USD) and1 / (0.8 USD/DEM) = (1 DEM)/(0.8 USD)
and calculates the value
(60 USD + 120 USD) * (1 DEM) / (0.6 USD) + ( 160 USD) *(1 DEM) / (0.8 USD) = 500 DEM,
i.e. the original amount.
3. Time-dependent translation for the posting date using the bank buying rate.
Example exchange rates for this:
0.6 DEM/USD for 1/5/19950.8 DEM/USD for 1/9/19950.8 DEM/USD for 2/7/1995.
During data transfer the posting date will be ignored as this is not contained in thetransaction data table as a characteristic. (see above)
The records in the data transfer table will then appear as follows:
Fiscal year Period Sales area Sales
1995 001 B3Z 60
1995 001 A3F 160
1995 002 27A 160
Sales of 380 USD for fiscal year 1995 are displayed in the drilldown report. You cannotcalculate the original amount using the inverse exchange rate, as the information aboutthe translation date was lost during the summarization over posting date.
You can calculate the original amount approximately by translating the amount using themixed specific date exchange rates or period end exchange rates. The latter wouldprovide the following result:
(60 USD + 160 USD) * (1 DEM) / (0.6 USD) + ( 160 USD) *(1 DEM) / (0.8 USD) = 566.67 DEM
that is, not the original amount of 500 DEM.
SAP AG CA - Drilldown Reporting
Overview: Report/Report Interface
April 2001 79
Overview: Report/Report Interface
UseThe report/report interface lets you link together a number of smaller reports each containing alimited number of characteristics so that you can report on a number of different combinations ofdata online.
This helps you to avoid the problem of having particularly large reports, whose large volume ofdata often means that they cannot be constructed online and have to be planned as abackground job.
IntegrationAmong other things, the report/report interface lets you
• connect reports which contain characteristics from different applications. This makes itpossible to report on more objects than you could with any individual report.
• connect reports which were created in different application classes
For an example of reports connected to other reports within an application class(costing-based Profitability Analysis), see the CO-PA example reports 0-SAP07(sender report with the characteristics “Customer group” and “Product group”) and 0-SAP08 and 0-SAP09 (receiver reports with the characteristics “Customer” and“Product”).
Features
Exchange of data between reports
With the report/report interface, you can combine information from several reports. To do so, youneed to define sender reports and receiver reports. The sender report sends data to the receiverreports using variables which you define either in the receiver reports or in the form they arebased on. The sender report supplies values for these variables when you execute the receiverreport.
See also:
Example: Report/Report Interface [Page 83]
How to Use the Report/Report Interface [Page 81]
Splitting reports
The function Split report offers you a simple alternative to the report/report interface for instanceswhen you want to jump from one drilldown report to another. You can divide a “large” report --which contains a large number of drilldown characteristics -- into two reports to make executingthe report online more efficient. This also makes navigating between the report lists easier.
You can find this function under the menu option Information system → Define report → Split.

CA - Drilldown Reporting SAP AG
Overview: Report/Report Interface
80 April 2001
Once you have made all the necessary entries and entered the name of the report, save yourentries. Then execute the report and choose the drilldown characteristic which should go into thenew report. Enter a name for the report which is created as a result of the split.
You can execute the report as soon as you have split the report. When you reach the lowest levelof the first report, the system automatically calls up the second report using the report/reportinterface. You can navigate back and forth between the two reports as you wish.
It is also possible to split a report into more than two reports.
If you have only split the report once, the system automatically executes the newreport when you click on the symbol for the report/report interface. If you have splitthe report more than once, you receive a dialog box where you can choose whichreport you want to see.

SAP AG CA - Drilldown Reporting
How to Use the Report/Report Interface
April 2001 81
How to Use the Report/Report Interface
For an example, see also Example: Report/Report Interface [Page 83].
Assigning reportsBefore you can use the report/report interface, you first need to define a receiver report withvariables for the information you want to pass on from the sender report. Next, define a senderreport. Before leaving the report, you need to assign it to the receiver report. To do this, call upthe function Extras → Report assignment. The system will then display a dialog box in which youcan enter the desired report. In another dialog box, you can enter a different application class toassign reports from that application to your sender report. Once you have done this, save yourreport.
Calling up a reportYou can call up a receiver report from any level of the drilldown list of your sender report. To doso, choose the function Call up report (in some applications called Other reports) and choose thereport you want to execute.
You can return to any previously executed report from a receiver report using thefunction History.
Prerequisites for using the report/report interface
Variables
For the system to send information from one report to another, the receiver report must containvariables for the data you want it to receive from the sender report. These can be either local orglobal variables, and you can define them in the report itself or in the form used by that report.
In order for the system to be able to replace the variables with characteristic values via thereport/report interface, it is important that you select the Enter when executing flag on thescreen Enter variables.
For more information about variables, see the following:
Overview: Variables [Page 50]
Variables for Characteristic Values
Variables for Texts
Variables for Formulas
Summarization levels (only CO-PA)
When you save a report after creating it, the system displays a dialog box with the title ReadSummarization Data. As a default, the option here is set to Error message.
However, a receiver report usually only requires the system to read a small amount of data,since the information from the sender report limits the selection drastically. Consequently, it is not

CA - Drilldown Reporting SAP AG
How to Use the Report/Report Interface
82 April 2001
always necessary to use summarization levels. It is therefore recommended that you change theoption to either Warning or No message.
Since a sender report can sometimes require a large amount of data, you should always use areport which uses a summarization level. In the dialog box Read Summarization Data, youshould accept the default setting, Error message, to avoid potential abends.
You can change this setting at any time in Change report under the menu option Extras →Summarization level.
If you work with summarization data instead of summarization levels, you receive thedialog box Store Summarization Data instead of Read Summarization Level. Herethe following settings are recommended:
– receiver report: No summarization data
– sender report: Store summarization data and Error message

SAP AG CA - Drilldown Reporting
Example: Report/Report Interface
April 2001 83
Example: Report/Report InterfaceFor an example of how you could use the report/report interface, see the CO-PA example report0-SAP07 and its two receiver reports 0-SAP08 and 0-SAP09.
Report 0-SAP07 displays the characteristics “Customer group” and “Product group”.
The receiver reports contain local variables for the characteristics “Customer group” and “Productgroup”. In addition, report 0-SAP08 displays the characteristic “Customer” and report 0-SAP09the characteristic “Product”.
You can display the parameters for each report by executing it and then choosing themenu option Extras → Report parameters.
Execute the report 0-SAP07. From the initial list, drill down to the characteristic “Customergroup”. Then choose Goto → Call up report... to call up report 0-SAP09 or 0-SAP08. The systempasses the characteristic values for “Customer group” and “Product group” to the receiver report,where you can then drill down through other characteristics.
If you have defined additional receiver reports, you can then call up another one using the samefunction (Call up report).
You can return to any previously executed report at any time using the function History, which islocated under the menu Goto.

CA - Drilldown Reporting SAP AG
Report/Report Interface: Transformation of Selection Data
84 April 2001
Report/Report Interface: Transformation of SelectionDataThe report/report interface lets you call up receiver reports (ABAP reports, transactions, ABAPquery, Report Writer reports and drilldown reports) from a sender report. The sender selectiondata is reproduced in the receiver selection data. The system performs the following steps toreproduce the sender fields in the receiver fields:
1. Firstly, the system performs transformation by data element equivalence. If the sender fieldsand the receiver fields have the same data element, and no other sender or receiver fieldshave the same data element (uniqueness) the sender value is taken over in the receiver field.
2. If transformation by data elements is not possible, the system carries out transformation inthe same way by domain equivalence. You can control this procedure by defining virtualdomains (see below).
3. If the system has still not found a sender value for a receiver field, it performs transformationby semantically equivalent domains. The domains in the sender and receiver fields whichhave not yet been transformed are replaced by equivalent domains, and processing isstarted as in 2. (see below).
In the procedures described below, it is important to note that the technical domainsof the related data elements must have the same value (data type, field length etc.).Otherwise, the report/report interface will not be able to transfer data correctly.
Transformation by Domain Equivalence: Virtual Domains
You can influence how selection data is transformed in accordance with steps 2 and 3. In step 2,you can use virtual domains instead of real domains. A virtual domain is a definable name, whichyou can assign consistently to the data elements which you want to relate to one another. To dothis, create a new data record in table TVIRTDOM for each affected data element, and enter thename of the data element and the virtual domain you want to use.. The system finds the correctdata element assignment from the name equivalence of the virtual domains, when thereport/report interface is called up.
Alternatively, you can enter the actual domain for data element A and enter the same domain fordata element B, which you want to assign to data element A. In this case, the entry you make indata element B is a virtual domain, as a different technical domain is assigned to B's dataelement definition.
In some applications, for example, various data elements are used for thecharacteristic "period". To assure that the report data is still assigned correctly, makethe following entries in table TVIRTDOM:
TVIRTDOM
Date element Virtual domain Comment
CFPERDE PERDE Drilldown EIS
CO_PERIO PERDE CO-OM
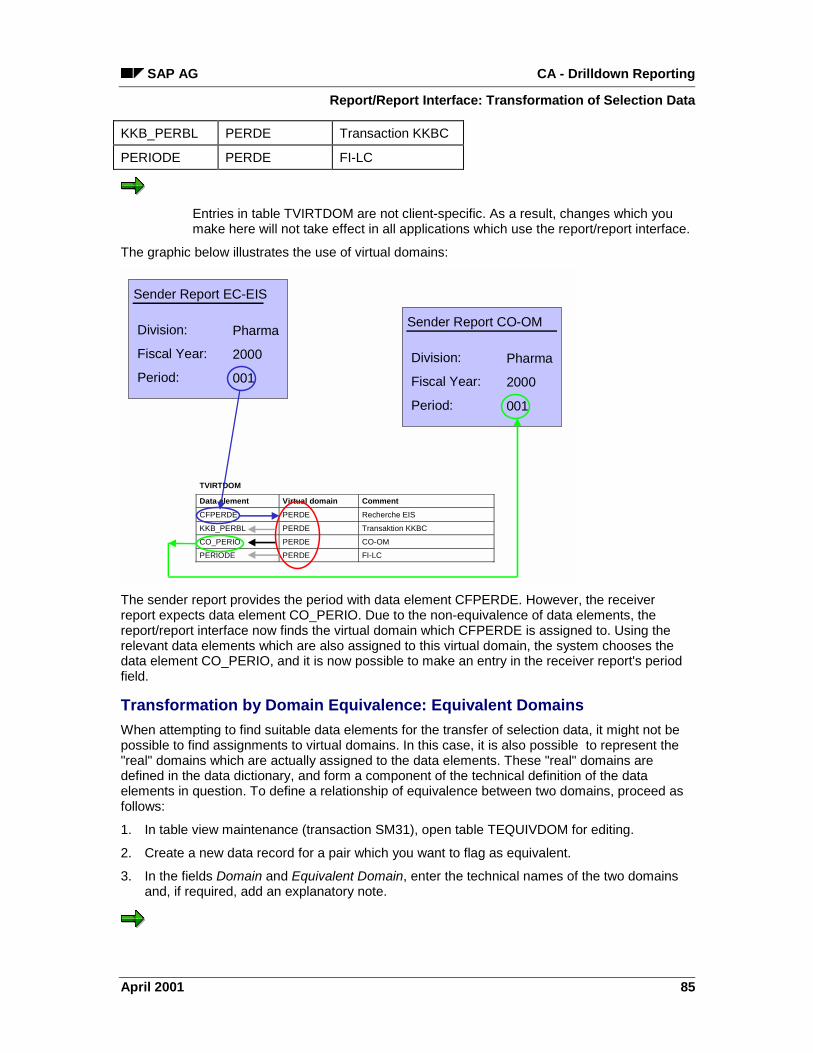
SAP AG CA - Drilldown Reporting
Report/Report Interface: Transformation of Selection Data
April 2001 85
KKB_PERBL PERDE Transaction KKBC
PERIODE PERDE FI-LC
Entries in table TVIRTDOM are not client-specific. As a result, changes which youmake here will not take effect in all applications which use the report/report interface.
The graphic below illustrates the use of virtual domains:
TVIRTDOM
Data element Virtual domain Comment
CFPERDE PERDE Recherche EIS
KKB_PERBL PERDE Transaktion KKBC
CO_PERIO PERDE CO-OM
PERIODE PERDE FI-LC
Sender Report EC-EIS
Division:
Fiscal Year:
Period:
Pharma
2000
001
Sender Report CO-OM
Division:
Fiscal Year:
Period:
Pharma
2000
001
The sender report provides the period with data element CFPERDE. However, the receiverreport expects data element CO_PERIO. Due to the non-equivalence of data elements, thereport/report interface now finds the virtual domain which CFPERDE is assigned to. Using therelevant data elements which are also assigned to this virtual domain, the system chooses thedata element CO_PERIO, and it is now possible to make an entry in the receiver report's periodfield.
Transformation by Domain Equivalence: Equivalent Domains
When attempting to find suitable data elements for the transfer of selection data, it might not bepossible to find assignments to virtual domains. In this case, it is also possible to represent the"real" domains which are actually assigned to the data elements. These "real" domains aredefined in the data dictionary, and form a component of the technical definition of the dataelements in question. To define a relationship of equivalence between two domains, proceed asfollows:
1. In table view maintenance (transaction SM31), open table TEQUIVDOM for editing.
2. Create a new data record for a pair which you want to flag as equivalent.
3. In the fields Domain and Equivalent Domain, enter the technical names of the two domainsand, if required, add an explanatory note.

CA - Drilldown Reporting SAP AG
Report/Report Interface: Transformation of Selection Data
86 April 2001
For technical reasons, it is not possible to determine whether a pair of domains youhave entered is actually equivalent from a managerial viewpoint. For this reason, thesystem does not perform a consistency check. You must check the consistency ofyour entries yourself.
The relationship between the two domains is not fixed. This means that it is of noimportance which of the two domains belongs to the sender field and which belongsto the receiver field.
Entries in table TEQUIVDOM are not client-specific. As a result, changes which youmake here will not take effect in all applications which use the report/report interface.
Although they possess different data elements, the characteristics cost element(KSTAR) and general ledger account (SAKNR) are semantically equivalent.
Calling up Reports with Variants
You can use the report/report interface to call up ABAP reports, ABAP queries and drilldownreports from many applications with variants. When assigning the report, both the name of thereport and the required variant have to be entered. The system then sends on the senderselection data to the receiver report and fills the entry fields in the receiver report automatically,meaning that you do not normally have to make any entries yourself on the selection screen forthe receiver report.
If you also call up the receiver report with a variant, the system takes into account both thesender selection data and the variant values of the receiver report. The relationship between thesender selection data and the variant values of the receiver report is decided as follows:
• The sender selection data normally overwrites the variant values.
• Entry fields which are marked as "protected" in the variant definition are an exception to thisrule. Consequently, they are not overwritten.
• If the entry field was marked as a "mandatory field" when the variant was defined, the systemwill also treat this field as a mandatory field when it is called up with the report/reportinterface. This means: If neither a sender value nor a variant value exist for this field, thesystem will display the selection screen and require the user to make entries here.
This functionality allows you to reproduce sender selection data more precisely in receiver entryfields. In particular, you can check the display of the receiver selection screen to a large extent:
• However, if the receiver report contains more entry variables than the sender report, theselection screen is not displayed, as the variables are filled with variable values.
• Previously, if the receiver report had two variables with the same data element, it was notpossible to assign a sender value to the variables, as the system requires data elementequivalence between the sender and receiver report when making the assignment. Now,however, it is possible to mark a variable as protected in the variant definition. In this way,the variable is removed from the assignment, and it is possible again to assign a sendervalue unambiguously.
Transformation of Global variables
In a drilldown report, it is possible to define more than one variable for the same characteristic. Intwo columns of a form, for example, the variables PER1 and PER2 could be defined for thecharacteristic "period", to represent a start period and an end period. If you use the report/report

SAP AG CA - Drilldown Reporting
Report/Report Interface: Transformation of Selection Data
April 2001 87
interface to call up a report which uses this type of form, variables PER1 and PER2 cannot befilled at first, as data equivalence exists between the sender and receiver selection data, but notuniqueness (see above). A solution to this problem is to transform global variables.
Here, sender variables are reproduced in receiver variables if they both have the same globalvariable name. For example, if the sender report has global variable PER1, the receiver variableis entered as PER1. If the sender report still has global variable PER2, PER2 is also entered inthe receiver report.
Calling up Reports from other Systems
The report/report interface also lets you call up reports (ABAP reports, transactions, ABAP query,Report Writer reports and drilldown reports) from other systems. To do this, proceed as follows:
1. Choose Extras → Report Assignment.
2. In the dialog box, choose Add External Report.
Another dialog box appears.
3. Enter the name of the RFC destination with which you want to set up a connection to theother system. If you set up the connection successfully, a dialog box appears in which youcan choose a receiver report from the reports available in the other system.
You can also assign and call up queries from a BW system. To do this, however, BW-ADD-ONmust be installed in the sender system. It is possible to carry out transformation between thesender selection data and the receiver selection data from the BW system provided that the datain the corresponding BW InfoCube originates from the sender system.
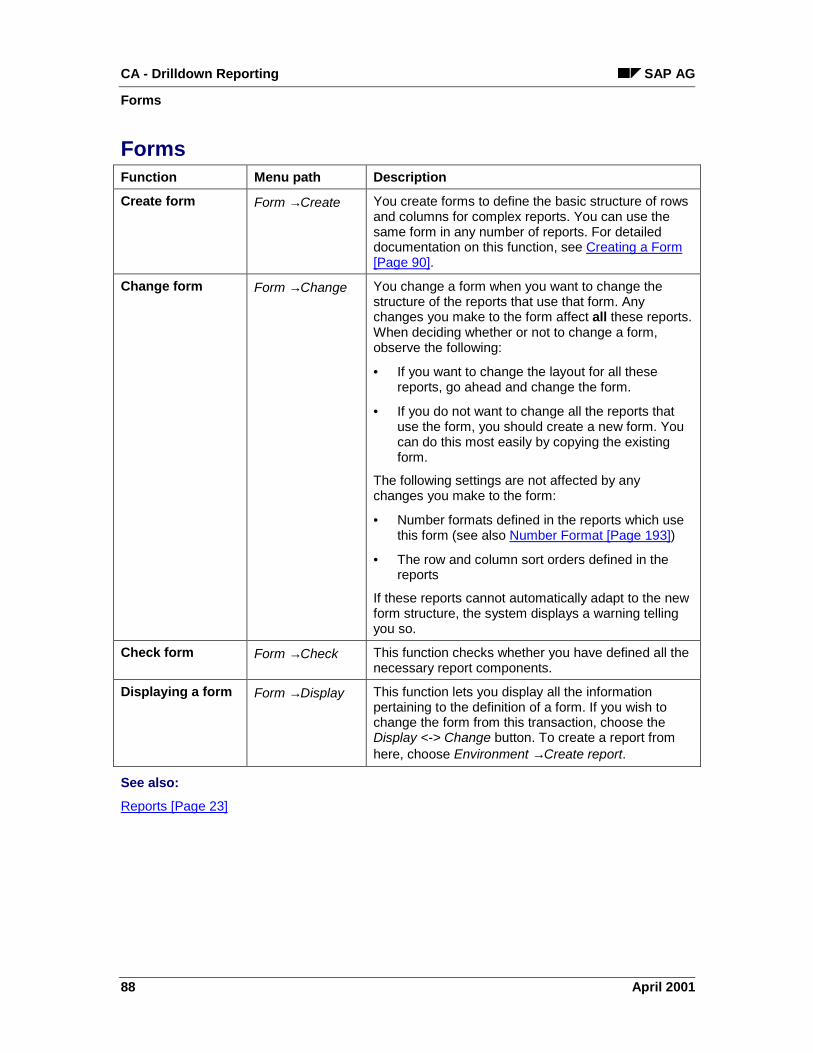
CA - Drilldown Reporting SAP AG
Forms
88 April 2001
FormsFunction Menu path Description
Create form Form → Create You create forms to define the basic structure of rowsand columns for complex reports. You can use thesame form in any number of reports. For detaileddocumentation on this function, see Creating a Form[Page 90].
Change form Form → Change You change a form when you want to change thestructure of the reports that use that form. Anychanges you make to the form affect all these reports.When deciding whether or not to change a form,observe the following:
• If you want to change the layout for all thesereports, go ahead and change the form.
• If you do not want to change all the reports thatuse the form, you should create a new form. Youcan do this most easily by copying the existingform.
The following settings are not affected by anychanges you make to the form:
• Number formats defined in the reports which usethis form (see also Number Format [Page 193])
• The row and column sort orders defined in thereports
If these reports cannot automatically adapt to the newform structure, the system displays a warning tellingyou so.
Check form Form → Check This function checks whether you have defined all thenecessary report components.
Displaying a form Form → Display This function lets you display all the informationpertaining to the definition of a form. If you wish tochange the form from this transaction, choose theDisplay <-> Change button. To create a report fromhere, choose Environment → Create report.
See also:
Reports [Page 23]
SAP AG CA - Drilldown Reporting
Overview: Forms
April 2001 89
Overview: FormsA form determines the content and formal structure of a report. A form can be thought of as asemi-finished report, which you complete by specifying (additional) characteristics and keyfigures when you define the individual report. The content of a form should generally be fixed andchange only under rare circumstances. When you change a form, it affects every report that usesthat form.
Types of formForms are divided into forms with one axis and forms with two axes. Forms with one axis onlyconsist of one dimension -- that is, either columns or rows. Forms with two axes contain bothcolumns and rows. You can choose from the following form types:
• form with one axis without key figure
In a form with one axis without key figure, you define either the rows or the columns ofthe form by choosing characteristics. When you press Continue, the system displays anempty structure of columns. You can “tip” this structure at any time by choosing Goto →Row display from the menu. You can therefore choose whether to define rows orcolumns for this type of form.
• form with one axis with key figure
In a form with one axis with key figure, you define either the rows or the columns of theform by choosing key figures. When you press Continue, the system displays an emptystructure of rows. You can “tip” this structure at any time by choosing Goto → Columndisplay from the menu. You can therefore choose whether to define rows or columns forthis type of form.
• form with two axes with key figure
In a form with two axis with key figure, you define both the rows and the columns of theform by choosing key figures and characteristics. When you press Continue, the systemdisplays an empty structure of rows and columns. You can define key figures in the rowsor in the columns, depending on how you want to use the form.
Which type of form you want to use will depend on what type of layout and what content yourequire for your report.
You can find further information about the various types of forms in the section: Basic Report andReport with Form [Page 14].
See also the following topic areas, which are also of relevance for forms:
Overview: Variables [Page 50]
Entry and Use of Hierarchy Nodes [Page 67]

CA - Drilldown Reporting SAP AG
Creating/Changing a Form
90 April 2001
Creating/Changing a FormYou can create a form by choosing Environment → Create form from the application, or inCustomizing under Information system → Form → Create form. You need to specify the type ofform and enter a new name. If you want to create a form that yields fully formatted detail lists,you need to choose the form type Two axes (matrix).
Basic ScreenThe function Create takes you to an empty list. When you press Continue, the system jumps tothe next screen and displays an empty list structure of either four rows, four columns, or fourrows and four columns, depending on the type of form you are creating. All definable fields on thescreen are referred to as “elements”. Every row, every column and every individual cell is anelement of the form.
ElementsYou can define each row, column or cell of a form individually. To do so, position the cursor onthe element you want to process, and then choose Edit → Element → Define element orCreate/change. You can also define an element simply by double-clicking on that element. Adialog box now appears, in which you can define the element.
You can define elements anywhere on the form except where defined elements already exist. Toadd a new element, position the cursor between two defined elements or in the free space to the

SAP AG CA - Drilldown Reporting
Creating/Changing a Form
April 2001 91
right or below, and choose Edit → Element → Insert element or simply double-click where youwant to insert the element. To change elements which have already been defined, double-clickon them.
You cannot define a cell until you have defined the corresponding row and column. Speciallydefined cells are indicated as such with symbols.
If the total width of the columns you have defined exceeds 255 characters, thecolumns beyond this limit will neither be displayed on the screen nor printed.However, you can use the columns beyond this limit for help columns, where youcan position formula calculations or other key figures which are referred to in thevisible part of the report.
For information about processing rows, columns and cells, see Defining Elements[Page 98].
If you want a characteristic (or a single characteristic value) to apply to all the rowsand columns of the form, you can define this centrally by choosing Edit → GeneralData Selection. Defining such characteristics in the general data selection also leadsto improved system response times.
See also General Data Selection [Page 102].
For application-specific examples of how to define a form, see:
• Example: Creating a Form (CO-PA) [Page 92]
• Example: Creating a Form (EC-EIS / CO-PC) [Page 94]
• Example: Creating a Form (FI) [Page 96]

CA - Drilldown Reporting SAP AG
Example: Creating a Form (CO-PA)
92 April 2001
Example: Creating a Form (CO-PA)
1. You are processing a form with two axes and would like to define the first column. To do so,position the cursor on the column you want to define and double-click with the left mousebutton.
2. Next, decide whether you want to define the element from nothing (choose Characteristics,Value fields, or Element of a line structure) or copy an element from a form with one axis(choose Predefined element). In this case we will choose Characteristics.
If you choose Characteristics, the system displays a dialog box in which you choose thecharacteristics you require. Select as many as you wish from this list. As you continuedefining your form, the system will ask you to specify a characteristic, an predefinedelement or a formula for each column you define. The value fields and the elements ofthe line structure will go in the rows.
If you choose Value fields, the system displays a dialog box. Here, you choose a fieldand then define this using characteristic values. As you continue defining your form, youwill need to specify a value field, a predefined element or a formula for each column youdefine.
If you are working in costing-based CO-PA and you choose Element of a line structure,the system displays a list of all the line structures. Choose one from this list. In a differentdialog box, now choose an element from this structure, which you can further defineusing characteristic values. As you continue processing your form the system will requireyou to choose a value field, a predefined element or a formula for each column.
In this example, we will choose Value fields.
3. While defining the characteristic values, you can define variables as an alternative to fixedvalues. To do this, position the cursor on the desired field and choose Variable on/off. Thesystem will automatically place a selected checkbox before that field, and the field length willchange. If you want to use a local variable, you also need to begin the variable name with $.Otherwise the system will treat the variable as a global variable and check to make sure thatit exists. If you want to specify fixed characteristic values, enter either an individual value oran interval. You can also enter several individual values or intervals by choosing thepushbutton.
In account-based analysis, you must specify a single value for a characteristic whichdetermines the currency of a selected value field. You are not allowed to enter aninterval.
If you change a characteristic value which you already entered, you can update the textdisplay using Refresh.
4. Click on the symbol to enter texts of three different lengths which will be used as columnheaders for the element. If you are defining a new element, the system proposes the text ofthe from-value of the first characteristic as a default. You can later define which text shouldbe displayed using the menu option Text length. If you want to define a two-line columnheader, be sure to indicate the line break with a “;“ (semicolon).

SAP AG CA - Drilldown Reporting
Example: Creating a Form (CO-PA)
April 2001 93
5. When you define the second element and later ones in the same axis, the first dialog box letsyou decide whether you want to define the element using value fields (or characteristics),predefined elements or a formula. If you choose Formula, the system takes you to theformula editor, where you can define the formula using the other elements of that axis andspecially defined cells.
In account-based analysis, if you define more than one element with a value fieldwhose currency is determined by the value of a characteristic, you can enter adifferent value of that characteristic in each element. That way you can displaydifferent currencies next to each other in the same report.
You can take over a complete key figure scheme [Ext.] into a report in one singleediting stage. Proceed as follows: Choose Edit → Lines → Replace all lines and thenAll characteristic values of a characteristic. Now choose "Element of a key figurescheme" from the characteristic list. Once you have selected one of the available keyfigure schemes, the system inserts all key figures which belong to this scheme intothe form.

CA - Drilldown Reporting SAP AG
Example: Creating a Form (EC-EIS/CO-PC)
94 April 2001
Example: Creating a Form (EC-EIS/CO-PC)1. You are processing a form with two axes and would like to define the first column. To do so,
position the cursor on the column you want to define and double-click with the left mousebutton.
2. Next, decide whether you want to define the element from nothing (choose Characteristics orKey figures) or copy an element from a form with one axis (choose Predefined element).
If you choose Characteristics, the system displays a dialog box in which you choose thecharacteristics you require. As you continue defining your form, the system will ask youto specify a characteristic, an predefined element or a formula for each column youdefine. The key figures will go in the rows.
If you choose Key figures, the system displays a dialog box. Here, you choose a fieldand then define this using characteristic values. As you continue defining your form, youwill need to specify a key figure, a predefined element or a formula for each column youdefine.
In this example we will choose Key figures.
3. While defining the characteristic values, you can define variables as an alternative to fixedvalues. You can also use variables instead of specifying individual values. To do this,position the cursor on the desired field and choose Variable on/off. The system willautomatically place a selected checkbox before that field, and the field length will change. Ifyou want to use a global variable, you can display possible entries using F4. If you want touse a local variable, you also need to begin the variable name with $. Otherwise the systemwill treat the variable as a global variable and check to make sure that it exists. If you wish toenter fixed characteristic values immediately, you can enter single values or an interval ofvalues. You can also enter a number of values or intervals by choosing the pushbuttonMore...
You must specify a single value for a characteristic which determines the currency ofa selected value field. You are not allowed to enter intervals for characteristics of thiskind.
If you change a characteristic value which you already entered, you can update the textdisplay using Refresh.
4. Click on the symbol to enter texts of three different lengths which will be used as columnheaders for the element. If you are defining a new element, the system proposes the text ofthe from-value of the first characteristic as a default. You can later define which text shouldbe displayed using the menu option Text length (Format →→→→ All columns →→→→ Text length...). Ifyou defined a variable for the characteristic value, it makes sense to define one for the texthere as well.
5. When you define the second element and later ones in the same axis, the first dialog boxalso lets you decide whether you want to define the element using a formula. If you chooseFormula, the system takes you to the formula editor, where you can define the formula usingthe other elements of that axis and specially defined cells.

SAP AG CA - Drilldown Reporting
Example: Creating a Form (EC-EIS/CO-PC)
April 2001 95
If you define more than one element with a key figure whose currency is determinedby the value of a characteristic, you can enter a different value of that characteristicin each element. That way you can display different currencies next to each other inthe same report.
You maintain the rows in the same manner as columns. Row, column and cellprocessing are described in detail under Defining Elements [Page 98].
CA - Drilldown Reporting SAP AG
Example: Creating a Form (FI)
96 April 2001
Example: Creating a Form (FI)1. Choose Edit form in the Implementation Guide for Financial Accounting.
2. Choose the report type Balance sheet analysis and enter a name for the form and choosethe form type One axis with key figure. This applies for all types of balance sheet analysis.
The R/3 System contains standard forms which you can copy and then change tocreate your own forms. These are the forms 0SAPBLNCE-01 through 0SAPBLNCE-NN. These forms themselves cannot be used with reports.
3. Choose Create.
By default, the system always takes you to the row display first. To see the columndisplay, choose the menu option Goto → Column display.
Define characteristics for all columns:
4. First, define the characteristics which should apply for all the columns of your form. Sinceyou want to show actual data in all the columns, you can specify the plan/actual indicatorunder Edit → Gen. Data selection.
The system displays a dialog box in which you can choose the characteristics for thegeneral data selection. Enter the characteristic Plan/actual indicator in the table Selectedcharacteristics and set the value for the actual data to "0".
Define first column:
5. Once you have defined the general data selection, specify the characteristics you want touse in this first column. Position the cursor on the first column and choose Edit → Element →Define element.
6. In the next dialog box, choose the option Key figure with characteristics.
7. Another dialog box appear. Choose the characteristic Balance sheet value from the list ofpossible key figures. The key figure stands for the balance sheet values which you want toanalyze in your report.
For an actual comparison of different years, you also need to choose the characteristicFiscal year. If you wanted to make a plan/actual comparison, you would also need toenter Plan version in the Selected characteristics table.
Now enter the desired characteristics values in the following dialog box:
– For the fiscal year, you can enter either fixed values or variables. To enter variables,position the cursor on the corresponding field and choose the pushbutton Variable on/off.The system then changes the length of the field accordingly. You can display a list of theexisting global variables for the fiscal year using the Possible entries function (F4). Forthe first column, choose the variable "1FY".
If you want to enter fixed values, enter the desired year in the corresponding field.
Using variables has the advantage that you can then use the form for a number ofdifferent reports, since you do not have to specify fixed values until you define thereport. For more on this topic, see Valuating Variables [Ext.] in the online manual FI -Financial Accounting Information System.

SAP AG CA - Drilldown Reporting
Example: Creating a Form (FI)
April 2001 97
8. Click on the symbol , to enter texts of three different lengths to be used as column headersfor the element. You can enter either a short, medium or long text. You can later determinewhich of these texts should appear in the displayed report. If you wish to use a two-linecolumn header, place a ";" in the long text where you want the line breaks to occur.
If you are working with variables, you also need to enter variables in the column header.For example, in a yearly comparison you could enter the following texts:
– short text: FY;1FY
– medium text: FiscYr;1FY
– long text: Fiscal year;1FY
You can change the column width using the menu option Formatting → Column → Columnwidth. To change the text length on the screen, choose Formatting → All columns → Textlength.
Variables for the column texts are replaced when you execute your report.
Define second column:
9. Once you have defined the first column, you can define additional columns in the samemanner as described above. However, you can also copy the attributes of a previouslydefined column.
To do this, position the cursor on the new column and choose Edit → Selected area →Copy. The system copies the entire definition of the first column to the new column. Youcan then change the definition of the column as required.
For the fiscal year comparison, you need to enter a different fiscal year in the secondcolumn. If you are using variables, enter “1FY-1” as the characteristic value.
Define variance:
10. The third column should contain the difference between the first and second columns.
To do this, position the cursor on the third column and choose Edit → Element → Defineelement.
11. In the first dialog box, choose the element type Formula.
12. The system now displays the formula editor, where you can enter a formula for calculatingthe variance. Here, you can carry out standard operations (+, -, *,/) on any number ofelements in the form.
Choose the first value under ID, then choose the minus sign. Now choose the secondvalue under ID.
13. In the next dialog box, enter texts for the column “Variance”.
14. Delete any columns you do not need by selecting the columns and then choosing Edit →Delete.
15. Save the form.

CA - Drilldown Reporting SAP AG
Defining Elements
98 April 2001
Defining Elements
Element typesWhen you define a row or column of a form, the system first displays a dialog box in which it asksyou to specify an element type. Which element types are offered here depends on whether youare defining a row or a column as well as what elements you have already defined.
Element type: Description: Where offered:
Characteristics Values:
• one or more characteristics,
• values of these characteristicsand
• the text that is to appear
in a dimension in which no keyfigure has yet been defined
Key figure (orValue field) withcharacteristics
Values:
• one key figure,
• characteristics that describe thekey figure,
• values of these characteristicsand
• the text that is to appear
in a dimension in which no(pure) characteristics have yetbeen defined
Element of theline structure
(only in CO-PAProfitabilityAnalysis)
Values:
• a key figure that already existsas part of the line structure beingused,
• characteristics that describethe key figure,
• values of thesecharacteristics and
• the text that is to appear
in a dimension in which nocharacteristics have yet beendefined

SAP AG CA - Drilldown Reporting
Defining Elements
April 2001 99
PredefinedElement
Values:
any predefined element
Here you can choose any elementfrom any existing form with oneaxis.
First you need to choose the desiredform, and then the element you wantto copy. You then receive the samesequence of dialog boxes as with theabove options, where the data of thecopied element is displayed as thedefault. You can change this datawhere necessary.
• if no dimension has beendefined, all forms with oneaxis are offered
• in a dimension in whichkey figures have beendefined, only forms withkey figure are offered
• in a dimension in whichcharacteristics have beendefined, only forms withoutkey figure are offered
Formula Definition
a formula that uses any existingelements in the same dimension.
• in any dimension where atleast one element hasbeen defined
Row processingUnder Edit → Rows you can find special functions for editing rows. Insert blank line and Insertdividing line insert the desired line directly above where the cursor is standing. Insert text givesyou a field 40 characters in length beginning where the cursor is standing.
The function Replace rows lets you replace the rows of a form with all the values of a singlecharacteristic or with a suitable form with one axis. A “suitable” form with one axis means eitherone with or one without key figure, depending on what type of columns you have already defined.If you have not defined any rows, the system offers both types of forms. However, if you havedefined a column with a key figure, the system only offers you forms without key figure for therows.
If the desired form with one axis contains columns instead of rows, you can tip the form underGoto → Row display.
The replace function is only available for forms with two axes. For forms with oneaxis, you can do this by specifying another form in the Copy from box on the initialscreen.
The function Edit → Rows → Hide lets you hide the row where the cursor is standing. Thedefinition of the hidden row remains active, however, so that you can still use it in formulas. Youcan edit hidden rows under Edit → Hide → Hidden rows → Change. You can also Delete and Showthese rows.

CA - Drilldown Reporting SAP AG
Defining Elements
100 April 2001
Column processingUnder the function Edit → Columns you can find special functions for editing columns. Replace allcolumns lets you replace all the columns of a form with the elements of a suitable form with oneaxis. A “suitable” form with one axis means either one with or one without key figure, dependingon what type of rows you have already defined. If you have not defined any rows, the systemoffers both types of forms. However, if you have defined a row with a key figure, the system onlyoffers you forms without key figure for the columns.
If the desired form with one axis contains rows instead of columns, you can tip the form underGoto → Column display.
This function is only available for forms with two axes. For forms with one axis, youshould create the form by specifying another form in the Copy from box on the initialscreen.
The functions Edit → Columns → Hide and Edit → Columns → Hidden rows work the same way asthe corresponding menu options for rows (see above).
Cell types in cell processingThe content of a cell is generally determined by the definitions of the row and the column whichintersect there. If this definition is not sufficient, you can define the cell separately. To do so,position the cursor on the cell and choose Define element... or simply double-click on the cell.Then choose the cell type you wish to define in the dialog box.
The following describes the various cell types and explains when the system lets you use them.
• Choosing row or column formula
The dialog box Choose Row or Column Formula appears when both the row and thecolumn that make up the cell contain formulas. In this case you need to specify whichformula you want to use to calculate the cell. Use column formula means that the valuedisplayed in the cell will be the solution of the column formula, and Use row formulameans it is the solution of the row formula. If you still have to choose which formula touse for a cell, that cell is indicated by a red question mark.
Which formula is used for the cell is indicated on the screen by an arrow pointing up:(forthe column formula) or to the left: �(for the row formula). ➧ ).
In addition to these two options, you can also choose No formula.
Since the system always uses the setting which was last made, you can use thisoption to reverse the previous setting.
• Selection with key figure (value field)
Choose Selection with key figure (value field) if you want a separate selection to takeplace for that cell. When you choose this option and press Confirm, the system displaysa series of dialog boxes in which you can choose a key figure, characteristics andcharacteristic values and define a text for the cell. The cell definition is indicated on thescreen by a. ♣ .

SAP AG CA - Drilldown Reporting
Defining Elements
April 2001 101
Note that the value in this cell need not necessarily reflect the intersection of theselections for the corresponding row and column.
• Formula
The option Formula becomes available only when you have already defined at least onespecial cell. When you choose this cell type, the system displays the formula editor,where you can define a formula based on the special cells. You can also enter a specialtext to describe the cell. This cell definition is indicated by a.
Note that the value in this cell need not necessarily reflect the intersection of theselections for the corresponding row and column.
• Inactive
Inactive lets you deactivate the cell if the value contained there is of no interest.
A deactivated cell is indicated by a “0” in the form.
• Selected
Choose Selected when you want to use this cell in formulas for other cells but do notwant to define it separately. When you call up the formula editor, the system displays alist of all the selected cells for you to use in the formula. All cells for which you havedefined special processing are “selected”.
You can see which cells in the form have been selected in the select mode (Extras →Select mode for cells). To leave the select mode, choose Save selections.
• No special processing
No special processing deletes any special cell definition which you previously defined.The cell becomes a normal cell again, and its content is determined by the row andcolumn to which it belongs.
This cell type is not available for cells in which special processing is mandatory. That isthe case when the cell forms the intersection of a formula row and a formula column,where at least one of those formulas contains non-additive elements.
In contrast to the rows and columns, you can change the cell type at any time.

CA - Drilldown Reporting SAP AG
General Data Selection
102 April 2001
General Data Selection
Characteristics and characteristic valuesYou specify the characteristics and characteristic values which should apply for the entire formusing the function Edit → General data selection → Display/Change or by double-clicking on theword Form. For example, if you want the form to be used to report on one fiscal year, you canenter this fiscal year here. The characteristics you define in the general data selection can thenno longer be used to define rows or columns.
You should always use the function General data selection when defining acharacteristic that should apply for all rows and columns of the form. This is easierthan defining the characteristic separately for each element, and leads to betterresponse times when you execute the final report.
Row and column formulasThe function Gen. data selection → Formula: row or column handles conflicts which arise whenthe definition of a cell consists of both a row formula and a column formula. If you want the cell tocontain the result of the row formula, choose Use row formula. This choice will be indicated onthe screen by an arrow: ➧ . If you want to use the column formula, choose Use column formula.The system will indicate this with the arrow �. The choice you make using this function appliesfor the entire form.
You can also make the same setting for individual cells using the function Edit → Element →Formula: row or column. This setting overrides the setting made under Gen. data selection forthat particular cell only.
If you want to change the setting for a single cell, you can do so simply by double-clicking on thecell.
In addition to these two options, you can also choose No formula.
Since the system always uses the setting which was last made, you can use thisoption to reverse the previous setting.
SAP AG CA - Drilldown Reporting
Drilldown List and Defining Percentage Shares
April 2001 103
Drilldown List and Defining Percentage Shares
Defining a drilldown list for online displayOnce you have defined a form, you can define how the drilldown list should be displayed online.To do so, choose Extras → Drilldown display → Select rows/columns.
Then select all the rows and columns which you want the system to display in the standarddrilldown list. Once you have made your selections, choose the function Save selections (thegreen check mark in the red box), and the system will display the chosen layout for you to check.The system will save the drilldown list finally when it saves the entire form. This layout definesthe formal structure of the reports which are based on that form.
Defining a drilldown list for printoutIt may sometimes be useful to define a different drilldown list for printouts than for online display.For example, this might be the case if you want to limit the online display of a wide report to themost important columns, in order to make it easier to read, but still want to use the horizontalformat to display additional columns in the drilldown list for the printout.
You define the drilldown list for the printout under Extras → Drilldown printout the same way youdefined the drilldown list for online display.
Before you save the form, you should execute the function Form → Check. If youdefined anything incorrectly or left anything undefined, the system displays amessage informing you of this. Then you can make the necessary changes and thusbe certain that the form is correct before you use it in a report.
Percentage columns and rowsYou can define rows or columns of a form to contain percentages of sums by using the elementsShare of grand total (Syntax: %T(ABC), where ABC is the “grand total”) and Share of sub-total (Syntax: %S (XYZ), where XYZ is the “sub-total”) in the formula editor. The total here refersto the total for the highest drilldown characteristic, whereas the sub-total refers to the total foreach characteristic (at each level) of the drilldown hierarchy.
For more information, see the online system Help (F1).
For an example of these functions, see the standard report 0-SAP05 for costing-basedProfitability Analysis in operating concern S001.

CA - Drilldown Reporting SAP AG
Form Settings
104 April 2001
Form SettingsWhen you create a form, you can make a number of settings to determine how individual rows orcolumns are to be displayed, or how numbers are formatted. These settings determine howreports that use this form appear on the screen. You can override these settings, however, bychanging them in the definition of individual reports (see Functions for Defining Reports [Page26]).
ProcedureTo format an element of a form (color settings, number format, sign reversal, and so on), placethe cursor on the element and choose the applicable menu option under the menu Formatting.The formatting becomes visible immediately.
You can also save time by selecting several elements and formatting them at thesame time. The selected elements remain selected until you explicitly choose thefunction Deselect all.
• Color settings
This function lets you change the color of the selected element(s).
• Number format
This sub-menu contains all the functions which affect how numbers are displayed in thereport. You can specify a display factor and the number of decimal spaces. The definitionyou make here always applies to a specific column group. You can define the numberformats in greater detail once you have executed a report. There you can make differentsettings for individual columns. For more information on number formats, see NumberFormat [Page 193].
• Reverse +/- signs
This function causes all the signs in the report to be reverse. Negative values appearpositive, and positive values appear negative. This setting is indicated in the form by a “-”.
• Suppress zeros
This function causes all the cells with a value of 0 to appear blank. This setting isindicated in the form by lower-case Xs: “xxx.xxx.xxx”.
• Row
The function Indent row lets you indent the text for individual rows to give the report amore visual structure.
• All rows
These functions apply to all the rows of the form.
The function Margin type only works if you have already chosen the function Indent rowfor at least one row. It aligns all the rows of the report with the one indented the furthest.
The function Text length determines which text (short, medium or long text) the systemdisplays for the rows.

SAP AG CA - Drilldown Reporting
Form Settings
April 2001 105
• Column
With the function Column width you can change the width of individual columns. Firstselect the column(s) you want to change, and then choose this function. Remember tochoose Deselect all when you are finished formatting the columns.
• All columns
These functions apply to all the columns of the form.
The function Align column text determines whether the texts in the columns areleft-justified, centered or right-justified.
The function Text length determines which text (short, medium or long text) is displayedin the column headers. If you choose Long text - two lines, be sure to indicate where youwant the line break by inserting a “;”.
• Initial settings
This function returns all your format settings back to the default.
It is currently not possible to format cells individually.

CA - Drilldown Reporting SAP AG
Executing a Report
106 April 2001
Executing a ReportWith the function you can execute a report. This means that the system selects the data thatmeets the specified criteria and displays it in a number of report lists. Since the procedure forexecuting reports is different in each application, see the corresponding chapter in the onlinedocumentation for your application.
If you are executing a report for which variables are defined, a selection screen appears, inwhich you can enter either individual values, intervals or complex selections for the variables.You can also set the final output type [Page 37] for the report here and, if required, you candeviate from the output type in the report definition.
Once you have executed a report, you can process the displayed report in a number of ways andnavigate through the report data using the functions available. Navigation functions let youdisplay a number of different lists to analyze the data from different viewpoints. For moreinformation on the navigation functions, see Navigation [Page 130]. To read about how tonavigate using the hotspots on the report list, see Hotspots on the Report List [Page 166](applies only for the output type 'classic drilldown report'). For information on navigating ingraphical report lists, see Navigation in Graphical Reports [Page 177].
For information on the report/report interface, characteristic hierarchies, exception reporting andthe use of currencies and other settings for report lists, see How to Process Report Lists [Page123].
In order to reduce runtime when executing reports, you can save report data in the backgroundusing variants and variant groups, before executing the reports. In the overview list of reportsavailable in your application, the variants defined for each report are displayed as subnodes ofthe report.
See also:
Save [Page 213]
Creating Variants and Variant Groups [Page 108]
Read [Page 47]
Executing a Report with Selection Options [Page 107]

SAP AG CA - Drilldown Reporting
Executing Reports with "Selection Options"
April 2001 107
Executing Reports with "Selection Options"When you execute a report that uses global variables [Page 58] that you replace manually, youcan replace these using complex selection criteria.
How and when you can use selection options depends on the application you areworking in. For more information, see the corresponding chapter in your application'sdocumentation.
Using selection options, you can select more than one single value, an interval, or anycombination of single values and intervals (as on ABAP selection screens). In addition, you canexclude certain values from the selection.
In the header of the resulting report list, the text Complex selection and the symbol appearnext to the characteristic you used selection options for. Click on the symbol to display theselection options.
Saving Selection Options in Report VariantsYou can also save your selection options as a variant and use these later for online orbackground processing.
See also:
Creating Variants and Variant Groups [Page 108]
For documentation on how to fill in the selection screen, click on the icon.

CA - Drilldown Reporting SAP AG
Creating Variants and Variant Groups
108 April 2001
Creating Variants and Variant Groups
UseVariants and variant groups let you execute and save or print reports in the background at pre-specified times. This is particularly advantageous if a report processes large quantities of dataand requires longer processing times. You can also use variants to store regularly usedcombinations of characteristic for data selection, and so be able to call them up easily.
Variants and variant groups in Release 4.0 replace the variable groups used inearlier releases. For information about converting these from Release 3.x to 4.x, seethe corresponding release note.
FeaturesSelection variants let you save entries for variables along with other settings for a report. You cangroup several reports along with their variants into a so-called "variant group". You can thenexecute the entire variant group in the background.
To save or print reports in the background using variants, you use the following functions:
Creating Variants
In the variant, define the selection criteria as you would for the report. Then specify how thereport should be processed in the background, and save these settings as a variant for thereport.
Executing Report with Variants
The variants which have been defined for a report are displayed as subnodes of the report in thereport overview list. To execute a report with the settings which are stored in the variant, selectthe variant and choose Run Report with Variant in the variant context menu.
Creating Variant Groups
If you want to schedule more than one report together with their variants, you can group thesereports and variants together in a variant group. Create a variant group. To do so, enter a name,a short text, and a description.
Maintaining Variant Groups
Here you enter all the desired variants and reports in your variant group.
A variant group lets you:
• process more than one variant of one report together
• process variants from different reports together
Enter the reports and variants in the table which you want to summarize under this variant group.Save you variant group.

SAP AG CA - Drilldown Reporting
Creating Variants and Variant Groups
April 2001 109
Scheduling Variant Groups
Here you can schedule the entire variant group for processing in the background, or select andschedule only specific reports in the variant group.
The system schedules the selected reports or the whole variant at the specified time. You canalso schedule the job for execution in regular intervals. For more information, see thedocumentation BC Computing Center Management System [Ext.].
Reorganizing Variants
This function lets you delete any variant groups that you no longer need.
ActivitiesWhere you can find the functions for defining variants and variant groups differs from applicationto application. For details, see the corresponding documentation for your application.
See also:
Example of How to Use Variant Groups [Page 110]
Freezing Report Data in the Background Using Variants [Page 216]
Printing Reports in the Background Using Variants [Page 237]

CA - Drilldown Reporting SAP AG
Example of the Use of a Variant Group
110 April 2001
Example of the Use of a Variant GroupReport REPORT1 contains one variable for the period and another for the division which youwould like to analyze. A second report, REPORT2, contains variables for the period and thesales region.
The marketing department of your company is particularly interested in the divisionPharmaceuticals and in the regions Northeast and South for period 1. You create variantMARKA for this department. For this variant MARKA of report REPORT1, you define the period asperiod 1 and the division as Pharmaceuticals.
For MARKB in REPORT2, you define the variable combinations: period 1 and region Northeast,as well as period 1 and region South.
Then you create a variant group MARKET and enter the variants MARKA and MARKB for thereports REPORT1 and REPORT2.
In order to print or save the reports you schedule the variant group MARKET in the backgroundprocessing.

SAP AG CA - Drilldown Reporting
Report Information
April 2001 111
Report InformationYou can display the following report information both when you define the report and afterexecuting it.
• Report Parameters [Page 112]
• Key Figure Information [Page 114]
There are also several ways you can enter and display additional information on the report. Youcan define and display texts and comments either when you define the report or after executingit, or you can create and display documents directly from the report list.
• Report Texts [Page 115]
• Maintain Comment [Page 116]
• Display Document [Page 118]
• Maintain Header [Page 249]
• Maintain Footer [Page 248]

CA - Drilldown Reporting SAP AG
Report and Cell Parameters
112 April 2001
Report and Cell Parameters
FeaturesThe report parameters show you basic information about the report (basic list, currencyhandling, and so on), information about when and by whom it was created and changed,technical information (time required for data selection), and information about what data isselected. This information cannot normally be displayed in the report lists.
If you choose this function while the cursor is positioned on a cell, the system displays either thereport parameters or the cell parameters for that cell. In form reports, you can use the cellinformation to find out what formula was defined for that cell.
The report parameters include the following:
• Report name and long text, along with short text and description
• Report type
• Author
• Date created
• Person who last changed
• Date last executed
• Number of times executed
• Basic list
• Currency handling
• Variables
• Selected characteristics
• Selected key figures
• Columns selected for the drilldown list
• Rows selected for the drilldown list
Choose Technical information to obtain the time required for data selection (for individual reportvariants), information on the generated report program, and the size of the internal table.
You can also display comments and key figure information for the individual fields in the reportparameters. You can see what fields comments are defined for using the Highlight commentsfunction.
To display information about the form used by the report, choose Form.
ActivitiesCell parameters:
Position the cursor on a cell and choose Report parameters. The system displays an overview ofthe cell parameters, including the general data selection, the key figure and the number format.
You can display the report parameters from this screen by choosing the icon.

SAP AG CA - Drilldown Reporting
Report and Cell Parameters
April 2001 113
Report parameters:
Position the cursor on the header of the report list and choose Report parameters. The systemdisplays an overview of the report parameters. You can display technical information, comments,and key figure and form information from this screen.

CA - Drilldown Reporting SAP AG
Key Figure Information
114 April 2001
Key Figure InformationThis function gives you information about the key figure on which the cursor is positioned. Adialog box appears containing the formula by which the system calculates the key figure.
If the cursor is positioned on a basic key figure, which is contained in the database, no additionalinformation exists.

SAP AG CA - Drilldown Reporting
Report Texts
April 2001 115
Report TextsYou receive a dialog box with which you can change or display three report texts of differentlengths. These texts are displayed when you call up the report parameters.
Report Text On/OffWith this function you can display or hide the line which contains the report name and the timeand date when the data was selected.

CA - Drilldown Reporting SAP AG
Writing Comments
116 April 2001
Writing CommentsWith this function you can define comments for reports, report variants, and transaction data.
In EC-EIS, you can also write comments for individual objects in the report, such ascharacteristics or key figures. To do so, choose the function Master data →Comments → Maintain from the application menu.
You can create the comment in the text editor or (if you are working on a PC) import any otherdocument type in the Microsoft Office suite. This function also lets you change existingcomments.
Displaying CommentThis function lets you display an existing comment for the report.
If you have maintained comments for additional objects in SAP-EIS, you first need toposition the cursor on the desired object before choosing this function.
The function Highlight Comments [Page 117] lets you see which objects in the reporthave comments.

SAP AG CA - Drilldown Reporting
Highlight Comment
April 2001 117
Highlight CommentIn SAP-EIS, this function highlights all the currently displayed fields for which a comment exists.These fields are displayed inversely. It is recommended that you use this function before you usethe function Display Comment, so that you do not try to display a comment where none exists.
If you change to another screen, or call up another function which changes the current screen,the normal display will return, without the inverted fields.
To learn about how to create comments in SAP-EIS, see Maintain Comments [Page 116].

CA - Drilldown Reporting SAP AG
Display Document
118 April 2001
Display DocumentIn some applications (such as EC-EIS), you can create documents for master data records. Formore information about creating these documents, see the online documentation for yourapplication.
The function Display Document lets you display a document from the report list if one exists.
The function Highlight Document lets you highlight a document from the report list if one exists.
Highlight DocumentWith this function, you can highlight all fields for which a document exists. These fields aredisplayed inversely. It is recommended that you use this function before you use the functionDisplay Document, so that you do not try to display a comment where none exists.
If you change to another screen, or call up another function which changes the current screen,the normal display will return, without the inverted fields.

SAP AG CA - Drilldown Reporting
Maintain Header
April 2001 119
Maintain HeaderThis function lets you create a header for the report. The header is used in the printout.
Header on/offThis function lets you decide whether the header you have created will also appear in the onlinedisplay.

CA - Drilldown Reporting SAP AG
Maintain Footer
120 April 2001
Maintain FooterThis function lets you create a footer for the report. This footer is displayed in the printout whenyou print the report.
Footer On/OffWith this function you can specify whether the footer which you defined for the printout shouldalso appear in the online report.

SAP AG CA - Drilldown Reporting
Maintain Footer
April 2001 121
Layout Display
With this function you receive a preview of the report list, without having to load data in thereport. This is handy for getting an idea of how the report will appear on the screen, as well aswhen no data is available or when loading the data would be too time-consuming.
In the report list, you can switch between the detail list and the drilldown list. In contrast tothe function Execute Report [Page 107], you do not have to enter values in the report parametersfor the layout display, as the system does not perform data selection. For the same reason, thelayout display function displays existing navigation characteristics although navigation is notactually possible.

CA - Drilldown Reporting SAP AG
Function Levels for Different Users
122 April 2001
Function Levels for Different UsersThe drilldown reporting functions are divided into three groups so that you can set up threedifferent categories of users, depending on their tasks and what information they need. Thisenables users to learn how to work with drilldown reporting quickly. You can change the functionlevel after executing a report by choosing Extras → Additional functions.
• Level 1 contains the basic functions of drilldown reporting as well as the interface withSAPmail. These functions allow you to navigate within the displayed characteristic hierarchy.They also allow you to display detail lists in order to analyze your data more closely. Thisfunction level does not contain certain functions, such as those for maintaining the report orits settings, or those form transferring the report to other tools, such as the Excel List Viewer.
This level is for users who want to analyze certain form reports occasionally but do notrequire the full navigation functionality of drilldown reporting.
• Level 2 contains all of the navigation functions and functions for hierarchies, and allows youto download the report to the Excel List Viewer and to a PC file, and to change the displaysettings. It also lets you display exceptions. This function level does not contain certainfunctions for maintaining reports and for defining the print layout.
This level is aimed at users who require the full functionality of drilldown reporting,including the additional download and display functions listed above.
• All functions provides you with all the functions of drilldown reporting: defining parametersfor printouts, freezing report data, defining exceptions and maintaining reports directly fromthe report list.
This level is for users who need to set up reports for printing or maintain reports in moreways than is possible under level 2.
Users can change their own function level from the report list by choosing Extras →→→→ Additionalfunctions. However, the system checks their authorization for this before switching the level (seeCustomizing).
You can assign these levels to individual user master records by entering theparameter IDs RLV1 (Level 1), RLV2 (Level 2) and RLV0 (All functions) using thefunction System →→→→ User profile →→→→ User parameters.

SAP AG CA - Drilldown Reporting
How to Process Report Lists
April 2001 123
How to Process Report Lists
UseThis section contains descriptions of the functions you can carry out after executing a reportonline - that is, in the report list.
PrerequisitesTo display the report list, you need to have defined the report and - where applicable - the form.You also need the data which you intend the report to display. If no suitable data exists, a pagewith report information will be displayed in place of the report.
FeaturesYou can analyze your report data using functions for Navigation [Page 130], for Defining DisplayConditions [Page 179] and for displaying Graphics [Page 272]. Using the Functions Available inReport Lists [Page 192], you can define how the data in the report list is displayed and printed.You can save, print, export and send report data, see Saving, Printing, Exporting, SendingGraphics [Page 212].
For more information about which functions are available as pushbuttons, see variation in ProfitCenter Accounting, see Report List: Pushbuttons [Page 124].
To find out about special functions, which are only used in conjunction with the report type"graphical report", see Navigation in Graphical Reports [Page 177].
See also:
Report Information [Page 111]

CA - Drilldown Reporting SAP AG
Functions for Report Lists
124 April 2001
Functions for Report ListsThe following table gives you an overview of the functions that you can carry out when youexecute a report. Most of these functions are represented by icons.

SAP AG CA - Drilldown Reporting
Functions for Report Lists
April 2001 125
Report parameters
This function displays a list containing allthe information about the report and itsdefinition. This includes specificationswhich do not always appear on the list.
For more information, see Report andCell Parameters [Page 112].
Export Report
You can export reports or parts of areport. For example, you can download areport or a page of a report to XXL, saveit in a file, transfer it to Microsoft Word,or copy it to the report portfolio (inEC-EIS).
The system displays a dialog box inwhich you can choose how you want toexport the report. If only one option ispossible for the list currently displayed,the system automatically carries out thatfunction without displaying the dialogbox.
For more information, see Export [Page262].
Graphic
You can display and print graphics foryour report lists. The graphic can refer tothe values in a single row or column, agroup of columns, or the entire reportlist. The system displays the availabletypes of graphics in a dialog box, fromwhich you choose the type you wouldlike to see. If only one type of graphic isallowed for the selected data range, thesystem displays that graphicimmediately.
For more information, see Graphics[Page 272].
Send report
This function lets you send the currentpage of your report list to one or severalrecipients using SAPmail.
For more information, see Send [Page271].
Currency
This function translates the displayedcurrency to any other currency for theselected column(s). The currencytranslation key is used to automaticallyfind the exchange rate. You definecurrency translation keys in Customizing.
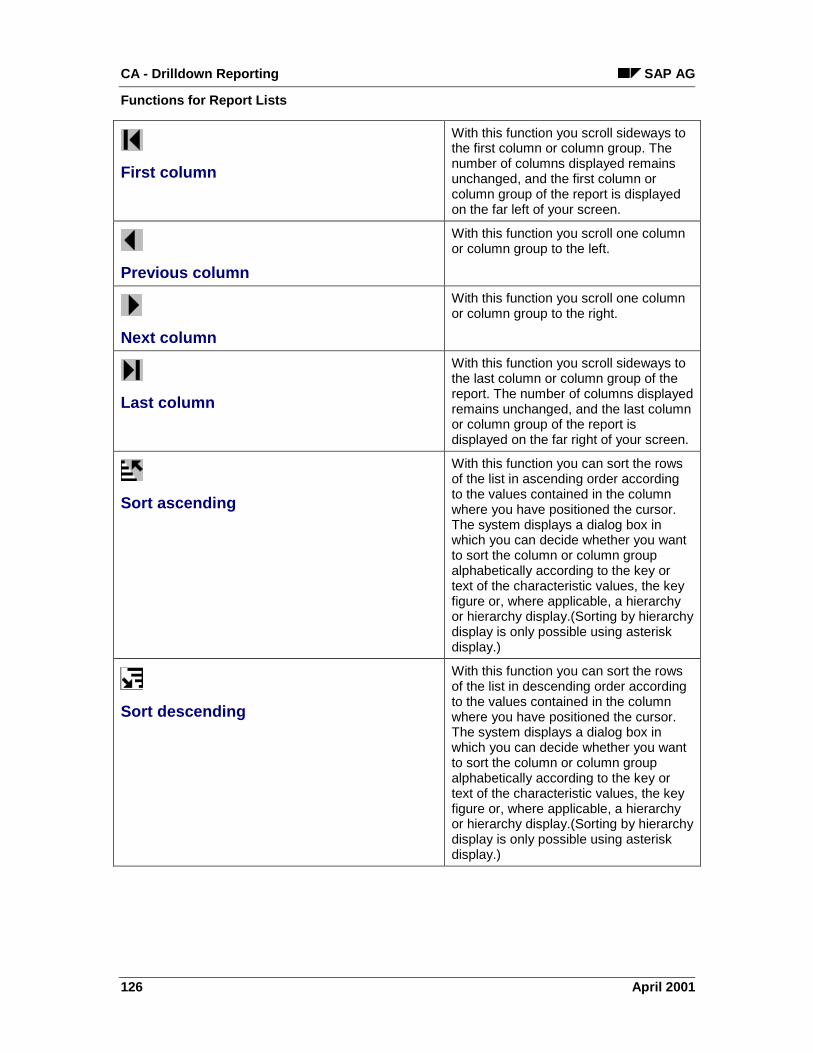
CA - Drilldown Reporting SAP AG
Functions for Report Lists
126 April 2001
First column
With this function you scroll sideways tothe first column or column group. Thenumber of columns displayed remainsunchanged, and the first column orcolumn group of the report is displayedon the far left of your screen.
Previous column
With this function you scroll one columnor column group to the left.
Next column
With this function you scroll one columnor column group to the right.
Last column
With this function you scroll sideways tothe last column or column group of thereport. The number of columns displayedremains unchanged, and the last columnor column group of the report isdisplayed on the far right of your screen.
Sort ascending
With this function you can sort the rowsof the list in ascending order accordingto the values contained in the columnwhere you have positioned the cursor.The system displays a dialog box inwhich you can decide whether you wantto sort the column or column groupalphabetically according to the key ortext of the characteristic values, the keyfigure or, where applicable, a hierarchyor hierarchy display.(Sorting by hierarchydisplay is only possible using asteriskdisplay.)
Sort descending
With this function you can sort the rowsof the list in descending order accordingto the values contained in the columnwhere you have positioned the cursor.The system displays a dialog box inwhich you can decide whether you wantto sort the column or column groupalphabetically according to the key ortext of the characteristic values, the keyfigure or, where applicable, a hierarchyor hierarchy display.(Sorting by hierarchydisplay is only possible using asteriskdisplay.)

SAP AG CA - Drilldown Reporting
Functions for Report Lists
April 2001 127
Choose hierarchy
This function is only active if hierarchieshave been defined for characteristics. Itlets you choose a specific hierarchy fordisplay or switch between hierarchicaldisplay and a normal drilldown list.
For more information, see ChooseHierarchy [Page 156].
Expand
This function lets you change the way acharacteristic hierarchy is displayed. Thefunction Expand expands the entirereport hierarchy one level. That meansthat every "+" currently visible becomesa "-", and all the nodes one level belowthem become visible. If the cursor ispositioned on a report row, this functiononly affects the branches which belongto that row. Otherwise all the report rowsare expanded.
For more information, see Expand [Page150].
Collapse
With this function you can collapsebranches of the displayed hierarchy.This function closes the lowest currentlyexpanded level of the hierarchy. If thecursor is positioned on a report row, thisfunction only affects the branches whichbelong to that row. Otherwise all thereport rows are collapsed.
For more information, see Collapse[Page 153].
Call up report
With this function you can call up thosereports which have been assigned to thecurrent report as receiver reports. To callup another report, position the cursor onthe row of the current report which youwant to use as parameters for the newreport. If the system requires additionalparameters for the new report, it displaysa dialog box asking you to enter these.
For more information, see Call up Report[Ext.].

CA - Drilldown Reporting SAP AG
Functions for Report Lists
128 April 2001
Number format
You can change the number format andthe +/- sign for individual columns. Whatsettings you can make depends on thereport and the list type displayed(drilldown or detail list).
For more information, see NumberFormat [Page 193].
Other report This function takes you back to the initialscreen of the function for executingreports. There you can specify anotherreport that you want to process.
Attributes
When you choose this function, thesystem displays all the attributes of theselected characteristic in a dialog box.
For more information, see Attributes[Page 162].
Functions in the Navigation Block on theReport List Screen
Drilldown list
This function takes you from the detaillist to the drilldown list for the selectedcharacteristic. For more information, seeDrilldown List [Page 132].
Detail list
This function takes you to the detail listfor a selected report object.
For more information, see Detail List[Page 138].
Basic list
The function Basic list returns you to thelist that the system displayed first whenyou executed the report. This may be adetail list or a drilldown list, dependingon how the report was defined.
For more information, see Basic List[Page 139].
Hide characteristic
This function clears the characteristicvalue specified for the currentcharacteristic. Position the cursor on thecharacteristic or characteristic value thatyou want to hide, and then choose thisfunction. Note that this is only possiblewith the characteristics in the navigationblock.
For more information, see HideCharacteristic [Page 160].

SAP AG CA - Drilldown Reporting
Functions for Report Lists
April 2001 129
Next characteristic value
When you position the cursor on one ofthe specified characteristic values in thisblock and then choose the function Nextchar. value, the system scrolls to thenext value of that characteristic anddisplays the corresponding list.
Previous characteristic value
When you position the cursor on one ofthe specified characteristic values in thisblock and then choose the functionPrevious char. value, the system scrollsto the previous value of thatcharacteristic and displays thecorresponding list.
Choose characteristic value
Position the cursor on the characteristicor characteristic value that you want tohide, and then choose this function. Notethat this is only possible with thecharacteristics in the navigation block.The system displays a dialog boxcontaining all the values of thatcharacteristic that you can choose from.Then the system displays thecorresponding list for the characteristicvalue you choose.
For more information, see ChooseCharacteristic Value [Ext.].

CA - Drilldown Reporting SAP AG
Navigation
130 April 2001
NavigationDrilldown reporting comes with a number of easy-to-use functions for navigating through yourreport data. Among other things, you can
• Create different types of report lists (see Report List [Page 131])
• Scroll back and forth through the report (see Scrolling Functions for Report Lists [Page140])
• Choose among display variants for hierarchies (see Hierarchy... [Page 149]))
• Navigate from one report to another (see Report/Report Interface [Page 158])
In addition, the following functions are also available for working with the report:
Hide Characteristic [Page 160]
Sort Characteristics [Page 161]
Line Items [Page 163]
Display Master Data [Page 164]
Find string [Page 165]
For a description of the navigation functions available, see Hotspots on the Report List [Page166] and Report List: Pushbuttons [Page 124].
SAP AG CA - Drilldown Reporting
Report List
April 2001 131
Report ListThere are two types of lists for a report − drilldown lists and detail lists − which display differenttypes of information. These navigation functions let you jump back and forth between thedifferent report lists in order to view your data from different angles.
• Drilldown List [Page 132]
• Choose Next Level [Page 133]
• Other Characteristic [Page 134]
• → Next Level [Page 135]
• ← Previous Level [Page 136]
• Period Screen [Page 137]
• Detail List [Page 138]
• Initial List [Page 139]

CA - Drilldown Reporting SAP AG
Drilldown List
132 April 2001
Drilldown ListThis function takes you from the detail list to the drilldown list for the selected characteristic.
This function is only available when you are displaying the detail list.
You can switch from the currently displayed drilldown characteristic to any other characteristic inthe report header, including the characteristics in the navigation block and those that havealready been specified through navigation. When you switch characteristics, the "old"characteristic moves to the bottom of the drilldown characteristics.
You can also execute this function by clicking on the symbol and then selectingthe desired characteristic from the navigation block.
For a detailed description of how to navigate using these and the other hotspots, seeHotspots on the Report List [Page 166].
See also:
Detail list [Page 138]
SAP AG CA - Drilldown Reporting
Choose next level
April 2001 133
Choose next levelThis function is only available on the drilldown list. It lets you choose which characteristic youwould like to break down next.
First position the cursor to determine which row you wish to analyze more closely, and thenchoose this function. The system displays a dialog box in which you choose the characteristicyou want to display. The selected characteristic value moves to the navigation block of the report,and the system displays the values of the characteristic you chose in the dialog box.
You can also rearrange the entire sequence of the characteristics using the function Sortcharacteristics [Page 161].

CA - Drilldown Reporting SAP AG
Other characteristic
134 April 2001
Other characteristicWith the function Other characteristic, you receive a dialog box containing the reportcharacteristics which you did not define with a characteristic value in the report definition or inpreceding navigation steps.
Choose one of these characteristics and the current list will be replaced by a breakdownaccording to the selected characteristic.

SAP AG CA - Drilldown Reporting
-> Next level
April 2001 135
-> Next levelThis function takes you down one characteristic in the drilldown sequence. The text for this menufunction is always replaced dynamically in the system by the name of the characteristic to whichit would take you.
The drilldown sequence is determined by the report definition. You can change the sequence ofthose characteristics through which you have not yet navigated in the displayed list using thefunction Sort characteristics [Page 161].
To execute this function, position the cursor on any row and then choose this menu option. Thecharacteristic value in that row moves to the navigation block, and all the values of the nextcharacteristic are displayed in the rows.
With the function <- Previous level [Page 136] you can navigate back in exactly the oppositedirection.
If you want to break down the list by a different characteristic, use the function Othercharacteristic [Page 134].

CA - Drilldown Reporting SAP AG
<- Go to previous level
136 April 2001
<- Go to previous levelThis function is the exact reverse of the function -> Next level [Page 135]. It takes you up onecharacteristic in the drilldown sequence. The text for this menu function is always replaceddynamically in the system by the name of the characteristic to which it would take you.
The drilldown sequence is determined by the report definition. You can change this sequencefrom the displayed list using the function Sort characteristics [Page 161].
To execute this function, position the cursor on any row and then choose the correspondingmenu option. The previous characteristic value disappears from the navigation block, and all thevalues of that characteristic are displayed in the rows. The current characteristic moves to thenavigation block.
If you want to break down the list by a different characteristic, use the function Othercharacteristic [Page 134].
The function <- Previous level is the same as the icon in the navigation block.
For detailed information about how to navigate using hotspots, see Hotspots on theReport List [Page 166].

SAP AG CA - Drilldown Reporting
Period screen
April 2001 137
Period screenUsing this function, you can drill down by period in the drilldown list. The row on which the cursoris positioned will then be broken down by period.
In order to do this, you must have selected characteristic “Period” on the Characteristics screenwhen you defined the report. The function is not active if the data is already broken down byperiod on the current level.
If you chose a period on an earlier level, the system summarizes this breakdown and drills downon the row where the cursor is positioned.

CA - Drilldown Reporting SAP AG
Detail List
138 April 2001
Detail ListThis function takes you to the detail list for a selected report object.
The detail list contains all the key figures for the selected object. To select the object for whichyou want to receive a detail list, position the cursor on the corresponding row. The systemdisplays all the columns for that object exactly as they were defined in the form.
You can also execute this function by clicking on the hotspot icon in thenavigation block.
For a detailed description of how to navigate using these and the other hotspots, seeHotspots on the Report List [Page 166].
From the detail list you can switch to the drilldown list, which contains a selection of key figuresfor a number of different report objects. To do so, select the icon and one of the drilldowncharacteristics or a previously determined characteristic value in the navigation block.
See also:
Drilldown List [Page 132]

SAP AG CA - Drilldown Reporting
Initial list (Report List)
April 2001 139
Initial list (Report List)The function Initial list returns you to the list that the system displayed first when you executedthe report. This may be a detail list or a drilldown list, depending on the setting made under Initiallist (Report Definition).
Note that any changes you made to settings in the meantime remain. Consequently, the listwhich you receive may not be completely identical to the first list.
You can also execute this function using the hotspot icon in the navigation block.
For detailed information about how to navigate using hotspots, see Hotspots on theReport List [Page 166].

CA - Drilldown Reporting SAP AG
Scrolling Functions for Report Lists
140 April 2001
Scrolling Functions for Report ListsThe scroll pushbuttons available for displayed report lists let you scroll back and forth betweenthe displayed columns, column groups, and pages.
You can also scroll between values of each characteristic using the function Other CharacteristicValue [Page 147] or using the hotspots in the header of the report list.

SAP AG CA - Drilldown Reporting
First Column
April 2001 141
First ColumnWith this function you scroll sideways to the first column. The number of columns displayedremains unchanged, and the first column of the report is displayed on the left.

CA - Drilldown Reporting SAP AG
Previous Column
142 April 2001
Previous ColumnWith this function you scroll one column or column group to the left.

SAP AG CA - Drilldown Reporting
Next Column
April 2001 143
Next ColumnWith this function you scroll one column or column group to the right.

CA - Drilldown Reporting SAP AG
Last Column
144 April 2001
Last ColumnWith this function you scroll sideways to the last column. The number of columns displayedremains unchanged, and the last column of the report is displayed on the right.

SAP AG CA - Drilldown Reporting
Previous Page
April 2001 145
Previous PageWith this function you scroll back to the previous page.

CA - Drilldown Reporting SAP AG
Next Page
146 April 2001
Next PageWith this function you scroll to the next page of your report.

SAP AG CA - Drilldown Reporting
Other Characteristic Value
April 2001 147
Other Characteristic Value
PrerequisitesThe navigation block shows you which characteristics you have already navigated through in thereport list, and which characteristic values form the report object.
ProcedureTo call up one of the functions listed below, position the cursor on one of the characteristics thatyou have already navigated through, and then choose Navigate → Other characteristic value →(the desired function) or click on the corresponding function (hotspot) in the navigation block.
Function Menu or Hotspot Description
First characteristicvalue
Navigate → Othercharacteristic value → Firstcharacteristic value
This function lets you scroll to the firstcharacteristic value and displays thecorresponding list for that value.
Last characteristicvalue
Navigate → Othercharacteristic value → Lastcharacteristic value
This function lets you scroll to the lastcharacteristic value and displays thecorresponding list for that value.
Next characteristicvalue
Navigate → Othercharacteristic value → Nextcharacteristic value
This function lets you scroll to the nextcharacteristic value and displays thecorresponding list for that value.
Previouscharacteristic value
Navigate → Othercharacteristic value →Previous characteristicvalue
This function lets you scroll to theprevious characteristic value anddisplays the corresponding list for thatvalue.
Choosecharacteristic value
Navigate → Othercharacteristic value →Choose characteristic value
This function lets you choose thecharacteristic value that you want toscroll to from a list of possible values.The system displays a dialog boxcontaining all the values of thatcharacteristic that you can choose from.Then the corresponding list for that valueis displayed.
The menu paths in your application may differ from those shown above. For details,see the documentation for your application.
See also:
Hotspots on the Report List [Page 166]

CA - Drilldown Reporting SAP AG
Other Characteristic Value
148 April 2001

SAP AG CA - Drilldown Reporting
Hierarchy
April 2001 149
Hierarchy
Use
The Hierarchy function ( ) lets you choose which characteristic hierarchy to display in what formin the report list using the characteristic hierarchy.
IntegrationThis function is only available if hierarchies have been defined for the characteristics used in thereport.
FeaturesWhen you choose this function, the system displays a dialog box for each characteristic for whichhierarchies exist. Here you can choose between different display variants of the hierarchy.
• You can also choose which hierarchy should be displayed or return to the “normal”non-hierarchical display using the function Choose Hierarchy [Page 156].
• You can also change how the hierarchy is displayed using the function Hierarchy Display[Page 157].
• Functions are also available to let you expand or collapse parts or all of the hierarchy for acharacteristic. See also:
Expand [Page 150]
Expand to Level [Page 151]
Expand All [Page 152]
Collapse [Page 153]
Set Focus [Page 154]
Undo Focus [Page 155]
See also:
Overview: Characteristic Hierarchies [Page 64]
Hierarchy Display [Page 69]
Functions for Editing Hierarchies [Page 72]

CA - Drilldown Reporting SAP AG
Expand
150 April 2001
ExpandThis function is only available if you have chosen a hierarchy for at least one characteristic. Youcan choose a hierarchy using the function Extras → Choose hierarchy [Page 156] in the reportdefinition or Edit → Hierarchy → Choose from the report list.
The function Expand expands the entire report hierarchy one level. That means that every “+”currently visible becomes a “-”, and all the nodes one level below them become visible.
If the cursor is positioned on one row of the report, the system only expands that row.
For detailed information about hierarchies, see:
Overview: Characteristic Hierarchies [Page 64]
Hierarchy Display [Page 69]
Functions for Editing Hierarchies [Page 72]

SAP AG CA - Drilldown Reporting
Expand to level
April 2001 151
Expand to levelThis function is only available if you have chosen a hierarchy for at least one characteristic. Youcan choose a hierarchy using the function Extras → Choose hierarchy [Page 156] in the reportdefinition or Edit → Hierarchy → Choose from the report list.
The function Expand to level expands the hierarchy down to a certain level and hides all thelevels above it. This function is especially useful when you want to give structure to a hard-to-read report.
If the cursor is positioned on one row of the report, the system only expands that row and theones which lie below it.
For detailed information about hierarchies, see:
Overview: Characteristic Hierarchies [Page 64]
Hierarchy Display [Page 69]
Functions for Editing Hierarchies [Page 72]
CA - Drilldown Reporting SAP AG
Expand all
152 April 2001
Expand allThis function is only available if you have chosen a hierarchy for at least one characteristic. Youcan choose a hierarchy using the function Extras → Choose hierarchy [Page 156] in the reportdefinition or Edit → Hierarchy → Choose from the report list.
The function Expand all expands all the nodes of the report hierarchy.
If the cursor is positioned on one row of the report, the system only expands that row and theones which lie below it.
For detailed information about hierarchies, see:
Overview: Characteristic Hierarchies [Page 64]
Hierarchy Display [Page 69]
Functions for Editing Hierarchies [Page 72]
SAP AG CA - Drilldown Reporting
Collapse
April 2001 153
CollapseThis function is only available if you have chosen a hierarchy for at least one characteristic. Youcan choose a hierarchy using the function Extras → Choose hierarchy [Page 156] in the reportdefinition or Edit → Hierarchy → Choose from the report list.
This function closes the lowest currently expanded level of the hierarchy.
If the cursor is positioned on a report row, this function only affects the branches which belong tothat row. Otherwise all the report rows are affected.
For detailed information about hierarchies, see:
Overview: Characteristic Hierarchies [Page 64]
Hierarchy Display [Page 69]
Functions for Editing Hierarchies [Page 72]

CA - Drilldown Reporting SAP AG
Set focus
154 April 2001
Set focusThis function is only available if you have chosen a hierarchy for at least one characteristic. Youcan choose a hierarchy using the function Extras → Choose hierarchy [Page 156] in the reportdefinition or Edit → Hierarchy → Choose from the report list.
The function Set focus lets you display a particular branch of your report by itself in order toanalyze it more closely. The rest of the report is not displayed.
To reverse this function and display the entire hierarchy again, choose the function Undo focus[Page 155] either from the menu or directly from the report list.
For detailed information about hierarchies, see:
Overview: Characteristic Hierarchies [Page 64]
Hierarchy Display [Page 69]
Functions for Editing Hierarchies [Page 72]
SAP AG CA - Drilldown Reporting
Undo focus
April 2001 155
Undo focusIf you have already executed the function Set focus [Page 154] on a hierarchy, this function letsyou display the entire report again or, if you choose, a larger section of the report.
When available, the function Undo focus appears directly on the report list.
For detailed documentation about hierarchies, see:
Overview: Characteristic Hierarchies [Page 64]
Hierarchy Display [Page 69]
Functions for Editing Hierarchies [Page 72]

CA - Drilldown Reporting SAP AG
Choose Hierarchy
156 April 2001
Choose HierarchyThis function lets you choose a specific hierarchy for display or switch between hierarchicaldisplay and a normal drilldown list. This function is only active if hierarchies exist for acharacteristic.
When you choose this function, the system displays a dialog box listing every characteristic in thereport for which hierarchies exist. For each characteristic listed, you can choose one of thehierarchy variants or the option No hierarchy, or the option Enter when executing. (This lastoption only appears when you are defining the report.)
The system initially displays the hierarchy you chose in completely expanded form. You can thencollapse and expand nodes using the corresponding functions.
You can also change the appearance of the hierarchy (see Hierarchy Display [Page 69]) ordeactivate the hierarchy again to return to the “normal” non-hierarchical display.
To report only on a certain branch of a hierarchy, choose the hierarchy node [Page 34] function.
For detailed information about hierarchies, see:
Overview: Characteristic Hierarchies [Page 64]
Hierarchy display [Page 157]
Functions for Editing Hierarchies [Page 72]
SAP AG CA - Drilldown Reporting
Hierarchy Display
April 2001 157
Hierarchy DisplayHierarchieauswahl [Page 156]
This function is only available if you have chosen a hierarchy for at least one characteristic. Youcan do this using the function Choose hierarchy [Page 156].
This function lets you change the way a characteristic hierarchy is displayed. The following typesof hierarchy display are available:
• compact display
• asterisk display
• line display
• line display with blank lines
For detailed information about hierarchies, see:
Overview: Characteristic Hierarchies [Page 64]
Hierarchy Display [Page 69]
Functions for Editing Hierarchies [Page 72]

CA - Drilldown Reporting SAP AG
Report/Report Interface
158 April 2001
Report/Report Interface
UseThe report/report interface lets you connect information contained in several separate reports bysending the data in one report to be used as selection criteria in other reports. It also makes itpossible to split a complex report into smaller reports and navigate between these.
For detailed information about the report/report interface, see Overview: Report/Report Interface[Page 79].
PrerequisitesBefore you can navigate using the report/report interface, your report must be assigned toanother report or other reports. You can make this Report Assignment [Page 46] as well as splita report when you define it.
FeaturesFunction Menu or Hotspot Description
Calling up a report Goto → Call up report With this function you can call up any reportthat has been assigned to the current report.
To call up another report, position the cursor onthe row of the current report which you want touse as parameters for the new report. If thesystem requires additional parameters for thenew report, it displays a dialog box asking youto enter these. The further you have navigatedthrough your report, the more parameters aretransferred automatically. If all the mandatoryparameters can be transferred automatically,the system does not display the dialog box.
The more parameters you specify, the less datathe system needs to read when calling up thereport. This can lead to improved responsetimes.
History Goto → History When you choose this function, the systemdisplays a dialog box listing all the reports youhave called up thus far since executing theinitial report. This is useful, for example, if youwant to return to the initial report.
The menu paths in your application may differ from those shown above. For details,see the documentation for your application.

SAP AG CA - Drilldown Reporting
Report/Report Interface
April 2001 159

CA - Drilldown Reporting SAP AG
Hide Characteristic
160 April 2001
Hide CharacteristicThe navigation block and the header of the list show the characteristics for which you havespecified a fixed characteristic value. You specified these values either when you defined thereport or by navigating in the displayed drilldown list.
This function makes it possible to deactivate any of the characteristics you specified in adrilldown report. Position the cursor on the characteristic or characteristic value which you wantto hide, and then choose this function. Note that this is only possible with the characteristics inthe navigation block.
Once you have done this, the system totals the values of that characteristic and displays the newresults. New rows may also appear as a result. You can now use the hidden characteristicanywhere at a lower level of the drilldown report. This means that you can display the selectedreport data according to any report hierarchy.
You can also execute this function by clicking on the hotspot icon symbol andthen selecting the desired characteristic from the navigation block.
For a detailed description of how to navigate using these and the other hotspots, seeHotspots on the Report List [Page 166].
SAP AG CA - Drilldown Reporting
Sort Characteristics
April 2001 161
Sort CharacteristicsThis function lets you determine the order in which the drilldown characteristics will appear in thenavigation block of the executed report. This determines the order in which you drill down bydouble-clicking on rows with the mouse. You can define a different order for the online display(menu Navigate → Sort characteristics) and for printing (menu Report → Print setup → Drilldown +detail → Mass print settings).
Note that characteristics for which you specified a characteristic value in the report definition arealways displayed at the beginning of the list and cannot be sorted. Likewise, those characteristicsthrough which you have already drilled down in the report also cannot be sorted. You can changethe latter, however, by returning to the initial list and then choosing Sort characteristics.
Characteristics not needed in the drilldown report should be deleted to improve performance.Likewise, only the most necessary characteristics should be active for printing, otherwiseunnecessary subtotals are printed.

CA - Drilldown Reporting SAP AG
Attributes
162 April 2001
AttributesThere are two fundamental types of attributes:
• Display attributes
Display attributes can be displayed either in a lead column of a report or in a dialog box.To be able to display attributes, you must have specified a single characteristic value forthe characteristic.
• Navigation attributes (such as those used in EC-EIS)
Navigation attributes can be selected from the field catalog like characteristics, and canbe used for navigation in reports. They can also be passed on to the report/reportinterface as selection criteria.
Display Attributes in the Lead ColumnYou can display attributes as well as keys and texts of characteristic values in the lead columnsof a report list. To display attributes in the lead column, select a characteristic value in the leadcolumn and choose Settings → Characteristic display → Lead column. Then you can select one ormore attributes to be displayed.
Display Attributes in a Dialog BoxYou can display all the attributes that exist for a characteristic value in a dialog box. To do so,position the cursor on the characteristic value and choose the symbol. The attributes aredisplayed in a dialog box.
If you have defined a form that contains different characteristic values with attributes in oneelement, you can see the attributes of all those characteristic values in a dialog box bypositioning the cursor on the desired cell of the detail list.
SAP AG CA - Drilldown Reporting
Line Items
April 2001 163
Line ItemsThis function displays the line items for your report.
Note that you should limit the amount of line items to be displayed through navigation and bypositioning the cursor on a row. If the selection parameters are not sufficiently specified to allowadequate runtimes, the system displays a warning and a recommendation.

CA - Drilldown Reporting SAP AG
Display Master Data
164 April 2001
Display Master DataThis function lets you display the master data for the characteristic value on which the cursor ispositioned. To find this function for reports in Profitability Analysis (CO-PA), choose Goto ->Display master data.

SAP AG CA - Drilldown Reporting
Find string
April 2001 165
Find stringThe function Find string... lets you search for a character string in the displayed list. The systemdisplays the lines which contained the string you were looking for in a dialog box. You can thenposition the list on one of the lines by double-clicking on that line in the dialog box.

CA - Drilldown Reporting SAP AG
Hotspots on the Report List
166 April 2001
Hotspots on the Report List
HotspotsA hotspot can appear as a text, a number or a symbol. Hotspots influence the appearance ofthe cursor and the effect of clicking. When you run the cursor over a hotspot, it appears as ahand with the index finger raised. When you click on a hotspot, the system carries out a specificfunction (either highlights the field(s) or switches to a different list).
To understand how hotspots work, you need to know the difference between one-step and two-step navigation functions.
One-step and two-step navigation• You execute a one-step hotspot by clicking once with the mouse. One-step functions include
Back one level, scrolling between characteristic values and Initial list).
• Some navigation functions on the report list are two-step functions. These include callingup a detail list, drilling down to another characteristic, and calling up a drilldown list from adetail list. For these functions, you need to click on both the function itself as well as theelement for which you want to execute the function.
When you click on one of these, the system highlights the other hotspots it would makesense to choose in connection with that hotspot. The hotspot you clicked on is alsohighlighted, albeit less brightly.
If you click on a hotspot which is part of a two-step function, and then click on it again,the second click “deactivates” it.
One-step and two-step navigation is described again under Example: NavigatingUsing Hotspots [Page 168] using practical examples and graphics.
SymbolsHotspots can be texts, numbers or symbols. Texts and numbers that are hotspots are highlightedwhen they are active. The most important symbols used in drilldown reporting are:
Symbol Meaning Number of steps Possible “partner” hotspots
Detail list 2all rows marked with ◊◊◊◊all symbols for “Special row”
♦Drilldown list 2 Current characteristic
All non-specifiedcharacteristics
◊◊◊◊ Select normal row 2 Symbol for “Detail list”
All non-specifiedcharacteristics
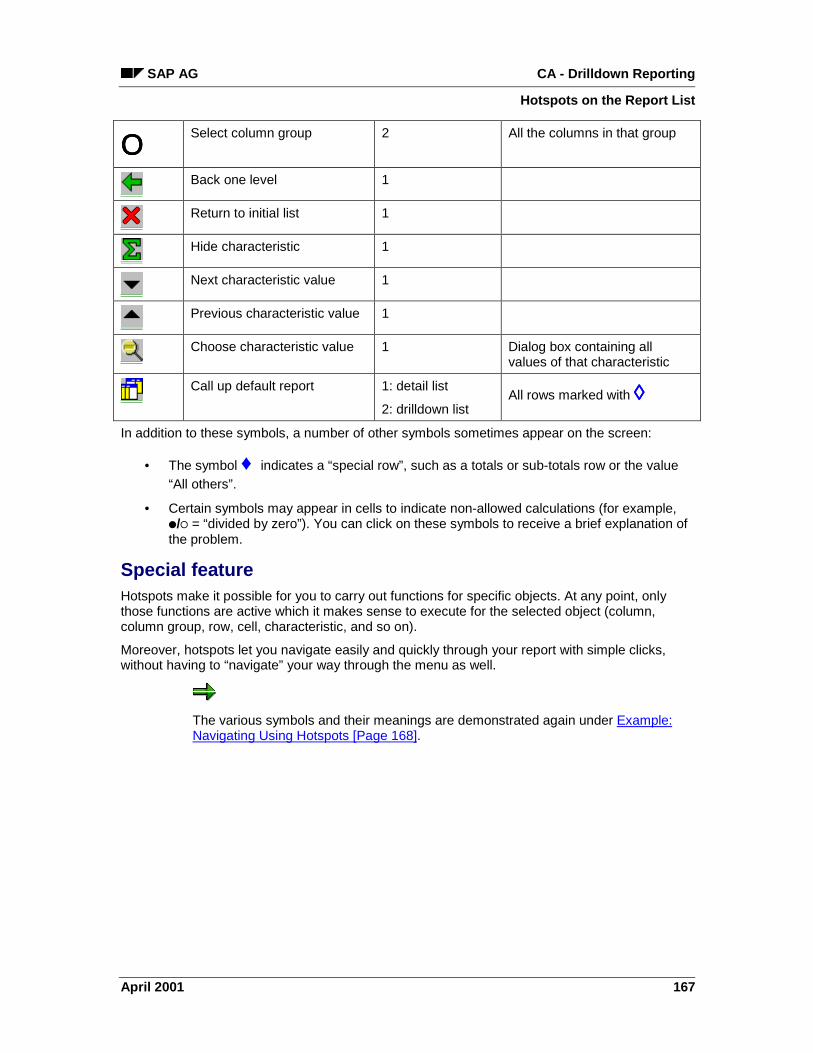
SAP AG CA - Drilldown Reporting
Hotspots on the Report List
April 2001 167
ΟΟΟΟ Select column group 2 All the columns in that group
Back one level 1
Return to initial list 1
Hide characteristic 1
Next characteristic value 1
Previous characteristic value 1
Choose characteristic value 1 Dialog box containing allvalues of that characteristic
Call up default report 1: detail list
2: drilldown listAll rows marked with ◊◊◊◊
In addition to these symbols, a number of other symbols sometimes appear on the screen:
• The symbol ♦ indicates a “special row”, such as a totals or sub-totals row or the value
“All others”.
• Certain symbols may appear in cells to indicate non-allowed calculations (for example,�/� = “divided by zero”). You can click on these symbols to receive a brief explanation ofthe problem.
Special featureHotspots make it possible for you to carry out functions for specific objects. At any point, onlythose functions are active which it makes sense to execute for the selected object (column,column group, row, cell, characteristic, and so on).
Moreover, hotspots let you navigate easily and quickly through your report with simple clicks,without having to “navigate” your way through the menu as well.
The various symbols and their meanings are demonstrated again under Example:Navigating Using Hotspots [Page 168].

CA - Drilldown Reporting SAP AG
Example: Navigating Using Hotspots
168 April 2001
Example: Navigating Using HotspotsThe following contains practical tips and examples that demonstrate how you can navigatethrough a report using hotspots. It also contains a description of all the hotspots that can appearon a report list.
Switching between the detail list and the drilldown list
Symbols:
Drilldown list
Detail list
Row marker ◊◊◊◊Initial list
• Detail list → Drilldown list
If the detail list for your report is defined as the initial list, the system displays this list firstwhen you execute the report. To switch from there to the drilldown list, first click on the
symbol . The system will highlight all thecharacteristics in the navigation area. Then click once on the desired characteristic to goto the drilldown list for that characteristic.
• Drilldown list → → → → Detail list

SAP AG CA - Drilldown Reporting
Example: Navigating Using Hotspots
April 2001 169
To switch from the drilldown list to the detail list, first click on the symbol
. The system will highlight all the ◊◊◊◊symbols. Then click once on the desired line, and the system will display thecorresponding detail list.
• Back to Initial List
To return from any list to the initial list, click on the symbol
. Note that this does not undo anysettings you have made in the report, such as number formats.
Navigation on the drilldown list
Symbol:

CA - Drilldown Reporting SAP AG
Example: Navigating Using Hotspots
170 April 2001
Row marker ◊◊◊◊Next characteristic value
Previous characteristic value
Choose characteristic value
Hide characteristic
• Switching the drilldown characteristic
Business area 0001Navigation
Customer group
Region
Product group
Division Revenue
1 USD
00000001 Glassware
00000014 Coffee products
00000016 Complete menus
149.99
34.75
10.00
Business area 0001Navigation
Customer group
Region
Division
Revenue
1 USD
00000010 Fruit
00000020 Vegetables
149.99
34.75
Product group
You are in the drilldown list that displays the individual divisions in the rows.Additional characteristics are available in the navigation area for drilling down. If you

SAP AG CA - Drilldown Reporting
Example: Navigating Using Hotspots
April 2001 171
would like to replace the characteristic Division with the characteristic Productgroup, select Division and then click on Product group. This causes the twocharacteristics to trade places: The characteristic Division is now found in thenavigation area and is available for drilling down, while the individual Productgroups are displayed in the rows.
• Drilling down on a characteristic value
Business area 0001Navigation
Customer group
Region
Product group
Division Revenue
1 USD
00000001 Glassware
00000014 Coffee products
00000016 Complete menus
149.99
34.75
10.00
Business area 0001Navigation
Region
Product group
Customer group Revenue
1 USD
Result 149.99
00000001 Retail
Division 00000001 Glassware
149.99
You are in the drilldown list that displays the individual divisions in the rows. If youwant to drill down on one of the divisions -- say, Glassware -- simply double-click onthat row. The system will display the division Glassware broken down according tothe values of the next available characteristic -- in the graphic, this is the Customer

CA - Drilldown Reporting SAP AG
Example: Navigating Using Hotspots
172 April 2001
group. The characteristic Division and the value Glassware now appear in theheader on the right.
If you want to drill down on Glassware but want to see a different characteristic than
Customer group, select Glassware by clicking once on the ◊◊◊◊ , and then click on
the desired characteristic in the navigation area. That way you can see the divisionbroken down by product groups.
If you want to drill down further -- say, to see Retail broken down by regions -- youcan do this by double-clicking on the desired row.
Business area 0001Navigation
Region
Product group
Customer group Revenue
1 USD
Result 149.99
00000001 Retail
Division 00000001 Glassware
149.99
Business area 0001Navigation
Product group
Region Revenue
1 USD
00000015 20.75
00000009 South
Division 00000001 Glassware
Customer group 00000001 Retail
14.00
Result 34.75
North
• Scrolling between characteristic values
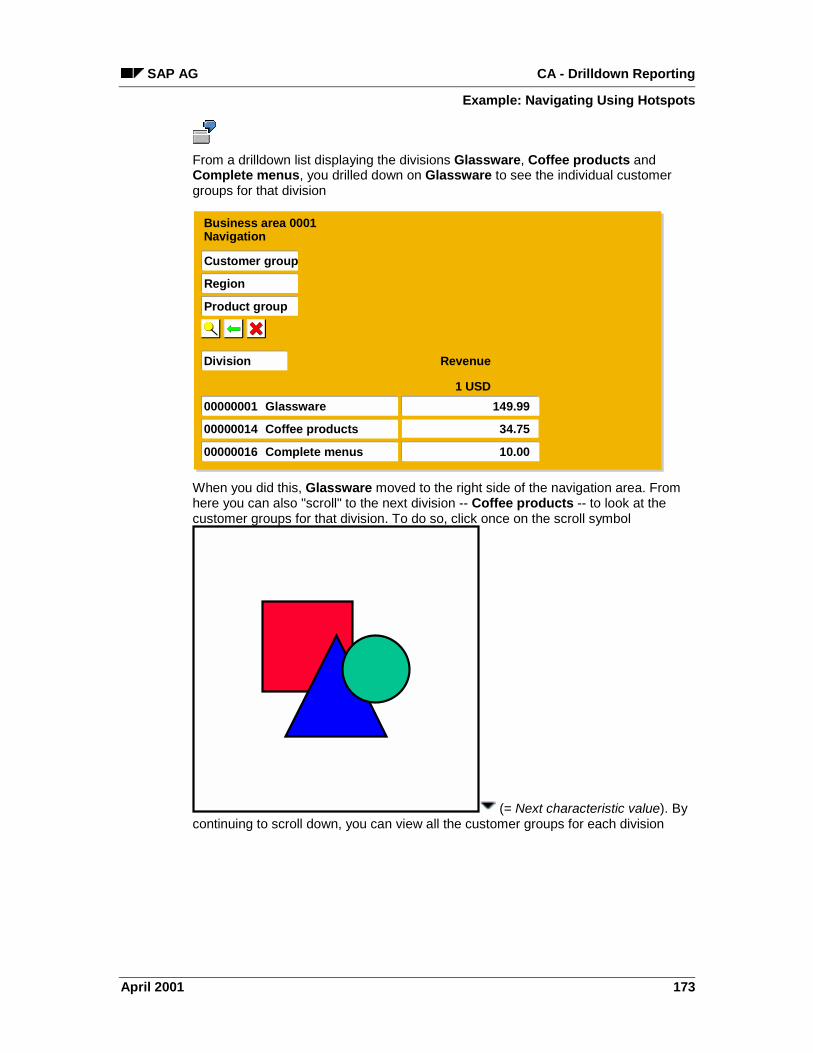
SAP AG CA - Drilldown Reporting
Example: Navigating Using Hotspots
April 2001 173
From a drilldown list displaying the divisions Glassware, Coffee products andComplete menus, you drilled down on Glassware to see the individual customergroups for that division
Business area 0001Navigation
Customer group
Region
Product group
Division Revenue
1 USD
00000001 Glassware
00000014 Coffee products
00000016 Complete menus
149.99
34.75
10.00
When you did this, Glassware moved to the right side of the navigation area. Fromhere you can also "scroll" to the next division -- Coffee products -- to look at thecustomer groups for that division. To do so, click once on the scroll symbol
(= Next characteristic value). Bycontinuing to scroll down, you can view all the customer groups for each division
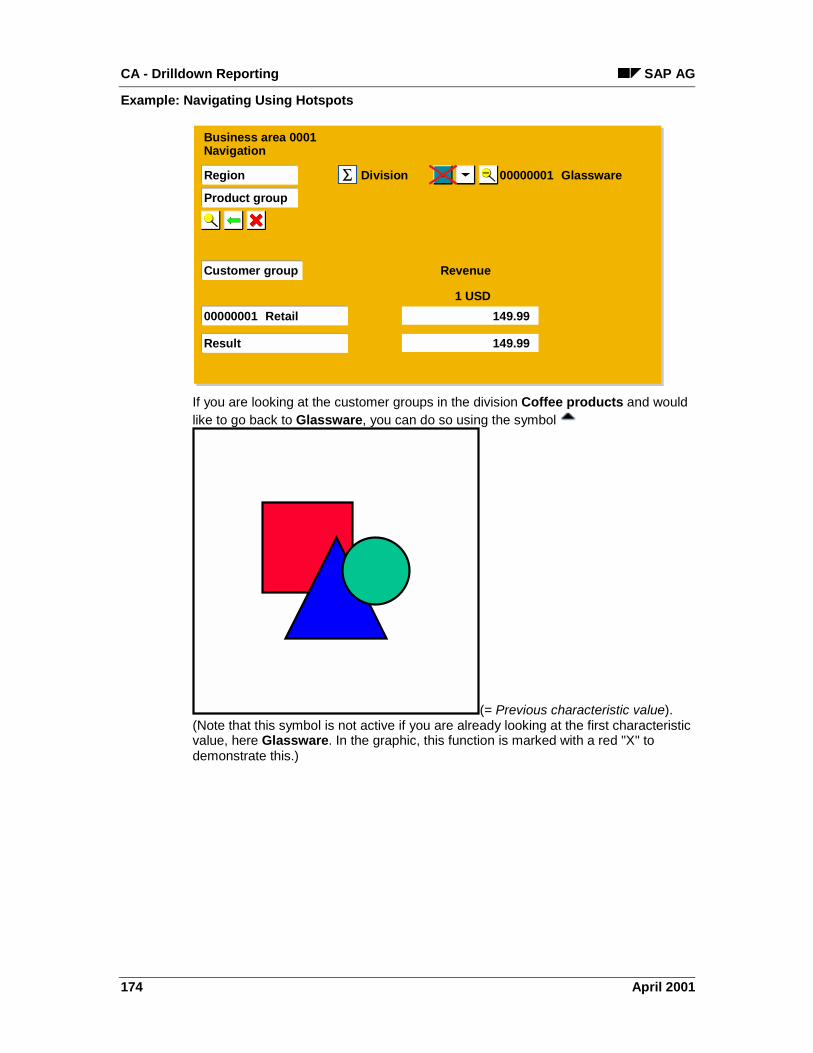
CA - Drilldown Reporting SAP AG
Example: Navigating Using Hotspots
174 April 2001
Business area 0001Navigation
Region
Product group
Customer group Revenue
1 USD
Result 149.99
00000001 Retail
Division 00000001 Glassware
149.99
If you are looking at the customer groups in the division Coffee products and wouldlike to go back to Glassware, you can do so using the symbol
(= Previous characteristic value).(Note that this symbol is not active if you are already looking at the first characteristicvalue, here Glassware. In the graphic, this function is marked with a red "X" todemonstrate this.)

SAP AG CA - Drilldown Reporting
Example: Navigating Using Hotspots
April 2001 175
If you would like to jump directly from Glassware to Complete menus, you can do
so by clicking on the symbol (=Choose characteristic value).
.
Business area 0001Navigation
Region
Product group
Customer group Revenue
1 USD
00000002 999.01
00000001 Retail
Division 00000001 Coffee products
149.99
Result 1149.00
Wholesale

CA - Drilldown Reporting SAP AG
Example: Navigating Using Hotspots
176 April 2001
Any time you are not at the top level of the drilldown sequence, you can return to the
previous level by pressing . Andfinally, you can deactivate any of the characteristics you have already drilled down to(that is, you can summarize the data for all values of that characteristic) by clicking
on the symbol (= Hidecharacteristic) next to that characteristic. Both of these two functions move thecharacteristic back to the navigation area on the left side.

SAP AG CA - Drilldown Reporting
Navigation in Graphical Reports
April 2001 177
Navigation in Graphical Reports
UseWith reports displayed using the output type [Page 37] "graphical report output" you can directlymanipulate objects in the report list using drag & drop and by double-clicking on them.
PrerequisitesThe methods described here can only be used with the graphical report type. You can use thesemethods if the output areas "drilldown area" and "navigation area" are available for the report.
Procedure
Drilldown switch
Drag & Drop
1. Click on a characteristic in the navigation area with the left-hand mouse button and drag it tothe required place in the drilldown area with the mouse button pressed down.
2. Release the mouse button.
The report data is broken down according to the values of the chosen characteristic.
Double-Click
1. Double-click on a characteristic in the navigation area.
The report data is broken down according to the values of the chosen characteristic.
Drilldown
Drag & Drop
1. Click on a characteristic value in the drilldown area with the left-hand mouse button and dragit to a target characteristic in the navigation area with the mouse button pressed down.
2. Release the mouse button.
The system performs a drilldown for the selected characteristic value and breaks downthe report data according to the target characteristic. At the same time, arrow buttons aredisplayed in the navigation area for the characteristic whose value you dragged from thedrilldown area to the navigation area in the previous step. You can use these arrowbuttons to scroll through the values of the characteristic. As you do this, the drilldownarea changes accordingly.
A report is broken down according to the characteristic "country". To find out whichcustomers have their head office in Germany, drag the characteristic value"Germany" in the drilldown area to the characteristic "customer'" in the navigationarea. The report now shows the data broken down according to German customers.You can also use the arrow buttons which are now visible next to the characteristic"country" to break down the data according to customers from other countries.

CA - Drilldown Reporting SAP AG
Navigation in Graphical Reports
178 April 2001
Double-Click
1. Double-click on a characteristic value in the drilldown area.
The system performs a drilldown for the selected characteristic value and breaks downthe report data according to the values of the characteristic which comes next in thesequence of characteristics in the report definition. At the same time, arrow buttons aredisplayed in the navigation area for the characteristic whose value you double-clicked on.You can use these arrow buttons to scroll through the values of the characteristic. As youdo this, the drilldown area changes accordingly.
Reset Drilldown
Drag & Drop
1. Click on a characteristic value in the navigation area with the left-hand mouse button anddrag it to the required place in the drilldown area with the mouse button pressed down.
2. Release the mouse button.
The drilldown is reset for the selected characteristic value, and the report data is brokendown according to the characteristic to which the selected characteristic value belongs.
Double-Click
1. Double-click on a characteristic value in the navigation area.
The drilldown is reset for the selected characteristic value and the current breakdown ofreport data is retained.

SAP AG CA - Drilldown Reporting
Defining Display Conditions
April 2001 179
Defining Display ConditionsYou can analyze the data in a report more easily by defining specific display conditions for thelist. These conditions determine:
• Which functions are available for the user (see Function Levels for Different Users [Page180])
• The highest or lowest values to be displayed in a specific column (see Creating aRanking List [Page 181])
• Which values are displayed individually and which are added together (see CreateCondition [Page 183])
• Which values should be highlighted to attract the viewer’s attention (see CreateException [Page 189])

CA - Drilldown Reporting SAP AG
Function Levels for Different Users
180 April 2001
Function Levels for Different UsersThe drilldown reporting functions are divided into three groups so that you can set up threedifferent categories of users, depending on their tasks and what information they need. Thisenables users to learn how to work with drilldown reporting quickly. You can change the functionlevel after executing a report by choosing Extras → Additional functions.
• Level 1 contains the basic functions of drilldown reporting as well as the interface withSAPmail. These functions allow you to navigate within the displayed characteristic hierarchy.They also allow you to display detail lists in order to analyze your data more closely. Thisfunction level does not contain certain functions, such as those for maintaining the report orits settings, or those form transferring the report to other tools, such as the Excel List Viewer.
This level is for users who want to analyze certain form reports occasionally but do notrequire the full navigation functionality of drilldown reporting.
• Level 2 contains all of the navigation functions and functions for hierarchies, and allows youto download the report to the Excel List Viewer and to a PC file, and to change the displaysettings. It also lets you display exceptions. This function level does not contain certainfunctions for maintaining reports and for defining the print layout.
This level is aimed at users who require the full functionality of drilldown reporting,including the additional download and display functions listed above.
• All functions provides you with all the functions of drilldown reporting: defining parametersfor printouts, freezing report data, defining exceptions and maintaining reports directly fromthe report list.
This level is for users who need to set up reports for printing or maintain reports in moreways than is possible under level 2.
Users can change their own function level from the report list by choosing Extras →→→→ Additionalfunctions. However, the system checks their authorization for this before switching the level (seeCustomizing).
You can assign these levels to individual user master records by entering theparameter IDs RLV1 (Level 1), RLV2 (Level 2) and RLV0 (All functions) using thefunction System →→→→ User profile →→→→ User parameters.

SAP AG CA - Drilldown Reporting
Creating a Ranking List
April 2001 181
Creating a Ranking List
UseThe functions Top n, Top %, Last n and Last % let you create a ranking list based on a singlecolumn of the report list. With these functions you can display those rows of the list that have thelargest or smallest values in a single column. A subtotal is displayed for these rows, and the restof the rows are added together and displayed in a row “Remainder”.
Each time you define a new display condition, this overwrites any previous condition,so that only one condition can be active at a time.
ActivitiesPosition the cursor on the column for which you want to define the ranking list. The function isavailable for all the columns of the list.
For more information about changing or deleting ranking lists, see Editing Conditions [Page 184].
FeaturesFunction Menu path Description
Top n Edit → Ranking list →Top n
This function lets you display, for example, the top tenrows in the selected column.
In the dialog box, enter the number of rows you want tosee. The system displays the selected rows and a subtotalfor those rows, followed by the subtotal for all rows notdisplayed (row Remainder...). The column for which youdefined the condition is highlighted, and the rows aresorted so that the values in that column appear indescending order.
Top % Edit → Ranking list →Top %
This function lets you those rows that add up to a certainpercentage of the total in the selected column, starting withthe highest value in that column and going down.
In the dialog box, enter the desired percentage in the field%. The system displays the selected rows and a subtotalfor those rows, followed by the subtotal for all rows notdisplayed (row Remainder...). The column for which youdefined the condition is highlighted, and the rows aresorted so that the values in that column appear indescending order.
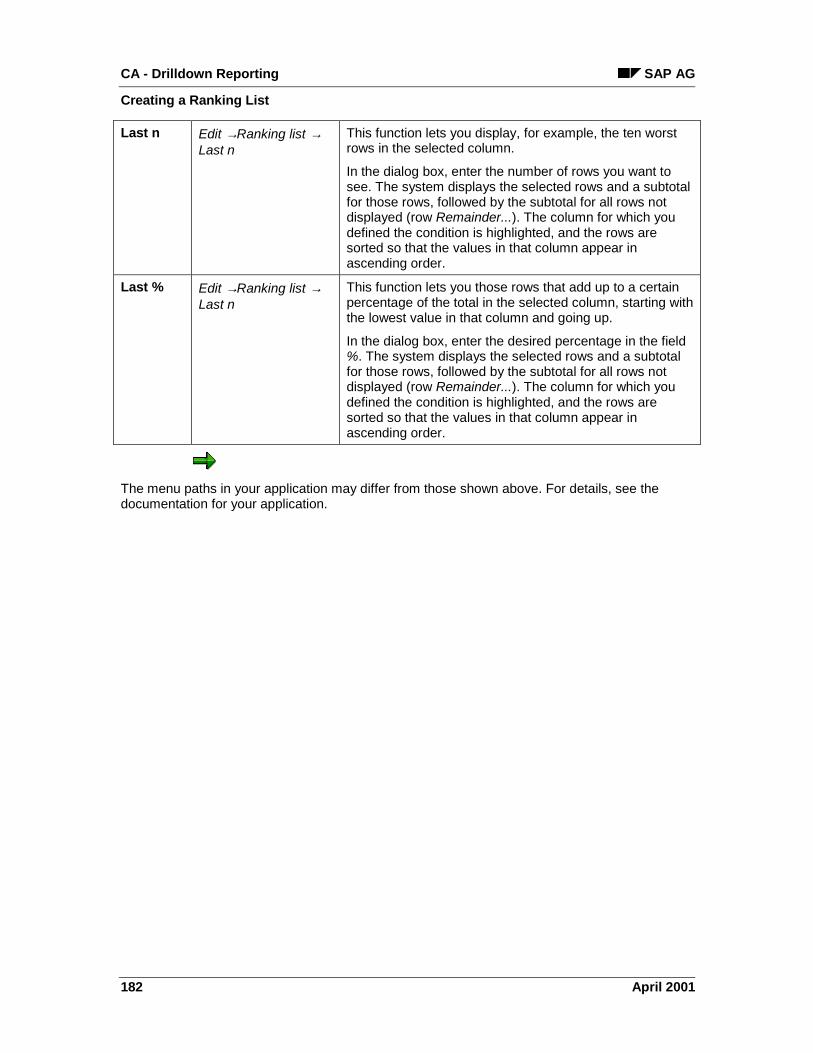
CA - Drilldown Reporting SAP AG
Creating a Ranking List
182 April 2001
Last n Edit → Ranking list →Last n
This function lets you display, for example, the ten worstrows in the selected column.
In the dialog box, enter the number of rows you want tosee. The system displays the selected rows and a subtotalfor those rows, followed by the subtotal for all rows notdisplayed (row Remainder...). The column for which youdefined the condition is highlighted, and the rows aresorted so that the values in that column appear inascending order.
Last % Edit → Ranking list →Last n
This function lets you those rows that add up to a certainpercentage of the total in the selected column, starting withthe lowest value in that column and going up.
In the dialog box, enter the desired percentage in the field%. The system displays the selected rows and a subtotalfor those rows, followed by the subtotal for all rows notdisplayed (row Remainder...). The column for which youdefined the condition is highlighted, and the rows aresorted so that the values in that column appear inascending order.
The menu paths in your application may differ from those shown above. For details, see thedocumentation for your application.

SAP AG CA - Drilldown Reporting
Create Condition
April 2001 183
Create ConditionYou can only define a condition for one column. Once you have defined a condition, the systemonly displays those objects that meet that condition. The other objects are added together anddisplayed in one line. Each new display condition deletes the previous condition, so that amaximum of one condition can be active.
This function is not available for report lists that contain hierarchies.
Procedure1. Position the cursor on the column for which you want to define the condition.
2. You receive a dialog box in which you can enter an operation (such as “>“, “=“ or “<“) anda value.
ResultThe system displays a list containing only those rows which fulfill the condition you defined. Thesystem calculates subtotals for the displayed rows, and aggregates the hidden rows into a rowcalled “Remainder...”. The column for which you defined the condition is highlighted, and therows are sorted by the values in that column in either ascending or descending order.
See also:
Processing Conditions [Page 184]

CA - Drilldown Reporting SAP AG
Processing Conditions
184 April 2001
Processing ConditionsFunction Menu path Description
Createcondition
Edit → Condition → Create Use this function to create a new condition. Fordetailed documentation on this function, seeCreate Condition [Page 183].
Changecondition
Edit → Condition → Change With this function you can change the number,percentage or value of the condition that youdefined using the function Create condition. Youcan also change the display conditions createdusing the ranking list functions (see Creating aRanking List [Page 181]).
Deletecondition
Edit → Condition → Deleteor Settings → Undo → Allsettings
With this function you can delete the conditionthat you defined under Create condition orCreate ranking list. See also: Undo all settings[Page 210]
The menu paths in your application may differ from those shown above. For details,see the documentation for your application.

SAP AG CA - Drilldown Reporting
Overview: Exception Reporting
April 2001 185
Overview: Exception ReportingAn exception is a condition which defines whether or not a value is worth paying particularattention to. You can create exception rules for any key figure in a cell or a column of a report.These exceptions comprise two threshold values which determine the maximum and minimumvalues for an acceptable range of variance. If a value for this object surpasses either one ofthese thresholds, the system displays that value in a different color (red or green).
There are two fundamental types of exceptions. You can define an exception either for a specificcell or for an entire column.
Exceptions for columnsRelative key figures, such as variances, are normally comparable at different drilldown levels of areport. It therefore makes sense to define a single exception for the entire column. This meansthat the exception is effective for every list of the report and independent of which drilldown levelis currently being displayed.
BelgiumFranceGermanyUSAGBItalyJapanSpainMexicoSwedenAustriaAfrica
Country
1,300,0001,600,0002,450,0002,700,0001,200,0001,600,0001,800,0001,350,0001,100,0001,550,0001,250,0001,100,000
Sales 1996 Var.% '95/'96
Var. < 12 %
Var. > 20 %
TomatoesOnionsMelonsCornApples.......
Productr
101223251413171121161214
Country: USA
150,000120,000130,000150,000170,000.......
1210152217.......
Sales 1996 Var.% '95/'96
The graphic above shows sales for different countries for the year 1996 and the variancefor each of these compared to 1994. For the column % var. 95/96, we define a lowerthreshold of -5 and an upper threshold of +10, thus defining the interval between -5 and+10 as "normal". In the report, variances greater than +10% are displayed in green, andthose below -5 % are displayed in red. Variances between -5% and +10% appear in thenormal background color.
When we drill down on the country USA, we see the products sold there, the salesfigures for 1996 and the variances. The exception defined in the second column is alsoevaluated in the second list. That is, the exception is evaluated for both the countries andthe individual products.
Exceptions for cells

CA - Drilldown Reporting SAP AG
Overview: Exception Reporting
186 April 2001
The second type of exception applies only to a single cell and therefore makes sense to use withabsolute key figures, such as sales.
BelgiumFranceGermanyUSAGBItalyJapanSpainMexicoSwedenAustriaAfrica
Country Sales 1996 Var.% '95/'96
Sales in USA < 1.500.000Sales in USA > 2.000.000
TomatoesOnionsMelonsCornApples.......
Product
Country: USA
150,000120,000130,000150,000170,000.......
1210152217.......
Sales 1996 Var.% '95/'96
Exceptionnot displayed
1,300,0001,600,0002,450,0002,700,0001,200,0001,600,0001,800,0001,350,0001,100,0001,550,0001,250,0001,100,000
101223251413171121161214
This graphic shows an exception for the cell USA/Sales 1996 defined with a lowerthreshold of -1,500,000 and an upper threshold of +2,000,000.
When we drilldown on the country "USA", we see that the exception is not applied tothe second list. Since the figures have no relevance for the drilldown characteristic, itwould make no sense to apply the exception here.
Since it can be quite time-consuming to define a large number of cell exceptions, there is also athird option. You can define an exception for all the cells of a column which appear in the samelist. This exception is only evaluated on the list for which it was created. To define this type ofexception, position the cursor on the column header (not on a single cell) and choose the area ofvalidity Cell. Enter * instead of the content of a specific cell.

SAP AG CA - Drilldown Reporting
Using Exceptions
April 2001 187
Using Exceptions
Creating an exceptionYou define an exception from the drilldown list. Once you have defined the exception, it alsoappears in the detail list and can be changed there.
The cursor position determines for which element the exception is to be defined. The area ofvalidity for the exception is determined as in the following example. The example report has beendefined to yield a two-line column header. Consequently, the columns are grouped together intocolumn groups.
Country: USA
Product
Tomatoes
Onions
Melons
1998 1999 1998B
A
Contribution marginCSales
Customer: Smith
1999
If you choose to define an exception for the range Column, the following scenarios are possible:
• If the cursor is positioned on A, the exception applies to "Sales 1998".
• If it is positioned on B, the exception applies to the column group "1998". Thus it applies toboth "Sales 1998" and "Contribution margin 1998".
• If the cursor is positioned on C, the exception applies to "Sales". Consequently, it is valid forboth "Sales 1998" and "Sales 1999".
If you define an exception for a Cell, it applies for a specific characteristic value. In the aboveexample, it is clear from the header of the list which country and customer the exception is validfor, regardless of the cursor position. If the cursor is positioned on A, this means that it alsoapplies to the product "Tomatoes".
Displaying, changing and deleting exceptionsYou can display the exceptions which exist for a report under Extras →→→→ Display exceptions. Youobtain a list of all the exceptions in the report. When you double-click on an exception, thesystem displays the parameters for that exception in a subsequent dialog box. If you havecreated other exceptions for this report, you can then display these using the functions Previousexception and Next exception. You can change and delete individual exceptions in a similarfashion under the menu option Change exception. If you want to delete all the exception in areport, choose Delete exceptions.
Use of exceptions in report listsIt is possible to define more than one exception for a single cell. It may then occur that oneexception is "normal", the next one "green" and the third one "red". In this case the systemfollows the priority rule: red, green, normal. This means that if at least one exception has thecondition "red", the system displays that cell in red. If "red" does not occur and one of the
CA - Drilldown Reporting SAP AG
Using Exceptions
188 April 2001
exceptions has the condition "green", the cells appears in green. The normal color only appearswhen all of the exceptions for that cell have the condition "normal".
See also:
Creating Exceptions [Page 189]
Editing Exceptions [Page 190]
SAP AG CA - Drilldown Reporting
Create Exception
April 2001 189
Create Exception
UseAn exception is a condition which determines when a value is to be regarded as worth takingnote of in either a positive or a negative sense. When the value exceeds a predefined maximumthreshold or falls below a predefined minimum threshold, the system displays it in a differentcolor. You define these threshold values using the function Create exception. You can define asmany exceptions in a report as you want.
Procedure1. Execute a report.
2. Position the cursor on the value column for which you would like to define thresholdvalues. The exception will depend on either the individual column or the column group,depending on whether you positioned the cursor on the column header or on the headerof a group of columns. If you position the cursor on a row, you can define an exceptionfor a certain characteristic value of the characteristic displayed.
3. Choose Extras →→→→ Create exception.
4. In the dialog box, click on the desired range of validity. Choose Column if you want todefine the exception for one column in all the lists of the report. Choose Cell if you wantto define it for one cell or all the cells of one column of one list. Press Continue.
5. In the next dialog box you can enter a description for the exception. The system displaysthe range of validity you chose. If you want the exception to apply for all thecharacteristic values in the column, enter *.
6. In the next dialog box, you can define the thresholds and colors for the exceptions. Youcan define either one or two thresholds. Enter a value for the desired threshold(s) andset the threshold(s) to active. Choose the desired color. If you do not want to define oneof the thresholds, make sure that it is not active. The following different combinations arepossible: two red ranges, two green ranges, one red and one green range, or either onered or one green range.
ResultWhen you return to the report list, the system highlights those values that fulfill the conditionsspecified in the exception rule.
You can only create exceptions from the drilldown list of a report. However, you canchange or display them from the detail list as well.
See also:
Editing Exceptions [Page 190]
Overview: Exception Reporting [Page 185]

CA - Drilldown Reporting SAP AG
Editing Exceptions
190 April 2001
Editing ExceptionsFunction Menu path Description
Create exception Extras → Createexception
Use this function to create a new exception. Fordetailed documentation on this function, see CreateException [Page 189].
Displayexceptions
Extras → Displayexception
This function gives you a list of all the exceptions whichhave been defined for the report. From there you canchoose one exception to obtain detailed informationabout it.
Changeexceptions
Extras → Changeexceptions
This function lets you change or delete exceptions.When you choose this function, the system displays alist of all the exceptions which exist for the report.Choose the exception you want to change from this list.The system then displays a dialog box in which youcan change the threshold values and colors. Youcannot change the area of validity for an exceptiononce you have already created it. If you want to changethe area of validity, you need to delete the exceptionand create a new one.
Deleteexceptions
Extras → Deleteexception orSettings → Undo→ All settings
With this function you delete all the exceptions in thereport. If you only want to delete one exception, use thefunction Change exceptions. See also: Undo allsettings [Page 210]
The menu paths in your application may differ from those shown above. For details,see the documentation for your application.
See also:
Overview: Exception Reporting [Page 185]
Use of Exceptions in Report Lists [Page 187]
SAP AG CA - Drilldown Reporting
Analysis Functions
April 2001 191
Analysis FunctionsUnder the menu path Edit → Analysis from the report list, you can analyze single characteristicvalues and display corresponding graphics.
The following analysis functions are available. For more information and examples, see thedocumentation for the functions.
• Cumulative curve [Ext.]
• ABC-analysis [Ext.]
• Classification [Ext.]

CA - Drilldown Reporting SAP AG
Functions Available on Report Lists
192 April 2001
Functions Available on Report ListsYou can make a number of settings directly from a displayed report list to define how the datashould be displayed and printed. These settings include changing the Currency [Page 194], theCharacteristic Display [Page 195], how Totals Rows [Page 196] are displayed, sorting functions(such as Sort Columns [Page 255]), switching display variants (such as Cumulative DisplayOn/Off [Page 200]), and various print settings (such as the Mass Print Settings [Page 251]).
You can also reverse all the settings you have made interactively (Undo All Settings [Page 210])or return to the settings defined in the form used for the report (Form Settings [Page 211]).
See also:
Defining Display Conditions [Page 179]
Print Settings [Page 244]

SAP AG CA - Drilldown Reporting
Number Format
April 2001 193
Number FormatThe number format refers to the number of decimal places and the factor in which a figure isdisplayed.
The figure one million, displayed with one decimal place and a factor of 1000,reads: 1,000.0.
You can define the number format separately for individual rows, columns and cells of a report.Settings are possible at the following levels:
• You can make rough settings to use in all reports in the report line structure or the fieldcatalog. There, for example, you can specify that sales should always be displayed in1,000,000s.
• You can make settings which apply to all the reports which use a specific form by definingthe number format in the form itself. For example, you can specify that the third column of theform should always be displayed with no decimal places.
• You can make settings which only apply to a specific report in the report definition itself.
When you make settings at different levels, you define the number format separatelyfor the detail list and the drilldown list. When you make these settings, observe therelationship between the column groups and the individual columns of the drilldownlist and the rows, columns and cells of the form. For a form with two axes, thisrelationship is as follows:
Single column (drilldown list) <--> Cell (detail list)
Column group (drilldown list) <--> Row or column (detail list)
In case of conflicting number format settings, the system uses the setting which was last made.

CA - Drilldown Reporting SAP AG
Currency
194 April 2001
CurrencyThis function converts the displayed currency from that stored in the database to any othercurrency for one or all value columns. The currency translation type is used to automatically findthe exchange rate. You define currency translation types in Customizing.
Undo CurrencyThis function allows you to reverse all currency conversions you have carried out for the reportlist. All key figures are displayed again in the database currency. Choose Settings → Undo→ Currency.
For detailed documentation on currency translation, see Currencies [Page 74]
SAP AG CA - Drilldown Reporting
Characteristic Display
April 2001 195
Characteristic DisplayThis function lets you decide how characteristic values should be represented in the report list.You can display the key and the text of the characteristic values in different combinations. Thefunction Settings → Characteristic display displays a dialog box allowing you to choose betweenfour possible display types.
Undo Characteristic DisplayThe function Settings → Undo → Characteristic display lets you reverse this setting.
The system displays the last option saved for this setting for all characteristics. If the last savedsetting called for a text, any characteristics that do not have texts are displayed with the key only.
In some applications, such as SAP-EIS, you can define a default value for thecharacteristic display in the field catalog (field DIMPR). If a default value has beendefined for a characteristic, the system displays this setting.

CA - Drilldown Reporting SAP AG
Totals row
196 April 2001
Totals rowYou can determine the position of the totals row for a single characteristic or for all characteristicsusing this function. You can also hide the totals row completely. To apply the function to a singlecharacteristic, position the cursor on that characteristic before choosing the function. If the cursoris not positioned on a characteristic, the function applies for all characteristics.

SAP AG CA - Drilldown Reporting
Undo totals row
April 2001 197
Undo totals rowThis function reverses the last display option you set for the totals rows of all characteristics inthe drilldown list.
If you hid the totals row for a hierarchical characteristic, this row remains hidden, regardless ofthe last setting.

CA - Drilldown Reporting SAP AG
Totals rows...
198 April 2001
Totals rows...With this function you can insert underscores and blank rows either before or after totals rows.For the underscore, you need to enter the characters you want to use for the underscore. Forblank rows, you need to enter the number of blank rows (up to 9).
In this dialog box, you can also determine the color and brightness of the totals rows. You canchoose from seven different colors and between normal and highlighted.
You can make all these settings separately for each characteristic to be printed.
With the function Order you can determine whether the underscore should appear before or aftera blank row, if you have set both.

SAP AG CA - Drilldown Reporting
Format Display On/Off
April 2001 199
Format Display On/OffThis function lets you display or hide the row containing the number format in the drilldown list.You define this separately for the screen display (Settings → Format disp. on/off) and for theprinted report (Report → Print setup → Drilldown + detail → Format disp. on/off).
It is possible for each cell in the detail list to have its own display format. Consequently, it is notalways possible to display all this information at once. When you choose this function, the systemdisplays the format for each cell. The information disappears again automatically when youperform another function or press ENTER.
The row Displayed in: shows what the numbers on the screen refer to.
If sales revenue is displayed in “USD 1000” and the number 123 appears in thecolumn “Sales revenue”, this means that the revenue is USD 123,000.
The row Displayed in: contains a combination of display factor and unit. The displayfactor is always a number, and the unit can be a currency, quantity, price or othervalue. In this example, the display factor is 1000 and the unit is USD.

CA - Drilldown Reporting SAP AG
Cumulative Display On/Off
200 April 2001
Cumulative Display On/OffThis function lets you activate or deactivate the cumulative display in the drilldown list.
The drilldown list is sorted according to the keys of the rows. When this function is active, thesystem displays each row as the sum of its content plus the content of the rows above it.
Cumulative display not active:
Period Revenue
001 January 992,110.00
002 February 1,776,200.00
003 March 60,100.00
004 April 4.346,236.10
005 May 822,747.37
006 June 15,442,985.93
007 July 18,831,728.88
008 August 82,962.57
009 September 68,100.00
010 October 49,431.00
011 November 71,040.00
012 December 77,100.00
Cumulative display active:
Period Revenue
001 January 992,110.00
002 February 2,768,310.00
003 March 2,828,410.00
004 April 7,174,646.10
005 May 7,997,393.47
006 June 23,440,379.40
007 July 42,272,108.28
008 August 42,355,070.85
009 September 42,423,170.85
010 October 42,472,601.85
011 November 42,543,641.85
012 December 42,620,741.85
SAP AG CA - Drilldown Reporting
Cumulative Display On/Off
April 2001 201
This option is especially useful for displaying the cumulative values for an individual year.

CA - Drilldown Reporting SAP AG
Zero Display On/Off
202 April 2001
Zero Display On/OffIf values equaling zero appear in the displayed list, there are two ways to display it. You caneither display the zeros or suppress them. The default setting is for the zeros to be displayed.With the function Zero disp. on/off you can switch from one display mode to the other.
If you choose not to displays the zeros, all rows containing only zeros in the displayed columnswill disappear in the overview list.

SAP AG CA - Drilldown Reporting
Column(s) On/Off
April 2001 203
Column(s) On/OffThis function lets you to hide or show columns of the report list.
This function is cursor-sensitive. If you have a report with more than one group of columns, theposition of the cursor determines whether this function hides individual columns or columngroups.
Your report shows different regions, each of which is divided according to severalfiscal years. If the cursor is positioned on a region (the header of a column group),the system displays all the column groups in a dialog box, where you can choosewhich ones you want to display. If the cursor on positioned on a single year, youreceive a dialog box where you can select the desired years.
CA - Drilldown Reporting SAP AG
Sort Columns
204 April 2001
Sort ColumnsThis function lets you change the order of the columns in the drilldown list.
This function is cursor-sensitive. If you have a report that contains groups of columns (two-levelcolumn headers), the position of the cursor determines whether this function applies to individualcolumns or column groups.
Your report shows different regions, each of which is divided according to severalfiscal years. If the cursor is positioned on a region (the header of a column group),the system displays all the column groups in a dialog box, where you can define theorder in which you want to display these. If the cursor on positioned on a single year,you receive a dialog box where you can sort the fiscal years.
If you have already hidden individual columns or column groups using the function Column(s)on/off, you cannot sort these hidden columns or column groups.

SAP AG CA - Drilldown Reporting
Percentage/Absolute
April 2001 205
Percentage/AbsoluteIn the drilldown list, you can display any quantity or value column either as absolute values or aspercentages of the total.
If you want a certain column always to appear as percentages, use the operator “%S” in theformula editor where you define the form.
CA - Drilldown Reporting SAP AG
Maintain Footer
206 April 2001
Maintain FooterThis function lets you create a footer for the report. This footer is displayed in the printout whenyou print the report.
Footer On/OffWith this function you can specify whether the footer which you defined for the printout shouldalso appear in the online report.

SAP AG CA - Drilldown Reporting
Maintain Header
April 2001 207
Maintain HeaderThis function lets you create a header for the report. The header is used in the printout.
Header on/offThis function lets you decide whether the header you have created will also appear in the onlinedisplay.

CA - Drilldown Reporting SAP AG
Sort Ascending
208 April 2001
Sort AscendingWith this function you can sort the rows of a report in ascending order according to the valuescontained in the column or column block where you position the cursor.
The system displays a dialog box in which you can decide whether you want to sort the columnor column block alphabetically according to the key or text of the characteristic values, the keyfigure or, where applicable, a hierarchy or hierarchy display. (Sorting by hierarchy display is onlypossible using asterisk display).

SAP AG CA - Drilldown Reporting
Sort Descending
April 2001 209
Sort DescendingWith this function you can sort the rows of a report in descending order according to the valuescontained in the column or column block where you position the cursor.
The system displays a dialog box in which you can decide whether you want to sort the columnor column block alphabetically according to the key or text of the characteristic values, the keyfigure or, where applicable, a hierarchy or hierarchy display. (Sorting by hierarchy display is onlypossible using asterisk display).

CA - Drilldown Reporting SAP AG
Undo All Settings
210 April 2001
Undo All SettingsThis function reverse all the settings you have made on the report list. This includes conditions,ranking lists, exceptions, and all the settings you make under the menu Settings.

SAP AG CA - Drilldown Reporting
Form Settings
April 2001 211
Form SettingsIf you changed the number formats in your report, this function lets you change these settingsback to those made in the definition of the form.

CA - Drilldown Reporting SAP AG
Saving, Printing, Exporting, Sending, Graphics
212 April 2001
Saving, Printing, Exporting, Sending, GraphicsDrilldown reporting offers you a number of functions for processing report lists interactively,including the following:
• Freeze report data [Page 213] and save the report structure
• Print [Page 217] report lists
• Export [Page 262] report lists (to the XXL List Viewer, for example)
• Send report lists [Page 271] using SAPmail
• Display graphics [Page 272] using SAPgraphics
See also:
Working in Reports [Page 123]

SAP AG CA - Drilldown Reporting
Save
April 2001 213
SaveYou have two options for saving a report after executing it.
• Using variants and variant groups, you can freeze the report data in the background so thatyou can display it later without the system having to select the data from the database again.This reduces the runtime for the report.
• After executing a report online, you have two options for saving the report:
You can use the function Freeze Data [Page 214] to save the data selected for thereport. When you choose this function, the system also saves any changes you havemade to the report definition. You should use this function if you want to be able to callup the same set of data at a later point in time.
The function Save Structure [Page 215] lets you save all changes you have made to thereport definition, but not the report data itself. Use this function when you want topreserve the settings (conditions, currency changes, sort orders, and so on) you havemade on the report lists.
See also:
Functions Available on Report Lists [Page 192]
Freezing Report Data in the Background Using Variants [Page 216]
CA - Drilldown Reporting SAP AG
Freeze data
214 April 2001
Freeze dataWhen you execute a report, the system either selects the data from the database or reads it froma buffer (COIX_DATA).
This function lets you “freeze”, or save, the summarized report data in its current state. Thefunction is only active if the system selected the data from the database, and can also only beperformed once per session. When you use this function, the system also saves the currentreport definition -- including any changes you made during navigation (see Save structure [Page215]).
If frozen report data already exists for this report from an earlier session, the system asks youwhether you want to overwrite this data.
SAP AG CA - Drilldown Reporting
Save structure
April 2001 215
Save structureThis function lets you permanently save changes you made when executing the report. That wayyou can create a rough report structure when you define the report, and then make the fineadjustments when you execute it. The systems saves any changes you made using the followingfunctions:
• sequence of the characteristics (Extras → Sort characteristics...)
• sort order of list (Edit → Sort ascending or Sort descending)
• conditions (Edit → Condition → Create condition)
• ranking lists (Edit → Ranking list → Top n, Top %, Last n or Last %)
• sort order of columns (Edit → Sort columns)
• characteristic display (Settings → Characteristic disp.)
• decimal places (Settings → Number format)
• display factor (Settings → Number format)
• currencies (Settings → Currency)
• display of units in drilldown list (Settings → Format disp. on/off)
• zero display (Settings → Zero disp. on/off)
Changes which you make in the report display have no influence on frozen report data (seeFreeze data [Page 214]).

CA - Drilldown Reporting SAP AG
Freezing Report Data in the Background Using Variants
216 April 2001
Freezing Report Data in the Background Using VariantsYou can use variants and variant groups to freeze report data at specified times in thebackground. By freezing report data, you can execute the report online later without the systemneeding to read any data from the database. This reduces runtimes substantially when youexecute reports online.
See also:
Creating Variants and Variant Groups [Page 108]

SAP AG CA - Drilldown Reporting
Printing Reports
April 2001 217
Printing Reports
UseYou can print reports using either:
• the R/3 System or
• Microsoft Word for Windows
When you print directly from the R/3 System, you can define the print layout yourself andprint the entire report. When you print from Word for Windows, you have the option ofmodifying the layout manually in Word.
FeaturesThe following table shows when you would normally want to print with which option:
Mass Printing an Entire Report:
● Large data volume
● Background processing
● Periodic reports
● Simple printouts
Printing Individual Report Lists:
● Printing what is displayed
● Simple printouts
EC-EIS Report Portfolio for Printing Several Reports:
● An entire user group
● An entire report class
● with table of contents
● with division into chapters/sections
● with graphics
● editable
Printing Individual Report Lists:
● Printing what is displayed without
navigation block
● Postediting in Word before printing
Printing from the R/3 System: Printing from Microsoft Word:
The different printout options differ in how the columns are built and what is contained. Whatoptions you have for printing depends on where you are in the report. The following table showsyou what printing options you have and how they differ:

CA - Drilldown Reporting SAP AG
Printing Reports
218 April 2001
Menu path
System List
Function
Columnsdisplayed(drilldown and detail list)
All columns(drilldownlist)
Mass printdrilldown/detail list
Transfer to Word
Result
Currently displayed reportlist is printed without navigation block orspecial characters
Currently displayed reportlist is printed includingany hidden columns,without navigation blockand special characters
Multiple levels of drilldownor detail list are printedaccording to settingsmade in Report -> Print setup
● EC-EIS: Entire reportportfolio report isprinted
● All other applications:Currently displayed list is printed withoutnavigation block orspecial characters
Screen capture: currently displayed reportlist is printed withnavigation block andspecial characters
Features/comments
Only those columnsdisplayed on screen are printed.
All columns definedin the report areprinted. If page is notwide enough, row by rowprinting or printing of several rows used.
You can determine content and layout ofprintout. Printout usuallyis not identical withonline display.
You can edit the reportlist manually in Wordbefore sending it toprinter.
Special charactersmay present problems.
Report Print
Report Print
Report Print
Report Print
The settings that you make with Report → Print setup determine how the report isprinted using Report → Print. They have no influence on printouts created usingSystem → List.
ActivitiesTo print from the R/3 System, choose Report → Print. To print from Microsoft Word for Windows,choose Report → Export. Then choose Transfer to Word.
See also:
Printing from the R/3 System [Page 219]
Printing from Word for Windows [Page 225]
Printing Graphics [Page 227]
Print Settings [Page 244]
Sample Printout [Page 240]
SAP AG CA - Drilldown Reporting
Printing from the R/3 System
April 2001 219
Printing from the R/3 System
UseYou have two different options for printing report lists from the SAP system:
• Printing the list as displayed
If you have reached the required drilldown level and would like to print the list that iscurrently displayed on the screen, choose one of the following functions:
– Report → Print → Columns Displayed
– Report → Print → All Columns
The system prints the specified list as it is displayed on the screen. Only one drilldownlevel is printed.
• Printing according to the print setup
If you want to define the content and layout of the printout before printing your report, youneed to make the desired settings first by choosing Report → Print setup.
The system generates and prints views of the report data at the drilldown levels specifiedand using the formatting setup defined with Print setup. The print layout is not displayedon the screen. A printout does not therefore necessarily reflect the current screendisplay.
There are two functions for mass prints:
– Report → Print → Mass Print Drilldown
– Report → Print → Mass Print Detail List
These functions let you print a large number or all of the drilldown levels in the report.Consequently, they could give you very large printouts, depending on what settings youmade using Print setup. For more information on the print setup, see Print Setup [Page228].
FeaturesYou can access all of the printing functions by choosing Report → Print or the printer icon. Whenyou choose this function, the system displays a dialog box containing the following options:
• Columns displayed
• All columns
• Mass print drilldown List
• Mass print detail list
• Transfer to Microsoft Word
The Mass print detail list function is not available for basic reports and reports thatuse forms with one axis and key figure, since these would lead to unusable printouts

CA - Drilldown Reporting SAP AG
Printing from the R/3 System
220 April 2001
with only one column. However, you can still create single printouts of these reportsusing the function Columns displayed.
Columns displayed
This function lets you print the currently displayed report columns. The printout thereforelooks like the displayed report.
Of the available print functions, this one is most suited for printing detail lists. It is also thesimplest way to print the displayed list.
All columns
With this function you print the report list according to the current drilldown list and all thedefined columns. If all the columns do not fit on the printout, the system prints either row by rowor several rows, depending on which was chosen under Report → Print Setup → Drilldown andDetail Lists → Other Settings.
This allows you to print the entire list displayed, including any columns which are not visible.
This function is only available for printing drilldown lists, since the detail list usually only consistsof one column. If you want to print a detail list as it appears on the screen, choose Displayedcolumns.
Mass print drilldown List
Mass print generally refers to a large printout that you receive when you print multiple drilldownlevels of a report list. The system breaks down all the characteristics you specify for the printout,and prints them in hierarchical fashion.
Due the drilldown required when performing a mass print, this function is onlyavailable if you chose the setting "Read all Data" when making the performancesettings. On the other hand, the mass print function cannot be performed if youchose the setting Read upon each Navigation Step [Page 47].
With this function you can print a drilldown list according to the settings you make using Report →Print setup → Drilldown and detail lists. These settings determine the size, content and layout ofthe printout and are not reflected by the list displayed on the screen.
The mass print functions may give you very large printouts. The size and contentdepends on the settings you make with the function Report → Print setup → Drilldownand detail lists → Mass print settings..., particularly the Sort characteristics, Level ofdetail and Page break settings. These settings are not displayed on the screen. Ifyou want to avoid unnecessary volume in your printout, be sure to check thesesettings.
• The setting Level of detail determines how many levels (characteristics) of the report thesystem should break down in the printout. For example, if you only want to see individualcharacteristic values for the first two levels, you need to set the second characteristic asthe deepest detail level.
• This means that you have to you sort the characteristics into the desired order before youset the level of detail.

SAP AG CA - Drilldown Reporting
Printing from the R/3 System
April 2001 221
• Once you have made these settings, you need to decide on the characteristic values thatyou want to follow with a page break. The system inserts a page break after each linethat represents a total for a value of that characteristic. For example, if your printoutcontains all customers broken down by products, you could insert a page break aftereach customer or after each combination of customer and product (all products forcustomer A, total of products for customer A, PAGE BREAK; then all products forcustomer B, total of products for customer B, PAGE BREAK; and so on). Choosing thelatter would increase the volume of your printout considerably.
It is very important that you check the effects of these settings using the function Report → Printsetup → Drilldown list → Print preview before actually printing the report. This allows you to seehow large the printout will be. See Example: Mass Print Drilldown List [Page 222] for a detailedexample of how this function works and how the print setup affects it. For a description of all thepossible print settings, see Print Setup [Page 228].
The number of rows printed when you choose Mass print drilldown list dependslargely on the number of levels you specified for the report as well as the number ofcharacteristic values contained in each list of the report.
For example, if you drill down through four characteristic (level of detail is the fifthcharacteristic) and each characteristic has 10 values contained in each drilldown list,the system has to print 100,000 rows, which - at 100 rows per page - yields a reportof 1000 pages.
It is therefore recommended that you check the layout before printing, using Report→ Print Setup → Drilldown List → Print Preview.
Mass print detail list
With this function you can print a detail list according to the settings made under Report → PrintSetup. Again, the settings you make determine the volume, content, and layout of the printout. Aswith Mass print drilldown list, the system "drills down" according to the hierarchy you defined inthe print setup to determine what to print.
This function is not available for basic reports and reports which use forms with one axis and keyfigure, since these would lead to nonsense printouts of single columns. However, you can stillcreate single printouts of these reports using the function Columns displayed.
See also:
Print Setup [Page 228]
Setting the Print Parameters [Page 239]
Print Settings [Page 244]
Example: Mass Print Drilldown List [Page 222]

CA - Drilldown Reporting SAP AG
Example: Mass Print Drilldown List
222 April 2001
Example: Mass Print Drilldown ListThe following section contains a detailed example of how the Mass print drilldown list functionworks and how the print setup affects it.
Settings in Print Setup
Sort characteristics
The report contains the 4 drill-down characteristics Customer group, Product group, Regionand Division in that order. Note that the sort order for the printout (Report → Print setup →Drilldown and detail lists → Mass print settings...) can differ from that of the displayed list(Navigate → Sort characteristics). In this example, the sort order for the online list and theprintout is the same.
Setting: Level of Detail and Page Break
The deepest level of detail is set at the third characteristic, Region, and a page break is definedfollowing the first characteristic, Customer group. Note that you can only define a page breakafter characteristics that lie before last broken down characteristic in the sequence.
The following table shows these settings:
Characteristic Position Level of detail Page break
Customer group
Product group
Region
Division 4
3
2
1
X
X
not possible
not possible
Preparation for Printing1. The system starts by preparing the drill-down list broken down by Customer group.
2. Then the system "drills down" on the first row of that list (Customer group 1) to display theindividual Product groups.
3. Then it drills down on the two product groups in this list (2 and 7) to display the individualRegions. The resulting lists are same two lists that would appear if you drilled down in that

SAP AG CA - Drilldown Reporting
Example: Mass Print Drilldown List
April 2001 223
sequence online. The figure below shows these steps. Since the characteristic Region is thefinest level of detail, the system does not go on to break the regions down by division.
PrintoutDrilldown Sequence for Mass Print Drilldown List
Customer group 1Customer group 2 ->
Product group 2Product group 7 ->
Region 1Region 2Region 3
Region 6Region 20
Nextrow
Customer group 1->Customer group 2
Nextrow
Product group 2->Product group 7
Region 1Region 2Region 3
* Product group 2
Region 6Region 20
Drilldown
Drilldown
Drilldown
Transfer to printout
The third drill-down level contains two drilldown lists broken down by region. The lines of theselists appear in order on the printout.
The totals for the individual product groups as well as for the first customer group are alsodisplayed. The row with the total for Customer group 1 is followed by a page break, as wasdefined in the example. The totals are indicated on the printout with asterisks (*) that show thedrilldown level for which the sum was calculated. Thus the sum for each product group isrepresented with one asterisk, the sum for the customer group with two asterisks, and the grandtotal for all customer groups with three asterisks.
The following table demonstrates how the system drills down in the report and sends the rows tothe pages of the printout.

CA - Drilldown Reporting SAP AG
Example: Mass Print Drilldown List
224 April 2001
Customer groupLists at level 1
Customer group 1 ->Customer group 2...
Customer group 1Customer group 2 ->...
Product groupLists at level 2
Product group 2->Product group 7
Product group 2Product group 7->
Product group 2->Product group 10Product group 12
Product group 2Product group 10 ->Product group 12
Product group 2Product group 10Product group 12 ->
RegionLists at level 3
Region 1Region 2Region 3
Region 6Region 20
Region 2Region 4Region 6
Region 14Region 24
Region 2Region 14Region 23
Rows of printout
Region 1Region 2Region 3* Product group 2
Region 6Region 20* Product group 7** Customer group 1Page break
Region 2Region 4Region 6* Product group 2
Region 14Region 24* Product group 10
Region 2Region 14Region 23* Product group 12* Customer group 2Page break
As you can see from this example, the number of rows printed depends on
• The number of levels drilled down for the printout
• The number of characteristic values that are displayed for each list
For example, if you drill down through four characteristic (level of detail is the fifthcharacteristic) and each characteristic has 10 values contained in each drilldown list,the system has to print 100,000 rows, which - at 100 rows per page - yields a reportof 1000 pages.
It is therefore recommended that you check the layout before printing using Report →Print setup → Drilldown list → Print preview.

SAP AG CA - Drilldown Reporting
Printing from Word for Windows
April 2001 225
Printing from Word for WindowsThe function Transfer to MS Word (under Report → Print) lets you print the currently displayedreport list (as with Columns displayed and All columns) by first transferring the report to MicrosoftWord for Windows and then printing it from there.
You can only use this function if you have an English, German, or French version ofMicrosoft Word for Windows version 6.0 or 7.0 installed on your PC. The printingfunctions are only active if you are working in Windows, Windows 3.x, Windows NT,or Windows 95.
To install the SAP standard template SAP_REP.DOT and to set up the interfacebetween the R/3 System and Microsoft Word for Windows, see Customizing.
When you choose the function Transfer to MS Word, the system displays a dialog box in whichyou can enter the following:
1. With the function Direct Word call-up you can download a report list to any directory onyour local PC and then print it from there as a file. Enter the desired directory and a filename that ends with.rtf. The system downloads the current list to Word and opens itthere.
2. With the function Call up Word with additional settings you can also send additionalinformation to Word along with the report list, and then print it all together.
− WORD macro
If you want to print the report list using the default settings, leave the field Wordmacro blank. If you want to use a special macro which you have already defined inWord, enter the name of the macro here.
− Cover page
The standard SAP template SAP_REP.DOT contains a default cover page. You canmodify this cover page in Word to meet your requirements, and print it together withthe report.
− Print only
This function only makes sense to use with the option Not interactive. When youselect this function, Word prints the report without saving it as a file on your PC. Thisprevents the report from being altered.
The system writes the report list to a temporary file before printing. Since all thefiles are deleted again after printing, you need to make sure that the directory thatyou use for printing does not contain any other files with the followingsuffixes:.txt,.rtf,.ini,.doc,.wmf,.tmp and.log.
− Settings for interactive printing
Noninteractive printing
If you do not print interactively, the system immediately sends the current report listto the specified path and opens it in Word for Windows under the specified document
CA - Drilldown Reporting SAP AG
Printing from Word for Windows
226 April 2001
name. You can then change the report as you need and then print it as you normallyprint documents in Word for Windows. You define the default path in Customizing.
Interactive printing
With this option you can choose the path in which to save the report yourself, andcan open it under any name you wish in Word. Then you can modify it as abovebefore printing it out.
Once you have entered the desired path and name, the system starts Wordautomatically.
In Word, choose File → New, and then choose the template SAP_REP.DOT. In thenext dialog box, open the INI file (which was saved in the aforementioned path).
Then the system asks you to write a brief documentation.
After that you can enter the name of the document you want to open (as above, orany other name). Then Word opens the report, and you can modify and print it asabove.
See also:
Transfer to Word [Page 268]

SAP AG CA - Drilldown Reporting
Printing Graphics
April 2001 227
Printing GraphicsYou can also print all types of graphics using Word for Windows. The procedure from there is thesame as when you print a report list from Word for Windows.
First, you need to activate the print mode by choosing the menu option Goto → Graphic → Graphicto WORD on. Then choose the type of graphic you want to print under Goto → Graphic →Graphics...
If you then only want to display a graphic on the screen, deactivate the print modeagain by choosing Goto → Graphic → Graphic to WORD off. Then call up the desiredgraphic as described above.
See also:
Graphic to Word on/off [Page 269]
Printing from Word for Windows [Page 225]

CA - Drilldown Reporting SAP AG
Print Setup
228 April 2001
Print Setup
UseThis section informs you about the various options available for formatting a report list speciallyfor printing. You can change the content of the report (which lists and which characteristics youwant to print) as well as the layout (page breaks, underscores, and so on).
You initially define the print layout when you define the report (under the menu option Extras →Print setup). However, if you later wish to change the print settings, you can do this from thereport list under the menu Report → Print setup.
ActivitiesYou can make the settings for printing in the form definition, the report definition, and thedisplayed report list:
• In the form definition, you can select the rows and columns to be printed in reports thatuse this form by choosing Extras → Drilldown printout. Then you can display the drilldownlist as it will be printed to check your settings.
• In the report definition, you can make the settings by choosing Extras → Print setup oron the Output and Options tab pages.
• If you want to change the print settings later, you can do this from the report list bychoosing Report → Print setup.
These settings are only relevant for mass printing (Report → Print, then Mass print drilldown listor detail list).
Print setup →→→→ Drilldown and detail listsThe functions found here let you set up the layout for both the drilldown and the detail list.
Mass print settings
The function Mass print settings lets you make settings that determine the size, content andlayout of your mass printouts:
• Sort characteristics
• Set level of detail
• Insert page breaks
• Hide totals rows
Note that the functions for sorting characteristics and setting the level of detail and page breaksare dependent on one another. For example, you can set a page break after those characteristicsthat lie above the deepest level of detail. Consequently, you cannot sort all the characteristicsagain once you have set the deepest level of detail, because this could possibly invalidate thesettings you made for page breaks.
Sort characteristics lets you determine in which order the characteristics should be sorted for theprintout.
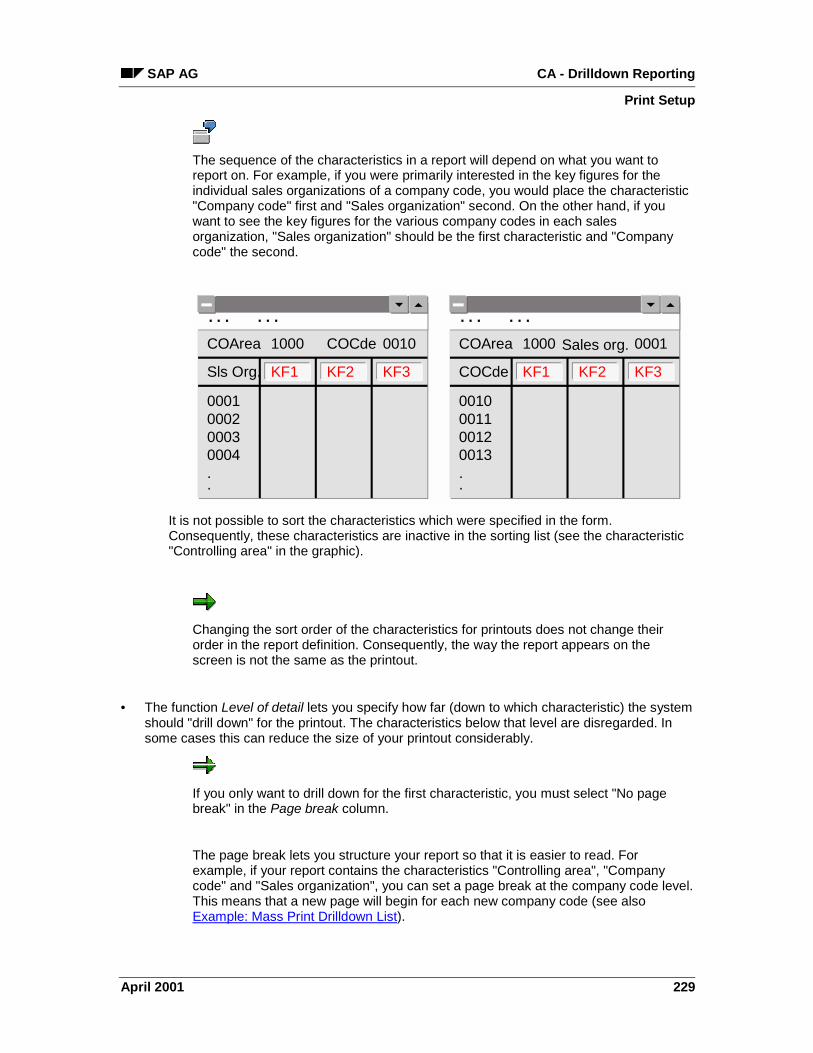
SAP AG CA - Drilldown Reporting
Print Setup
April 2001 229
The sequence of the characteristics in a report will depend on what you want toreport on. For example, if you were primarily interested in the key figures for theindividual sales organizations of a company code, you would place the characteristic"Company code" first and "Sales organization" second. On the other hand, if youwant to see the key figures for the various company codes in each salesorganization, "Sales organization" should be the first characteristic and "Companycode" the second.
. . . . . .
COArea
Sls Org.
1000
KF1
COCde
KF2
0010
KF3
0001000200030004..
. . . . . .
COArea
COCde
1000
KF1
Sales org.
KF2
0001
KF3
0010001100120013..
It is not possible to sort the characteristics which were specified in the form.Consequently, these characteristics are inactive in the sorting list (see the characteristic"Controlling area" in the graphic).
Changing the sort order of the characteristics for printouts does not change theirorder in the report definition. Consequently, the way the report appears on thescreen is not the same as the printout.
• The function Level of detail lets you specify how far (down to which characteristic) the systemshould "drill down" for the printout. The characteristics below that level are disregarded. Insome cases this can reduce the size of your printout considerably.
If you only want to drill down for the first characteristic, you must select "No pagebreak" in the Page break column.
The page break lets you structure your report so that it is easier to read. Forexample, if your report contains the characteristics "Controlling area", "Companycode" and "Sales organization", you can set a page break at the company code level.This means that a new page will begin for each new company code (see alsoExample: Mass Print Drilldown List).
CA - Drilldown Reporting SAP AG
Print Setup
230 April 2001
It is recommended that you set the page break as high up in the sequence ofcharacteristics as possible to keep the volume of the printout as small as possible.
• You can hide certain totals rows of your report, either dependent on or independent ofwhether the totals row contains the same value as that of the next level of the hierarchy. Ifyou choose cond., the system will not print the totals for that characteristic if the same totalsappear for the characteristic above it in the drilldown hierarchy. If you choose uncond., thesystem does not print any of the totals for that characteristic.
Other Settings
You can also make a number of Other settings to determine the layout of your printed report.
• You can decide whether the system should print the Report parameters, the Header, theFooter, and the Title page. You can maintain the header, footer and title page in thesame submenu.
The header appears at the top of every printed page, while the footer appears everywherewhere you explicitly defined the Page break.
These settings apply for both mass prints and report lists as displayed on the screen.
• In the Hierarchy sorting box you can decide whether each totals row should appearabove (Descending) or below (Ascending) the figures that make up that total. Forhierarchical lists, this also determines whether the hierarchies are to be sorted inascending or descending order.
• If a report contains more columns than can fit on one page, you can decide whether thesystem should print row by row or several rows together. By default, the system printsseveral rows.
– Print row by row
If you print a report row by row, the system groups together as many columns as itcan side by side on one page. Consequently, the key figures for one row (here thecharacteristic value "Sales organization 0001") are spread out over several pages.

SAP AG CA - Drilldown Reporting
Print Setup
April 2001 231
. . . . . .
COArea
Sales Org.
1000
KF7
COCde
KF8
0010
KF9
00010002..
454.000.00
.
.
896.0045.00
.
.
2,920.001,100.00
.
.. . . . . .
COArea
Sales Org.
1000
KF4
COCde
KF5
0010
KF6
00010002..
390.00101.00
.
.
0.00761.00
.
.
1,001.001,900.00
.
.. . . . . .
COArea
Sales Org.
1000
KF1
COCde
KF2
0010
KF3
00010002..
250.00456.00
.
.
1,119.00399.00
.
.
110.00500.00
.
.
– Print several rows
If you choose Print several rows, the columns (here the key figures 1 through 9) areprinted below one another in different rows instead of next to one another. Thismakes it possible to print all the columns on one page. This setting is especiallyuseful if you want to compare a large number of key figures for the samecharacteristic value at one glance.

CA - Drilldown Reporting SAP AG
Print Setup
232 April 2001
. . . . . .
COArea
Sales Org.
1000 COCde 0010
0001 250.00390.00454.00
1,119.000.00
896.00
110.001,001.002,929.00
KF1 KF2 KF3
KF4 KF5 KF6
KF7 KF8 KF9
456.00101.00
0.00..
399.00761.0045.00
.
.
500.001,900.001,100.00
.
.
0002
Note that if you choose to print several rows, the column header takes up morespace on the page, thus reducing the amount of space available for the actual data.This becomes even worse if you have also defined a header or footer for the report.
To prevent the header from taking up the entire page, the system automaticallyswitches to row-by-row printing if the column header reaches more than six lines.
• Format disp. on/off lets you decide whether or not to print the number format that youdefined for the report. You define the number format in the same menu using the functionNumber format. The number format includes the number of decimal places displayed aswell as the display factor (10s, 100s, 1000s, and so on). It also determines whether "-"(minus) signs should appear before or after the number, or whether they should appearin parentheses.
• If you select the Expand all hierarchy nodes box, the system prints all nodes of thehierarchy list in expanded form. If you do not select this field, the system prints thehierarchy list in a way so that no information is displayed more than once.
You can define the number format and total rows display for the online list separatelyin the Settings menu.
You can also display and hide the header and footer separately in the Settingsmenu.
Print layout →→→→ Drilldown listThe functions listed here are not suited for printing detail lists due to their predefined layout.Consequently, they are only available for printing drilldown lists.
• Print preview

SAP AG CA - Drilldown Reporting
Print Setup
April 2001 233
This function lets you see the effects of your print settings on the screen without having toprint it out each time. The system first displays the report parameters, so that you can verifythem once again.
• Totals rows
This option lets you insert underscores and blank rows before or after totals rows. Forunderscores, you need to enter the characters that you want to appear for the underscore.You also need to enter the number of blank rows (up to 9).
In the field Order you can specify whether you want the underscore to appear before or aftera blank row.
In the dialog box you can also define the color and intensity in which you want thecharacteristics to appear.
You can make all these settings separately for each characteristic.
Print setup →→→→ Column width (drilldown)These functions let you decide how the column width for the printout should be determined.
• If you choose Optimal, the system determines the appropriate width dynamically. Theoptimal column width depends on the size of your R/3 window and the size of thenumbers to be printed in the individual columns. Thus you can influence the columnwidth by making your R/3 window larger.
• Set means that you can enter a set width for each type of column (quantity or amountcolumns). If you have not set a column width, the system uses a default of 10 characters.
• Set to default sets the width of all the columns to the default width.
See also:
Example: Mass Print Drilldown List [Page 222]
Printing Reports [Page 217]
Setting Print Parameters [Page 239]

CA - Drilldown Reporting SAP AG
Printing Reports with Characteristic Hierarchies
234 April 2001
Printing Reports with Characteristic HierarchiesWhen you print a report that contains hierarchies of one or more characteristics, you need toobserve certain special factors, including
• the level to which the hierarchy has been expanded
• the hierarchy display type
• the sort order of the hierarchy list
Level of Expansion of a HierarchyTo prepare a report for printing, the system normally drills down on each line containing acharacteristic that lies above the deepest level of detail (see also Example: Mass Print DrilldownList [Page 222]). This is not the case when you print a list containing a hierarchy.
When you print a hierarchy, you must first expand the hierarchy down to the level set underNavigate → Hierarchy.
The rows broken down after the following characteristic are:
• all end nodes and
• all nodes at the lowest level of the hierarchy, i.e. those at the level set under Navigate→ Hierarchy
The other nodes are not broken down.
The other nodes are not broken down.
The hierarchy displayed below is expanded down to the lowest level (level 3: customersubgroup). Since the nodes All customers and Customer group A are neither end nodes nornodes at the lowest level, these are not broken down in the printout.
Expansion of a Hierarchical List
Customer 1
Customer 2
Customer group A
Customer 3
Customer subgroup 1+
-
All customers-
Drilldown
Hierarchy DisplayHierarchies are always printed with the display type asterisk display. The higher levels of thehierarchy are represented with asterisks in such a way that the higher a line is in the hierarchy,

SAP AG CA - Drilldown Reporting
Printing Reports with Characteristic Hierarchies
April 2001 235
the more asterisks it has. In the following graphic, the lines at the highest level are shown withtwo asterisks, while the lines directly below them are shown with one. The lines representing thelowest level of the hierarchy do not have asterisks. If any lines of the report have more than threeasterisks, only one asterisk appears in the printout, and the actual number is shown next to theasterisk.
Sorting the Hierarchy ListIn addition, all the hierarchies that are to be printed must be sorted in the same way. If youchoose asterisk display, you can sort in either ascending or descending order. Ascending ordermeans that the higher nodes of the hierarchy appear above the lower nodes. Descending ordermeans that the lower nodes appear first.
Hierarchy with Asterisk Display Sorted in Ascending Order
Cost element Value
- 120,963.00
- 109,563.00
> 700.00
> 1,100.00
> 107,763.00
- 10,300.00
> 3,000.00
> 7,300.00
+ 1,100.00
> 27,520.00
** Total costs
* Material costs
400001 Raw materials
400004 Finished products
400005 Semi-finished products
* Personnel costs
431000 Wages
439000 Salaries
* Imputed depreciation
** Other costs
Hierarchy with Asterisk Display Sorted in Descending Order

CA - Drilldown Reporting SAP AG
Printing Reports with Characteristic Hierarchies
236 April 2001
Cost element Value
400001 Raw materials
400004 Fertigerzeugnisse
400005 Semi-finished products
Material costs
431000 Wages
439000 Salaries
Personnel costs
Imputed depreciation
Total costs
Other costs
700.00
1,100.00
107,763.00
109,563.00
3,000.00
7,300.00
10,300.00
1,100.00
120,963.00
27,520.00
SAP AG CA - Drilldown Reporting
Printing in the Background Using Variants
April 2001 237
Printing in the Background Using Variants
UseYou can print reports in the background to avoid long runtimes for online reports and to printreports on a periodic basis. You do this by defining variants and variant groups for the reports.
Variants and variant groups in Release 4.x replace the variable groups used inearlier releases. For information about converting these from Release 3.x to 4.x, seethe corresponding release note.
In the Profitability Analysis (CO-PA) and Executive Information System (EC-EIS) applications,reports are printed in the background using programs RKEBATCH and RKCBATCH,respectively.
PrerequisitesBefore you can print reports in the background, you must define variants for the reports and thenassign them to variant groups. For detailed information, see Creating Variants and VariantGroups [Page 108].
FeaturesYou print reports in the background by executing a variant group. A variant group can processmultiple combinations of characteristic values for one or more reports at the same time.
Printing in the Background - Immediately and as Scheduled JobWhen you print a report in the background, you can choose to print it immediately, or you canschedule it to print at a specific time.
Choose Information system or Drilldown Reporting → Report data → Schedule Variant Groups.
• To print the report immediately, choose Execute → Start Time, choose Immediately inthe dialog box and save your entries.
• To schedule the report for printing at a later time, proceed as follows:
1. Choose Execute → Start Time and then set the desired start time. If you would like torepeat the print periodically, choose Execute Job Periodically, then save your entries.
2. Choose Steps. Select the desired job in the list and choose Change.
3. Choose ABAP/4. Select a variant from the list of variants.
4. Choose Print specifications. Enter the required printing specifications (see Settingthe Print Parameters [Page 239]). Save your entries. Save your step entries. PressBack.
5. By choosing System → Services → Jobs → Job Overview, you can check the job'sprocessing status.

CA - Drilldown Reporting SAP AG
Printing in the Background Using Variants
238 April 2001
For detailed information about background processing, see the online documentationComputing Center Management System (R/3 Library → Basis → SystemAdministration → Computing Center Management System → BackgroundProcessing).

SAP AG CA - Drilldown Reporting
Setting the Print Parameters
April 2001 239
Setting the Print Parameters
Print ParametersWhenever you print, the system asks you to enter print parameters or confirm the defaultparameters. Here you can specify what printer you want to use, enter a name and title for thespool request and set the output format.
The default printer is that specified in your user parameters (System → User profile → Own data).
The default name and title of the spool request are the report name and text, plus the type ofprintout you requested (such as "Mass Print Drilldown List").
Default Output FormatThe default output format is determined by the number of columns and the specified format.
First, the printing program determines a default for the number of columns. This is eithercurrent width of the report or
• The page width specified in Print setup → Drilldown and detail lists → Maintain header orfooter using the function Edit → Page width, if you have defined a header or footer for thereport. The header or footer has a minimum width of 85 characters.
If a page width of 85 is set in the header or footer, the printing program sets a defaultwidth according to the width of the report without a header or footer.
• The width of the current window or a minimum of 85 characters, if no header or footer isdefined.
The system then chooses the first suitable Format supported by the printer you chose for thenumber of columns. The default for the number of lines is the maximum number of lines availablefor that format.
Note that the number of rows and columns determine the page size for the printout,and not the values shown for the format.

CA - Drilldown Reporting SAP AG
Sample Printout
240 April 2001
Sample PrintoutThe following sample was created using the function Print → Mass print drilldown list.
Report DefinitionThe report definition contains the following:
• Characteristics: Sales Office, Customer Group, and Industry
• Key Figures: Invoiced Quantity and Revenue
Print SettingsThe following settings were made in the Print setup:
• The characteristics were sorted in the following order for the printout:
1. Sales organization
2. Customer group
3. Industry
• The deepest level of detail is the characteristic Industry.
• No page break was defined.
The entire report was printed. That means that the system "drilled down" through all the levels ofthe report for the printout.
The PrintoutThe initial list shows the individual sales organizations, summarized across all the customergroups and industries.
The sales organizations are:
• North US Office, South US Office, East US Office, West US Office, Canada Office andNot assigned.
The customer groups include:
• Industrial customers, Wholesale/retail companies and Not assigned.
The list begins with the first sales organization, Office North US, and the first customer groupIndustrial customers, broken down by the individual industries Chemical industry, High Tech,Manufacturing, and so on. The individual industries are followed by the total for the customergroup Industrial customers, which is indicated with an asterisk.
This is followed by the second customer group Trading companies in the first salesorganization, Office North US, again broken down by the individual industries. After theindividual industries comes the total for the customer group Trading companies in the salesorganization Office North US, which is likewise indicated with an asterisk.
Finally, the values in the sales organization Office North US that are not assigned to a customergroup are displayed under Not assigned.

SAP AG CA - Drilldown Reporting
Sample Printout
April 2001 241
The sum of all of these rows is then displayed in the totals row for the sales organization OfficeNorth US, which is indicated with two asterisks. This completes the information for that salesorganization.
The other sales organizations, Office South US, Office East US, Office West US, OfficeCanada and Not assigned, are then broken down in the same fashion according to customergroups. The customer groups are likewise broken down according to industries.
At the bottom of the printout, the grand total for all sales organizations is displayed in the row“Result” and indicated with three asterisks.
Sales office**
Customer group*
Industry Inv. Qty Revenue
CHEM Chemical Industry12.000
143,320.00
HITE High Tech8,416.000
27,393,240.00
MBAU Manufacturing4,916.000
15,092,464.00
MEDI Media Industry2.000
6,720.00
TRAD Trade1,235.000
4,607,864.00
# Not assigned4,742.000
69,700.00
* 01 Industrialcustomers 14,519.000
47,312,308.00
CHEM Chemical industry4,742.000
14,585,486.00
HITE High Tech6,069.000
19,271,264.00
TRAD Trade7.000
53,830.00
* 02 Trading companies10,818.000
33,910,580.00
# Not assigned0.000
24.66
* Not assigned0.000
24.66
** 0001 Office North US25,409.000
81,222,912.66
CHEM Chemical industry4.000
36,800.00
ENER Energy research6,049.000
19,364,676.00
MBAU Manufacturing1,326.000
4,917,492.00

CA - Drilldown Reporting SAP AG
Sample Printout
242 April 2001
TRAD Trade4,843.000
14,998,692.00
# Not assigned0.000
12,378.00
* 01 Industrialcustomers 12,222.000
39,330,038.00
HITE High Tech6,105.000
18,021,071.50
MBAU Manufacturing2,470.000
8,750,216.00
TRAD Trade3,930.000
12,446,964.00
* 02 Trading companies12,505.000
39,218,251.50
** 0002 Office South US24,727.000
78,548,289.50
MBAU Manufacturing80.000
813,077.06
* 01 Industrialcustomers 80.000
813,077.06
MBAU Manufacturing24.000
204,230.79
TRAD Trade102.000
1,008,938.49
* 02 Trading companies126.000
1,213,169.28
TRAD Trade61.000
308,758.70
# Not assigned8.000
63,230.79
* Not assigned69.000
371,989.49
** 0003 Office East US275.000
2,398,235.83
HITE High Tech25.000
76,937.46
* 01 Industrialcustomers 25.000
76,937.46
TRAD Trade0.000
84,584.62
* Not assigned0.000
84,584.62
** 0004 Office West US25.000
161,522.08
MBAU Manufacturing0.000
0.00

SAP AG CA - Drilldown Reporting
Sample Printout
April 2001 243
* 01 Industrialcustomers 0.000
0.00
** 1010 Office Canada0.000
0.00
ENER Energy research3.000
21,901.10-
# Not assigned0.000
36,378.00-
* 01 Industrialcustomers 3.000
58,279.10-
HITE High Tech0.000
45,000.00-
TRAD Trade0.000
420.00-
* 02 Trading companies0.000
87,200.00-
CHEM Chemical industry11.000
134,339.73
MBAU Manufacturing0.000
0.00
TRAD Trade20.000
553,846.15
# Not assigned144.000
312,770.00
* Not assigned175.000
1,000,955.88
** Not assigned178.000
855,476.78
*** Result50,614.000
163,186,436.85
CA - Drilldown Reporting SAP AG
Print Settings
244 April 2001
Print SettingsThis section describes the settings that you can make when you want to print your report lists.The available functions are:
Print row by row/several rows [Page 245]
Print preview [Page 246]
Maintain footer [Page 248]
Maintain header [Page 249]
Blank rows [Page 250]
Mass print settings [Page 251]
Optimal/set column width [Page 252]
Other settings [Page 253]
Set column width to default [Page 256]
Set column width [Page 257]
SAP title page on/off [Page 258]
Maintain title page [Page 259]
Underscore [Page 260]
Number format [Page 261]
For detailed information about printing reports, see Print [Page 217].

SAP AG CA - Drilldown Reporting
Print row by row
April 2001 245
Print row by rowThis documentation is under construction.
CA - Drilldown Reporting SAP AG
Print Preview
246 April 2001
Print PreviewThis function displays how the overview list will be printed.
For detailed information about printing reports, see Printing, Exporting and Sending Reports[Page 212].
SAP AG CA - Drilldown Reporting
Format Display On/Off
April 2001 247
Format Display On/OffThis function lets you display or hide the row containing the number format in the drilldown list.You define this separately for the screen display (Settings → Format disp. on/off) and for theprinted report (Report → Print setup → Drilldown + detail → Format disp. on/off).
It is possible for each cell in the detail list to have its own display format. Consequently, it is notalways possible to display all this information at once. When you choose this function, the systemdisplays the format for each cell. The information disappears again automatically when youperform another function or press ENTER.
The row Displayed in: shows what the numbers on the screen refer to.
If sales revenue is displayed in “USD 1000” and the number 123 appears in thecolumn “Sales revenue”, this means that the revenue is USD 123,000.
The row Displayed in: contains a combination of display factor and unit. The displayfactor is always a number, and the unit can be a currency, quantity, price or othervalue. In this example, the display factor is 1000 and the unit is USD.

CA - Drilldown Reporting SAP AG
Maintain Footer
248 April 2001
Maintain FooterThis function lets you create a footer for the report. This footer is displayed in the printout whenyou print the report.
Footer On/OffWith this function you can specify whether the footer which you defined for the printout shouldalso appear in the online report.
SAP AG CA - Drilldown Reporting
Maintain Header
April 2001 249
Maintain HeaderThis function lets you create a header for the report. The header is used in the printout.
Header on/offThis function lets you decide whether the header you have created will also appear in the onlinedisplay.

CA - Drilldown Reporting SAP AG
Page break
250 April 2001
Page breakThis function lets you define where a page break should occur in the printout.
The setting you make here is decisive for the size of the printout when you printusing the options Report as detail list and Mass print.
Unless you specify otherwise, this occurs at the second to last characteristic, that is,whenever the value of the second to last characteristic changes.
The further down in the hierarchy you set the page break, the more pages yourprintout will have.
For detailed information about printing reports, see Printing, Exporting and Sending Reports[Page 212].

SAP AG CA - Drilldown Reporting
Mass print settings
April 2001 251
Mass print settingsThese settings are important for determining the size and content of the printouts you createusing the functions Mass print drilldown list and Mass print detail list.
• With Sort characteristics you can determine the order in which the characteristics should bebroken down in the drilldown sequence.
• With Deepest detail level you determine how far down you want the system to break downthe report in the printout.
• Page break determines which characteristic should be followed by a page break.
• Hide total lets you hide the totals rows by characteristic. If you select the field cond., thesystem only hides the total if the next total up in the drilldown hierarchy contains the samevalue.
If you select the field uncond., the system hides all the totals rows for that characteristics.
It is very important to check these settings before printing, by choosing Report →Print layout → Drilldown list → Print view. This allows you to control the print quantity.For information on how to use the Mass print drilldown list function and thesignificance of some of the parameters in the print layout, see Example: Mass PrintDrilldown List [Page 222].

CA - Drilldown Reporting SAP AG
Optimal / set
252 April 2001
Optimal / setThis function lets you decide how the system should determine the width of columns for printing.
• If you choose Optimal, the system automatically finds the most suitable width.
• Set lets you display the fixed length entered manually under Set column width [Page257]. If you have not entered one manually, the system uses a default width of tencharacters.

SAP AG CA - Drilldown Reporting
Other settings...
April 2001 253
Other settings...The function Other settings... lets you make additional settings for mass printouts.
• In the Print extras box you can decide whether you want to print the report parameters,head, footer and title page with your report. You can also maintain the header, footer andtitle page in the submenu Report → Print setup → Drilldown + Detail.
• In the Totals rows box you can determine whether each totals row should appear aboveor below the rows that make up that total. For hierarchy lists, this setting also determineswhether the hierarchy should be printed in ascending (“Totals row below”) or descending(“Totals row above”) order.
• The Line break box determines how the system prints columns if not all the columns canfit next to each other on the page.
Several rows means that the system prints all the columns for each row, broken down tothe next line where necessary. This makes it easy to fit all the columns on the samepage. This setting is especially useful if you want to analyze all the key figures forindividual characteristic values.
It is generally recommended that you use this setting where possible, since it is in mostcases easier to read.
Row by row means that all the columns are printed side by side, stretching over severalpages where necessary.
• If you select the Display format field, the system print the number format you defined foreach column in the header of that column.
• If you select the field, the system prints all the levels of the hierarchy in expanded form.Otherwise it prints the hierarchy in a way that no information is printed more than once.
CA - Drilldown Reporting SAP AG
Column(s) On/Off
254 April 2001
Column(s) On/OffThis function lets you to hide or show columns of the report list.
This function is cursor-sensitive. If you have a report with more than one group of columns, theposition of the cursor determines whether this function hides individual columns or columngroups.
Your report shows different regions, each of which is divided according to severalfiscal years. If the cursor is positioned on a region (the header of a column group),the system displays all the column groups in a dialog box, where you can choosewhich ones you want to display. If the cursor on positioned on a single year, youreceive a dialog box where you can select the desired years.
SAP AG CA - Drilldown Reporting
Sort Columns
April 2001 255
Sort ColumnsThis function lets you change the order of the columns in the drilldown list.
This function is cursor-sensitive. If you have a report that contains groups of columns (two-levelcolumn headers), the position of the cursor determines whether this function applies to individualcolumns or column groups.
Your report shows different regions, each of which is divided according to severalfiscal years. If the cursor is positioned on a region (the header of a column group),the system displays all the column groups in a dialog box, where you can define theorder in which you want to display these. If the cursor on positioned on a single year,you receive a dialog box where you can sort the fiscal years.
If you have already hidden individual columns or column groups using the function Column(s)on/off, you cannot sort these hidden columns or column groups.
CA - Drilldown Reporting SAP AG
Set to default
256 April 2001
Set to defaultThe function Set to default sets the column width for printing to the default width of tencharacters. This function overrides any other column width settings you have made.
See also:
Optimal / set [Page 252]

SAP AG CA - Drilldown Reporting
Set column width
April 2001 257
Set column widthThis function lets you define the width of each column for when you print the drilldown list.
The function Optimal / set determines whether the system prints the columns in this width or inthe optimal width.
See also:
Optimal / set [Page 252]
CA - Drilldown Reporting SAP AG
SAP Title Page On/Off
258 April 2001
SAP Title Page On/OffWith this function you can specify whether you want to print the standard SAP title page whenyou print the entire report. The SAP title page contains all the parameters of the report.
If an individually defined title page already exists for a report, the system always prints that titlepage, regardless of whether or not you choose this function. To create a title page, see Maintaintitle page [Page 259].

SAP AG CA - Drilldown Reporting
Maintain Title Page
April 2001 259
Maintain Title PageThis function lets you create a title page for the report. This title page is the first page when youprint out the report.
In the report page of the executed report, you can determine whether or not the titlepage is to be printed. Choose Report → Print layout → Drilldown and detail list → Othersettings. A dialog box is displayed, where you can make the required setting.
CA - Drilldown Reporting SAP AG
Underscore
260 April 2001
UnderscoreThis documentation is under construction.

SAP AG CA - Drilldown Reporting
Number format
April 2001 261
Number formatThe number format consists of a display factor (10s, 100s, 1000s, and so on) and the number ofdecimal places displayed.
You can define the number format separately for the detail and drilldown lists.
You can also define separate number formats for printing (Report → Print setup → Drilldown +detail → Number format) and for the list displayed on the screen (Settings → Number format).
The system handles conflicting number format settings so that the setting last made alwaysapplies.
CA - Drilldown Reporting SAP AG
Exporting Reports
262 April 2001
Exporting ReportsYou can export report lists. Depending on the application and the settings in the report list, thesystem displays a dialog box from which you can choose the export function. If only one option ispossible for the list currently displayed, the system automatically carries out that function withoutdisplaying the dialog box.
The following section is an explanation of which functions are available in which situations.
• Transfer report to XXL [Page 264]
This function is not active for detail lists and for lists with percentage shares.
• Transfer Page to XXL [Page 266]
This function is not active for detail lists and for lists that contain characteristichierarchies.
• Save in PC file [Page 267]
This function is active for both drilldown lists and detail lists.
• Transfer to MS Word [Page 268]
This function is available when the following conditions are met:
– You are working under one of the following operating systems: OS/2-PresentationManager, DOS-Windows, 32-Bit Frontend under Windows-NT, Windows 32bit orWindows 95.
– You have Microsoft Word on your presentation server.
– You use Microsoft Word version 6, 7 or 8.
• Copy to Report Portfolio [Page 270]
This function is only available in SAP-EIS.
This function is not active when you are displaying a hierarchy list where the differentbranches are expanded to different levels. In this case, you should either change thedisplay so that all branches are expanded equally, or display a different hierarchy or nohierarchy (Navigate → Hierarchy → Expand to level...).
• HTML Export
This function is under Report → HTML Export and is only available with output type [Page37] "graphical report". When you carry out HTML export, an HTML file is created for eachoutput area of a graphical report. These files are stored together in a directory of yourchoice on your local hard drive. With these files, you can display the report output on anycomputer which has a Web browser. This means that it is not necessary to be connectedto the SAP system.
Exporting options
You have three formatting options for exporting your report list: as a text file, spreadsheet file orreport portfolio report in SAP-EIS.
• Export as text file
SAP AG CA - Drilldown Reporting
Exporting Reports
April 2001 263
Choose Save as file to save the list in rich text format or ASCII format. Choose Transferto Word to call up Word for Windows directly or to print from Word.
• Export as spreadsheet data
Choose Save as file to download all the columns of the report list or all the currentlydisplayed columns as a spreadsheet file. If you choose Transfer report to XXL orTransfer page to XXL from the drilldown list, the system opens the Excel List Viewer anddisplays the report in that format. XXL format has the following advantages:
– The system downloads the characteristics as well, so that you can navigate on thespreadsheet.
– You can download all the data in the report. All other export functions work only forthe data displayed on the screen.
• Transfer to the SAP-EIS report portfolio
Choose Freeze data if you want to save the report as it is on the screen, including data.Choose Save definition if you only want to save the report definition as it is currentlydisplayed, but do not want to see the same data again.
For all the export functions, the system exports the report list as it appears on thescreen according to the settings you have made. You should therefore check the listand make the desired settings before exporting the list. This is especially importantwith regard to +/- signs, decimal places, and the characteristic values.

CA - Drilldown Reporting SAP AG
Transferring Reports to XXL
264 April 2001
Transferring Reports to XXLThis function lets you export the entire report in XXL format (a special format for transferring datato a spreadsheet). This means that all characteristics of the report are available in the Excel ListViewer. This function makes it possible to execute a drilldown report in the Excel List Viewer.This factor distinguishes this function from the one which you can call up with transfer page toXXL [Page 266].
Note that if you wish to transfer a drilldown list, it may contain no more than 16 384lines / 256 columns. The exact formula for the data transferred by the application is:
26 + number of data columns + 5 * ( 1 + number of characteristics) < 256
As this function transfers all columns in the report list, all columns also go into theformula (not just the columns currently displayed).
Note that for each column transferred, an additional column is transferred for the unitof measure.
PrerequisitesYou can only transfer a report to XXL under the following conditions:
• You are displaying a drilldown list in a report. This function is not possible for detail lists dueto technical reasons.
• You have set the report display to “Absolute” using the function Settings →Percentage/absolute. Transfer to XXL is deactivated as soon as you switch the display to“Percentage”.
• You chose the setting 'Read all data' in the performance settings for the report. Reports, forwhich data is dynamically reloaded at each navigation step, cannot be transferred to XXL.
Procedure1. In a dialog box, choose the characteristics you want to transfer. It is recommended that
you choose the option “All characteristics”. If the report list is so large that yourspreadsheet program cannot process it, you should only choose some of thecharacteristics.
When you transfer a report to Microsoft Excel, the data you transfer can consist of upto 16,384 rows or 256 columns. The formula for calculating the amount of datatransferred from the application is:
26 + number of data columns + 5 * (1 + number of characteristics) < 256
Since this function transfers all the columns of the report list, you can use all thecolumns in formulas, not just those on the displayed list.
Note that an additional column for the unit is transferred along with each normalcolumn transferred.

SAP AG CA - Drilldown Reporting
Transferring Reports to XXL
April 2001 265
If you have chosen a characteristic with a hierarchy display, you should note that it isnot possible to display hierarchy lists in XXL in the same form as in R/3. The data istherefore transferred as if there were no hierarchical structure for this data.
2. If you use an operating system which does not let you operate a spreadsheet program, youcan still transfer the report to XXL; however, you can only store the XXL object in SAPofficeor in a PC file.

CA - Drilldown Reporting SAP AG
Transfer Page to XXL
266 April 2001
Transfer Page to XXLThis function lets you transfer the page currently being displayed to the Excel List Viewer (XXL).
The “page'“ is the entire list you can reach using the scrolling functions. If you want to be able tocarry out a drill-drown in the Excel List Viewer, use the function Transfer report to XXL [Page264].
When you transfer a report or a page to Microsoft Excel, the data you transfer canconsist of up to 16,384 rows or 256 columns. The formula for calculating the amountof data transferred from the application is:
26 + number of data columns + 5 * (1 + number of characteristics) < 256
Since this function transfers all the columns of the report list, you can use all thecolumns in formulas, not just those on the displayed list.
Note that an additional column for the unit is transferred along with each normalcolumn transferred.
PrerequisitesYou can transfer a report to XXL when:
• You are displaying a drilldown list. This function is not possible for detail lists due totechnical reasons.
• You have set the report display to “Absolute” using the function Settings →Percentage/absolute. You cannot transfer the list to XXL if you have switched the displayto “Percentage”.
ProcedureChoose a processing type. If you use an operating system in which a spreadsheet programcannot be run, you can still transfer lists to XXL; however, you can only store the XXL object inOffice or in a file.

SAP AG CA - Drilldown Reporting
Save as File
April 2001 267
Save as FileThis function lets you export the displayed report page to your local PC, presentation server orapplication server.
You can choose from the following formats:
• Table (file with the extension.dat)
You can download either the columns currently displayed or all columns.
• Text (file with the extension.txt)
You can download either the columns currently displayed or all columns.
• Rich text format (rile with the extension.rtf)
Rich text format is only available if your are downloading to a presentation server. Youcan only export the columns displayed.
You should not choose All columns unless you are sure that your server can handlea large number of columns.
Procedure1. Choose a format.
2. Choose which elements of the report you would like to download (such as the listheader). Different elements are possible, depending on which format you chose.
3. Enter a path and file name for the file.
You can define a default path name for the files you download. Choose System →User defaults → User parameters and enter the desired path under the parameterDLF.
4. Specify whether undefined values in the report list should be displayed as zeros or astext (such as “Division by zero”).
5. If you save the file on your presentation server, you can also decide whether or not youwant to process the exported data immediately in a PC application.

CA - Drilldown Reporting SAP AG
Transfer to MS Word
268 April 2001
Transfer to MS WordThis function lets you transfer the current report page to Microsoft Word for Windows and prints itfrom there. The system displays a dialog box in which you can choose to call up Word directly orto call it with additional settings.
Procedure1. Choose Direct Word call-up to transfer the report list to a file and call it up in Word from there
for editing and/or printing.
2. Choose Call up Word with additional settings to transfer the report list to Word, edit it thereand then print it when desired. However, this function also sends additional information toWord, such as a special Word macro or a title page.
3. Choose how you want to print the exported file. You can transfer the list to Word with thestandard settings (Non-interactive printing) or enter a name and path in which you want tosave the file (Interactive printing). If you want the system to print the list directly from Wordwithout saving it in a file first, select the Print only field.
If you select Print only, the system transfers the report list to a temporary file on yourPC. After printing, the system deletes all the files in that directory. You shouldtherefore make sure that you have no other files with the following suffixes in yourtemporary directory:.txt,.rtf,.ini,.doc,.wmf,.tmp or .log.

SAP AG CA - Drilldown Reporting
Graphic to Word On/Off
April 2001 269
Graphic to Word On/OffThis function makes it possible to transfer graphics from drilldown reporting to Microsoft Word forWindows for the purpose of printing. Once you have selected this function, a dialog box appearsthe next time you call up a graphic. There you can make a number of settings. For moreinformation, see Printing Reports [Page 217].
The system then displays the graphic and simultaneously downloads it to your PC. The graphicwindow closes again automatically when the system is finished downloading.
CA - Drilldown Reporting SAP AG
Copy to Report Portfolio
270 April 2001
Copy to Report Portfolio
PrerequisitesWith this function you can copy a report into the report portfolio. If this function is not availablewhen you try to find it, that means that you are currently displaying a list that cannot be used asthe initial list for a report portfolio report. This only occurs with hierarchical lists in which differentbranches are expanded to different levels. To be able to copy the report to the report portfolioswitch to either the detail list or to a nonhierarchical display, or expand all the branches to thesame level.
Procedure1. Enter a name, a user group and a report class.
2. Specify whether you wnat to transfer a single screen or a series of screens. If you wantto record a series of screens, the subsequent screens are stored until you choose Copyto report portfolio again. You then receive another dialog box, in which you can decidewhether you want to store the screen sequence or not. You can scroll back and forthbetween the screens using the scroll buttons.
Note that the report is first assigned to one user group only. With the functionChange report in the report portfolio, you can make the same report available toother user groups. This means that you do not have to copy the same screensequence over and over again.
3. Specify whether you want to save the report structure only or if you also want to freezethe data. If you freeze the report data, a document is created which contains the datacurrently displayed on the screen. However, if you save the structure (that is, the reportdefinition), only the functions in the report are saved. This means that the data can beselected again each time you call up the report.
The system tries to compensate for any changes made to the form, the key figures orthe variables. However, any such changes (deletion of a row or column in the form,for example) may make it impossible for the system to execute the report again.
SAP AG CA - Drilldown Reporting
Send
April 2001 271
SendThis function lets you send the currently displayed page of your report to one or more receiversvia SAPmail. Receivers of the report can be users of the same or another R/3 or R/2 system orusers of external systems. You can also send the report via the Internet or as a fax.
The system places the current report page and the report parameters in an attachment.
You can also write a note to the receiver and send it with the report.
Once you have sent the document, the receiver can access it using the menu Office and thefunction Inbox. The receiver can also go to that transaction in which you created the report usingthe function Edit → Process to obtain more information.

CA - Drilldown Reporting SAP AG
Graphics
272 April 2001
GraphicsBy clicking on the graphic symbol or by choosing the menu path Goto → Graphic, you candisplay a graphical representation of your report data in a separate window. You can choosefrom a number of different types of graphics, depending on where the cursor is located. Thegraphic can refer to the values in a single row or column, a group of columns, or the entire reportlist. The system displays the available types of reports in a dialog box, from which you choosethe type you would like to see.
The following types of graphics are available:
• Graphics for rows
• 2D graphic row
• Graph - row
• Graphics for columns
• 2D graphic column
• Graph - column
• Graphics for column groups
• 3D graphic column group
• Graphics for the entire report
• 3D graphic
• Graph - all col./row
• Portfolio graphic
Note the following exceptions to the above graphic types:
• Since it does not make sense to display a graphic for a single row or column, the graphictypes for rows and columns are not offered if only one row or column is selected.
• Portfolio graphics cannot be displayed from the detail list.
• Only graphics for rows are available for hierarchical lists.
If you set exactly one level of the hierarchy using the function Hierarchy → Set level,the system may make all types of graphics available depending on the cursorposition.
Presentation graphicBoth two-dimensional and three-dimensional graphics are available as presentation graphics.
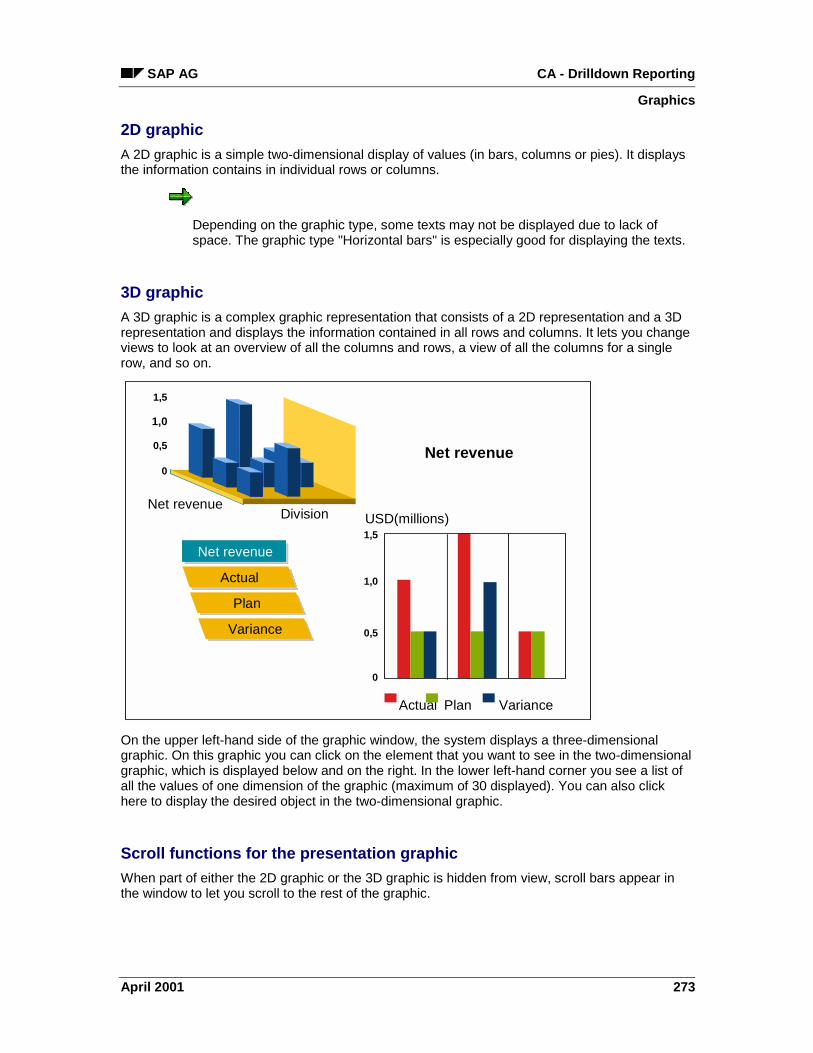
SAP AG CA - Drilldown Reporting
Graphics
April 2001 273
2D graphic
A 2D graphic is a simple two-dimensional display of values (in bars, columns or pies). It displaysthe information contains in individual rows or columns.
Depending on the graphic type, some texts may not be displayed due to lack ofspace. The graphic type "Horizontal bars" is especially good for displaying the texts.
3D graphic
A 3D graphic is a complex graphic representation that consists of a 2D representation and a 3Drepresentation and displays the information contained in all rows and columns. It lets you changeviews to look at an overview of all the columns and rows, a view of all the columns for a singlerow, and so on.
Plan
Actual
Variance
Net revenue
Net revenue0
0,5
1,0
1,5
DivisionNet revenue
0
0,5
1,0
1,5
USD(millions)
Actual Plan Variance
On the upper left-hand side of the graphic window, the system displays a three-dimensionalgraphic. On this graphic you can click on the element that you want to see in the two-dimensionalgraphic, which is displayed below and on the right. In the lower left-hand corner you see a list ofall the values of one dimension of the graphic (maximum of 30 displayed). You can also clickhere to display the desired object in the two-dimensional graphic.
Scroll functions for the presentation graphic
When part of either the 2D graphic or the 3D graphic is hidden from view, scroll bars appear inthe window to let you scroll to the rest of the graphic.

CA - Drilldown Reporting SAP AG
Graphics
274 April 2001
If you are displaying a 2D graphic for a row or column or a 3D graphic for a column group, youcan display a graphic the next row, column or column group directly from this graphic using theFirst, Previous, Next and Last row/column/column group functions.
A maximum of 30 characteristic values can be displayed for a single dimension in each graphic.If the report list has more than 30 characteristic values, you can display these using the First,Previous, Next and Last buttons. These functions correspond to scrolling vertically through thereport list.
In 3D graphics, you can switch between different forms of representation using the pushbuttonsat the top of the window or using the Goto menu. The functions 2D display and 3D display let youview an enlarged 2D or 3D graphic. The Groups function displays a series of 2D graphics at thesame time.
Graphic settings for the presentation graphic
You can make a number of settings for your graphic under the menu Settings.
For technical reasons any interactive changes you save in the graphic (Settings → Save settings)are valid only for the presentation graphic. When you save, the system saves all the changes youhave made except to the window size and position. The saved settings are used again wheneveryou call up the same type of graphic for that report.
You can save the window position and size using the function System → User profile → Userparameters. By default, the graphic window appears is centered and takes up the entire screen.You can change these settings as follows:
• WIP: Window position, values 1 through 9
• WIX: Window width, values < 100 (% of screen width)
• WIY: Window height, values < 100 (% of screen height)
When you make these settings in your user parameters, the system uses them whenever youcall up any graphic.
Line DiagramA line graph (also called a statistic graphic) is a two-dimensional representation of statisticalvalues in the form of a curve. This type of graphic is most suited for representing a large numberof values. It also lets you represent trends over time for values such as stock prices.

SAP AG CA - Drilldown Reporting
Graphics
April 2001 275
0.0
1000.0
2000.0
3000.0
96' JAN 96' FEB 96' MAR 96' APR 96' MAY 96' JUN
05 12 19 26 06 13 20 27 03 10 17 2404 11 18 252901 08 15 22 2901 08 15 22
Comparison of Stocks
x xx x x
x
x x x x xx x x
x
x
xx Stock A
Stock B
x
Portfolio GraphicA portfolio graphic is a graphic representation that lets you depict multidimensional reportobjects. Two of the dimensions of the object are represented by the X and Y axes. The objectitself is often displayed as a circle, but may also be represented by a rectangle.
In addition to the X and Y coordinates, the radius or the length of each side of the object canrepresent the third dimension. A pie chart or bar chart can represent the fourth dimension.
You can also place arrows on the objects in the graphic to emphasize trends or other aspects.
When you call up a portfolio graphic, the system first displays a dialog box in which you canmake a number of settings. For example, you can specify which column of your report list shouldbe represented by which dimension in the graphic. For more information on the individual fields inthis dialog box, see the online field Help (F1 Help).

CA - Drilldown Reporting SAP AG
Graphics
276 April 2001
Sales inUSD millions
% growth in thelast 12 months
2
3
4
Spices
Fruit
1
Fruit juice
Vegetables
Otherbeverages
25 50 75 100
Dairy products
Complete menus
Grain products
Portfolio - Divisions
For detailed documentation on the various graphic types, settings, and the variousexport and sending functions, see the online documentation SAP Graphics: User'sGuide [Ext.].
Printing GraphicsYou can print all the available types of graphics directly from the graphic window. To do so,choose Graphic → Print.
If you want to alter a graphic before printing it, choose Goto → Graphic → Graphic to WORD onfrom the report list. This activates the download and print function for graphics. Then when youcall up the graphic (Goto → Graphic → Graphics... or the corresponding symbol) and choose thetype, the system displays the same dialog box as when you send a report list to Microsoft Wordfor Windows. Once you have made the desired settings, the system sends the graphic to Wordfor Windows, where you can alter it as desired and then print it. For more information on thisprocedure, see Printing Reports [Page 217].
If, after printing, you want to display a graphic on the screen again, you need todeactivate the print mode by choosing Goto → Graphic → Graphic to WORD off. Thenchoose Goto → Graphic → Graphics... or the corresponding icon to display thegraphic.
SAP AG CA - Drilldown Reporting
Graphics
April 2001 277

CA - Drilldown Reporting SAP AG
Optimizing Performance
278 April 2001
Optimizing Performance
UseWhen you execute a report, the system reads the transaction data records and summarizes themso that the user can navigate as he or she wishes through the free characteristics selected in thereport definition. Further summarizations over the free characteristics take place during theterminal session, in order to build up the lists. This data is contained in the main memory. Thiscan create a large volume of data and cause long response times. In order to read 100,000records of a length of 500 bytes from the hard-drive, the system typically requires about threeminutes. The quantity of data is often much larger than this. This means that, in many cases,executing reports online takes too long. The following section describes a number of possibilitiesfor obtaining optimal response times in reporting.
Executing the Report Online
To achieve a reasonable response time when calling up a report which reads data from thetransaction database, the amount of data to be read should be as small as possible. As a rule, itmakes sense to execute reports of up to 20,000 records online. With special tuning measures,this figure can be higher, for example when the database buffer is enlarged and access to thehard drive is no longer required. You can also make improvements by creating special indices.The details of the tuning measures are dependent on the database system and the operatingsystem.
Executing the Report in the Background and Saving Data
You can execute a report in the background and save the data contained in the main memory.This data is then known as saved data.
This method has the advantage that the end user does not have to wait for the transaction datato be read. The report can be scheduled in the background and the end user automaticallyreceives the data from the most recently saved data. The saved data is also in exactly the levelof detail which the end user requires. A report with saved data can be called up much morequickly than a report which is executed online, since little demand is placed on the databaseserver.
The disadvantage of this method is that you must create a variant for each variable combination.This can be troublesome if a large number of different variable combinations are required.However, these variants can be summarized in one variant group and executed together in thebackground.
It is also important to realize that a report with saved data might not contain the most up-to-datedata in the R/3 system. One thing is certain, however: with larger and more complex reports,saved data is a useful means of improving response times.
Avoiding Characteristic Hierarchies
The R/3 system allows you to arrange characteristic values hierarchically in order to show thecontextual dependencies which exist in the system. Within the system, you do this by maintaininga separate table, which you need to access in addition to the actual table of characteristics.These extra database accesses can have a negative effect on report performance. You musttherefore consider whether or not the benefits of characteristic hierarchies outweigh the loss ofperformance.

SAP AG CA - Drilldown Reporting
Optimizing Performance
April 2001 279
Summarization Levels
You can reduce the quantity of data to be read (and, therefore, the response time of a report) byholding the dataset in a summarized form. These summarized datasets are calledsummarization levels. You can determine both the number of levels required and the respectivedegree of detail.
This process has the advantage that the data which is read from the summarization levels can becalled up quickly. Also, the data is always up-to-date compared to the saved data. The data isalways updated at the same time as the aspect transaction database. A disadvantage of thisprocess is that the greater the number of summarization levels, the slower the data transfer willbe.
The use of summarization levels makes sense if the data is required by several reports.
Since not every summarization level can produce an improvement in response time compared toa report executed online, there are guidelines for defining summarization levels.
Using the Report/Report Interface
With the report/report interface you can connect several individual reports, each with a limitednumber of characteristics, to one another like building blocks in order to be able to navigate fromhighly aggregated objects into detail, or to other types of objects. To achieve optimal responsetimes, you start with a highly summarized report. Only a small number of free characteristicsshould be included in this report. Using the report/report interface, you can call up (connected)reports, which contain additional characteristics with which the objects are described in moredetail. These connected reports normally have good response times, as only a small and veryspecific amount of data must be selected.
In many cases, these processes are not mutually exclusive. A better result is oftenattained with a combination of the methods, for example:
• saved data for a large, complex report, but a summarization level for a reportusing highly aggregated data.
• a report with summarized data, which calls up an online report using the report/reportinterface. See Example: Optimizing Performance [Page 284].
See also:
Freezing Report Data in the Background Using Variants [Page 216]
Summarization levels [Page 280]
Overview: Report/Report Interface [Page 79]

CA - Drilldown Reporting SAP AG
Summarization Levels
280 April 2001
Summarization Levels
DefinitionA summarization level saves transaction data in compressed form. In such transaction data,individual objects are described using a range of characteristics. Summarizing means thatselected characteristics are left out. Objects from the original dataset which are no longerdifferentiated once characteristics have been left out are summarized in one object in thesummarization level. The aggregated data is available to all reports. The summarization allowsfor quick access to the data in reporting-
UseTypically, reports are required in which the end user can navigate from a high summarized leveldown to the level of detail which is of business interest to him or her. The selected report data iscontained in the main memory. This can create a large volume of data and cause long responsetimes. There are various alternatives for improving the response time of a report. See the sectionOptimizing Performance [Page 278]. In this section, the alternative using summarization levels isdescribed, and the guidelines according to which you summarization levels are to be defined arealso explained. For information about how to create and build up summarization levels, seeCustomizing.
The example below shows how the transaction data records can be summarized on the databasein order to improve reading times in the report.
Employee xxx in cost center 100 in company code 1000 worked 50 hours overtime.
Employee yyy in cost center 100 in company code 1000 worked 30 hours overtime.
Employee zzz in cost center 200 in company code 1000 worked 20 hours overtime.
If the transaction data were transferred in this way, three records could be written inthe transaction data table:
Employees Cost center Company code Overtime
xxx 100 1000 50
yyy 100 1000 30
zzz 200 1000 20
As a rule, relatively few analysis paths are used in reporting, so you could define asummarization level for the example above.
A summarization level is formed at the cost center level, which means that asummarization is made over the characteristic employee. The records arecompressed together and the following structure ensues:
Cost center Company code Overtime
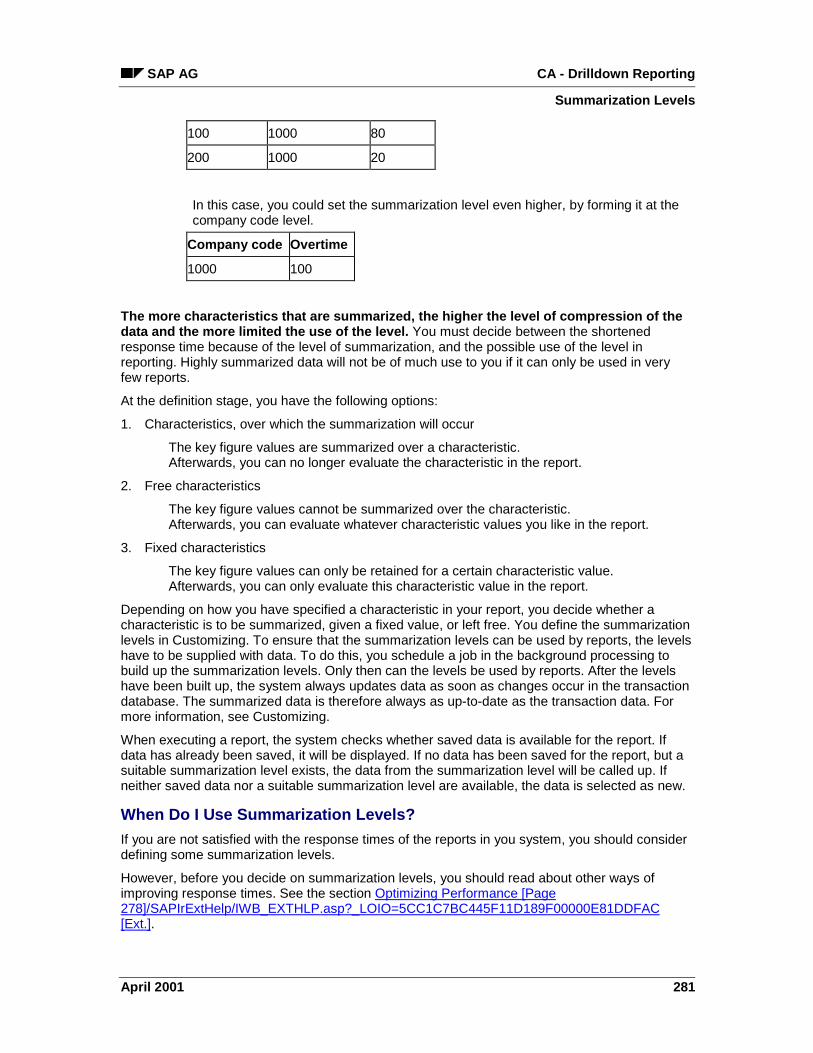
SAP AG CA - Drilldown Reporting
Summarization Levels
April 2001 281
100 1000 80
200 1000 20
In this case, you could set the summarization level even higher, by forming it at thecompany code level.
Company code Overtime
1000 100
The more characteristics that are summarized, the higher the level of compression of thedata and the more limited the use of the level. You must decide between the shortenedresponse time because of the level of summarization, and the possible use of the level inreporting. Highly summarized data will not be of much use to you if it can only be used in veryfew reports.
At the definition stage, you have the following options:
1. Characteristics, over which the summarization will occur
The key figure values are summarized over a characteristic.Afterwards, you can no longer evaluate the characteristic in the report.
2. Free characteristics
The key figure values cannot be summarized over the characteristic.Afterwards, you can evaluate whatever characteristic values you like in the report.
3. Fixed characteristics
The key figure values can only be retained for a certain characteristic value.Afterwards, you can only evaluate this characteristic value in the report.
Depending on how you have specified a characteristic in your report, you decide whether acharacteristic is to be summarized, given a fixed value, or left free. You define the summarizationlevels in Customizing. To ensure that the summarization levels can be used by reports, the levelshave to be supplied with data. To do this, you schedule a job in the background processing tobuild up the summarization levels. Only then can the levels be used by reports. After the levelshave been built up, the system always updates data as soon as changes occur in the transactiondatabase. The summarized data is therefore always as up-to-date as the transaction data. Formore information, see Customizing.
When executing a report, the system checks whether saved data is available for the report. Ifdata has already been saved, it will be displayed. If no data has been saved for the report, but asuitable summarization level exists, the data from the summarization level will be called up. Ifneither saved data nor a suitable summarization level are available, the data is selected as new.
When Do I Use Summarization Levels?
If you are not satisfied with the response times of the reports in you system, you should considerdefining some summarization levels.
However, before you decide on summarization levels, you should read about other ways ofimproving response times. See the section Optimizing Performance [Page278]/SAPIrExtHelp/IWB_EXTHLP.asp?_LOIO=5CC1C7BC445F11D189F00000E81DDFAC[Ext.].

CA - Drilldown Reporting SAP AG
Summarization Levels
282 April 2001
Guidelines for Creating a Summarization Level
When defining a summarization level, there are often several possible combinations ofcharacteristics. Since not every summarization level can produce an improvement in responsetimes compared to a report executed online, there are guidelines for defining summarizationlevels. To obtain the optimum summarization effect, you must analyze the desired report for eachsummarization level, determine which master and transaction data is affected and consider thefollowing points:
1. A summarization level should contain as few records as possible compared to thenumber of records in the transaction data.
Estimate the number of records to be read on the database, and the number of recordsin your planned summarization level. A minimum factor of 10 should be attained.
Where possible, summarization levels should be defined over characteristics with a largenumber of values. You can attain a greater summarization effect if you summarize overthe characteristics article and product, as these characteristics typically contain a largenumber of values.
If your summarization level contains a large number of records, the corresponding reportmust be defined in such a way that it does not have to read more than 10,000 to 20,000records from the summarization level.
2. As few summarization levels as possible should exist
Since the summarization levels are updated automatically, each change in thetransaction data leads to an update in all summarization levels. This means that achange to one transaction data record leads to several writing processes in thedatabase. If there are a large number of summarization levels, this will impairperformance in data transfer.
If you generate a proposal for a summarization level, you should edit it manually. Youshould also check whether a similar summarization level already exists. You will find thisinformation when maintaining the summarization levels in the overview and detail screen.You should check this data occasionally for all summarization levels, as the number ofaccesses, for example, can help you to decide whether a particular level is still required.For more information, see Customizing.
3. Dependent characteristics should always be included in a summarization level.
In many cases there is a dependency between several characteristics. If, for example,the product group is derived from the product number, then the product group isdependent on the product. The volume of data in the summarization level is not enlargedby the inclusion of the product group and therefore does not impair performance. Theadvantage is that the summarization level can also be used by reports which containthese dependent characteristics.
The dependency between two characteristics normally exists because of derivation or isalready given by previous systems, for example a representative for customers in acustomer master.
A detailed description of how you create and build up summarization levels is given inCustomizing.
For an example of defining a summarization level, see Example: Optimizing Performance [Page284].

SAP AG CA - Drilldown Reporting
Summarization Levels
April 2001 283

CA - Drilldown Reporting SAP AG
Example: Optimizing Performance
284 April 2001
Example: Optimizing PerformanceSuppose you have the following characteristics:
• 10 product master groups (each containing 10 product groups)
• 100 product groups (each containing 10 products)
• 1,000 products
• 100 customer groups (each containing 10 customers)
• 1,000 customers
In this example, the product master group is dependent on the product group, and the productgroup is dependent on the product. Furthermore, the customer group is dependent on thecustomer. No dependence exists between any other characteristics. Each customer purchaseseach product. This results in a million records (1000 products * 1000 customers) in thetransaction database.
In your report, you wish to navigate from the list of product master groups over the characteristicsproduct group, product and customer group to the customer. If, for this purpose, you define areport with all characteristics, this would lead to long response times when you execute the reportonline, as the data would be loaded at the lowest level of detail in the memory.
You can solve this problem as follows:
1. Define the first report over the free characteristics product master group, product group andproduct.
2. Now define the second report over all five characteristics, while defining the characteristicsproduct master group, product group and product as reqiured entry fields. Define thecharacteristics customer group and customer as free characteristics.
3. Combine the reports using via the report/report interface.
4. For the first report, create a summarization level with the characteristics product mastergroup, product group and product.
When you execute the first report, the system reads 1,000 records from the summarization level,as the product group and product master group are dependent on the product, and there are1,000 products.
To navigate to the customer, navigate to a product in the first report. Now call up the secondreport using the report/report interface. As the three required entry fields are transferred from thefirst report, no more than 1,000 records can be read from the transaction database. For thisproduct, you can now navigate to the customer.
In contrast to the single report with all characteristics, where the system reads a million records,in this case the system only reads 1,000 records twice. You can therefore execute the reportsonline.
SAP AG CA - Drilldown Reporting
Reorganization and Conversion
April 2001 285
Reorganization and Conversion
UseReorganization (deleting large numbers of reports, forms and report data) and conversion ofreports are both functions which normally only use if changes within your company render suchsteps necessary.
To cite an example, it might be necessary to carry out reorganization if your company's Reportinghas been restructured, thus making a large number of reports redundant or superfluous.
It is always necessary to convert reports if your SAP system has been upgraded to a newrelease, and you wish to use existing reports in the new release.
Features
Reorganization
The functions Reorganize report data, Reorganize reports , Reorganize forms and Reorganizevariant groups let you specify a number of report data, reports, forms and so on, and then deletethese from an overview list.
You can only delete a form if it is no longer used in any reports.
For application-specific information about Reorganization, see the section Information Systemin Customizing.
Conversion
When you upgrade your system to a new release, it may be necessary to convert reports youdefined in the earlier release before you can use them in the new release.
The system automatically converts each report the first time you execute it following the upgradeto the new release. If the automatic conversion does not work, you can convert the reportmanually. For more information, see Customizing or the corresponding section in yourapplication-specific documentation.
When you convert a report, you merely adapt the report's technical structure so thatit conforms to the new release. Report data is deleted during the conversion. Thesystem then reselects the report data when you execute the report in the newrelease.
Conversion of all reports
As an administrator, you can plan conversion of all reports centrally as a background job. Thereport RKD_REGENERATE_ALL_REPORTS has been created for this purpose. You can call up thisreport using the monitor (transaction KEMO in CO-PA, transaction KCW0 in EC-EIS, chooseGoto -> Generate All Reports) or directly using the ABAP Editor (transaction SE38).
Conversion of all reports must be schedules as a background job, as it is normally avery time-consuming function.

CA - Drilldown Reporting SAP AG
Reorganization and Conversion
286 April 2001