C4 photosynthesis, atmospheric CO2, and climate - ResearchGate
15
James R. Ehleringer Æ Thure E. Cerling Brent R. Helliker C 4 photosynthesis, atmospheric CO 2 , and climate Received: 12 February 1997 / Accepted: 20 June 1997 Abstract The objectives of this synthesis are (1) to review the factors that influence the ecological, geographical, and palaeoecological distributions of plants possessing C 4 photosynthesis and (2) to propose a hypothesis/ model to explain both the distribution of C 4 plants with respect to temperature and CO 2 and why C 4 photosyn- thesis is relatively uncommon in dicotyledonous plants (hereafter dicots), especially in comparison with its widespread distribution in monocotyledonous species (hereafter monocots). Our goal is to stimulate discussion of the factors controlling distributions of C 4 plants to- day, historically, and under future elevated CO 2 envi- ronments. Understanding the distributions of C 3 /C 4 plants impacts not only primary productivity, but also the distribution, evolution, and migration of both in- vertebrates and vertebrates that graze on these plants. Sixteen separate studies all indicate that the current distributions of C 4 monocots are tightly correlated with temperature: elevated temperatures during the growing season favor C 4 monocots. In contrast, the seven studies on C 4 dicot distributions suggest that a dierent envi- ronmental parameter, such as aridity (combination of temperature and evaporative potential), more closely describes their distributions. Dierences in the temper- ature dependence of the quantum yield for CO 2 uptake (light-use eciency) of C 3 and C 4 species relate well to observed plant distributions and light-use eciency is the only mechanism that has been proposed to explain distributional dierences in C 3 /C 4 monocots. Modeling of C 3 and C 4 light-use eciencies under dierent com- binations of atmospheric CO 2 and temperature predicts that C 4 -dominated ecosystems should not have ex- panded until atmospheric CO 2 concentrations reached the lower levels that are thought to have existed begin- ning near the end of the Miocene. At that time, pal- aeocarbonate and fossil data indicate a simultaneous, global expansion of C 4 -dominated grasslands. The C 4 monocots generally have a higher quantum yield than C 4 dicots and it is proposed that leaf venation patterns play a role in increasing the light-use eciency of most C 4 monocots. The reduced quantum yield of most C 4 dicots is consistent with their rarity, and it is suggested that C 4 dicots may not have been selected until CO 2 concentrations reached their lowest levels during glacial maxima in the Quaternary. Given the intrinsic light-use eciency advantage of C 4 monocots, C 4 dicots may have been limited in their distributions to the warmest eco- systems, saline ecosystems, and/or to highly disturbed ecosystems. All C 4 plants have a significant advantage over C 3 plants under low atmospheric CO 2 conditions and are predicted to have expanded significantly on a global scale during full-glacial periods, especially in tropical regions. Bog and lake sediment cores as well as pedogenic carbonates support the hypothesis that C 4 ecosystems were more extensive during the last glacial maximum and then decreased in abundance following deglaciation as atmospheric CO 2 levels increased. Key words Photosynthesis Æ Carbon isotope ratio Æ Global change Æ Quantum yield Æ Light-use eciency Introduction Plants can be categorized photosynthetically as falling into one of three categories: C 3 ,C 4 , and CAM. On a global basis, C 4 biota account for approximately 18% of the total global productivity, which is largely due to high Oecologia (1997) 112:285–299 Ó Springer-Verlag 1997 This contribution is dedicated to Professor Harold Mooney, a pioneer in plant ecology and global ecology, on the occasion of his 65th birthday J.R. Ehleringer (&) Æ B.R. Helliker Stable Isotope Ratio Facility for Environmental Research, Department of Biology, University of Utah, Salt Lake City, UT 84112, USA Fax: 801-581-4665; e-mail: [email protected] T.E. Cerling Department of Geology and Geophysics, University of Utah, Salt Lake City, UT 84112, USA
Transcript of C4 photosynthesis, atmospheric CO2, and climate - ResearchGate
James R. Ehleringer á Thure E. CerlingBrent R. Helliker
C4 photosynthesis, atmospheric CO2, and climate
Received: 12 February 1997 /Accepted: 20 June 1997
Abstract The objectives of this synthesis are (1) to reviewthe factors that in¯uence the ecological, geographical,and palaeoecological distributions of plants possessingC4 photosynthesis and (2) to propose a hypothesis/model to explain both the distribution of C4 plants withrespect to temperature and CO2 and why C4 photosyn-thesis is relatively uncommon in dicotyledonous plants(hereafter dicots), especially in comparison with itswidespread distribution in monocotyledonous species(hereafter monocots). Our goal is to stimulate discussionof the factors controlling distributions of C4 plants to-day, historically, and under future elevated CO2 envi-ronments. Understanding the distributions of C3/C4
plants impacts not only primary productivity, but alsothe distribution, evolution, and migration of both in-vertebrates and vertebrates that graze on these plants.Sixteen separate studies all indicate that the currentdistributions of C4 monocots are tightly correlated withtemperature: elevated temperatures during the growingseason favor C4 monocots. In contrast, the seven studieson C4 dicot distributions suggest that a di�erent envi-ronmental parameter, such as aridity (combination oftemperature and evaporative potential), more closelydescribes their distributions. Di�erences in the temper-ature dependence of the quantum yield for CO2 uptake(light-use e�ciency) of C3 and C4 species relate well toobserved plant distributions and light-use e�ciency is
the only mechanism that has been proposed to explaindistributional di�erences in C3/C4 monocots. Modelingof C3 and C4 light-use e�ciencies under di�erent com-binations of atmospheric CO2 and temperature predictsthat C4-dominated ecosystems should not have ex-panded until atmospheric CO2 concentrations reachedthe lower levels that are thought to have existed begin-ning near the end of the Miocene. At that time, pal-aeocarbonate and fossil data indicate a simultaneous,global expansion of C4-dominated grasslands. The C4
monocots generally have a higher quantum yield than C4
dicots and it is proposed that leaf venation patterns playa role in increasing the light-use e�ciency of most C4
monocots. The reduced quantum yield of most C4 dicotsis consistent with their rarity, and it is suggested thatC4 dicots may not have been selected until CO2
concentrations reached their lowest levels during glacialmaxima in the Quaternary. Given the intrinsic light-usee�ciency advantage of C4 monocots, C4 dicots may havebeen limited in their distributions to the warmest eco-systems, saline ecosystems, and/or to highly disturbedecosystems. All C4 plants have a signi®cant advantageover C3 plants under low atmospheric CO2 conditionsand are predicted to have expanded signi®cantly on aglobal scale during full-glacial periods, especially intropical regions. Bog and lake sediment cores as well aspedogenic carbonates support the hypothesis that C4
ecosystems were more extensive during the last glacialmaximum and then decreased in abundance followingdeglaciation as atmospheric CO2 levels increased.
Key words Photosynthesis á Carbon isotope ratio áGlobal change á Quantum yield á Light-use e�ciency
Introduction
Plants can be categorized photosynthetically as fallinginto one of three categories: C3, C4, and CAM. On aglobal basis, C4 biota account for approximately 18% ofthe total global productivity, which is largely due to high
Oecologia (1997) 112:285±299 Ó Springer-Verlag 1997
This contribution is dedicated to Professor Harold Mooney, apioneer in plant ecology and global ecology, on the occasion of his65th birthday
J.R. Ehleringer (&) á B.R. HellikerStable Isotope Ratio Facility for Environmental Research,Department of Biology,University of Utah,Salt Lake City, UT 84112, USAFax: 801-581-4665; e-mail: [email protected]
T.E. CerlingDepartment of Geology and Geophysics,University of Utah,Salt Lake City, UT 84112, USA
productivity of C4 monocots in grasslands (calculatedfrom data in Melillo et al. 1993). Most plant speciesglobally are characterized by C3 photosynthesis, but theC4 and CAM pathways represent evolutionary ad-vancements over the ancestral C3 pathway that result insuperior carbon-gaining capacities under particular en-vironmental conditions (Osmond et al. 1982; Monson1989; Ehleringer and Monson 1993). The performanceof each pathway is signi®cantly in¯uenced by climaticconditions and over the past two decades attention hasfocused on describing those environmental parametersmost closely associated with the distributional abun-dance of di�erent photosynthetic pathway types.
The objectives of this synthesis are to review thefactors known to in¯uence the ecological and geo-graphical distributions of C4 plants and to propose ahypothesis to explain why C4 dicotyledonous plants(hereafter dicots) are relatively uncommon, especiallywhen compared to the widespread distributions of C4
monocotyledonous species (hereafter monocots). Whatwill become evident is that most previous e�orts haveconcentrated on describing the environmental factorsrelated to the distributions of C4 monocots (grasses andsedges). Such a focus is expected, since approximatelyone-half of the 10,000 grass species have C4 photosyn-thesis (Hattersley 1987; Hattersley and Watson 1992). Incontrast, it appears that fewer than perhaps a thousandof the 165,000 dicots have C4 photosynthesis. A con-sensus has emerged as to the environmental factors mostclosely associated with expansion of C4 grasslands, butboth the uncommonness of C4 dicots as well as the en-vironmental constraints associated with their distribu-tions have been largely ignored.
Phylogenetic distribution of C4 photosynthesis
The taxonomic distributions of plants possessing C4
photosynthesis suggest interesting and perhaps recentevolutionary origins. C4 photosynthesis is restricted toadvanced members of the Dicotyledonae (dicots) andMonocotyledonae (monocots). The C4 pathway hasmultiple evolutionary origins. It occurs within 8 of 16superorders in the Dicotyledonae, but only within 1 of 5superorders in the Monocotyledonae (Commelinanae)(Table 1). C3±C4 intermediates are also known to occurin taxa of these superorders (Monson et al. 1984). Phy-logenetically these groups are quite separated from eachother (Chase et al. 1993), reinforcing the notion that theC4 pathway must have evolved independently multipletimes (see reviews in Monson 1989; Ehleringer andMonson 1993). Within the monocots, C4 photosynthesisis quite common among grasses (Poaceae) and sedges(Cyperaceae), two closely related groups (Hattersley1987; Hattersley and Watson 1992). Although wide-spread, the distribution of C4 photosynthesis is notcomplete in grasses and sedges. Lineages extensivethroughout tropical and subtropical regions tend tohave C4 photosynthesis, whereas those originating from
arctic or temperate regions tend to have C3 photosyn-thesis (Brown 1977; Hattersley 1987). What isremarkable is that although C4 photosynthesis isdocumented to occur among half of the Dicotyledonaesuperorders, further analysis of C4 distributions amongthe dicots indicates that it occurs in only 16 of theapproximately 400 families. Furthermore, within eachfamily, it often occurs within only one to several generaand then often only within two to three species. Excep-tions to this trend are in the Caryophyllales, where C4
photosynthesis is common among genera within theAmaranthaceae and Chenopodiaceae. Thus, in C4
dicots, we have a photosynthetic pathway whosedistribution is both taxonomically uncommon andphylogenetically widely dispersed among only advancedfamilies. Additionally, there are C3±C4 intermediates ingenera which at present do not have C4 photosynthesis.This taxonomic distribution pattern is consistent withthe notion that C4 photosynthesis may have evolvedrecently among the dicots. Later we will suggest that C4
photosynthesis in dicots may not have been evolution-arily favored until atmospheric CO2 concentrationsreached the low levels that characterize glacial maxima.These low atmospheric CO2 conditions may not haveoccurred until the Quaternary and then for relativelybrief periods of 20,000±30,000 years at a time.
Current abundances of C4 monocots are associatedwith temperature
On a global basis, the greatest fraction of C4 taxa arewithin the monocots, speci®cally the grasses (Teeri andStowe 1976; Hattersley 1983; Teeri 1988) and the sedges(Teeri et al. 1980; Takeda et al. 1985a; Ueno and Takeda1992). The now classic study by Teeri and Stowe (1976)®rst quanti®ed the environmental characteristics asso-ciated with the distributions of C3 and C4 grasses inNorth America. They showed a correlation of r = 0.97between percent C4 grasses within a ¯ora and the min-imum growing-season temperature: the higher the tem-perature the more frequent C4 photosynthesis within thegrass taxa. Total precipitation was not as critical aparameter. More recently, Epstein et al. (1997) havecon®rmed the primary signi®cance of temperature inassociation with C3/C4 grass distributions in the GreatPlains. Given the strong relationships between temper-ature and both latitude and elevation, the Teeri andStowe (1976) study accounted for the geographicdistribution of C4 grasses across North America. Ingrasslands with only a spring growing season (e.g.,Central Valley of California or Palouse of Washington),we ®nd only C3 grass species (Teeri and Stowe 1976).However, where grasslands exhibit two distinct growingseasons (winter±spring and summer), strong seasonaldi�erences exist for the dominance of one pathwayversus the other. Primary productivity in the central andnorthern portions of the Great Plains of North Americais dominated by C3 grasses in the spring growing season,
286
while C4 grasses predominate during the summergrowing season (Ode et al. 1980; Barnes et al. 1983;Monson et al. 1983; Boryslawski and Bentley 1985;Paruelo and Lauenroth 1996; Tieszen et al. 1997). Asimilar pattern occurs in the Sonoran Desert, where thewinter±spring vegetation is exclusively C3, whereas C4
grasses dominate in the summer monsoon season (Shr-eve and Wiggins 1964; Mulroy and Rundel 1977).
Teeri and Stowe's initial observations lead to a seriesof additional grassland analyses in di�erent global re-gions, from which it became clear that temperature wasthe dominant climatic parameter correlated with theabundance of C4 within grass taxa (Table 2). In these
analyses, temperature has not always been quanti®edusing the same parameter: in some cases it was minimumgrowing-season temperature, but in others it was day-time maximum temperature or mean temperature. Yetgiven the high autocorrelation between these varioustemperature parameters, choosing a single temperaturemeasure may not be critical. While precipitation is ob-viously essential to initiate plant growth, temperature issuch a dominant factor in these regression analyses thatit explains more than 90% of the total C3/C4 distribu-tional variation across almost all geographic regions.
Many of the previous climate-C4 analyses allow forthe calculation of the transition temperatures associated
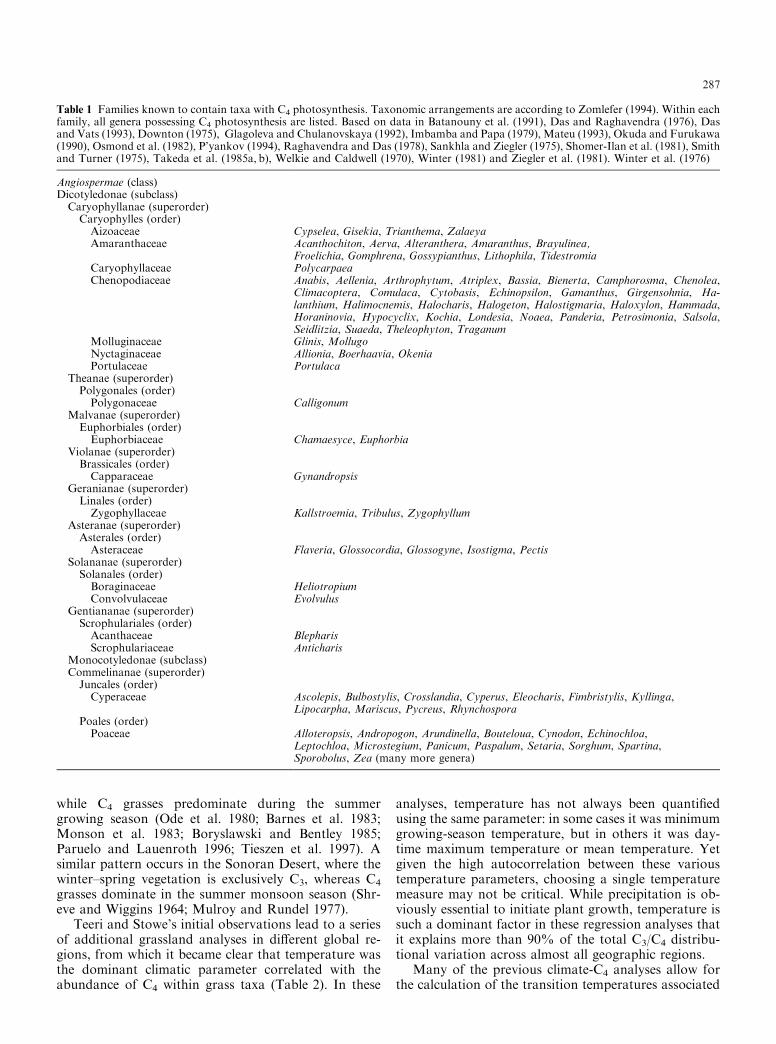
Table 1 Families known to contain taxa with C4 photosynthesis. Taxonomic arrangements are according to Zomlefer (1994). Within eachfamily, all genera possessing C4 photosynthesis are listed. Based on data in Batanouny et al. (1991), Das and Raghavendra (1976), Dasand Vats (1993), Downton (1975), Glagoleva and Chulanovskaya (1992), Imbamba and Papa (1979), Mateu (1993), Okuda and Furukawa(1990), Osmond et al. (1982), P'yankov (1994), Raghavendra and Das (1978), Sankhla and Ziegler (1975), Shomer-Ilan et al. (1981), Smithand Turner (1975), Takeda et al. (1985a, b), Welkie and Caldwell (1970), Winter (1981) and Ziegler et al. (1981). Winter et al. (1976)
Angiospermae (class)Dicotyledonae (subclass)Caryophyllanae (superorder)Caryophylles (order)Aizoaceae Cypselea, Gisekia, Trianthema, ZalaeyaAmaranthaceae Acanthochiton, Aerva, Alteranthera, Amaranthus, Brayulinea,
Froelichia, Gomphrena, Gossypianthus, Lithophila, TidestromiaCaryophyllaceae PolycarpaeaChenopodiaceae Anabis, Aellenia, Arthrophytum, Atriplex, Bassia, Bienerta, Camphorosma, Chenolea,
Climacoptera, Comulaca, Cytobasis, Echinopsilon, Gamanthus, Girgensohnia, Ha-lanthium, Halimocnemis, Halocharis, Halogeton, Halostigmaria, Haloxylon, Hammada,Horaninovia, Hypocyclix, Kochia, Londesia, Noaea, Panderia, Petrosimonia, Salsola,Seidlitzia, Suaeda, Theleophyton, Traganum
Molluginaceae Glinis, MollugoNyctaginaceae Allionia, Boerhaavia, OkeniaPortulaceae Portulaca
Theanae (superorder)Polygonales (order)Polygonaceae Calligonum
Malvanae (superorder)Euphorbiales (order)Euphorbiaceae Chamaesyce, Euphorbia
Violanae (superorder)Brassicales (order)Capparaceae Gynandropsis
Geranianae (superorder)Linales (order)Zygophyllaceae Kallstroemia, Tribulus, Zygophyllum
Asteranae (superorder)Asterales (order)Asteraceae Flaveria, Glossocordia, Glossogyne, Isostigma, Pectis
Solananae (superorder)Solanales (order)Boraginaceae HeliotropiumConvolvulaceae Evolvulus
Gentiananae (superorder)Scrophulariales (order)Acanthaceae BlepharisScrophulariaceae Anticharis
Monocotyledonae (subclass)Commelinanae (superorder)Juncales (order)Cyperaceae Ascolepis, Bulbostylis, Crosslandia, Cyperus, Eleocharis, Fimbristylis, Kyllinga,
Lipocarpha, Mariscus, Pycreus, RhynchosporaPoales (order)Poaceae Alloteropsis, Andropogon, Arundinella, Bouteloua, Cynodon, Echinochloa,
Leptochloa, Microstegium, Panicum, Paspalum, Setaria, Sorghum, Spartina,Sporobolus, Zea (many more genera)
287
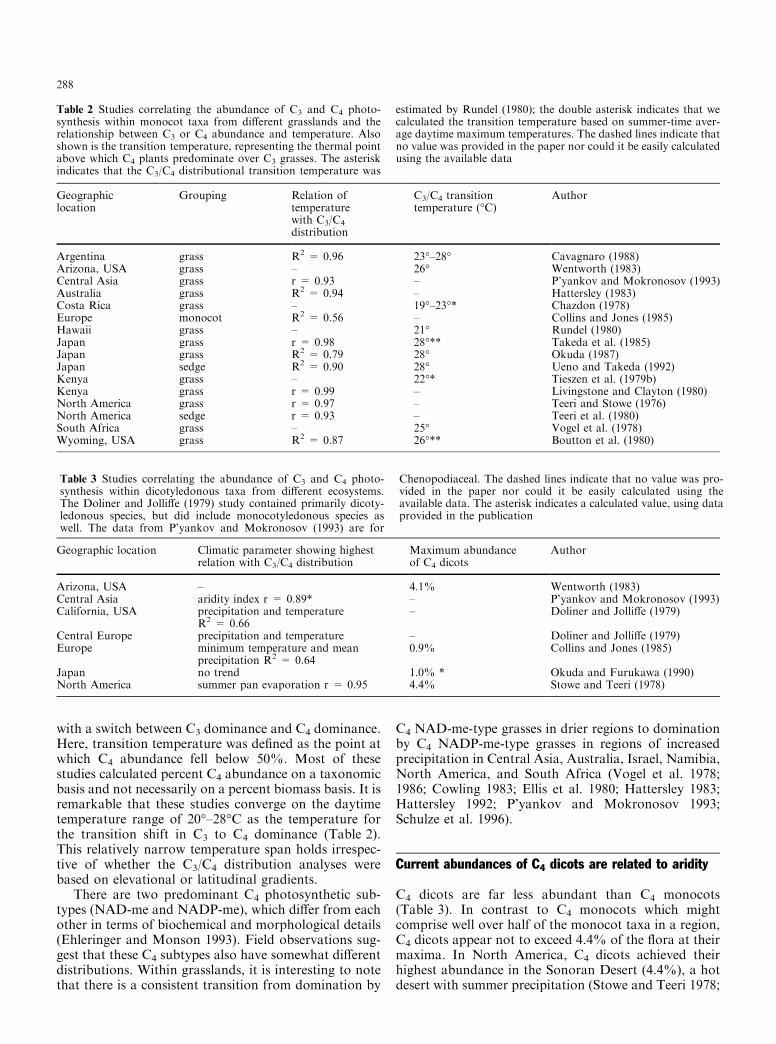
with a switch between C3 dominance and C4 dominance.Here, transition temperature was de®ned as the point atwhich C4 abundance fell below 50%. Most of thesestudies calculated percent C4 abundance on a taxonomicbasis and not necessarily on a percent biomass basis. It isremarkable that these studies converge on the daytimetemperature range of 20°±28°C as the temperature forthe transition shift in C3 to C4 dominance (Table 2).This relatively narrow temperature span holds irrespec-tive of whether the C3/C4 distribution analyses werebased on elevational or latitudinal gradients.
There are two predominant C4 photosynthetic sub-types (NAD-me and NADP-me), which di�er from eachother in terms of biochemical and morphological details(Ehleringer and Monson 1993). Field observations sug-gest that these C4 subtypes also have somewhat di�erentdistributions. Within grasslands, it is interesting to notethat there is a consistent transition from domination by
C4 NAD-me-type grasses in drier regions to dominationby C4 NADP-me-type grasses in regions of increasedprecipitation in Central Asia, Australia, Israel, Namibia,North America, and South Africa (Vogel et al. 1978;1986; Cowling 1983; Ellis et al. 1980; Hattersley 1983;Hattersley 1992; P'yankov and Mokronosov 1993;Schulze et al. 1996).
Current abundances of C4 dicots are related to aridity
C4 dicots are far less abundant than C4 monocots(Table 3). In contrast to C4 monocots which mightcomprise well over half of the monocot taxa in a region,C4 dicots appear not to exceed 4.4% of the ¯ora at theirmaxima. In North America, C4 dicots achieved theirhighest abundance in the Sonoran Desert (4.4%), a hotdesert with summer precipitation (Stowe and Teeri 1978;
Table 2 Studies correlating the abundance of C3 and C4 photo-synthesis within monocot taxa from di�erent grasslands and therelationship between C3 or C4 abundance and temperature. Alsoshown is the transition temperature, representing the thermal pointabove which C4 plants predominate over C3 grasses. The asteriskindicates that the C3/C4 distributional transition temperature was
estimated by Rundel (1980); the double asterisk indicates that wecalculated the transition temperature based on summer-time aver-age daytime maximum temperatures. The dashed lines indicate thatno value was provided in the paper nor could it be easily calculatedusing the available data
Geographiclocation
Grouping Relation oftemperaturewith C3/C4
distribution
C3/C4 transitiontemperature (°C)
Author
Argentina grass R2 = 0.96 23°±28° Cavagnaro (1988)Arizona, USA grass ± 26° Wentworth (1983)Central Asia grass r = 0.93 ± P'yankov and Mokronosov (1993)Australia grass R2 = 0.94 ± Hattersley (1983)Costa Rica grass ± 19°±23°* Chazdon (1978)Europe monocot R2 = 0.56 ± Collins and Jones (1985)Hawaii grass ± 21° Rundel (1980)Japan grass r = 0.98 28°** Takeda et al. (1985)Japan grass R2 = 0.79 28° Okuda (1987)Japan sedge R2 = 0.90 28° Ueno and Takeda (1992)Kenya grass ± 22°* Tieszen et al. (1979b)Kenya grass r = 0.99 ± Livingstone and Clayton (1980)North America grass r = 0.97 ± Teeri and Stowe (1976)North America sedge r = 0.93 ± Teeri et al. (1980)South Africa grass ± 25° Vogel et al. (1978)Wyoming, USA grass R2 = 0.87 26°** Boutton et al. (1980)
Table 3 Studies correlating the abundance of C3 and C4 photo-synthesis within dicotyledonous taxa from di�erent ecosystems.The Doliner and Jolli�e (1979) study contained primarily dicoty-ledonous species, but did include monocotyledonous species aswell. The data from P'yankov and Mokronosov (1993) are for
Chenopodiaceal. The dashed lines indicate that no value was pro-vided in the paper nor could it be easily calculated using theavailable data. The asterisk indicates a calculated value, using dataprovided in the publication
Geographic location Climatic parameter showing highestrelation with C3/C4 distribution
Maximum abundanceof C4 dicots
Author
Arizona, USA ± 4.1% Wentworth (1983)Central Asia aridity index r = 0.89* ± P'yankov and Mokronosov (1993)California, USA precipitation and temperature
R2 = 0.66± Doliner and Jolli�e (1979)
Central Europe precipitation and temperature ± Doliner and Jolli�e (1979)Europe minimum temperature and mean
precipitation R2 = 0.640.9% Collins and Jones (1985)
Japan no trend 1.0% * Okuda and Furukawa (1990)North America summer pan evaporation r = 0.95 4.4% Stowe and Teeri (1978)
288
Wentworth 1983). With decreasing aridity, the percentC4 dicot abundance in the ¯ora also decreased. Thus, insubtropical regions, such as Florida (2.5%) and Texas(2.8%), C4 dicots were a smaller percentage of the ¯orathan they were in the Sonoran Desert. Similar patternshave been observed in Europe (Collins and Jones 1985)and Japan (Okuda and Furukawa 1990). Little infor-mation is as yet available on the factors controllingeither the abundances or distributions of C4 NADP-meand C4 NAD-medicot plants.
There have been limited analyses of the climatic fac-tors related to the distributions of C4 dicots throughoutthe world. Stowe and Teeri (1978) conducted by far themost extensive and thorough analysis of climatic pa-rameters that might be related to the distribution of C4
dicots. Their analysis indicated that the percent C4
dicots did not follow the same climatic factors as forC4 monocots. Instead of ®nding strong correlations be-tween percent C4 dicots and temperature, the percentC4 dicots appeared most closely related to aridity char-acters, such as summertime pan evaporation rates andannual dryness ratio (ratio of annual net radiation toheat required to evaporate mean annual precipitation)(Table 3). In North America, summer pan evaporationalone explained 90% of the variance in percent C4 dicotabundance (Stowe and Teeri 1978). Similar climatic re-lationships have been observed for C4 dicots within theCalifornia ¯ora (Doliner and Jolli�e 1979), across theEuropean continent (Collins and Jones 1985), andthroughout Japan (Okuda and Furukawa 1990). In eachcase, the conclusion was that the distributions of C4
monocots and dicots appear to be responding to di�er-ent climatic parameters.
While C4 dicots might be conceived as being morecommon than these surveys would otherwise indicate,this is undoubtedly because C4 dicots are among themost noxious and aggressive summertime weeds intemperate and subtropical regions (Holm et al. 1977;Elmore and Paul 1983). Holm et al. (1977) noted that 14of the 18 worst weeds globally had C4 photosynthesis.Elmore and Paul (1983) calculated that the taxonomicfraction of C4 weeds was 17-fold greater than would beexpected based solely on a C3/C4 species basis. There-fore, in habitats subject to disturbance, it would appearthat C4 species are more likely than C3 species to com-prise a signi®cant component of the invaders. Stowe andTeeri (1978) examined possible relationships betweenintroduced C4 dicots (weeds) and climate, but could ®ndno climatological parameter that was signi®cantlycorrelated. They concluded that perhaps similarities inthe microenvironmental attributes of disturbed sitesoverrode climatological di�erences.
The quantum yield for CO2 uptake differencesamong C3 and C4 plants relates to plant distribution
Ehleringer (1978) proposed that variations in thequantum yield for CO2 uptake might be the mechanism
accounting for the observed geographical distributiondi�erences of C3 and C4 grasses. A fundamental physi-ological di�erence between C3 and C4 plants is thequantum yield for CO2 uptake, which is the leaf-levelratio of photosynthetic carbon gain to photons absorbed(Ehleringer and BjoÈ rkman 1977). Sometimes referred toas light-use e�ciency, the quantum yield can play anin¯uential role in determining primary productivity ratesunder light-limited, canopy-level conditions, becausethis parameter describes the basic leaf-level conversione�ciency of the incident photon ¯ux (Ehleringer 1978;Thornley and Johnson 1990; Ruimy et al. 1995). At thecanopy level, di�erences in the orientation of individualleaves allow for greater light penetration into the canopywith the result that few leaves are at light saturation. Asa consequence, there is often a linear relationship be-tween incident photon ¯ux and canopy photosyntheticrate. Thus, while the quantum yield might not be ex-pected to play a signi®cant role for photosynthetic rateof individual leaves at high photon ¯ux densities, itsimportance comes in scaling leaf-level activities to thecanopy scale (Ruimy et al. 1995). On a theoretical basis,the quantum yield is expected to be lower in C4 than C3
plants, because of the additional energy requirement toregenerate phosphoenolpyruvate from pyruvate in theoperation of the C4 cycle (Farquhar and von Caemmerer1982). Yet under current atmospheric conditions, thequantum yield in C3 plants is reduced from maximalvalues because of photorespiration. Since photorespira-tion is a temperature-dependent process, the quantumyield of C3 plants declines with increasing temperatures.
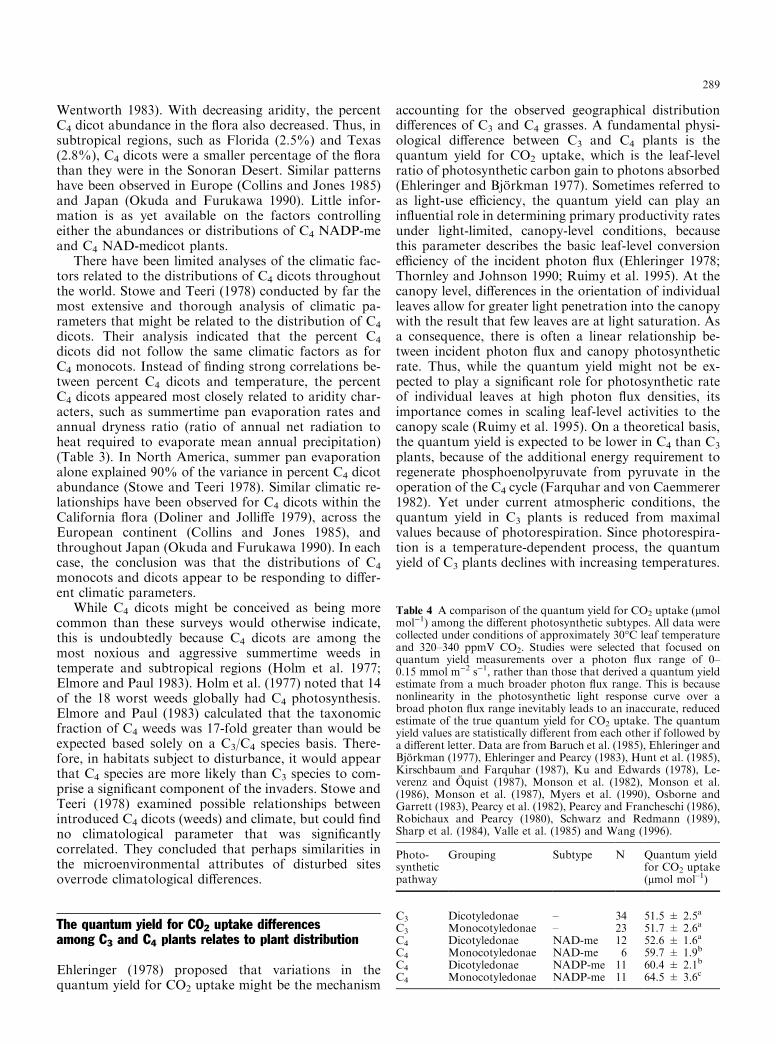
Table 4 A comparison of the quantum yield for CO2 uptake (lmolmol)1) among the di�erent photosynthetic subtypes. All data werecollected under conditions of approximately 30°C leaf temperatureand 320±340 ppmV CO2. Studies were selected that focused onquantum yield measurements over a photon ¯ux range of 0±0.15 mmol m)2 s)1, rather than those that derived a quantum yieldestimate from a much broader photon ¯ux range. This is becausenonlinearity in the photosynthetic light response curve over abroad photon ¯ux range inevitably leads to an inaccurate, reducedestimate of the true quantum yield for CO2 uptake. The quantumyield values are statistically di�erent from each other if followed bya di�erent letter. Data are from Baruch et al. (1985), Ehleringer andBjoÈ rkman (1977), Ehleringer and Pearcy (1983), Hunt et al. (1985),Kirschbaum and Farquhar (1987), Ku and Edwards (1978), Le-verenz and OÈ quist (1987), Monson et al. (1982), Monson et al.(1986), Monson et al. (1987), Myers et al. (1990), Osborne andGarrett (1983), Pearcy et al. (1982), Pearcy and Francheschi (1986),Robichaux and Pearcy (1980), Schwarz and Redmann (1989),Sharp et al. (1984), Valle et al. (1985) and Wang (1996).
Photo-syntheticpathway
Grouping Subtype N Quantum yieldfor CO2 uptake(lmol mol±1)
C3 Dicotyledonae ± 34 51.5 � 2.5a
C3 Monocotyledonae ± 23 51.7 � 2.6a
C4 Dicotyledonae NAD-me 12 52.6 � 1.6a
C4 Monocotyledonae NAD-me 6 59.7 � 1.9b
C4 Dicotyledonae NADP-me 11 60.4 � 2.1b
C4 Monocotyledonae NADP-me 11 64.5 � 3.6c
289
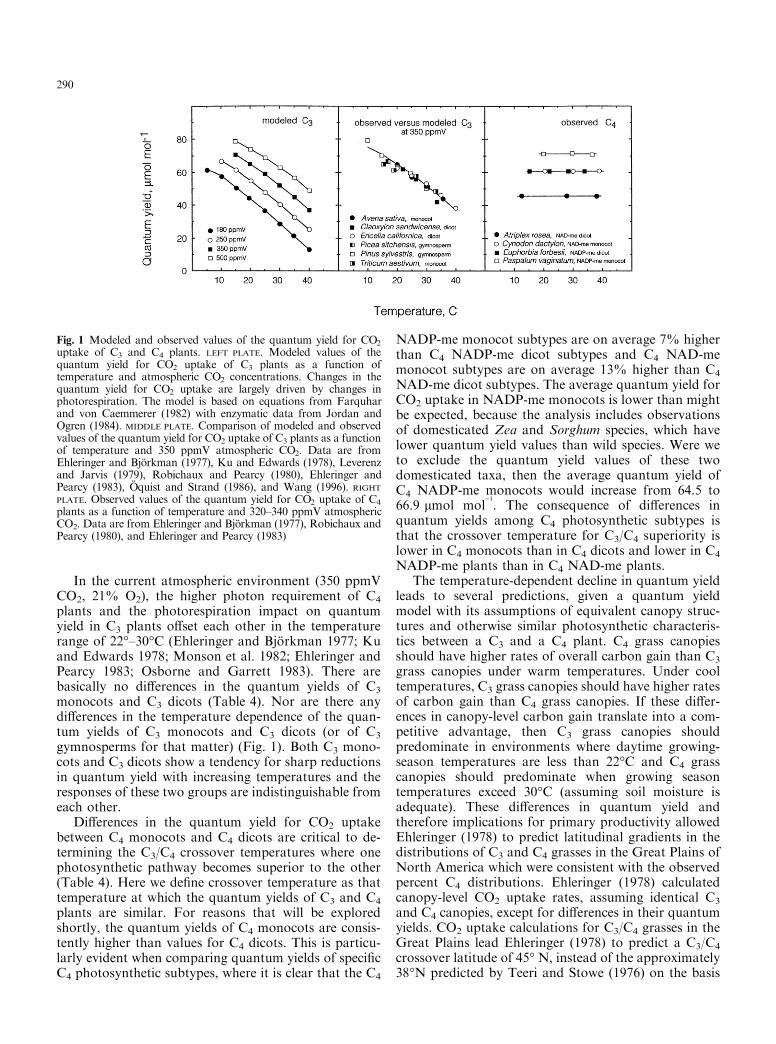
In the current atmospheric environment (350 ppmVCO2, 21% O2), the higher photon requirement of C4
plants and the photorespiration impact on quantumyield in C3 plants o�set each other in the temperaturerange of 22°±30°C (Ehleringer and BjoÈ rkman 1977; Kuand Edwards 1978; Monson et al. 1982; Ehleringer andPearcy 1983; Osborne and Garrett 1983). There arebasically no di�erences in the quantum yields of C3
monocots and C3 dicots (Table 4). Nor are there anydi�erences in the temperature dependence of the quan-tum yields of C3 monocots and C3 dicots (or of C3
gymnosperms for that matter) (Fig. 1). Both C3 mono-cots and C3 dicots show a tendency for sharp reductionsin quantum yield with increasing temperatures and theresponses of these two groups are indistinguishable fromeach other.
Di�erences in the quantum yield for CO2 uptakebetween C4 monocots and C4 dicots are critical to de-termining the C3/C4 crossover temperatures where onephotosynthetic pathway becomes superior to the other(Table 4). Here we de®ne crossover temperature as thattemperature at which the quantum yields of C3 and C4
plants are similar. For reasons that will be exploredshortly, the quantum yields of C4 monocots are consis-tently higher than values for C4 dicots. This is particu-larly evident when comparing quantum yields of speci®cC4 photosynthetic subtypes, where it is clear that the C4
NADP-me monocot subtypes are on average 7% higherthan C4 NADP-me dicot subtypes and C4 NAD-memonocot subtypes are on average 13% higher than C4
NAD-me dicot subtypes. The average quantum yield forCO2 uptake in NADP-me monocots is lower than mightbe expected, because the analysis includes observationsof domesticated Zea and Sorghum species, which havelower quantum yield values than wild species. Were weto exclude the quantum yield values of these twodomesticated taxa, then the average quantum yield ofC4 NADP-me monocots would increase from 64.5 to66.9 lmol mol
)1. The consequence of di�erences in
quantum yields among C4 photosynthetic subtypes isthat the crossover temperature for C3/C4 superiority islower in C4 monocots than in C4 dicots and lower in C4
NADP-me plants than in C4 NAD-me plants.The temperature-dependent decline in quantum yield
leads to several predictions, given a quantum yieldmodel with its assumptions of equivalent canopy struc-tures and otherwise similar photosynthetic characteris-tics between a C3 and a C4 plant. C4 grass canopiesshould have higher rates of overall carbon gain than C3
grass canopies under warm temperatures. Under cooltemperatures, C3 grass canopies should have higher ratesof carbon gain than C4 grass canopies. If these di�er-ences in canopy-level carbon gain translate into a com-petitive advantage, then C3 grass canopies shouldpredominate in environments where daytime growing-season temperatures are less than 22°C and C4 grasscanopies should predominate when growing seasontemperatures exceed 30°C (assuming soil moisture isadequate). These di�erences in quantum yield andtherefore implications for primary productivity allowedEhleringer (1978) to predict latitudinal gradients in thedistributions of C3 and C4 grasses in the Great Plains ofNorth America which were consistent with the observedpercent C4 distributions. Ehleringer (1978) calculatedcanopy-level CO2 uptake rates, assuming identical C3
and C4 canopies, except for di�erences in their quantumyields. CO2 uptake calculations for C3/C4 grasses in theGreat Plains lead Ehleringer (1978) to predict a C3/C4
crossover latitude of 45° N, instead of the approximately38°N predicted by Teeri and Stowe (1976) on the basis
Fig. 1 Modeled and observed values of the quantum yield for CO2
uptake of C3 and C4 plants. LEFT PLATE. Modeled values of thequantum yield for CO2 uptake of C3 plants as a function oftemperature and atmospheric CO2 concentrations. Changes in thequantum yield for CO2 uptake are largely driven by changes inphotorespiration. The model is based on equations from Farquharand von Caemmerer (1982) with enzymatic data from Jordan andOgren (1984). MIDDLE PLATE. Comparison of modeled and observedvalues of the quantum yield for CO2 uptake of C3 plants as a functionof temperature and 350 ppmV atmospheric CO2. Data are fromEhleringer and BjoÈ rkman (1977), Ku and Edwards (1978), Leverenzand Jarvis (1979), Robichaux and Pearcy (1980), Ehleringer andPearcy (1983), OÈ quist and Strand (1986), and Wang (1996). RIGHTPLATE. Observed values of the quantum yield for CO2 uptake of C4
plants as a function of temperature and 320±340 ppmV atmosphericCO2. Data are from Ehleringer and BjoÈ rkman (1977), Robichaux andPearcy (1980), and Ehleringer and Pearcy (1983)
290

of taxonomic abundance. Recently, Epstein et al. (1997)have used ®eld observations to calculate C3/C4 primaryproductivity patterns; they conclude that the crossoverlatitude is about 43°N. Tieszen et al. (1997) have eval-uated the C3/C4 crossover latitude based on bothprimary productivity observations and carbon isotoperatios of the organic soil matter in the upper soil layers,which should integrate over an extended multi-decadaltime period. Their conclusions are that the C3/C4
crossover latitude is around 43±45°N. Both studies arein solid agreement with predictions based on a physio-logical model that uses only di�erences in the quantumyield to estimate the overall success of one photosyn-thetic pathway over the other.
Variation in the quantum yields of C3 and C4 speciesis the only physiological mechanism proposed which canaccount for the observed geographic, biseasonal, andsun-shade distribution di�erences of C3/C4 grasses.Numerous studies from grasslands throughout theworld, including the Great Plains, have con®rmed theC3/C4 transition in grassland composition correlatedwith temperature along a geographic gradient (Table 2)or on an interseasonal basis (Ode et al. 1980; Barnes et al.1983; Monson et al. 1983; Boryslawski and Bentley1985) as predicted by the quantum yield model. It isunlikely that the strong agreements between predictionsof C3/C4 monocot transition based on quantum yieldmodeling analysis and ®eld observations are fortuitous.More likely, these tight correlations between quantumyield crossover temperatures and observed C3/C4 tran-sition distributions indicate that competitive interactionsin these grasslands are strong and that light-use e�-ciency plays a role in determining the competitive out-come of these interactions. The di�erential distributionpatterns of NADP-me and NAD-me grasses are con-sistent with the higher quantum yield of C4 NADP-megrasses providing a competitive advantage over C4
NAD-me grasses in ecosystems with higher productivityand higher leaf area index canopies.
Anatomical differences may contributeto a higher quantum yield in C4 monocots
What is the basis for the relatively higher quantum yieldsamong C4 monocots? While that question is largelyunresolved, one factor could be leaf venation patterns,since the quantum yield re¯ects the ratio of photosyn-thetic CO2 capture relative to photon capture ± withboth parameters expressed on a projected surface areabasis. In C4 photosynthesis, photon capture is not evenlydistributed, making relative photosynthetic cell ar-rangements important. This arises because the photo-synthetic carbon assimilation (PCA) cycle in C4
photosynthesis occurs in mesophyll cells containinglimited if any chlorophyll (Hatch 1987), especially inNAD-me plants. Therefore, little reducing power isgenerated in mesophyll cells that can be translocated tothe bundle sheath to o�set the increased ATP cost of the
C4 cycle. At the same time, the photosynthetic carbonreduction (PCR) cycle occurs in the bundle sheath cells(containing chlorophyll) surrounding the veins. Giventhis, decreasing the number of mesophyll cells in theinterveinal spaces across a leaf should have the e�ect ofincreasing the quantum yield because these cells wouldcontribute little to photon capture when the activities ofall cells are scaled to the leaf level and expressed on aprojected area basis. Hattersley (1984) analyzed themorphology of a large number of C3 and C4 grasses andconcluded that the PCA area per vein di�ered in thefollowing order: C3 > C4 NAD-me > C4 NADP-me,which is consistent with the argument presented above.He speculated that di�erences in the architectural con-struction of grass leaves were likely to be functionallysigni®cant and may be related to known di�erences inthe carbon isotope ratios among C4 subtypes.
There is ample evidence to suggest that interveinaldistances di�er in grass leaves (Hattersley and Watson1975; Kawamitsu et al. 1985; Ohsugi and Murata 1986;Dengler et al. 1994). In comparisons of C3 and C4 grassleaves, interveinal distances were closer in C4 grasses(x = 124 lm) than in C3 grasses (x = 304 lm)(Kawamitsu et al. 1985). Moreover, among C4 grasses,interveinal distances in C4 NADP-me grasses (x =89 lm) were shorter than C4 NAD-me grasses(x = 142 lm). In addition, NADP-me grasses havesuberized lamella that prevent apoplastic bundle sheathCO2 leakage out of the PCR cells, whereas NAD-megrasses do not (Hattersley 1987, 1992). Together, thepossibility of greater CO2 retention within PCR cells(which in¯uences net CO2 uptake) and a shorterinterveinal distance (which in¯uences e�ective photoncapture) should contribute to a higher quantum yield(light-use e�ciency) in C4 NADP-me over C4 NAD-megrass leaves.
A major di�erence in the anatomy of dicots andmonocots is the general tendency for tight parallel ve-nation in monocots versus a reticulate, multi-branchedvenation pattern in dicots. Unfortunately, we are un-aware of any studies that have quanti®ed interveinalspacing or PCA area per vein (PCR tissue) in dicotspecies, and so a direct comparison of monocots anddicots is not possible at this time. However, intuitively,the reticulate packing of veins within dicot leaves shouldincrease the fraction of the projected leaf area that isoccupied by PCA tissues, if PCR activities occur only inbundle sheath cells surrounding veins. We hypothesizethat this structural di�erence contributes to the reducedlight-use e�ciency of C4 NAD-me dicots relative to C4
NAD-me monocots and of C4 NADP-me dicots relativeto C4 NADP-me monocots.
Based upon general di�erences in the chloroplastcapacity to generate reducing energy within mesophyllcells (which is then translocated into the bundle sheathcells), one would expect a slightly higher light-use e�-ciency in all C4 NADP-me leaves relative to C4 NAD-meleaves. Yet other factors may be contributing to theenhanced quantum yields of C4 NADP-me dicots over
291

those of C4 NAD-me dicots. For instance, Herbst (1971)described an unusual cell arrangement in Euphorbia, oneof the relatively few NADP-me dicots, that e�ectivelydecreased the PCA-to-PCR ratio. In between the multi-branched veins of many Euphorbia leaves are short,isolated veinlets, consisting only of tracheids and asso-ciated bundle sheath cells. Because they are detachedfrom the leaf vein network, the isolated tracheids andbundle sheath cells are not associated with water ornutrient transport. Yet the bundle sheath cells in theseisolated veinlets contain PCR cells and are likely in-creasing the light-use e�ciency by the same means as thereduced interveinal distances in C4 NADP-me mono-cots. A functionally equivalent pattern may occur insome Salsola and Suaeda, where PCR activities occur ina ring that surrounds the entire leaf instead of beinglimited only to the vascular bundle tissues (Carolin et al.1975; Shomer-Ilan et al. 1975; P'yankov et al. 1997).
C4 species should be favoredin reduced atmospheric CO2
Ehleringer et al. (1991) proposed that declining atmo-spheric CO2 concentrations could be a major selectiveforce for the expansion of C4 ecosystems at the end ofthe Miocene. The palaeogeological and paleoecologicalevidence of the near simultaneous global expansion ofC4 ecosystems at the end of the Miocene (Cerling et al.1993, 1997a, b; Quade and Cerling 1995) implies acommon selective force, such as would be expected witha reduction in atmospheric CO2 conditions. The devel-opment of the Himalayas and the Tibetan Plateau,which exposed massive amounts of unweathered silicaterock in a climatic zone where carbonate formationwould then be high, may have been a mechanism for aglobal reduction in CO2 (Raymo and Ruddiman1992).
We modeled quantum yield for CO2 uptake in C3
plants as a function of both temperature and CO2 con-centration (Fig. 1), using the basic equations and pa-rameters to describe leaf-level photosynthesis (Farquharand von Caemmerer 1982; Jordan and Ogren 1984). Therange of CO2 concentrations was chosen to span thatrange thought to have occurred within the last severalmillion years, from a low of 180 ppmV during the glacialmaximum to a high of about 500 ppmV at the end of theMiocene (Jouzel et al. 1987; Berner 1991; Cerling 1991).The model predicts a family of quantum yield curves,each exhibiting a continual decrease in the quantumyield with increasing temperature and each indicatingthat the quantum yield at any speci®ed temperatureshould increase with CO2 concentration (Fig. 1 leftdiagram). The validity of this model was tested by acomparison of the predicted and observed quantumyields for C3 plants under current CO2 conditions (Fig. 1middle diagram). The extremely close association be-tween predicted and observed quantum yield valueslends credence to this modeling e�ort. We also com-
pared CO2 compensation points predicted by this modelwith extensive values summarized by Brooks and Far-quhar (1985) and again observed a very close agreementbetween modeled and observed results (data not shown).In contrast to C3 plants, the quantum yield for CO2
uptake in C4 plants does not change with temperatureand CO2 concentration over the biologically relevantrange of temperatures (Fig. 1 right diagram).
By comparing the temperature and CO2 dependenceof the quantum yields of C3 and C4 plants, one cancalculate the crossover temperature, which will be thedaytime temperature at which the quantum yields of C3
and C4 plants are identical for a given atmospheric CO2
concentration. When these crossover temperatures arecompiled (intersection of lines in left and right diagramsof Fig. 1), it is clear that the transition between C3 andC4 superiority is a function of both atmospheric CO2
and temperature (Fig. 2). Variation in the C3/C4 cross-over temperature occurs because of the dependence ofthe C3 quantum yield on both temperature and [CO2]/[O2] (Ehleringer and BjoÈ rkman 1977; Ku and Edwards1978). The inherent di�erences in quantum yields amongC4 monocots and C4 dicots (but not among C3 monocotsand C3 dicots) leads to fundamentally di�erent combi-nations of CO2 and temperature favoring C4 monocotsover C3 plants or C4 dicots over C3 plants (Fig. 2).
Considering a reasonable range of growing-seasontemperatures, the quantum yield model predicts thatboth monocot and dicot C4 species should be rare underglobally high CO2 concentrations, but expanding as at-mospheric CO2 levels decrease (Fig. 3). The C3/C4
crossover temperature for current CO2 concentrations(approximately 350 ppmV) is at about a daytimegrowing-season temperature of 21°C for C4 grasses
Fig. 2Modeled crossover temperatures of the quantum yield for CO2
uptake for monocots and dicots as a function of atmospheric CO2concentrations. The boundary conditions for both monocots anddicots are NADP-me C4 plants (upper boundaries) and NAD-me C4plants (lower boundaries). The crossover temperature is de®ned as thetemperature (for a particular atmospheric CO2 concentration) atwhich the quantum yields for CO2 uptake are equivalent for both theC3 and the C4 plant. Data are based on average values from Table 4
292
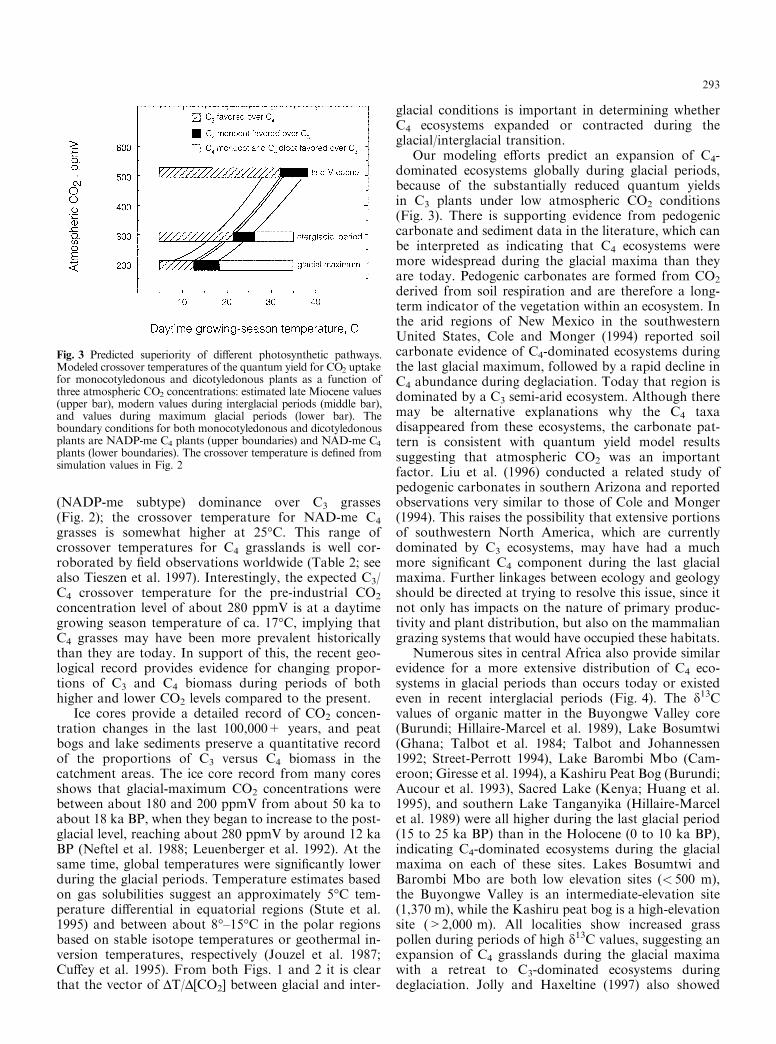
(NADP-me subtype) dominance over C3 grasses(Fig. 2); the crossover temperature for NAD-me C4
grasses is somewhat higher at 25°C. This range ofcrossover temperatures for C4 grasslands is well cor-roborated by ®eld observations worldwide (Table 2; seealso Tieszen et al. 1997). Interestingly, the expected C3/C4 crossover temperature for the pre-industrial CO2
concentration level of about 280 ppmV is at a daytimegrowing season temperature of ca. 17°C, implying thatC4 grasses may have been more prevalent historicallythan they are today. In support of this, the recent geo-logical record provides evidence for changing propor-tions of C3 and C4 biomass during periods of bothhigher and lower CO2 levels compared to the present.
Ice cores provide a detailed record of CO2 concen-tration changes in the last 100,000+ years, and peatbogs and lake sediments preserve a quantitative recordof the proportions of C3 versus C4 biomass in thecatchment areas. The ice core record from many coresshows that glacial-maximum CO2 concentrations werebetween about 180 and 200 ppmV from about 50 ka toabout 18 ka BP, when they began to increase to the post-glacial level, reaching about 280 ppmV by around 12 kaBP (Neftel et al. 1988; Leuenberger et al. 1992). At thesame time, global temperatures were signi®cantly lowerduring the glacial periods. Temperature estimates basedon gas solubilities suggest an approximately 5°C tem-perature di�erential in equatorial regions (Stute et al.1995) and between about 8°±15°C in the polar regionsbased on stable isotope temperatures or geothermal in-version temperatures, respectively (Jouzel et al. 1987;Cu�ey et al. 1995). From both Figs. 1 and 2 it is clearthat the vector of DT/D[CO2] between glacial and inter-
glacial conditions is important in determining whetherC4 ecosystems expanded or contracted during theglacial/interglacial transition.
Our modeling e�orts predict an expansion of C4-dominated ecosystems globally during glacial periods,because of the substantially reduced quantum yieldsin C3 plants under low atmospheric CO2 conditions(Fig. 3). There is supporting evidence from pedogeniccarbonate and sediment data in the literature, which canbe interpreted as indicating that C4 ecosystems weremore widespread during the glacial maxima than theyare today. Pedogenic carbonates are formed from CO2
derived from soil respiration and are therefore a long-term indicator of the vegetation within an ecosystem. Inthe arid regions of New Mexico in the southwesternUnited States, Cole and Monger (1994) reported soilcarbonate evidence of C4-dominated ecosystems duringthe last glacial maximum, followed by a rapid decline inC4 abundance during deglaciation. Today that region isdominated by a C3 semi-arid ecosystem. Although theremay be alternative explanations why the C4 taxadisappeared from these ecosystems, the carbonate pat-tern is consistent with quantum yield model resultssuggesting that atmospheric CO2 was an importantfactor. Liu et al. (1996) conducted a related study ofpedogenic carbonates in southern Arizona and reportedobservations very similar to those of Cole and Monger(1994). This raises the possibility that extensive portionsof southwestern North America, which are currentlydominated by C3 ecosystems, may have had a muchmore signi®cant C4 component during the last glacialmaxima. Further linkages between ecology and geologyshould be directed at trying to resolve this issue, since itnot only has impacts on the nature of primary produc-tivity and plant distribution, but also on the mammaliangrazing systems that would have occupied these habitats.
Numerous sites in central Africa also provide similarevidence for a more extensive distribution of C4 eco-systems in glacial periods than occurs today or existedeven in recent interglacial periods (Fig. 4). The d13Cvalues of organic matter in the Buyongwe Valley core(Burundi; Hillaire-Marcel et al. 1989), Lake Bosumtwi(Ghana; Talbot et al. 1984; Talbot and Johannessen1992; Street-Perrott 1994), Lake Barombi Mbo (Cam-eroon; Giresse et al. 1994), a Kashiru Peat Bog (Burundi;Aucour et al. 1993), Sacred Lake (Kenya; Huang et al.1995), and southern Lake Tanganyika (Hillaire-Marcelet al. 1989) were all higher during the last glacial period(15 to 25 ka BP) than in the Holocene (0 to 10 ka BP),indicating C4-dominated ecosystems during the glacialmaxima on each of these sites. Lakes Bosumtwi andBarombi Mbo are both low elevation sites (< 500 m),the Buyongwe Valley is an intermediate-elevation site(1,370 m), while the Kashiru peat bog is a high-elevationsite (>2,000 m). All localities show increased grasspollen during periods of high d13C values, suggesting anexpansion of C4 grasslands during the glacial maximawith a retreat to C3-dominated ecosystems duringdeglaciation. Jolly and Haxeltine (1997) also showed
Fig. 3 Predicted superiority of di�erent photosynthetic pathways.Modeled crossover temperatures of the quantum yield for CO2 uptakefor monocotyledonous and dicotyledonous plants as a function ofthree atmospheric CO2 concentrations: estimated late Miocene values(upper bar), modern values during interglacial periods (middle bar),and values during maximum glacial periods (lower bar). Theboundary conditions for both monocotyledonous and dicotyledonousplants are NADP-me C4 plants (upper boundaries) and NAD-me C4plants (lower boundaries). The crossover temperature is de®ned fromsimulation values in Fig. 2
293
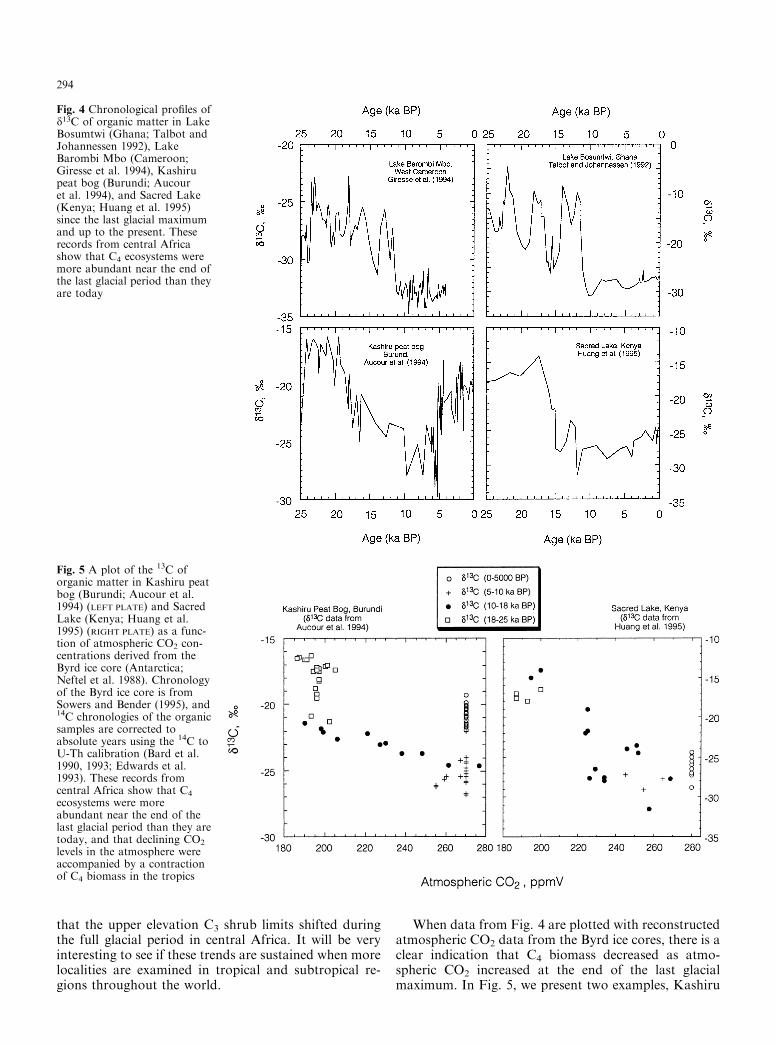
that the upper elevation C3 shrub limits shifted duringthe full glacial period in central Africa. It will be veryinteresting to see if these trends are sustained when morelocalities are examined in tropical and subtropical re-gions throughout the world.
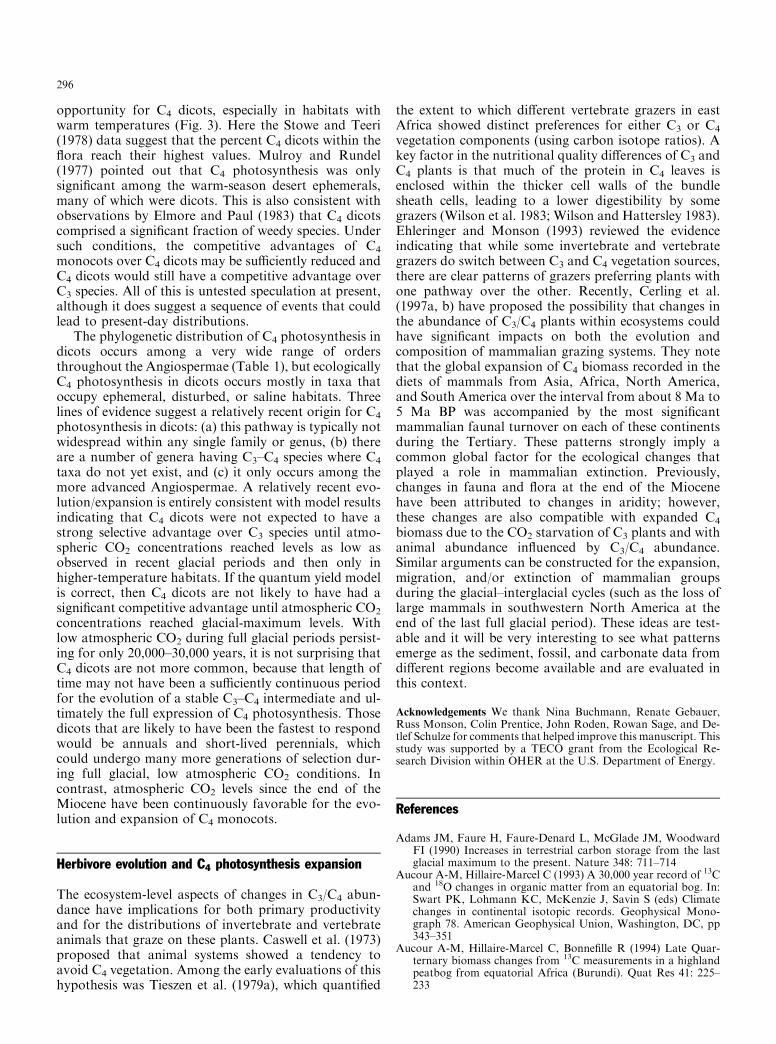
When data from Fig. 4 are plotted with reconstructedatmospheric CO2 data from the Byrd ice cores, there is aclear indication that C4 biomass decreased as atmo-spheric CO2 increased at the end of the last glacialmaximum. In Fig. 5, we present two examples, Kashiru
Fig. 4 Chronological pro®les ofd13C of organic matter in LakeBosumtwi (Ghana; Talbot andJohannessen 1992), LakeBarombi Mbo (Cameroon;Giresse et al. 1994), Kashirupeat bog (Burundi; Aucouret al. 1994), and Sacred Lake(Kenya; Huang et al. 1995)since the last glacial maximumand up to the present. Theserecords from central Africashow that C4 ecosystems weremore abundant near the end ofthe last glacial period than theyare today
Fig. 5 A plot of the 13C oforganic matter in Kashiru peatbog (Burundi; Aucour et al.1994) (LEFT PLATE) and SacredLake (Kenya; Huang et al.1995) (RIGHT PLATE) as a func-tion of atmospheric CO2 con-centrations derived from theByrd ice core (Antarctica;Neftel et al. 1988). Chronologyof the Byrd ice core is fromSowers and Bender (1995), and14C chronologies of the organicsamples are corrected toabsolute years using the 14C toU-Th calibration (Bard et al.1990, 1993; Edwards et al.1993). These records fromcentral Africa show that C4
ecosystems were moreabundant near the end of thelast glacial period than they aretoday, and that declining CO2
levels in the atmosphere wereaccompanied by a contractionof C4 biomass in the tropics
294

Peat Bog (Burundi) and Sacred Lake (Kenya), of thispattern. This relationship is remarkably consistent withthe C3/C4 crossover pattern predicted in Fig. 2. Withend member d13C values of )27& for C3 and )15& forC4, the C3/C4 transition at these sites is predicted to haveoccurred at about 210±220 ppmV.
Recent global modeling studies of biome distribu-tions during the last glacial maximum do not provide aclear picture of the extent of C4-dominated ecosystems,although there is a trend for more extensive grasslandsand savannas than observed now (Adams et al. 1990;van Campo et al. 1993; Crowley 1995). Crowley (1990,1995) suggested that changes in the marine carbon iso-tope ratio record could be interpreted as suggesting thatC4 plants were more extensive during the full glacialperiod than they are today, although this point has beenchallenged by Prentice and Sarnthein (1993).
Atmospheric CO2 levels greater than about 500ppmV favor C3 photosynthesis under most global con-ditions (Fig. 2). While the palaeo record of atmosphericCO2 levels is poorly known, geological evidence iscompatible with much higher CO2 levels in the Mesozoic(ca. 220±65 Ma BP). Modeling of the global carbonbudget indicates high CO2 levels for most of the Meso-zoic (Berner 1991, 1994), and the palaeosol CO2 ba-rometer also indicates CO2 levels >1,000 ppmV for theMesozoic (Cerling 1991; Ehleringer and Cerling 1995). Ifthese levels are correct, then CO2 concentration levelsdeclined in the Tertiary and crossed a threshold whereC4 plants would have a competitive advantage. Studiesof fossil soils (Quade et al. 1989; Quade and Cerling1995) and fossil tooth enamel (Cerling et al. 1993, 1997a,b) indicate that abundant C4 biomass suddenly appearedin North America, South America, southern Asia, andAfrica between 8 and 6 million years ago, perhaps inresponse to atmospheric CO2 levels declining throughthe window where C4 plants were now more e�cientthan C3 plants.
Why are C4 dicots at a disadvantage comparedto C4 monocots?
While the palaeogeological literature does not allow oneto specify whether it was C4 monocots, C4 dicots, orboth that expanded globally at the end of the Miocene,the available evidence suggests that the C4 expansionoccurred in grasslands and savannahs. These ecosystemsare currently dominated by C4 monocots and there is noevidence to indicate that C4 dicots were ever signi®cantcomponents of these ecosystems. The modeling results inFig. 3 strongly suggest that C4 monocots would havebeen more e�cient and thus more likely selected over C4
dicots as atmospheric CO2 decreased. One can speculateon the extent to which each C4 group would have beenfavored by natural selection as global CO2 decreasedthrough analyses of three major time periods: the end ofthe Miocene, recent glacial periods, and recent inter-glacial periods. Global CO2 concentrations are known
to have averaged 180±200 ppmV during glacial periodsand 270±290 ppmV during interglacial periods (Jouzelet al. 1987). The atmospheric CO2 concentration at theend of the Miocene has not yet been quanti®ed, but 500ppmV is not unreasonable (Berner 1991; Cerling 1991).
Examining plant responses at these three atmosphericCO2 concentrations, C4 photosynthesis is expected tohave been selected ®rst in the warmest ecosystems asatmospheric CO2 decreased through time (Fig. 3). Atthe end of the Miocene, we speculate that C4 photo-synthesis would have been favored in only the warmestof terrestrial ecosystems with adequate soil moisture.Given the reduced photorespiration rates that would beexpected to have occurred in C3 plants, only NADP-memonocots would have had a selective advantage over C3
plants in these warm ecosystems. It is likely that summerprecipitation (monsoons) would have played a key rolein allowing NADP-me monocots to prosper under thesehigh temperature conditions. As global CO2 concentra-tions decreased to current and ultimately to interglacialconcentrations, C4 photosynthesis is predicted to haveexpanded into even cooler ecosystems than predicted forthe late Miocene (Fig. 3). Most of this expansion ispredicted to have been C4 NADP-me and C4 NAD-memonocots. The C4 dicots are predicted to have had anadvantage only in the warmest or saline ecosystems andthen only under low CO2 conditions. Even then, C4
dicots would be at a competitive disadvantage to C4
monocots unless a factor such as disturbance played asigni®cant role. However, we propose that it is not untilthe modern glacial periods (last 3 million years) that theglobal CO2 concentrations would become low enoughfor C4 dicots to have expanded beyond the warmestecosystems (Fig. 3).
Given that quantum yields of C4 dicots tend to belower than those of C4 monocots, there are limitedcanopy-level situations in which C4 dicots have a com-petitive advantage over C4 monocots. The quantumyield model predicts that competitive situations withequivalent canopy stature should favor the C4 monocotsover the C4 dicots. However, given the woody nature ofmost dicots, secondary growth and a perennial habitwould provide dicots with a mechanism to overshadow ashorter monocot. Upon closer examination though,most C4 dicots, with the exception of some Chenopodia-ceae and Euphorbiaceae tuxa, are annuals or nonwoodyperennials and so there are few realistic opportunities torealize a C4 dicot competitive advantage.
Success of the C4 monocots may also have been in-¯uenced by their growth habit with a basal meristem,since monocots have a signi®cant meristematic advan-tage over dicots in their response to grazing pressure.Evolution of grasslands preceded the appearance of the®rst known C4 taxa, implying that C4 taxa originatingwithin the monocots would have had a signi®cantgrazing-tolerance advantage over dicots. This may havebeen enough to provide an early advantage for C4
monocots over C4 dicots. Disturbance or habitats with ashort growing season, however, may provide a selective
295
opportunity for C4 dicots, especially in habitats withwarm temperatures (Fig. 3). Here the Stowe and Teeri(1978) data suggest that the percent C4 dicots within the¯ora reach their highest values. Mulroy and Rundel(1977) pointed out that C4 photosynthesis was onlysigni®cant among the warm-season desert ephemerals,many of which were dicots. This is also consistent withobservations by Elmore and Paul (1983) that C4 dicotscomprised a signi®cant fraction of weedy species. Undersuch conditions, the competitive advantages of C4
monocots over C4 dicots may be su�ciently reduced andC4 dicots would still have a competitive advantage overC3 species. All of this is untested speculation at present,although it does suggest a sequence of events that couldlead to present-day distributions.
The phylogenetic distribution of C4 photosynthesis indicots occurs among a very wide range of ordersthroughout the Angiospermae (Table 1), but ecologicallyC4 photosynthesis in dicots occurs mostly in taxa thatoccupy ephemeral, disturbed, or saline habitats. Threelines of evidence suggest a relatively recent origin for C4
photosynthesis in dicots: (a) this pathway is typically notwidespread within any single family or genus, (b) thereare a number of genera having C3±C4 species where C4
taxa do not yet exist, and (c) it only occurs among themore advanced Angiospermae. A relatively recent evo-lution/expansion is entirely consistent with model resultsindicating that C4 dicots were not expected to have astrong selective advantage over C3 species until atmo-spheric CO2 concentrations reached levels as low asobserved in recent glacial periods and then only inhigher-temperature habitats. If the quantum yield modelis correct, then C4 dicots are not likely to have had asigni®cant competitive advantage until atmospheric CO2
concentrations reached glacial-maximum levels. Withlow atmospheric CO2 during full glacial periods persist-ing for only 20,000±30,000 years, it is not surprising thatC4 dicots are not more common, because that length oftime may not have been a su�ciently continuous periodfor the evolution of a stable C3±C4 intermediate and ul-timately the full expression of C4 photosynthesis. Thosedicots that are likely to have been the fastest to respondwould be annuals and short-lived perennials, whichcould undergo many more generations of selection dur-ing full glacial, low atmospheric CO2 conditions. Incontrast, atmospheric CO2 levels since the end of theMiocene have been continuously favorable for the evo-lution and expansion of C4 monocots.
Herbivore evolution and C4 photosynthesis expansion
The ecosystem-level aspects of changes in C3/C4 abun-dance have implications for both primary productivityand for the distributions of invertebrate and vertebrateanimals that graze on these plants. Caswell et al. (1973)proposed that animal systems showed a tendency toavoid C4 vegetation. Among the early evaluations of thishypothesis was Tieszen et al. (1979a), which quanti®ed
the extent to which di�erent vertebrate grazers in eastAfrica showed distinct preferences for either C3 or C4
vegetation components (using carbon isotope ratios). Akey factor in the nutritional quality di�erences of C3 andC4 plants is that much of the protein in C4 leaves isenclosed within the thicker cell walls of the bundlesheath cells, leading to a lower digestibility by somegrazers (Wilson et al. 1983; Wilson and Hattersley 1983).Ehleringer and Monson (1993) reviewed the evidenceindicating that while some invertebrate and vertebrategrazers do switch between C3 and C4 vegetation sources,there are clear patterns of grazers preferring plants withone pathway over the other. Recently, Cerling et al.(1997a, b) have proposed the possibility that changes inthe abundance of C3/C4 plants within ecosystems couldhave signi®cant impacts on both the evolution andcomposition of mammalian grazing systems. They notethat the global expansion of C4 biomass recorded in thediets of mammals from Asia, Africa, North America,and South America over the interval from about 8 Ma to5 Ma BP was accompanied by the most signi®cantmammalian faunal turnover on each of these continentsduring the Tertiary. These patterns strongly imply acommon global factor for the ecological changes thatplayed a role in mammalian extinction. Previously,changes in fauna and ¯ora at the end of the Miocenehave been attributed to changes in aridity; however,these changes are also compatible with expanded C4
biomass due to the CO2 starvation of C3 plants and withanimal abundance in¯uenced by C3/C4 abundance.Similar arguments can be constructed for the expansion,migration, and/or extinction of mammalian groupsduring the glacial±interglacial cycles (such as the loss oflarge mammals in southwestern North America at theend of the last full glacial period). These ideas are test-able and it will be very interesting to see what patternsemerge as the sediment, fossil, and carbonate data fromdi�erent regions become available and are evaluated inthis context.
Acknowledgements We thank Nina Buchmann, Renate Gebauer,Russ Monson, Colin Prentice, John Roden, Rowan Sage, and De-tlef Schulze for comments that helped improve this manuscript. Thisstudy was supported by a TECO grant from the Ecological Re-search Division within OHER at the U.S. Department of Energy.
References
Adams JM, Faure H, Faure-Denard L, McGlade JM, WoodwardFI (1990) Increases in terrestrial carbon storage from the lastglacial maximum to the present. Nature 348: 711±714
Aucour A-M, Hillaire-Marcel C (1993) A 30,000 year record of 13Cand 18O changes in organic matter from an equatorial bog. In:Swart PK, Lohmann KC, McKenzie J, Savin S (eds) Climatechanges in continental isotopic records. Geophysical Mono-graph 78. American Geophysical Union, Washington, DC, pp343±351
Aucour A-M, Hillaire-Marcel C, Bonne®lle R (1994) Late Quar-ternary biomass changes from 13C measurements in a highlandpeatbog from equatorial Africa (Burundi). Quat Res 41: 225±233
296
Bard E, Hamelin B, Fairbanks RG, Zindler A (1990) Calibration ofthe 14C timescale over the past 30,000 years using mass spectro-metric U-Th ages from Barbados corals. Nature 345: 405±410
Bard E, Arnold M, Fairbanks RG, Hamelin B (1993) 230Th-234Uand 14C ages obtained by mass spectrometry on corals. Ra-diocarbon 35: 191±199
Barnes PW, Tieszen LL, Ode DJ (1983) Distribution, production,and diversity of C3- and C4-dominated communities in a mixedprairie. Can J Bot 61: 741±751
Baruch Z, Ludlow MM, Davis R (1985) Photosynthetic responsesof native and introduced C4 grasses from Venezuelan savannas.Oecologia 67: 388±393
Batanouny KH, S®chler W, Ziegler H (1991) Photosyntheticpathways and ecological dstribution of Euphorbia species inEgypt. Oecologia 87: 565±569
Berner, RA (1991) A model for atmospheric CO2 over Phanerozoictime. Am J Sci 291: 339±376
Berner, RA (1994) GEOCARB II: a revised model of atmosphericCO2 over Phanerozoic time. Am J Sci 294: 56±91
Boryslawski Z, Bentley BL (1985) The e�ect of nitrogen and clip-ping on interference between C3 and C4 grasses. J Ecol 73: 113±121
Boutton TW, Harrison AT, Smith BN (1980) Distribution of bio-mass of species di�ering in photosynthetic pathway along analtitudinal transect in southeastern Wyoming grassland. Oeco-logia 45: 287±298
Brooks A, Farquhar GD (1985) E�ect of temperature on the CO2/O2 speci®city of ribulose-1,5-bisphosphate carboxylase/oxy-genase and the rate of respiration in the light. Planta 165: 397±406
Brown WV (1977) The Kranz syndrome and its subtypes in grasssystematics. Mem Torrey Bot Club 23: 1±97
Buchmann N, Brooks JR, Rapp KD, Ehleringer JR (1996) Carbonisotope composition of C4 grasses is in¯uenced by light andwater supply. Plant Cell Environ 9: 392±402
Campo van E, Guiot J, Peng C (1993) A data-based re-appraisal ofthe terrestrial carbon budget at the last glacial maximum.Global Planet Change 8: 189±201
Carolin RC, Jacobs WL, Vesk M (1975) Leaf structure in Cheno-podiaceae. Bot Jahrb Syst P¯anzengesch P¯anzengeogr 95:225±255
Caswell H, Reed F, Stephenson SN, Werner PA (1973) Photo-synthetic pathways and selective herbivory: a hypothesis. AmNat 107: 465±479
Cavagnaro JB (1988) Distribution of C3 and C4 grasses at di�erentaltitudes in a temperate arid region of Argentina. Oecologia 76:273±277
Cerling TE (1991) Carbon dioxide in the atmosphere: evidencefrom Cenozoic and Mesozoic paleosols. Am J Sci 291: 377±400
Cerling TE, Wang Y, Quade J (1993) Expansion of C4 ecosystemsas an indicator of global ecological change in the late Miocene.Nature 361: 344±345
Cerling TE, Ehleringer JR, Harris JM (1997a) Carbon dioxidestarvation, the development of C4 ecosystems, and mammalianevolution. Proc Roy Soc Lond (in press)
Cerling TE, Harris JM, MacFadden BJ, Leakey MG, Quade J,Eisemann V, Ehleringer JR (1997b) Global vegetation changethrough the Miocene-Pliocene boundary. Nature (in press)
Chase MW, Soltis DE, Olmstead RG, Morgan D, Les DH, MishlerBD, Duvall MR, Price RA, Hills HG, Qiu Y-L, Kron KA,Rottig JH, Conti E, Palmer JD, Manhart JR, Sytsma KJ, Mi-chaels HJ, Kress WJ, Karol KG, Clark WD, Hedre n M, GautBS, Jansen RK, Kim K-J, Wimpee CF, Smith JF, Furnier GR,Strauss SH, Xiang Q-Y, Plunkett GM, Soltis PS, Swensen SM,Williams SE, Gadek PA, Quinn CJ, Eguiarte LE, Golenberg E,Learn GH Jr., Graham SW, Barrett SCH, Dayanandan S, Al-bert VA (1993) Phylogenetics of seed plants: an analysis ofnucleotide sequences from the plastid gene rbcL. Ann Mo BotGard 80: 528±580
Chazdon RL (1978) Ecological aspects of the distribution of C4
grasses in selected habitats of Costa Rica. Biotropica 10: 265±269
Cole DR, Monger HC (1994) In¯uence of atmospheric CO2 on thedecline of C4 plants during the last deglaciation. Nature 368:533±536
Collins RP, Jones MB (1985) The in¯uence of climatic factorson the distribution of C4 species in Europe. Vegetatio 64: 121±129
Cowling RM (1983) The occurrence of C3 and C4 grasses in fynbosand allied shrublands in the South Eastern Cape, South Africa.Oecologia 58: 121±127
Crowley TJ (1991) Ice age carbon. Nature 352: 575±576Crowley TJ (1995) Ice age terrestrial carbon changes revisited.
Global Biogeochem Cycles 9: 377±389Cu�ey KM, Clow GD, Alley RB, Stuiver M, Waddington ED,
Saltus RW (1995) Large Arctic temperature change at theWisconsin-Holocene glacial transition. Science 270: 455±458
Das VSR, Raghavendra AS (1976) C4 photosynthesis and a uniquetype of Kranz anatomy in Glossocordia boswallaea (Asteraceae).Proc Indian Acad Sci 84B: 12±19
Das VSR, Vats SK (1993) A Himalayan monsoonal locationexhibiting unusually high preponderance of C4 grasses. Photo-synthetica 28: 91±97
Dengler NG, Dengler RE, Donnelly PM, Hattersley PW (1994)Quantitative leaf anatomy of C3 and C4 grasses (Poaceae):bundle sheath and mesophyll surface area relationships. AnnBot 73: 241±255
Doliner LH, Jolli�e PA (1979) Ecological evidence concerning theadaptive signi®cance of the C4 dicarboxylic acid pathway ofphotosynthesis. Oecologia 38: 23±34
Downton WJS (1975) The occurrence of C4 photosynthesis amongplants. Photosynthetica 9: 96±105
Edwards RL, Beck JW, Burr GS, Donahue DJ, Chappell JMA,Bloom AL, Dru�el ERM, Taylor FW (1993) A large drop inatmospheric 14C/12C and reduced melting in the Younger Dryas,documented with 230Th ages of corals. Science 260: 962±968
Ehleringer JR (1978) Implications of quantum yield di�erences tothe distributions of C3 and C4 grasses. Oecologia 31: 255±267
Ehleringer J, BjoÈ rkman O (1977) Quantum yields for CO2 uptakein C3 and C4 plants: dependence on temperature, CO2 and O2
concentrations. Plant Physiol 59: 86±90Ehleringer JR, Cerling TE (1995) Atmospheric CO2 and the ratio
of intercellular to ambient CO2 levels in plants. Tree Physiol 15:105±111
Ehleringer JR, Monson RK (1993) Evolutionary and ecologicalaspects of photosynthetic pathway variation. Annu Rev EcolSyst 24: 411±439
Ehleringer JR, Pearcy RW (1983) Variation in quantum yields forCO2 uptake among C3 and C4 plants. Plant Physiol 73: 555±559
Ehleringer JR, Sage RF, Flanagan LB, Pearcy RW (1991) Climatechange and the evolution of C4 photosynthesis. Trends EcolEvol 6: 95±99
Ellis RP, Vogel JC, Fuls A (1980) Photosynthetic pathways and thegeographical distribution of grasses in South West Africa/Namibia. S Afr J Sci 76: 307±314
Elmore CD, Paul RN (1983) Composite list of C4 weeds. Weed Sci31: 686±692
Epstein HE, Lauenroth WK, Burke IC, Co�n DP (1997) Pro-ductivity patterns of C3 and C4 functional types in the U.S.Great Plains. Ecology 78: 722±731
Farquhar GD, Caemmerer von S (1982) Modelling of photosyn-thetic response to environmental conditions. In: Lange OL,Nobel PS, Osmond CB, Ziegler H (eds) Physiological plantecology II. Springer, Berlin, Heidelberg New York. pp 549±587
Glagoleva TA, Chulanovskaya MV (1992) Photosynthetic meta-bolism in plants of the family Chenopodiaceae from avid salineregions, Soviet Plant Physiol. 39: 431±437
Giresse P, Maley J, Brenac P (1994) Late Quaternary palaeoenvi-ronments in Lake Barombi Mbo (West Cameroon) deducedfrom pollen and carbon isotopes of organic matter. PaleogeogrPalaeoclimatol Palaeoecol 107: 65±78
Hatch MD (1987) C4 photosynthesis: a unique blend of modi®edbiochemistry, anatomy and ultrastructure. Biochim BiophysActa 895: 81±106
297

Hattersley PW (1983) The distribution of C3 and C4 grasses inAustralia in relation to climate. Oecologia 57: 113±128
Hattersley PW (1984) Characterization of C4 type leaf anatomy ingrasses (Poaceae). Mesophyll:bundles sheath area ratios. AnnBot 53: 163±179
Hattersley PW (1987) Variations in photosynthetic pathway. In:Soderstrom TR, Hilu KW, Campbell CDS, Barkworth ME(eds) Grass systematics and evolution. Smithsonian InstitutionPress, Washington, DC, pp 49±64
Hattersley PW (1992) C4 photosynthetic pathway variation ingrasses (Poaceae): its signi®cance for arid and semi-arid lands.In: Deserti®ed grasslands: their biology and management.Linnean Society, London, pp 181±212
Hattersley PW, Watson L (1975) Anatomical parameters for pre-dicting photosynthetic pathways of grass leaves: the `maximumlateral cell count' and the `maximum cell distance count'.Phytomorphology 25: 325±333
Hattersley PW, Watson L (1992) Diversi®cation of photosynthesis.In: Chapman GP (ed) Grass evolution and domestication.Cambridge University Press, Cambridge, pp 38±116
Herbst D (1971) Disjunct foliar veins in Hawaiian Euphorbia.Science 171: 1247±1248
Hesla BI, Tieszen LL, Imbamba SK (1982) A systematic survey ofC3 and C4 photosynthesis in the Cyperaceae of Kenya, EastAfrica. Photosynthetica 16: 196±205
Hillaire-Marcel C, Aucour A-M, Bonne®lle R, Riollet G,Vincens A, Williamson D (1989) 13C/palynological evidence ofdi�erential residence times of organic carbon prior to its sedi-mentation in East African rift lakes and peat bogs. Quat SciRev 8: 207±212
Holm LG, Plicknett DL, Pancho JV, Herberger JP (1977) Theworld's worst weeds: distribution and biology. University Press,Honolulu
Huang Y, Street-Perrott FA, Perrott RA, Eglinton G (1995) Mo-lecular and carbon isotope stratigraphy of a glacial/interglacialsediment sequence from a tropical freshwater lake: Sacred Lake,Mt. Kenya. In: Grimalt JO, Dorronsoro C (eds) Organic geo-chemistry: developments and applications to energy, climate,environment and human history. AIGOA, Spain, pp 826±829
Hunt ER Jr, Weber JA, Gates DM (1985) E�ects of nitrate appli-cation on Amaranthus powellii Wats. Plant Physiol 79: 609±613
Imbamba SK, Papa G (1979) Distribution of the Kranz typeanatomy in some dicotyledonous families of Kenya. Photo-synthetica 13: 315±322
Jolly D, Haxeltine A (1997) E�ect of low atmospheric CO2 ontropical African montane vegetation. Science 276: 786±788
Jordan DB, Ogren WL (1984) The CO2/O2 speci®city of ribulose1,5-bisphosphate carboxylase/oxygenase. Planta 161: 308±313
Jouzel J, Lorius C, Petit J R, Genthon C, Barkov N I, KotlyakovV M, Petrov V M (1987) Vostok ice core: a continuous isotopetemperature record over the last climatic cycle (160,000 years).Nature 329: 403±408
Kalapos T, Baloghne -Nyakas, Csontos P (1997) Occurrence andecological characteristics of C4 dicot and Cyperacene species inthe Hungarian ¯ora. Photosynthetica 33: 227±240
Kawamitsu Y, Hakoyama S, Agata W, Takeda T (1985) Leafinterveinal distances corresponding to anatomical types ingrasses. Plant Cell Physiol 21: 589±593
Kirschbaum MUF, Farquhar GD (1987) Investigation of the CO2
dependence of quantum yield and respiration in Eucalyptuspauci¯ora. Plant Physiol 83: 1032±1036
Ku SB, Edwards GE (1978) Oxygen inhibition of photosynthesis.III. Temperature dependence of quantum yield and its relationto O2/CO2 solubility ratio. Planta 140: 1±6
Leuenberger M, Siegenthaler U, Langway CC (1992) Carbon iso-tope composition of atmospheric CO2 during the last ice agefrom an Antarctic ice core. Nature 357: 488±490
Leverenz JW, Jarvis PG (1979) Photosynthesis in sitka spruce.VIII. The e�ects of light ¯ux density and direction on the rate ofnet photosynthesis and the stomatal conductance of needles. JAppl Ecol 16: 919±932
Leverenz JW, OÈ quist G (1987) Quantum yields of photosynthesis attemperatures between )2°C and 35°C in a cold-tolerant C3
plant (Pinus sylvestris) during the course of one year. Plant CellEnviron 10: 287±295
Li MR (1993) Distribution of C3 and C4 species of Cyperus inEurope. Photosynthetica 28: 119±126
Liu B, Phillips FM, Campbell AR (1996) Stable carbon and oxygenisotopes of pedogenic carbonates, Ajo Mountains, southernArizona: implications for paleoenvironmental change. Pal-aeogeogr Palaeoclimatol Palaeoecol 124: 233±246
Livingstone DA, Clayton WD (1980) An altitudinal cline in trop-ical African grass ¯oras and its paleoecological signi®cance.Quat Res 13: 392±402
Maten AI (1993) A revised list of the European C4 plants Photo-synthetica 26: 323±331
Melillo JM, McGuire AD, Kicklighter DW, Moore B III, Voros-marty CJ, Schloss AL (1993) Global climate change andterrestrial net primary production. Nature 363: 234±240
Monson RK (1989) On the evolutionary pathways resulting in C4
photosynthesis and Crassulacean acid metabolism. Adv EcolRes 19: 57±110
Monson RK, Littlejohn RO, Williams GJ (1982) The quantumyield for CO2 uptake in C3 and C4 grasses. Photosynth Res 3:153±159
Monson RK, Littlejohn RO, Williams GJ (1983) Photosyntheticadaptation to temperature in four species from the Coloradoshortgrass steppe: a physiological model for coexistence. Oe-cologia 58: 43±51
Monson RK, Edwards GE, Ku MSB (1984) C3-C4 intermediatephotosynthesis in plants. Bioscience 34: 563±574
Monson RK, Moore BD, Ku MSB, Edwards GE (1986) Co-function of C3- and C4-photosynthetic pathways in C3, C4, andC3-C4 intermediate Flaveria species. Planta 168: 493±502
Monson RK, Schuster WS, Ku MSB (1987) Photosynthesis inFlaveria brownii A.M. Powell. Plant Physiol 85: 1063±1067
Mulroy TW, Rundel PW (1977) Annual plants: adaptations todesert environments. Bioscience 27: 109±114
Myers BA, Neales TF, Jones MB (1990) The in¯uence of salinityon growth, water relations, and photosynthesis in Diplachnefusca (L) P Beauv Ex Roemer and Schultes. Aust J PlantPhysiol 17: 675±691
Neftel A, Oeschger H, Sta�elbach T, Stau�er B (1988) CO2 recordin the Byrd ice core 50,000±5,000 years BP. Nature 331: 609±611
Ode DJ, Tieszen LL, Lerman JC (1980) The seasonal contributionof C3 and C4 plant species to primary production in a mixedprairie. Ecology 61: 1304±1311
Okuda T (1987) The distribution of C3 and C4 graminoids on thesemi-natural grasslands of southwestern Japan. J Jpn Grass Sci33: 175±184
Okuda T, Furukawa A (1990) Occurrence and distribution of C4
plants in Japan. Jpn J Ecol 40: 91±121OÈ quist G, Strand M (1986) E�ects of frost hardening on photo-synthetic quantum yield, chlorophyll organization and energydistribution between the two photosystems in Scots pine. Can JBot 64: 748±753
Osborne BA, Garrett MK (1983) Quantum yields for CO2 uptakein some diploid and tetraploid plant species. Plant Cell Environ6: 135±144
Oshugi R, Murata T (1986) Variations in the leaf anatomy amongsome C4 Panicum species. Ann Bot 58: 443±453
Osmond CB, Winter K, Ziegler H (1982) Functional signi®cance ofdi�erent pathways of CO2 ®xation in photosynthesis. In: LangeOL, Nobel PS, Osmond CB, Ziegler H (eds) Physiological plantecology II. Springer, Berlin, Heidelberg, New York, pp 479±547
Paruelo JM, Lauenroth WK (1996) Relative abundance of plantfunctional types in grasslands and shrublands of North Amer-ica. Ecol Appl 6: 1212±1224
Pearcy RW, Franceschi VR (1986) Photosynthetic characteristicsand chloroplast ultrastructure of C3 and C4 tree species grown inhigh- and low-light environments. Photosynth Res 9: 317±331
298
Pearcy RW, Osteryoung K, Randall D (1982) Carbon dioxide ex-change characteristics of C4 Hawaiian Euphorbia species nativeto diverse habitats. Oecologia 55: 333±341
Prentice IC, Sarnthein M (1993) Self-regulatory processes in thebiosphere in the face of climate change. In: Eddy JA,Oeschger H (eds) Global changes in the perspective of the past.Wiley, New York, pp 29±38
P'yankov VI (1997) C4-species of high-mountain deserts in easternPamir. Russian J Ecol 24: 156±160
P'yankov VI, Mokronosov AT (1993) General trends in changes ofthe earth's vegetation reltaed to global warming. Russian JPlant Physiol 40: 443±458
P'yankov V, Voznesenskaya EV, Kondratschuk AV, Black CC Jr(1997) A comparative anatomical and biochemical analysis inSalsola (Chenopodiaceae) species with and without a Kranztype leaf anatomy: a possible reversion of C4 to C3 photosyn-thesis. Am J Bot 84: 597±606
Quade J, Cerling TE (1995) Expansion of C4 grasses in the LateMiocene of Northern Pakistan: Evidence from stable isotopesin paleosols. Palaeogeogr Palaeoclimatol Palaeoecol 115: 91±116
Quade J, Cerling TE, Bowman JR (1989) Development of Asianmonsoon revealed by marked ecological shift during the latestMiocene in Northern Pakistan. Nature 342: 163±166
Raghavendra AS, Das VSR (1978) The occurrence of C4-photo-synthesis: a supplementary list of C4 plants reported during late1974±1977. Planta 12: 200±208
Raymo ME, Ruddiman WF (1992) Tectonic forcing of lateCenozoic climate. Nature 359: 117±122
Robichaux RH, Pearcy RW (1980) Photosynthetic responses of C3
and C4 species from cool shaded habitats in Hawaii. Oecologia47: 106±109
Ruimy A, Jarvis PG, Baldocchi DD, Saugier B (1995) CO2 ¯uxesover plant canopies and solar radiation: a review. Adv Ecol Res26: 1±68
Rundel PW (1980) The ecological distribution of C4 and C3 grassesin the Hawaiian Islands. Oecologia 45: 354±359
Sankhla N, Ziegler H (1975) Eco-physiological studies on Indianarid zone plants. Oecologia 21: 123±129
Schulze E-D, Ellis R, Schulze W, Trimborn P, Ziegler H (1996)Diversity, metabolic types and d13C carbon isotope ratios in thegrass ¯ora of Namibia in relation to growth form, precipitationand habitat conditions. Oecologia 106: 352±369
Schwarz AG, Redmann RE (1989) Photosynthetic properties of C4
grass (Spartina gracilis Trin.) from northern environment.Photosynthetica 23: 449±459
Sharp RE, Matthews MA, Boyer JS (1984) Kok e�ect and thequantum yield of photosynthesis. Plant Physiol 75: 95±101
Shomer-Ilan A, Beer S, Waisel Y (1975) Suaeda monoica, a C4 plantwithout typical bundle sheaths. Plant Physiol 56: 676±679
Shomer-Ilan A, Nissenbaun A, Waisel Y (1981) Photosyntheticpathways and the ecological distribution of the Chenopodia-ceae in Israel. Oecologia 48: 244±248
Shreve F, Wiggins IR (1964) Vegetation and ¯ora of the SonoranDesert. Stanford University Press, Stanford, Calif
Smith BN, Turner BL (1975) Distribution of Kranz syndromeamong Asteraceae. Am J Bot 62: 541±545
Sowers T, Bender M (1995) Climate records covering the lastdeglaciation. Science 269: 210±214
Stowe LG, Teeri JA (1978) The geographic distribution of C4
species of the Dicotyledonae in relation to climate. Am Nat 112:609±623
Street-Perrott FA (1994) Palaeo-perspectives: changes in terrestrialecosystems. Ambio 23: 37±43
Stute M, Forster M, Frischkorn H, Serejo A, Clark JF, Schlosser P,Broecker WS, Bonani G (1995) Cooling of tropical Brazil (5°C)during the last glacial maximum. Science 269: 379±383
Takeda T, Tanikawa T, Agata W, Hakoyama S (1985a) Studies onthe ecology and geographical distribution of C3 and C4 grasses.
I. Taxonomic and geographical distribution of C3 and C4
grasses in Japan with special reference to climatic conditions(in Japanese) Jpn J Crop Sci 54: 54±64
Takeda T, Ueno O, Samejima M, Ohtani T (1985b) An inv-estigation for the occurrence of C4 photosynthesis in theCyperaceae from Australia. Bot Mag Tokyo 98: 393±411
Talbot MR, Johannessen T (1992) A high resolution palaeoclimaticrecord for the last 27,500 years in tropical west Africa from thecarbon and nitrogen isotopic composition of lacustrine organicmatter. Earth Planet Sci Lett 110: 23±37
Talbot MR, Livingstone DA, Palmer PG, Maley J, Melack JM,Delibrias G, Gulliksen S (1984) Preliminary results from sedi-ment cores from Lake Bosumtwi, Ghana. Palaeoecol. Afr 16:173±192
Teeri JA (1988) Interaction of temperature and other environ-mental variables in¯uencing plant distribution. Soc Exp Biol 42:77±89
Teeri JA, Stowe LG (1976) Climatic patterns and the distributionof C4 grasses in North America. Oecologia 23: 1±12
Teeri JA, Stowe LG, Livingstone DA (1980) The distribution of C4
species of the Cyperaceae in North America in relation toclimate. Oecologia 47: 307±310
Thornley JHM, Johnson IR (1990) Plant and crop modelling.Clarendon Press, Oxford
Tieszen LL, Hein D, Qvortrup SA, Troughton JH, Imbamba SK(1979a) Use of d13C values to determine vegetation selectivity inEast African herbivores. Oecologia 37: 351±359
Tieszen LL, Senyimba MM, Imbamba SK, Troughton JH (1979b)The distribution of C3 and C4 grasses along an altitudinal andmoisture gradient in Kenya. Oecologia 37: 337±350
Tieszen LL, Reed BC, Bliss NB, Wylie BK, DeJong DD (1997)NDVI, C3 and C4 production, and distributions in Great Plainsgrassland land cover classes. Ecol Appl 7: 59±78
Ueno O, Takeda T (1992) Photosynthetic pathway types, ecologicalcharacteristics, and geographical distribution of the Cyperaceaein Japan. Oecologia 89: 195±203
Valle R, Mishoe JW, Campbell WJ, Jones JW, Allen LH Jr (1985)Photosynthetic responses of `Bragg' soybean leaves adapted todi�erent CO2 environments. Crop Sci 25: 333±339
Vogel JC, Fuls A, Ellis RP (1978) The geographical distribution ofKranz grasses in South Africa. S Afr J Sci 74: 209±219
Vogel JC, Fuls A, Danin A (1986) Geographical and environ-mental distribution of C3 and C4 grasses in the Sinai, Negev,and Judean Deserts. Oecologia 70: 258±265
Wang KY (1996) Apparent quantum yield in Scots pine after fouryears of exposure to elevated temperature and CO2. Photo-synthetica 32: 339±353
Welkie GW, Caldwell M (1970) Leaf anatomy of species in somedicotyledon families as related to the C3 and C4 pathways ofcarbon ®xation. Can J Bot 48: 2135±2146
Wentworth TR (1983) Distributions of C4 plants along environ-mental and compositional gradients in southeastern Arizona.Vegetatio 52: 21±34
Wilson JR, Hattersley PW (1983) In vitro digestion of bundlessheath cells in rumen ¯uid and its relation to the suberizedlamella and C4 photosynthetic type in Panicum species. GrassForage Sci 38: 219±223
Wilson JR, Brown RH, Windham WR (1983) In¯uence of leafanatomy on the digestibility of C3, C4, and intermediate typesof Panicum species. Crop Sci 23: 141±146
Winter K (1981) C4 plants of high biomass in arid regions of Asia ±occurrence of C4 photosynthesis in Chenopodiaceae and Poly-gonaceae from the Middle East and USSR. Oecologia 48: 100±106
Winter K,Troughton JH, Card KA (1976) d13C values of grassspecies collected in the northern Sahara Desert. Oecologia 25:115±123
Zomlefer WB (1994) Guide to ¯owering plant families. Universityof North Carolina Press, Chapel Hill
299