C146-E366A GCMS-TQ8040 NX - Shimadzu
20
C146-E366A Gas Chromatograph Mass Spectrometer GCMS-TQ8040 NX
Transcript of C146-E366A GCMS-TQ8040 NX - Shimadzu
C146-E366AGC
MS-TQ
8040 N
X
Gas Chromatograph Mass Spectrometer
GCMS-TQ8040 NX
© Shimadzu Corporation, 2020
www.shimadzu.com/an/
For Research Use Only. Not for use in diagnostic procedures. This publication may contain references to products that are not available in your country. Please contact us to check the availability of these products in your country.Company names, products/service names and logos used in this publication are trademarks and trade names of Shimadzu Corporation, its subsidiaries or its af�liates, whether or not they are used with trademark symbol “TM” or “®”.Third-party trademarks and trade names may be used in this publication to refer to either the entities or their products/services, whether or not they are used with trademark symbol “TM” or “®”.Shimadzu disclaims any proprietary interest in trademarks and trade names other than its own.
The contents of this publication are provided to you “as is” without warranty of any kind, and are subject to change without notice. Shimadzu does not assume any responsibility or liability for any damage, whether direct or indirect, relating to the use of this publication.
First Edition: September 2018 3655-01014-PDFIT
GCMS-TQ, UFMS, Nexis, ClickTek, UFsweeper, Smart MRM, Active Time Management, GCMSsolution, Smart Database, LabSolutions Insight, Smart Pesticides Database, Smart Environmental Database,Smart Metabolites Database, Smart Forensic Database, Quick-DB, ASSP and AOC are trademarks of Shimadzu Corporation.MonoTrap is a trademark of GL Sciences Inc.Rxi and Rtx are registered trademarks of Restek Corporation.
A3 w420×h297
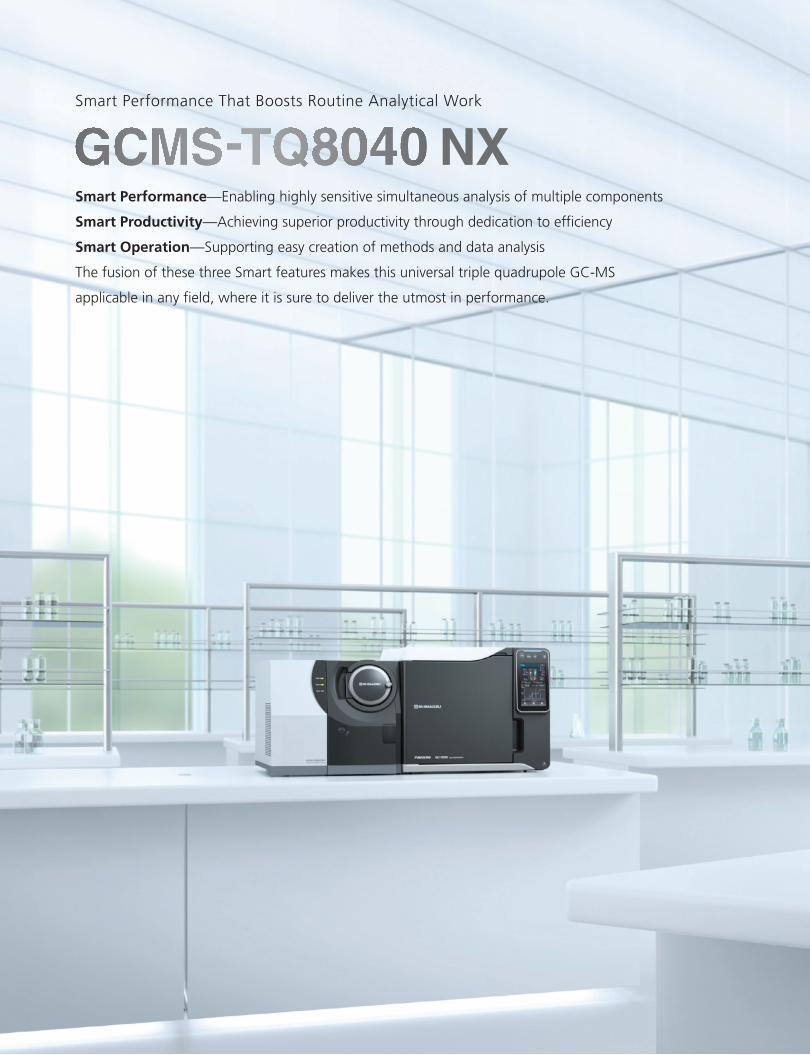
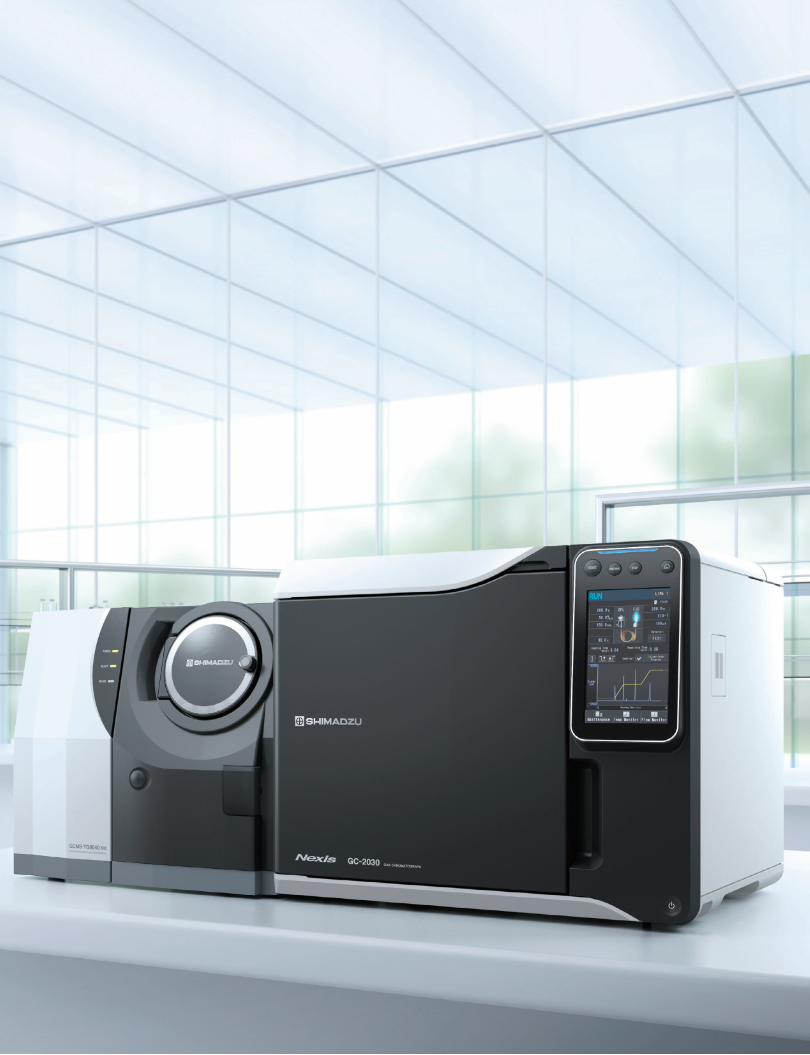
Smart Performance—Enabling highly sensitive simultaneous analysis of multiple components
Smart Productivity—Achieving superior productivity through dedication to efficiency
Smart Operation—Supporting easy creation of methods and data analysis
The fusion of these three Smart features makes this universal triple quadrupole GC-MS
applicable in any field, where it is sure to deliver the utmost in performance.
Smart Performance That Boosts Routine Analytical Work
A3 w420×h297
Smart Performance—Enabling highly sensitive simultaneous analysis of multiple components
Smart Productivity—Achieving superior productivity through dedication to efficiency
Smart Operation—Supporting easy creation of methods and data analysis
The fusion of these three Smart features makes this universal triple quadrupole GC-MS
applicable in any field, where it is sure to deliver the utmost in performance.
Smart Performance That Boosts Routine Analytical Work

Equipped with an ion source that features high sensitivity and long-term stability, and a high-efficiency collision cell, the system can provide sensitive, stable analyses over a long period of time. Also, since it incorporates the Nexis™ GC-2030, high-precision control over flowrate and temperature is assured, enabling the acquisition of highly reliable data.
The high-accuracy mass filter with pre-rods and patented electric field control technology achieves high-accuracy mass separation performance.Also, the pre-rods minimize quadrupole contamination and eliminate the need for quadrupole maintenance.
The effect of the filament’s electric potential on the ion source is reduced by placing more distance between the filament and ion source box. In addition, a shield blocks out radiant heat generated from the filament to ensure the ion source box temperature remains uniform. Since this prevents any active spots within the ion source, it provides higher sensitivity for analysis.(Patent: US7939810)
Highly Sensitive and Stable Ion Source
: Filament
Temperature
Low High
: Electric field
: Heat rays
Shield
Shield
High-Performance Quadrupole Mass Filter
New Flow Controller Achieves ExceptionalReproducibility
One Touch Inlet Maintenance
4 5
A new flow controller (AFC) with a CPU uses various control methods to control carrier gas flow to a constant flow speed, flowrate, or pressure. It can also accurately trace the analytical conditions already being used.The split line filter can be replaced without any tools. Internal contamination can be confirmed visually, ensuring filters are replaced at the proper time.
The injection port can be opened or closed without tools by simply sliding the ClickTek™ lever. Replace the insert, slide the lever and feel the click for a leak-free install every time.
Response for Pesticide (Fenitrothion) in Sesame Extract
Number of Analyses0 20 40 60 8010 30 50 70 90 100
0.0
0.2
0.4
0.6
0.8
1.0
1.2
1.4
1.6
2.0
1.8
MRM Mass Chromatograms (Pesticides, 1 pg/µL)
240.90>205.90238.90>203.90
23.25 23.50 23.75 24.00
beta-Endosulfan
314.10>244.90314.10>56.10
26.50 26.75 27.00 27.25
Iprodione
ClickTek Nut
Are
a R
ati
o w
ith
Re
spe
ct t
o F
irst
An
aly
sis
Smart Performance
The improved temperature control function enables more precise temperature control of the GC oven, which improves the precision of retention time reproducibility.In addition, three oven cooling rate levels can be specified to minimize damage to column liquid phases and maximize the service life.
Advanced GC Oven
AcenaphthyleneFluorenePhenanthreneAnthracenePyreneBenz[a]anthraceneChryseneBenzo[b]fluorantheneBenzo[k]fluorantheneBenzo[a]pyreneIndeno[1,2,3-cd]pyreneDibenz[a,h]anthraceneBenzo[ghi]perylene
Area value%RSD0.9690.9181.0751.1411.2631.4051.2831.9401.2680.7810.7440.8360.767
Retention time%RSD0.0050.0070.0060.0070.0040.0050.0050.0030.0030.0050.0040.0040.004
Repeatability with PolycyclicAromatic Hydrocarbons (PAHs)
Mass Chromatogram of Benzo[a]pyrene(Overlaid Plotting of Measurements Repeated Eight Times)
17.5517.5017.45
Gas Chromatograph Mass Spectrometer
Split filter
Valve
Flow Controller(AFC-2030)
5 pg/mL ThiobencarbLeft: GCMS-QP2020 NX, Right: GCMS-TQ8040 NXReproducibility for n = 5
%RSD = 1.76 % %RSD = 1.44 %
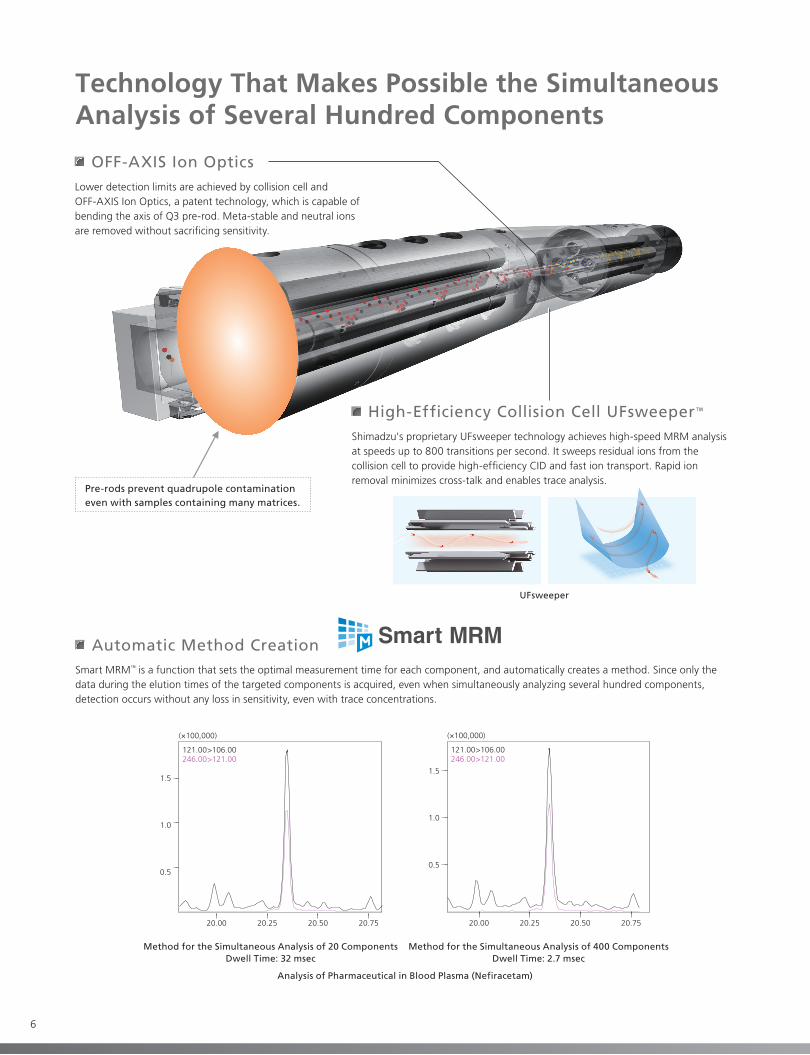
Analysis of Pharmaceutical in Blood Plasma (Nefiracetam)
5.0 7.5 10.0 12.5 15.0 17.5 20.0 22.5
1.0
2.0
3.0
4.0
5.0
6.0
7.0
(×1,000,000)
MRM Chromatogram
Fenthion %RSD = 4.16% Pyributicarb %RSD = 2.39% Iprodione %RSD = 4.54% Indoxacarb %RSD = 4.03%
1.0
2.0
3.0
4.0
5.0
6.0
7.0
8.0 278.00>109.00278.00>125.00278.00>169.00
12.75 13.00 13.25 13.50
(×1,000)
0.5
1.0
1.5
2.0
2.5
3.0 165.10>108.10165.10>93.00165.10>65.00
16.75 17.00 17.25 17.50
(×10,000)
0.5
1.0
1.5
2.0
2.5 314.00>245.00314.00>56.00314.00>271.00
17.00 17.25 17.50 17.75
(×1,000)
2.5
5.0
7.5
264.00>176.00264.00>232.00264.00>148.00
21.25 21.50 21.75 22.00
(×100)
Mass Chromatogram and %RSD of Each Pesticide (5 pg/µL)
Simultaneous Analysis of 439 Pesticides
N
O
O
S
OP
OO277
260
247214169150
125
9379
63
0 50 100 150 200 250 300 350
277260
247214169
150
125
9379
63
0 50 100 150 200 250 300 350
Scan Analysis Results for Fenitrothion Mass Spectrum from NIST Library
Method for the Simultaneous Analysis of 400 ComponentsDwell Time: 2.7 msec
Method for the Simultaneous Analysis of 20 ComponentsDwell Time: 32 msec
6 7
UFsweeper
Pre-rods prevent quadrupole contaminationeven with samples containing many matrices.
Lower detection limits are achieved by collision cell and OFF-AXIS Ion Optics, a patent technology, which is capable of bending the axis of Q3 pre-rod. Meta-stable and neutral ions are removed without sacri�cing sensitivity.
Shimadzu's proprietary UFsweeper technology achieves high-speed MRM analysis at speeds up to 800 transitions per second. It sweeps residual ions from the collision cell to provide high-ef�ciency CID and fast ion transport. Rapid ion removal minimizes cross-talk and enables trace analysis.
121.00>106.00246.00>121.00
(×100,000)
20.75
0.5
1.0
1.5
20.5020.2520.00
121.00>106.00246.00>121.00
(×100,000)
20.75
0.5
1.0
1.5
20.5020.2520.00
100.0072.00
12.75 13.00 13.25 13.50
100.0072.00
12.75 13.00 13.25 13.50
Technology That Makes Possible the SimultaneousAnalysis of Several Hundred Components
Gas Chromatograph Mass Spectrometer
Smart MRM™ is a function that sets the optimal measurement time for each component, and automatically creates a method. Since only the data during the elution times of the targeted components is acquired, even when simultaneously analyzing several hundred components, detection occurs without any loss in sensitivity, even with trace concentrations.
Automatic Method Creation Due to a highly sensitive ion source and highly sensitive detector with overdrive lenses, the GCMS-TQ8040 NX is able to select and detect generated ions ef�ciently. That achieves high sensitivity not only for MRM measurements in the GC-MS/MS mode, but also for scan and SIM measurements in the GC/MS mode. In addition, pre-rods help prevent quadrupole contamination, so that stable sensitivity and mass spectra can be obtained even when samples containing many matrices are analyzed.
High-Sensitivity Analysis by Single GC-MS Mode
High-Efficiency Collision Cell UFsweeper™
OFF-AXIS Ion Optics

5 pg/mL ThiobencarbLeft: GCMS-QP2020 NX, Right: GCMS-TQ8040 NXReproducibility for n = 5
%RSD = 1.76 % %RSD = 1.44 %
Analysis of Pharmaceutical in Blood Plasma (Nefiracetam)
5.0 7.5 10.0 12.5 15.0 17.5 20.0 22.5
1.0
2.0
3.0
4.0
5.0
6.0
7.0
(×1,000,000)
MRM Chromatogram
Fenthion %RSD = 4.16% Pyributicarb %RSD = 2.39% Iprodione %RSD = 4.54% Indoxacarb %RSD = 4.03%
1.0
2.0
3.0
4.0
5.0
6.0
7.0
8.0 278.00>109.00278.00>125.00278.00>169.00
12.75 13.00 13.25 13.50
(×1,000)
0.5
1.0
1.5
2.0
2.5
3.0 165.10>108.10165.10>93.00165.10>65.00
16.75 17.00 17.25 17.50
(×10,000)
0.5
1.0
1.5
2.0
2.5 314.00>245.00314.00>56.00314.00>271.00
17.00 17.25 17.50 17.75
(×1,000)
2.5
5.0
7.5
264.00>176.00264.00>232.00264.00>148.00
21.25 21.50 21.75 22.00
(×100)
Mass Chromatogram and %RSD of Each Pesticide (5 pg/µL)
Simultaneous Analysis of 439 Pesticides
N
O
O
S
OP
OO277
260
247214169150
125
9379
63
0 50 100 150 200 250 300 350
277260
247214169
150
125
9379
63
0 50 100 150 200 250 300 350
Scan Analysis Results for Fenitrothion Mass Spectrum from NIST Library
Method for the Simultaneous Analysis of 400 ComponentsDwell Time: 2.7 msec
Method for the Simultaneous Analysis of 20 ComponentsDwell Time: 32 msec
6 7
UFsweeper
Pre-rods prevent quadrupole contaminationeven with samples containing many matrices.
Lower detection limits are achieved by collision cell and OFF-AXIS Ion Optics, a patent technology, which is capable of bending the axis of Q3 pre-rod. Meta-stable and neutral ions are removed without sacri�cing sensitivity.
Shimadzu's proprietary UFsweeper technology achieves high-speed MRM analysis at speeds up to 800 transitions per second. It sweeps residual ions from the collision cell to provide high-ef�ciency CID and fast ion transport. Rapid ion removal minimizes cross-talk and enables trace analysis.
121.00>106.00246.00>121.00
(×100,000)
20.75
0.5
1.0
1.5
20.5020.2520.00
121.00>106.00246.00>121.00
(×100,000)
20.75
0.5
1.0
1.5
20.5020.2520.00
100.0072.00
12.75 13.00 13.25 13.50
100.0072.00
12.75 13.00 13.25 13.50
Technology That Makes Possible the SimultaneousAnalysis of Several Hundred Components
Gas Chromatograph Mass Spectrometer
Smart MRM™ is a function that sets the optimal measurement time for each component, and automatically creates a method. Since only the data during the elution times of the targeted components is acquired, even when simultaneously analyzing several hundred components, detection occurs without any loss in sensitivity, even with trace concentrations.
Automatic Method Creation Due to a highly sensitive ion source and highly sensitive detector with overdrive lenses, the GCMS-TQ8040 NX is able to select and detect generated ions ef�ciently. That achieves high sensitivity not only for MRM measurements in the GC-MS/MS mode, but also for scan and SIM measurements in the GC/MS mode. In addition, pre-rods help prevent quadrupole contamination, so that stable sensitivity and mass spectra can be obtained even when samples containing many matrices are analyzed.
High-Sensitivity Analysis by Single GC-MS Mode
High-Efficiency Collision Cell UFsweeper™
OFF-AXIS Ion Optics

Twin Line MS System
5.25 5.50 5.75 6.00
141.00>95.00141.00>79.00
Column 1 (SH-RxiTM-5Sil MS)
141.00>95.00141.00>79.00
5.75 6.00 6.25 6.50
Column 2 (SH-RtxTM-200MS)
MRM Analysis of Methamidophos (10 pg/µL)in Extract of Ginger Using QuEChERS
8 9Gas Chromatograph Mass Spectrometer
Simple Column Replacement Using the Twin Line MS System
By connecting the outlet ends of two different columns to the MS at the same, different application data can be acquired without shutting OFF the MS vacuum.CID gas control is a method parameter, allowing acquisition of GC-MS and GC-MS/MS data in the same batch.
Time Management for Continuous Analysis
By displaying the time required for continuous analysis in real time, the time when the current continuous analysis will finish can be accurately confirmed. This increases the instrument operating time (active time) by reducing standby time required during continuous analysis or while switching between different users. In addition, because this function makes it easier to schedule the timing for analysis preparations, such as sample preparation and pretreatment, based on the finish time of the previous analysis, it enables analytical processes to be performed more efficiently, which can help improve work-life balance.
A3 w420×h297
The GC/MS is now a standard system for analysts, and a system can be used for a wide variety of applications. The active time management feature appropriately manages times when the system requires maintenance, or when system changes are being made, or the waiting time for a user when multiple users are waiting to use the system. This ensures more efficient use of the system and greater uptime.
Smart Productivity
Time Management during Instrument Startup/Shutdown
The mass spectrometer has to be operated in a vacuum condition, the startup and stopping of the system takes time depending on the condition. Determining this can be a challenge. Since the amount of time that the system takes when starting up or stopping is displayed in real time, it is easy to accurately determine when maintenance of the ion source or analysis is possible. Moreover, tasks that until now needed to be performed by the user, such as leak checks upon system startup and auto tuning, are now performed automatically.
Time Management during Injection Port Maintenance
The Easy sTop function, used to safely maintain the sample injection port without releasing the vacuum, displays the remaining time (cooling-down time) when the septum or the insert can be replaced in real time. Maintenance time can be minimized by understanding the accurate remaining timeFurthermore, by using a ClickTek nut on the top of the sample injection port, the port can be opened or closed without tools, by simply using fingers to twist a lever. That enables faster and easier insert replacement than ever before.
Active-Time Management™ That Accurately Determines Operation Time
ClickTek Nut Easy sTop Function
Auto Startup and Shutdown
Auto Tuning Check Result
Time display for continuous analysis can be used only in liquid injection using AOC-20i.

Creating an MRM analysis method requires determining the optimum transitions, collision energies, and other complicated parameters. In GCMSsolution™ software, Smart MRM, the method creation function, creates optimized analytical methods by using the transitions data in the “Smart Database” file. When you want to perform MRM measurements of components not contained in the database, the optimal transitions can be automatically searched for using the MRM Optimization Tool.
MRM Optimization Tool
Determining and optimizing MRM transitions for new compounds can require signi�cant development time. The “MRM Optimization Tool“ automates the process by collecting product ion scan data and �nding the optimum collision energy for each transition. Once established, the transitions are registered to one of the Shimadzu “Smart Database” �les, and the MRM or Scan/MRM methods are created using Smart MRM.
The Shimadzu “Smart Database” is a database �le for creating the method �les using “Smart MRM” function. In addition to compound information and transitions, retention index can be registered in the database �le. Method creation can be proceeded without calculating the retention time by analyzing the standard samples when using the Automatic Adjustment Retention Time (AART) function. In addition to MRM information, Scan and SIM ion information, mass spectra and calibration curve information from the internal standard method can also be registered in the database �le. This allows users to create their own database easily.
Smar t Database ™
The AART function adjusts the retention times of target components based on linear retention indices (LRI) and the retention times of n-alkanes. The AART function easily adjusts acquisition and processing method parameters simultaneously.
The Smart MRM technology automatically creates methods with measurement times optimized for each component based on the Smart database. The Automatic Adjustment of Retention Time (AART) function incorporated in the system estimates retention times with high accuracy. When creating methods for simultaneous multicomponent analysis, the complicated process of con�guring measurement parameters made it dif�cult to prepare appropriate methods. By using the Smart MRM function, however, it is possible to automatically create methods in which data are acquired with high sensitivity only during the elution time of the target components. In addition to MRM methods, SIM methods can be created.
Parameter Setting
Automatic Adjustment of Compound Retention Time (AART)(Automatic Adjustment of Retention Time)
Smart Operation
Optimize MRM Transitions Automatically
Method Management Achieved by Database File
Smar t MRM
Automatic Method Creation
Dichlorvos
0.000
0.200
0.400
0.600
0.800
1.000
1.200
3 6 9 12 15 18 21 24 27 30 33 36 39 42 45
109.00 > 79.00
185.00 > 93.00
185.00 > 109.00
Fenobucarb
0.000
0.200
0.400
0.600
0.800
1.000
1.200
3 6 9 12 15 18 21 24 27 30 33 36 39 42 45
121.00 > 77.10
150.00 > 121.10
121.00 > 103.10
Dwell Time OptimizationAutomatic Estimationof Retention Times
C17 C18 C19
1700 1735
1735
1800
C17 C18 C19
1700 1800
Automatic adjustment
Identi�cationwindow
Analyte
20 21 2221.1 min
(Calculated RT)21.5 min(Originally registered RT)
Retention time
Retention index
Retention index
Originally registered method information
Customer's instrument
Automatic Creationof Analysis Methods
10 11Gas Chromatograph Mass Spectrometer

Users can select the optimal method for displaying data based on their work�ow. For example, data analysis windows can be displayed for each target compound or each set of measurement data, or quantitation or area values can be displayed as a list. If necessary, quantitative analysis can be repeated with peaks directly corrected, which provides intuitive operability.
Quantitative and accuracy control results can be presented more clearly by using the �agging function to color-code result values that exceed speci�ed criteria values or by only displaying �agged results. Five levels of criteria values can be indicated for quantitative results, making it easy to con�rm the corresponding criteria value range for the detected compounds. Flagging immediately re�ects results from any corrections made to manual peak integration or calibration curves.
Multianalyte Data Analysis with More Efficiency Using LabSolutions Insight™
LabSolutions Insight quantitative analysis support software includes functionality for enhancing the throughput of multianalyte data analysis, making it especially helpful for routine analysis. Quantitative results for a series of data sets can be displayed at the same time for data analysis. Chromatograms for each set of sample data can be displayed side-by-side for each compound, making it easy to con�rm peak detection and quantitative results. Color-coded �agging functionality makes it easy to quickly see peaks from any of multiple analytes that exceed criteria values. That drastically decreases the number of peaks that need to be checked and improves the ef�ciency of quantitative analysis processes.
Easy Control of Quantitation and Reference IonsAnalysts can update retention times and reference ion ratios quickly and easily from a single standard or a group of standards. It is also easy to reassign quantitation ions as needed for method development purposes or because of unexpected matrix interferences.
Status Review Function
This function can be used to specify the status of all compounds and samples for their management. By specifying a status, the progress of data analysis work can be accurately recorded and reported.
Rerun
Pending Accept
Data acquired from multiple systems can be reviewed or con�rmed using client computers connected via a LAN or other network. If multiple systems are used, data obtained from each system can be reviewed from any client computer. Even in the case of multiple analysts using the same system, the ability to separate analytical work from measurement work improves ef�ciency.
Network Support Laboratory
GC/MS analysis
Data review
Client PC
File Server
Analysis administratorClient PCClient PCClient PC
Of�ce
Data con�rmation
LC/MS analysis
OperatorOperatorOperator
Operator Operator
File management on a �le server is recommended for systems with more than �ve users.
12 13
global w430×h280
Analysis of Pesticides in Ginger
13.00 13.25 13.50
0.0e0
2.0e4
4.0e4
6.0e4
7.34e4Q161.00>99.00 (+)
Propanil Quantitation ionQualification ion
Matrix Peaks
Q161.00>90.00 (+)
13.00 13.25 13.50
0.0e0
2.0e4
4.0e4
6.0e4
7.78e4
Propanil
Visualization of Quantitative and Accuracy Control Results
More Efficient Multianalyte Data Analysis
Gas Chromatograph Mass Spectrometer

Smart Database Series Supporting Accurate Quantitative Determinations in MRM Analysis
Offering both quantitative and screening applications, these databases contain pre-optimized MRM transitions and collision energies required for GC-MS/MS analysis, allowing users to start an analysis immediately just by using the AART function to automatically modify the retention times.
The series contains optimized analysis conditions, so users can start an analysis immediately without investigating the conditions. This database is for accurate quantitative determinations using standard samples.
Smart Pesticides Database™
It covers the pesticides (530 compounds) subject to GC-MS analysis and used inside and outside Japan. The database also contains information on compounds that can be used as internal standards. Therefore, it also supports analysis with the internal standard method.
Smart Environmental Database™
The database contains information on 527 compounds including polychlorinated biphenyl, brominated �ame retardants, dioxins, polycyclic aromatic hydrocarbons, and organochlorine pesticides, as well as their stable isotope labeled compounds.
Smart Metabolites Database™
The database contains 525 compounds including metabolites contained in blood, urine, cells and other biological samples. It also contains information on the stable isotopes of 22 major metabolites, which can be used as internal standards.
Smart Forensic Database™
The database is registered with 486 forensic toxicological substances often involved in poisonings, such as drugs of abuse, psychotropic drugs, pharmaceuticals, and pesticides.
Quick-DB™ Series Enables Quick Screening Without Using StandardsPreregistered with calibration curve information from the internal standard methods, this database allows users to calculate quantitative values without analyzing
standard samples. It can be used for screening when quick con�rmation of quantitative results is required.
Quick-DB GC/MS Residual Pesticides DatabaseThe database contains information on calibration curves created using pesticide surrogates as the internal standards, thus enabling the simultaneous screening of 491 residual pesticides without using standard samples. The registered calibration curves have been created by grouping target pesticides based on similar behavioral and physical properties, and allocating pesticide surrogates with similar physical properties to each group as internal standard substances. This allows highly accurate quantitative values to be calculated.
Allocation of Pesticide Surrogates Based on Physical Properties of Target Pesticides
Target pesticides
Analyticalbehavior
Boilingpoint
Others
Hydrophobicity
Recoveryrate
Malathion
Polarity
Pesticide surrogates
Group 1Dichlorvos-d
Group 2Acephate-d
Group 4Iprobenfos-d
Allocation
Sensitivity Variation Adjustments Using Pesticide Surrogates
Database Calibration Curve
PesticidePesticidePesticide
IS(Pesticide-d)
IS(Pesticide-d)IS(Pesticide-d)
Customer's GC-MS
Pesticide surrogates can also be used to adjust differences in target pesticide responses observed in calibration curves and a customer's instrument due to variations in GC-MS(/MS) sensitivity.
Quick-DB Forensic Toxicology DatabaseThis database contains information on sample preparation, data acquisition, and analysis of 68 compounds often involved in poisonings. Due to the simple QuEChERS method used for the sample preparation, even �rst-time users can pretreat samples easily. The performance control function, which automatically assesses the system status, quickly determines problematic areas. As a result, users can analyze toxicological substances while consistently maintaining the highest status level.
Using a Calibration Curve for a Pretreated Sample to Correct for Recovery Rates
By using the calibration curve information from a pretreated sample, accurate quantitative values can be obtained. The calibration curve information is used to correct differences in recovery rates for each target compound or correct for effects caused by adsorption, which occurs when creating calibration curves using standards.
If speci�c control parameter criteria are not satis�ed, the optimal steps for restoring the system status are displayed in a message box.
Calibration curve forwhole blood samplespiked with standardand pretreated
Effect ofpretreatmentrecovery rate
Less affected by adsorptioncaused by matrix effects
Quick-DB Forensic Launcher Screen
Off-Flavor Analyzer
Primary odorcomponents
GC/MS analyticalconditions
Sensoryinformation
This analysis system contains information on the major odor-causing substances identi�ed from previous problems and associated sensory information, thus enabling the reliable identi�cation of odor-causing substances. It allows users to calculate quantitative values easily without using standard samples, and to identify odor-causing substances through comparison with registered odor thresholds. The system also supports the use of a sniffer, enabling the ef�cient con�rmation of odors using the predicted retention time display function.In addition, support is provided for a total system, including pretreatment units such as HS, SPME, and thermal desorption units using MonoTrap™.
Comparison of Concentration to Odor Threshold Values
Odor-causing substances can be identi�ed through comparisons of odor thresholds with the concentrations of off-�avor components identi�ed in a chromatogram.
Since some odor components have a low odor threshold, low concentration levels need to be detected to identify the causative substances. High-sensitivity MRM/SIM analysis by GC-MS(/MS) can reliably detect even trace components near the odor threshold (a few pg/g).
195.0210.0167.0
4.0
3.0
2.0
1.0
0.017.50 17.75 18.00 18.25
0.5
1.0
1.5
210.0 > 167.0210.0 > 195.0195.0 > 167.0
17.50 17.75 18.00 18.25
Mass Chromatograms of 2,4,6-Trichloroanisole(estimated concentration of 18.166 pg/g) in Food with an Odd Odor
(Left: Scan analysis, Right: MRM analysis)
GC-MS/MS Databases Allow Users to Start Analysis Immediately
2,4,6-Tribromophenol
Under Threshold Value Over Threshold Value
Benzophenone
Concentration/Threshold=Odor threshold value
2241.933/100.000=22.419
Concentration/Threshold=Odor threshold value
2.543/10.000=0.254
14 15Gas Chromatograph Mass Spectrometer

Qualitative Analysis Using GC-MS/MS
GC-MS/MS allows users to freely select ions cleaved by electron ionization (EI), and then cleave precursor ions via collision induced dissociation (CID), thus enabling the detailed analysis of partial structures. A product ion scan can be used to easily discriminate structural isomers and regioisomers, which are hard to identify with an EI mass spectrum obtained via GC/MS. This mode is optimal for predicting partial structures.
Example of Structural Isomers EI-ScanEI-Product Ion Scan(Precursor m/z 126)
α-PVP
%
0
25
50
75
100 126
847755 986943
25 50 75 100 125 150
%
0
25
50
75
100 126
9784
695542
30
25 50 75 100 125 150
α-PBP Piperidine analog 25 50 75 100 125 1500
25
50
75
100
%126
69 77 8455 10543
25 50 75 100 125 150 0
25
50
75
100
% 126
41
69 55 84 96 30
Example of Regioisomers EI-ScanEI-Product Ion Scan(Precursor m/z 149)
Methylone (bk-MDMA)
50 100 150 200 0
25
50
75
100
% 58
65 121 149 91 135
50 100 150 200 0
25
50
75
100
% 121
149
65
91
2,3-Methylenedioxy-methcathinone 50 100 150 200
0
25
50
75
100
% 58
65 149 121 91 135
50 100 150 200 0
25
50
75
100
%
65
149
121
93 77
Black: 1,111 u/secRed: 5,000 u/secBlue: 10,000 u/sec
Newly Patented Technology (ASSP)
DiazinonPropyzamide
Inert Flow Path Achieves High-SensitivityGC/MS Flow Path
Minimizing adsorption and other losses in the �ow path from sample injection to the detector is important for stable, high-sensitivity measurements using GC/MS. The �ow lines in the GCMS-QP series and the TQ series consist of high-quality, highly reliable consumable parts, so even trace concentrations of components can be detected with high sensitivity and favorable repeatability.
Micro-syringeAutosampler syringes feature improved durability, clarity, and accuracy, achieving reliable injection accuracy.
GC septumOur lineup now includes low bleed septa, which maintain optimal seal performance even when the injection cycles are increased, and can be used even at high temperatures. This reduces sensitivity variations due to leaks.
Ferrules and gold gasketThe high-quality Vespel ferrule is easily attached and designed to resist leaking. The gold gasket is inactive, and adsorption does not occur.
Ion sourceDesigned with a shield that blocks radiant heat generated by the �lament, and an ion source treated with an oxide coating, active spots inside the ion source are not prone to occur, which enables high-sensitivity analysis with long-term stability.
Capillary columnsFor the SH-Rxi series, a high-quality fused silica like no other is used as the raw material. Our proprietary surface inactivation technology and optimal process to mask silanol groups result in a low-bleed column with very impressive inactivation performance, even with respect to polar compounds comparable to acidic and basic substances.
Glass linerThe glass liner recommended for GC/MS analysis uses a proprietary inactivation technology to dramatically suppress active sites. After packing into the insert, the wool is subjected to a complete inactivation treatment. This product is controlled throughout from production to �nal inspection to provide 100 % satisfaction.
p,p
'-D
DE
End
rinTIC
p,p
'-D
DD
End
rin
ald
ehyd
e
p,p
'-D
DT
End
rin
ket
on
e
Resolution (%)Endrin: 1.34DDT: 1.44
High-Speed Scan Control Technology
Advanced Scanning Speed Protocol (ASSP™)
16 17Gas Chromatograph Mass Spectrometer
Equipped with a function to automatically optimize the rod bias voltage during high-speed data acquisition, the system can collect data stably through scans as well as product ion scans at 20,000 u/sec (patent: US6610979).With the GCMS-TQ8040 NX, ten or more product ion scans can be con�gured for a single measurement, and three or more user-speci�ed analysis modes (Scan, MRM, product ion scan) can be combined.

For GC-MS/MS analysis, different system con�gurations may be required depending on the application and sample-introduction needs. The GCMS-TQ8040 NX offers a wide variety of system con�gurations and sample-introduction devices to enable an expanded range of applications.
The Smart EI/CI ion source has been developed in order to acquire CI data without switching the ion source, and without losing the sensitivity of EI, which is most commonly used.Even when it is dif�cult to perform identi�cation with the EI mode using the mass spectral library, molecular weight information can be obtained from CI data, thus helping in the estimation of unknown compounds.
Direct sample injection (DI) is a method in which a sample is injected directly into the ion source without passing through the gas chromatograph (GC). This is an effective method for measuring the mass spectra of synthetic compounds, and can be used easily with a typical GC-MS con�guration. By using this in combination with Smart EI/CI ion source, EI and CI mass spectra can easily be collected.
Components that are thermally degradable or dif�cult to vaporize are not suited to GC analysis. However, their mass spectra can be obtained easily using the DI probe.
250 500 750
5998116
158
216 398 520 662 763
EI100
75
50
25
0
%
250 500 750
%158
116
174254 398
558
679
662 731
838CI M+H+100
75
50
25
0
Mass Spectrum for Antibiotic Roxithromycin
50 100 150 200 250
0
50
100
%
236
86
218149 188
CI
50 100 150 200 250
0
50
10086
4414912165
EI
%
Exchange ofion source
unnecessary
Con�rmation of Molecular Weight InformationCon�rmation of Mass Spectra Smart EI/CI ion source
18 19
Thermal desorption systems heat samples in a sample tube and then concentrate the thermally desorbed gases before injection into a GC-MS. They are commonly used to measure volatile organic compounds (VOCs) in the atmosphere or measure trace components that are generated from plastic or other samples.The TD-30R can accommodate 120 samples for excellent processing capacity and offers outstanding expandability, such as functionality for retrapping components or for automatically adding an internal standard substance.
Smart EI/CI Ion Source Easily Switches Between EI and CI Methods
DI-2010 Direct Inlet System
The AOC-6000 Plus supports three sample injection methods: liquid sample injection, headspace (HS) injection, and solid phase micro extraction (SPME) injection, so samples in a variety of forms can be analyzed. It allows the sample injection method to be switched automatically, enabling different sample injection methods to be combined in a continuous operation.With the automatic syringe exchange and vial mixing function, standard samples can be prepared automatically with a variety of dilution levels, and everything from the creation of calibration curves to the quantitative determination of unknown samples can be fully automated.
The HS-20 headspace sampler provides strong backup for the analysis of volatile components at every stage from research to quality control departments. The high-sensitivity electronic cooling trap enables quantitative and qualitative determination of trace components that cannot be detected with a conventional headspace sampler.The HS-20 transfer line is built into the GC unit, which makes it easy to combine the HS-20 with the AOC-20 liquid sample injector, as well as to switch between these units.
The OPTIC-4 multimode sample inlet is a GC injection port that enables a variety of sample injection modes for GC-MS, including large-quantity injection, inlet derivatization, thermal desorption, and DMI (dif�cult matrix introduction).Combining this with an autosampler enables automatic replacement of inserts, improving productivity in multisample analyses.
AOC-6000 Plus Multifunctional Autosampler System
HS-20 Headspace Analysis System
OPTIC-4 Multimode Sample Inlet System
TD-30 Thermal Desorption System
Con�gure Optimal Analysis Systems to Meet Your Needs
Gas Chromatograph Mass Spectrometer
SPME Injection
2-Methylisoborneol(Concentration: 1 ng/L)
SMCI can obtain the same results as previously-existing CI methods, but is less dependent on the compound. For example, it has been dif�cult to verify the molecular weight of phthalate esters using EI or previously-existing CI method, whereas SMCI can identify the quasi-molecular ions.
The mass spectrum of bis(2-ethylhexyl)phthalate (MW=390) obtained using different
ionization methods
SMCI (Solvent Mediated Chemical Ionization) is a soft ionization method for GCMS. The headspace reagent gas from the sample bottle is introduced into the GCMS ionization unit to be ionized, which then causes chemical ionization (CI) of the target molecule via protonation.* Previous CI methods have required the use of �ammable reagent gas cylinders, but SMCI can be carried out with a general organic solvent such as methanol or acetonitrile, together with nitrogen or argon gas. This results in greater safety and lower running costs.
SMCI Unit
SMCI unit+GCMS-TQ8040 NX
100
75
50
25
00
100
75
50
25
00100
100 200 300 400 500
200 300 400
120
57112113
149
167
207 261 430 480327 351 377279
165 224261
279
299 327 372
391
%
%

C146-E366AGC
MS-TQ
8040 N
X
Gas Chromatograph Mass Spectrometer
GCMS-TQ8040 NX
© Shimadzu Corporation, 2020
www.shimadzu.com/an/
For Research Use Only. Not for use in diagnostic procedures. This publication may contain references to products that are not available in your country. Please contact us to check the availability of these products in your country.Company names, products/service names and logos used in this publication are trademarks and trade names of Shimadzu Corporation, its subsidiaries or its af�liates, whether or not they are used with trademark symbol “TM” or “®”.Third-party trademarks and trade names may be used in this publication to refer to either the entities or their products/services, whether or not they are used with trademark symbol “TM” or “®”.Shimadzu disclaims any proprietary interest in trademarks and trade names other than its own.
The contents of this publication are provided to you “as is” without warranty of any kind, and are subject to change without notice. Shimadzu does not assume any responsibility or liability for any damage, whether direct or indirect, relating to the use of this publication.
First Edition: September 2018 3655-01014-PDFIT
GCMS-TQ, UFMS, Nexis, ClickTek, UFsweeper, Smart MRM, Active Time Management, GCMSsolution, Smart Database, LabSolutions Insight, Smart Pesticides Database, Smart Environmental Database,Smart Metabolites Database, Smart Forensic Database, Quick-DB, ASSP and AOC are trademarks of Shimadzu Corporation.MonoTrap is a trademark of GL Sciences Inc.Rxi and Rtx are registered trademarks of Restek Corporation.