RSM · RSM . Author: RSM Indonesia Created Date: 5/17/2018 4:20:17 PM
Upload
phungduongCategory
view
216download
1
RSM Training HESM Instructional Materials for Training Purposes Only Module 12: C111 RSM – Model Conceptualization, Calibration, and Application
Hydrologic and Environmental Systems Modeling Page 12.1
Lecture 12: C111 Spreader Canal / Frog Pond Reservoir RSM
The C111 subregional RSM was the first implementation to be used as an application
for evaluating alternative project formulations. This lecture covers the calibration of
the baseline model and initial testing of the implementation of the spreader canal
features and the impoundment feature within the RSM for modeling the Frog Pond
Reservoir.
Model Conceptualization, Calibration, and ApplicationModel Conceptualization, Calibration, and Application
C111 Spreader Canal / Frog Pond Reservoir RSM

RSM Training HESM Instructional Materials for Training Purposes Only Module 12: C111 RSM – Model Conceptualization, Calibration, and Application
Page 12.2 Hydrologic and Environmental Systems Modeling
NOTE:
Additional Resources
A C-111 presentation file is available in the labs/lab12_subregion directory.
RSM Training HESM Instructional Materials for Training Purposes Only Module 12: C111 RSM – Model Conceptualization, Calibration, and Application
Hydrologic and Environmental Systems Modeling Page 12.3
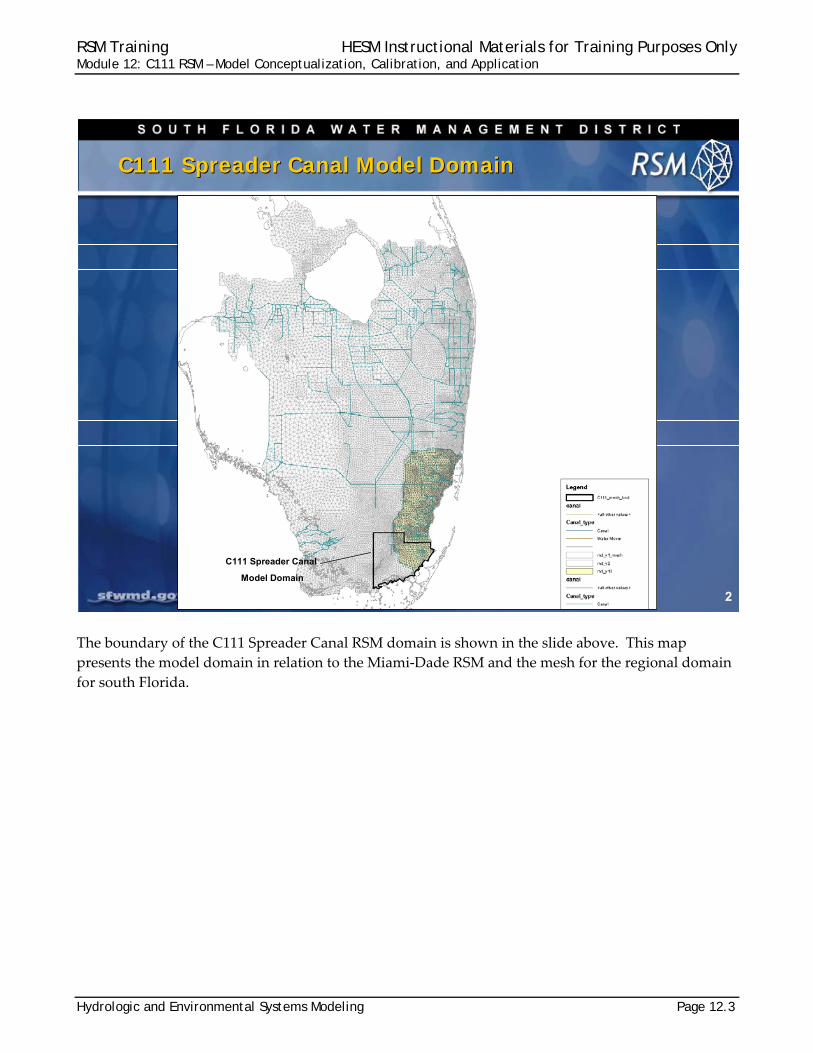
The boundary of the C111 Spreader Canal RSM domain is shown in the slide above. This map
presents the model domain in relation to the Miami‐Dade RSM and the mesh for the regional domain
for south Florida.
2
C111 Spreader Canal Model DomainC111 Spreader Canal Model Domain
C111 Spreader Canal
Model Domain

RSM Training HESM Instructional Materials for Training Purposes Only Module 12: C111 RSM – Model Conceptualization, Calibration, and Application
Page 12.4 Hydrologic and Environmental Systems Modeling
Subregional C111 RSM mesh framework detail:
north boundary is an East – West line through S176 western boundary is 8 miles west of the C111 Canal south and east boundaries are the coastline
3
C111 Spreader Canal Mesh Framework
Extended model domain area to accommodate proposed Frog Pond Reservoir

RSM Training HESM Instructional Materials for Training Purposes Only Module 12: C111 RSM – Model Conceptualization, Calibration, and Application
Hydrologic and Environmental Systems Modeling Page 12.5
The C111 RSM model mesh consists of 3,505 cells with an average size of 64 acres. The average length
of a triangle cell’s side is about 2,000 feet.
4
Model Mesh and Canal NetworkModel Mesh and Canal Network

RSM Training HESM Instructional Materials for Training Purposes Only Module 12: C111 RSM – Model Conceptualization, Calibration, and Application
Page 12.6 Hydrologic and Environmental Systems Modeling
Topography and landuse are important data for this model. The mesh topography was derived from
the LIDAR dataset. The topographic resolution on the east side of the L31‐N Levee is a 100‐foot grid
derived from a Miami‐Dade 25‐foot resolution dataset. The resolution on the west side of the levee is
1,000‐foot based on HAEDC USGS survey data.
Based on a combination of the South Florida Water Management District (SFWMD) 1988 landuse
coverage and the SFWMD 1995 landuse coverage used for the calibration period (1984‐1995),
dominant landuses are mangrove (16%), sawgrass (30%) and marsh (13%).
5
C111 Mesh: Topography and LanduseC111 Mesh: Topography and Landuse

RSM Training HESM Instructional Materials for Training Purposes Only Module 12: C111 RSM – Model Conceptualization, Calibration, and Application
Hydrologic and Environmental Systems Modeling Page 12.7
Hydraulic conductivity is another critical data set. There is an order of magnitude range in hydraulic
conductivity across the domain.
This dataset was adopted from the Miami‐Dade RSM v1.0 calibration datasets.
6
C111 Single-Layer Hydraulic ConductivityC111 Single-Layer Hydraulic Conductivity

RSM Training HESM Instructional Materials for Training Purposes Only Module 12: C111 RSM – Model Conceptualization, Calibration, and Application
Page 12.8 Hydrologic and Environmental Systems Modeling
The base C111 Spreader Canal RSM was calibrated using the following canals: L31W, C111, C111E,
L31E and Card Sound Rd canal.
The simulated structures included the following: S177, S178, S18C, and S197, while historical flows
were imposed at S176, S174, S332 and S175 structures. For the C111‐Spreader Canal/ Frog Pond
Model, the same canals and structures were modeled as in the baseline model with two additional
pumps (SC111NP and FPDNP).
7
Canal ReachesCanal Reaches

RSM Training HESM Instructional Materials for Training Purposes Only Module 12: C111 RSM – Model Conceptualization, Calibration, and Application
Hydrologic and Environmental Systems Modeling Page 12.9
The Spreader Canal is designed to receive water from the C111 Canal and disperse the water across
the marsh to create sheet flow. This is the schematic diagram of the Spreader Canal segment with the
levee gaps on the south side, to promote sheet flow across the restored marsh.
8
Spreader Canal Segment ConceptualizationSpreader Canal Segment Conceptualization

RSM Training HESM Instructional Materials for Training Purposes Only Module 12: C111 RSM – Model Conceptualization, Calibration, and Application
Page 12.10 Hydrologic and Environmental Systems Modeling
This is the Spreader Canal segment conceptualization within the RSM:
No-flow boundary condition on the north bank Spreader Canal segments with and without free flow discharge Spreader Canal segments with gaps have overbank flow Seepage outflow from segments without gaps
9
Spreader Canal Conceptualization in RSMSpreader Canal Conceptualization in RSM

RSM Training HESM Instructional Materials for Training Purposes Only Module 12: C111 RSM – Model Conceptualization, Calibration, and Application
Hydrologic and Environmental Systems Modeling Page 12.11
The perimeter boundary conditions for the RSM were as follows:
Flows from the SFWMM simulation for the calibration period along the west and north boundaries Tidal stage (Manatee Bay gage) along the East-South boundary Historical S176 inflows for C111 Canal and S174 for L31W Canal
10
C111 RSM: Perimeter Boundary ConditionsC111 RSM: Perimeter Boundary Conditions

RSM Training HESM Instructional Materials for Training Purposes Only Module 12: C111 RSM – Model Conceptualization, Calibration, and Application
Page 12.12 Hydrologic and Environmental Systems Modeling
Levee seepage was included in the RSM in a similar way as modeled in the SFWMM via levee
seepage watermovers.
Each levee reach has distinct sets of levee seepage properties and coefficients. Seepage flow across
the levee is simulated as a linear function of the head differential on both sides of the levee. Values of
the levee seepage coefficients were established through calibration.
Seepage flow is calculated as a function of the linear levee seepage coefficients and the head
difference across the levee.
11
Levee Seepage ReachesLevee Seepage Reaches

RSM Training HESM Instructional Materials for Training Purposes Only Module 12: C111 RSM – Model Conceptualization, Calibration, and Application
Hydrologic and Environmental Systems Modeling Page 12.13
The Frog Pond impoundment is simulated as a single waterbody that interacts with the aquifer via
vertical seepage.
12
Frog Pond ReservoirFrog Pond Reservoir

RSM Training HESM Instructional Materials for Training Purposes Only Module 12: C111 RSM – Model Conceptualization, Calibration, and Application
Page 12.14 Hydrologic and Environmental Systems Modeling
There are 36 groundwater stage monitoring sites and seven canal structure flow monitoring sites used
for calibration. Eighteen stage monitoring sites are in the Impact Assessment area.
13
Stage Monitoring SitesStage Monitoring Sites

RSM Training HESM Instructional Materials for Training Purposes Only Module 12: C111 RSM – Model Conceptualization, Calibration, and Application
Hydrologic and Environmental Systems Modeling Page 12.15
Eight flow transect lines are used to determine if the overland sheet flow and groundwater flow are
adequate in the evaluation of alternative project formulations.
14
Flow Transect LinesFlow Transect Lines
RSM Training HESM Instructional Materials for Training Purposes Only Module 12: C111 RSM – Model Conceptualization, Calibration, and Application
Page 12.16 Hydrologic and Environmental Systems Modeling
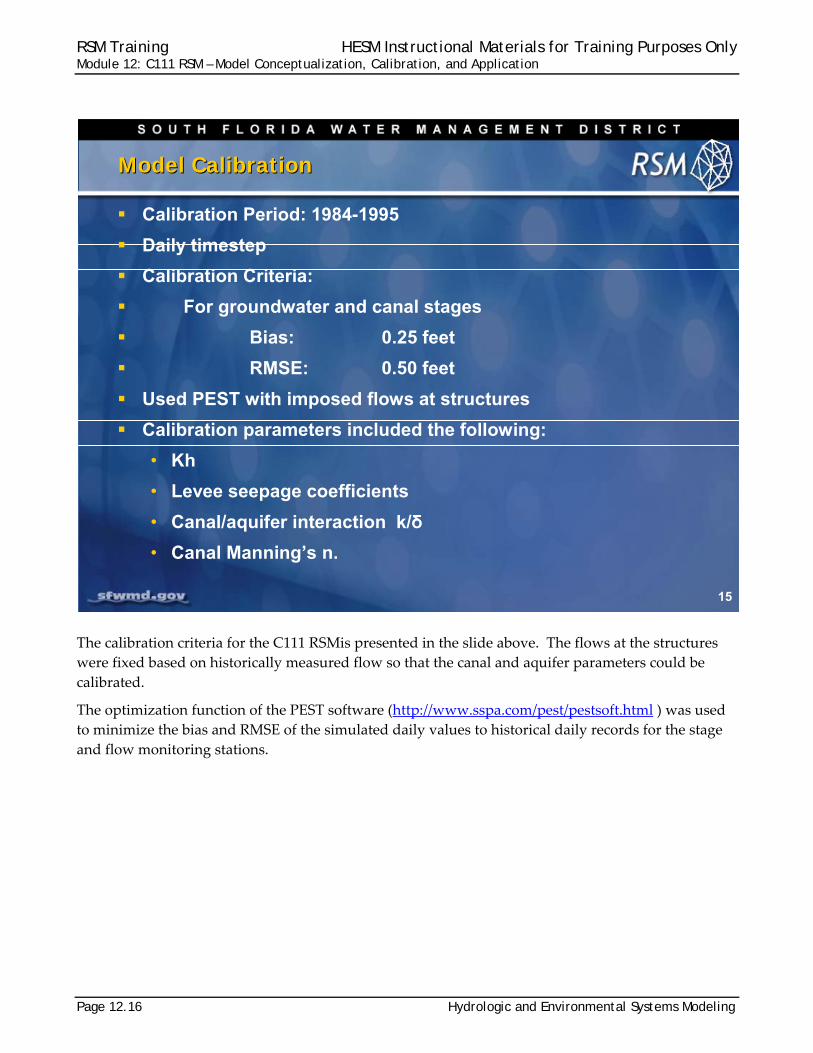
The calibration criteria for the C111 RSMis presented in the slide above. The flows at the structures
were fixed based on historically measured flow so that the canal and aquifer parameters could be
calibrated.
The optimization function of the PEST software (http://www.sspa.com/pest/pestsoft.html ) was used
to minimize the bias and RMSE of the simulated daily values to historical daily records for the stage
and flow monitoring stations.
15
Model CalibrationModel Calibration
Calibration Period: 1984-1995
Daily timestep
Calibration Criteria:
For groundwater and canal stages
Bias: 0.25 feet
RMSE: 0.50 feet
Used PEST with imposed flows at structures
Calibration parameters included the following:
• Kh
• Levee seepage coefficients
• Canal/aquifer interaction k/δ
• Canal Manning’s n.

RSM Training HESM Instructional Materials for Training Purposes Only Module 12: C111 RSM – Model Conceptualization, Calibration, and Application
Hydrologic and Environmental Systems Modeling Page 12.17
Results from a subset of groundwater stage time series used in the C111 Spreader Canal RSM are
shown in the slide above. Compared with the SFWMM, the RSM calibrated most of the sites as well
or better. Additionally, performance of the C111 Spreader Canal RSM was also compared to the
previous subregional RSM, Miami‐Dade v.1.0. The red values in the table were outside the acceptable
range.
16
Groundwater Stage Calibration Statistics (1984-1995)Groundwater Stage Calibration Statistics (1984-1995)
0.360.31SWEVER5A
0.69-0.370.56-0.10NP-TSB
0.300.03NP-N10
0.570.43NP-EV6
0.41-0.240.300.17NP-67
0.420.16NP-31W
0.51-0.370.57-0.41G3355
0.24-0.140.23-0.150.200.02G3354
0.390.000.42-0.240.390.11G864
0.370.170.330.220.560.46G613
0.350.050.380.17FROGP
0.250.100.400.34EVER4
0.37-0.140.22-0.140.210.06EVER2B
0.45-0.190.60-0.460.75-0.50EVER1
0.34-0.230.29-0.04EPSW
0.220.070.280.22EP9R
RMSEBiasRMSEBiasRMSEBiasStage Gauge
SFWMM v5.5Miami_Dade RSM v1C111 Spreader Canal

RSM Training HESM Instructional Materials for Training Purposes Only Module 12: C111 RSM – Model Conceptualization, Calibration, and Application
Page 12.18 Hydrologic and Environmental Systems Modeling
The C111 Spreader Canal RSM was calibrated to more sites than the SFWMM. Except at two stations,
it performed within the calibration criteria.
17
Canal Stage Calibration Statistics (1984-1995)Canal Stage Calibration Statistics (1984-1995)
0.360.00S175_HW
0.24-0.01S20_HW
0.320.16S178_TW
0.440.28S178_HW
0.370.19S177_TW
0.370.080.540.24S177_HW
0.290.14S18C_TW
0.240.030.340.18S18C_HW
0.33-0.240.280.09S197_HW
RMSEBiasRMSEBiasRMSEBiasStage Gauge
SFWMM v5.5MD v1C111 SC

RSM Training HESM Instructional Materials for Training Purposes Only Module 12: C111 RSM – Model Conceptualization, Calibration, and Application
Hydrologic and Environmental Systems Modeling Page 12.19
Groundwater stage values calibrated well with measured values for many sites. The hydrographs
presented here, and on the following slides, show the comparison of the calibrated and observed
stage data at different groundwater and surface water observation stations.
18
C111 SC RSM Calibrated to Historical DataC111 SC RSM Calibrated to Historical Data

RSM Training HESM Instructional Materials for Training Purposes Only Module 12: C111 RSM – Model Conceptualization, Calibration, and Application
Page 12.20 Hydrologic and Environmental Systems Modeling
At some sites it was determined that the “extinction depth” parameter of the <layer1nsm> HPM was
not correct and required calibration. There was insufficient evapotranspiration resulting in
groundwater stage that was too high.
19
C111 SC RSM Calibrated to Historical DataC111 SC RSM Calibrated to Historical Data

RSM Training HESM Instructional Materials for Training Purposes Only Module 12: C111 RSM – Model Conceptualization, Calibration, and Application
Hydrologic and Environmental Systems Modeling Page 12.21
Simulated canal stages matched fairly well with historical stages. The RSM was not able to simulate
the low stages because the model was not transpiring sufficient water.
20
C111 SC RSM Calibrated to Historical DataC111 SC RSM Calibrated to Historical Data

RSM Training HESM Instructional Materials for Training Purposes Only Module 12: C111 RSM – Model Conceptualization, Calibration, and Application
Page 12.22 Hydrologic and Environmental Systems Modeling
In some marsh locations the pattern of stage time series was reproduced, but the seasonal peak flows
were not well simulated.
21
C111 SC RSM Calibrated to Historical DataC111 SC RSM Calibrated to Historical Data

RSM Training HESM Instructional Materials for Training Purposes Only Module 12: C111 RSM – Model Conceptualization, Calibration, and Application
Hydrologic and Environmental Systems Modeling Page 12.23
The simulated segment head matched well with the observed values in the canals.
22
C111 SC RSM Calibrated to Historical DataC111 SC RSM Calibrated to Historical Data

RSM Training HESM Instructional Materials for Training Purposes Only Module 12: C111 RSM – Model Conceptualization, Calibration, and Application
Page 12.24 Hydrologic and Environmental Systems Modeling
After the calibration was completed, the Management Simulation Engine (MSE) component of the
model was implemented and the flow in the canals was simulated using management at the
structures.
This slide shows a comparison of the simulated flows and the historical flows at the two downstream
structures of the C111 Canal from the MSE simulation. The simulated flow at S18C compared well
with historical flow.
23
Observed and Simulated Flows (1991-1995)Observed and Simulated Flows (1991-1995)
S197
S18C

RSM Training HESM Instructional Materials for Training Purposes Only Module 12: C111 RSM – Model Conceptualization, Calibration, and Application
Hydrologic and Environmental Systems Modeling Page 12.25
The simulated flows matched the historical flows at S177, but did not match so well at S20.
24
Observed and Simulated Flows (1991-1995)Observed and Simulated Flows (1991-1995)
S177
S20

RSM Training HESM Instructional Materials for Training Purposes Only Module 12: C111 RSM – Model Conceptualization, Calibration, and Application
Page 12.26 Hydrologic and Environmental Systems Modeling
The first alternative was to add a Spreader Canal to the C111 Basin. This slide lists the design
parameters for the Spreader Canal alternative.
25
Simulation Results: Baseline + Spreader CanalSimulation Results: Baseline + Spreader Canal
Proposed spreader canal is 4.6 miles from C111 Canal to US 1
Includes Spreader Canal pump (500 cfs)
Spreader Canal has 11 levee gaps 35–55 feet wide
Spreader Canal pump operates only when S177 is discharging

RSM Training HESM Instructional Materials for Training Purposes Only Module 12: C111 RSM – Model Conceptualization, Calibration, and Application
Hydrologic and Environmental Systems Modeling Page 12.27
The graphs in this slide show the distribution of flow along the Spreader Canal decreasing
(a) from the pump to mile 1.755
(b) through the next four segments from mile 1.755 to 2.506
(c) from mile 2.745 to mile 3.502
(d) mile 3.756 to mile 4.254
26
Simulated Spreader Canal OutflowsSimulated Spreader Canal Outflows
Flow Rate through Canal Segment 312781 (Mile 0) to 312790 (Mile 1.755)
-100
0
100
200
300
400
500
600
1/1/
1991
1/1/
1992
1/1/
1993
1/1/
1994
1/1/
1995
1/1/
1996
Date
Dis
char
ge R
ate,
cfs
Canal Segments 312783 to 312790C111NP Q
Flow Rate through Canal Segment 312790 (Mile 1.755 ) to 312796 (Mile 2.506)
0
10
20
30
40
50
60
70
80
1/1/
1991
1/1/
1992
1/1/
1993
1/1/
1994
1/1/
1995
1/1/
1996
Date
Dis
char
ge R
ate,
cfs
Canal Segment 312790Canal Segment 312792Canal Segment 312794Canal Segment 312796
Flow Rate through Canal Segment 312798 (Mile 2.745 from C111) to 312810 (Mile 3.502)
0
10
20
30
40
50
60
70
80
1/1/
1991
1/1/
1992
1/1/
1993
1/1/
1994
1/1/
1995
1/1/
1996
Date
Dis
char
ge R
ate,
cfs
Canal Segment 312798Canal Segment 312800Canal Segment 312802Canal Segment 312804
Flow Rate through Canal Segment 312806 (Mile 3.756 from C111) to 312810 (Mile 4.254)
0
10
20
30
40
50
60
70
80
1/1/
1991
1/1/
1992
1/1/
1993
1/1/
1994
1/1/
1995
1/1/
1996
Date
Dis
char
ge R
ate,
cfs
Canal Segment 312806Canal Segment 312808Canal Segment 312810
(a) (b)
(c) (d)

RSM Training HESM Instructional Materials for Training Purposes Only Module 12: C111 RSM – Model Conceptualization, Calibration, and Application
Page 12.28 Hydrologic and Environmental Systems Modeling
Discharge into the marsh along the Spreader Canal was simulated to show how well the Spreader
Canal operated.
The flow includes seepage (spgflow) and overbank (bankflow) flows. The spikes in flows occur at the
location of gaps in the berm.
27
Spreader Canal DischargeSpreader Canal Discharge
-30
-25
-20
-15
-10
-5
0
segid (mile number)
aver
age
flo
w (
cfs)
spgflow bankflow sbflow
Spreader Canal Average Discharge Distribution Baseline + Spreader Canal
RSM Training HESM Instructional Materials for Training Purposes Only Module 12: C111 RSM – Model Conceptualization, Calibration, and Application
Hydrologic and Environmental Systems Modeling Page 12.29
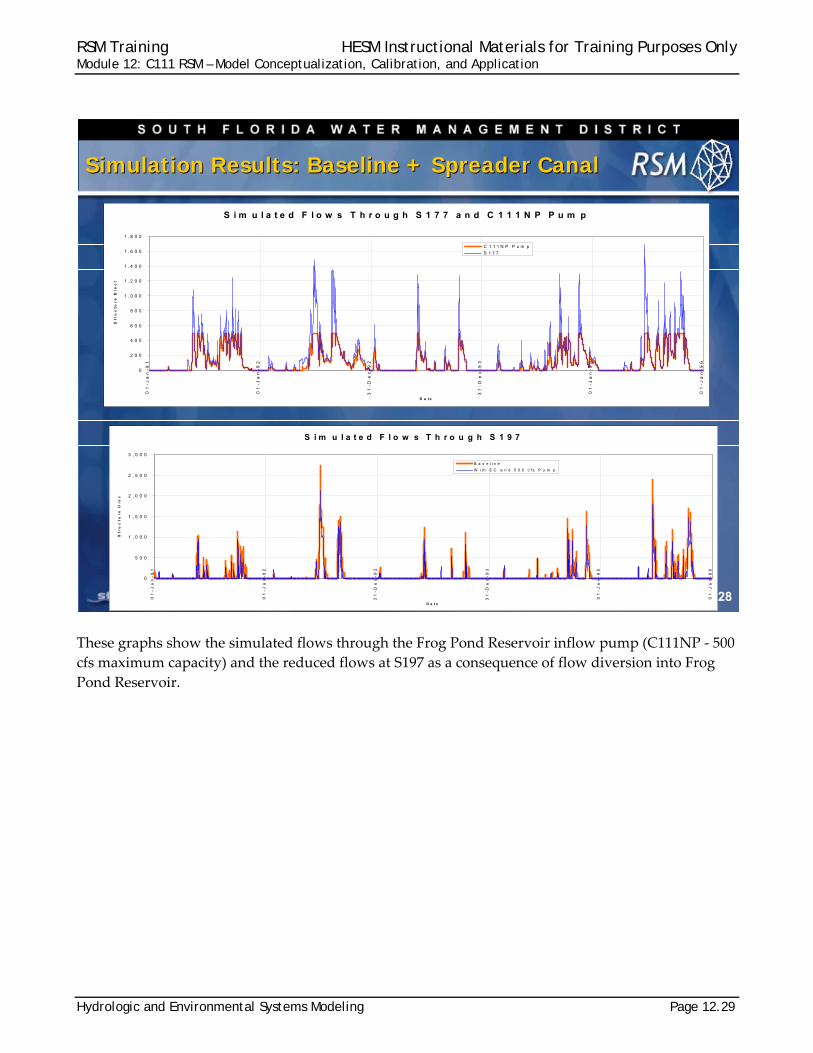
These graphs show the simulated flows through the Frog Pond Reservoir inflow pump (C111NP ‐ 500
cfs maximum capacity) and the reduced flows at S197 as a consequence of flow diversion into Frog
Pond Reservoir.
28
Simulation Results: Baseline + Spreader CanalSimulation Results: Baseline + Spreader Canal
S i m u l a t e d F l o w s T h r o u g h S 1 7 7 a n d C 1 1 1 N P P u m p
0
2 0 0
4 0 0
6 0 0
8 0 0
1 , 0 0 0
1 , 2 0 0
1 , 4 0 0
1 , 6 0 0
1 , 8 0 0
01
-Ja
n-9
1
01
-Ja
n-9
2
31
-De
c-9
2
31
-De
c-9
3
01
-Ja
n-9
5
01
-Ja
n-9
6
D a t e
Str
uc
tur
e D
isc
h
C 1 1 1 N P P u m p
S 1 7 7
S i m u l a t e d F l o w s T h r o u g h S 1 9 7
0
5 0 0
1 , 0 0 0
1 , 5 0 0
2 , 0 0 0
2 , 5 0 0
3 , 0 0 0
01
-Ja
n-9
1
01
-Ja
n-9
2
31
-De
c-9
2
31
-De
c-9
3
01
-Ja
n-9
5
01
-Ja
n-9
6
D a t e
St
ru
ct
ur
e D
isc
B a s e l i n e
W i t h S C a n d 5 0 0 c f s P u m p

RSM Training HESM Instructional Materials for Training Purposes Only Module 12: C111 RSM – Model Conceptualization, Calibration, and Application
Page 12.30 Hydrologic and Environmental Systems Modeling
The design characteristics of the Frog Pond alternative are listed in the slide above.
29
Simulation Results Baseline + Frog PondSimulation Results Baseline + Frog Pond
Frog Pond Reservoir sizes being tested vary from 513 to 745 Ac
Includes Frog Pond Reservoir pump with capacities varying from 250 cfs to 750 cfs
Frog Pond Reservoir pump operates prior to S177 being open
Flow out of reservoir is through seepage or through a control structure regulated by a fixed weir
RSM Training HESM Instructional Materials for Training Purposes Only Module 12: C111 RSM – Model Conceptualization, Calibration, and Application
Hydrologic and Environmental Systems Modeling Page 12.31
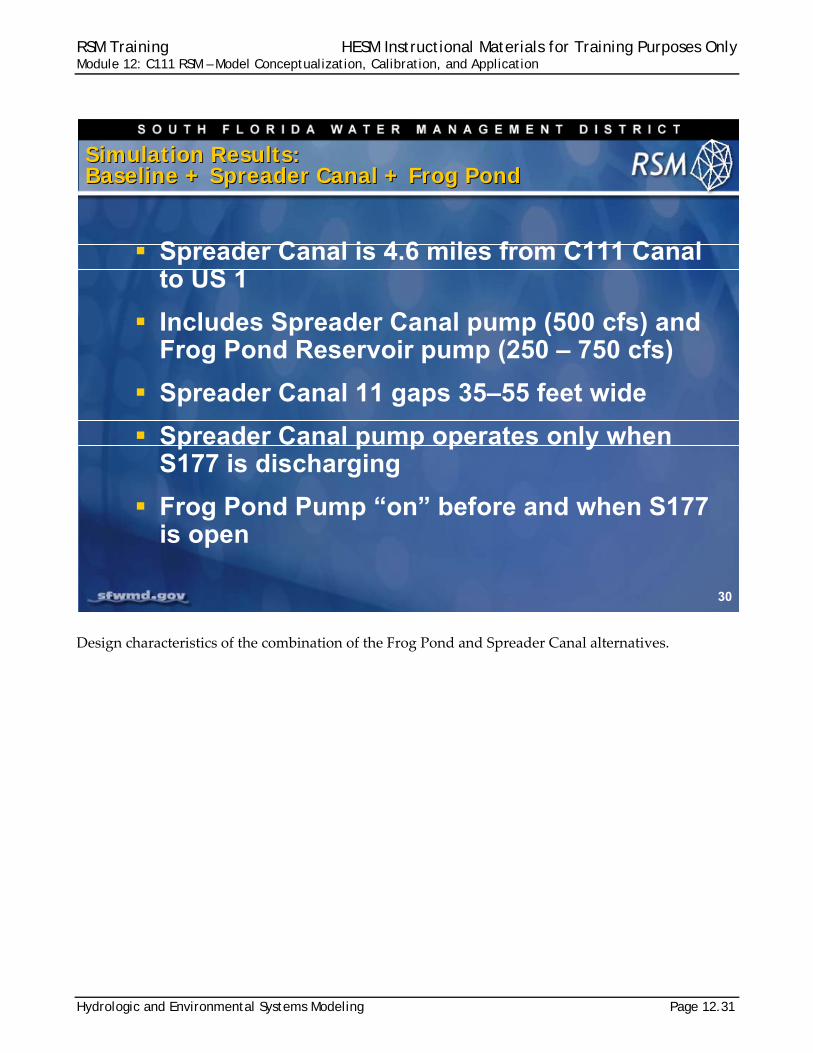
Design characteristics of the combination of the Frog Pond and Spreader Canal alternatives.
30
Simulation Results: Baseline + Spreader Canal + Frog PondSimulation Results: Baseline + Spreader Canal + Frog Pond
Spreader Canal is 4.6 miles from C111 Canal to US 1
Includes Spreader Canal pump (500 cfs) and Frog Pond Reservoir pump (250 – 750 cfs)
Spreader Canal 11 gaps 35–55 feet wide
Spreader Canal pump operates only when S177 is discharging
Frog Pond Pump “on” before and when S177 is open
RSM Training HESM Instructional Materials for Training Purposes Only Module 12: C111 RSM – Model Conceptualization, Calibration, and Application
Page 12.32 Hydrologic and Environmental Systems Modeling
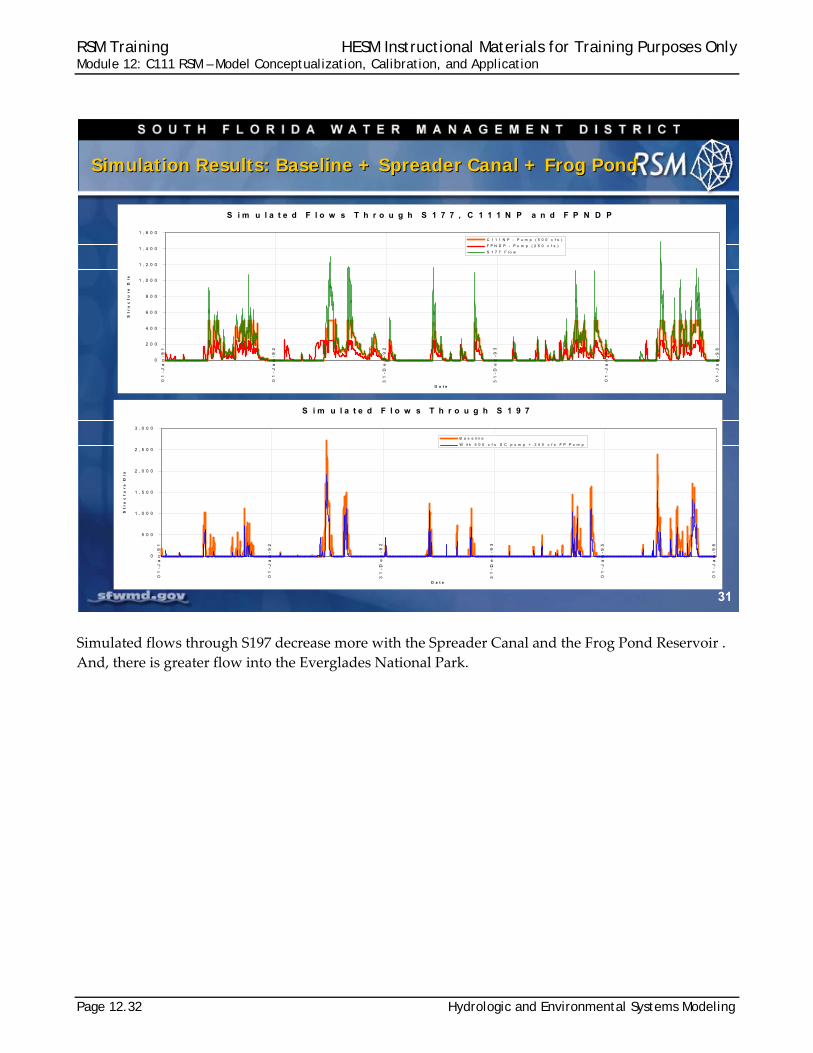
Simulated flows through S197 decrease more with the Spreader Canal and the Frog Pond Reservoir .
And, there is greater flow into the Everglades National Park.
31
Simulation Results: Baseline + Spreader Canal + Frog PondSimulation Results: Baseline + Spreader Canal + Frog Pond
S i m u l a t e d F l o w s T h r o u g h S 1 7 7 , C 1 1 1 N P a n d F P N D P
0
2 0 0
4 0 0
6 0 0
8 0 0
1 , 0 0 0
1 , 2 0 0
1 , 4 0 0
1 , 6 0 0
01
-J
an
-9
1
01
-J
an
-9
2
31
-D
ec
-9
2
31
-D
ec
-9
3
01
-J
an
-9
5
01
-J
an
-9
6
D a t e
St
ru
ct
ur
e D
is
C 1 1 1 N P - P u m p ( 5 0 0 c f s )
F P N D P - P u m p ( 2 5 0 c f s )
S 1 7 7 F l o w
S i m u l a t e d F l o w s T h r o u g h S 1 9 7
0
5 0 0
1 , 0 0 0
1 , 5 0 0
2 , 0 0 0
2 , 5 0 0
3 , 0 0 0
01
-J
an
-9
1
01
-J
an
-9
2
31
-D
ec
-9
2
31
-D
ec
-9
3
01
-J
an
-9
5
01
-J
an
-9
6
D a t e
St
ru
ct
ur
e D
is
B a s e l in e
W i t h 5 0 0 c f s S C p u m p + 2 5 0 c f s F P P u m p

RSM Training HESM Instructional Materials for Training Purposes Only Module 12: C111 RSM – Model Conceptualization, Calibration, and Application
Hydrologic and Environmental Systems Modeling Page 12.33
The discharge from the Spreader Canal into the marsh remains equivalent to the flows with the
Spreader Canal alone.
32
Spreader Canal Average Discharge Distribution Baseline + Spreader Canal + Frog Pond Reservoir
Spreader Canal Average Discharge Distribution Baseline + Spreader Canal + Frog Pond Reservoir
-30
-25
-20
-15
-10
-5
0
3127
83 (
0.5)
3127
84 (
0.75
)
3127
85 (
1)
3127
86 (
1.25
)
3127
87 (
1.5)
3127
88 (
1.74
5)
3127
90 (
1.75
5)
3127
91 (
1.99
5)
3127
92 (
2.00
5)
3127
93 (
2.24
5)
3127
94 (
2.25
6)
3127
95 (
2.49
5)
3127
96 (
2.50
6)
3127
97 (
2.74
5)
3127
98 (
2.75
3)
3127
99 (
2.99
5)
3128
00 (
3.00
3)
3128
01 (
3.24
5)
3128
02 (
3.25
2)
3128
03 (
3.49
5)
3128
04 (
3.50
2)
3128
05 (
3.74
5)
3128
06 (
3.75
6)
3128
07 (
3.99
5)
3128
08 (
4.00
6)
3128
09 (
4.24
5)
3128
10 (
4.25
4)
3128
11 (
4.64
1)
segid (mile number)
aver
ag
e fl
ow
(c
fs)
spgflow bankflow sbflow

RSM Training HESM Instructional Materials for Training Purposes Only Module 12: C111 RSM – Model Conceptualization, Calibration, and Application
Page 12.34 Hydrologic and Environmental Systems Modeling
An assessment of the flow vectors created by the RSM shows greater ponding in the marsh
downstream of the Spreader Canal.
33
Simulated Flow VectorsSimulated Flow Vectors
C111 SC BASELINE C111 SC BASELINE + SPREADER CANAL

RSM Training HESM Instructional Materials for Training Purposes Only Module 12: C111 RSM – Model Conceptualization, Calibration, and Application
Hydrologic and Environmental Systems Modeling Page 12.35
Comparison of scenarios:
1. Baseline with Frog Pond Reservoir and
2. Baseline with Frog Pond Reservoir and Spreader Canal.
The inclusion of the Spreader Canal diversion results in reduced flows at S197.
34
Simulated Flow VectorsSimulated Flow Vectors
C111 SC BASELINE + FROG POND C111 SC BASELINE + SPREADER CANAL + FROG POND

RSM Training HESM Instructional Materials for Training Purposes Only Module 12: C111 RSM – Model Conceptualization, Calibration, and Application
Page 12.36 Hydrologic and Environmental Systems Modeling
Several flow‐volume transects were established to evaluate the impact of the alternative project
formulations on the overland sheet flow and groundwater flow into specific vegetation types.
35
Flow Transect LinesFlow Transect Lines
Landuse types Location of flowgage transects

RSM Training HESM Instructional Materials for Training Purposes Only Module 12: C111 RSM – Model Conceptualization, Calibration, and Application
Hydrologic and Environmental Systems Modeling Page 12.37
Implementation of the Frog Pond Reservoir greatly increased flow across Transect 1 and Transect 2,
while reducing discharge through the C111 canal. Implementation of the Spreader Canal alone
increased the flow across Transect 6 and Transect 7 (see graph ‘b’ on the top right of the slide above).
The implementation of both structures maintained the flow across Transect 6 and Transect 7, but
decreased the flow across Transect 1, Transect 2, and Transect 3.
The C111 Spreader Canal model has shown itself to be a useful tool for evaluating the effectiveness of
spreader canals and impoundments for modifying the structure flows and flows into the marsh to be
restored.
36
C111 SC RSM Transects & Structure FlowsC111 SC RSM Transects & Structure Flows
Transect and Control Structure Cummulative Volumes (Spreader Canal Only (SC) Scenario - 1/1/1991-12/31/1995)
-200
0
200
400
600
800
1000
1200
1400
TR_1 TR_2 TR_3 TR_4 TR_5 TR_6 TR_7 TR_8 S197 S18C S177 S20
Transect line
Vo
l x 1
000
Acf
Baseline
Spreader Canal with 500 cfs Pump
Transect and Control Structure Cummulative Volumes (SC+FP Scenario - 1/1/1991-12/31/1995)
-200
0
200
400
600
800
1000
1200
1400
TR_1 TR_2 TR_3 TR_4 TR_5 TR_6 TR_7 TR_8 S197 S18C S177 S20
Transect line/Structure
Vo
l x
10
00
Ac
f
BaselineSpreader Canal w ith 500 cfs SC Pump + 250 cfs FP pump
Transect and Control Structure Cummulative Volumes (FP Scenario - 1/1/1991-12/31/1995)
-200
0
200
400
600
800
1000
1200
1400
TR_1 TR_2 TR_3 TR_4 TR_5 TR_6 TR_7 TR_8 S197 S18C S177 S20
Transect line/Structure
Vo
l x
1000
Acf
Baseline Spreader Canal w ith 250 cfs FP pump
a) b)
c)

RSM Training HESM Instructional Materials for Training Purposes Only Module 12: C111 RSM – Model Conceptualization, Calibration, and Application
Page 12.38 Hydrologic and Environmental Systems Modeling
The 2005 Base RSM is being used to evaluate
alternative project formulations for the Frog
Pond and the Spreader Canal. Loveland
Slough infiltration basins are also being
evaluated through a series of alternative
project formulations.
37
Recent UpgradesRecent Upgrades
2005 Baseline model completed and revised
• Added S332D reservoirs using the new Impoundment package
• Added inflow (from 2x2 model) at S332D as flow boundary condition
• Updated landuse to year 2005
• Operations at structure S178 have been revised and calibrated with the MSE
38
Current ApplicationsCurrent Applications
In addition to sizing the proposed Frog Pond reservoir and Spreader Canal, additional alternatives are being developed and tested for a new water quality infiltration basin south of S178 (Loveland Slough)
In addition to sizing the proposed Frog Pond reservoir and Spreader Canal, additional alternatives are being developed and tested for a new water quality infiltration basin south of S178 (Loveland Slough)

RSM Training HESM Instructional Materials for Training Purposes Only Module 12: C111 RSM – Model Conceptualization, Calibration, and Application
Hydrologic and Environmental Systems Modeling Page 12.39
KNOWLEDGE ASSESSMENT (pre- and post-lecture quiz to assess efficacy of training materials)
1. What was the purpose of the C111 Spreader Canal project? 2. How many cells and canals were in the C111 RSM? 3. What was the dominant landuse in the model domain? 4. How was the spreader canal modeled? 5. How many canal reaches have levees? 6. How big was the impoundment (i.e., number of cells)? 7. How many observations were used for calibration? 8. What parameters were calibrated? 9. What were the criteria for successful calibration? 10. Did C111 perform better than the SFWMM? 11. Did the model alternatives show a reduction in the number of high flow events at S20
and S18C?
RSM Training HESM Instructional Materials for Training Purposes Only Module 12: C111 RSM – Model Conceptualization, Calibration, and Application
Page 12.40 Hydrologic and Environmental Systems Modeling
Answers
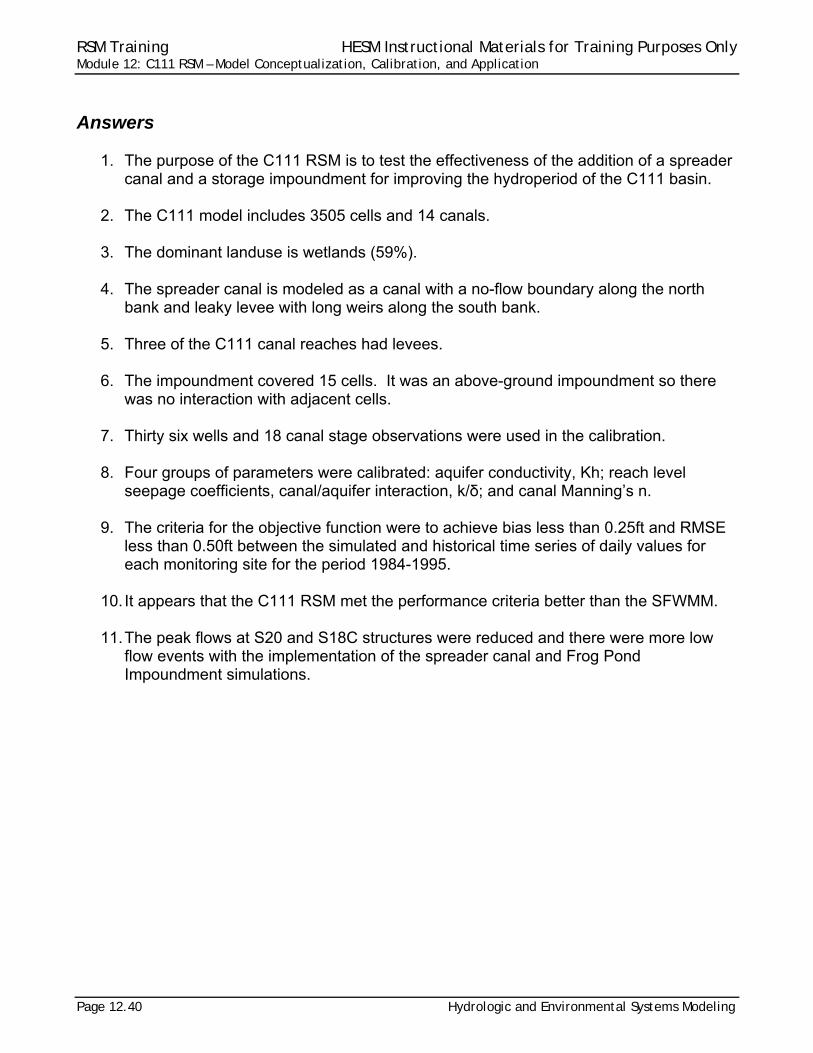
1. The purpose of the C111 RSM is to test the effectiveness of the addition of a spreader canal and a storage impoundment for improving the hydroperiod of the C111 basin.
2. The C111 model includes 3505 cells and 14 canals. 3. The dominant landuse is wetlands (59%). 4. The spreader canal is modeled as a canal with a no-flow boundary along the north
bank and leaky levee with long weirs along the south bank. 5. Three of the C111 canal reaches had levees. 6. The impoundment covered 15 cells. It was an above-ground impoundment so there
was no interaction with adjacent cells. 7. Thirty six wells and 18 canal stage observations were used in the calibration. 8. Four groups of parameters were calibrated: aquifer conductivity, Kh; reach level
seepage coefficients, canal/aquifer interaction, k/δ; and canal Manning’s n. 9. The criteria for the objective function were to achieve bias less than 0.25ft and RMSE
less than 0.50ft between the simulated and historical time series of daily values for each monitoring site for the period 1984-1995.
10. It appears that the C111 RSM met the performance criteria better than the SFWMM. 11. The peak flows at S20 and S18C structures were reduced and there were more low
flow events with the implementation of the spreader canal and Frog Pond Impoundment simulations.

RSM Training HESM Instructional Materials for Training Purposes Only Module 12: C111 RSM – Model Conceptualization, Calibration, and Application
Hydrologic and Environmental Systems Modeling Page 12.41
Lab 12: C111 RSM – Model Conceptualization, Calibration, and Application
Time Estimate: 3 hours
Training Objective: To learn subregional modeling components by studying the content of existing RSM files
There are several subregional RSMs currently being implemented by the South Florida
Water Management District. These RSMs provide the most comprehensive application
of the RSM features. One of the most effective methods for learning the Regional
Simulation Model (RSM) is to explore the construction of other RSM applications.
In addition to modeling the flood control and water supply requirements for each
subregion, each RSM has unique model features associated with the landscape and
special subregional water resources issues.
There are currently four subregional models which include:
C-111 subbasin (C111) Everglades- Lower East Coast Service Area (Glades-LECSA) Lake Okeechobee Service Area (LOSA-EAA) Biscayne Bay Coastal Wetlands (BBCW)
Model Conceptualization, Calibration, and ApplicationModel Conceptualization, Calibration, and Application
C111 Spreader Canal / Frog Pond Reservoir RSM

RSM Training HESM Instructional Materials for Training Purposes Only Module 12: C111 RSM – Model Conceptualization, Calibration, and Application
Page 12.42 Hydrologic and Environmental Systems Modeling
NOTE:
For ease of navigation, you may wish to set an environment variable to the directory where you install the RSM code using the syntax
setenv RSM <path>
For SFWMD modelers, the path you should use for the NAS is:
/nw/oomdata_ws/nw/oom/sfrsm/workdirs/<username>/trunk
setenv RSM /nw/oomdata_ws/nw/oom/sfrsm/workdirs/<username>/trunk
Once you have set the RSM environment variable to your trunk path, you can use $RSM in any path statement, such as:
cd $RSM/benchmarks
Training files are currently located in the following directories:
INTERNAL_TRAINING | |____data | |__geographic | |__C111 | |__rain+et | |__glades_lecsa | |__losa_eaa | |__BBCW | |____trunk | |___benchmarks | |___hpmbud | |____labs
Files for this lab are located in the labs/lab12_subregion directory. Additional materials in the directory include:
C-111_WRAC_Presentation-12_06_06_Rev1.pdf
RSM Training HESM Instructional Materials for Training Purposes Only Module 12: C111 RSM – Model Conceptualization, Calibration, and Application
Hydrologic and Environmental Systems Modeling Page 12.43
Activity 12.1 Components of a Subregional Model
Overview This activity includes five exercises:
Exercise 12.1.1. Find input files for C111 RSM Exercise 12.1.2. Review content of C111 RSM input files Exercise 12.1.3. Review content of Biscayne Bay Coastal Wetlands RSM input files Exercise 12.1.4. Review content of Lake Okeechobee Service Area (LOSA-EAA) RSM
input files Exercise 12.1.5. Run the LOSA-EAA RSM
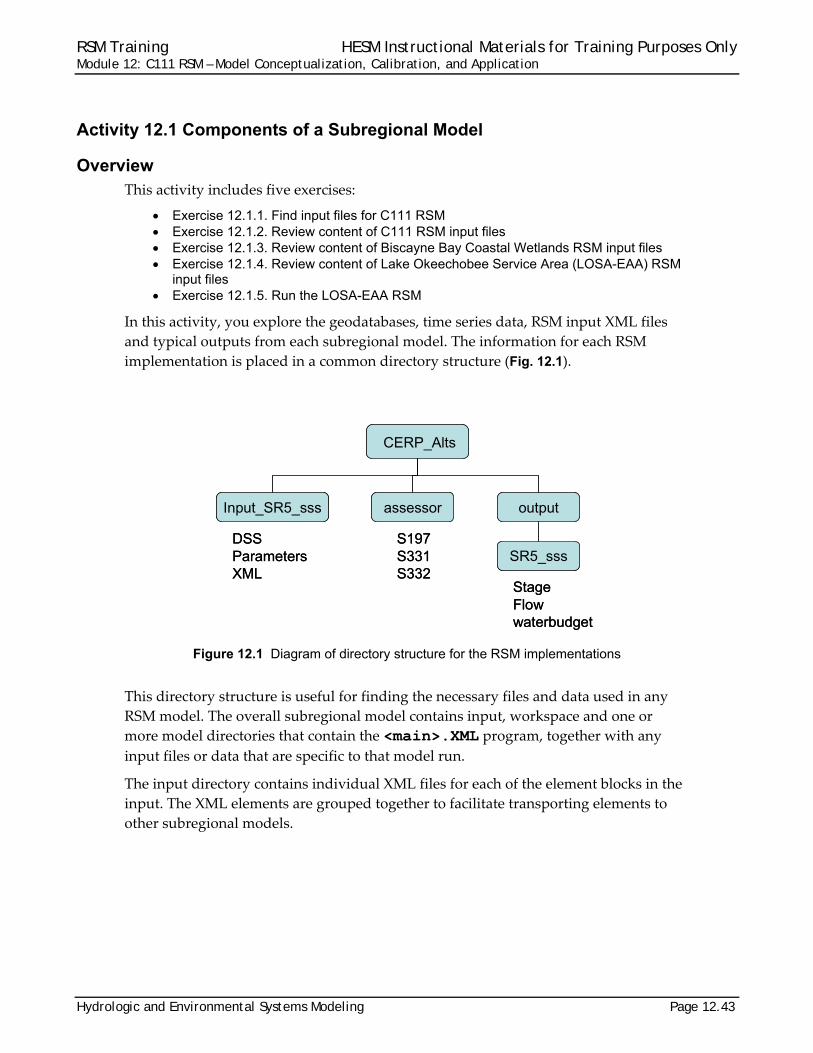
In this activity, you explore the geodatabases, time series data, RSM input XML files
and typical outputs from each subregional model. The information for each RSM
implementation is placed in a common directory structure (Fig. 12.1).
Figure 12.1 Diagram of directory structure for the RSM implementations
This directory structure is useful for finding the necessary files and data used in any
RSM model. The overall subregional model contains input, workspace and one or
more model directories that contain the <main>.XML program, together with any
input files or data that are specific to that model run.
The input directory contains individual XML files for each of the element blocks in the
input. The XML elements are grouped together to facilitate transporting elements to
other subregional models.
CERP_Alts
assessor
SR5_sss
outputInput_SR5_sss
S197S331S332
DSSParametersXML
StageFlowwaterbudget
CERP_Alts
assessor
SR5_sss
outputInput_SR5_sss
S197S331S332
DSSParametersXML
StageFlowwaterbudget

RSM Training HESM Instructional Materials for Training Purposes Only Module 12: C111 RSM – Model Conceptualization, Calibration, and Application
Page 12.44 Hydrologic and Environmental Systems Modeling
Exercise 12.1.1 Find input files for C111 RSM
Four subregional RSM implementations have been created for south Florida. Each of
the four models contains several input XML and data files that provide the
components that are required for a complete RSM implementation.
1. In this exercise you will identify each of the input files for the C111 model:
$RSM/../data/C111/run_c111_mse_SR5_sss.xml
Similar files can be identified for each subregional model. This exercise provides a
first look at the complexity of a subregional model.
File description File name
Main program
<mesh> block
Mesh geometry
Surface elevations
Aquifer bottom elevations
Initial heads
Hydrologic Process Modules
Conveyance parameters
Rainfall depths
Reference ET depths
Aquifer hydraulic conductivities
Public water supply wells
Levee boundary conditions
<network> block
Network geometry
Initial heads
Arcs_index
Canal boundary conditions
Segmentsource flow data
Segmentghb tidal data
<Lakes> Block
Lake inflow source data
<watermovers> block
Levee seepage parameters
<assessors> block

RSM Training HESM Instructional Materials for Training Purposes Only Module 12: C111 RSM – Model Conceptualization, Calibration, and Application
Hydrologic and Environmental Systems Modeling Page 12.45
File description File name
Special assessors
<mse_network> block
mse_network properties
<controllers> block
Controllers for mseStructures
<Rulecurves> block
Annual stage schedules
RSM Training HESM Instructional Materials for Training Purposes Only Module 12: C111 RSM – Model Conceptualization, Calibration, and Application
Page 12.46 Hydrologic and Environmental Systems Modeling
Exercise 12.1.2: Review content of C111 RSM input files It is not practical for you to run the model in this lab because the C111 Model requires
13 minutes for each year. This exercise is designed to acclimate you to the content of
the standard files used in a subregional simulation.
1. Go to the $RSM/../data/C111/input_SR5_sss directory and look at the
contents of each XML file
List the main XML file What are the different types of boundary conditions implemented in the model? How many mesh cells are in the model? What is the deepest approximate bottom of the aquifer? How many segments are in the model? How many different HPMs are used in the model? How many canal boundary conditions are implemented in the model? Which type? What kinds of waterbodies are used in the model? What is the lake used for? What kinds of user-defined watermovers are used in the model? What types of output are generated from the model? How many levee sections are there between S176 to S177? How many cells does the S332DN impoundment cover? How many special assessors are used in the model? How many water control units <mse_units> are in the mse_network?
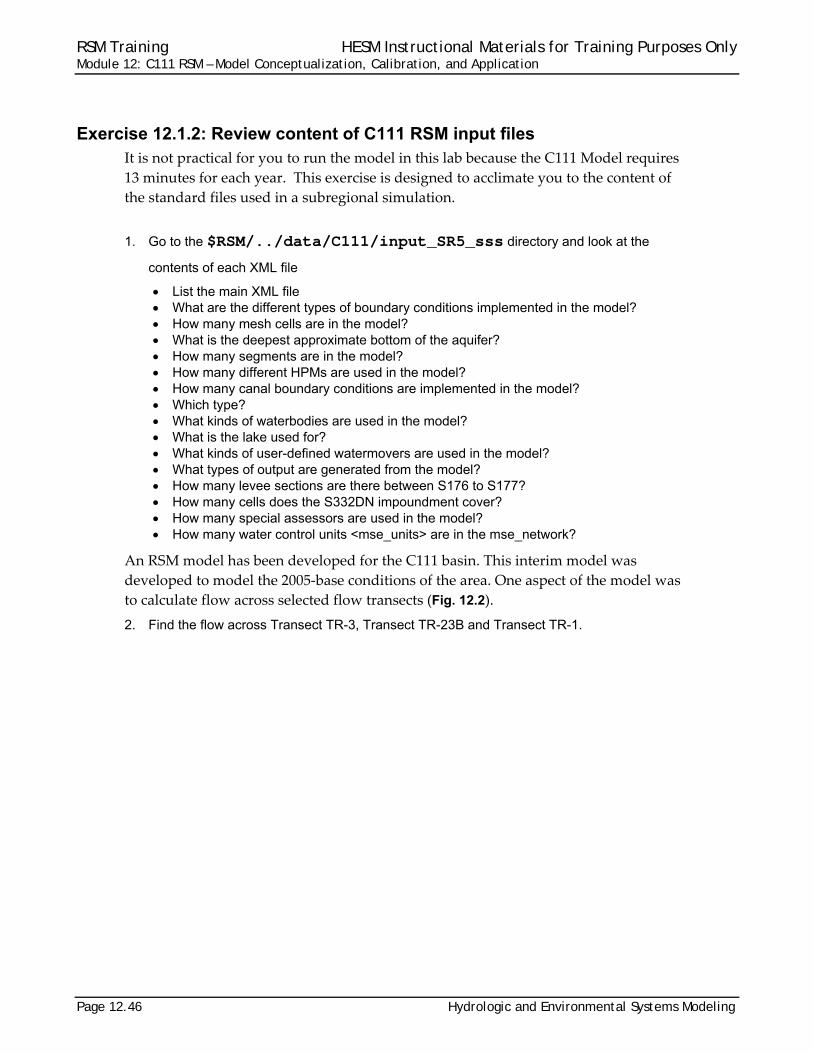
An RSM model has been developed for the C111 basin. This interim model was
developed to model the 2005‐base conditions of the area. One aspect of the model was
to calculate flow across selected flow transects (Fig. 12.2).
2. Find the flow across Transect TR-3, Transect TR-23B and Transect TR-1.
RSM Training HESM Instructional Materials for Training Purposes Only Module 12: C111 RSM – Model Conceptualization, Calibration, and Application
Hydrologic and Environmental Systems Modeling Page 12.47
Figure 12.2 The mesh, canal network and flowgages used in the C111 Basin

RSM Training HESM Instructional Materials for Training Purposes Only Module 12: C111 RSM – Model Conceptualization, Calibration, and Application
Page 12.48 Hydrologic and Environmental Systems Modeling
Exercise 12.1.3 Review content of Biscayne Bay Coastal Wetlands RSM input files
An RSM model was developed for the coastal subregion of south Miami‐Dade County.
The Biscayne Aquifer underlying the domain has high and varied hydraulic
conductivity (Fig. 12.3). There is a dense network of canals to provide adequate
drainage to this low gradient area. The model XML code is organized in considerable
detail (Fig. 12.4).
a) Distribution of aquifer hydraulic conductivity b) Locations of canals and structures
Figure 12.3 Biscayne Bay Coastal Wetlands RSM domain and mesh

RSM Training HESM Instructional Materials for Training Purposes Only Module 12: C111 RSM – Model Conceptualization, Calibration, and Application
Hydrologic and Environmental Systems Modeling Page 12.49
3. Go to the Biscayne Bay Coastal Wetlands (BBCW) directory and identify the different
components of the BBCW RSM. The input data are located in the
$RSM/../data/BBCW directory. The main model, run_calib_bbcw.xml, is
located in the directory: $RSM/../data/BBCW/bbcw
How are the boundary conditions (BCs) organized for the model? What kinds of BCs are applied to the mesh? What data is in the aquifer directory? How many different HPM indexed-entry files are in the HPM directory? What are the boundary conditions on the canal network and how many BCs are
specified? What kinds of watermovers are used in the BBCW model? What outputs are generated from this model? How many groundwater conductivity zones are used in the model? Looking at the network, how many canal-arc parameter sets are there? How many canal segments are in the BBCW RSM? What is the range in leakage coefficient among the canal reaches? What time series data are used in this model?
4. Run the BBCW model using the RSM Graphical User Interface (RSM GUI).
5. Run makePlots.py in the ./pest/bbcw_test directory:
/opt/local/share2/bin/dssvue ./bin/makePlots.py ./bbcw_fetch_calibqh1.ctl
6. Observe the results in the ./pest/bbcw_test/plots subdirectory.
Note that the model performs very well for some structures and poorly at other
structures.
Figure 12.4 BBCW RSM XML code organization
bbcw
output bininput Run files
canal mse
monitors
data
BC
topo
mesh
hpm
aquifer
watermover

RSM Training HESM Instructional Materials for Training Purposes Only Module 12: C111 RSM – Model Conceptualization, Calibration, and Application
Page 12.50 Hydrologic and Environmental Systems Modeling
LOSA-EAA RSM The LOSA‐EAA model was developed to simulate the water supply requirements and
flood control management issues for the agricultural land in the Everglades
Agricultural Area (EAA).
The LOSA‐EAA RSM is a development model used to test the implementation of water
control districts (WCDs) for the EAA. It models the surface hydrology of agricultural
land through the implementation of hub HPMs and water control districts. The hub
HPMs describe the distribution of the HPMs, within each cell, for all of the cells in that
area.
The WCDs are designed to manage the water levels in the secondary canal system
within each WCD. The agricultural land is sub‐irrigated and the water table is
managed by managing the canal water levels.
LOSA-EAA RSM Geodatabase The geodatabase $RSM/../data/losa_eaa/workspace/losa_mesh.mxd contains the spatial information about the LOSA‐EAA RSM domain including the
structures, mesh_framework, and mesh (Fig. 12.5).
Figure 12.5 Lake Okeechobee Service Area (LOSA-EAA) RSM domain and mesh
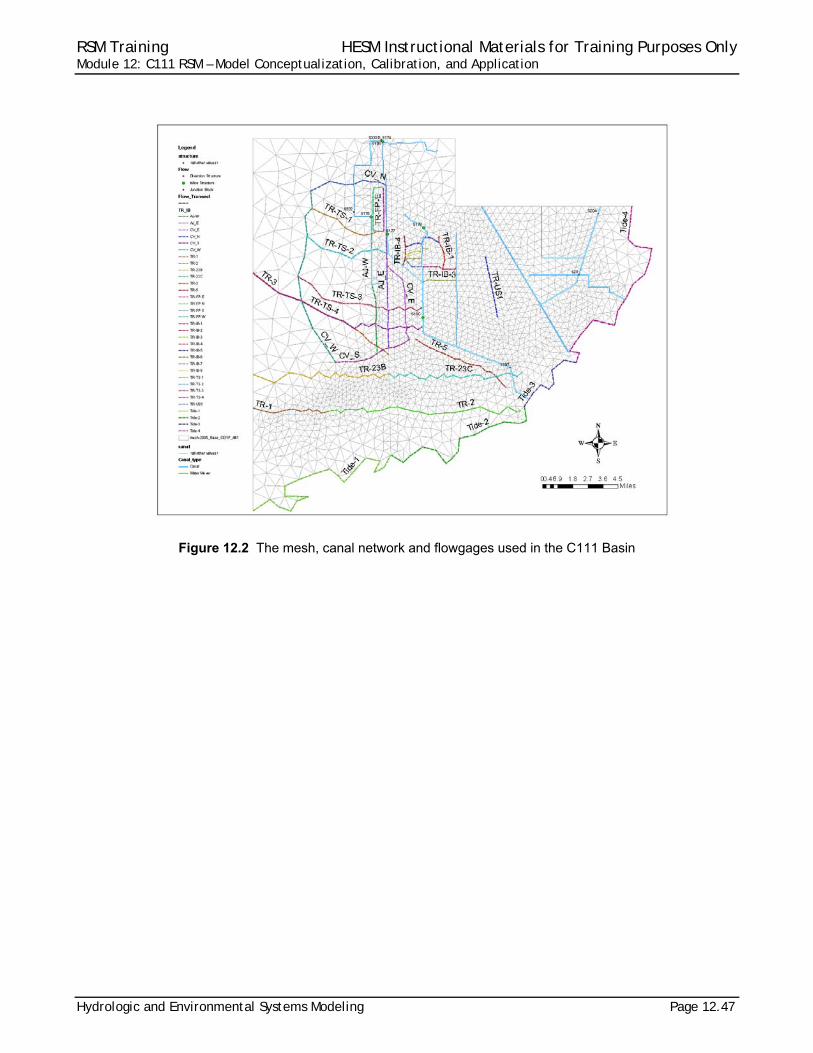
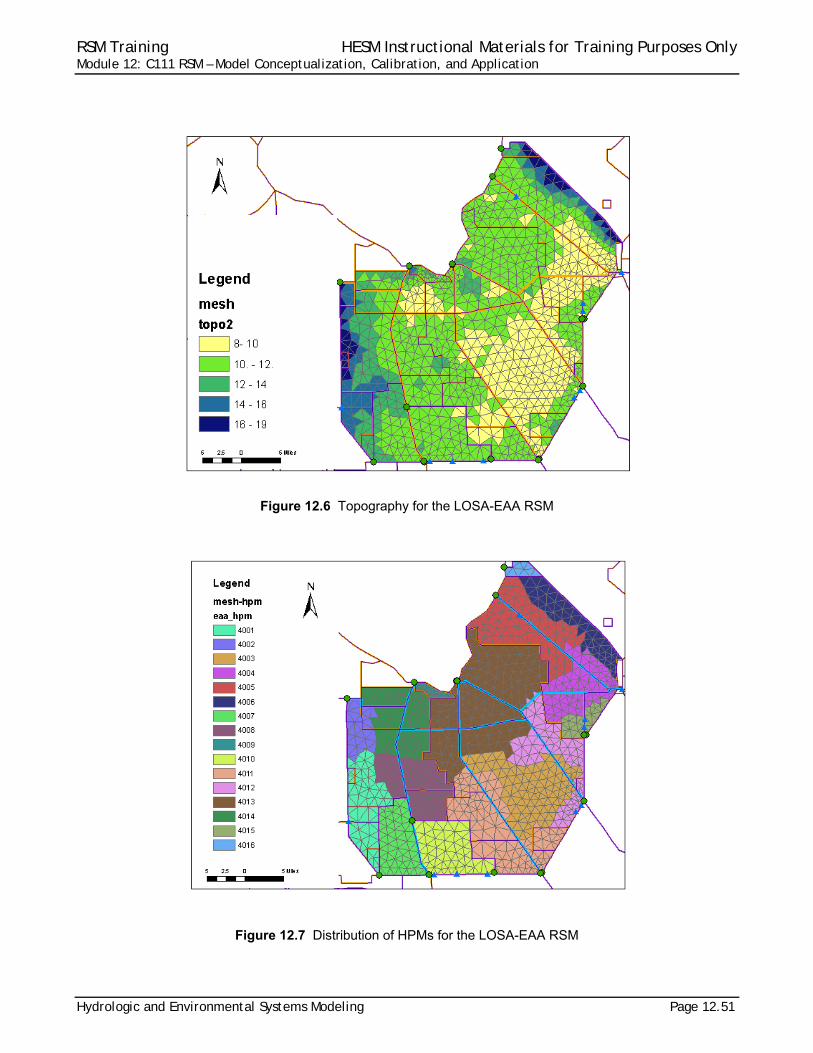
The topography (Fig. 12.6), along with the levees (no‐flow boundaries) and canals,
define the locations of the water control districts (Fig. 12.7).
RSM Training HESM Instructional Materials for Training Purposes Only Module 12: C111 RSM – Model Conceptualization, Calibration, and Application
Hydrologic and Environmental Systems Modeling Page 12.51
Figure 12.6 Topography for the LOSA-EAA RSM
Figure 12.7 Distribution of HPMs for the LOSA-EAA RSM
RSM Training HESM Instructional Materials for Training Purposes Only Module 12: C111 RSM – Model Conceptualization, Calibration, and Application
Page 12.52 Hydrologic and Environmental Systems Modeling
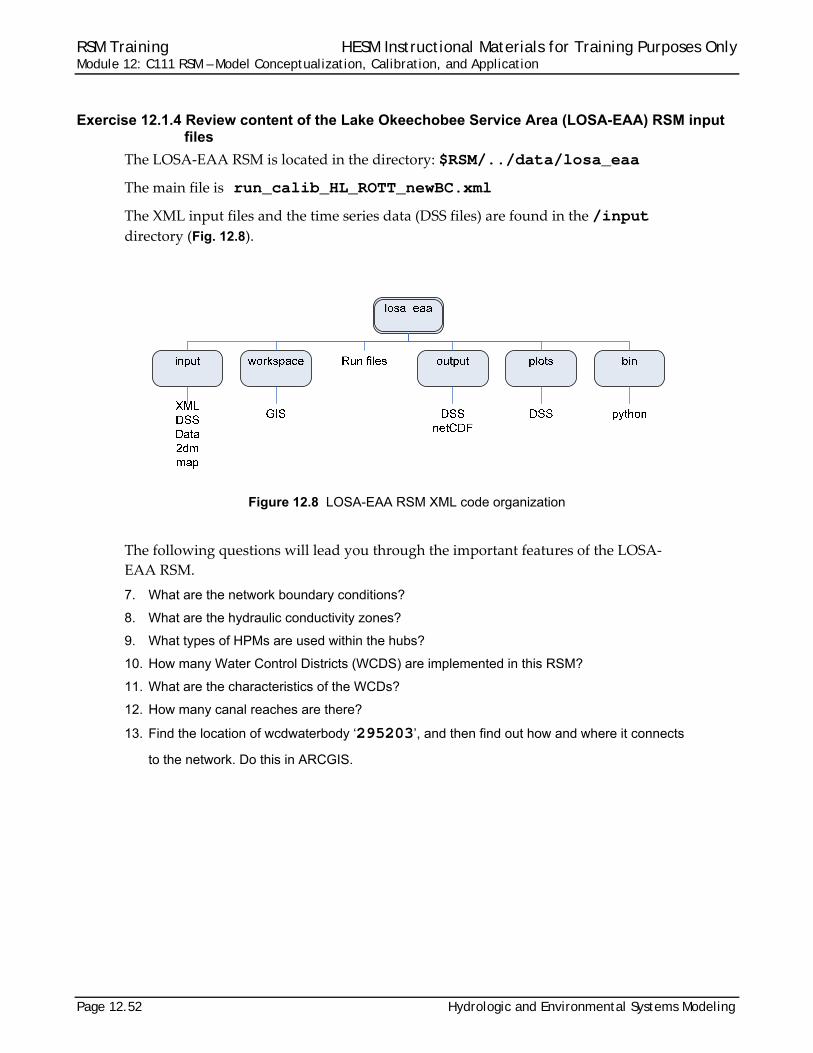
Exercise 12.1.4 Review content of the Lake Okeechobee Service Area (LOSA-EAA) RSM input files
The LOSA‐EAA RSM is located in the directory: $RSM/../data/losa_eaa
The main file is run_calib_HL_ROTT_newBC.xml
The XML input files and the time series data (DSS files) are found in the /input directory (Fig. 12.8).
Figure 12.8 LOSA-EAA RSM XML code organization
The following questions will lead you through the important features of the LOSA‐
EAA RSM.
7. What are the network boundary conditions?
8. What are the hydraulic conductivity zones?
9. What types of HPMs are used within the hubs?
10. How many Water Control Districts (WCDS) are implemented in this RSM?
11. What are the characteristics of the WCDs?
12. How many canal reaches are there?
13. Find the location of wcdwaterbody ‘295203’, and then find out how and where it connects
to the network. Do this in ARCGIS.
RSM Training HESM Instructional Materials for Training Purposes Only Module 12: C111 RSM – Model Conceptualization, Calibration, and Application
Hydrologic and Environmental Systems Modeling Page 12.53
Exercise 12.1.5 Run the LOSA-EAA RSM
14. Run the model (run_calib_HL_ROTT_newBC.xml) using the RSM GUI.
15. Compare simulated and historical stage time series for selected structures:
Go to $RSM/../data/losa_eaa directory Run the Python script to create the DSS file:
./dssvue ./bin/post_process_verify.py ./bin/verify_stage_plot_daily.ctl
16. Run HecDSSVue from the RSM GUI and open ./output/post_process.dss
17. Select “calc” and “HISTORICAL” parts for the same structure and plot.
How well does the model simulate historical flows? What other comparisons can be made from post_process.dss file?

RSM Training HESM Instructional Materials for Training Purposes Only Module 12: C111 RSM – Model Conceptualization, Calibration, and Application
Page 12.54 Hydrologic and Environmental Systems Modeling
RSM Training HESM Instructional Materials for Training Purposes Only Module 12: C111 RSM – Model Conceptualization, Calibration, and Application
Hydrologic and Environmental Systems Modeling Page 12.55
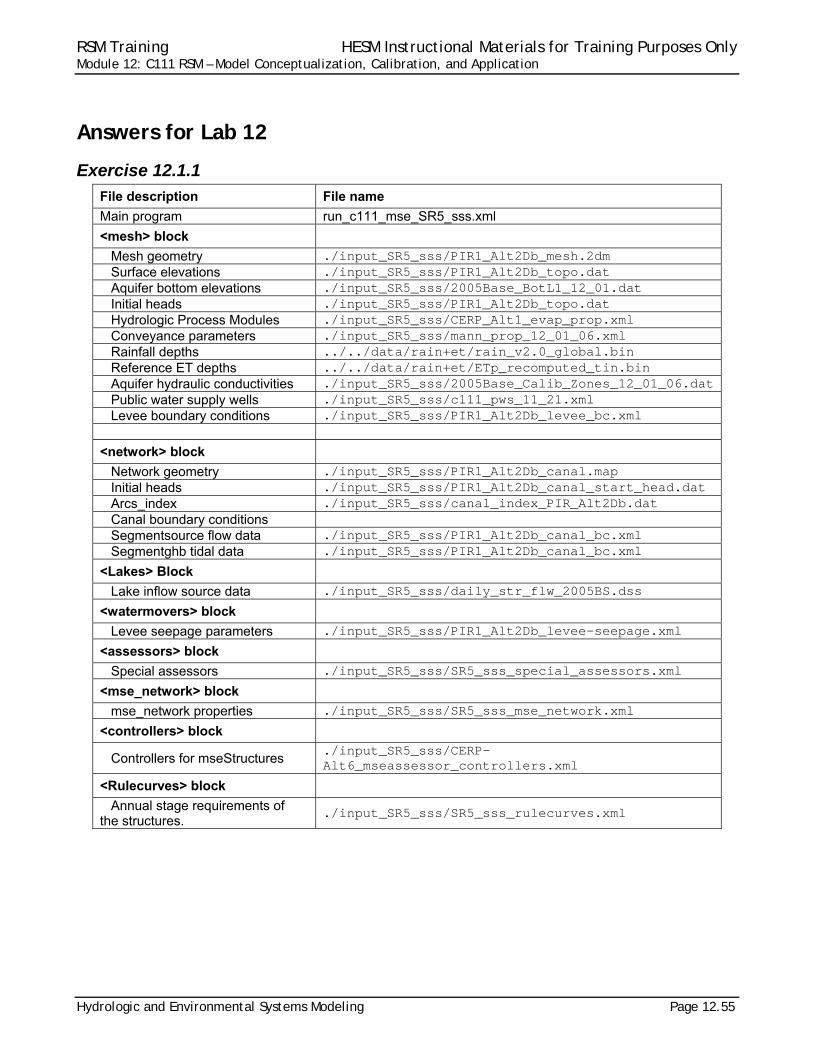
Answers for Lab 12
Exercise 12.1.1
File description File name
Main program run_c111_mse_SR5_sss.xml
<mesh> block
Mesh geometry ./input_SR5_sss/PIR1_Alt2Db_mesh.2dm Surface elevations ./input_SR5_sss/PIR1_Alt2Db_topo.dat Aquifer bottom elevations ./input_SR5_sss/2005Base_BotL1_12_01.dat Initial heads ./input_SR5_sss/PIR1_Alt2Db_topo.dat Hydrologic Process Modules ./input_SR5_sss/CERP_Alt1_evap_prop.xml Conveyance parameters ./input_SR5_sss/mann_prop_12_01_06.xml Rainfall depths ../../data/rain+et/rain_v2.0_global.bin Reference ET depths ../../data/rain+et/ETp_recomputed_tin.bin Aquifer hydraulic conductivities ./input_SR5_sss/2005Base_Calib_Zones_12_01_06.dat Public water supply wells ./input_SR5_sss/c111_pws_11_21.xml Levee boundary conditions ./input_SR5_sss/PIR1_Alt2Db_levee_bc.xml
<network> block
Network geometry ./input_SR5_sss/PIR1_Alt2Db_canal.map Initial heads ./input_SR5_sss/PIR1_Alt2Db_canal_start_head.dat Arcs_index ./input_SR5_sss/canal_index_PIR_Alt2Db.dat Canal boundary conditions Segmentsource flow data ./input_SR5_sss/PIR1_Alt2Db_canal_bc.xml Segmentghb tidal data ./input_SR5_sss/PIR1_Alt2Db_canal_bc.xml
<Lakes> Block
Lake inflow source data ./input_SR5_sss/daily_str_flw_2005BS.dss
<watermovers> block
Levee seepage parameters ./input_SR5_sss/PIR1_Alt2Db_levee-seepage.xml
<assessors> block
Special assessors ./input_SR5_sss/SR5_sss_special_assessors.xml
<mse_network> block
mse_network properties ./input_SR5_sss/SR5_sss_mse_network.xml
<controllers> block
Controllers for mseStructures ./input_SR5_sss/CERP-Alt6_mseassessor_controllers.xml
<Rulecurves> block
Annual stage requirements of the structures.
./input_SR5_sss/SR5_sss_rulecurves.xml

RSM Training HESM Instructional Materials for Training Purposes Only Module 12: C111 RSM – Model Conceptualization, Calibration, and Application
Page 12.56 Hydrologic and Environmental Systems Modeling
Exercise 12.1.2 1. Answers to individual bullets:
List the Main XML file: run_c111_mse_SR5_sss.xml
What are the different types of boundary conditions implemented in the model?
(Boundary conditions are in the file: mesh_bc_11_01_IOP.xml)
pws wells
levees
inflow wells representing inflows to the perimeter cells
wallghb representing the todal BC
How many mesh cells are in the model?
3545 mesh cells (look at any of the mesh attribute files: topo, shead, bottom for the
number)
What is the deepest approximate bottom of the aquifer?
Bottom of aquifer: 77 ft (look in c111/input_SR5_sss/2005Base_Bot1_1_12_01.dat;
values range from ‐40 to ‐80)
How many segments are in the model?
57 segments (count the lines in the PIR1_alt2Db_canal_start_head_7_12.dat file)
How many different HPMs are used in the model?
27 HPMs (look at the number of HPMs in the evap_prop file)
How many canal boundary conditions are implemented in the model and which type?
7 canal BCs
Three <segmentghb> for tides and four <segmentsource> for canals
What kinds of waterbodies are used in the model?
cells, segments, impoundments and lakes
What is the lake used for?
The dummy lake is used to provide a source of water for impoundment.
What kinds of user‐defined watermovers are used in the model?
<genxweir>, <mseStruc> and <setflow>
What types of output are generated from the model?
Cell heads
junction flows
segment heads
watermover flows
wcu flows
flowgages flows

RSM Training HESM Instructional Materials for Training Purposes Only Module 12: C111 RSM – Model Conceptualization, Calibration, and Application
Hydrologic and Environmental Systems Modeling Page 12.57
globalmonitor heads & overland flow vector
budgetpackage
psbudgetpackage
impoundment heads
flows
rain
ET
How many levee sections are there between S176 to S177?
14 (list the contents of PIR1_Alt2Db_levee-seepage.xml)
How many cells does the S332DN impoundment cover?
6
How many special assessors are used in the model?
2 (view the contents of special_assessors.xml)
How many water control units <mse_units> are in the mse_network?
9 (list the contents of the SR5_sss_mse_network.xml file and count <mse_unit>)
2. Find the flow across Transect TR‐3, Transect TR‐23B and Transect TR‐1
(open transect_flows_2005Baseline.dss; use HEC_DSS_Vue statistics function for CY 1984)
Flow across Transect TR‐3: GW= ____ ft3, OL=____ ft3
Flow across Transect TR‐23B: GW=3.02e9 ft3, OL=2.66e9 ft3
Flow across Transect TR‐1: GW=4.22e8ft3, OL=1.20e9 ft3
RSM Training HESM Instructional Materials for Training Purposes Only Module 12: C111 RSM – Model Conceptualization, Calibration, and Application
Page 12.58 Hydrologic and Environmental Systems Modeling
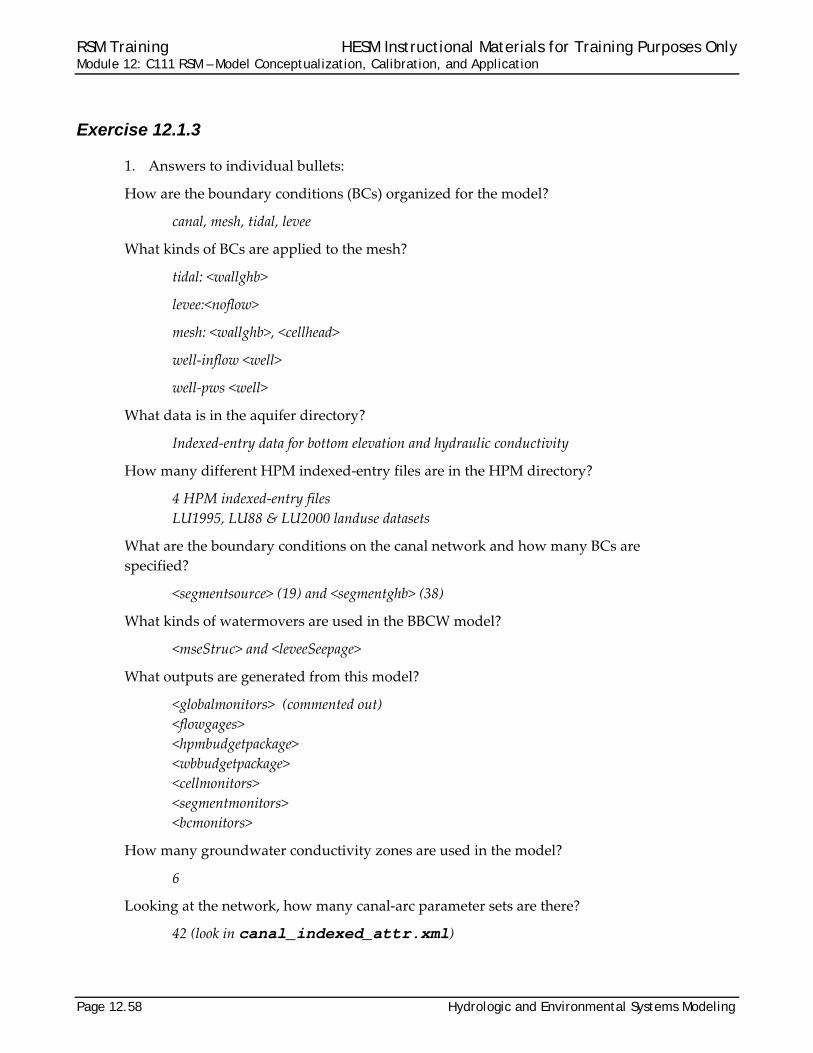
Exercise 12.1.3
1. Answers to individual bullets:
How are the boundary conditions (BCs) organized for the model?
canal, mesh, tidal, levee
What kinds of BCs are applied to the mesh?
tidal: <wallghb>
levee:<noflow>
mesh: <wallghb>, <cellhead>
well‐inflow <well>
well‐pws <well>
What data is in the aquifer directory?
Indexed‐entry data for bottom elevation and hydraulic conductivity
How many different HPM indexed‐entry files are in the HPM directory?
4 HPM indexed‐entry files
LU1995, LU88 & LU2000 landuse datasets
What are the boundary conditions on the canal network and how many BCs are
specified?
<segmentsource> (19) and <segmentghb> (38)
What kinds of watermovers are used in the BBCW model?
<mseStruc> and <leveeSeepage>
What outputs are generated from this model?
<globalmonitors> (commented out)
<flowgages>
<hpmbudgetpackage>
<wbbudgetpackage>
<cellmonitors>
<segmentmonitors>
<bcmonitors>
How many groundwater conductivity zones are used in the model?
6
Looking at the network, how many canal‐arc parameter sets are there?
42 (look in canal_indexed_attr.xml)

RSM Training HESM Instructional Materials for Training Purposes Only Module 12: C111 RSM – Model Conceptualization, Calibration, and Application
Hydrologic and Environmental Systems Modeling Page 12.59
How many canal segments are in the BBCW RSM?
332
What is the range in leakage coefficient among the canal reaches?
0.0 to 1e‐6
What time series data are used in this model?
rain_v2.0_global.bin
ETp_recomputed_tin.bin
north_bc_wallghb.dss
sfwmm_calib8395_bc_bbcw.dss
sfwmm_west_bc_bbcw_8395.dss
rsm_CalibVerif_v1.2.dss
RSM_TIDES_2006.dss
all_canal_bc.dss
all_bbw_historical.dss
all_bbw_historical_dbhydro.dss
all_canal_bc.dss
daily_str_flw.dss
sfwmm_cv_v54_gages_lecsaglades.dss

RSM Training HESM Instructional Materials for Training Purposes Only Module 12: C111 RSM – Model Conceptualization, Calibration, and Application
Page 12.60 Hydrologic and Environmental Systems Modeling
Exercise 12.1.4
1. What are the network boundary conditions?
5 network boundary conditions:
<segmentsource> elements using the flow_v5.0_09292003.dss file
<segmentghb> for the five pumped discharge structures for the EAA, using observed
stages from eaa_obs_canal_stage.dss file for the downstream boundary
2. What are the hydraulic conductivity zones?
1) Rotenberger, 2) Holeyland, 3) remaining EAA. Little variability is being modeled.
3. What types of HPMs are used within the hubs?
Find the reference to the HPMs within the <mesh> block (&eaa_hpms;) which points at the LOSA_eaa_hub.xml. There are 14 HPM hubs that are 95% sugarcane and 5% pasture, and two hubs that are scrub and cattail.
4. How many Water Control Districts (WCDs) are implemented in this RSM?
30 WCDs (open the eaa_wcd.xml file to find a description of the WCD wcdwaterbodies and wcdmovers. Note: the eaa_wcd.init file provides the initial head for each waterbody. Open that file and count the number of WCDs.)
5. What are the characteristics of the WCDs?
Use ‘grep’ to list the components of the wcdmovers at the command line:
grep segwidth eaa_wcd.xml | more
This provides a method to determine the characteristics of the WCDs if the
design documents are not available. Repeat for other properties.
wcdwaterbodies are 5.0 ft wide for all wcdwaterbodies
Leakagecoeff = 7.76e‐7 ft/sec for all wcdwaterbodies
Lengths are variable for all cells
BotElev are constant for all wcdwaterbodies
Bankheight = 0.10 and bankcoeff = 0.00
6. How many canal reaches are there?
8 canal reaches, 103 segments. There is one reach for each section of the primary canals.
7. Find the location of wcdwaterbody ‘295203’, and then find out how and where it
connects to the network.
The WCD is connected to the network at segment ‘310459’; it is just upstream of
pumpstation S8. (Open the losa_mesh_other.mxd file and symbolize the eaa_wcd_zn feature class. Find wcd_zn = ‘203’. From the wcd_pumps.xml determine the connection. In ARCGIS, use identity to find segment ‘310459’.)

RSM Training HESM Instructional Materials for Training Purposes Only Module 12: C111 RSM – Model Conceptualization, Calibration, and Application
Hydrologic and Environmental Systems Modeling Page 12.61
Exercise 12.1.5
How well does the model simulate historical flows?
For structure S7, the calculated low‐flows are lower than the historical ones and some
peaks are too high. Overall, the simulation is good.
For structure S6, the calculated flows follow the historical pattern well, but are
generally too high.
For structure S8, the calculated low‐flows are lower than the historical flows. The model
generally follows the flow pattern and does better after 1987.
For structure S5A, the model does a very good job of simulating flows.
The simulated runoff pattern is very close to the historical runoff in magnitude and
pattern.
The water demand pattern matches well for the model but the magnitude of demands is
only okay.
Comparisons can also be made for the irrigation demand and agricultural runoff.

RSM Training HESM Instructional Materials for Training Purposes Only Module 12: C111 RSM – Model Conceptualization, Calibration, and Application
Page 12.62 Hydrologic and Environmental Systems Modeling

RSM Training HESM Instructional Materials for Training Purposes Only Module 12: C111 RSM – Model Conceptualization, Calibration, and Application
Hydrologic and Environmental Systems Modeling Page 12.63
Index 2005-base conditions ............................. 46 aquifer ................ 13, 16, 40, 48, 49, 56, 58
hydraulic conductivity .................... 44, 55 aquifer bottom ................................... 46, 56 attribute .................................................. 56 basin ........................................... 38, 40, 46 BBCW, see also Biscayne Bay Coastal
Wetlands ..................... 41, 42, 49, 58, 59 BC, see also input data - boundary
conditions ................................ 49, 56, 58 benchmark .............................................. 42 bias ................................................... 16, 40 Biscayne Bay Coastal Wetlands, see also
BBCW ............................... 41, 43, 48, 49 bottom elevation ......................... 44, 55, 58 C111 model ... 1, 2, 3, 4, 5, 8, 9, 11, 16, 17,
18, 24, 26, 37, 39, 40, 41, 42, 43, 44, 46, 47
calibration .... 1, 6, 7, 11, 12, 14, 16, 18, 20, 24, 39, 40, 41
canal ... 8, 23, 24, 37, 39, 40, 48, 50, 56, 60 arc parameter sets ........................ 49, 58 network ................................... 47, 49, 58 reach ..................... 39, 40, 49, 52, 59, 60 segment ........................................ 49, 59 water levels ......................................... 50
canal, see also WCD ... 1, 8, 14, 16, 21, 37, 39, 40, 46, 47, 49, 50, 52, 55, 56, 58, 59, 60
canal.map ............................................... 55 cell
heads .................................................. 56 cell, see also mesh .... 5, 39, 40, 46, 50, 56,
57, 60 cellmonitor, see also monitor .................. 58 coefficient ............................. 12, 40, 49, 59 conductivity, see also hydraulic
conductivity ......................... 7, 40, 49, 58 control ..................................................... 50 controller ........................................... 45, 55
mseStructures ............................... 45, 55 conveyance ...................................... 44, 55
parameters .................................... 44, 55 coverage ................................................... 6 daily values ....................................... 16, 40 datasets .............................................. 7, 58
distribution ........................................ 27, 50 downstream structures ........................... 24 drainage ................................................. 48 DSSVue ........................................... 49, 53 dummy lake ............................................ 56 EAA .................................................. 50, 60 environment variable .............................. 42 ET............................................... 44, 55, 57 evapotranspiration, see also ET ............. 20 Everglades Agricultural Area .................. 50 feature class ........................................... 60 file format
DSS ....................... 52, 53, 55, 57, 59, 60 XML ..... 44, 49, 52, 53, 55, 56, 57, 58, 60
flood ................................................. 41, 50 flood control ...................................... 41, 50 flood control management ...................... 50 flow . 8, 9, 10, 11, 12, 14, 15, 16, 22, 24, 25,
27, 28, 29, 32, 33, 34, 35, 36, 37, 39, 40, 44, 46, 53, 55, 56, 57, 60, 61
flowgage ..................................... 47, 56, 58 framework ................................................ 4 gage ....................................................... 11 genxweir, see also watermover .............. 56 geodatabase .......................................... 50 Glades-LECSA ....................................... 41 grep ........................................................ 60 groundwater .. 14, 15, 17, 19, 20, 36, 49, 58
flow ............................................... 15, 36 head ...................................... 12, 55, 56, 60 historical data . 8, 11, 16, 21, 24, 25, 40, 53,
59, 61 Holeyland ............................................... 60 HPM .. 20, 42, 46, 49, 50, 51, 52, 56, 58, 60
hub .......................................... 50, 52, 60 layer1nsm ........................................... 20 water budget ....................................... 42
hydraulic conductivity ........ 7, 48, 52, 58, 60 hydraulic conductivity zones ............. 52, 60 Hydrologic Process Module, see also HPM
...................................................... 44, 55 impoundment .. 1, 13, 37, 39, 40, 46, 56, 57 inflow ............................... 29, 44, 55, 56, 58 initial head .......................................... 1, 60 Initial head ........................................ 44, 55 input data
RSM Training HESM Instructional Materials for Training Purposes Only Module 12: C111 RSM – Model Conceptualization, Calibration, and Application
Page 12.64 Hydrologic and Environmental Systems Modeling
boundary conditions ... 10, 11, 44, 46, 49, 55, 56, 58
flow ............................................... 44, 55 mesh ................................................... 55
input files ................................................ 49 irrigation, see also HPM ......................... 61 lake ............................................. 44, 55, 56 Lake Okeechobee ................ 41, 43, 50, 52 Lake Okeechobee Service Area, see also
LOSA ................................ 41, 43, 50, 52 lake, see also waterbody 41, 43, 44, 46, 50,
52, 55, 56 landscape ............................................... 41 landuse ................................... 6, 39, 40, 58
LU88 ................................................... 58 leakage ............................................. 49, 59 levee 6, 9, 12, 39, 40, 46, 50, 55, 56, 57, 58 levee boundary conditions ................ 44, 55 levee seepage, see also seepage ... 12, 44,
55, 58 LOSA, see also Lake Okeechobee Service
Area ................ 41, 43, 50, 51, 52, 53, 60 LOSA-EAA Model ..... 41, 43, 50, 51, 52, 53 Lower East Coast Service Area, see also
LECSA ................................................ 41 main XML file .......................................... 46 makePlots.py, see also Python ............... 49 Management Simulation Engine, see also
MSE .................................................... 24 mangrove, see also HPM ......................... 6 marsh, see also HPM - layer1nsm . 6, 9, 22,
28, 33, 34, 37 mesh .. 3, 4, 5, 6, 44, 46, 47, 48, 49, 50, 55,
56, 58, 60 geometry ....................................... 44, 55
mesh_framework .................................... 50 Miami-Dade County ................................ 48 monitor
global ............................................ 57, 58 MSE ........................................................ 24
network ............................. 45, 46, 55, 57 structure, see also watermover ..... 56, 58 units .............................................. 46, 57
network ............... 44, 48, 49, 52, 55, 58, 60 boundary condition ........................ 52, 60
network geometry ............................. 44, 55 no-flow boundary condition ......... 40, 50, 58 note ........................................ 2, 42, 49, 60
objective function ................................... 40 observed value ....................................... 23 OL .......................................................... 57 outflow .................................................... 10 output data ................ 43, 46, 49, 53, 56, 58
flow monitors ................................ 14, 16 flow vectors ......................................... 34 water budget ....................................... 58
overbank flow ......................................... 10 overland flow .......................................... 57 parameter ............ 16, 20, 26, 39, 40, 44, 55 PEST ...................................................... 16 plot ................................................... 49, 53 pond, see also lake 1, 8, 13, 29, 30, 31, 32,
35, 37, 38, 40 ponding .................................................. 34 public water supply, see also pws .... 44, 55 pump, see also watermover ....8, 27, 29, 60 pws ............................................. 55, 56, 58 Python .................................................... 53 rainfall .................................... 42, 55, 57, 59 reach .......................................... 12, 40, 60 Regional Simulation Model, see also RSM
............................................................ 41 reservoir ............................ 1, 29, 32, 35, 37 RMSE ............................................... 16, 40 Rotenberger ........................................... 60 RSM
implementation ............................. 43, 44 RSM GUI .......................................... 49, 53 RSM, see also Regional Simulation Model
1, 3, 4, 5, 7, 8, 10, 11, 12, 17, 18, 21, 34, 38, 39, 40, 41, 42, 43, 44, 46, 48, 49, 50, 51, 52, 53, 59, 60
runoff ...................................................... 61 script ....................................................... 53 scrub land, see also HPM ...................... 60 secondary canal, see also canal, WCD .. 50 seepage .................... 12, 13, 28, 40, 55, 57 segment
boundary condition ...... 44, 55, 56, 58, 60 head .............................................. 23, 56 segmentsource ............ 44, 55, 56, 58, 60
segment, see also waterbody segment ............. 9, 10, 23, 27, 46, 56, 60
setenv ..................................................... 42 setflow .................................................... 56 SFWMM .................... 11, 12, 17, 18, 39, 40

RSM Training HESM Instructional Materials for Training Purposes Only Module 12: C111 RSM – Model Conceptualization, Calibration, and Application
Hydrologic and Environmental Systems Modeling Page 12.65
sheet flow ..................................... 9, 15, 36 simulated flows ........................... 24, 25, 29 special assessors ................. 45, 46, 55, 57 stage 11, 14, 16, 17, 19, 20, 22, 40, 45, 53,
55, 60 data ..................................................... 19 schedule ............................................. 45
statistics .................................................. 57 structure .. 8, 14, 16, 24, 37, 40, 43, 48, 49,
50, 53, 55, 60, 61 S176 ............................... 4, 8, 11, 46, 57 S177 ................................... 8, 25, 46, 57 S18C ................................... 8, 24, 39, 40 S332DN ........................................ 46, 57 S8 ................................................. 60, 61
subregional models 1, 4, 17, 41, 43, 44, 46 sugarcane ............................................... 60 surface elevation .............................. 44, 55 surface hydrology ................................... 50 surface water .......................................... 19 tidal data ........................................... 44, 55 time series .... 17, 22, 40, 43, 49, 52, 53, 59
topo, see topography ........................ 55, 56 topography ......................................... 6, 50 transect ........................... 15, 36, 37, 46, 57 transect line ............................................ 15 user-specified watermover, see also
watermover ................................... 46, 56 vector ..................................................... 57 volume .................................................... 36 Water Control District ................. 50, 52, 60 water control units ............................ 46, 57 water supply ..................................... 41, 50 waterbody .............................. 13, 46, 56, 60 watermover ..................... 44, 49, 55, 56, 58
seepage .............................................. 12 WCD
wcdwaterbody ............................... 52, 60 WCD, see also Water Control District ... 50,
52, 60 weir ......................................................... 40 well ... 17, 19, 21, 22, 23, 24, 25, 28, 40, 44,
49, 53, 55, 56, 58, 61 wetlands ................................................. 40

RSM Training HESM Instructional Materials for Training Purposes Only Module 12: C111 RSM – Model Conceptualization, Calibration, and Application
Page 12.66 Hydrologic and Environmental Systems Modeling