C SIU Land Use and Water Budgets 160713 - Butte CountyA/Report/AppxC.pdfWater Inventory and Analysis...
110
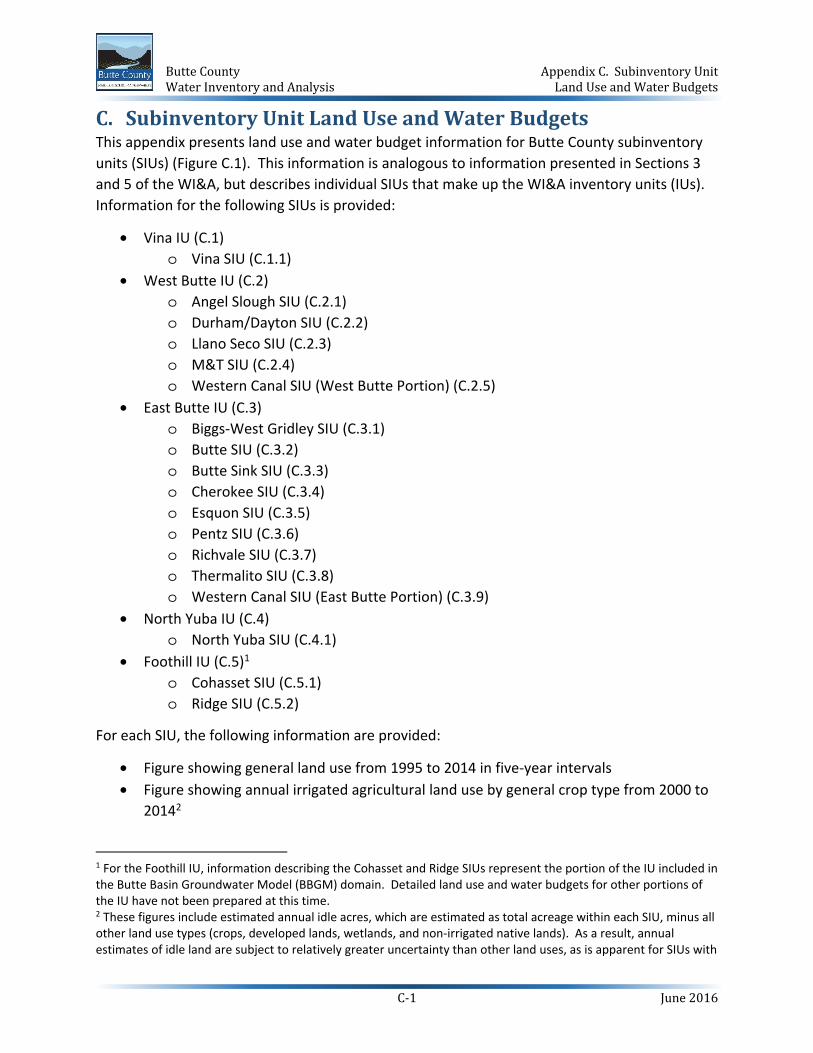
Butte County Appendix C. Subinventory Unit Water Inventory and Analysis Land Use and Water Budgets C-1 June 2016 C. Subinventory Unit Land Use and Water Budgets This appendix presents land use and water budget information for Butte County subinventory units (SIUs) (Figure C.1). This information is analogous to information presented in Sections 3 and 5 of the WI&A, but describes individual SIUs that make up the WI&A inventory units (IUs). Information for the following SIUs is provided: • Vina IU (C.1) o Vina SIU (C.1.1) • West Butte IU (C.2) o Angel Slough SIU (C.2.1) o Durham/Dayton SIU (C.2.2) o Llano Seco SIU (C.2.3) o M&T SIU (C.2.4) o Western Canal SIU (West Butte Portion) (C.2.5) • East Butte IU (C.3) o Biggs-West Gridley SIU (C.3.1) o Butte SIU (C.3.2) o Butte Sink SIU (C.3.3) o Cherokee SIU (C.3.4) o Esquon SIU (C.3.5) o Pentz SIU (C.3.6) o Richvale SIU (C.3.7) o Thermalito SIU (C.3.8) o Western Canal SIU (East Butte Portion) (C.3.9) • North Yuba IU (C.4) o North Yuba SIU (C.4.1) • Foothill IU (C.5) 1 o Cohasset SIU (C.5.1) o Ridge SIU (C.5.2) For each SIU, the following information are provided: • Figure showing general land use from 1995 to 2014 in five-year intervals • Figure showing annual irrigated agricultural land use by general crop type from 2000 to 2014 2 1 For the Foothill IU, information describing the Cohasset and Ridge SIUs represent the portion of the IU included in the Butte Basin Groundwater Model (BBGM) domain. Detailed land use and water budgets for other portions of the IU have not been prepared at this time. 2 These figures include estimated annual idle acres, which are estimated as total acreage within each SIU, minus all other land use types (crops, developed lands, wetlands, and non-irrigated native lands). As a result, annual estimates of idle land are subject to relatively greater uncertainty than other land uses, as is apparent for SIUs with
Transcript of C SIU Land Use and Water Budgets 160713 - Butte CountyA/Report/AppxC.pdfWater Inventory and Analysis...
Butte County Appendix C. Subinventory Unit Water Inventory and Analysis Land Use and Water Budgets
C-1 June 2016
C. Subinventory Unit Land Use and Water Budgets This appendix presents land use and water budget information for Butte County subinventory units (SIUs) (Figure C.1). This information is analogous to information presented in Sections 3 and 5 of the WI&A, but describes individual SIUs that make up the WI&A inventory units (IUs). Information for the following SIUs is provided:
• Vina IU (C.1) o Vina SIU (C.1.1)
• West Butte IU (C.2) o Angel Slough SIU (C.2.1) o Durham/Dayton SIU (C.2.2) o Llano Seco SIU (C.2.3) o M&T SIU (C.2.4) o Western Canal SIU (West Butte Portion) (C.2.5)
• East Butte IU (C.3) o Biggs-West Gridley SIU (C.3.1) o Butte SIU (C.3.2) o Butte Sink SIU (C.3.3) o Cherokee SIU (C.3.4) o Esquon SIU (C.3.5) o Pentz SIU (C.3.6) o Richvale SIU (C.3.7) o Thermalito SIU (C.3.8) o Western Canal SIU (East Butte Portion) (C.3.9)
• North Yuba IU (C.4) o North Yuba SIU (C.4.1)
• Foothill IU (C.5)1 o Cohasset SIU (C.5.1) o Ridge SIU (C.5.2)
For each SIU, the following information are provided:
• Figure showing general land use from 1995 to 2014 in five-year intervals • Figure showing annual irrigated agricultural land use by general crop type from 2000 to
20142
1 For the Foothill IU, information describing the Cohasset and Ridge SIUs represent the portion of the IU included in the Butte Basin Groundwater Model (BBGM) domain. Detailed land use and water budgets for other portions of the IU have not been prepared at this time. 2 These figures include estimated annual idle acres, which are estimated as total acreage within each SIU, minus all other land use types (crops, developed lands, wetlands, and non-irrigated native lands). As a result, annual estimates of idle land are subject to relatively greater uncertainty than other land uses, as is apparent for SIUs with

Butte County Appendix C. Subinventory Unit Water Inventory and Analysis Land Use and Water Budgets
C-2 June 2016
• Tables showing annual land use • Figures showing average annual land surface (root zone) water budget inflows and
outflows by general land use category • Figure showing total annual inflows and outflows, 2000 to 2014 • Table showing annual inflows and outflows for 2000 to 2014 with summary statistics
and averages by hydrologic year type3
Figure C.1. Butte County Water Inventory and Analysis Inventory Units and Subinventory
Units.
relatively limited irrigated agriculture. Because idle lands are hydrologically similar to non-irrigated lands, these uncertainties are not believed to significantly affect water budget results. 3 Hydrologic year types are characterized as Wet (W), Above Normal (AN), Below Normal (BN), Dry (D), and Critical (C) based on the Sacramento Valley Water Year Index, as described in Section 4 of the WI&A.

Butte County Appendix C. Subinventory Unit Water Inventory and Analysis Land Use and Water Budgets
C-3 June 2016
C.1. Vina Inventory Unit C.1.1. Vina Subinventory Unit Land Use General Land Use
Irrigated Agricultural Land Use
36 37 37 38
39 38 37 35
0 0 1 112 12 13 15
0
10
20
30
40
50
60
70
80
90
100
1995-1999 2000-2004 2005-2009 2010-2014
Acre
s (Th
ousa
nds)
Irrigated Agriculture Non-Irrigated Wetlands Developed
0
5
10
15
20
25
30
35
40
45
2000 2001 2002 2003 2004 2005 2006 2007 2008 2009 2010 2011 2012 2013 2014
Acre
s (Th
ousa
nds)
Rice Orchards Other Crops Idle Cropland

Butte County Appendix C. Subinventory Unit Water Inventory and Analysis Land Use and Water Budgets
C-4 June 2016
Irrigated Agricultural Land Use
Year Rice Almonds Walnuts Prunes
Other Trees and
Vines Grain
Pasture and
Alfalfa
Field and
Annual Idle
CroplandTotal
CroppedTotal
(w/Idle) 2000 0 14,763 10,505 4,890 478 1,089 997 2,338 1,462 35,058 36,5202001 0 13,552 10,417 4,402 498 1,229 1,097 2,176 4,150 33,370 37,5202002 0 12,628 10,652 4,152 433 1,118 1,363 1,965 5,401 32,310 37,7112003 0 13,192 11,720 3,992 438 1,219 1,464 1,551 3,586 33,576 37,1622004 0 14,178 13,116 4,283 380 952 1,727 1,116 17 35,752 35,7692005 0 13,088 13,504 3,084 475 580 1,451 1,351 4,568 33,532 38,1002006 0 12,952 14,664 4,349 423 1,053 1,534 193 1,379 35,167 36,5462007 0 13,184 14,564 4,407 433 1,131 1,445 170 1,153 35,335 36,4882008 0 11,587 13,832 4,102 649 1,123 1,301 1,968 4,392 34,562 38,9542009 0 12,615 14,935 4,410 391 1,040 1,353 450 1,587 35,194 36,7812010 0 12,304 14,460 4,332 576 843 1,238 1,667 2,856 35,422 38,2782011 0 12,370 16,213 4,236 632 1,096 1,236 1,111 123 36,893 37,0162012 0 12,100 15,604 4,027 597 1,379 1,208 976 3,185 35,892 39,0772013 0 11,917 16,945 3,715 582 887 1,121 993 1,776 36,159 37,9362014 0 11,976 16,997 2,986 537 109 1,181 1,035 3,114 34,821 37,935Min 0 11,587 10,417 2,986 380 109 997 170 17 32,310 35,769Max 0 14,763 16,997 4,890 649 1,379 1,727 2,338 5,401 36,893 39,077
Average 0 12,827 13,875 4,091 501 990 1,314 1,271 2,583 34,870 37,453

Butte County Appendix C. Subinventory Unit Water Inventory and Analysis Land Use and Water Budgets
C-5 June 2016
Other Land Use
Year Wetlands DevelopedNon-
Irrigated Total 2000 472 12,706 38,389 51,567 2001 446 12,201 37,920 50,567 2002 444 12,141 37,791 50,376 2003 441 12,430 38,055 50,926 2004 454 12,819 39,044 52,318 2005 473 12,333 37,181 49,988 2006 547 13,230 37,765 51,541 2007 606 13,571 37,423 51,599 2008 633 13,144 35,357 49,133 2009 720 14,139 36,447 51,307 2010 757 14,046 35,007 49,810 2011 852 14,856 35,363 51,072 2012 806 14,298 33,907 49,011 2013 818 14,712 34,622 50,152 2014 815 14,689 34,649 50,152 Min 441 12,141 33,907 49,011 Max 852 14,856 39,044 52,318
Average 619 13,421 36,595 50,635 Water Budgets
Vina Inventory Unit Average Annual Inflows and Outflows (Thousands of Acre-Feet)
Precipitation180
Surface Water
8
Ground-water
Pumping109
Evapotrans-piration
169
Deep Perco-lation
80
Runoff and Return Flow
48
Inflows Outflows

Butte County Appendix C. Subinventory Unit Water Inventory and Analysis Land Use and Water Budgets
C-6 June 2016
Vina Inventory Unit Agricultural Area Average Annual Inflows and Outflows (Thousands of Acre-Feet)
Precipitation74
Surface Water
8
Ground-water
Pumping88
Evapotrans-piration
114
Deep Perco-lation
40
Runoff and Return Flow
17
Inflows Outflows
Vina Inventory Unit Developed Area Average Annual Inflows and Outflows (Thousands of Acre-Feet)
Precipitation28
Ground-water
Pumping20
Evapotrans-piration
16
Deep Perco-lation
9
Runoff and Return Flow
24Inflows Outflows

Butte County Appendix C. Subinventory Unit Water Inventory and Analysis Land Use and Water Budgets
C-7 June 2016
Vina Inventory Unit Native Area Average Annual Inflows and Outflows (Thousands of Acre-Feet)
Precipitation78
Evapotrans-piration
39Deep Perco-lation
31
Runoff and Return Flow
8
Inflows Outflows
Vina Inventory Unit 2000-2014 Water Year Inflows and Outflows (Thousands of Acre-Feet)
0 50 100 150 200 250 300 350 400
20…
20…
20…
20…
20…
20…
20…
20…
20…
20…
20…
20…
20…
20…
20…
Outflows (taf/year)
Evapotranspiration Deep Percolation Runoff and Return Flow
050100150200250300350400
2000 (AN)
2001 (D)
2002 (D)
2003 (AN)
2004 (BN)
2005 (AN)
2006 (W)
2007 (D)
2008 (C)
2009 (D)
2010 (BN)
2011 (W)
2012 (BN)
2013 (D)
2014 (C)
Inflows (taf/year)
Surface Water Groundwater Precipitation

Butte County Appendix C. Subinventory Unit Water Inventory and Analysis Land Use and Water Budgets
C-8 June 2016
Subinventory Unit Water Budget
Water Year
Inflows (taf) Outflows (taf) Change
in Storage
(taf) Precipi-tation
Surface Water
Ground-water
Evapotrans-piration
Deep Percolation
Runoff and
Return Flow
2000 (AN) 187 7 106 163 94 40 -22001 (D) 150 8 107 164 68 31 02002 (D) 196 8 109 158 91 65 -1
2003 (AN) 243 7 104 163 105 87 22004 (BN) 166 9 124 155 94 51 -12005 (AN) 208 7 91 171 93 40 22006 (W) 237 8 102 162 119 68 22007 (D) 95 9 127 177 27 24 -22008 (C) 122 9 128 166 59 35 -12009 (D) 136 9 116 169 50 43 2
2010 (BN) 188 8 96 166 84 41 12011 (W) 265 7 82 177 118 60 22012 (BN) 180 9 108 181 65 51 -12013 (D) 197 8 114 179 79 60 82014 (C) 131 8 116 179 50 24 -7
Minimum 95 7 82 155 27 24 -7Maximum 265 9 128 181 119 87 8Average 180 8 109 169 80 48 0
Averages by Hydrologic Year Type Wet (W) 251 7 92 169 119 64 2
Above Normal (AN) 213 7 100 166 97 56 0Below Normal (BN) 178 8 109 167 81 48 0
Dry (D) 155 8 115 169 63 45 2Critical (C) 127 8 122 172 55 30 -4

Butte County Appendix C. Subinventory Unit Water Inventory and Analysis Land Use and Water Budgets
C-9 June 2016
C.2. West Butte Inventory Unit C.2.1. Angel Slough Subinventory Unit Land Use General Land Use
Irrigated Agricultural Land Use
3.5 3.6 3.4 3.2
1.1 1.0 1.1 1.3
0.0
0.5
1.0
1.5
2.0
2.5
3.0
3.5
4.0
4.5
5.0
1995-1999 2000-2004 2005-2009 2010-2014
Acre
s (Th
ousa
nds)
Irrigated Agriculture Non-Irrigated Wetlands Developed
0.0
0.5
1.0
1.5
2.0
2.5
3.0
3.5
4.0
2000 2001 2002 2003 2004 2005 2006 2007 2008 2009 2010 2011 2012 2013 2014
Acre
s (Th
ousa
nds)
Rice Orchards Other Crops Idle Cropland

Butte County Appendix C. Subinventory Unit Water Inventory and Analysis Land Use and Water Budgets
C-10 June 2016
Irrigated Agricultural Land Use
Year Rice Almonds Walnuts Prunes
Other Trees and
Vines Grain
Pasture and
Alfalfa
Field and
Annual Idle
CroplandTotal
CroppedTotal
(w/Idle) 2000 0 1,242 1,400 0 0 221 81 512 109 3,456 3,5652001 0 1,139 1,342 0 0 224 71 471 408 3,248 3,6552002 0 1,007 1,304 0 0 221 79 646 433 3,256 3,6892003 0 1,100 1,579 0 0 319 82 339 224 3,419 3,6432004 0 1,188 1,965 0 0 281 96 0 1 3,528 3,5302005 0 1,077 2,052 0 0 154 84 0 181 3,368 3,5492006 0 1,035 2,118 0 0 200 91 0 24 3,444 3,4682007 0 1,054 2,060 0 0 174 94 0 8 3,381 3,3892008 0 948 1,961 0 0 175 92 0 196 3,176 3,3732009 0 993 2,035 0 0 87 94 0 69 3,209 3,2782010 0 966 1,949 0 0 47 93 0 202 3,055 3,2572011 0 932 2,123 0 0 23 94 0 3 3,172 3,1752012 0 931 2,058 0 0 31 93 0 114 3,113 3,2272013 0 885 2,197 0 0 19 80 0 68 3,182 3,2502014 0 888 2,186 0 0 2 83 0 100 3,160 3,261Min 0 885 1,304 0 0 2 71 0 1 3,055 3,175Max 0 1,242 2,197 0 0 319 96 646 433 3,528 3,689
Average 0 1,026 1,889 0 0 145 87 131 143 3,278 3,420

Butte County Appendix C. Subinventory Unit Water Inventory and Analysis Land Use and Water Budgets
C-11 June 2016
Other Land Use
Year Wetlands DevelopedNon-
Irrigated Total 2000 35 68 1,026 1,129 2001 28 68 943 1,039 2002 27 74 904 1,006 2003 30 92 929 1,051 2004 37 125 1,004 1,165 2005 33 113 1,000 1,146 2006 34 116 1,077 1,227 2007 34 119 1,152 1,305 2008 33 115 1,174 1,322 2009 34 118 1,266 1,417 2010 33 114 1,291 1,437 2011 33 115 1,372 1,520 2012 32 113 1,323 1,468 2013 31 108 1,306 1,445 2014 31 107 1,296 1,434 Min 27 68 904 1,006 Max 37 125 1,372 1,520
Average 32 104 1,138 1,274 Water Budgets
Angel Slough Subinventory Unit Average Annual Inflows and Outflows (Thousands of Acre-Feet)
Precipitation8.6
Surface Water
0.3
Groundwater8.0
Evapotranspiration12.1
Deep Percolation
4.2
Runoff and Return Flow
0.5
Inflows Outflows

Butte County Appendix C. Subinventory Unit Water Inventory and Analysis Land Use and Water Budgets
C-12 June 2016
Angel Slough Subinventory Unit Agricultural Area Average Annual Inflows and Outflows (Thousands of Acre-Feet)
Precipitation6.4
Surface Water
0.3
Groundwater8.0
Evapotranspiration10.8
Deep Percolation
3.4
Runoff and Return Flow
0.4
Inflows Outflows
Angel Slough Subinventory Unit Developed Area Average Annual Inflows and Outflows (Thousands of Acre-Feet)
Precipitation0.18
Groundwater0.01
Evapotranspiration0.15
Deep Percolation
0.05
Runoff and Return Flow
0.00
Inflows Outflows

Butte County Appendix C. Subinventory Unit Water Inventory and Analysis Land Use and Water Budgets
C-13 June 2016
Angel Slough Subinventory Unit Native Area Average Annual Inflows and Outflows (Thousands of Acre-Feet)
Precipitation2
Evapotranspiration
1
Deep Percolation
1
Runoff and Return Flow
0
Inflows Outflows
Angel Slough Subinventory Unit 2000-2014 Water Year Inflows and Outflows (Thousands of Acre-Feet)
0 5 10 15 20 25
2000
2001
2002
2003
2004
2005
2006
2007
2008
2009
2010
2011
2012
2013
2014
Outflows (taf/year)
Evapotranspiration Deep Percolation Runoff and Return Flow
0510152025
2000
2001
2002
2003
2004
2005
2006
2007
2008
2009
2010
2011
2012
2013
2014
Inflows (taf/year)
Surface Water Groundwater Precipitation

Butte County Appendix C. Subinventory Unit Water Inventory and Analysis Land Use and Water Budgets
C-14 June 2016
Subinventory Unit Water Budget
Water Year
Inflows (taf) Outflows (taf) Change
in Storage
(taf) Precipi-tation
Surface Water
Ground-water
Evapotrans-piration
Deep Percolation
Runoff and
Return Flow
2000 (AN) 8.9 0.2 8.1 11.8 5.1 0.0 -0.22001 (D) 7.3 0.3 8.3 11.8 4.1 -0.2 -0.22002 (D) 9.4 0.2 8.8 11.6 5.3 1.8 0.3
2003 (AN) 11.7 0.2 8.0 11.9 5.9 2.3 0.12004 (BN) 7.9 0.3 9.9 12.4 5.1 0.8 0.02005 (AN) 10.0 0.2 6.9 12.1 4.8 0.2 0.02006 (W) 11.0 0.2 7.8 11.9 6.3 1.3 0.32007 (D) 4.3 0.3 9.5 13.2 1.3 -0.8 -0.52008 (C) 5.9 0.3 9.6 12.5 3.2 0.1 0.02009 (D) 6.3 0.3 8.0 12.1 2.3 0.5 0.1
2010 (BN) 8.9 0.2 6.3 11.3 4.1 0.0 -0.12011 (W) 12.9 0.3 5.2 11.6 5.9 1.0 0.12012 (BN) 8.9 0.3 7.0 12.5 3.3 0.2 -0.32013 (D) 9.7 0.3 8.0 12.6 4.3 1.4 0.62014 (C) 6.4 0.3 8.2 12.9 2.5 -1.0 -0.6
Minimum 4.3 0.2 5.2 11.3 1.3 -1.0 -0.6Maximum 12.9 0.3 9.9 13.2 6.3 2.3 0.6Average 8.6 0.3 8.0 12.1 4.2 0.5 0.0
Averages by Hydrologic Year Type Wet (W) 12.0 0.3 6.5 11.7 6.1 1.2 0.2
Above Normal (AN) 10.2 0.2 7.7 11.9 5.3 0.8 0.0Below Normal (BN) 8.6 0.3 7.7 12.1 4.2 0.3 -0.1
Dry (D) 7.4 0.3 8.5 12.3 3.4 0.5 0.1Critical (C) 6.1 0.3 8.9 12.7 2.8 -0.4 -0.3
Butte County Appendix C. Subinventory Unit Water Inventory and Analysis Land Use and Water Budgets
C-15 June 2016
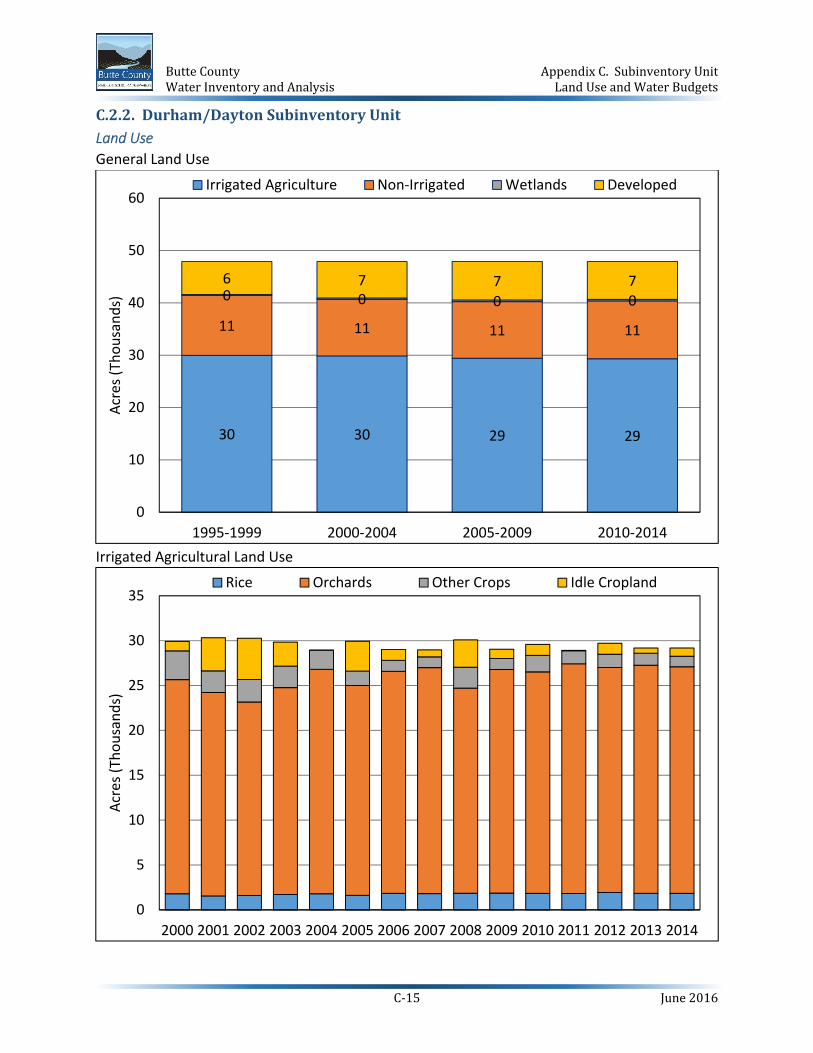
C.2.2. Durham/Dayton Subinventory Unit Land Use General Land Use
Irrigated Agricultural Land Use
30 30 29 29
11 11 11 11
0 0 0 06 7 7 7
0
10
20
30
40
50
60
1995-1999 2000-2004 2005-2009 2010-2014
Acre
s (Th
ousa
nds)
Irrigated Agriculture Non-Irrigated Wetlands Developed
0
5
10
15
20
25
30
35
2000 2001 2002 2003 2004 2005 2006 2007 2008 2009 2010 2011 2012 2013 2014
Acre
s (Th
ousa
nds)
Rice Orchards Other Crops Idle Cropland

Butte County Appendix C. Subinventory Unit Water Inventory and Analysis Land Use and Water Budgets
C-16 June 2016
Irrigated Agricultural Land Use
Year Rice Almonds Walnuts Prunes
Other Trees and
Vines Grain
Pasture and
Alfalfa
Field and
Annual Idle
CroplandTotal
CroppedTotal
(w/Idle) 2000 1,798 19,203 2,830 1,115 718 550 884 1,765 1,061 28,863 29,9232001 1,548 18,310 2,752 982 637 465 645 1,303 3,688 26,641 30,3292002 1,591 17,321 2,792 887 580 430 621 1,458 4,591 25,681 30,2712003 1,704 18,503 3,128 874 563 469 557 1,377 2,663 27,174 29,8372004 1,793 19,976 3,555 995 488 402 752 984 4 28,944 28,9482005 1,616 18,160 3,931 673 621 165 498 950 3,327 26,615 29,9422006 1,832 18,750 4,543 926 535 342 721 162 1,212 27,811 29,0242007 1,807 19,266 4,456 894 569 337 683 185 783 28,197 28,9802008 1,850 16,932 4,290 764 871 284 536 1,507 3,051 27,035 30,0862009 1,853 18,760 4,809 800 570 249 662 309 1,042 28,010 29,0522010 1,830 18,379 4,828 736 753 170 513 1,155 1,228 28,363 29,5912011 1,822 18,523 5,561 686 830 216 567 669 38 28,875 28,9132012 1,927 18,360 5,326 641 751 337 547 602 1,229 28,490 29,7192013 1,836 18,096 5,949 609 772 177 543 623 577 28,606 29,1822014 1,832 18,154 5,922 492 697 22 582 569 918 28,269 29,186Min 1,548 16,932 2,752 492 488 22 498 162 4 25,681 28,913Max 1,927 19,976 5,949 1,115 871 550 884 1,765 4,591 28,944 30,329
Average 1,776 18,446 4,311 805 664 308 621 908 1,694 27,838 29,532

Butte County Appendix C. Subinventory Unit Water Inventory and Analysis Land Use and Water Budgets
C-17 June 2016
Other Land Use
Year Wetlands DevelopedNon-
Irrigated Total 2000 230 6,641 11,099 17,970 2001 244 6,561 10,759 17,565 2002 271 6,748 10,604 17,622 2003 302 7,136 10,617 18,056 2004 360 7,733 10,852 18,945 2005 330 7,131 10,490 17,951 2006 342 7,566 10,962 18,870 2007 334 7,538 11,042 18,914 2008 296 6,993 10,519 17,807 2009 315 7,403 11,123 18,841 2010 289 7,137 10,876 18,303 2011 316 7,337 11,329 18,981 2012 286 7,064 10,825 18,175 2013 301 7,286 11,124 18,711 2014 298 7,285 11,124 18,707 Min 230 6,561 10,490 17,565 Max 360 7,733 11,329 18,981
Average 301 7,171 10,890 18,361 Water Budgets
Durham/Dayton Subinventory Unit Average Annual Inflows and Outflows (Thousands of Acre-Feet)
Precipitation103
Surface Water
5
Groundwater79
Evapotranspiration110
Deep Percolation
47
Runoff and Return Flow
30
Inflows Outflows

Butte County Appendix C. Subinventory Unit Water Inventory and Analysis Land Use and Water Budgets
C-18 June 2016
Durham/Dayton Subinventory Unit Agricultural Area Average Annual Inflows and Outflows (Thousands of Acre-Feet)
Precipitation61
Surface Water
5
Groundwater69
Evapotranspiration
89
Deep Percolation
31
Runoff and Return Flow
14
Inflows Outflows
Durham/Dayton Subinventory Unit Developed Area Average Annual Inflows and Outflows (Thousands of Acre-Feet)
Precipitation16
Surface Water
0
Groundwater10
Evapotranspiration
9
Deep Percolation
5
Runoff and Return Flow
12Inflows Outflows

Butte County Appendix C. Subinventory Unit Water Inventory and Analysis Land Use and Water Budgets
C-19 June 2016
Durham/Dayton Subinventory Unit Native Area Average Annual Inflows and Outflows (Thousands of Acre-Feet)
Precipitation26
Evapotranspiration
12
Deep Percolation
11
Runoff and Return Flow
3
Inflows Outflows
Durham/Dayton Subinventory Unit 2000-2014 Water Year Inflows and Outflows (Thousands of Acre-Feet)
0 50 100 150 200 250
2000
2001
2002
2003
2004
2005
2006
2007
2008
2009
2010
2011
2012
2013
2014
Outflows (taf/year)
Evapotranspiration Deep Percolation Runoff and Return Flow
050100150200250
2000
2001
2002
2003
2004
2005
2006
2007
2008
2009
2010
2011
2012
2013
2014
Inflows (taf/year)
Surface Water Groundwater Precipitation

Butte County Appendix C. Subinventory Unit Water Inventory and Analysis Land Use and Water Budgets
C-20 June 2016
Subinventory Unit Water Budget
Water Year
Inflows (taf) Outflows (taf) Change
in Storage
(taf) Precipi-tation
Surface Water
Ground-water
Evapotrans-piration
Deep Percolation
Runoff and
Return Flow
2000 (AN) 108 5 79 107 58 26 -12001 (D) 85 5 76 106 41 17 -12002 (D) 112 5 77 103 52 41 0
2003 (AN) 139 5 76 105 59 58 22004 (BN) 95 5 90 106 55 29 -12005 (AN) 119 5 63 107 53 27 12006 (W) 137 5 69 103 67 43 02007 (D) 56 5 95 119 23 14 02008 (C) 70 5 93 111 38 18 -22009 (D) 79 6 85 111 33 27 2
2010 (BN) 108 4 68 107 49 25 02011 (W) 150 5 58 109 66 39 12012 (BN) 101 6 80 116 40 31 -12013 (D) 111 5 83 117 47 36 42014 (C) 75 4 88 117 32 15 -3
Minimum 56 4 58 103 23 14 -3Maximum 150 6 95 119 67 58 4Average 103 5 79 110 47 30 0
Averages by Hydrologic Year Type Wet (W) 144 5 64 106 66 41 1
Above Normal (AN) 122 5 73 106 57 37 1Below Normal (BN) 101 5 80 110 48 28 -1
Dry (D) 89 5 83 111 39 27 1Critical (C) 72 4 90 114 35 16 -2

Butte County Appendix C. Subinventory Unit Water Inventory and Analysis Land Use and Water Budgets
C-21 June 2016
C.2.3. Llano Seco Subinventory Unit Land Use General Land Use
Irrigated Agricultural Land Use
10 97
5
54
67
4 55 5
0 0 1 1
0
2
4
6
8
10
12
14
16
18
20
1995-1999 2000-2004 2005-2009 2010-2014
Acre
s (Th
ousa
nds)
Irrigated Agriculture Non-Irrigated Wetlands Developed
0
2
4
6
8
10
12
2000 2001 2002 2003 2004 2005 2006 2007 2008 2009 2010 2011 2012 2013 2014
Acre
s (Th
ousa
nds)
Rice Orchards Other Crops Idle Cropland
Butte County Appendix C. Subinventory Unit Water Inventory and Analysis Land Use and Water Budgets
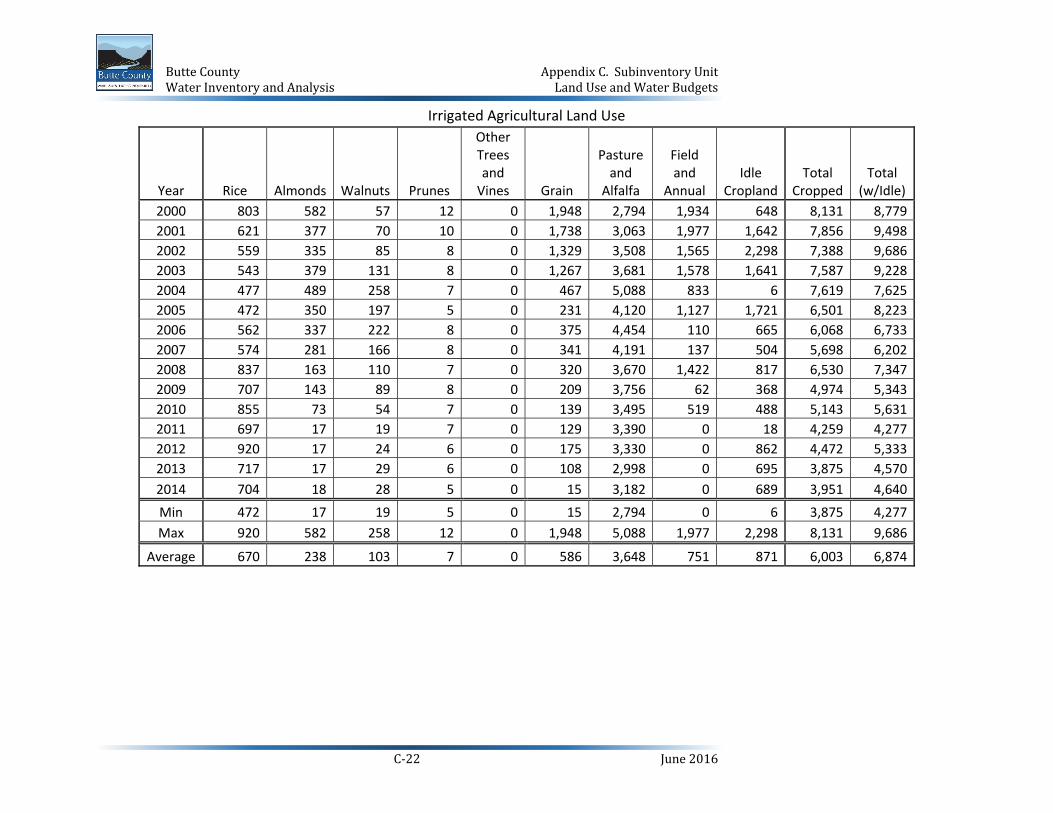
C-22 June 2016
Irrigated Agricultural Land Use
Year Rice Almonds Walnuts Prunes
Other Trees and
Vines Grain
Pasture and
Alfalfa
Field and
Annual Idle
CroplandTotal
CroppedTotal
(w/Idle) 2000 803 582 57 12 0 1,948 2,794 1,934 648 8,131 8,7792001 621 377 70 10 0 1,738 3,063 1,977 1,642 7,856 9,4982002 559 335 85 8 0 1,329 3,508 1,565 2,298 7,388 9,6862003 543 379 131 8 0 1,267 3,681 1,578 1,641 7,587 9,2282004 477 489 258 7 0 467 5,088 833 6 7,619 7,6252005 472 350 197 5 0 231 4,120 1,127 1,721 6,501 8,2232006 562 337 222 8 0 375 4,454 110 665 6,068 6,7332007 574 281 166 8 0 341 4,191 137 504 5,698 6,2022008 837 163 110 7 0 320 3,670 1,422 817 6,530 7,3472009 707 143 89 8 0 209 3,756 62 368 4,974 5,3432010 855 73 54 7 0 139 3,495 519 488 5,143 5,6312011 697 17 19 7 0 129 3,390 0 18 4,259 4,2772012 920 17 24 6 0 175 3,330 0 862 4,472 5,3332013 717 17 29 6 0 108 2,998 0 695 3,875 4,5702014 704 18 28 5 0 15 3,182 0 689 3,951 4,640Min 472 17 19 5 0 15 2,794 0 6 3,875 4,277Max 920 582 258 12 0 1,948 5,088 1,977 2,298 8,131 9,686
Average 670 238 103 7 0 586 3,648 751 871 6,003 6,874

Butte County Appendix C. Subinventory Unit Water Inventory and Analysis Land Use and Water Budgets
C-23 June 2016
Other Land Use
Year Wetlands DevelopedNon-
Irrigated Total 2000 4,378 267 4,927 9,572 2001 4,329 216 4,309 8,853 2002 4,424 251 3,989 8,664 2003 4,881 275 3,967 9,123 2004 5,446 423 4,857 10,726 2005 5,267 498 4,363 10,128 2006 5,439 691 5,489 11,618 2007 5,471 781 5,897 12,149 2008 5,130 702 5,172 11,004 2009 5,440 909 6,659 13,008 2010 5,291 909 6,519 12,720 2011 5,529 1,046 7,498 14,074 2012 5,207 972 6,839 13,018 2013 5,510 1,037 7,234 13,781 2014 5,534 1,033 7,145 13,711 Min 4,329 216 3,967 8,664 Max 5,534 1,046 7,498 14,074
Average 5,152 667 5,658 11,477 Water Budgets
Llano Seco Subinventory Unit Average Annual Inflows and Outflows (Thousands of Acre-Feet)
Precipitation33
Surface Water
22
Groundwater26
Evapotranspiration
43Deep
Percolation18
Runoff and Return Flow
20
Inflows Outflows

Butte County Appendix C. Subinventory Unit Water Inventory and Analysis Land Use and Water Budgets
C-24 June 2016
Llano Seco Subinventory Unit Agricultural Area Average Annual Inflows and Outflows (Thousands of Acre-Feet)
Precipitation22
Surface Water
22
Groundwater26
Evapotranspiration
36
Deep Percolation
15
Runoff and Return Flow
18
Inflows Outflows
Llano Seco Subinventory Unit Developed Area Average Annual Inflows and Outflows (Thousands of Acre-Feet)
Precipitation1.09
Groundwater0.01
Evapotranspiration
0.9
Deep Percolation
0.2
Runoff and Return Flow
0.0
Inflows Outflows

Butte County Appendix C. Subinventory Unit Water Inventory and Analysis Land Use and Water Budgets
C-25 June 2016
Llano Seco Subinventory Unit Native Area Average Annual Inflows and Outflows (Thousands of Acre-Feet)
Precipitation10
Evapotranspiration
7
Deep Percolation
2
Runoff and Return Flow
1
Inflows Outflows
Llano Seco Subinventory Unit 2000-2014 Water Year Inflows and Outflows (Thousands of Acre-Feet)
0 20 40 60 80 100
2000
2001
2002
2003
2004
2005
2006
2007
2008
2009
2010
2011
2012
2013
2014
Outflows (taf/year)
Evapotranspiration Deep Percolation Runoff and Return Flow
020406080100
2000
2001
2002
2003
2004
2005
2006
2007
2008
2009
2010
2011
2012
2013
2014
Inflows (taf/year)
Surface Water Groundwater Precipitation

Butte County Appendix C. Subinventory Unit Water Inventory and Analysis Land Use and Water Budgets
C-26 June 2016
Subinventory Unit Water Budget
Water Year
Inflows (taf) Outflows (taf) Change
in Storage
(taf) Precipi-tation
Surface Water
Ground-water
Evapotrans-piration
Deep Percolation
Runoff and
Return Flow
2000 (AN) 34 26 20 44 19 17 02001 (D) 28 20 28 44 16 15 02002 (D) 36 24 26 43 20 23 0
2003 (AN) 44 25 23 44 20 29 12004 (BN) 30 26 29 45 21 20 -12005 (AN) 38 24 21 44 20 19 02006 (W) 42 20 26 42 22 24 -22007 (D) 16 21 33 45 13 12 02008 (C) 22 20 34 45 16 15 02009 (D) 24 19 29 42 15 15 -2
2010 (BN) 34 24 20 41 18 20 02011 (W) 49 25 14 42 21 26 -12012 (BN) 34 20 27 43 16 21 02013 (D) 37 21 23 41 18 21 12014 (C) 24 11 36 42 14 15 -1
Minimum 16 11 14 41 13 12 -2Maximum 49 26 36 45 22 29 1Average 33 22 26 43 18 20 0
Averages by Hydrologic Year Type Wet (W) 46 22 20 42 22 25 -1
Above Normal (AN) 39 25 21 44 20 22 0Below Normal (BN) 33 23 26 43 18 20 0
Dry (D) 28 21 28 43 17 17 0Critical (C) 23 16 35 44 15 15 0

Butte County Appendix C. Subinventory Unit Water Inventory and Analysis Land Use and Water Budgets
C-27 June 2016
C.2.4. M&T Subinventory Unit Land Use General Land Use
Irrigated Agricultural Land Use
6 6 6 6
2 2 2 2
0.1 0.1 0.2 0.20.1 0.3 0.4 0.4
0
1
2
3
4
5
6
7
8
9
10
1995-1999 2000-2004 2005-2009 2010-2014
Acre
s (Th
ousa
nds)
Irrigated Agriculture Non-Irrigated Wetlands Developed
0
1
2
3
4
5
6
7
2000 2001 2002 2003 2004 2005 2006 2007 2008 2009 2010 2011 2012 2013 2014
Acre
s (Th
ousa
nds)
Rice Orchards Other Crops Idle Cropland

Butte County Appendix C. Subinventory Unit Water Inventory and Analysis Land Use and Water Budgets
C-28 June 2016
Irrigated Agricultural Land Use
Year Rice Almonds Walnuts Prunes
Other Trees and
Vines Grain
Pasture and
Alfalfa
Field and
Annual Idle
CroplandTotal
CroppedTotal
(w/Idle) 2000 1,767 2,154 755 525 6 432 24 457 234 6,121 6,3552001 1,263 2,058 820 530 5 379 24 959 493 6,040 6,5332002 1,331 1,902 951 547 4 308 23 766 736 5,832 6,5682003 1,298 1,998 1,196 590 8 302 19 717 382 6,127 6,5092004 1,360 2,172 1,686 709 4 160 15 109 1 6,214 6,2152005 1,168 2,063 1,754 536 11 103 13 122 557 5,770 6,3262006 1,410 1,988 1,779 713 3 162 13 11 100 6,079 6,1792007 1,390 2,023 1,722 727 3 169 12 9 51 6,054 6,1062008 1,409 1,793 1,644 684 6 161 11 139 380 5,847 6,2272009 1,504 1,886 1,691 725 3 148 11 10 80 5,976 6,0562010 1,567 1,808 1,607 729 4 99 10 108 236 5,932 6,1682011 1,452 1,715 1,759 717 4 159 10 0 8 5,816 5,8252012 1,572 1,718 1,663 650 3 191 10 0 337 5,806 6,1432013 1,461 1,681 1,865 626 3 133 9 0 199 5,778 5,9782014 1,456 1,686 1,864 503 3 17 9 0 480 5,539 6,018Min 1,168 1,681 755 503 3 17 9 0 1 5,539 5,825Max 1,767 2,172 1,865 729 11 432 24 959 736 6,214 6,568
Average 1,427 1,910 1,517 634 5 195 14 227 285 5,929 6,214

Butte County Appendix C. Subinventory Unit Water Inventory and Analysis Land Use and Water Budgets
C-29 June 2016
Other Land Use
Year Wetlands DevelopedNon-
Irrigated Total 2000 118 166 2,110 2,394 2001 122 193 1,901 2,216 2002 136 238 1,808 2,182 2003 145 297 1,798 2,240 2004 189 407 1,938 2,534 2005 184 373 1,866 2,423 2006 189 378 2,003 2,570 2007 198 380 2,066 2,643 2008 184 351 1,987 2,522 2009 203 361 2,129 2,693 2010 194 342 2,046 2,581 2011 245 378 2,301 2,924 2012 198 330 2,078 2,606 2013 229 354 2,189 2,772 2014 223 349 2,158 2,731 Min 118 166 1,798 2,182 Max 245 407 2,301 2,924
Average 184 326 2,025 2,535 Water Budgets
M&T Subinventory Unit Average Annual Inflows and Outflows (Thousands of Acre-Feet)
Precipitation17
Surface Water
9
Groundwater11
Evapotranspiration
23
Deep Percolation
8
Runoff and Return Flow
6
Inflows Outflows

Butte County Appendix C. Subinventory Unit Water Inventory and Analysis Land Use and Water Budgets
C-30 June 2016
M&T Subinventory Unit Agricultural Area Average Annual Inflows and Outflows (Thousands of Acre-Feet)
Precipitation12
Surface Water
9
Groundwater11
Evapotranspiration
20
Deep Percolation
7
Runoff and Return Flow
6
Inflows Outflows
M&T Subinventory Unit Developed Area Average Annual Inflows and Outflows (Thousands of Acre-Feet)
Precipitation0.60
Groundwater0.04
Evapotranspiration
0.4
Deep Percolation
0.1
Runoff and Return Flow
0.1
Inflows Outflows

Butte County Appendix C. Subinventory Unit Water Inventory and Analysis Land Use and Water Budgets
C-31 June 2016
M&T Subinventory Unit Native Area Average Annual Inflows and Outflows (Thousands of Acre-Feet)
Precipitation3.8
Evapotranspiration
2.1
Deep Percolation
1.4
Runoff and Return Flow
0.3
Inflows Outflows
M&T Subinventory Unit 2000-2014 Water Year Inflows and Outflows (Thousands of Acre-Feet)
0 10 20 30 40 50
2000
2001
2002
2003
2004
2005
2006
2007
2008
2009
2010
2011
2012
2013
2014
Outflows (taf/year)
Evapotranspiration Deep Percolation Runoff and Return Flow
01020304050
2000
2001
2002
2003
2004
2005
2006
2007
2008
2009
2010
2011
2012
2013
2014
Inflows (taf/year)
Surface Water Groundwater Precipitation
Butte County Appendix C. Subinventory Unit Water Inventory and Analysis Land Use and Water Budgets
C-32 June 2016
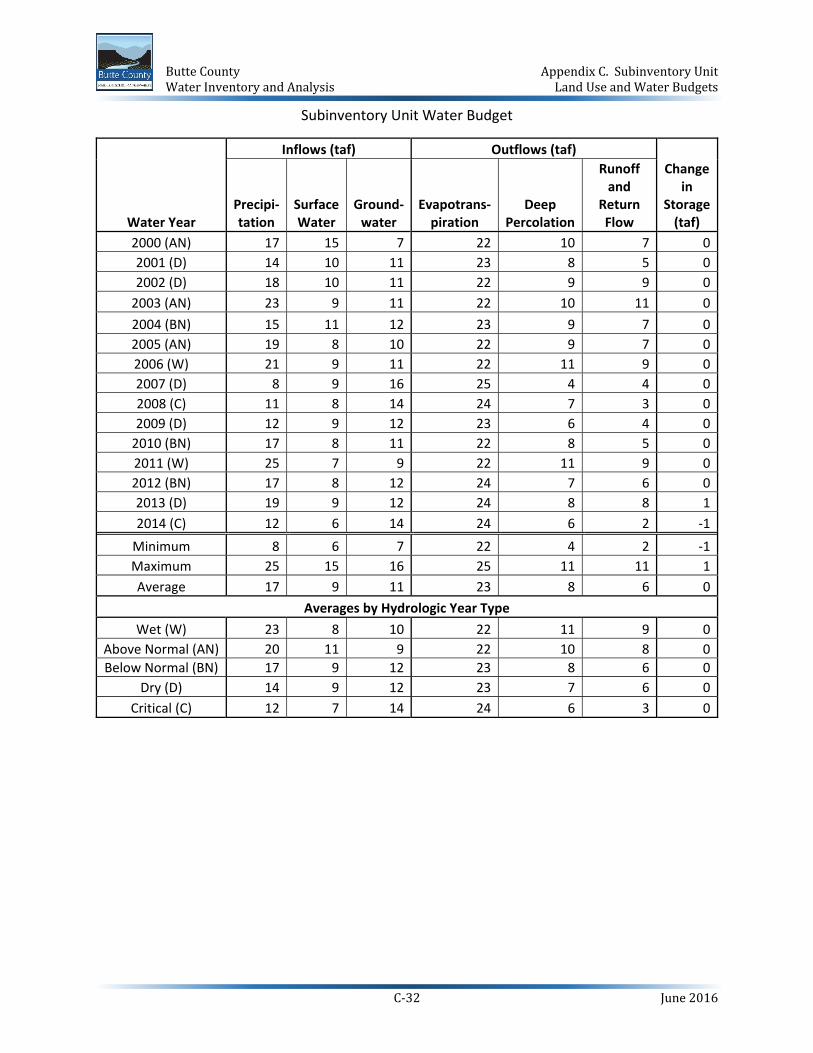
Subinventory Unit Water Budget
Water Year
Inflows (taf) Outflows (taf) Change
in Storage
(taf) Precipi-tation
Surface Water
Ground-water
Evapotrans-piration
Deep Percolation
Runoff and
Return Flow
2000 (AN) 17 15 7 22 10 7 02001 (D) 14 10 11 23 8 5 02002 (D) 18 10 11 22 9 9 0
2003 (AN) 23 9 11 22 10 11 02004 (BN) 15 11 12 23 9 7 02005 (AN) 19 8 10 22 9 7 02006 (W) 21 9 11 22 11 9 02007 (D) 8 9 16 25 4 4 02008 (C) 11 8 14 24 7 3 02009 (D) 12 9 12 23 6 4 0
2010 (BN) 17 8 11 22 8 5 02011 (W) 25 7 9 22 11 9 02012 (BN) 17 8 12 24 7 6 02013 (D) 19 9 12 24 8 8 12014 (C) 12 6 14 24 6 2 -1
Minimum 8 6 7 22 4 2 -1Maximum 25 15 16 25 11 11 1Average 17 9 11 23 8 6 0
Averages by Hydrologic Year Type Wet (W) 23 8 10 22 11 9 0
Above Normal (AN) 20 11 9 22 10 8 0Below Normal (BN) 17 9 12 23 8 6 0
Dry (D) 14 9 12 23 7 6 0Critical (C) 12 7 14 24 6 3 0

Butte County Appendix C. Subinventory Unit Water Inventory and Analysis Land Use and Water Budgets
C-33 June 2016
C.2.5. Western Canal Subinventory Unit (West Butte Portion) Land Use General Land Use
Irrigated Agricultural Land Use
12 12 12 12
0.6 0.5 0.5 0.50.7 0.8 0.8 0.70.6 0.7 0.7 0.7
0
2
4
6
8
10
12
14
16
1995-1999 2000-2004 2005-2009 2010-2014
Acre
s (Th
ousa
nds)
Irrigated Agriculture Non-Irrigated Wetlands Developed
0
2
4
6
8
10
12
14
2000 2001 2002 2003 2004 2005 2006 2007 2008 2009 2010 2011 2012 2013 2014
Acre
s (Th
ousa
nds)
Rice Orchards Other Crops Idle Cropland

Butte County Appendix C. Subinventory Unit Water Inventory and Analysis Land Use and Water Budgets
C-34 June 2016
Irrigated Agricultural Land Use
Year Rice Almonds Walnuts Prunes
Other Trees and
Vines Grain
Pasture and
Alfalfa
Field and
Annual Idle
CroplandTotal
CroppedTotal
(w/Idle) 2000 9,978 388 82 390 176 0 1,025 138 37 12,177 12,2142001 7,994 354 109 390 179 0 867 194 2,080 10,087 12,1672002 9,619 363 166 401 135 0 695 53 754 11,432 12,1862003 9,042 363 192 382 136 0 320 86 1,658 10,522 12,1802004 10,774 384 256 447 82 0 1 104 3 12,047 12,0502005 10,015 368 260 307 102 2 1 66 961 11,119 12,0802006 10,929 368 256 372 73 6 2 9 140 12,015 12,1552007 10,969 382 242 337 76 11 2 7 103 12,025 12,1282008 9,834 317 193 262 121 14 2 59 1,643 10,803 12,4462009 10,597 372 218 247 59 14 2 6 786 11,515 12,3012010 9,342 375 190 205 82 14 1 17 2,130 10,226 12,3562011 11,241 384 227 167 80 20 2 0 14 12,122 12,1362012 9,184 375 206 146 71 27 2 0 2,392 10,011 12,4022013 11,194 380 243 149 72 17 2 0 114 12,055 12,1692014 8,818 386 251 119 63 2 2 0 2,511 9,641 12,152Min 7,994 317 82 119 59 0 1 0 3 9,641 12,050Max 11,241 388 260 447 179 27 1,025 194 2,511 12,177 12,446
Average 9,969 371 206 288 101 8 195 49 1,022 11,186 12,208

Butte County Appendix C. Subinventory Unit Water Inventory and Analysis Land Use and Water Budgets
C-35 June 2016
Other Land Use
Year Wetlands DevelopedNon-
Irrigated Total 2000 792 610 559 1,962 2001 803 648 557 2,008 2002 791 675 524 1,990 2003 809 691 496 1,995 2004 810 757 558 2,125 2005 816 760 519 2,095 2006 777 720 523 2,020 2007 780 737 530 2,047 2008 690 613 427 1,729 2009 737 663 475 1,875 2010 696 641 483 1,819 2011 776 740 524 2,040 2012 675 638 460 1,773 2013 764 729 514 2,006 2014 766 742 515 2,024 Min 675 610 427 1,729 Max 816 760 559 2,125
Average 765 691 511 1,967 Water Budgets
Western Canal (West Butte Portion) Subinventory Unit Average Annual Inflows and Outflows (Thousands of Acre-Feet)
Precipitation26
Surface Water
58
Groundwater2
Evapotranspiration
46
Deep Percolation
11
Runoff and Return Flow
29
Inflows Outflows

Butte County Appendix C. Subinventory Unit Water Inventory and Analysis Land Use and Water Budgets
C-36 June 2016
Western Canal (West Butte Portion) Subinventory Unit Agricultural Area Average Annual Inflows and Outflows (Thousands of Acre-Feet)
Precipitation24
Surface Water
58
Groundwater2
Evapotranspiration
45
Deep Percolation
11
Runoff and Return Flow
29
Inflows Outflows
Western Canal (West Butte Portion) Subinventory Unit Developed Area Average Annual Inflows and Outflows (Thousands of Acre-Feet)
Precipitation1.3
Groundwater0.002
Evapotranspiration
0.9
Deep Percolation
0.1
Runoff and Return Flow
0.3
Inflows Outflows

Butte County Appendix C. Subinventory Unit Water Inventory and Analysis Land Use and Water Budgets
C-37 June 2016
Western Canal (West Butte Portion) Subinventory Unit Native Area Average Annual Inflows and Outflows (Thousands of Acre-Feet)
Precipitation1
Evapotranspiration
1
Deep Percolation
0
Runoff and Return Flow
0
Inflows Outflows
Western Canal (West Butte Portion) Subinventory Unit 2000-2014 Water Year Inflows and Outflows (Thousands of Acre-Feet)
0 20 40 60 80 100 120
2000
2001
2002
2003
2004
2005
2006
2007
2008
2009
2010
2011
2012
2013
2014
Outflows (taf/year)
Evapotranspiration Deep Percolation Runoff and Return Flow
020406080100120
2000
2001
2002
2003
2004
2005
2006
2007
2008
2009
2010
2011
2012
2013
2014
Inflows (taf/year)
Surface Water Groundwater Precipitation

Butte County Appendix C. Subinventory Unit Water Inventory and Analysis Land Use and Water Budgets
C-38 June 2016
Subinventory Unit Water Budget
Water Year
Inflows (taf) Outflows (taf) Change
in Storage
(taf) Precipi-tation
Surface Water
Ground-water
Evapotrans-piration
Deep Percolation
Runoff and
Return Flow
2000 (AN) 27 61 2 49 11 29 02001 (D) 22 57 2 45 10 26 02002 (D) 29 57 2 48 10 28 -1
2003 (AN) 36 49 1 43 10 34 12004 (BN) 24 62 2 46 11 28 -22005 (AN) 31 53 2 45 12 30 22006 (W) 34 55 1 45 13 33 12007 (D) 13 63 2 53 10 15 02008 (C) 18 63 2 48 11 22 -12009 (D) 19 62 2 47 10 25 0
2010 (BN) 27 59 1 41 11 37 22011 (W) 40 55 1 45 12 38 02012 (BN) 27 58 2 45 10 32 02013 (D) 30 61 2 50 11 31 02014 (C) 19 60 2 45 10 26 -1
Minimum 13 49 1 41 10 15 -2Maximum 40 63 2 53 13 38 2Average 26 58 2 46 11 29 0
Averages by Hydrologic Year Type Wet (W) 37 55 1 45 12 36 0
Above Normal (AN) 31 54 2 46 11 31 1Below Normal (BN) 26 60 1 44 11 32 0
Dry (D) 23 60 2 49 10 25 0Critical (C) 19 61 2 47 10 24 -1

Butte County Appendix C. Subinventory Unit Water Inventory and Analysis Land Use and Water Budgets
C-39 June 2016
C.3. East Butte Inventory Unit C.3.1. Biggs-West Gridley Subinventory Unit Land Use General Land Use
Irrigated Agricultural Land Use
26 26 26 26
2 2 2 23 4 4 42 2 2 2
0
5
10
15
20
25
30
35
40
1995-1999 2000-2004 2005-2009 2010-2014
Acre
s (Th
ousa
nds)
Irrigated Agriculture Non-Irrigated Wetlands Developed
0
5
10
15
20
25
30
2000 2001 2002 2003 2004 2005 2006 2007 2008 2009 2010 2011 2012 2013 2014
Acre
s (Th
ousa
nds)
Rice Orchards Other Crops Idle Cropland

Butte County Appendix C. Subinventory Unit Water Inventory and Analysis Land Use and Water Budgets
C-40 June 2016
Irrigated Agricultural Land Use
Year Rice Almonds Walnuts Prunes
Other Trees and
Vines Grain
Pasture and
Alfalfa
Field and
Annual Idle
CroplandTotal
CroppedTotal
(w/Idle) 2000 20,431 6 603 1,408 358 651 1,941 379 249 25,777 26,0262001 18,489 7 542 1,298 359 888 1,904 824 1,647 24,311 25,9582002 19,256 6 572 1,052 314 893 1,857 856 1,115 24,805 25,9202003 20,461 6 674 953 358 1,144 1,447 455 299 25,496 25,7952004 21,036 5 907 1,001 235 528 1,414 32 1 25,158 25,1592005 19,318 5 1,157 608 354 250 1,127 1,190 1,349 24,008 25,3572006 21,134 6 1,152 941 229 411 1,394 21 165 25,289 25,4552007 21,112 7 1,153 953 227 386 1,413 48 106 25,298 25,4052008 21,216 5 952 762 390 353 1,172 390 1,222 25,239 26,4612009 21,333 3 1,163 850 175 222 1,358 48 749 25,151 25,9002010 17,798 5 1,129 777 238 148 1,265 274 4,692 21,632 26,3242011 21,112 5 1,542 764 262 144 1,506 170 12 25,504 25,5162012 17,332 5 1,246 640 224 260 1,211 97 5,647 21,014 26,6622013 21,237 7 1,783 665 242 118 1,333 119 179 25,505 25,6842014 15,472 14 1,884 539 226 15 1,400 68 6,027 19,618 25,645Min 15,472 3 542 539 175 15 1,127 21 1 19,618 25,159Max 21,333 14 1,884 1,408 390 1,144 1,941 1,190 6,027 25,777 26,662
Average 19,782 6 1,097 881 279 427 1,449 331 1,564 24,254 25,818

Butte County Appendix C. Subinventory Unit Water Inventory and Analysis Land Use and Water Budgets
C-41 June 2016
Other Land Use
Year Wetlands DevelopedNon-
Irrigated Total 2000 3,884 2,294 1,702 7,879 2001 3,829 2,137 1,982 7,947 2002 3,847 1,998 2,141 7,986 2003 4,038 1,846 2,226 8,110 2004 4,305 1,888 2,554 8,747 2005 4,245 1,735 2,569 8,548 2006 4,121 1,814 2,517 8,451 2007 4,084 1,853 2,565 8,501 2008 3,641 1,537 2,268 7,445 2009 3,853 1,696 2,457 8,006 2010 3,611 1,606 2,365 7,582 2011 3,862 1,869 2,660 8,390 2012 3,409 1,535 2,300 7,244 2013 3,817 1,825 2,580 8,222 2014 3,839 1,839 2,583 8,261 Min 3,409 1,535 1,702 7,244 Max 4,305 2,294 2,660 8,747
Average 3,892 1,831 2,364 8,088 Water Budgets
Biggs-West Gridley Subinventory Unit Average Annual Inflows and Outflows (Thousands of Acre-Feet)
Precipitation58
Surface Water
197
Groundwater6
Evapotranspiration108
Deep Percolation
35
Runoff and Return Flow
118Inflows Outflows

Butte County Appendix C. Subinventory Unit Water Inventory and Analysis Land Use and Water Budgets
C-42 June 2016
Biggs-West Gridley Subinventory Unit Agricultural Area Average Annual Inflows and Outflows (Thousands of Acre-Feet)
Precipitation51
Surface Water
197
Groundwater5
Evapotranspiration103
Deep Percolation
34
Runoff and Return Flow
117Inflows Outflows
Biggs-West Gridley Subinventory Unit Developed Area Average Annual Inflows and Outflows (Thousands of Acre-Feet)
Precipitation3.3
Groundwater0.5
Evapotranspiration
2.6
Deep Percolation
0.5
Runoff and Return Flow
0.7
Inflows Outflows

Butte County Appendix C. Subinventory Unit Water Inventory and Analysis Land Use and Water Budgets
C-43 June 2016
Biggs-West Gridley Subinventory Unit Native Area Average Annual Inflows and Outflows (Thousands of Acre-Feet)
Precipitation3.8
Evapotranspiration
2.7
Deep Percolation
0.5
Runoff and Return Flow
0.6
Inflows Outflows
Biggs-West Gridley Subinventory Unit 2000-2014 Water Year Inflows and Outflows (Thousands of Acre-Feet)
0 50 100 150 200 250 300 350
2000
2001
2002
2003
2004
2005
2006
2007
2008
2009
2010
2011
2012
2013
2014
Outflows (taf/year)
Evapotranspiration Deep Percolation Runoff and Return Flow
050100150200250300350
2000
2001
2002
2003
2004
2005
2006
2007
2008
2009
2010
2011
2012
2013
2014
Inflows (taf/year)
Surface Water Groundwater Precipitation

Butte County Appendix C. Subinventory Unit Water Inventory and Analysis Land Use and Water Budgets
C-44 June 2016
Subinventory Unit Water Budget
Water Year
Inflows (taf) Outflows (taf) Change
in Storage
(taf) Precipi-tation
Surface Water
Ground-water
Evapotrans-piration
Deep Percolation
Runoff and
Return Flow
2000 (AN) 65 189 5 112 36 110 02001 (D) 50 187 4 110 33 98 02002 (D) 55 191 3 111 34 103 -2
2003 (AN) 69 184 7 107 36 120 42004 (BN) 61 223 8 107 37 144 -52005 (AN) 67 198 7 105 37 135 42006 (W) 87 215 7 104 42 164 12007 (D) 41 220 6 122 33 112 02008 (C) 40 216 6 118 34 107 -32009 (D) 52 188 6 111 35 101 1
2010 (BN) 67 184 6 96 35 128 32011 (W) 81 199 5 102 37 144 02012 (BN) 46 201 5 101 30 119 -12013 (D) 51 199 6 114 31 111 02014 (C) 37 157 7 99 28 74 -1
Minimum 37 157 3 96 28 74 -5Maximum 87 223 8 122 42 164 4Average 58 197 6 108 35 118 0
Averages by Hydrologic Year Type Wet (W) 84 207 6 103 40 154 0
Above Normal (AN) 67 190 6 108 37 122 2Below Normal (BN) 58 203 6 101 34 130 -1
Dry (D) 50 197 5 113 33 105 0Critical (C) 38 187 7 108 31 90 -2

Butte County Appendix C. Subinventory Unit Water Inventory and Analysis Land Use and Water Budgets
C-45 June 2016
C.3.2. Butte Subinventory Unit Land Use General Land Use
Irrigated Agricultural Land Use
16 16 16 16
2 2 2 20.3 0.3 0.3 0.33 3 3 3
0
5
10
15
20
25
1995-1999 2000-2004 2005-2009 2010-2014
Acre
s (Th
ousa
nds)
Irrigated Agriculture Non-Irrigated Wetlands Developed
0
2
4
6
8
10
12
14
16
18
2000 2001 2002 2003 2004 2005 2006 2007 2008 2009 2010 2011 2012 2013 2014
Acre
s (Th
ousa
nds)
Rice Orchards Other Crops Idle Cropland

Butte County Appendix C. Subinventory Unit Water Inventory and Analysis Land Use and Water Budgets
C-46 June 2016
Irrigated Agricultural Land Use
Year Rice Almonds Walnuts Prunes
Other Trees and
Vines Grain
Pasture and
Alfalfa
Field and
Annual Idle
CroplandTotal
CroppedTotal
(w/Idle) 2000 1,754 86 4,077 4,044 4,043 586 1,441 286 143 16,315 16,4582001 1,571 88 3,858 3,661 3,709 773 1,255 893 914 15,809 16,7232002 1,677 105 4,035 3,176 3,328 828 1,292 1,060 1,143 15,500 16,6442003 1,011 113 4,321 2,782 3,565 1,077 1,184 1,130 1,558 15,184 16,7422004 1,932 161 5,299 3,300 3,064 590 1,200 165 2 15,711 15,7132005 1,632 133 5,405 1,968 3,874 286 959 1,430 930 15,688 16,6182006 1,989 184 6,044 3,260 2,788 439 1,233 47 63 15,983 16,0462007 1,984 207 5,842 3,405 2,723 395 1,247 73 82 15,875 15,9572008 1,594 168 4,962 2,554 3,833 335 1,107 913 1,512 15,465 16,9772009 2,233 238 5,892 3,266 2,150 213 1,331 125 699 15,447 16,1462010 1,713 250 5,616 3,065 2,800 127 1,172 634 1,096 15,378 16,4732011 2,049 268 6,396 2,914 2,778 92 1,336 268 25 16,100 16,1252012 1,781 267 6,014 2,734 2,573 219 1,235 226 1,494 15,049 16,5432013 2,082 256 7,417 2,482 2,489 69 1,249 222 176 16,266 16,4422014 1,319 271 7,742 2,024 2,309 9 1,324 218 1,179 15,216 16,395Min 1,011 86 3,858 1,968 2,150 9 959 47 2 15,049 15,713Max 2,233 271 7,742 4,044 4,043 1,077 1,441 1,430 1,558 16,315 16,977
Average 1,755 186 5,528 2,976 3,068 402 1,238 513 734 15,666 16,400

Butte County Appendix C. Subinventory Unit Water Inventory and Analysis Land Use and Water Budgets
C-47 June 2016
Other Land Use
Year Wetlands DevelopedNon-
Irrigated Total 2000 330 3,312 1,297 4,940 2001 300 2,955 1,420 4,675 2002 301 2,910 1,544 4,755 2003 293 2,812 1,552 4,656 2004 342 3,396 1,947 5,685 2005 304 2,844 1,633 4,780 2006 327 3,262 1,763 5,352 2007 338 3,331 1,772 5,441 2008 267 2,730 1,425 4,421 2009 324 3,270 1,658 5,252 2010 303 3,082 1,539 4,925 2011 354 3,322 1,598 5,273 2012 298 3,076 1,481 4,855 2013 330 3,157 1,468 4,955 2014 332 3,194 1,477 5,003 Min 267 2,730 1,297 4,421 Max 354 3,396 1,947 5,685
Average 316 3,110 1,572 4,998 Water Budgets
Butte Subinventory Unit Average Annual Inflows and Outflows (Thousands of Acre-Feet)
Precipitation39
Surface Water
36
Groundwater11
Evapotranspiration
57
Deep Percolation
23
Runoff and Return Flow
6
Inflows Outflows

Butte County Appendix C. Subinventory Unit Water Inventory and Analysis Land Use and Water Budgets
C-48 June 2016
Butte Subinventory Unit Agricultural Area Average Annual Inflows and Outflows (Thousands of Acre-Feet)
Precipitation30
Surface Water
36
Groundwater9
Evapotranspiration
51
Deep Percolation
20
Runoff and Return Flow
4
Inflows Outflows
Butte Subinventory Unit Developed Area Average Annual Inflows and Outflows (Thousands of Acre-Feet)
Precipitation5.7
Surface Water
0.0
Groundwater2.1
Evapotranspiration
4.0
Deep Percolation
1.6
Runoff and Return Flow
2.2
Inflows Outflows

Butte County Appendix C. Subinventory Unit Water Inventory and Analysis Land Use and Water Budgets
C-49 June 2016
Butte Subinventory Unit Native Area Average Annual Inflows and Outflows (Thousands of Acre-Feet)
Precipitation2.9
Evapotranspiration
1.6
Deep Percolation
1.0
Runoff and Return Flow
0.2
Inflows Outflows
Butte Subinventory Unit 2000-2014 Water Year Inflows and Outflows (Thousands of Acre-Feet)
0 20 40 60 80 100 120
2000
2001
2002
2003
2004
2005
2006
2007
2008
2009
2010
2011
2012
2013
2014
Outflows (taf/year)
Evapotranspiration Deep Percolation Runoff and Return Flow
020406080100120
2000
2001
2002
2003
2004
2005
2006
2007
2008
2009
2010
2011
2012
2013
2014
Inflows (taf/year)
Surface Water Groundwater Precipitation

Butte County Appendix C. Subinventory Unit Water Inventory and Analysis Land Use and Water Budgets
C-50 June 2016
Subinventory Unit Water Budget
Water Year
Inflows (taf) Outflows (taf) Change
in Storage
(taf) Precipi-tation
Surface Water
Ground-water
Evapotrans-piration
Deep Percolation
Runoff and
Return Flow
2000 (AN) 44 36 9 56 30 3 -12001 (D) 33 36 10 56 21 0 -12002 (D) 36 43 10 56 24 9 0
2003 (AN) 46 38 9 53 25 14 02004 (BN) 40 35 10 56 27 3 02005 (AN) 44 30 9 54 25 5 12006 (W) 58 32 9 54 34 12 02007 (D) 28 39 13 63 16 1 02008 (C) 24 35 12 57 18 -5 -12009 (D) 39 38 14 57 22 12 0
2010 (BN) 45 34 12 54 24 13 02011 (W) 55 33 10 54 28 15 12012 (BN) 32 31 12 57 18 -1 -12013 (D) 34 36 17 60 20 8 12014 (C) 26 37 17 60 15 4 0
Minimum 24 30 9 53 15 -5 -1Maximum 58 43 17 63 34 15 1Average 39 36 11 57 23 6 0
Averages by Hydrologic Year Type Wet (W) 57 33 9 54 31 14 0
Above Normal (AN) 45 35 9 55 27 7 0Below Normal (BN) 39 33 11 56 23 5 0
Dry (D) 34 38 13 58 21 6 0Critical (C) 25 36 14 59 17 0 0

Butte County Appendix C. Subinventory Unit Water Inventory and Analysis Land Use and Water Budgets
C-51 June 2016
C.3.3. Butte Sink Subinventory Unit Land Use General Land Use
Irrigated Agricultural Land Use
2 2 1 1
2 2 2 2
7 7 7 7
0.1 0.1 0.1 0.1
0
2
4
6
8
10
12
1995-1999 2000-2004 2005-2009 2010-2014
Acre
s (Th
ousa
nds)
Irrigated Agriculture Non-Irrigated Wetlands Developed
0.0
0.5
1.0
1.5
2.0
2.5
2000 2001 2002 2003 2004 2005 2006 2007 2008 2009 2010 2011 2012 2013 2014
Acre
s (Th
ousa
nds)
Rice Orchards Other Crops Idle Cropland

Butte County Appendix C. Subinventory Unit Water Inventory and Analysis Land Use and Water Budgets
C-52 June 2016
Irrigated Agricultural Land Use
Year Rice Almonds Walnuts Prunes
Other Trees and
Vines Grain
Pasture and
Alfalfa
Field and
Annual Idle
CroplandTotal
CroppedTotal
(w/Idle) 2000 1,116 44 0 7 0 55 0 253 85 1,474 1,5592001 1,004 38 0 13 0 100 0 330 479 1,485 1,9642002 1,045 32 0 17 0 123 0 300 625 1,517 2,1422003 1,107 26 0 21 0 180 0 131 133 1,464 1,5972004 1,160 21 0 27 0 117 0 0 0 1,325 1,3252005 1,079 19 0 22 0 81 0 0 293 1,200 1,4942006 1,147 23 0 28 0 122 0 0 11 1,321 1,3322007 1,144 25 0 29 0 130 0 0 13 1,327 1,3402008 1,146 25 0 25 0 162 0 0 313 1,359 1,6712009 1,142 13 0 28 0 114 0 0 66 1,297 1,3632010 1,166 22 0 27 0 99 0 0 228 1,314 1,5422011 1,140 21 0 26 0 118 0 0 20 1,305 1,3252012 1,160 19 0 22 0 215 0 0 282 1,416 1,6982013 1,165 27 0 22 0 98 0 0 61 1,311 1,3722014 1,166 29 0 19 0 13 0 0 92 1,226 1,318Min 1,004 13 0 7 0 13 0 0 0 1,200 1,318Max 1,166 44 0 29 0 215 0 330 625 1,517 2,142
Average 1,126 26 0 22 0 115 0 68 180 1,356 1,536

Butte County Appendix C. Subinventory Unit Water Inventory and Analysis Land Use and Water Budgets
C-53 June 2016
Other Land Use
Year Wetlands DevelopedNon-
Irrigated Total 2000 6,912 105 1,584 8,600 2001 6,452 97 1,645 8,195 2002 6,194 92 1,731 8,017 2003 6,526 94 1,942 8,562 2004 6,582 92 2,160 8,833 2005 6,425 89 2,151 8,665 2006 6,596 89 2,142 8,827 2007 6,595 88 2,136 8,818 2008 6,362 82 2,044 8,487 2009 6,596 83 2,116 8,796 2010 6,474 80 2,063 8,616 2011 6,640 81 2,113 8,833 2012 6,385 78 1,997 8,460 2013 6,616 83 2,088 8,786 2014 6,653 84 2,103 8,840 Min 6,194 78 1,584 8,017 Max 6,912 105 2,160 8,840
Average 6,534 88 2,001 8,622 Water Budgets
Butte Sink Subinventory Unit Average Annual Inflows and Outflows (Thousands of Acre-Feet)
Precipitation16
Surface Water
39
Groundwater1
Evapotranspiration
29
Deep Percolation
12
Runoff and Return Flow
15
Inflows Outflows

Butte County Appendix C. Subinventory Unit Water Inventory and Analysis Land Use and Water Budgets
C-54 June 2016
Butte Sink Subinventory Unit Agricultural Area Average Annual Inflows and Outflows (Thousands of Acre-Feet)
Precipitation13
Surface Water
39
Groundwater1
Evapotranspiration
26
Deep Percolation
12
Runoff and Return Flow
14
Inflows Outflows
Butte Sink Subinventory Unit Developed Area Average Annual Inflows and Outflows (Thousands of Acre-Feet)
Precipitation0.14
Groundwater0.00
Evapotranspiration0.12
Deep Percolation
0.01
Runoff and Return Flow
0.01
Inflows Outflows

Butte County Appendix C. Subinventory Unit Water Inventory and Analysis Land Use and Water Budgets
C-55 June 2016
Butte Sink Subinventory Unit Native Area Average Annual Inflows and Outflows (Thousands of Acre-Feet)
Precipitation3.1
Evapotranspiration
2.3
Deep Percolation
0.2
Runoff and Return Flow
0.6
Inflows Outflows
Butte Sink Subinventory Unit 2000-2014 Water Year Inflows and Outflows (Thousands of Acre-Feet)
0 10 20 30 40 50 60 70
2000
2001
2002
2003
2004
2005
2006
2007
2008
2009
2010
2011
2012
2013
2014
Outflows (taf/year)
Evapotranspiration Deep Percolation Runoff and Return Flow
010203040506070
2000
2001
2002
2003
2004
2005
2006
2007
2008
2009
2010
2011
2012
2013
2014
Inflows (taf/year)
Surface Water Groundwater Precipitation

Butte County Appendix C. Subinventory Unit Water Inventory and Analysis Land Use and Water Budgets
C-56 June 2016
Subinventory Unit Water Budget
Water Year
Inflows (taf) Outflows (taf) Change
in Storage
(taf) Precipi-tation
Surface Water
Ground-water
Evapotrans-piration
Deep Percolation
Runoff and
Return Flow
2000 (AN) 17 42 1 30 13 17 02001 (D) 15 40 1 29 13 14 02002 (D) 17 39 0 28 12 16 0
2003 (AN) 19 39 2 28 12 20 02004 (BN) 18 40 2 28 12 19 -12005 (AN) 20 37 2 28 13 19 02006 (W) 24 37 2 27 13 23 02007 (D) 10 40 1 31 12 9 02008 (C) 16 40 1 30 12 15 02009 (D) 6 41 1 28 12 10 0
2010 (BN) 18 37 1 27 13 17 02011 (W) 21 36 1 27 12 19 02012 (BN) 11 40 1 29 12 11 02013 (D) 15 38 1 29 12 12 02014 (C) 8 38 2 29 12 6 0
Minimum 6 36 0 27 12 6 -1Maximum 24 42 2 31 13 23 0Average 16 39 1 29 12 15 0
Averages by Hydrologic Year Type Wet (W) 23 37 1 27 13 21 0
Above Normal (AN) 19 39 2 29 12 18 0Below Normal (BN) 16 39 1 28 12 16 0
Dry (D) 13 40 1 29 12 12 0Critical (C) 12 39 1 30 12 10 0

Butte County Appendix C. Subinventory Unit Water Inventory and Analysis Land Use and Water Budgets
C-57 June 2016
C.3.4. Cherokee Subinventory Unit Land Use General Land Use
Irrigated Agricultural Land Use
7 7 8 10
20 20 19 17
0.4 0.4 0.4 0.41 1 1 1
0
5
10
15
20
25
30
1995-1999 2000-2004 2005-2009 2010-2014
Acre
s (Th
ousa
nds)
Irrigated Agriculture Non-Irrigated Wetlands Developed
0
2
4
6
8
10
12
2000 2001 2002 2003 2004 2005 2006 2007 2008 2009 2010 2011 2012 2013 2014
Acre
s (Th
ousa
nds)
Rice Orchards Other Crops Idle Cropland

Butte County Appendix C. Subinventory Unit Water Inventory and Analysis Land Use and Water Budgets
C-58 June 2016
Irrigated Agricultural Land Use
Year Rice Almonds Walnuts Prunes
Other Trees and
Vines Grain
Pasture and
Alfalfa
Field and
Annual Idle
CroplandTotal
CroppedTotal
(w/Idle) 2000 3,345 1,544 0 162 847 197 188 134 91 6,418 6,5092001 2,983 1,494 0 166 754 189 199 164 745 5,949 6,6932002 3,056 1,437 0 128 906 178 211 293 848 6,209 7,0572003 3,222 1,539 0 97 801 203 220 286 391 6,368 6,7592004 3,236 1,660 0 66 801 136 235 133 1 6,266 6,2672005 3,278 1,583 36 49 1,024 92 221 239 614 6,522 7,1362006 4,006 1,532 45 66 1,085 140 211 32 247 7,116 7,3632007 4,228 1,561 49 66 1,216 146 195 55 224 7,515 7,7382008 4,822 1,318 50 61 1,572 145 164 206 988 8,337 9,3252009 4,944 1,473 61 64 1,724 129 175 15 344 8,584 8,9282010 5,256 1,463 63 64 1,999 100 149 63 595 9,155 9,7502011 5,382 1,469 83 61 2,158 136 147 24 2 9,459 9,4612012 5,442 1,440 80 53 2,061 165 147 24 980 9,411 10,3912013 5,407 1,465 87 54 2,010 114 155 24 393 9,315 9,7082014 5,401 1,483 87 44 1,981 14 164 27 431 9,202 9,633Min 2,983 1,318 0 44 754 14 147 15 1 5,949 6,267Max 5,442 1,660 87 166 2,158 203 235 293 988 9,459 10,391
Average 4,267 1,497 43 80 1,396 139 185 115 459 7,722 8,181

Butte County Appendix C. Subinventory Unit Water Inventory and Analysis Land Use and Water Budgets
C-59 June 2016
Other Land Use
Year Wetlands DevelopedNon-
Irrigated Total 2000 439 1,354 20,085 21,878 2001 419 1,349 19,927 21,695 2002 403 1,345 19,583 21,330 2003 400 1,400 19,829 21,629 2004 412 1,520 20,189 22,121 2005 390 1,433 19,428 21,251 2006 403 1,452 19,170 21,025 2007 407 1,449 18,793 20,649 2008 368 1,265 17,431 19,063 2009 396 1,368 17,696 19,459 2010 389 1,309 16,939 18,637 2011 417 1,397 17,113 18,927 2012 382 1,290 16,325 17,997 2013 412 1,396 16,871 18,680 2014 414 1,407 16,933 18,755 Min 368 1,265 16,325 17,997 Max 439 1,520 20,189 22,121
Average 403 1,382 18,421 20,206 Water Budgets
Cherokee Subinventory Unit Average Annual Inflows and Outflows (Thousands of Acre-Feet)
Precipitation72
Surface Water
0.5
Groundwater33
Evapotranspiration
50
Deep Percolation
34
Runoff and Return Flow
23
Inflows Outflows
Butte County Appendix C. Subinventory Unit Water Inventory and Analysis Land Use and Water Budgets
C-60 June 2016
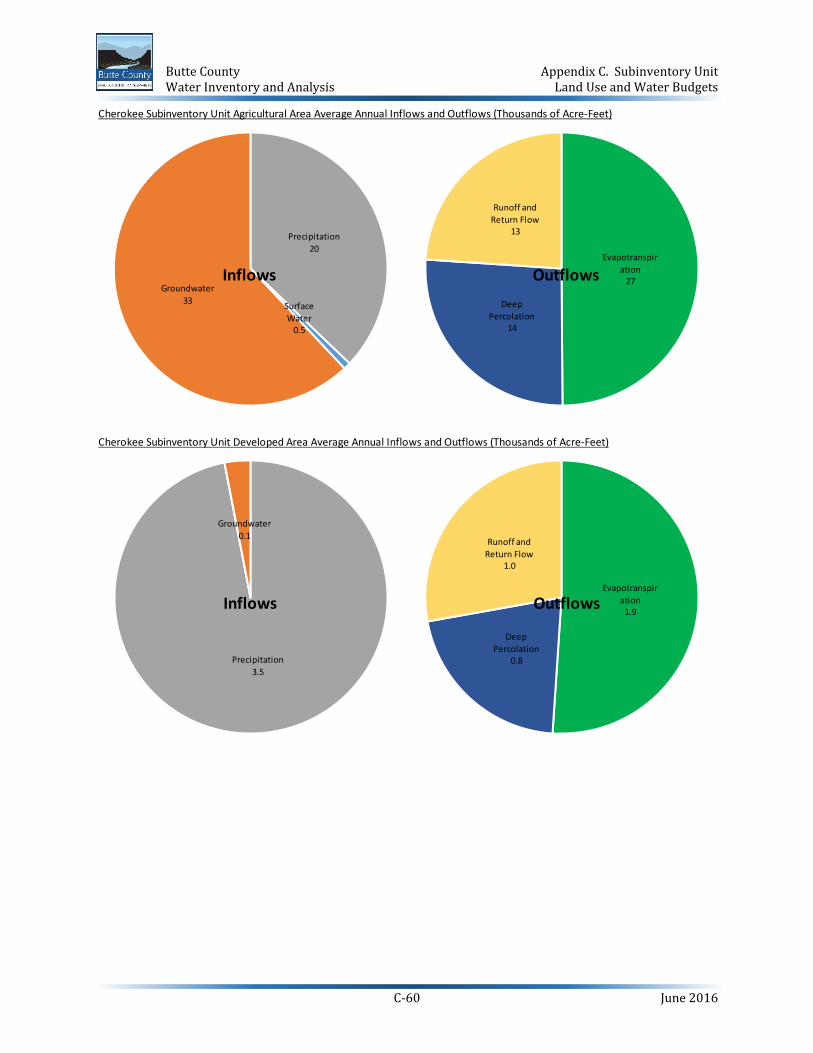
Cherokee Subinventory Unit Agricultural Area Average Annual Inflows and Outflows (Thousands of Acre-Feet)
Precipitation20
Surface Water
0.5
Groundwater33
Evapotranspiration
27
Deep Percolation
14
Runoff and Return Flow
13
Inflows Outflows
Cherokee Subinventory Unit Developed Area Average Annual Inflows and Outflows (Thousands of Acre-Feet)
Precipitation3.5
Groundwater0.1
Evapotranspiration
1.9
Deep Percolation
0.8
Runoff and Return Flow
1.0
Inflows Outflows

Butte County Appendix C. Subinventory Unit Water Inventory and Analysis Land Use and Water Budgets
C-61 June 2016
Cherokee Subinventory Unit Native Area Average Annual Inflows and Outflows (Thousands of Acre-Feet)
Precipitation49
Evapotranspiration
21
Deep Percolation
19
Runoff and Return Flow
9
Inflows Outflows
Cherokee Subinventory Unit 2000-2014 Water Year Inflows and Outflows (Thousands of Acre-Feet)
0 20 40 60 80 100 120 140 160
2000
2001
2002
2003
2004
2005
2006
2007
2008
2009
2010
2011
2012
2013
2014
Outflows (taf/year)
Evapotranspiration Deep Percolation Runoff and Return Flow
020406080100120140160
2000
2001
2002
2003
2004
2005
2006
2007
2008
2009
2010
2011
2012
2013
2014
Inflows (taf/year)
Surface Water Groundwater Precipitation

Butte County Appendix C. Subinventory Unit Water Inventory and Analysis Land Use and Water Budgets
C-62 June 2016
Subinventory Unit Water Budget
Water Year
Inflows (taf) Outflows (taf) Change
in Storage
(taf) Precipi-tation
Surface Water
Ground-water
Evapotrans-piration
Deep Percolation
Runoff and
Return Flow
2000 (AN) 79 1 28 46 36 26 02001 (D) 60 1 27 46 28 14 02002 (D) 71 0 28 46 32 22 0
2003 (AN) 91 0 27 47 39 31 12004 (BN) 72 0 28 41 37 21 -12005 (AN) 82 0 27 50 38 22 22006 (W) 104 0 29 46 51 36 02007 (D) 48 0 37 54 19 13 22008 (C) 46 0 41 49 25 14 -12009 (D) 67 0 38 53 30 22 1
2010 (BN) 80 0 36 52 40 27 12011 (W) 102 0 33 54 49 31 02012 (BN) 63 0 40 56 27 22 02013 (D) 67 0 40 54 29 22 12014 (C) 51 0 42 54 23 16 -1
Minimum 46 0 27 41 19 13 -1Maximum 104 1 42 56 51 36 2Average 72 0 33 50 34 23 0
Averages by Hydrologic Year Type Wet (W) 103 0 31 50 50 33 0
Above Normal (AN) 84 1 27 48 38 26 1Below Normal (BN) 72 0 35 50 35 23 0
Dry (D) 63 1 34 51 28 19 1Critical (C) 48 0 41 52 24 15 -1

Butte County Appendix C. Subinventory Unit Water Inventory and Analysis Land Use and Water Budgets
C-63 June 2016
C.3.5. Esquon Subinventory Unit Land Use General Land Use
Irrigated Agricultural Land Use
7.7 7.8 8.1 8.2
1.8 1.6 1.4 1.30.9 1.0 1.1 1.01.2 1.3 1.1 1.1
0
2
4
6
8
10
12
14
1995-1999 2000-2004 2005-2009 2010-2014
Acre
s (Th
ousa
nds)
Irrigated Agriculture Non-Irrigated Wetlands Developed
0
1
2
3
4
5
6
7
8
9
2000 2001 2002 2003 2004 2005 2006 2007 2008 2009 2010 2011 2012 2013 2014
Acre
s (Th
ousa
nds)
Rice Orchards Other Crops Idle Cropland

Butte County Appendix C. Subinventory Unit Water Inventory and Analysis Land Use and Water Budgets
C-64 June 2016
Irrigated Agricultural Land Use
Year Rice Almonds Walnuts Prunes
Other Trees and
Vines Grain
Pasture and
Alfalfa
Field and
Annual Idle
CroplandTotal
CroppedTotal
(w/Idle) 2000 5,675 1,471 102 0 22 27 206 114 168 7,616 7,7852001 5,066 1,396 100 0 22 25 251 165 756 7,024 7,7802002 5,198 1,342 103 0 16 21 309 184 600 7,173 7,7732003 5,441 1,427 112 0 21 24 323 185 298 7,533 7,8312004 5,526 1,469 123 0 11 13 411 115 1 7,666 7,6672005 5,106 1,477 147 0 19 7 393 192 598 7,340 7,9382006 5,550 1,550 196 0 12 10 460 13 152 7,789 7,9412007 5,459 1,678 199 0 12 8 485 11 105 7,851 7,9552008 5,461 1,538 166 0 28 8 459 202 522 7,862 8,3842009 5,346 1,781 238 0 10 3 521 24 224 7,923 8,1482010 5,312 1,833 230 0 14 1 499 131 320 8,020 8,3402011 5,202 1,946 299 0 16 0 581 42 1 8,086 8,0872012 5,272 1,899 288 0 15 0 493 35 430 8,001 8,4312013 5,216 1,915 329 0 15 0 483 33 170 7,989 8,1592014 5,197 1,920 322 0 14 0 493 33 195 7,978 8,174Min 5,066 1,342 100 0 10 0 206 11 1 7,024 7,667Max 5,675 1,946 329 0 28 27 581 202 756 8,086 8,431
Average 5,335 1,643 197 0 16 10 424 98 303 7,723 8,026

Butte County Appendix C. Subinventory Unit Water Inventory and Analysis Land Use and Water Budgets
C-65 June 2016
Other Land Use
Year Wetlands DevelopedNon-
Irrigated Total 2000 953 1,263 1,655 3,871 2001 996 1,231 1,649 3,875 2002 1,033 1,234 1,615 3,882 2003 1,081 1,231 1,513 3,824 2004 1,179 1,312 1,497 3,989 2005 1,112 1,183 1,423 3,718 2006 1,092 1,198 1,424 3,714 2007 1,097 1,189 1,414 3,700 2008 975 1,050 1,246 3,271 2009 1,056 1,115 1,336 3,507 2010 1,008 1,058 1,249 3,316 2011 1,094 1,132 1,342 3,568 2012 967 1,038 1,219 3,224 2013 1,082 1,112 1,303 3,496 2014 1,083 1,109 1,290 3,482 Min 953 1,038 1,219 3,224 Max 1,179 1,312 1,655 3,989
Average 1,054 1,164 1,412 3,629 Water Budgets
Esquon Subinventory Unit Average Annual Inflows and Outflows (Thousands of Acre-Feet)
Precipitation27
Surface Water
12
Groundwater29 Evapotranspir
ation34
Deep Percolation
11
Runoff and Return Flow
22
Inflows Outflows
Butte County Appendix C. Subinventory Unit Water Inventory and Analysis Land Use and Water Budgets
C-66 June 2016
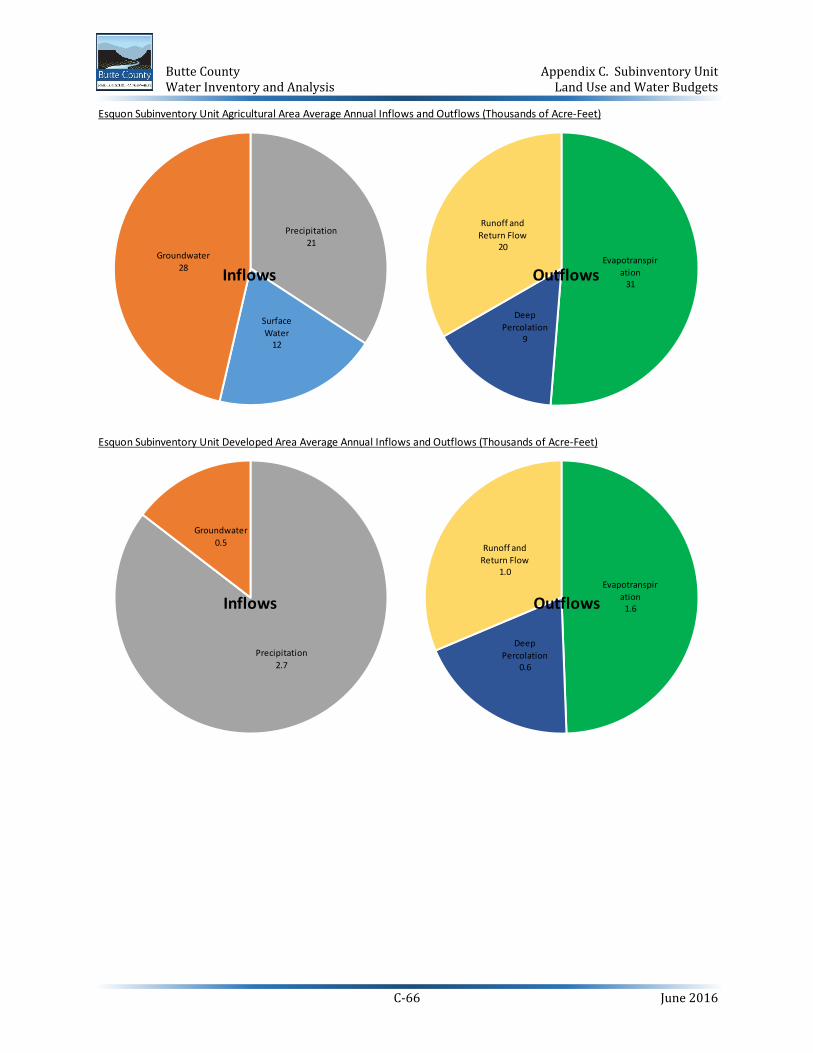
Esquon Subinventory Unit Agricultural Area Average Annual Inflows and Outflows (Thousands of Acre-Feet)
Precipitation21
Surface Water
12
Groundwater28
Evapotranspiration
31
Deep Percolation
9
Runoff and Return Flow
20
Inflows Outflows
Esquon Subinventory Unit Developed Area Average Annual Inflows and Outflows (Thousands of Acre-Feet)
Precipitation2.7
Groundwater0.5
Evapotranspiration
1.6
Deep Percolation
0.6
Runoff and Return Flow
1.0
Inflows Outflows

Butte County Appendix C. Subinventory Unit Water Inventory and Analysis Land Use and Water Budgets
C-67 June 2016
Esquon Subinventory Unit Native Area Average Annual Inflows and Outflows (Thousands of Acre-Feet)
Precipitation3.4
Evapotranspiration
1.6
Deep Percolation
1.2
Runoff and Return Flow
0.6
Inflows Outflows
Esquon Subinventory Unit 2000-2014 Water Year Inflows and Outflows (Thousands of Acre-Feet)
0 20 40 60 80 100
2000
2001
2002
2003
2004
2005
2006
2007
2008
2009
2010
2011
2012
2013
2014
Outflows (taf/year)
Evapotranspiration Deep Percolation Runoff and Return Flow
01020304050607080
2000
2001
2002
2003
2004
2005
2006
2007
2008
2009
2010
2011
2012
2013
2014
Inflows (taf/year)
Surface Water Groundwater Precipitation
Butte County Appendix C. Subinventory Unit Water Inventory and Analysis Land Use and Water Budgets
C-68 June 2016
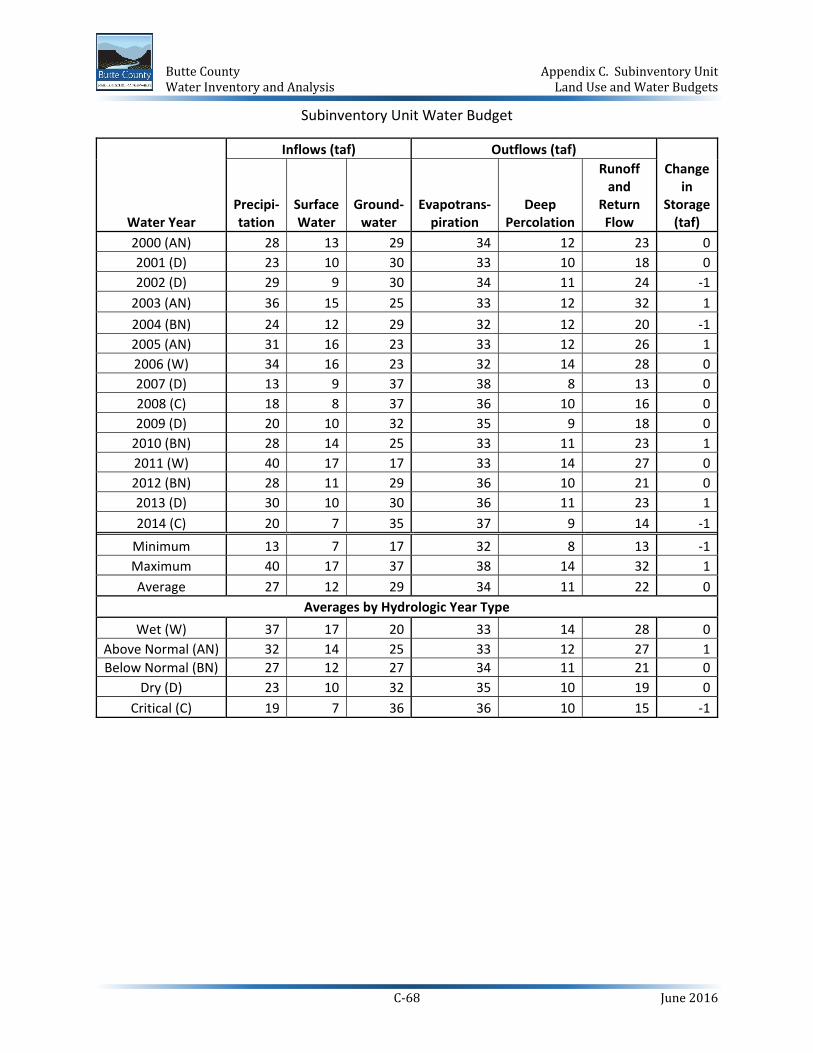
Subinventory Unit Water Budget
Water Year
Inflows (taf) Outflows (taf) Change
in Storage
(taf) Precipi-tation
Surface Water
Ground-water
Evapotrans-piration
Deep Percolation
Runoff and
Return Flow
2000 (AN) 28 13 29 34 12 23 02001 (D) 23 10 30 33 10 18 02002 (D) 29 9 30 34 11 24 -1
2003 (AN) 36 15 25 33 12 32 12004 (BN) 24 12 29 32 12 20 -12005 (AN) 31 16 23 33 12 26 12006 (W) 34 16 23 32 14 28 02007 (D) 13 9 37 38 8 13 02008 (C) 18 8 37 36 10 16 02009 (D) 20 10 32 35 9 18 0
2010 (BN) 28 14 25 33 11 23 12011 (W) 40 17 17 33 14 27 02012 (BN) 28 11 29 36 10 21 02013 (D) 30 10 30 36 11 23 12014 (C) 20 7 35 37 9 14 -1
Minimum 13 7 17 32 8 13 -1Maximum 40 17 37 38 14 32 1Average 27 12 29 34 11 22 0
Averages by Hydrologic Year Type Wet (W) 37 17 20 33 14 28 0
Above Normal (AN) 32 14 25 33 12 27 1Below Normal (BN) 27 12 27 34 11 21 0
Dry (D) 23 10 32 35 10 19 0Critical (C) 19 7 36 36 10 15 -1

Butte County Appendix C. Subinventory Unit Water Inventory and Analysis Land Use and Water Budgets
C-69 June 2016
C.3.6. Pentz Subinventory Unit Land Use General Land Use
Irrigated Agricultural Land Use
0.3 0.2 0.3 0.4
17 17 17 17
1 1 1 1
0
2
4
6
8
10
12
14
16
18
20
1995-1999 2000-2004 2005-2009 2010-2014
Acre
s (Th
ousa
nds)
Irrigated Agriculture Non-Irrigated Wetlands Developed
0.0
0.1
0.2
0.3
0.4
0.5
0.6
0.7
0.8
0.9
2000 2001 2002 2003 2004 2005 2006 2007 2008 2009 2010 2011 2012 2013 2014
Acre
s (Th
ousa
nds)
Rice Orchards Other Crops Idle Cropland

Butte County Appendix C. Subinventory Unit Water Inventory and Analysis Land Use and Water Budgets
C-70 June 2016
Irrigated Agricultural Land Use
Year Rice Almonds Walnuts Prunes
Other Trees and
Vines Grain
Pasture and
Alfalfa
Field and
Annual Idle
CroplandTotal
CroppedTotal
(w/Idle) 2000 4 11 0 0 0 0 17 5 1 37 392001 4 11 0 0 0 0 36 4 197 53 2512002 3 10 0 0 0 0 58 5 261 76 3372003 3 11 0 0 0 0 75 5 107 93 2002004 2 11 0 0 0 0 100 1 0 115 1152005 2 10 0 0 0 0 93 7 266 112 3782006 3 9 0 0 0 0 99 0 5 110 1162007 3 8 0 0 0 0 98 0 4 109 1132008 6 6 0 0 0 0 96 37 595 144 7392009 3 5 0 0 0 0 99 1 51 108 1582010 7 3 0 0 0 0 99 12 403 121 5242011 2 2 0 0 0 0 99 10 0 113 1132012 8 2 0 0 0 0 99 9 675 118 7932013 3 2 0 0 0 0 88 9 228 102 3302014 3 2 0 0 0 0 93 10 137 108 245Min 2 2 0 0 0 0 17 0 0 37 39Max 8 11 0 0 0 0 100 37 675 144 793
Average 4 7 0 0 0 0 83 8 195 101 297

Butte County Appendix C. Subinventory Unit Water Inventory and Analysis Land Use and Water Budgets
C-71 June 2016
Other Land Use
Year Wetlands DevelopedNon-
Irrigated Total 2000 128 542 17,604 18,274 2001 110 551 17,401 18,062 2002 94 565 17,316 17,975 2003 80 593 17,439 18,112 2004 63 618 17,517 18,198 2005 62 599 17,274 17,935 2006 63 613 17,521 18,197 2007 63 610 17,526 18,200 2008 60 579 16,935 17,573 2009 63 602 17,489 18,154 2010 61 586 17,141 17,788 2011 63 596 17,540 18,199 2012 61 579 16,880 17,520 2013 63 600 17,320 17,983 2014 63 606 17,398 18,067 Min 60 542 16,880 17,520 Max 128 618 17,604 18,274
Average 73 589 17,353 18,016 Water Budgets
Pentz Subinventory Unit Average Annual Inflows and Outflows (Thousands of Acre-Feet)
Precipitation47
Groundwater0.7
Evapotranspiration
21
Deep Percolation
19
Runoff and Return Flow
8
Inflows Outflows

Butte County Appendix C. Subinventory Unit Water Inventory and Analysis Land Use and Water Budgets
C-72 June 2016
Pentz Subinventory Unit Agricultural Area Average Annual Inflows and Outflows (Thousands of Acre-Feet)
Precipitation0.9
Groundwater0.6 Evapotranspir
ation0.7
Deep Percolation
0.4
Runoff and Return Flow
0.4
Inflows Outflows
Pentz Subinventory Unit Developed Area Average Annual Inflows and Outflows (Thousands of Acre-Feet)
Precipitation1.5
Groundwater0.1
Evapotranspiration
0.7
Deep Percolation
0.5
Runoff and Return Flow
0.4
Inflows Outflows

Butte County Appendix C. Subinventory Unit Water Inventory and Analysis Land Use and Water Budgets
C-73 June 2016
Pentz Subinventory Unit Native Area Average Annual Inflows and Outflows (Thousands of Acre-Feet)
Precipitation45
Evapotranspiration
19
Deep Percolation
18
Runoff and Return Flow
7
Inflows Outflows
Pentz Subinventory Unit 2000-2014 Water Year Inflows and Outflows (Thousands of Acre-Feet)
0 10 20 30 40 50 60 70 80
2000
2001
2002
2003
2004
2005
2006
2007
2008
2009
2010
2011
2012
2013
2014
Outflows (taf/year)
Evapotranspiration Deep Percolation Runoff and Return Flow
01020304050607080
2000
2001
2002
2003
2004
2005
2006
2007
2008
2009
2010
2011
2012
2013
2014
Inflows (taf/year)
Surface Water Groundwater Precipitation

Butte County Appendix C. Subinventory Unit Water Inventory and Analysis Land Use and Water Budgets
C-74 June 2016
Subinventory Unit Water Budget
Water Year
Inflows (taf) Outflows (taf) Change
in Storage
(taf) Precipi-tation
Surface Water
Ground-water
Evapotrans-piration
Deep Percolation
Runoff and
Return Flow
2000 (AN) 52 0 1 20 22 9 02001 (D) 37 0 1 20 14 3 02002 (D) 51 0 1 20 22 11 0
2003 (AN) 63 0 1 21 25 17 02004 (BN) 46 0 1 16 22 8 02005 (AN) 53 0 1 24 23 6 12006 (W) 70 0 1 20 34 17 -12007 (D) 32 0 1 22 7 3 12008 (C) 32 0 1 18 12 4 02009 (D) 41 0 1 22 13 7 0
2010 (BN) 51 0 1 21 23 8 02011 (W) 64 0 1 24 30 10 02012 (BN) 41 0 1 23 12 8 02013 (D) 44 0 1 20 15 8 22014 (C) 33 0 1 20 9 5 -1
Minimum 32 0 1 16 7 3 -1Maximum 70 0 1 24 34 17 2Average 47 0 1 21 19 8 0
Averages by Hydrologic Year Type Wet (W) 67 0 1 22 32 13 0
Above Normal (AN) 56 0 1 22 24 11 0Below Normal (BN) 46 0 1 20 19 8 0
Dry (D) 41 0 1 21 14 6 1Critical (C) 32 0 1 19 11 5 -1

Butte County Appendix C. Subinventory Unit Water Inventory and Analysis Land Use and Water Budgets
C-75 June 2016
C.3.7. Richvale Subinventory Unit Land Use General Land Use
Irrigated Agricultural Land Use
32 31 31 31
2 2 3 34 4 5 52 2 1 1
0
5
10
15
20
25
30
35
40
45
1995-1999 2000-2004 2005-2009 2010-2014
Acre
s (Th
ousa
nds)
Irrigated Agriculture Non-Irrigated Wetlands Developed
0
5
10
15
20
25
30
35
2000 2001 2002 2003 2004 2005 2006 2007 2008 2009 2010 2011 2012 2013 2014
Acre
s (Th
ousa
nds)
Rice Orchards Other Crops Idle Cropland

Butte County Appendix C. Subinventory Unit Water Inventory and Analysis Land Use and Water Budgets
C-76 June 2016
Irrigated Agricultural Land Use
Year Rice Almonds Walnuts Prunes
Other Trees and
Vines Grain
Pasture and
Alfalfa
Field and
Annual Idle
CroplandTotal
CroppedTotal
(w/Idle) 2000 30,749 0 0 16 0 266 188 119 262 31,338 31,6002001 27,764 0 0 21 0 290 202 125 2,803 28,403 31,2062002 28,767 0 0 16 0 206 185 118 1,839 29,292 31,1322003 24,692 0 0 15 0 156 137 84 6,004 25,084 31,0882004 30,426 0 0 16 0 27 120 29 2 30,617 30,6192005 28,305 0 0 10 0 14 119 21 2,059 28,470 30,5292006 30,431 0 0 11 0 28 115 3 229 30,589 30,8182007 30,415 0 0 9 0 30 115 3 133 30,573 30,7062008 24,454 0 0 6 0 27 104 46 7,046 24,637 31,6832009 27,825 0 0 4 0 26 109 9 3,159 27,973 31,1322010 23,673 0 0 2 0 23 106 44 7,658 23,847 31,5052011 30,451 0 0 0 0 27 117 29 11 30,623 30,6342012 24,590 0 0 0 0 40 104 4 6,979 24,739 31,7172013 30,480 0 0 0 0 23 101 0 163 30,603 30,7662014 24,043 0 0 0 0 3 106 0 6,589 24,152 30,741Min 23,673 0 0 0 0 3 101 0 2 23,847 30,529Max 30,749 0 0 21 0 290 202 125 7,658 31,338 31,717
Average 27,804 0 0 8 0 79 129 42 2,996 28,063 31,058

Butte County Appendix C. Subinventory Unit Water Inventory and Analysis Land Use and Water Budgets
C-77 June 2016
Other Land Use
Year Wetlands DevelopedNon-
Irrigated Total 2000 4,076 2,322 1,701 8,098 2001 4,104 2,156 2,232 8,492 2002 4,123 1,920 2,524 8,567 2003 4,339 1,636 2,635 8,610 2004 4,666 1,414 3,000 9,079 2005 4,595 1,443 3,131 9,169 2006 4,676 1,330 2,874 8,880 2007 4,741 1,353 2,899 8,992 2008 4,348 1,139 2,528 8,016 2009 4,677 1,202 2,688 8,566 2010 4,514 1,139 2,541 8,193 2011 4,896 1,318 2,850 9,064 2012 4,458 1,083 2,440 7,981 2013 4,856 1,297 2,779 8,932 2014 4,875 1,306 2,777 8,958 Min 4,076 1,083 1,701 7,981 Max 4,896 2,322 3,131 9,169
Average 4,530 1,470 2,640 8,640 Water Budgets
Richvale Subinventory Unit Average Annual Inflows and Outflows (Thousands of Acre-Feet)
Precipitation70
Surface Water
169
Groundwater0.4
Evapotranspiration127
Deep Percolation
20
Runoff and Return Flow
92
Inflows Outflows

Butte County Appendix C. Subinventory Unit Water Inventory and Analysis Land Use and Water Budgets
C-78 June 2016
Richvale Subinventory Unit Agricultural Area Average Annual Inflows and Outflows (Thousands of Acre-Feet)
Precipitation63
Surface Water
169
Groundwater0.3
Evapotranspiration122
Deep Percolation
20
Runoff and Return Flow
90
Inflows Outflows
Richvale Subinventory Unit Developed Area Average Annual Inflows and Outflows (Thousands of Acre-Feet)
Precipitation2.8
Groundwater0.1
Evapotranspiration
2.1
Deep Percolation
0.1
Runoff and Return Flow
0.6
Inflows Outflows

Butte County Appendix C. Subinventory Unit Water Inventory and Analysis Land Use and Water Budgets
C-79 June 2016
Richvale Subinventory Unit Native Area Average Annual Inflows and Outflows (Thousands of Acre-Feet)
Precipitation4
Evapotranspiration
3
Deep Percolation
0
Runoff and Return Flow
1
Inflows Outflows
Richvale Subinventory Unit 2000-2014 Water Year Inflows and Outflows (Thousands of Acre-Feet)
0 50 100 150 200 250 300
2000
2001
2002
2003
2004
2005
2006
2007
2008
2009
2010
2011
2012
2013
2014
Outflows (taf/year)
Evapotranspiration Deep Percolation Runoff and Return Flow
050100150200250300
2000
2001
2002
2003
2004
2005
2006
2007
2008
2009
2010
2011
2012
2013
2014
Inflows (taf/year)
Surface Water Groundwater Precipitation

Butte County Appendix C. Subinventory Unit Water Inventory and Analysis Land Use and Water Budgets
C-80 June 2016
Subinventory Unit Water Budget
Water Year
Inflows (taf) Outflows (taf) Change
in Storage
(taf) Precipi-tation
Surface Water
Ground-water
Evapotrans-piration
Deep Percolation
Runoff and
Return Flow
2000 (AN) 77 163 0 136 21 83 02001 (D) 60 173 0 132 20 80 -12002 (D) 67 166 0 132 20 79 -2
2003 (AN) 86 152 0 115 19 109 52004 (BN) 71 186 0 125 20 107 -62005 (AN) 81 197 0 126 23 134 42006 (W) 100 179 0 125 24 132 22007 (D) 46 196 0 147 21 75 02008 (C) 45 164 0 125 19 63 -32009 (D) 63 162 0 126 19 81 1
2010 (BN) 79 139 0 110 20 93 42011 (W) 99 161 0 124 22 113 -12012 (BN) 60 166 0 121 18 86 -12013 (D) 65 172 0 137 19 80 -12014 (C) 48 154 0 120 18 63 -1
Minimum 45 139 0 110 18 63 -6Maximum 100 197 0 147 24 134 5Average 70 169 0 127 20 92 0
Averages by Hydrologic Year Type Wet (W) 100 170 0 124 23 123 0
Above Normal (AN) 81 171 0 125 21 109 3Below Normal (BN) 70 164 0 118 19 96 -1
Dry (D) 60 174 0 135 20 79 -1Critical (C) 47 159 0 122 18 63 -2

Butte County Appendix C. Subinventory Unit Water Inventory and Analysis Land Use and Water Budgets
C-81 June 2016
C.3.8. Thermalito Subinventory Unit Land Use General Land Use
Irrigated Agricultural Land Use
5 5 5 5
15 14 13 12
3 3 3 4
3 3 4 4
0
5
10
15
20
25
30
1995-1999 2000-2004 2005-2009 2010-2014
Acre
s (Th
ousa
nds)
Irrigated Agriculture Non-Irrigated Wetlands Developed
0
1
2
3
4
5
6
2000 2001 2002 2003 2004 2005 2006 2007 2008 2009 2010 2011 2012 2013 2014
Acre
s (Th
ousa
nds)
Rice Orchards Other Crops Idle Cropland
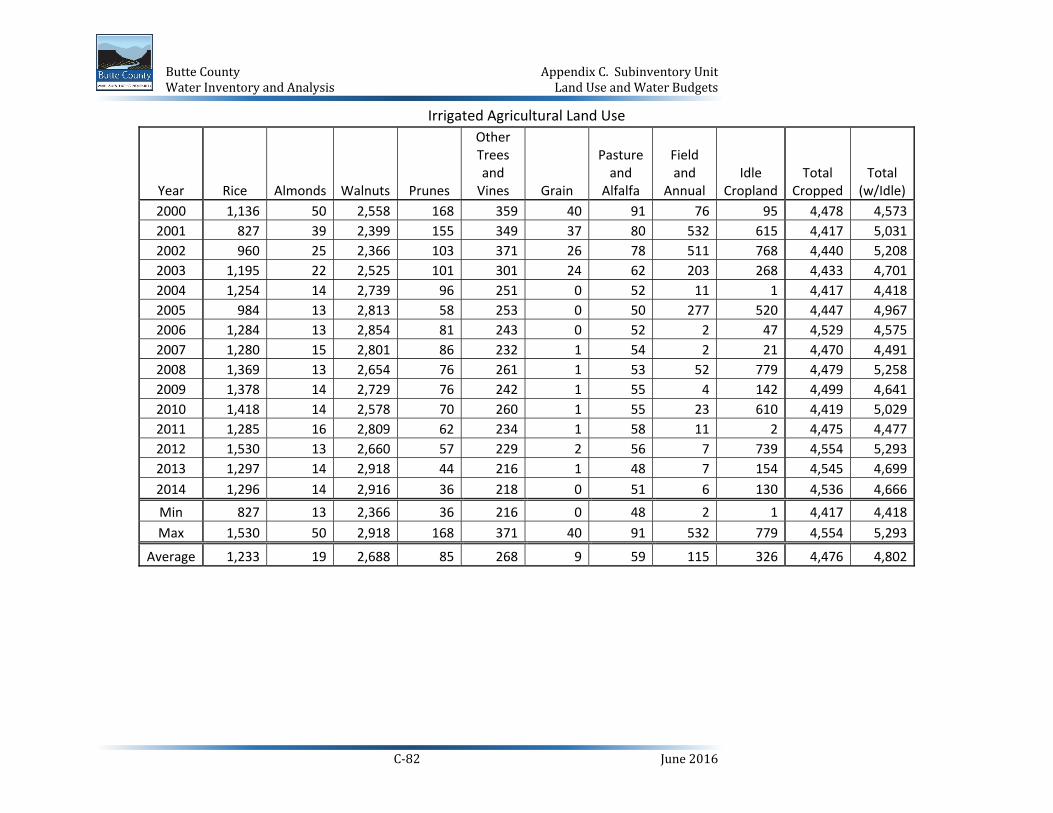
Butte County Appendix C. Subinventory Unit Water Inventory and Analysis Land Use and Water Budgets
C-82 June 2016
Irrigated Agricultural Land Use
Year Rice Almonds Walnuts Prunes
Other Trees and
Vines Grain
Pasture and
Alfalfa
Field and
Annual Idle
CroplandTotal
CroppedTotal
(w/Idle) 2000 1,136 50 2,558 168 359 40 91 76 95 4,478 4,5732001 827 39 2,399 155 349 37 80 532 615 4,417 5,0312002 960 25 2,366 103 371 26 78 511 768 4,440 5,2082003 1,195 22 2,525 101 301 24 62 203 268 4,433 4,7012004 1,254 14 2,739 96 251 0 52 11 1 4,417 4,4182005 984 13 2,813 58 253 0 50 277 520 4,447 4,9672006 1,284 13 2,854 81 243 0 52 2 47 4,529 4,5752007 1,280 15 2,801 86 232 1 54 2 21 4,470 4,4912008 1,369 13 2,654 76 261 1 53 52 779 4,479 5,2582009 1,378 14 2,729 76 242 1 55 4 142 4,499 4,6412010 1,418 14 2,578 70 260 1 55 23 610 4,419 5,0292011 1,285 16 2,809 62 234 1 58 11 2 4,475 4,4772012 1,530 13 2,660 57 229 2 56 7 739 4,554 5,2932013 1,297 14 2,918 44 216 1 48 7 154 4,545 4,6992014 1,296 14 2,916 36 218 0 51 6 130 4,536 4,666Min 827 13 2,366 36 216 0 48 2 1 4,417 4,418Max 1,530 50 2,918 168 371 40 91 532 779 4,554 5,293
Average 1,233 19 2,688 85 268 9 59 115 326 4,476 4,802

Butte County Appendix C. Subinventory Unit Water Inventory and Analysis Land Use and Water Budgets
C-83 June 2016
Other Land Use
Year Wetlands4 DevelopedNon-
Irrigated Total 2000 2,854 3,089 14,498 20,440 2001 2,831 3,030 14,121 19,982 2002 2,905 3,046 13,855 19,805 2003 3,211 3,247 13,854 20,313 2004 3,361 3,363 13,872 20,596 2005 3,309 3,367 13,370 20,046 2006 3,451 3,611 13,376 20,438 2007 3,508 3,789 13,225 20,522 2008 3,405 3,779 12,571 19,756 2009 3,585 4,029 12,759 20,372 2010 3,548 4,117 12,319 19,984 2011 3,714 4,405 12,417 20,536 2012 3,549 4,220 11,952 19,720 2013 3,698 4,381 12,235 20,314 2014 3,710 4,396 12,241 20,347 Min 2,831 3,030 11,952 19,720 Max 3,714 4,405 14,498 20,596
Average 3,376 3,725 13,111 20,211 Water Budgets
4 Within the East Butte Inventory Unit, Thermalito Afterbay is classified as wetlands for purposes of this report and represents approximately 3,000 acres.
Thermalito Subinventory Unit Average Annual Inflows and Outflows (Thousands of Acre-Feet)
Precipitation52
Surface Water
4
Groundwater39 Evapotranspir
ation44
Deep Percolation
30
Runoff and Return Flow
20
Inflows Outflows

Butte County Appendix C. Subinventory Unit Water Inventory and Analysis Land Use and Water Budgets
C-84 June 2016
Thermalito Subinventory Unit Agricultural Area Average Annual Inflows and Outflows (Thousands of Acre-Feet)
Precipitation16
Surface Water
1Groundwater37
Evapotranspiration
27
Deep Percolation
15
Runoff and Return Flow
13
Inflows Outflows
Thermalito Subinventory Unit Developed Area Average Annual Inflows and Outflows (Thousands of Acre-Feet)
Precipitation8
Surface Water
2
Groundwater2
Evapotranspiration
4.4
Deep Percolation
2.4
Runoff and Return Flow
5.1Inflows Outflows

Butte County Appendix C. Subinventory Unit Water Inventory and Analysis Land Use and Water Budgets
C-85 June 2016
Thermalito Subinventory Unit Native Area Average Annual Inflows and Outflows (Thousands of Acre-Feet)
Precipitation28
Evapotranspiration
13Deep Percolation
13
Runoff and Return Flow
2
Inflows Outflows
Thermalito Subinventory Unit 2000-2014 Water Year Inflows and Outflows (Thousands of Acre-Feet)
0 20 40 60 80 100 120 140
2000
2001
2002
2003
2004
2005
2006
2007
2008
2009
2010
2011
2012
2013
2014
Outflows (taf/year)
Evapotranspiration Deep Percolation Runoff and Return Flow
020406080100120140
2000
2001
2002
2003
2004
2005
2006
2007
2008
2009
2010
2011
2012
2013
2014
Inflows (taf/year)
Surface Water Groundwater Precipitation

Butte County Appendix C. Subinventory Unit Water Inventory and Analysis Land Use and Water Budgets
C-86 June 2016
Subinventory Unit Water Budget
Water Year
Inflows (taf) Outflows (taf) Change
in Storage
(taf) Precipi-tation
Surface Water
Ground-water
Evapotrans-piration
Deep Percolation
Runoff and
Return Flow
2000 (AN) 59 4 36 41 35 22 02001 (D) 44 4 35 42 25 16 02002 (D) 47 4 35 42 27 17 0
2003 (AN) 62 4 35 45 35 22 02004 (BN) 54 4 39 40 35 23 02005 (AN) 59 4 36 46 32 21 12006 (W) 77 3 37 43 46 29 02007 (D) 38 3 43 48 19 17 22008 (C) 31 4 44 42 22 16 -12009 (D) 53 4 41 46 29 22 1
2010 (BN) 61 3 37 45 34 21 02011 (W) 73 3 35 48 40 25 02012 (BN) 43 4 42 47 23 18 02013 (D) 45 4 42 45 25 19 12014 (C) 36 3 44 46 21 17 0
Minimum 31 3 35 40 19 16 -1Maximum 77 4 44 48 46 29 2Average 52 4 39 44 30 20 0
Averages by Hydrologic Year Type Wet (W) 75 3 36 45 43 27 0
Above Normal (AN) 60 4 36 44 34 22 0Below Normal (BN) 53 4 39 44 31 20 0
Dry (D) 46 4 39 45 25 18 1Critical (C) 34 4 44 44 21 17 -1

Butte County Appendix C. Subinventory Unit Water Inventory and Analysis Land Use and Water Budgets
C-87 June 2016
C.3.9. Western Canal Subinventory Unit (East Butte Portion) Land Use General Land Use
Irrigated Agricultural Land Use
27 27 27 27
1.2 1.2 1.2 1.21.2 1.1 0.7 0.71.7 1.8 1.6 1.5
0
5
10
15
20
25
30
35
1995-1999 2000-2004 2005-2009 2010-2014
Acre
s (Th
ousa
nds)
Irrigated Agriculture Non-Irrigated Wetlands Developed
0
5
10
15
20
25
30
2000 2001 2002 2003 2004 2005 2006 2007 2008 2009 2010 2011 2012 2013 2014
Acre
s (Th
ousa
nds)
Rice Orchards Other Crops Idle Cropland
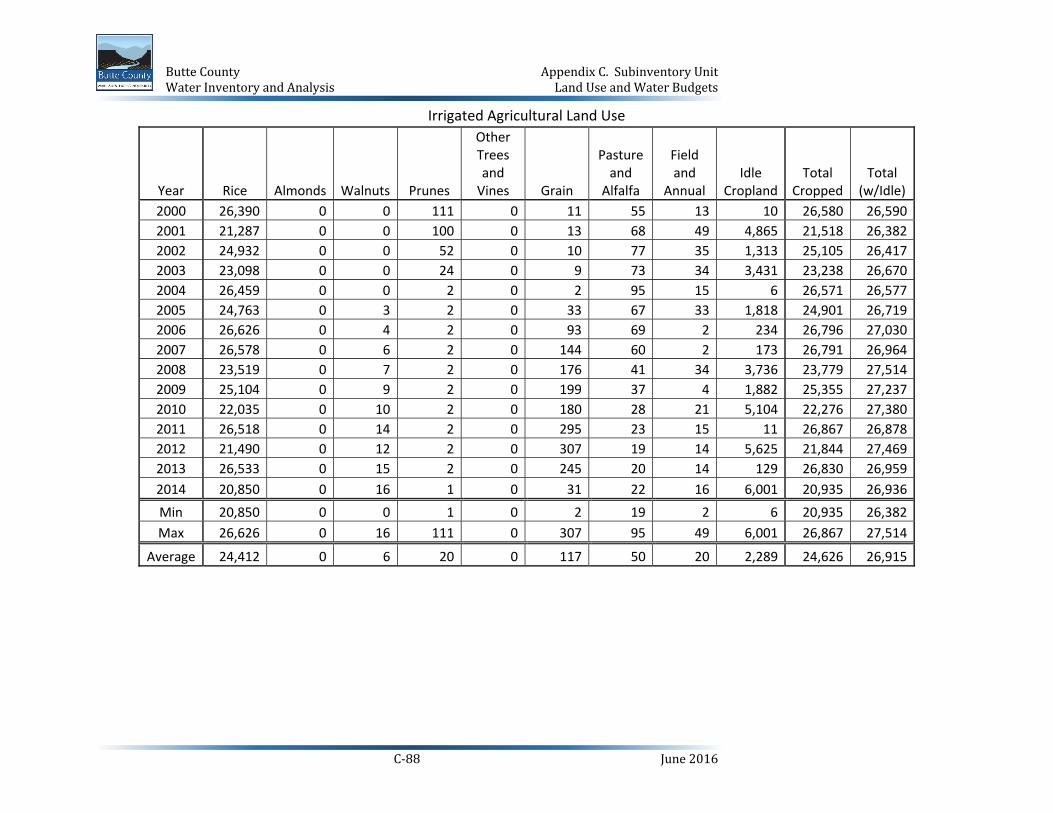
Butte County Appendix C. Subinventory Unit Water Inventory and Analysis Land Use and Water Budgets
C-88 June 2016
Irrigated Agricultural Land Use
Year Rice Almonds Walnuts Prunes
Other Trees and
Vines Grain
Pasture and
Alfalfa
Field and
Annual Idle
CroplandTotal
CroppedTotal
(w/Idle) 2000 26,390 0 0 111 0 11 55 13 10 26,580 26,5902001 21,287 0 0 100 0 13 68 49 4,865 21,518 26,3822002 24,932 0 0 52 0 10 77 35 1,313 25,105 26,4172003 23,098 0 0 24 0 9 73 34 3,431 23,238 26,6702004 26,459 0 0 2 0 2 95 15 6 26,571 26,5772005 24,763 0 3 2 0 33 67 33 1,818 24,901 26,7192006 26,626 0 4 2 0 93 69 2 234 26,796 27,0302007 26,578 0 6 2 0 144 60 2 173 26,791 26,9642008 23,519 0 7 2 0 176 41 34 3,736 23,779 27,5142009 25,104 0 9 2 0 199 37 4 1,882 25,355 27,2372010 22,035 0 10 2 0 180 28 21 5,104 22,276 27,3802011 26,518 0 14 2 0 295 23 15 11 26,867 26,8782012 21,490 0 12 2 0 307 19 14 5,625 21,844 27,4692013 26,533 0 15 2 0 245 20 14 129 26,830 26,9592014 20,850 0 16 1 0 31 22 16 6,001 20,935 26,936Min 20,850 0 0 1 0 2 19 2 6 20,935 26,382Max 26,626 0 16 111 0 307 95 49 6,001 26,867 27,514
Average 24,412 0 6 20 0 117 50 20 2,289 24,626 26,915

Butte County Appendix C. Subinventory Unit Water Inventory and Analysis Land Use and Water Budgets
C-89 June 2016
Other Land Use
Year Wetlands DevelopedNon-
Irrigated Total 2000 1,196 1,755 1,108 4,059 2001 1,206 1,805 1,255 4,266 2002 1,161 1,804 1,266 4,231 2003 1,039 1,753 1,186 3,979 2004 835 1,992 1,245 4,071 2005 801 1,817 1,312 3,930 2006 735 1,659 1,225 3,618 2007 753 1,673 1,258 3,684 2008 639 1,397 1,098 3,134 2009 702 1,497 1,212 3,411 2010 678 1,415 1,175 3,268 2011 794 1,643 1,334 3,770 2012 668 1,383 1,129 3,179 2013 775 1,617 1,297 3,689 2014 779 1,634 1,300 3,713 Min 639 1,383 1,098 3,134 Max 1,206 1,992 1,334 4,266
Average 851 1,656 1,227 3,733 Water Budgets
Western Canal (East Butte Portion) Subinventory Unit Average Annual Inflows and Outflows (Thousands of Acre-Feet)
Precipitation60
Surface Water
145
Groundwater4
Evapotranspiration102
Deep Percolation
23
Runoff and Return Flow
84
Inflows Outflows

Butte County Appendix C. Subinventory Unit Water Inventory and Analysis Land Use and Water Budgets
C-90 June 2016
Western Canal (East Butte Portion) Subinventory Unit Agricultural Area Average Annual Inflows and Outflows (Thousands of Acre-Feet)
Precipitation54
Surface Water
145
Groundwater4
Evapotranspiration
98
Deep Percolation
22
Runoff and Return Flow
83Inflows Outflows
Western Canal (East Butte Portion) Subinventory Unit Developed Area Average Annual Inflows and Outflows (Thousands of Acre-Fee
Precipitation3.3
Groundwater0.04
Evapotranspiration
2.3
Deep Percolation
0.2
Runoff and Return Flow
0.8
Inflows Outflows

Butte County Appendix C. Subinventory Unit Water Inventory and Analysis Land Use and Water Budgets
C-91 June 2016
Western Canal (East Butte Portion) Subinventory Unit Native Area Average Annual Inflows and Outflows (Thousands of Acre-Feet)
Precipitation2.4
Evapotranspiration
1.6
Deep Percolation
0.3
Runoff and Return Flow
0.5
Inflows Outflows
Western Canal (East Butte Portion) Subinventory Unit 2000-2014 Water Year Inflows and Outflows (Thousands of Acre-Feet)
0 50 100 150 200 250
2000
2001
2002
2003
2004
2005
2006
2007
2008
2009
2010
2011
2012
2013
2014
Outflows (taf/year)
Evapotranspiration Deep Percolation Runoff and Return Flow
050100150200250
2000
2001
2002
2003
2004
2005
2006
2007
2008
2009
2010
2011
2012
2013
2014
Inflows (taf/year)
Surface Water Groundwater Precipitation

Butte County Appendix C. Subinventory Unit Water Inventory and Analysis Land Use and Water Budgets
C-92 June 2016
Subinventory Unit Water Budget
Water Year
Inflows (taf) Outflows (taf) Change
in Storage
(taf) Precipi-tation
Surface Water
Ground-water
Evapotrans-piration
Deep Percolation
Runoff and
Return Flow
2000 (AN) 64 154 4 109 24 88 02001 (D) 51 142 4 98 22 76 02002 (D) 62 142 4 107 22 77 -2
2003 (AN) 78 125 3 95 22 93 42004 (BN) 57 156 4 100 23 88 -62005 (AN) 69 134 4 100 25 86 52006 (W) 81 139 4 100 27 99 22007 (D) 35 154 5 117 23 53 -12008 (C) 39 154 5 106 22 67 -32009 (D) 50 152 4 104 22 81 0
2010 (BN) 65 146 3 90 22 106 42011 (W) 88 140 3 98 26 107 -12012 (BN) 58 143 4 97 20 87 -12013 (D) 62 147 5 111 22 82 02014 (C) 44 143 4 96 20 72 -3
Minimum 35 125 3 90 20 53 -6Maximum 88 156 5 117 27 107 5Average 60 145 4 102 23 84 0
Averages by Hydrologic Year Type Wet (W) 85 140 4 99 26 103 0
Above Normal (AN) 70 137 4 102 24 89 3Below Normal (BN) 60 148 4 96 22 94 -1
Dry (D) 52 148 4 107 22 74 -1Critical (C) 41 149 4 101 21 69 -3

Butte County Appendix C. Subinventory Unit Water Inventory and Analysis Land Use and Water Budgets
C-93 June 2016
C.4. North Yuba Inventory Unit C.4.1. North Yuba Subinventory Unit Land Use General Land Use
Irrigated Agricultural Land Use
16 15 16 16
27 25 24 23
1.0 1.9 2.0 1.6
7 8 10 11
0
10
20
30
40
50
60
1995-1999 2000-2004 2005-2009 2010-2014
Acre
s (Th
ousa
nds)
Irrigated Agriculture Non-Irrigated Wetlands Developed
0
2
4
6
8
10
12
14
16
18
2000 2001 2002 2003 2004 2005 2006 2007 2008 2009 2010 2011 2012 2013 2014
Acre
s (Th
ousa
nds)
Rice Orchards Other Crops Idle Cropland

Butte County Appendix C. Subinventory Unit Water Inventory and Analysis Land Use and Water Budgets
C-94 June 2016
Irrigated Agricultural Land Use
Year Rice Almonds Walnuts Prunes
Other Trees and
Vines Grain
Pasture and
Alfalfa
Field and
Annual Idle
CroplandTotal
CroppedTotal
(w/Idle) 2000 3,112 64 2,438 1,851 3,004 961 3,510 171 219 15,111 15,3312001 2,595 56 2,388 1,785 2,707 1,075 3,619 325 939 14,551 15,4902002 2,534 54 2,415 1,553 3,553 990 3,725 301 1,351 15,125 16,4752003 2,629 62 2,560 1,495 2,907 1,074 3,573 303 946 14,603 15,5492004 2,596 74 2,876 1,540 2,868 517 3,789 117 5 14,376 14,3812005 2,430 77 2,698 1,119 3,258 399 3,354 422 1,862 13,758 15,6202006 2,813 74 2,930 1,590 2,930 720 3,393 47 352 14,496 14,8482007 2,750 77 2,800 1,643 2,890 861 3,252 109 420 14,381 14,8012008 3,477 72 2,435 1,448 3,419 1,089 2,929 723 1,412 15,592 17,0032009 3,256 82 2,687 1,648 3,049 910 2,922 138 848 14,691 15,5402010 3,525 85 2,519 1,619 3,319 863 2,755 756 818 15,440 16,2582011 2,870 90 2,717 1,594 3,141 1,086 2,756 682 116 14,936 15,0512012 3,687 87 2,610 1,478 2,955 1,614 2,638 609 1,264 15,677 16,9412013 2,976 88 2,952 1,407 2,925 927 2,454 680 885 14,407 15,2932014 3,022 93 3,006 1,151 2,819 117 2,595 549 1,685 13,352 15,036Min 2,430 54 2,388 1,119 2,707 117 2,454 47 5 13,352 14,381Max 3,687 93 3,006 1,851 3,553 1,614 3,789 756 1,862 15,677 17,003
Average 2,951 76 2,669 1,528 3,050 880 3,151 396 875 14,700 15,574

Butte County Appendix C. Subinventory Unit Water Inventory and Analysis Land Use and Water Budgets
C-95 June 2016
Other Land Use
Year Wetlands DevelopedNon-
Irrigated Total 2000 1,542 7,680 26,367 35,589 2001 1,700 7,775 25,956 35,431 2002 1,842 7,887 24,715 34,445 2003 2,076 8,562 24,733 35,371 2004 2,359 9,120 25,060 36,539 2005 2,168 8,957 24,176 35,300 2006 2,144 9,557 24,371 36,072 2007 2,059 9,838 24,222 36,119 2008 1,758 9,518 22,641 33,917 2009 1,837 10,150 23,393 35,380 2010 1,663 10,234 22,764 34,662 2011 1,677 10,892 23,299 35,869 2012 1,551 10,333 22,095 33,979 2013 1,670 10,958 23,000 35,627 2014 1,685 11,089 23,110 35,884 Min 1,542 7,680 22,095 33,917 Max 2,359 11,089 26,367 36,539
Average 1,849 9,503 23,993 35,346 Water Budgets
North Yuba Inventory Unit Average Annual Inflows and Outflows (Thousands of Acre-Feet)
Precip-itation106
Applied Surface Water
12
Ground-water
Pumping52
Evapo-trans-piration
88Deep Perco-lation
57
Runoff and Return Flow
24
Inflows Outflows

Butte County Appendix C. Subinventory Unit Water Inventory and Analysis Land Use and Water Budgets
C-96 June 2016
North Yuba Inventory Unit Agricultural Area Average Annual Inflows and Outflows (Thousands of Acre-Feet)
Precipitation35
Applied Surface Water
8
Ground-water
Pumping51
Evapotrans-piration
51Deep Perco-
lation28
Runoff and Return Flow
14
Inflows Outflows
North Yuba Inventory Unit Developed Area Average Annual Inflows and Outflows (Thousands of Acre-Feet)
Precipitation20
Applied Surface Water
4
Ground-water
Pumping1
Evapotrans-piration
11
Deep Perco-lation
7
Runoff and Return Flow
7
Inflows Outflows

Butte County Appendix C. Subinventory Unit Water Inventory and Analysis Land Use and Water Budgets
C-97 June 2016
North Yuba Inventory Unit Native Area Average Annual Inflows and Outflows (Thousands of Acre-Feet)
Precipitation51
Evapotrans-piration
25Deep Perco-
lation22
Runoff and Return Flow
3
Inflows Outflows
North Yuba Inventory Unit 2000-2014 Water Year Inflows and Outflows (Thousands of Acre-Feet)
0 50 100 150 200 250
20…
20…
20…
20…
20…
20…
20…
20…
20…
20…
20…
20…
20…
20…
20…
Outflows (taf/year)
Evapotranspiration Deep Percolation Runoff and Return Flow
050100150200250
2000 (AN)
2001 (D)
2002 (D)
2003 (AN)
2004 (BN)
2005 (AN)
2006 (W)
2007 (D)
2008 (C)
2009 (D)
2010 (BN)
2011 (W)
2012 (BN)
2013 (D)
2014 (C)
Inflows (taf/year)
Surface Water Groundwater Precipitation

Butte County Appendix C. Subinventory Unit Water Inventory and Analysis Land Use and Water Budgets
C-98 June 2016
Subinventory Unit Water Budget
Water Year
Inflows (taf) Outflows (taf) Change
in Storage
(taf) Precipi-tation
Surface Water
Ground-water
Evapotrans-piration
Deep Percolation
Runoff and
Return Flow
2000 (AN) 119 11 53 84 68 31 12001 (D) 89 12 51 86 47 18 02002 (D) 96 12 55 87 53 23 1
2003 (AN) 125 11 49 89 68 29 12004 (BN) 109 13 55 81 67 28 -12005 (AN) 120 11 44 91 61 24 12006 (W) 157 12 47 85 90 41 -12007 (D) 77 12 57 94 34 17 32008 (C) 64 13 62 84 41 16 -32009 (D) 107 12 51 89 55 25 1
2010 (BN) 122 11 46 89 65 26 02011 (W) 148 11 41 92 78 29 02012 (BN) 86 13 54 92 43 19 02013 (D) 91 12 53 87 46 21 12014 (C) 73 12 54 86 36 16 -1
Minimum 64 11 41 81 34 16 -3Maximum 157 13 62 94 90 41 3Average 106 12 52 88 57 24 0
Averages by Hydrologic Year Type Wet (W) 153 11 44 88 84 35 0
Above Normal (AN) 121 11 49 88 66 28 1Below Normal (BN) 106 12 51 87 58 24 0
Dry (D) 92 12 54 89 47 21 1Critical (C) 68 12 58 85 38 16 -2

Butte County Appendix C. Subinventory Unit Water Inventory and Analysis Land Use and Water Budgets
C-99 June 2016
C.5. Foothill Inventory Unit C.5.1. Cohasset Subinventory Unit Land Use General Land Use
Irrigated Agricultural Land Use
0.7 0.4 0.4 0.5
23 23 23 22
4.3 4.6 4.9 5.3
0
5
10
15
20
25
30
1995-1999 2000-2004 2005-2009 2010-2014
Acre
s (Th
ousa
nds)
Irrigated Agriculture Non-Irrigated Wetlands Developed
0.0
0.2
0.4
0.6
0.8
1.0
1.2
2000 2001 2002 2003 2004 2005 2006 2007 2008 2009 2010 2011 2012 2013 2014
Acre
s (Th
ousa
nds)
Rice Orchards Other Crops Idle Cropland

Butte County Appendix C. Subinventory Unit Water Inventory and Analysis Land Use and Water Budgets
C-100 June 2016
Irrigated Agricultural Land Use
Year Rice Almonds Walnuts Prunes
Other Trees and
Vines Grain
Pasture and
Alfalfa
Field and
Annual Idle
CroplandTotal
CroppedTotal
(w/Idle) 2000 0 0 0 0 13 0 0 0 0 13 132001 0 0 0 0 29 0 0 0 390 29 4192002 0 0 0 0 42 0 0 0 518 42 5602003 0 0 0 0 65 0 0 0 215 65 2802004 0 0 0 0 69 0 0 0 0 69 692005 0 0 0 0 88 0 0 0 506 88 5942006 0 0 0 0 69 0 0 0 7 69 762007 0 0 0 0 69 0 0 0 0 69 692008 0 0 0 0 102 0 0 0 1,263 102 1,3652009 0 0 0 0 53 0 0 0 111 53 1652010 0 0 0 0 73 0 0 0 855 73 9282011 0 0 0 0 69 0 0 0 5 69 732012 0 0 0 0 68 0 0 0 1,425 68 1,4932013 0 0 0 0 72 0 0 0 463 72 5362014 0 0 0 0 68 0 0 0 288 68 355Min 0 0 0 0 13 0 0 0 0 13 13Max 0 0 0 0 102 0 0 0 1,425 102 1,493
Average 0 0 0 0 63 0 0 0 403 63 466

Butte County Appendix C. Subinventory Unit Water Inventory and Analysis Land Use and Water Budgets
C-101 June 2016
Other Land Use
Year Wetlands DevelopedNon-
Irrigated Total 2000 52 357 37,901 38,309 2001 59 435 37,411 37,904 2002 66 517 37,179 37,763 2003 76 609 37,357 38,043 2004 86 702 37,466 38,254 2005 82 690 36,957 37,729 2006 82 701 37,464 38,246 2007 80 700 37,474 38,254 2008 75 674 36,208 36,958 2009 77 695 37,387 38,158 2010 73 680 36,642 37,395 2011 73 693 37,484 38,250 2012 71 674 36,085 36,829 2013 73 697 37,017 37,787 2014 73 706 37,188 37,967 Min 52 357 36,085 36,829 Max 86 706 37,901 38,309
Average 73 635 37,148 37,856 Water Budgets
Cohasset Subinventory Unit Average Annual Inflows and Outflows (Thousands of Acre-Feet)
Precipitation121
Groundwater1
Evapotranspiration
44
Deep Percolation
50
Runoff and Return Flow
27
Inflows Outflows
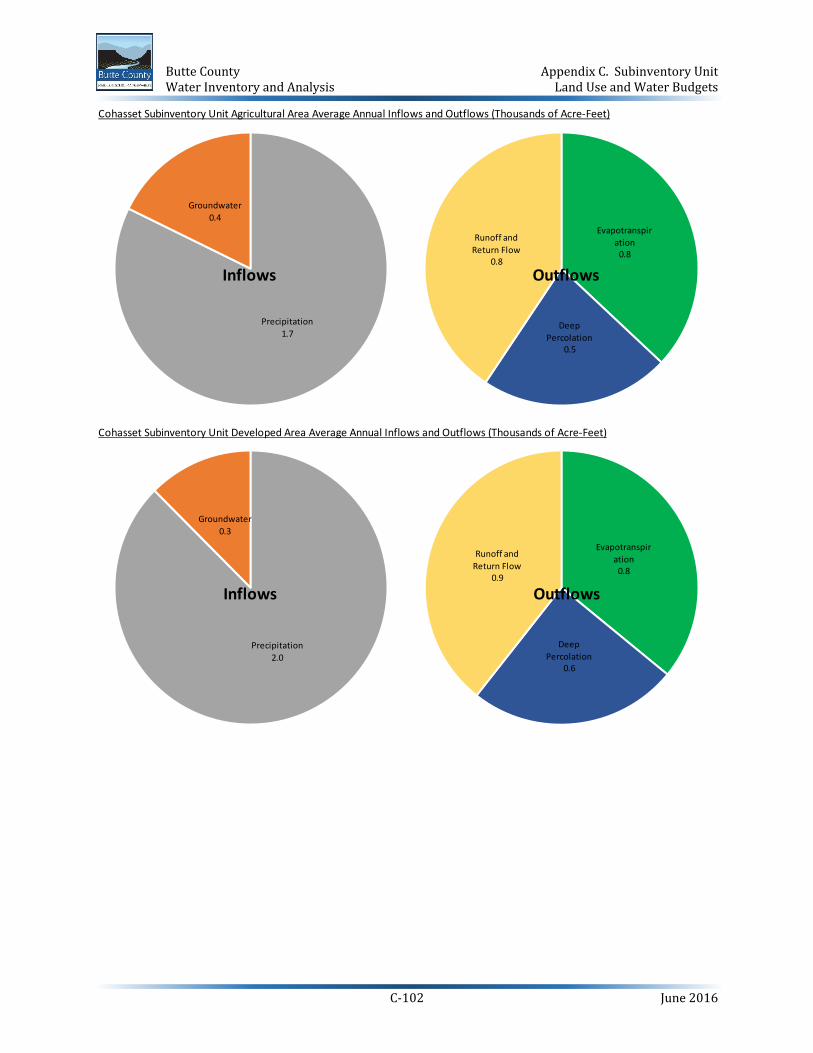
Butte County Appendix C. Subinventory Unit Water Inventory and Analysis Land Use and Water Budgets
C-102 June 2016
Cohasset Subinventory Unit Agricultural Area Average Annual Inflows and Outflows (Thousands of Acre-Feet)
Precipitation1.7
Groundwater0.4
Evapotranspiration
0.8
Deep Percolation
0.5
Runoff and Return Flow
0.8Inflows Outflows
Cohasset Subinventory Unit Developed Area Average Annual Inflows and Outflows (Thousands of Acre-Feet)
Precipitation2.0
Groundwater0.3
Evapotranspiration
0.8
Deep Percolation
0.6
Runoff and Return Flow
0.9
Inflows Outflows

Butte County Appendix C. Subinventory Unit Water Inventory and Analysis Land Use and Water Budgets
C-103 June 2016
Cohasset Subinventory Unit Native Area Average Annual Inflows and Outflows (Thousands of Acre-Feet)
Precipitation117
Evapotranspiration
43
Deep Percolation
49
Runoff and Return Flow
25
Inflows Outflows
Cohasset Subinventory Unit 2000-2014 Water Year Inflows and Outflows (Thousands of Acre-Feet)
0 50 100 150 200 250
2000
2001
2002
2003
2004
2005
2006
2007
2008
2009
2010
2011
2012
2013
2014
Outflows (taf/year)
Evapotranspiration Deep Percolation Runoff and Return Flow
050100150200250
2000
2001
2002
2003
2004
2005
2006
2007
2008
2009
2010
2011
2012
2013
2014
Inflows (taf/year)
Surface Water Groundwater Precipitation

Butte County Appendix C. Subinventory Unit Water Inventory and Analysis Land Use and Water Budgets
C-104 June 2016
Subinventory Unit Water Budget
Water Year
Inflows (taf) Outflows (taf) Change
in Storage
(taf) Precipi-tation
Surface Water
Ground-water
Evapotrans-piration
Deep Percolation
Runoff and
Return Flow
2000 (AN) 136 0 0 43 60 33 02001 (D) 91 0 1 43 37 11 12002 (D) 131 0 1 42 60 30 -1
2003 (AN) 159 0 1 44 66 49 12004 (BN) 119 0 1 36 58 28 -12005 (AN) 135 0 1 50 61 23 22006 (W) 192 0 1 42 93 59 -22007 (D) 92 0 1 50 25 16 22008 (C) 82 0 1 40 32 14 -22009 (D) 113 0 1 48 38 24 2
2010 (BN) 133 0 1 46 61 28 -12011 (W) 154 0 1 51 75 27 02012 (BN) 95 0 1 49 28 20 02013 (D) 102 0 1 41 35 22 42014 (C) 81 0 1 42 24 18 -2
Minimum 81 0 0 36 24 11 -2Maximum 192 0 1 51 93 59 4Average 121 0 1 44 50 27 0
Averages by Hydrologic Year Type Wet (W) 173 0 1 46 84 43 -1
Above Normal (AN) 143 0 1 46 62 35 1Below Normal (BN) 116 0 1 43 49 25 -1
Dry (D) 106 0 1 45 39 21 2Critical (C) 81 0 1 41 28 16 -2

Butte County Appendix C. Subinventory Unit Water Inventory and Analysis Land Use and Water Budgets
C-105 June 2016
C.5.2. Ridge Subinventory Unit Land Use General Land Use
Irrigated Agricultural Land Use
0.7 0.4 0.4 0.5
23 23 23 22
4 5 5 5
0
5
10
15
20
25
30
1995-1999 2000-2004 2005-2009 2010-2014
Acre
s (Th
ousa
nds)
Irrigated Agriculture Non-Irrigated Wetlands Developed
0.0
0.2
0.4
0.6
0.8
1.0
1.2
2000 2001 2002 2003 2004 2005 2006 2007 2008 2009 2010 2011 2012 2013 2014
Acre
s (Th
ousa
nds)
Rice Orchards Other Crops Idle Cropland

Butte County Appendix C. Subinventory Unit Water Inventory and Analysis Land Use and Water Budgets
C-106 June 2016
Irrigated Agricultural Land Use
Year Rice Almonds Walnuts Prunes
Other Trees and
Vines Grain
Pasture and
Alfalfa
Field and
Annual Idle
CroplandTotal
CroppedTotal
(w/Idle) 2000 0 0 0 0 142 0 66 0 2 208 2102001 0 0 0 0 123 0 59 0 358 182 5402002 0 0 0 0 160 0 51 0 472 211 6832003 0 0 0 0 109 0 36 0 172 145 3162004 0 0 0 0 96 0 22 0 0 119 1192005 0 0 0 0 102 0 20 0 439 122 5612006 0 0 0 0 102 0 19 0 22 121 1432007 0 0 0 0 100 0 18 0 10 118 1282008 0 0 0 0 102 0 17 0 943 119 1,0622009 0 0 0 0 125 0 16 0 83 141 2242010 0 0 0 0 140 0 15 0 616 155 7712011 0 0 0 0 112 0 14 0 0 126 1262012 0 0 0 0 109 0 14 0 1,001 123 1,1242013 0 0 0 0 105 0 12 0 268 117 3852014 0 0 0 0 107 0 13 0 149 120 269Min 0 0 0 0 96 0 12 0 0 117 119Max 0 0 0 0 160 0 66 0 1,001 211 1,124
Average 0 0 0 0 116 0 26 0 302 142 444
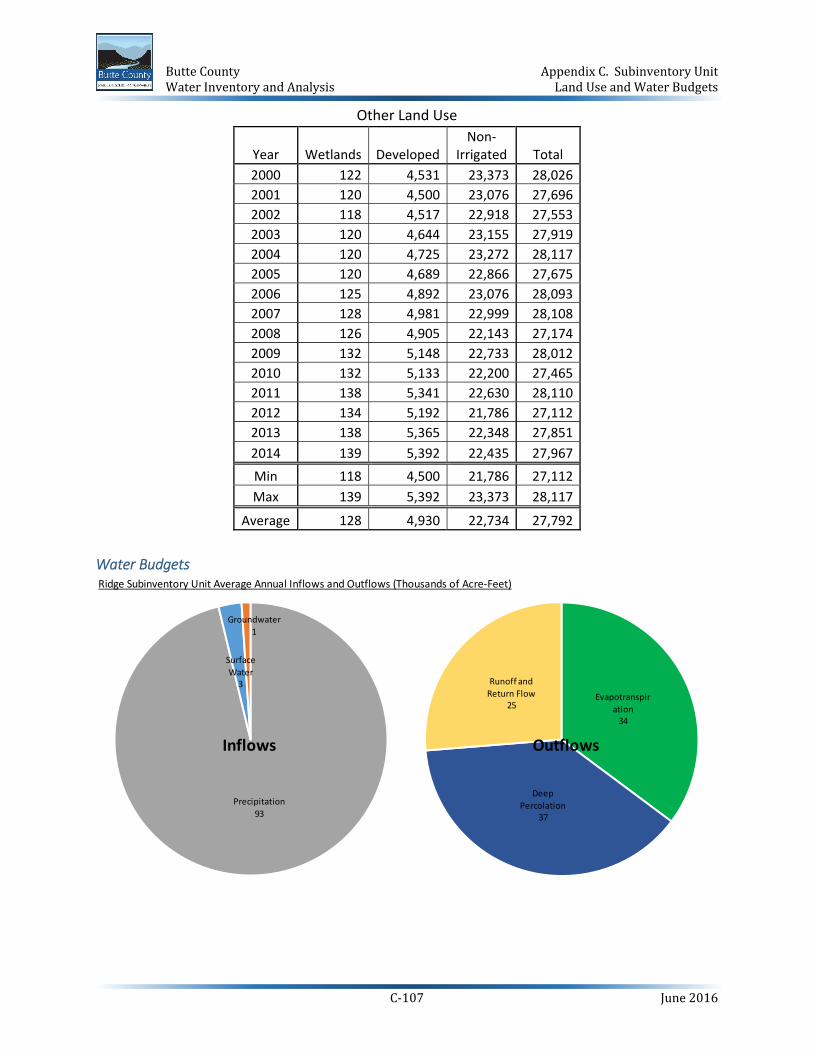
Butte County Appendix C. Subinventory Unit Water Inventory and Analysis Land Use and Water Budgets
C-107 June 2016
Other Land Use
Year Wetlands DevelopedNon-
Irrigated Total 2000 122 4,531 23,373 28,026 2001 120 4,500 23,076 27,696 2002 118 4,517 22,918 27,553 2003 120 4,644 23,155 27,919 2004 120 4,725 23,272 28,117 2005 120 4,689 22,866 27,675 2006 125 4,892 23,076 28,093 2007 128 4,981 22,999 28,108 2008 126 4,905 22,143 27,174 2009 132 5,148 22,733 28,012 2010 132 5,133 22,200 27,465 2011 138 5,341 22,630 28,110 2012 134 5,192 21,786 27,112 2013 138 5,365 22,348 27,851 2014 139 5,392 22,435 27,967 Min 118 4,500 21,786 27,112 Max 139 5,392 23,373 28,117
Average 128 4,930 22,734 27,792 Water Budgets
Ridge Subinventory Unit Average Annual Inflows and Outflows (Thousands of Acre-Feet)
Precipitation93
Surface Water
3
Groundwater1
Evapotranspiration
34
Deep Percolation
37
Runoff and Return Flow
25
Inflows Outflows

Butte County Appendix C. Subinventory Unit Water Inventory and Analysis Land Use and Water Budgets
C-108 June 2016
Ridge Subinventory Unit Agricultural Area Average Annual Inflows and Outflows (Thousands of Acre-Feet)
Precipitation1.8
Groundwater0.7 Evapotranspir
ation1.1
Deep Percolation
0.7
Runoff and Return Flow
0.8
Inflows Outflows
Ridge Subinventory Unit Developed Area Average Annual Inflows and Outflows (Thousands of Acre-Feet)
Precipitation17.1
Groundwater0.3
Evapotranspiration
6.6
Deep Percolation
4.1
Runoff and Return Flow
9.3Inflows Outflows
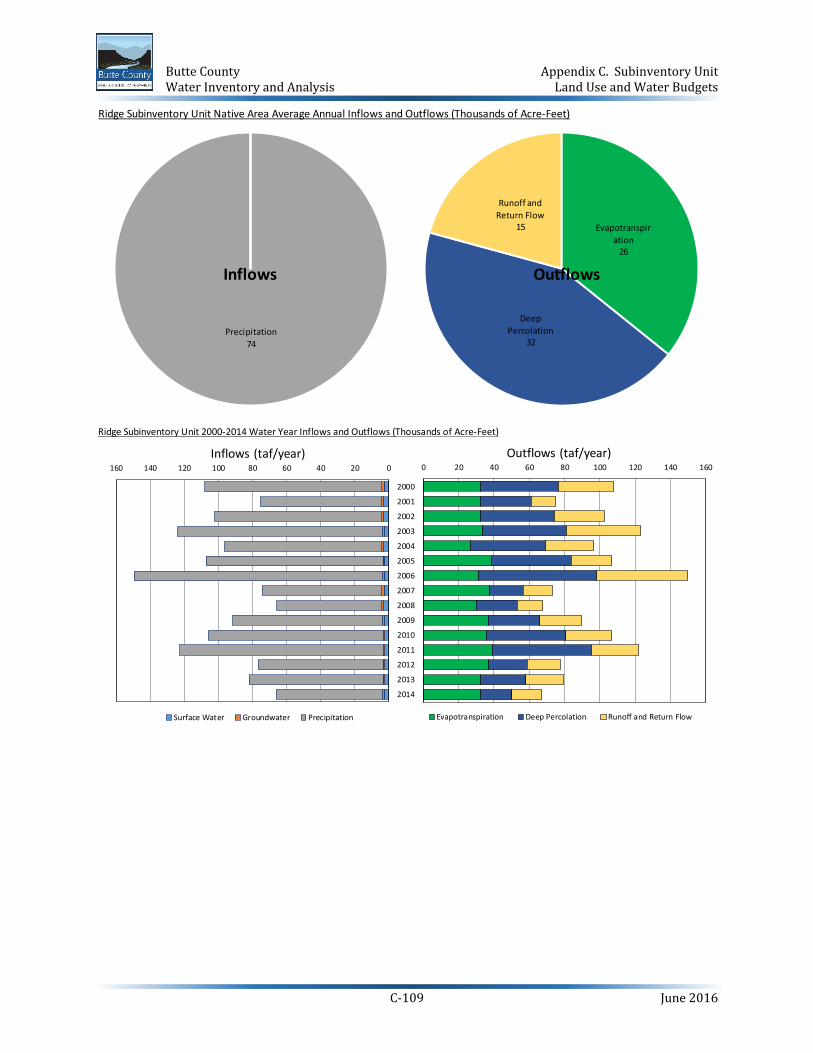
Butte County Appendix C. Subinventory Unit Water Inventory and Analysis Land Use and Water Budgets
C-109 June 2016
Ridge Subinventory Unit Native Area Average Annual Inflows and Outflows (Thousands of Acre-Feet)
Precipitation74
Evapotranspiration
26
Deep Percolation
32
Runoff and Return Flow
15
Inflows Outflows
Ridge Subinventory Unit 2000-2014 Water Year Inflows and Outflows (Thousands of Acre-Feet)
0 20 40 60 80 100 120 140 160
2000
2001
2002
2003
2004
2005
2006
2007
2008
2009
2010
2011
2012
2013
2014
Outflows (taf/year)
Evapotranspiration Deep Percolation Runoff and Return Flow
020406080100120140160
2000
2001
2002
2003
2004
2005
2006
2007
2008
2009
2010
2011
2012
2013
2014
Inflows (taf/year)
Surface Water Groundwater Precipitation

Butte County Appendix C. Subinventory Unit Water Inventory and Analysis Land Use and Water Budgets
C-110 June 2016
Subinventory Unit Water Budget
Water Year
Inflows (taf) Outflows (taf) Change
in Storage
(taf) Precipi-tation
Surface Water
Ground-water
Evapotrans-piration
Deep Percolation
Runoff and
Return Flow
2000 (AN) 104 3 1 33 44 31 02001 (D) 71 3 1 32 29 14 12002 (D) 98 3 1 33 42 28 0
2003 (AN) 120 3 1 34 47 42 02004 (BN) 92 3 1 27 43 27 02005 (AN) 104 3 1 39 45 23 12006 (W) 146 3 1 32 67 52 -12007 (D) 70 3 1 38 19 16 22008 (C) 62 3 1 30 23 14 -12009 (D) 88 3 1 37 29 23 1
2010 (BN) 103 2 1 36 45 26 -12011 (W) 120 2 1 39 56 27 02012 (BN) 73 2 1 37 22 19 02013 (D) 79 2 1 33 25 21 32014 (C) 62 2 1 32 18 17 -2
Minimum 62 2 1 27 18 14 -2Maximum 146 3 1 39 67 52 3Average 93 3 1 34 37 25 0
Averages by Hydrologic Year Type Wet (W) 133 2 1 35 61 39 0
Above Normal (AN) 109 3 1 35 46 32 1Below Normal (BN) 89 2 1 33 37 24 0
Dry (D) 81 3 1 34 29 21 1Critical (C) 62 3 1 31 21 16 -1