C S A S S C C Sdfo-mpo.gc.ca/CSAS/Csas/DocREC/2003/RES2003_009.pdf · American shad (Alosa...
77
C S A S Canadian Science Advisory Secretariat S C C S Secrétariat canadien de consultation scientifique * This series documents the scientific basis for the evaluation of fisheries resources in Canada. As such, it addresses the issues of the day in the time frames required and the documents it contains are not intended as definitive statements on the subjects addressed but rather as progress reports on ongoing investigations. * La présente série documente les bases scientifiques des évaluations des ressources halieutiques du Canada. Elle traite des problèmes courants selon les échéanciers dictés. Les documents qu’elle contient ne doivent pas être considérés comme des énoncés définitifs sur les sujets traités, mais plutôt comme des rapports d’étape sur les études en cours. Research documents are produced in the official language in which they are provided to the Secretariat. This document is available on the Internet at: Les documents de recherche sont publiés dans la langue officielle utilisée dans le manuscrit envoyé au Secrétariat. Ce document est disponible sur l’Internet à: http://www.dfo-mpo.gc.ca/csas/ ISSN 1480-4883 © Her Majesty the Queen in Right of Canada, 2003 © Sa majesté la Reine, Chef du Canada, 2003 Research Document 2003/009 Document de recherche 2003/009 Not to be cited without Permission of the authors * Ne pas citer sans autorisation des auteurs * American shad (Alosa sapidissima) in Atlantic Canada L’Alose savoureuse (Alosa sapidissima) dans l’atlantique Canada G. Chaput and R.G. Bradford 1 Department of Fisheries and Oceans Oceans and Science Branch Gulf Region P.O. Box 5030 Moncton, N.B. E1C 9B6 1 Department of Fisheries and Oceans Science Branch Maritimes Region P.O. Box 1006 Dartmouth, NS B2Y 4A2
Transcript of C S A S S C C Sdfo-mpo.gc.ca/CSAS/Csas/DocREC/2003/RES2003_009.pdf · American shad (Alosa...

C S A SCanadian Science Advisory Secretariat
S C C SSecrétariat canadien de consultation scientifique
* This series documents the scientific basis for theevaluation of fisheries resources in Canada. Assuch, it addresses the issues of the day in thetime frames required and the documents itcontains are not intended as definitive statementson the subjects addressed but rather as progressreports on ongoing investigations.
* La présente série documente les basesscientifiques des évaluations des ressourceshalieutiques du Canada. Elle traite desproblèmes courants selon les échéanciersdictés. Les documents qu’elle contient nedoivent pas être considérés comme des énoncésdéfinitifs sur les sujets traités, mais plutôt commedes rapports d’étape sur les études en cours.
Research documents are produced in the officiallanguage in which they are provided to theSecretariat.
This document is available on the Internet at:
Les documents de recherche sont publiés dansla langue officielle utilisée dans le manuscritenvoyé au Secrétariat.
Ce document est disponible sur l’Internet à:http://www.dfo-mpo.gc.ca/csas/
ISSN 1480-4883© Her Majesty the Queen in Right of Canada, 2003
© Sa majesté la Reine, Chef du Canada, 2003
Research Document 2003/009 Document de recherche 2003/009
Not to be cited withoutPermission of the authors *
Ne pas citer sansautorisation des auteurs *
American shad (Alosa sapidissima) in AtlanticCanada
L’Alose savoureuse (Alosa sapidissima) dansl’atlantique Canada
G. Chaput and R.G. Bradford1
Department of Fisheries and OceansOceans and Science Branch
Gulf RegionP.O. Box 5030Moncton, N.B.
E1C 9B6
1 Department of Fisheries and OceansScience Branch
Maritimes RegionP.O. Box 1006Dartmouth, NS
B2Y 4A2


i
TABLE OF CONTENTS / TABLE DES MATIÈRES
ABSTRACT ......................................................................................................................... iii
RÉSUMÉ ............................................................................................................................. iv
I - INTRODUCTION............................................................................................................. 1
II - BACKGROUND BIOLOGY............................................................................................. 1
III - MATERIALS AND METHODS....................................................................................... 2Fisheries related data.......................................................................................................................... 2Research and monitoring data............................................................................................................ 2
IV - MANAGEMENT OF THE SHAD FISHERIES ............................................................... 3Commercial Fisheries ......................................................................................................................... 3Recreational Fisheries ........................................................................................................................ 4First Nations Fisheries ........................................................................................................................ 4Fisheries Landings .............................................................................................................................. 4Fishing Effort ....................................................................................................................................... 6
V - AREA OF OCCUPANCY ............................................................................................... 6Marine Distribution .............................................................................................................................. 6Coastal Distributions ........................................................................................................................... 7Freshwater Distribution ....................................................................................................................... 8
VI - EVIDENCE OF EXTANT SPAWNING RUNS............................................................. 10Newfoundland and Labrador............................................................................................................. 10Southern Gulf of St. Lawrence.......................................................................................................... 10Bay of Fundy ..................................................................................................................................... 11Atlantic Coast Nova Scotia................................................................................................................ 12
VII - ADDRESSING THE SPECIFIC TERMS OF REFERENCE....................................... 12VII-1 Review the population structure in the context of “evolutionarily significant units” .................. 12
VII-2 By stock and for ESUs identified above summarize overall trends in population size............. 13
VII-3 By stock and for ESUs identified above summarize current area of occupancy ..................... 16
VIII - REFERENCES ......................................................................................................... 17
Tables................................................................................................................................ 21
Figures............................................................................................................................... 43
Appendices........................................................................................................................ 63

ii

iii
ABSTRACT
The document summarizes information held by Fisheries and Oceans Canada (DFO) which couldbe used by the Committee on Status of Endangered Wildlife in Canada (COSEWIC) to assess thestatus of American shad (Alosa sapidissima) in Canadian waters. Shad are exploited incommercial, recreational and First Nations fisheries. The commercial fisheries are local in nature,generally small in individual landings, and of small capitalization which makes landings difficult totrack. The marine distribution of shad in eastern Canada extends from the Bay of Fundy toLabrador. Shad were captured exlcusively in the nearshore shallow waters of the southern Gulf ofSt. Lawrence and the locations of capture are consistent with a migration of shad into the Gulf of St.Lawrence in the spring and migration out of the Gulf in the fall. Shad are frequently represented inthe catches from research surveys along the Atlantic coast of Nova Scotia and in the Bay of Fundy.Summer catches are consistent with the well-described occurrence of migrant feeding shad in theBay of Fundy and Gulf of Maine originating from virtually all rivers along the eastern seaboard. Latefall surveys suggest a ‘winter’ distribution at depths of between 100 and 200 m along the edges ofGeorges Bank and the Scotian Shelf and within the basins along the top of the shelf. Shad havebeen reported from essentially all coastal areas of the Maritimes. Shad have been observed inrivers from the Bay of Fundy to Labrador but occur infrequently in Labrador and insularNewfoundland. In the Gulf of St. Lawrence, shad are most abundant in the Miramichi River in Mayto mid-July, consistent with a spawning run. Spawning shad occur in the lesser tributaries flowinginto the lower Saint John River below Mactaquac Dam. Within Minas Basin shad runs occur on theShubenacadie/Stewiacke River and the Kennetcook River. There is a large spawning run of shadon the Annapolis River. The fisheries management regime within the Maritime provinces isorganized regionally and is therefore consistent with the principle of managing discrete units whichare at least if not at a finer scale than the evolutionary significant unit designations which maydevelop for shad. Run sizes to the major rivers of the Maritimes are expected to be in the order of100s of thousands of fish. In the Bay of Fundy, there is an appearance of a range contraction owingto the loss of the spawning run to the St. Croix River, upper Saint John River (upstream ofMactaquac) and the Petitcodiac River. Information is available to confirm that there are nine extantspawning runs and the status of 19 other rivers is unknown.

iv
RÉSUMÉ
Le document résume les données du ministère des Pêches et des Océans du Canada (MPO) quele Comité sur la situation des espèces en péril au Canada (COSEPAC) pourrait utiliser afind’évaluer l’état de l’alose savoureuse (Alosa sapidissima) dans les eaux canadiennes. L’alosesavoureuse est exploitée dans le cadre de pêches commerciales, récréatives et autochtones. Lespêches commerciales sont de nature locale, leurs débarquements individuels sont généralementpetits, et leur capitalisation est faible, ce qui rend difficile le suivi des débarquements. Dans leseaux marines de l’Est du Canada, l’alose savoureuse est présente de la baie de Fundy jusqu’auLabrador. Elle est capturée exclusivement dans les eaux côtières peu profondes du sud du golfedu Saint-Laurent. Les sites de capture concordent avec la migration de cette espèce vers l’intérieurdu golfe au printemps et vers l’extérieur à l’automne. L’alose savoureuse est fréquemment prisedans le cadre de relevés de recherche effectués dans les eaux côtières atlantiques de laNouvelle-Écosse et dans la baie de Fundy. Les prises estivales concordent avec la présence biendocumentée d’aloses savoureuses migratrices qui se nourrissent dans la baie de Fundy et dans legolfe du Maine; ces aloses proviennent de pratiquement toutes les rivières de la côte Est. Lesrelevés effectués à la fin de l’automne portent à croire qu’au cours de l’hiver, l’alose savoureuse setient à une profondeur de 100 à 200 m le long des limites du banc Georges et de la plate-formeScotian et dans les bassins situés sur cette plate-forme. L’alose savoureuse a été observée danspratiquement toutes les zones côtières des Maritimes et dans des rivières de la baie de Fundyjusqu’au Labrador, mais elle est rare à ce dernier endroit et le long des côtes de Terre-Neuve.Dans le golfe du Saint-Laurent, cette espèce est abondante dans la rivière Miramichi de maijusqu’à la mi-juillet, ce qui concorde avec une remonte de reproducteurs. Les reproducteurs decette espèce sont également présents dans les petits affluents du cours inférieur de la rivièreSaint-Jean, en aval du barrage de Mactaquac. Dans le bassin Minas, des remontes dereproducteurs se produisent dans les rivières Shubenacadie, Stewiacke et Kennetcook. Une forteremonte se produit dans la rivière Annapolis. Le régime de gestion des pêches dans les provincesMaritimes est organisé en composantes régionales et respecte ainsi le principe de gestion d’unitésdistinctes qui sont au moins à la même échelle, si ce n’est à une échelle plus détaillée, que lesunités évolutionnaires significatives, qui pourraient être établies pour l’alose savoureuse. Ons’attend à ce que les remontes dans les principales rivières des Maritimes soient de l’ordre decentaines de milliers de poissons. Dans la baie de Fundy, il semble que l’aire de répartition diminueen raison de la disparition des remontes dans la rivière Sainte-Croix, dans le cours supérieur de larivière Saint Jean (en amont de Mactaquac) et dans la rivière Petitcodiac. Des données confirmentqu’il existe neuf remontes de reproducteurs et que l’état de 19 autres est inconnu.

1
I - INTRODUCTION
Leim (1924) compiled the first review of American shad in the Maritime provinces and attemptedto identify the factors which limited shad abundance. A large part of the document focused onfactors which affected the survival and growth of eggs and larvae. Included was a summary ofthe rivers in the Maritimes which were reported to have contained spawning runs of shad.However, he also indicated that the large rivers were invariably the most important.
Following on Leim (1924), we present an updated compilation of American shad (Alosasapidissima) data for the Atlantic provinces (New Brunswick, Nova Scotia, Prince Edward Island,Newfoundland and Labrador) of Canada. This document collates and summarizes theinformation held by Fisheries and Oceans Canada (DFO) which could be used by the Committeeon Status of Endangered Wildlife in Canada (COSEWIC) to assess the status of American shad(Alosa sapidissima) in Canadian waters. The information presented is not intended as a completereview of all the biological knowledge of shad in eastern Canada. The mandate for managementof American shad in the St. Lawrence River was delegated to the province of Quebec in 1922.American shad have been the subject of much research in the last four decades, and informationon American shad from the Annapolis River is more extensive and associated with studies on theimpacts of tidal water generating project. Much of this information resides in the “EstuarineCentre” at Acadia University (Wolfville, NS).
The first section of this document deals with information on American shad for Atlantic Canada asit relates to the fisheries, distribution within fresh, coastal, and marine waters and occurrence ofspawning runs or evidence of spawning.
The second section deals with addressing the specific terms of reference of the NationalAssessment Process (NAP) review. The terms of reference were:Review the population structure in the context of “evolutionarily significant units” (ESU)By stock and for ESUs identified, summarize overall trends in population size and the degree towhich the causes of declines (if any) are understoodBy stock and for ESUs identified, summarize current and changes in area of occupancy, ordegree of fragmentationBy stock and for ESUs identified, tabulate the best estimates of the number of mature individuals
II - BACKGROUND BIOLOGY
Class OsteichthyesOrder ClupeiformesFamily ClupeidaeScientific name: Alosa sapidissima (Wilson, 1811)Common name: English:American shad
Français: alose savoureuse (gatte en Acadie)
The general biology of American shad has been reviewed by Scott and Crossman (1973), Scottand Scott (1988) and Weiss-Glanz et al. (1986) and is summarized below.
• Anadromous fish spawning in freshwater, lower portions of rivers in spring, May to July inMaritimes
• Northern extent of spawning distribution is Gulf of St. Lawrence and St. Lawrence River• Juveniles spend a brief time in freshwater before migrating downstream to brackish waters
(especially so in northern populations)• Age at maturity varying from 3 to 6 years of age, earlier for males than females• Latitudinal gradient in fecundity (negative association) and proportion of runs which are
repeat spawners (positive association) (Leggett and Carscadden 1978)
2
• Shad are iteroparous in northern rivers, with previous spawners representing greater than50% of the spawning runs (depending on exploitation rates in the fisheries)
• Fecundities of maiden shad in the order of 100 to 175 thousand eggs in northern populations(Leggett and Carscadden 1978; Melvin et al. 1985)
• Maximum size of shad in Maritime populations at over 60 cm fork length• Shad leave the Gulf of St. Lawrence and overwinter on the Scotian Shelf and south• Migration ranges for shad at sea extend from Labrador to Florida (Dadswell et al. 1987)• Shad from different river populations are mixed to varying degrees while at sea (Dadswell et
al. 1987)• High spawning site fidelity (Melvin et al. 1986)
III - MATERIALS AND METHODS
Fisheries related data
Commercial landings are compiled by individual landings report for communities and generallysummarized by DFO Fisheries Statistical District (Fig. III-1).
In Maritimes Region (DFO operational region encompassing the watersheds draining into the Bayof Fundy and the Atlantic coast of Nova Scotia to the north east tip of Cape Breton Island),logbook reports are mandatory for both commercial gaspereau fishers (which can retain shadunder condition of licence) and commercial shad fishers (which operate under a specificcommercial shad licence). There is about 50% or more return rate with years of highercompliance attributable to increased visits by enforcement officers to remind fishers thatcompletion of logbooks is mandatory.
There are some voluntary logbook reports from the gaspereau fisheries in Miramichi River and afew other smaller rivers in Gulf Region (DFO operational region encompassing the portion of thesouthern Gulf of St. Lawrence for which the rivers of the Maritime provinces empty into the Gulf).Fishermen were asked to record the number of shad landed daily during the gaspereau fishery.There was generally less than 50% return rate of logbooks from the Miramichi and not allfishermen who returned logbooks indicated the amount of shad bycatch.
The logbook reports from both regions provide an indication of the quantity of shad which couldpotentially have been landed in a given year and a measure of the reliability of the commerciallandings compiled by DFO.
Research and monitoring data
Counting facilities are operated in a large number of rivers in Atlantic Canada and shad observedat these facilities are enumerated and in some cases sampled for biological characteristics. Mostof these facilities have been described in a number of reports (for example: Moores and Ash1984, Claytor 1996, Hayward 2001).
Opportunistic but regular sampling of shad at research facilities has occurred on the MiramichiRiver. Sampling included measurements of fork length, external determination of sex, and scalesamples. Shad catches in DFO research trapnets on the Shubenacadie River, Nova Scotia arerecorded for each day of operation. However, the traps are located in an area of significant shadspawning activity with the result that trap re-entry of released fish is believed to be high. Thenumbers are therefore not considered to be a reliable indicator of run timing and strength in theirraw form, and are not reported here. Ripe and running males and females were sampled fromthose trapnet catches.

3
Other rivers in the Maritimes where sampling for biological characteristics has occurred includethe Saint John River (Bay of Fundy NB) and the Annapolis River (Bay of Fundy NS). DFO doesnot sample these rivers with regularity but data for these rivers are available in publications andspecifically for the Annapolis River can be found at Acadia University Estuarine Research Centre(Wolfville, NS).
IV - MANAGEMENT OF THE SHAD FISHERIES
Fisheries for shad in Maritime provinces are managed under the Fisheries Act under regulationsdescribed in the Fishery (General) Regulations and the Maritime Provinces Fishery Regulations.These regulations define the conditions under which shad can be fished including closed times,closed areas, and gear restrictions. The Fishery (General) Regulations also define the processfor variation orders and conditions of license which can be used to further manage the fisheries.
Shad are exploited in commercial, recreational and First Nations fisheries.
Commercial Fisheries
In the Maritime provinces, shad are fished in directed fisheries prosecuted by fishermen who holdcommercial shad licenses and as bycatch in gaspereau fisheries (Table IV-1). Commercial shadfisheries are local in nature, generally small in individual landings, and of small capitalizationwhich makes landings difficult to track.
There are only 10 commercial shad licenses in the southern Gulf of St. Lawrence, all issued forgillnets (Table IV-1). In the Bay of Fundy, there were 156 commercial licenses issued in 2002,152 for gillnets and four gear not-specified (Table IV-1). In the Atlantic coast of Nova Scotiadistricts, a total of 9 gillnet and 6 dipnet licenses were issued in 2002 (Table IV-1). The number oflicenses has essentially remained unchanged over the last six years (Table IV-1).
The gear, seasons and weekly close time restrictions for the directed commercial fishery bylocation in the Maritime provinces are described in the Maritime Provinces Fishery Regulations(Scehdule VIII) and are summarized in Table IV-2.
In the southern Gulf of St. Lawrence, fisheries for shad can be prosecuted using gillnets, trapnetsand dipnets during a relatively short season in May and June for New Brunswick and PrinceEdward Island but extending into July for Nova Scotia. The commercial fishery in the southernGulf is however limited to ten commercial license holders, all in the Gulf New Brunswick portion.This directed commercial fishery is restricted to fixed gill nets of maximum length 100.6 m (55 fa)in the waters of Northumberland Strait adjacent to Kent County (statistical districts 75, 76, and 77;Fig. III-1) (Table IV-1) and since they are situated in New Brunswick would only be allowed to fishbetween May 15 and June 20 (Table IV-2).
Seasons and gears are more varied in the Bay of Fundy portion of the Maritimes (Table IV-2).Fisheries for shad can be prosecuted using set and drift gillnets, dipnets, square nets, andtrapnets. The earliest season opening of April 1 occurs in the tidal waters of theShubenacadie/Stewiacke system and the remaining locations open May 1. Seasons close eitherin mid- to late-June, end of July, mid-August or end of September with the latest closure inCumberland Basin (inner Bay of Fundy bordering New Brunswick and Nova Scotia) (Table IV-2).All these fisheries have a designated weekly close time equivalent to about a two-day tie-up perweek.
For the Atlantic coast of Nova Scotia, the season extends from May 1 to July 30 with a two-dayper week mandatory tie-up (Table IV-2).

4
Shad may also be caught and retained as bycatch in licensed commercial gaspereau fisheries(aritime Provinces Fishery Regulations). Gaspereau fisheries are prosecuted using gillnets,estuarine trapnets and tiptraps within river (in combination with dipnets). Gaspereau fisherieshave season and weekly close time restrictions which vary by location (Maritime ProvincesFishery Regulations Schedule V).
In Prince Edward Island, the gaspereau season extends from May 1 to June 30. For Gulf NewBrunswick, the inland waters season extends from January 1 to June 30 but the tidal waterseason extends from May 15 to June 30. These seasons can vary within individual tributaries andlocal preference (DFO 2001).
In Nova Scotia (both Gulf and Maritimes Region) the gaspereau seasons open March 15 andgenerally closes the end of June to July 10. In the Bay of Fundy, gaspereau fishery seasonsextend from January 1 to June 30.
In the gaspereau fishery, there is a large amount of gear which could catch shad. For example, inthe New Brunswick portion of the Gulf Region, there were 132 gaspereau fishery licenses withlicensed gear equivalents of 328 trapnets and 600 fa of gillnet in 2000 (DFO 2001). The totalnumber of licenses declined from 179 in 1987 to 132 licenses in 2000 (DFO 2001). There aresimilarly large numbers of gaspereau licenses and licensed gears in the Bay of Fundy andAtlantic coast of Nova Scotia.
Recreational Fisheries
Regulations for the recreational fisheries in tidal and inland waters are described in the MaritimeProvinces Fishery Regulations. A bag limit of five shad per day is in effect for the inland and tidalwaters of the Maritime provinces (Maritime Provinces Fishery Regulations, Section 73.1).Recreational fishing for shad is not widespread in the Maritimes but of generally moderate to highparticipation where these fisheries occur. Effort is generally concentrated within specific areas ofonly a few rivers, most notably the Southwest Miramichi River (Gulf of St. Lawrence), AnnapolisRiver, and Shubenacadie/Stewiacke rivers (Bay of Fundy). In 2002, a total of 52 recreationalgillnet licences were issued, the majority within the tidal water districts of the Saint John River(Table IV-1). The number of recreational gillnet licenses has decreased slightly over the last sixyears. There are no statistics on the number of people angling for shad or the number of shadcaptured in either the angling or recreational gillnet fisheries.
First Nations Fisheries
Licenses issued to several First Nations in the Maritime provinces for Food, Social andCeremonial Purposes include an allowance for the capture and harvest of shad. The allowancesare generally based on community needs or requests for shad. Harvest statistics for shad inthese fisheries are not available.
Fisheries Landings
Landings in commercial fisheries are recorded by the Dept. of Fisheries and Oceans. Data arerecorded in three forms (Chaput and LeBlanc 1991). Purchase slips are recorded by the buyer ofthe product and include the fisherman’s name (and license number), the place of landing and thedate of purchase. The second form is called a “Supplementary B” (coded 9000) which issubmitted by protection staff and are monthly estimates of catch which was consumed locally, i.e.not sold to buyers. The quantity of “Supplementary B” slips has varied among statistical districtsand species fished and has declined in the recent decade as protection staff spend less timecollating these statistics (Chaput and LeBlanc 1991). The final form has been called“Supplementary A” (coded 9999) forms which are slips completed by buyers outside thestatistical district of the fishery which gives the total catch purchased by species and the date and

5
location of the purchase. In the last few years, self-declaration slips (coded 9997) have beenreceived directly from the fishers which gives the total catch sold by the individual to anunspecified buyer.
Logbook reports have been mandatory in the commercial fisheries of the Bay of Fundy andAtlantic coast of Nova Scotia since 1993. The data from logbooks are more reliable than othersources but are still considered incomplete.
For American shad, the reliability of the commercial fisheries data varies with the region. In thesouthern Gulf of St. Lawrence, historical data are considered to be more reliable than that ofrecent years. In the first half of the 20th century, there was a larger number of participants in thefisheries and there was a larger enforcement contingent to record the fisheries landings. In thelast decade, the data quality has diminished and the reported landings are minimal and in somecases represent but a minor portion of the actual harvests. For example, with less than half thegaspereau fishermen from the Miramichi returning logbooks in the best years, the estimatedweight of the shad captured as bycatch has been two to three times the value recorded in thepurchase slips (Table IV-3). In some years, there were no recorded landings of shad but shadcatches were recorded in the harvests. All bycatch of shad in the gaspereau fishery of theMiramichi are landed with a large number of these sold directly at the wharf or consumed locally(G. Chaput, DFO pers. comm.).
The landings of shad for Canada and the southern of Gulf of St. Lawrence for 1917 to 2001 aresummarized in Figure IV-1. Detailed landings by statistical district and year for 1984 to 2001 aresummarized in Table IV-4 for Gulf New Brunswick, in Table IV-5 for Gulf Nova Scotia, and inTable IV-6 for Gulf PEI. Landings for the Bay of Fundy are summarized in Table IV-7 and for theAtlantic coast of Nova Scotia in Table IV-8.
Fisheries landings for shad for the years 1871 to 1921 are shown in Leim (1924) for eight regionsof eastern Canada.
Gulf of St. Lawrence
For Gulf Region, landings for 1917 to 1983 are summarized by LeBlanc and Chaput (1991).Landings of American shad peaked in the mid 1950s and have declined to low (less than 50 tannually) but constant levels since 1970 (Fig. IV-1). The area around Miramichi River in thesouthern Gulf of St. Lawrence accounted for more than 75% of the landings from the southernGulf prior to the 1960s and continues to account for more than 50% (Fig. IV-2; Chaput 1995).Catches of gaspereau in the southern Gulf and particularly Miramichi also increased dramaticallyand peaked in the mid-1950s to be followed by a rapid decline and steady to slightly increasedcatches since the 1970s (Chaput 1995). Landings of American shad from PEI and Gulf NovaScotia are low and sporadic (Table IV-5, IV-6).
Bay of Fundy / Atlantic Coast of Nova Scotia
Dadswell (1986) summarized the landings of American shad from Cumberland and Minas basinsof the Bay of Fundy and for the Saint John River fisheries of the Bay of Fundy for 1870 to 1978.Peak landings of 100 to 200 t per year were reported at the turn of the century in Cumberlandand Minas Basins whereas the Saint John River fisheries had a peak landing of 450 t in the1950s (Dadswell 1986). Landings of shad in the commerical fisheries of the Bay of Fundy remainmore important than those of the southern Gulf of St. Lawrence and the Atlantic coast of NovaScotia (Fig. IV-3). In the Bay of Fundy, landings of shad include migrant fish from U.S.A. rivers.
Recent landings have been below historic levels, fluctuating between 32 t and 110 t in the lastdecade but in 1988, 358 t were reported landed from the Bay of Fundy (Fig. IV-3). The greatestproportion of the landings are recorded from districts 48 and 49 bordering the Saint John Riverand upper Cumberland Basin (district 81) on the New Brunswick shore and from districts 42 and

6
43, the Minas Basin portion of the Bay of Fundy (Table IV-7). The landings from the Atlantic coastof Nova Scotia are low and sporadic with the majority reported from the offshore (non-tidal water)fisheries (Fig. IV-3; Table IV-8).
Fishing Effort
There is no information on the effort expended in the commercial shad fishery of the southernGulf of St. Lawrence. There are only 10 commercial licenses issued in the southern Gulf with atotal of 525 fathoms of potential gear effort (Table IV-1).
Fishing effort for gaspereau in the Miramichi River districts (71 and 72) declined from over 200licenses in 1950 to 36 licenses in 1965 (Figure IV-4) (Alexander and Vromans 1988). For theMiramichi River districts, the decline in landings during 1950 to 2000 parallels the reductions intrapnet licenses for gaspereau (Fig. IV-4).
There is some effort information from logbook reports within the Maritimes Region but not alllicensed fishermen submit logbooks and there has not been any verification of the reported effort.
V - AREA OF OCCUPANCY
Shad spend the majority of their life at sea and utilize the freshwater habitat for the purpose ofspawning. In the rivers of the Maritime Provinces, it is common for post-larvae and young juvenileshad to occupy both freshwater and brackish water environments. Juveniles eventually descendto the estuary and sea before the end of their first season of growth. There are instances whenshad can be found in tidal waters of rivers outside the spawning season.
Marine Distribution
The marine distribution of shad has been described by Neves and Depres (1979), Leggett(1973). Dadswell et al. (1987) provide a summary of seasonal marine migration patterns ofAmerican shad.
The marine distribution of shad in eastern Canada extends from the Bay of Fundy to Labrador.There are few observations of shad catches in marine fisheries off Newfoundland (Appendix I -NFLD observer reports). No information was obtained on catches of shad in the DFO researchsurveys in the Newfoundland Region.
Gulf of St. Lawrence
Shad have been infrequently captured in the September groundfish survey of the southern Gulf(Appendix II; Appendix Fig. II-1, 2). Over the last 30 years of survey, shad were observed at 23 ofthe more than 3000 trawl/stations sampled, totalling 89 fish (Appendix Table II-1). In 14 of the 23sets, only one individual was captured. The largest single catch was 30 fish. Shad were capturedexlcusively in the nearshore shallow waters of the southern Gulf (Appendix Fig. II-2). Shadsampled ranged in size between 7 and 71 cm fork length (Appendix Table II-2).
Shad have been captured in May, July, September, October and December in the southern Gulf(Appendix Table II-1, 3, 4). The locations of capture are consistent with a migration of shad intothe Gulf of St. Lawrence in the spring and migration out of the Gulf in the fall.
In an October 2002 survey of the western portion of the Northumberland Strait region of the Gulfof St. Lawrence, juvenile shad were captured in 54 of 99 bottom trawl sets (Appendix Table II-4).A total of 850 shad were captured with the highest single trawl catch of 125 individuals.

7
Fishery observer reports of American shad captured in the Gulf of St. Lawrence indicate thatshad occur occasionally as a bycatch in the southern Gulf of St. Lawrence from May toDecember (Appendix Table II-5). The majority of the bycatch occurred in gill nets. Thegeographic distribution of the catches is also consistent with a migration into the Gulf in thespring followed by an eastward and outward migration from the Gulf of St. Lawrence in the fall.
Bay of Fundy / Atlantic Coast of Nova Scotia
Shad are frequently represented in the catches from research surveys along the Atlantic coast ofNova Scotia and in the Bay of Fundy. Summer catches are consistent with the well-describedoccurrence of migrant feeding shad originating from virtually all rivers along the eastern seaboardinto the Bay of Fundy and Gulf of Maine (Fig. V-1). Winter surveys indicate that shad aredistributed at depths of between 100 and 200 m along the edges of Georges Bank and theScotian Shelf and within the basins along the top of the shelf (Fig. V-2, V-3). The 1999 observerdata is typical for the years 1997-2001 and suggests a January to March distribution along theshelf slope, rather than the Shelf as has been the interpretation of the winter range based solelyon research vessel survey data (Fig. V-4).
Coastal Distributions
The best indication of nearshore and estuarine occurrence of shad is the commercial fisheriesdata.
Gulf of St. Lawrence
Based on the commercial fisheries landings, shad have been reported from essentially all coastalareas of the Maritimes with the exception of the eastern shore of Cape Breton Island and somedistricts in PEI (Fig. V-5). In the southern Gulf of St. Lawrence, shad are captured in coastal orestuarine waters primairly in spring and summer with limited catches in late fall (Table V-1).There are few to no fisheries which could capture shad in late summer and fall because of closedseasons, gear restrictions (Table IV-2).
Bay of Fundy / Atlantic coast of Nova Scotia
Catches from this area are concentrated in the Bay of Fundy with the largest catches from theinner portions (Chignecto Bay which includes both Shepody Bay and Cumberland Basin; andMinas Basin and approaches which includes Scots Bay, Minas Basin, Southern Bight, andCobequid Bay). The inner portions of the Bay of Fundy are the traditional locations for fishingshad in shallow coastal water principally with gillnets and low head weirs as has been the casefor more than a century and a half (Perley 1852). The large fishery for migrant feeding shadexists because of the combination of high water turbidity and therefore high light attenuationdown the water column and the preference exhibited by shad for low light. Hence, shad areavailable to capture with shallow water fishing gear because of the fish’s close proximity to thesea surface (Dadswell et al. 1983). Tagging information and analysis of the morphometric andmeristic characters of the fish captured there indicate that the summer-autumn fishery is a mixed-stock fishery, with virtually every shad population on the eastern seaboard of North Americacontributing to the catch in rough proportion to their individual population abundances.
River fisheries for spawning shad from April-June occur on the Shubenacadie/Stewiacke andlesser rivers flowing into the Southern Bight of Minas Basin, and at one time on the PetitcodiacRiver which flows to Shepody Bay. The commercial fishery for spawning shad on the Petitcodiacdoes not appear to have been large apparently owing to the fact that the commercial fishers ofthe area regarded these fish to be of inferior quality to those that would arrive in early summerand remain available to capture through to mid-autumn (Perley 1852). This also appears to be

8
the reason why river fisheries for spawning shad did not become established to any great extenton the Tantramar, River Hebert, and Maccan and Nappan rivers, all flowing to CumberlandBasin.
Important fisheries for shad also occur in the Saint John River (NB) and along the coast on eitherside of the Saint John River estuary (Fig. V-5; Table IV-7, V-2).
Shad are generally exploited in May to July in most areas of the Bay of Fundy and Atlantic coastof Nova Scotia although some landings of shad were reported from February to Novemberconsistent with fishing activities in the coastal waters and the presence of shad on the ScotianShelf during the fall and winter (see Marine Distribution Section) (Table V-2).
Freshwater Distribution
Shad have been observed in rivers from the Bay of Fundy to Labrador (Fig. V-6; Table V-3).Shad occur infrequently in Labrador and insular Newfoundland (Fig. V-6; Table V-3, V-4)(Dempson et al. 1983). American shad at fresh water facilities in Newfoundland and Labradorhave been observed from May to August (Table V-5). Most of the facilities in Newfoundland donot operate after August but it is unlikely that shad would have been present yet missed based onthe timing of occurrence of shad in the Newfoundland and Maritime rivers.
Gulf of St. Lawrence
In the Gulf of St. Lawrence, shad are abundant in the Miramichi River and have been observed atthe counting facilities of the major rivers of the southern Gulf, the Restigouche River (NB) and theMargaree River (Cape Breton, NS) (Table V-3, V-6).
Shad are most abundant in the Miramichi River in May to mid-July, consistent with a spawningrun into that river (Fig. V-7). A few shad have been observed in September (Claytor 1996).Similarly, shad in the Margaree River were observed in June and July with no observations afterJuly (trapnets were operating in those years to late October) (Table V-7). In Chaleur Bay (NB),shad were observed at a coastal trapnet near the mouth of the Restigouche River from May intoSeptember with peak periods of occurrence in June, July and August (Fig. V-8). This occurrenceof shad is consistent with spawning runs to the Restigouche although no sampling for biologicalcharacteristics was conducted to confirm the presence of mature adults. Infrequent observationsof shad in the other rivers of the Gulf occurred in July.
Bay of Fundy
A large in-river fishery was once reported to have existed on the St. Croix River (Perley 1852) butthe stock has been extirpated for several decades as a result of inadequate fish passage.
Leim (1924) indicated that shad historically ascended the Saint John River up to Grand Falls (320km from the mouth of the river) but that the bulk of the catch was taken in the lower 200 km ofriver. In the Saint John River system, shad were observed at the Tobique Narrows fishway, over180 km above the head of tide prior to the construction of the downstream dams (Smith 1979).Annual counts of shad at the Beechwood Dam facility, located 153 km above the head of tideranged from 0 to 1,490 fish between 1957 and 1971 and shad were infrequently observed atBeechwood Dam after the construction of the Mactaquac Dam ( 2 km above the head of tide)(Table V-8). Counts of shad at Mactaquac obtained between 1969 (when the fish trappingfacilities became operational) to 2002 were highest in the first three years (between 36,400 and39,000 fish) and declined to less than 500 fish by 1976 (Table V-8). The continued transport ofshad above Mactaquac dam became an issue when it was found that the handling proceduresresulted in high mortalities of fish when released (Smith 1979). Shad transport above Mactaquacis presently incidental to the transport and release of gaspereau above the dam and counts at the

9
fish trapping facilities at Mactaquac are not a reliable indicator of abundance of shad in thatportion of the Saint John River.
Spawning shad still run to the lesser tributaries flowing into the lower Saint John River belowMactaquac, including the Grand Lake, Washademoak Lake, and the Kennebecasis (including theHammond) River systems (Fig. V-9). Analysis of meristic characters (Carscadden and Leggett,1975a,b) has indicated that these are discrete spawning runs.
Leim (1924) indicated spawning shad were observed in May and June in the Petitcodiac and thatthis river probably represented the principal spawning ground for Shepody Bay and perhapsCumberland Basin. Shad were sampled moving upstream and downstream through a countingfence on the Petitcodiac River in 1942 (Wilder 1942a). The first upstream movements wereobserved in early May and sampling of downstream migrating shad indicated both male andfemale shad in post-spawning condition (Wilder 1942c). Because of difficulties in keeping shadalive in the holding trap and the effects of warm water, parts of the fence were removed to allowshad to pass unobstructed (Wilder 1942a,c). Shad abundance in the Petitcodiac that year was inthe thousands based on 1,100 fish counted going downstream and reports of more than 2,500shad which were collected and disposed of following mortality in the river associated with warmwater temperatures (Wilder 1942b). After construction of the causeway in 1968, shad appear tohave been unable to pass through the fishway. Between 1983 and 1997, only 4 shad (all in 1983)were counted at the fishway (DFO Unpubl. data).
The River Hebert was also mentioned by Leim (1924) as an important spawning river for shadwith the possibility that shad may also spawn in the LaPlanche, Nappan and Maccan rivers ofCumberland Basin. Beyond the report by Leim (1924), there are no historic or current data toconfirm the historic existence and the continued presence of spawning runs in these rivers. Aflood control structure in the tidal channel of the Tantramar River impedes fish passage.
Within Minas Basin shad runs occur on the Shubenacadie/Stewiacke (Leim 1924) and theKennetcook rivers (Table V-3; Fig. V-6). The Shubenacadie/Stewiacke River (FSD 42, 43; Fig. III-1) supports a large April-June shad fishery (Table IV-8). Shad were a regular component of thedaily catch in a research trapnet operated during May for striped bass assessments at Enfield onthe Shubenacadie River during 1999-2002 (DFO, unpublished data). Shad were also interceptedduring most of the days that a counting fence operated on the Stewiacke River and a partialcount of shad totalling about 15,000 fish was tallied between May 20 and June 30, 1993 (DFOUnpubl. data).
Commercial fishing above the head of tide on the Kennetcook River was prohibited byregulations in the early 1900’s as a way of protecting spawning shad and Atlantic salmon (Prince1912). Therefore the continued occurrence of this population is known to DFO only through localknowledge and reports of fish in the river from credible sources. Spawning fish (that arepresumably) running to the Kennetcook are exploited in an April to June gillnet (set and drift)fishery in the tide way that is shared with the Avon River and lesser streams. Leim (1924)suggested that shad spawned, but in low numbers, in the Kennetcook, Avon and St. Croix rivers.Prince (1912) provides details of the collapse and eventual elimination from catch-failure of ashad gillnet fishery within the tidal portions of the Cornwallis River. The present status of thesepresumed runs is unknown.
There is a large spawning run of shad on the Annapolis River (Fig. V-6) (Dadswell et al. 1983;Melvin and Dadswell 1984; Melvin et al. 1986). As was the case with the Kennetcook, theAnnapolis River was closed to commercial fishing in the early 1900’s in order to protect spawners(Prince 1912).

10
Atlantic Coast Nova Scotia
Shad have also been observed in rivers along the Atlantic coast of Nova Scotia, primarily theLaHave River (Fig. V-6) where they are intercepted as a bycatch in the dipnet fishery forgaspereau (FSD 27; Table V-2). Shad have been infrequently (approximately 30 fish over pastten years) observed at the Morgan Falls fish counting facility on the LaHave River, about 25 kmabove the head of tide.
Rivers for which local knowledge of shad runs exist but for which the DFO does not possesscorroborative information include Mira (FSD 7 - Cape Breton), St. Mary’s (FSD 17), andMusquodoboit (FSD 20) rivers. Inspection of April-June landings (Table V-2) and as reported inlogbooks indicates that shad runs may occur on the Annis River (FSD 34; Fig. III-1) and Porter’sLake (FSD 20; Fig. III-1). These will require further investigation. Note that Leim (1924) indicatedthat shad ascended the Tusket River (FSD 33) for the purposes of spawning but in smallnumbers. No shad were observed ascending the fishways on the Tusket during May to June inrecent years (15 minute counts every half hour during daylight hours with 60, 53, 20, and 46 daysof observation for the years 1996, 1997, 1999, 2001 respectively) Further along the Atlanticcoast, Leim (op. cit.) indicated that the absence of large accessible rivers precluded the presenceof large runs of shad but based on small but more or less persisent catches, shad may spawn ina few of those rivers including the Liverpool (Mersey) and Medway rivers (FSD 25) and the MiraLakes in Cape Breton.
VI - EVIDENCE OF EXTANT SPAWNING RUNS
Spawning runs of shad are identified on the basis of the presence of ripe and running fish, bothmales and females, from the presence of eggs/larvae or juveniles, and from anectodal reports ofmature fish (Table V-3). The presence of shad in an estuary is not assumed to indicate aspawning run nor is the absence of eggs or larvae in ichthyoplankton surveys intended to inferthe absence of spawning in that river. Where shad spawning does occur, eggs and larvae wererecovered in the fresh water portions of the river with few in the lower and estuarine sections ofthe river (Williams and Daborn 1984) therefore ichtyoplankton surveys conducted in estuarineportions of the rivers may not be indicators of spawning activity. Anecdotal reports fromfishermen of mature adults in their catches at the appropriate season for shad spawning may beindicative of spawning runs into those rivers but this information is less reliable than the otherindicators. The data presented below include observations from DFO monitoring programs orevidence from literature.
Newfoundland and Labrador
There is no evidence of spawning runs of shad in Newfoundland and Labrador (Table V-3).Dempson et al. (1983) suggest that the shad observed in Newfoundland and Labrador are likelystrays and not fish from self-sustaining runs.
Southern Gulf of St. Lawrence
In the southern Gulf of St. Lawrence, spawning runs of shad have only been confirmed in theNorthwest and Southwest Miramichi rivers.
In the southern Gulf of St. Lawrence, ripe and running male and female American shad havebeen sampled at tidal trapnets in both the Northwest Miramichi and Southwest Miramichi rivers(Table V-3). These mature spawners had modal lengths of 40 cm for males and 45 cm forfemales (Fig. VI-1). The size range of mature males in the Miramichi was 27.0 to 55.5 cm forklength whereas the size range of mature females was 36.0 to 58.5 cm fork length (Fig. VI-1). Theyoungest spawning male was three years old and the oldest male was 11 years old having first

11
spawned at age 5 years. The youngest female spawner was 4 years of age and the oldestspawner was 10 years old having first spawned at 5 years. Age at first maturity observed in theMiramichi shad runs ranged between 3 and 5 years for males, 4 and 6 years for females (DFOUnpubl. data). Proportionally, more males have been observed than females and the males arepresent in the river for a longer period of time than females (Fig. VI-2).
Shad are abundant and readily captured in First Nations fisheries near the head of tide in theNorthwest Miramichi but do not appear to migrate far upstream. No shad were reported at theCurventon counting fence in the Northwest Miramichi located 13 km above the head of tide(Table V-3). Few post-spawning shad were captured in the Little Southwest Miramichi at therotary screw trap facility located 29 km above the head of tide and operated early May to midJune although shad are observed in the pools in that location (P. Hardie, DFO pers. comm.). Thespawning location in the Northwest Miramichi is not known. In the Southwest Miramichi, shadcongregate and behaviour consistent with spawning has been observed at upper Blackville (S.Douglas, DFO pers. comm.), about 50 km above the head of tide (altitude 30 m above sea level).No shad eggs or larvae were recovered in the Miramichi during an ichthyoplankton survey in1992 but a personal communication referenced in the document indicates shad larvae werepresent in the Northwest Miramichi in June 1992 (Locke and Courtenay 1995). This survey wasconcentrated in the upper and middle estuary and large numbers of gaspereau (Alosa sp.) larvaewere collected (Locke and Courtenay 1995).
No American shad eggs or larvae were identified in the ichthyoplankton samples collected in1996 to 1998 from the Kouchibouguac River and Richibucto River (New Brunswick) but larvae ofAlosa sp. were captured and identified as being larvae of gaspereau rather than shad (Bernier etal. 1998; Robinson et al. 1998, 2001).
No shad eggs or larvae were identified from icthyoplankton samples collected between May andAugust 1983 from two estuaries of Prince Edward Island (Johnston and Morse 1988). Larvae ofblueback herring (Alosa aestivalis) were identified in large numbers from these estuariesindicating that the season and sampling locations would have been appropriate for capturingshad eggs or larvae if they had been present.
American shad opportunistically sampled from the estuarine trapnet in the Margaree River wereof the appropriate size range to be spawners (Fig. VI-3). One ripe male but no ripe females wereobserved at the trapnet.
Bay of Fundy
It is assumed that shad spawned in the St. Croix River (Perley 1852) but the run declinedprecipitously over the years and is not believed to presently exist because of manmade barriersto upstream fish passage (Fig. VI-4).
Prior to the construction of the hydroelectric dams at Beechwood and Mactaquac on the SaintJohn River, shad ascended beyond the dams and were present in June and could haverepresented spawning runs in that upper portion of the river (Fig. VI-5). Shad transport aboveMactaquac is presently incidental to the transport and release of gaspereau above the dam.Shad runs to Mactaquac are consistent in timing to what would be expected for spawning runs(Table V-8).
There are spawning runs of shad to the lesser tributaries flowing into the lower Saint John Riverbelow Mactaquac, including the Grand Lake, Washamadoak Lake, and the Kennebecasis(including the Hammond) River systems (Table V-3; Fig. V-9, VI-4). Analysis of meristiccharacters (Carscadden and Legget, 1975) has indicated that these are discrete spawning runs.
Wilder (1942a, c) reported several thousand shad in the Petitcodiac River, and considered theseto be a spawning run based on the presence of post-spawned males and females. Few or no

12
shad have been reported ascending through the fishway at the causeway in the last years whenmonitoring occurred and the shad run in this river is considered to have been eliminated, causedby the lack of suitable fish passage facilities (Fig. VI-4). Recent evidence for shad spawners in onthe Tantramar, River Hebert, and Maccan and Nappan rivers, all flowing to Cumberland Basinare based on scientific collections which occurred in river during the anticipated spawning period(Bradford and Dadswell 1983) (Fig. VI-4).
Within Minas Basin shad runs occur on the Shubenacadie/Stewiacke and the Kennetcook rivers(Fig. VI-4). Egg surveys (DFO, unpublished data) on the Shubenacadie/Stewiacke riversindicated that spawning occurred on the main Shubenacadie below Enfield, the Nine Mile Riverthat joins the Shubenacadie at Elmsdale, and on the main Stewiacke River several kilometresupstream from the head of tide (Fig. VI-6). These are all areas of low stream gradient. In recentyears shad have run into Shubenacadie River to Grand Lake (Fig. VI-6; DFO unpublished data).It is not known where spawning occurs above Enfield or if this activity contributes to recruitment.The continued occurrence of spawning shad in the Kennetcook River is known to DFO onlythrough local knowledge and reports of fish in the river from credible sources (Fig. VI-4)..Spawning fish (that are presumably) running to the Kennetcook are exploited in the April to Juneset and drift gillnet fisheries in the tideway that is shared with the Avon River and lesser streams.Prince (1912) provides details of the collapse and eventual elimination from catch-failure of ashad gillnet fishery within the tidal portions of the Cornwallis River (Fig. VI-4). The present statusof this run has not been determined.
There is a large spawning run of shad on the Annapolis River as evidenced by the large numberof adult shad in the river and the presence of eggs and larvae (Fig. VI-4; Dadswell et al. 1983;Melvin et al. 1985). As was the case with the Kennetcook this river was closed to commercialfishing in the early 1900’s in order to protect spawners (Prince 1912).
Atlantic Coast Nova Scotia
Shad have also been observed in rivers along the Atlantic coast of Nova Scotia, primarily theLaHave River (Fig. VI-4) where they are intercepted as a bycatch in the dipnet fishery forgaspereau. It is suspected that shad spawn in the LaHave River but there is no supportingevidence based on egg or larval sampling nor from directed assessment programs on this river.
Rivers for which local information of shad spawning occurs but for which the DFO does notpossess corroborative information include Mira (Cape Breton), St. Mary’s, Musquodoboit, Annisrivers and Porter’s Lake (Fig. VI-4). There is no confirmation however that any of these rivershave ever or continue to have self-sustaining (complete life cycle over several generations) runsof American shad.
VII - ADDRESSING THE SPECIFIC TERMS OF REFERENCE
VII-1 Review the population structure in the context of “evolutionarily significant units”
Smedbol et al. (2002) provide a detailed review of the considerations for defining ESUs formarine fishes. The arguments will not be repeated here. However, the conclusions of theseauthors that the management units used were at finer spatial scales than what might beanticipated as ESUs for cod is relevant for the discussion of shad population structure.
Life history differences among shad populations have been suggested as indicative of populationstructuring within eastern North America and perhaps within spawning rivers that share acommon estuary (Carscadden and Leggett 1975a,b). Repeat spawners are generally absent inshad runs south of 36˚N and a high proportion of repeat spawning occurs in rivers north of 40˚latitude (Leggett and Carscadden 1978). A number of studies of American shad have found

13
significant differences in meristic and morphometric characteristics among shad sampled fromrivers on the eastern seaboard of North America (Carscadden and Leggett 1975a and referenceswithin Dadswell et al. 1987). Based on tag returns and migrations, Dadswell et al. (1987)suggested that there were three regional groups of shad: a northern group consisting of the Bayof Fundy and the Gulf of St. Lawrence, a mid-Atlantic group from Cape Hatteras to Cape Cod anda southern group (south of Cape Hatteras). Shad tagged in the Minas Basin of the Bay of Fundyin summer were subsequently recaptured in all areas of the eastern seaboard of North America(Melvin 1984; Dadswell et al. 1987). Some of these fish were recaptured in Newfoundland andLabrador, in the Gulf of St. Lawrence and into the St. Lawrence River, from June to December(Dadswell et al. 1987). The extent of the recaptures suggests that shad from the entire Atlanticcoast may spend part of their life in the Bay of Fundy area.
Bentzen et al. (1989) conducted a study of mitochondrial DNA polymorphism in American shadsampled from spawning runs in 14 rivers from Florida to the Miramichi in the Gulf of St. Lawrenceand the St. Lawrence River. They concluded that the shad in their sampled rivers representedgenetically distinct assemblages but there was no evidence of a phylogenetic split betweennorthern and southern shad (i.e. genotypes were commonly distributed over the entiregeographic range). The results of Bentzen et al. (1989) suggest that there was sufficient isolationamong the shad runs of these rivers for genetic differences to have become established.
The latitudinal gradient in proportion repeat spawners and fecundity suggests a grouping ofsouthern and northern shad runs. Within the Canadian shad runs, the observed geneticdifferences in mitochondrial DNA would suggest a grouping into the St. Lawrence River,Miramichi River, and Bay of Fundy. The fisheries management regime within the Maritimeprovinces is organized regionally such that shad from the Gulf of St. Lawrence are managed as aunit while shad from the Bay of Fundy and Atlantic coast of Nova Scotia are managed as aseparate unit. Even within the Bay of Fundy area, fisheries are managed in accordance to localcharacteristics of the shad runs. The present treatment of shad in the Maritimes is thereforeconsistent with the principle of managing discrete units and it is likely that the management unitsare at least if not at a finer scale than the ESU definitions which may develop for shad. Thepresent structure for the management of fisheries for spawning shad could accommodate furtherdivisions should genetic and life-history data indicate more than one ESU occurs within aparticular region, as for example Bay of Fundy versus Atlantic Nova Scotia.
VII-2 By stock and for ESUs identified above summarize overall trends in populationsize
Shad spend the majority of their life at sea and utilize the freshwater habitat for the purpose ofspawning. In the shad rivers of the Maritime Provinces it is common for post-larvae and youngjuveniles to occupy both freshwater and brackish water environments. Juveniles eventuallydescend to the estuary and sea before the end of their first season of growth. There areinstances when shad can be found in tidal waters of rivers outside the spawning season,especially in the Saint John River of the Bay of Fundy (Gabriel et al. 1976) and via tidal advectioninto the Shubenacadie estuary. Male shad in the Maritime provinces mature at ages 3 to 6 yearswhile female shad mature at ages 4 to 6 years. Estimates of total numbers of shad in thepopulation are therefore not available since fish observed in the rivers are only the maturecomponent of the populations.
Estimates of the size of spawning runs of American shad are limited to a few rivers in AtlanticCanada. With the exception of counts at monitoring facilities, there are no estimates of total runsize of spawners into the rivers. Where counts at facilities are considered complete, they mayrepresent only part of the run because of their location in the river.

14
Estimates of run size based on counting facilities
There are no rivers in the southern Gulf of St. Lawrence with complete counts of runs of shad.
Runs of shad enumerated at the Mactaquac Dam in the first three years of operation averagedjust over 37,000 fish (Table V-8) although the size of the shad run in the Saint John River wasconsidered to be much larger (Jessop 1975). Prior to the construction of the Mactaquac Dam,shad ascended beyond the Beechwood dam but numbered less than 1,500 animals annually.Very few shad are presently observed at the fish trapping facility at Mactaquac, generally lessthan 1,000 animals per year since 1974 (Table V-8).
A counting fence operating on the Stewiacke River in 1993 provides another measure of theminimum size of the shad run at no less than 10,000 animals (DFO Unpubl. data). Estimates ofthe shad run on the Annapolis River prior to operation of the tidal power facility were on the orderof 100 thousand animals (Melvin et al. 1985).
Estimates of run size based on catches
Fisheries catches provide an indication of the relative size of runs. Jessop (1975) indicated thatthe fisheries catches in the Saint John River in 1953 amounted to about 238 thousand fish (at anassumed average weight of 1.92 kg per fish). At a similar assumed weight through the history ofthe fisheries, then the number of shad captured in Canada at the peak of the fishery (1955) wouldhave amounted to over one half million fish (Fig. IV-1). Landings in the last three decades havebeen much lower but would put the catches of shad in the fisheries as high as 200 thousand fishin the Bay of Fundy (in 1988) and as high as 30,000 fish in the southern Gulf of St. Lawrence.The number of shad in the runs is much higher because the landings are incomplete andconsidered to be minimum, and the fisheries do not remove 100% of the runs. A component ofthe shad catches in the Bay of Fundy and Atlantic coast of Nova Scotia would be shad of U.S.A.origin.
Chaput (1995) assumed catch rates for shad at the Millbank trapnet in the Miramichi River (Gulfof St. Lawrence) to be about 1.3% (between those for gaspereau at 0.2% and salmon at 1.5% to3%). This results in annual run size estimates to the Miramichi of close to 100 thousand fish(Table V-6). Partial reported landings of shad from the gaspereau fishery have been as high as21,000 fish annually with less than one-third of potential gear reporting catches (Table IV-3).These indicate that the spawning run of shad to the Miramichi is in the order of 100 thousand ormore animals.
Trends in population size
No analysis of trends of abundance were conducted on the fisheries landings data. The data areconsidered incomplete and changes in effort over time preclude the use of these data to infertrends in abundance. For example, the number of licenses in the Miramichi River gaspereaufishery has declined from over 200 in the early 1950s to just over 35 licenses since the mid 1960s(Fig. IV-4). There is a strong positive association between the reported landings of shad from theMiramichi and the number of gaspereau licenses for that area (Fig. IV-4).
A catch rate analysis was conducted on the catches of shad at the index estuary trapnets in theMiramichi: Millbank (main stem of the Miramichi), SW Enclosure (lower portion of the SouthwestMiramichi) and SW Millerton (upper portion of Southwest Miramichi estuary) (Table V-6; Fig. VII-1). Counts of shad at the index trapnets show important annual variations among individualtrapnets and rivers (Fig. VII-1; Table V-6). An analysis of trends in the annual counts indicatedthat the Millbank trapnet captured more shad than either of the Southwest Miramichi trapnets butonly a minimal amount of the annual variation (7%) in counts could be explained by a trend overtime or a trapnet location. The trend over time (1970 to 2001) was positive and significant (P <0.01).

15
Conclusion
Run sizes to the major rivers of the Maritimes (Miramichi, Saint John, Shubenacadie/Stewiacke,Annapolis) are expected to be in the order of 100s of thousands of fish.
There is insufficient information to draw conclusions on the trends in abundance of Americanshad in Atlantic Canada. Fisheries landings have declined over the past 5 decades but some ofthe decline can be attributed to reduced effort. Where indices of abundance are available, thereis no significant temporal trend in the indices.
VII-2a Where declines have occurred over the past three generations, summarize thedegree to which the causes of the declines are understood, and the evidence that thedeclines are a result of natural variability, habitat loss, fishing, or other human activity
There are three rivers in the Maritimes, all in the Bay of Fundy, where declines in abundance ofshad have been observed. In the Petitcodiac River, the construction of the causeway atMoncton/Riverivew (NB) has prevented the migration of shad into the river. In 1942, Wilder(1942a,c) reported several thousand shad in the Petitcodiac River, considered to be a spawningrun. Few or no shad have been reported ascending through the fishway at the causeway in thelast years when monitoring occurred and the shad run in this river is considered to have beeneliminated, caused by the lack of suitable fish passage facilities.
On the Saint John River, shad ascended above the Mactaquac Dam prior to its construction.After construction, attempts were made to transport and release shad above the dam but withlimited success and the practice has been discontinued although some shad are undoubtedlyreleased into the headpond within the gaspereau transportation activities (R. Jones, pers.comm.). Jessop (1975) attributed the decline in shad at Mactaquac to the construction of thedam, the stress associated with upstream transportation of spawning adults, downstream fishpassage constraints, and modified spawning habitat due to headpond construction.
A substantive fishery for shad on the St. Croix River, an international waterway lying between theState of Maine and the Province of New Brunswick, was described by Perley (1852). This rundeclined precipitously over the years following his report because of manmade barriers toupstream fish passage.
A large portion of the southern Uplands of Nova Scotia has been impacted by acid precipitation(DFO 2000). This has resulted in significant declines in Atlantic salmon populations. AlthoughAmerican shad are known to be more tolerant of river acidification than salmonids (Klauda, 1994)the impact of acid depositions on American shad production in Nova Scotia rivers has not beenstudied but it is likely to have degraded the spawning habitat of shad in this area.
There is no evidence of fisheries induced declines in American shad in Atlantic Canada.Fisheries for shad are regulated by season and gear restrictions and there are no new entrantsinto the fishery. Some of the fisheries for shad, such as in the Saint John River at the harbour,are constrained by bycatch considerations for Atlantic salmon.
VII-2b Where declines have occurred over the past three generations, summarize theevidence that the declines have ceased, are reversible, and likely time scales forreversibility.
Specifically for Petitcodiac, and the Saint John River (upstream of Mactaquac), there have few tono shad for years and this status is not expected to change under present conditions. The majorimpediment to shad in these rivers is fish passage, both upstream and downstream.

16
The prospects for re-colonization of the St. Croix are presently poor owing to the practice byState of Maine authorities of blocking fishways to gaspereau (and presumably shad) at Woodlandand Grand Falls.
VII-3 By stock and for ESUs identified above summarize current area of occupancy
Leim (1924) indicated that there were five important regions for shad in eastern Canada: SaintJohn, Chignecto Bay, Minas Basin, Miramichi and St. Lawrence River, all located within proximityto large rivers.
The present knowledge of shad ecology is greatly enhanced relative to the information availablein 1924. The extensive migrations of shad along the eastern seaboard and the mixed stock originof shad in the Bay of Fundy were unknown to Leim (1924) who indicated that it was probable thatshad did not leave the Bay of Fundy or the Gulf of St. Lawrence but remained within those bodiesof water year round.
Shad undertake migrations similar to gaspereau to overwinter outside the Gulf of St. Lawrence,because marine surface waters in the Gulf are generally below freezing for several months. Shadoverwinter on the Scotian Shelf, the edge of Georges Bank lying within the Bay of Fundy-Gulf ofMaine, and apparently along the Shelf Slope (this manuscript). Marine distributions are alsosparse in the northern areas and limited to the open water periods (late spring to fall) (Dempsonet al. 1983; this document).
In freshwater, American shad have been observed from the most southern rivers of the Maritimesto a few rivers in Labrador (Table V-3; Fig. V-6). At most facilities in Newfoundland and Labrador,shad are rare occurences and are not observed annually in rivers, suggesting that these do notrepresent sustained spawning runs or even spawners in those rivers.
The Miramichi River is the only confirmed river within the southern Gulf of St. Lawrence thatsupports shad spawning. The presence of numbers of shad in the Chaleur Bay region and in theMargaree River do not preclude that spawning may also occur in those locations but run sizeswould be small relative to the Miramichi. There is no reason to believe this has changed fromhistorical conditions.
Shad are found throughout the Bay of Fundy in numerous rivers and within the Bay itself.Spawning shad runs are known from three rivers and suspected in another six rivers. Spawningruns have been eliminated from the St. Croix and the Petitcodiac rivers.
Along the Atlantic coast of Nova Scotia, shad runs are suspected in at least four rivers. There isno data to indicate American shad have been extirpated from any of the Canadian rivers flowingdirectly into the Atlantic Ocean.
VII-3a Summarize changes in area of occupancy over as long a time as possible, and inparticular, over the past three generations
In the Bay of Fundy, there is an appearance of a range contraction owing to the loss of thespawning run to the St. Croix River, New Brunswick. However, and when taken in the context ofthe known occurrence of extant spawning runs to rivers draining into the U.S.A. portions of theGulf of Maine, and along the eastern seaboard to the south, the loss is of greater importance interms of loss of local production than in a biogeographic context. In combination with the loss ofthe upper Saint John River run (upstream of Mactaquac) and that to the Petitcodiac the net lossdue to land-based human activities is three spawning runs which existed historically. Information

17
is available to confirm that nine spawning runs are still sustained (Table VII-1) and the status of of18 other rivers is unknown (Table VII-1).
Shad have been and continue to be observed throughout Atlantic Canada and the lack ofdedicated assessment programs for shad preclude any description of short to medium termchanges in occupancy.
VIII - REFERENCES
Alexander, D.R. and A.H. Vromans. 1988. Status of the Miramichi River fishery (1987) for alewife(Alosa pseudoharengus) and blueback herring (Alosa aestivalis). Can. Atl. Fish. Sci. Adv. Comm.Res. Doc. 88/27. 30 p.
Bentzen, P; G.G. Brown, and W.C. Leggett. 1989. Mitochondrial DNA polymorphism, populationstructure, and life history variation in American shad (Alosa sapidissima ). Can. J. Fish. Aquat.Sci. 46: 1446-1454.
Bernier, R., S. Désormeaux, E. Tremblay, A. Locke, I. Kaczmarska, G. Klassen, and P. Strain.1998. Plankton community structure and productivity in the Kouchibouguac National Parkestuaries Part I, Preliminary results from the ice-free season, 1997. Parks Canada - EcosystemMonitoring and Data Report No. 004: iii + 149 p.
Bradford, R.G. and M.J. Dadswell. 1983. The goegraphical origin of 'fall-run' American shad(Alosa sapidissima) in the Saint John Harbour as determined by tagging and morphometric andmeristic analysis. Unpublished manuscript, Department of Fisheries and Oceans, St. AndrewsBiological Station, St. Andrews, N.B. 16 p.
Carscadden, J.E. and W.C. Leggett. 1975a. Meristic differences in spawning populations ofAmerican shad, Alosa sapidissima: evidence for homing to tributaries in the St. John River, NewBrunswick. J. Fish. Res. Board Can. 32: 653-660.
Carscadden, J.E. and W.C. Leggett. 1975b. Life history variations in populations of Americanshad, Alosa sapidissima (Wilson), spawning in tributaries of the St John River, New Brunswick. J.Fish Biol. 7: 595-609.
Chadwick, E.M.P., D.R. Alexander, R.W. Gray, T.G. Lutzac, J.L. Peppar, and R.G. Randall. 1985.1983 Research on Anadromous Fishes, Gulf Region. Can. Tech. Rep. Fish. Aquat. Sci. No.1420. xi + 69 p.
Chaput, G. J. 1995. Temporal distribution, spatial distribution, and abundance of diadromous fishin the Miramichi River watershed, p. 121-139. In E.M.P. chadwick [editor]. Water, science, andthe public: the Miramichi ecosystem. Can. Spec. Publ. Fish. Aquat. Sci. 123.
Chaput, G.J. and C.H. LeBlanc. 1991. Les pêches commerciales de poissons dans les baies,estuaires et rivières du sud-ouest du golfe du Saint-Laurent, p. 293-301. Dans J.-C. Therriault[éditeur] Le golfe du Saint-Laurent : petit océan ou grand estuaire? Publ. Spéc. Can. Sci. Halieut.Aquat. 113.
Claytor, R.R. 1996. Weekly fish counts from in-river traps, counting fences, barrier pools, andfishways in southern Gulf of St. Lawrence rivers, from 1952-1993. Can. Data Rep. Fish. Aquat.Sci. No. 982. xiv + 143 p.
Dadswell, M.J. 1986. Stock structure of American shad, Alosa sapidissima, in the Gulf of Maineand Bay of Fundy. CAFSAC Res. Doc. 86/97. 32 p.

18
Dadswell, M.J., G.D. Melvin, and P.J. Williams. 1983. Effect of turbidity on the temporal andspatial utilization of the inner Bay of Fundy by American shad (Alosa sapidissima) (Pisces:Clupeidae) and it s relationship to local fisheries. Can. J. Fish. Aquat. Sci. 40 (Suppl. 1): 322-330.
Dadswell, M.J., G.D. Melvin, P.J. Williams, and D.E. Themelis. 1987. Influences of origin, lifehistory, and chance on the Atlantic coast migration of American shad. American Fisheries SocietySymposium 1: 313-330.
Davidson, K., M. Niles, P. Swan, and L. Forsyth. 1995. The Lake O’Law Project, Cape Breton,Nova Scotia: 1989-1993. Can. Tech. Rep. Fish. Aquat. Sci. No. 2053. ix + 96 p.
Delaney, G., E. Tremblay, F. LeBlanc, A. Locke, and G. Atkinson. 1993. Data from the BlackRiver fish counting fence, Kouchibouguac National Park, from 1984 to 1992. Can. Data Rep.Fish. Aquat. Sci. 919: v + 33 p.
Dempson, J.B., L.J. Ledrew, and G. Furey. 1983. Occurrence of American shad (Alosasapidissima) in northern Labrador waters. Nat. can. (Rev. Ecol. Syst.) 110: 217-221.
DFO, 2000. The Effects of Acid Rain on the Atlantic salmon of the Southern Upland of NovaScotia. DFO Maritimes Regional Habitat Status Report 2000/2E. 19 p.
DFO, 2001. Plan de gestion intégrée de la pêche du gaspareau – secteur est du Nouveau-Brunswick Région du Golfe 2001-2006. Pêches et Océans Canada, Région du Golfe Secteur Estdu N.-B. 44 p.
Gabriel, W.L., W.C. Leggett, J.E. Carscadden, and B.D. Glebe. 1976. Origin and characteristicsof “Fall-Run” American shad (Alosa sapidissima) from the Saint John River, New Brunswick. J.Fish. Res. Board Can. 33: 1764-1770.
Hardie, P., R.A. Cunjak, and S. Komadina-Douthwright. 1998. Fish movement in CatamaranBrook, N.B. (1990-1996). Can. Data Rep. Fish. Aquat. Sci. No. 1038. vii + 64 p.
Hayward, J. 2001. Weekly fish counts from in-river traps and barrier pools in the Miramichi River,New Brunswick, 1994 to 1999. Can. Data Rep. Fish. Aquat. Sci. No. 1080. x + 94 p.
Ingram, J.H. 1980. Capture and distribution of Atlantic salmon and other species at MactaquacDam and Hatchery, Saint John River, N.B., 1972-76. Can. Data Rep. Fish. Aquat. Sci. No. 181. ix+ 65 p.
Jessop, B.M. 1975. A review of the American shad (Alosa sapidissima) stocks of the Saint JohnRiver, New Brunswick, with particular reference to the adverse effects of hydroelectricdevelopment. Environment Canada, Fisheries and Marine Service, Resource DevelopmentBranch Tech. Rep. Ser. No. MAR/T-75-6. 23 p.
Johnston, C.E. and M. Morse. 1988. Summer ichthyoplankton communities of two estuarinesystems of Prince Edward Island. Can. J. Zool. 66: 737-745.
Klauda, R.J. 1994. Lethal and critical effects thresholds for American shad eggs and larvaeexposed to acid and aluminum in the laboratory, with speculation on the potential role of habitatacidification on stock status in Maryland. p. 7-39. In Cooper, J.E., R.T. Eades, R.J. Klauda, andJ.G. Loesch [ed.]. 1994. Anadromous Alosa Symposium. Tidewater Chapter, American FisheriesSociety, Bethesda, Maryland.
LeBlanc, C.H. and/et G.J. Chaput. 1991. Landings of estuarine fishes in the Gulf of St. Lawrence1917-1988 / Débarquements de poissons estuariens dans le golfe du Saint-Laurent 1917-1988.Can. Data Rep. Of Fish. Aquat. Sci. / Rapp. Stat. Can. Sci. Halieut. Aquat. No. 842 : 101 p.

19
Leggett, W.C. 1973. The migrations of the shad. Scientific American 228: 92-98.
Leggett,W.C. and J.E. Carscadden. 1978. Latitudinal variation in reproductive characteristics ofAmerican shad (Alosa sapidissima): evidence for population specific life history strategies in fish.J. Fish. Res. Board Can. 35: 1469-1478.
Leim, A.H. 1924. The life history of the shad (Alosa sapidissima (Wilson)) with special referenceto the factors limiting its abundance. Cont. Can. Biology Vol. II. No. 11: 161-284.
Locke, A. and S.C. Courtenay. 1995. Effects of environmental factors on ichthyoplanktoncommunities in the Miramichi estuary, Gulf of St. Lawrence. J. Plank. Res. 17: 333-349.
Martin, J.D. 1984. Atlantic salmon and alewife passage through a pool and weir fishway on theMagaguadavic River, New Brunswick, during 1983. Can. MS Rep. Fish. Aquat. Sci. 1776: iii + 11p.
Melvin, G.D. 1984. The usefulness of meristic and morphometric characteristics in discriminatingpopulations of American shad (Alosa sapidissima) inhabiting Cumberland Basin, New Brunswick.Doctoral dissertation,. University of New Brunswick, Fredericton, Canada. 196 p.
Melvin, G.D. and M.J. Dadswell. 1984. Possible impact of tidal power development on thespawning population of American shad (Alosa sapidissima) in the Annapolis River, Nova Scotia.p. 543-549. In: Update on the Environmental Consequences of Tidal Power in the UpperReaches of the Bay of Fundy. Can. Tech. Rep. Fish. Aquat. Sci., No. 1256.
Melvin, G.D., M.J. Dadswell, and J.D. Martin. 1985. Impact of lowhead hydroelectric tidal powerdevelopment on fisheries. I. A pre-operation study of the spawning population of American shad,Alosa sapidissima (Pisces:Clupeidae), in the Annapolis River, Nova Scotia, Canada. Can. Tech.Rep. Fish. Aquat. Sci. No. 1340: iv + 33 p.
Melvin, G.D., M.J. Dadswell, and J.D. Martin. 1986. Fidelity of American shad, Alosa sapidissima(Clupeidae), to its river of previous spawning. Can. J. Fish. Aquat. Sci. 43:640-646.
Moores, R.B. and E.G.M. Ash. 1984. Fishway and counting fence operations in Newfoundlandand Labrador, 1949-79. Can. Data Rep. Fish. Aquat. Sci. No. 477: v + 123 p.
Murray, A.R. 1968. Numbers of Atlantic salmon and brook trout captured and marked at the LittleCodroy River, Newfoundland, counting fence and auxiliary traps, 1954-63. Fisheries ResearchBoard of Canada Technical Report No. 84. 135 p.
Neves, R.J. and L. Depres. 1979. The oceanic migration of American shad, Alosa sapidissima,along the Atlantic coast. Fish. Bull. 77: 199-212.
O’Neil, S.F. and D.A.B. Swetnam. 1991. Collation of Atlantic salmon sport catch statistics,Maritime Provinces, 1951-1959. Can. Data Rep. Fish. Aquat. Sci. No. 860: ix + 259 p.
Perley, M.H. 1852. Reports on the sea and river fisheries of New Brunswick. Queens Printer,Fredericton, Canada.
Prince, E.E. 1912. The shad fishery of Canada and its restoration. Sea Fisheries of EasternCanada. Commission of Conservation, Canada. p. 120-136.
Robinson, M., G. Klassen, A. Locke, A. Vershoor, E. Tremblay, A. St.Hilaire, and S. Courtenay.1998. A preliminary survey of the early life history of striped bass (Morone saxatilis) in the
20
Kouchibouguac estuary in 1996. Parks Canada - Technical Reports in Ecosystem Science No.012: iii + 36 p.
Robinson, M., S. Courtenay, T. Benfey, and E. Tremblay. 2001. The fish community and use ofthe Kouchibouguac and Richibucto estuaries by striped bass during the spring and summer of1997 and 1998. Parks Canada - Technical Reports in Ecosystem Science No. 032: iv + 83 p.
Scott, W.B. and E.J. Crossman. 1973. Freshwater Fishes of Canada. Fisheries Research Boardof Canada Bulletin 184: xi + 966 p.
Scott, W.B. and M.G. Scott. 1988. Atlantic Fishes of Canada. Can. Bull. Fish. Aquat. Sci. 219:731 p.
Smedbol, R.K., P. A. Shelton, D. P. Swain, A. Fréchet, and G. A. Chouinard. 2002. Review ofpopulation structure, distribution and abundance of cod (Gadus morhua) in Atlantic Canada in aspecies-at-risk context. DFO Can. Sci. Adv. Secr. Res. Doc. 2002/082. 134 p.
Smith, K.E.H. 1979. Capture and distribution of all fish species at Saint John River power dams,New Brunswick, from construction years to 1971. Can. Data Rep. Fish. Aquat. Sci. No. 171. viii +55 p.
Weiss-Glanz, L.S., J.G. Stanley, and J.R. Moring. 1986. Species profiles: life histories andenvironmental requirements of coastal fishes and invertebrates (North Atlantic): American shad.Fish and Wildlife Service, U.S. Dept. of the Interior Biological Report 82 (11.59) TR EL-82-4. 16p.
Wilder, D.G. 1942a. Operation of Petitcodiac and Pollett smolt traps in 1942. Report No. III.Atlantic Salmon and Trout Investigations 1942. Fish. Res. Board of Can. Manus. Rep. of theBiological Stations No. 327: 9 p.
Wilder, D.G. 1942b. Water temperatures and heights, Petitcodiac and Pollett rivers, 1942. ReportNo. IV. Atlantic Salmon and Trout Investigations 1942. Fish. Res. Board of Can. Manus. Rep. ofthe Biological Stations No. 327: 8 p.
Wilder, D.G. 1942c. Traps and shad migration, Petitcodiac river, 1942. Report No. V. AtlanticSalmon and Trout Investigations 1942. Fish. Res. Board of Can. Manus. Rep. of the BiologicalStations No. 327: 4 p.
Williams, R.R.G. and G.R. Daborn. 1984. Spawning of the American shad (Alosa sapidissima) inthe Annapolis River, Nova Scotia. Proc. N.S. Inst. Sci. 34: 9-14.

21
Table IV-1. Commercial and recreational fishery licenses, gears, restrictions by DFOFishery Statistical District (FSD) within the Gulf and Maritimes Region of AtlanticCanada. FSDs are shown in Figure III-1.
Commercial licenses – southern Gulf of St. Lawrence
Gear CountyStatisticaldistrict
Number oflicenses
Number ofgear Gear
restrictionsFixed gill net Kent 75, 76, 77 9 9 Max. 55 fathomFixed gill net Kent 75, 76, 77 1 1 Max 30 fathom
Commercial licensesDistrict Gear 1997 1998 1999 2000 2001 2002
Atlantic coast of Nova Scotia17 Gillnet 1 1 120 Gillnet 1 1 1 1 1 121 Gillnet 5 6 626 Dipnet 2 2 2 2 2 227 Dipnet 5 4 3 3 3 331 Dipnet 1 1 1 132 Gillnet 1 1 1 1 1 133 Gillnet 1 1 1
Bay of Fundy – Nova Scotia40 Gillnet 1 1 1 1 1 141 Gillnet 1 1 1 1 1 142 Gillnet 21 21 20 21 21 22
Not-specified 1 1 1 1 1 143 Gillnet 26 26 27 26 26 2544 Gillnet 5 5 5 5 5 524 Gillnet 8 8 8 8 8 8
Bay of Fundy – New Brunswick81 Gillnet 20 19 19 19 18 18
Not-specified 1 1 1 1 1 179 Gillnet 1 1 1 1 1 157 Gillnet 6 5 5 5 5 556 Gillnet 13 13 13 13 13 1355 Gillnet 11 11 10 10 9 948 Gillnet 39 39 40 39 40 39
Not specified 2 2 2 2 2 249 Gillnet 9 9 8 4 4 553 Gillnet 1 1 1 150 Gillnet 1 1 1 1 1 1
Recreational licensesDistrict Gear 1997 1998 1999 2000 2001 2002
Bay of Fundy – New Brunswick48 Gillnet 2 2 2 1 1 155 Gillnet 1 1 1 1 1 156 Gillnet 13 13 13 13 13 1357 Gillnet 37 34 34 34 34 3458 Gillnet 3 3 3 3 3 3
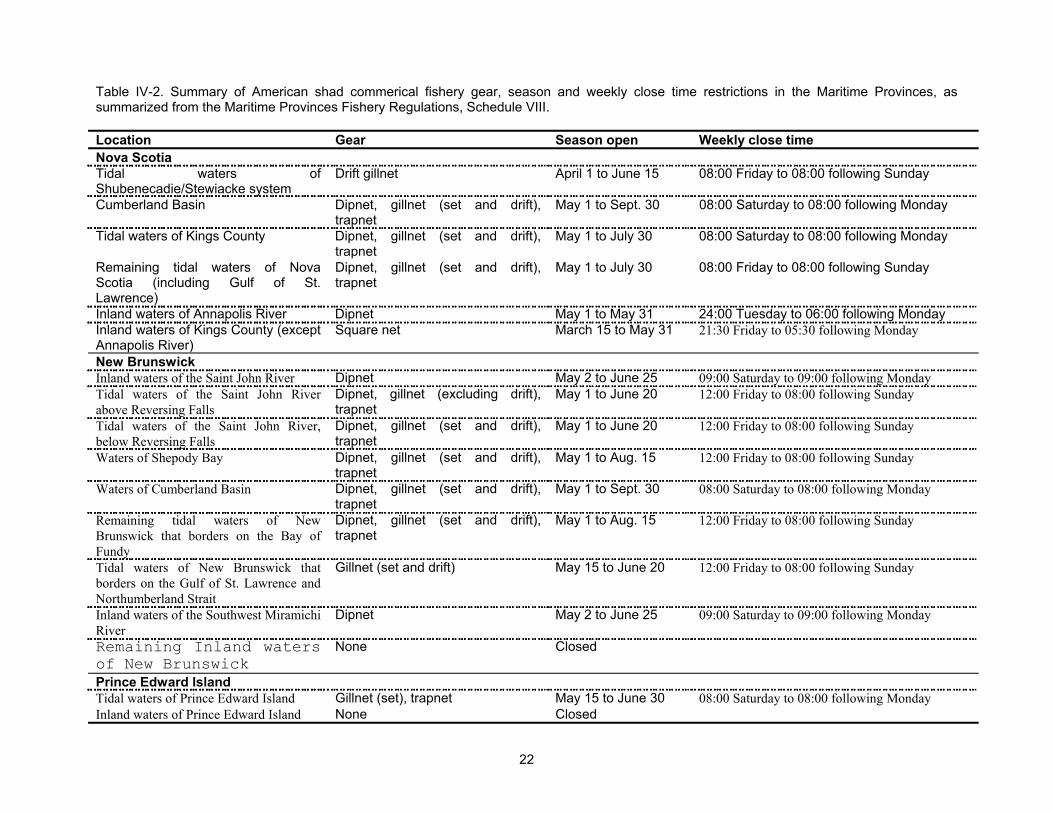
22
Table IV-2. Summary of American shad commerical fishery gear, season and weekly close time restrictions in the Maritime Provinces, assummarized from the Maritime Provinces Fishery Regulations, Schedule VIII.
Location Gear Season open Weekly close timeNova ScotiaTidal waters ofShubenecadie/Stewiacke system
Drift gillnet April 1 to June 15 08:00 Friday to 08:00 following Sunday
Cumberland Basin Dipnet, gillnet (set and drift),trapnet
May 1 to Sept. 30 08:00 Saturday to 08:00 following Monday
Tidal waters of Kings County Dipnet, gillnet (set and drift),trapnet
May 1 to July 30 08:00 Saturday to 08:00 following Monday
Remaining tidal waters of NovaScotia (including Gulf of St.Lawrence)
Dipnet, gillnet (set and drift),trapnet
May 1 to July 30 08:00 Friday to 08:00 following Sunday
Inland waters of Annapolis River Dipnet May 1 to May 31 24:00 Tuesday to 06:00 following MondayInland waters of Kings County (exceptAnnapolis River)
Square net March 15 to May 31 21:30 Friday to 05:30 following Monday
New BrunswickInland waters of the Saint John River Dipnet May 2 to June 25 09:00 Saturday to 09:00 following MondayTidal waters of the Saint John Riverabove Reversing Falls
Dipnet, gillnet (excluding drift),trapnet
May 1 to June 20 12:00 Friday to 08:00 following Sunday
Tidal waters of the Saint John River,below Reversing Falls
Dipnet, gillnet (set and drift),trapnet
May 1 to June 20 12:00 Friday to 08:00 following Sunday
Waters of Shepody Bay Dipnet, gillnet (set and drift),trapnet
May 1 to Aug. 15 12:00 Friday to 08:00 following Sunday
Waters of Cumberland Basin Dipnet, gillnet (set and drift),trapnet
May 1 to Sept. 30 08:00 Saturday to 08:00 following Monday
Remaining tidal waters of NewBrunswick that borders on the Bay ofFundy
Dipnet, gillnet (set and drift),trapnet
May 1 to Aug. 15 12:00 Friday to 08:00 following Sunday
Tidal waters of New Brunswick thatborders on the Gulf of St. Lawrence andNorthumberland Strait
Gillnet (set and drift) May 15 to June 20 12:00 Friday to 08:00 following Sunday
Inland waters of the Southwest MiramichiRiver
Dipnet May 2 to June 25 09:00 Saturday to 09:00 following Monday
Remaining Inland watersof New Brunswick
None Closed
Prince Edward IslandTidal waters of Prince Edward Island Gillnet (set), trapnet May 15 to June 30 08:00 Saturday to 08:00 following MondayInland waters of Prince Edward Island None Closed

23
Table IV-3. Comparison of logbook reported catches of American shad from the gaspereaufishery of the Miramichi River and the reported landings as recorded in the DFO database for thecorresponding area, 1981 to 1994.

24
Table IV-4. Landings (t) of American shad by FSD for the Gulf New Brunswick portion of the Maritime Provinces, 1984 to 2001. Data for1917 to 1983 are available in LeBlanc and Chaput (1991). Data for 1984 to 2001 are from the database of Statistics and EconomicsBranch, Gulf Region, Fisheries and Oceans Canada.
Fishery Statistical District (FSD)
Year 63 65 66 67 68 70 71 72 73 75 76 77 78 80 Total
1984 0.0 0.9 0.0 0.9 1.2 2.0 0.7 5.71985 0.4 7.9 0.0 0.1 8.51986 1.7 7.0 0.1 0.2 9.11987 1.0 13.9 0.2 1.8 0.4 15.1 3.7 36.11988 6.4 6.9 0.1 0.5 1.1 0.9 15.91989 0.3 3.1 0.6 1.8 9.6 15.41990 0.6 0.9 0.0 13.6 0.3 1.4 16.71991 0.1 1.3 0.2 1.61992 0.3 22.0 1.4 23.81993 0.0 0.6 0.1 0.81994 0.1 0.2 0.3 0.0 0.51995 0.1 19.1 2.5 21.71996 0.0 0.01997 0.0 0.4 0.0 0.41998 0.0 0.01999 0.0 3.8 0.3 4.12000 0.0 1.4 1.42001 18.9 0.0 0.0 18.9

25
Table IV-5. Landings (t) of American shad by FSD for the Gulf Nova Scotia portion of the MaritimeProvinces, 1984 to 2001. Data for 1917 to 1983 are available in LeBlanc and Chaput (1991). Data for1984 to 2001 are from the database of Statistics and Economics Branch, Gulf Region, Fisheries andOceans Canada.
Fishery Statistical District (FSD)Year 2 3 10 11 12 13 45 46 Total1984 1.2 1.21985198619871988 0.4 0.41989 0.2 0.2199019911992199319941995199619971998 0.0 0.0199920002001

26
Table IV-6. Landings (t) of American shad by FSD for Prince Edward Island (Gulf Region of the MaritimeProvinces), 1984 to 2001. Data for 1917 to 1983 are available in LeBlanc and Chaput (1991). Data for1984 to 2001 are from the database of Statistics and Economics Branch, Gulf Region, Fisheries andOceans Canada.
Fishery Statistical District (FSD)Year 82 92 93 95 88 Total19841985 0.1 0.119861987 1.7 1.719881989 0.5 0.519901991 34.4 6.1 40.51992 16.3 0.8 17.11993 0.0 0.0 0.01994 0.2 0.1 0.31995 0.0 0.019961997199819992000 0.0 0.02001

27
Table IV-7. Landings (t) of American shad by FSD for the Bay of Fundy portion of New Brunswick, 1984to 2000. Data for 1984 to 2000 are from the database of Statistics and Economics Branch, MaritimesRegion, Fisheries and Oceans Canada. Inshore refers to landings from rivers and estuaries. Offshorerefers to landings from coastal or marine fisheries.

28
Table IV-8. Landings (t) of American shad by FSD from the Atlantic coast of Nova Scotia (FSDs 1 to 36 in Maritimes Region of DFO), 1984 to2000. are from the database of Statistics and Economics Branch, Maritimes Region, Fisheries and Oceans Canada. Inshore refers to landingsfrom rivers and estuaries. Offshore refers to landings from coastal or marine fisheries.
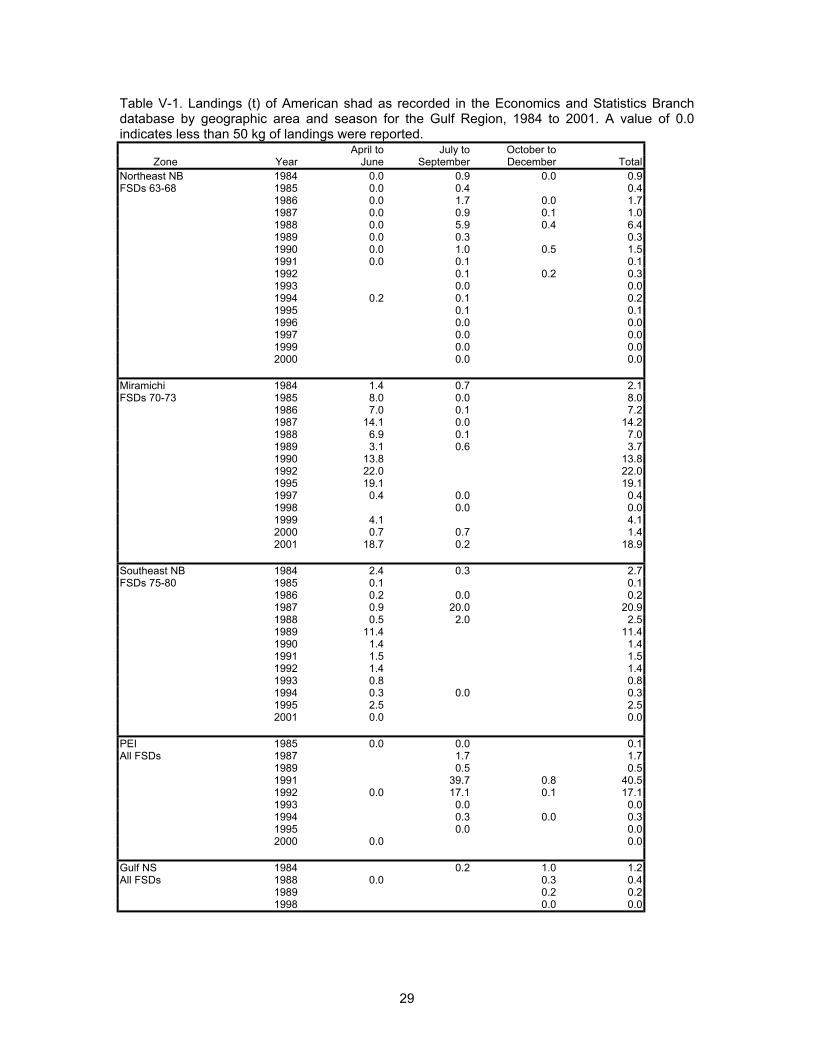
29
Table V-1. Landings (t) of American shad as recorded in the Economics and Statistics Branchdatabase by geographic area and season for the Gulf Region, 1984 to 2001. A value of 0.0indicates less than 50 kg of landings were reported.
April to July to October toZone Year June September December Total
Northeast NB 1984 0.0 0.9 0.0 0.9FSDs 63-68 1985 0.0 0.4 0.4
1986 0.0 1.7 0.0 1.71987 0.0 0.9 0.1 1.01988 0.0 5.9 0.4 6.41989 0.0 0.3 0.31990 0.0 1.0 0.5 1.51991 0.0 0.1 0.11992 0.1 0.2 0.31993 0.0 0.01994 0.2 0.1 0.21995 0.1 0.11996 0.0 0.01997 0.0 0.01999 0.0 0.02000 0.0 0.0
Miramichi 1984 1.4 0.7 2.1FSDs 70-73 1985 8.0 0.0 8.0
1986 7.0 0.1 7.21987 14.1 0.0 14.21988 6.9 0.1 7.01989 3.1 0.6 3.71990 13.8 13.81992 22.0 22.01995 19.1 19.11997 0.4 0.0 0.41998 0.0 0.01999 4.1 4.12000 0.7 0.7 1.42001 18.7 0.2 18.9
Southeast NB 1984 2.4 0.3 2.7FSDs 75-80 1985 0.1 0.1
1986 0.2 0.0 0.21987 0.9 20.0 20.91988 0.5 2.0 2.51989 11.4 11.41990 1.4 1.41991 1.5 1.51992 1.4 1.41993 0.8 0.81994 0.3 0.0 0.31995 2.5 2.52001 0.0 0.0
PEI 1985 0.0 0.0 0.1All FSDs 1987 1.7 1.7
1989 0.5 0.51991 39.7 0.8 40.51992 0.0 17.1 0.1 17.11993 0.0 0.01994 0.3 0.0 0.31995 0.0 0.02000 0.0 0.0
Gulf NS 1984 0.2 1.0 1.2All FSDs 1988 0.0 0.3 0.4
1989 0.2 0.21998 0.0 0.0

30
Table V-2. Timing of the coastal and river fisheries on American shad from the Bay of Fundy andAtlantic coast of Nova Scotia as inferred from logbook reports. Landings (t) in the table are thevalues for the returned logbooks, are totals for the years 1995 to 2001, and do not represent theentire landings for the districts.

31
Table V-3. Rivers and estuaries (Fig. V-6) with facilities for monitoring American shad and those facilities where American shad have beenobserved and reference for observations. N means not recorded from this facility, Rare means generally less than 20 individuals seen on average,annually, Y means common or very abundant at this facility. ? means unconfirmed. For environment: FW means freshwater, TidalFW meansfreshwater within tidal influence, TidalEst means brackish water within tidal influence, Est means estuary, Coastal means outside an estuary.1 facility not operating during spring and summerRiver Name Gear Present
[A]Spawning[B]
GaspereauPresent [C]
Environment Dates shad present Reference
Gulf New BrunswickChaleur Bay(Dalhousie)
Trapnet Y ? Y Coastal May to September A, C – DFO Unpubl. data
Restigouche Trapnet Rare ? Y TidalFW June 26 – July 3 A, C - Claytor 1996Nepisiguit Counting fence N FWTabusintac Trapnet ? 1 ? Y TidalFW A, C - Claytor 1996Napan Trapnet Y ? Y TidalEst May-June Commercial logbookSouthwest Miramichi Trapnet Y Y Y TidalEst A, C - Claytor 1996; Hayward
2001Bartholomew Fence N Y FW A, C - Claytor 1996Northwest Miramichi Trapnet
IchthyoplanktonY Y Y TidalEst May-July A, C - Claytor 1996; Hayward
2001B – Locke and Courtenay 1995
Northwest Miramichi Fence N Y FW A, C – Curventon DFO Unpubl.Data
Little SW Miramichi Rotary screwtrap
Rare ? Y FW June A, C - DFO Unpubl. Data
Catamaran Brook Fence N Rare FW A, C - Hardie et al. 1998Black Fence N Y TidalFW A, C - Delaney et al. 1993Kouchibouguac Ichthyoplankton ? N B – Bernier et al. 1998; Robinson
et al. 1998, 2001Richibucto Trapnet,
Ichthyoplankton? 1 N Y TidalEst A, C - Claytor 1996;
B – Robinson et al. 2001Buctouche Trapnet ? 1 ? Y TidalEst A, C - Claytor 1996

32
Table V-3 (continued).
River Name Gear Present[A]
Spawning[B]
GaspereauPresent [C]
Environment)
Dates shad present Reference
Gulf Nova ScotiaSouth Fence N Y FW A, C - Claytor 1996Margaree Trapnet Rare ? Y TidalFW June – Aug., Oct. A, C – Claytor 1996Southwest Margaree Traps Rare? ? Y FW Commercial gaspereau fishery
reportsLake O’Law Bk Fence N Y FW A, C – Davidson et al. 1995
PEIMorell Fishway N Y FW A, C - Claytor 1996Hillsborough Ichthyoplankton ? N Y FW, TidalFW, Est B – Johnston and Morse 1988Winter (Tracadie Bay) Ichthyoplankton ? N Y Est B – Johnston and Morse 1988
Bay of FundyMagaguadavic Fishway N Y FW A, C - Martin 1984Saint John
Mactaquac Fishway Y ? Y FW May - July A, C - Smith 1979;Beechwood Fishway Y ? Y FW June – Aug. A, C - Smith 1979
Nashwaak Fence Rare ? FW R. Jones, DFO Unpubl. dataBig Salmon Fence N FW DFO Unpubl. dataPetitcodiac Fence Y Y Y FW May - June A, B, C - Wilder 1942(a, b, c)Tantramar Adult sampling Y ? FW Melvin 1984Maccan/Nappan Adult sampling
AnecdotalY ? Melvin 1984
River Hebert Adult samplingAnecdotal
Y ? Melvin 1984
Shubenacadie Fisheries,TrapnetIchthyoplankton
Y Y Y TidalEst DFO Unpubl. data
Stewiacke Fence, TrapnetIchthyoplankton
Y Y Y FW DFO Unpubl. data

33
Table V-3 (Continued).
River Name Gear Present[A]
Spawning[B]
GaspereauPresent [C]
Environment)
Dates shad present Reference
Bay of FundyKennetcook Fisheries Y ? Local knowledgeGaspereau Fishway Rare N Y FW DFO Unpubl. dataAnnapolis Nets,
IchthyoplanktonY Y Y FW, TidalFW May - June A, B, C – Williams and Daborn
1984;Melvin et al. 1985
Atlantic Coast NovaScotiaLaHave (MorgansFalls)
Fishway Rare FW A – DFO Unpubl data
Musquodoboit Fisheries Y ? FW, TidalFW Local knowledgeEast River (SheetHarbour)
Fishway N FW A – DFO Unpubl data
St. Mary’s Fisheries Y ? Local knowledgeGrand Fishway N N A – DFO Unpubl dataMira Fisheries,
anecdotalY ? Local knowledge
InsularNewfoundlandLittle Codroy Fence N N FW A, C – Murray 1968; Moores and
Ash 1984Highlands Fence N FW A – Dempson et al. 1983Fischells Fence N FW A – DFO Unpubl. dataHarrys (Pinchgut) Fence N N FW A – DFO Unpubl. dataHughes Fence N Rare FW A, C – C. Mullins, DFO Unpubl.
dataHumber Trapnet Rare ? Rare TidalEst August A, C – C. Mullins, DFO Unpubl.
data

34
Table V-3 Contiued.
River Name Gear Present[A]
Spawning[B]
GaspereauPresent [C]
Environment)
Dates shad present Reference
InsularNewfoundlandLomond Fishway N N FW A, C – C. Mullins, DFO Unpubl.
data; Moores and Ash 1984Torrent Fishway N N FW A, C – C. Mullins, DFO Unpubl.
data; Moores and Ash 1984Western Arm Brook Fence Rare ? N FW June A, C – Moores and Ash 1984;
Chadwick et al. 1985; C. Mullins,DFO Unpubl. data
LaPoile Fence Rare FW A, - M. O’ConnellDFO Unpubl. data
White Bear Fence N N FW A, C – Moores and Ash 1984Salmon Fishway N N FW A, C – Moores and Ash 1984Conne Fence Rare FW A, C – B. Dempson,
DFO Unpubl. dataLong Harbour Fyke net N N FW A, C – Moores and Ash 1984Come by Chance Fence N N FW A, C – Moores and Ash 1984Northeast (Placentia) Fishway N N FW A, C – Moores and Ash 1984Colinet Fence Rare FW A - M. O’Connell
DFO Unpubl. dataBiscay Bay Fence Rare FW A - M. O’Connell
DFO Unpubl. dataTerra Nova Fishway (lower) N N FW A, C – Moores and Ash 1984Middle Brook Fishway N N FW A, C – Moores and Ash 1984Salmon Brook Fishway N N FW A, C – Moores and Ash 1984Gander Fence Rare FW A - M. O’Connell
DFO Unpubl. dataExploits (Bishop’sFalls)
Fishway N N FW A, C – Moores and Ash 1984
Indian Brook Fishway N N FW A, C – Moores and Ash 1984Salmon Fence N N FW A, C - Moores and Ash 1984

35
Table V-3 Contiued.
River Name Gear Present[A]
Spawning[B]
GaspereauPresent [C]
Environment)
Dates shad present Reference
LabradorForteau Fishway N FW A - C. Mullins, DFO Unpubl. dataPinware Trapnet N TidalEst A - C. Mullins, DFO Unpubl. dataSt. Charles Fence N Rare FW A, C - Moores and Ash 1984Sand Hillo Fence Rare ? Rare FW ? A, C - Moores and Ash 1984Paradise Trapnet Rare ? TidalEst A - D. Reddin, DFO Unpubl. dataBig Brook Fence N FW A - D. Reddin, DFO Unpubl. dataEnglish Fence N FW A - D. Reddin, DFO Unpubl. dataDouble Brook Fence N FW A - Dempson et al. 1983Fraser Fence N FW A - Dempson et al. 1983Ikarut Fence N FW A - Dempson et al. 1983

36
Table V-4. Observations of American shad at counting facilities in Newfoundland and Labrador,1971 to 2000. Data from M. O’Connell and B. Dempson, DFO, White Hills, St. John’s,Newfoundland.

37
Table V-5. Timing of observations of American shad at counting facilities in Newfoundland andLabrador, 1971 to 2000. Data from M. O’Connell and B. Dempson, DFO, White Hills, St. John’s,Newfoundland.

38
Table V-6. Number of American shad reported from counting facilities in Gulf Region estuaries. Trapnet abbreviations for the Miramichi are fromHayward (2001).

39
Table V-7. Number and timing of catches of American shad from tidal water trapnets in the MargareeRiver, Gulf Nova Scotia.

40
Table V-8. Annual counts of American shad and median date of the count at the hydro-electric fishtrapping facilities in the Saint John River, 1957 to 2002. Data for 1957 to 1976 are from Smith (1979) andIngram (1980). Data for Mactaquac for 1977 to 2002 are DFO (Unpubl. data. R. Jones). The Beechwoodfacility is located about 153 km above the head of tide and was completed in 1957-58. The Mactaquacdam, constructed approx. 2 km above the head of tide, was completed in 1967.Annual counts of shad at Saint John River facilities
Beechwood MactaquacYear Count Count Median date1957 01958 551959 1,1551960 1,4901961 2511962 2091963 431964 1031965 1391966 1991967 01968 0 38,8381969 17 37,4491970 9 36,4371971 16 15,2941972 1,4971973 7,3631974 4321975 5491976 4581977 154 Jul-021978 142 Jun-301979 185 Jun-251980 562 Jun-141981 534 Jun-101982 20 Jul-241983 242 Jun-081984 246 Jun-201985 155 Jun-021986 466 Aug-041987 43 Jul-211988 69 Jul-281989 476 Jun-281990 367 Jun-021991 836 Jun-131992 691 Jul-091993 61 Jun-211994 110 Jun-301995 175 Jun-261996 1,465 Jun-241997 01998 102 Jun-191999 263 Jun-222000 573 Jun-222001 19 May-232002 39 Jul-02

41
Table VII-1. Status summary of known and suspected American shad spawning runs in the Maritime Provinces.

42
Figure III-1. Fishery Statistical Districts (FSD) used to collate the landings of American shad in theMaritimes provinces. Descriptions of the statistical districts are summarized in O’Neil and Swetnam(1991).

43
Figure IV-1. American shad landings (t) from Canada, Québec and Gulf Region of the MaritimeProvinces, 1917 to 2001. Data for 1917 to 1983 are from LeBlanc and Chaput (1991). Data for 1984 to2001 are from the database of Statistics and Economics Branch, Gulf Region, Fisheries and OceansCanada.

44
Figure IV-2. American shad landings (t) from the Gulf New Brunswick fishery statistical districts. Data for1917 to 1983 are from LeBlanc and Chaput (1991). Data for 1984 to 2001 are from the database ofStatistics and Economics Branch, Gulf Region, Fisheries and Oceans Canada.

45
Figure IV-3. Reported landings (t) of American shad from the Bay of Fundy, Atlantic coast of Nova Scotia,and the Gulf of St. Lawrence fisheries, 1985 to 2001.

46
Figure IV-4. Number of gaspereau trapnet licenses in the Miramichi River fishery (FSDs 71, 72) (lowerpanel) and relationship between landings of shad reported from FSDs 71 and 72 relative to the number oftrapnet licenses in those FSDs. Annual license information from Alexander and Vromans (1988).

47
Figure V-1. Catches of American shad from the summer DFO research vessel surveys. Data are for allyears combined.

48
Figure V-2. Catches of American shad in winter Scotian Shelf DFO surveys. Data are for all yearscombined.

49
Figure V-3. Catches of American shad in the winter Georges Bank DFO surveys. Data are for all yearscombined.

50
Figure V-4. American shad catches as recorded in the observer data base for January to March, 1999.
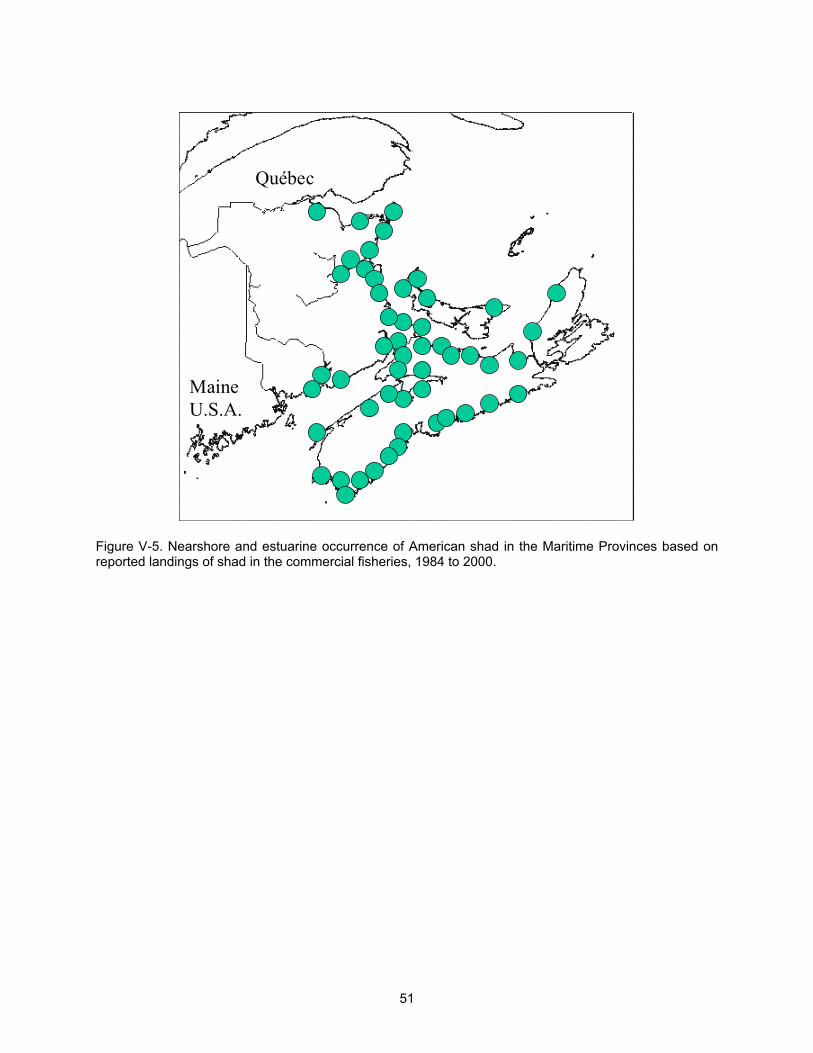
51
Québec
MaineU.S.A.
Figure V-5. Nearshore and estuarine occurrence of American shad in the Maritime Provinces based onreported landings of shad in the commercial fisheries, 1984 to 2000.

52
Counting Facilities
Other methods
Shad PresentY N
Counting Facilities
Shad PresentY N
Figure V-6. Fresh water and tidal water occurrence of American shad at counting facilities operated by orassociated with DFO monitoring projects and based on information from other sources. Facilities whichwere not operating during the season when shad would be expected in freshwater (May to August) arenot shown (Table V-3). The other methods include ichthyoplankton surveys, fisheries and specialcollections.

53
Figure V-7. Run-timing of American shad to the Miramichi River based on catches at the Millbank trapnet(upper panel), and in the Northwest Miramichi (middle panel) and the Southwest Miramichi rivers (lowerpanel). Shad migrate into the Miramichi at the same time as gaspereau (alewife and blueback herring).

54
Figure V-8. Run-timing of American shad based on catches at the Dalhouise (New Brunswick) coastaltrapnet in Chaleur Bay, 1972 to 1980.

55
Figure V-9. Locations within the Saint John River where American shad spawning runs are inferred tooccur based on catches in commercial fisheries.

56
Figure VI-1. Fork length distributions of opportunistically sampled American shad from estuarine indextrapnets from the Miramichi River, 1994 to 2001. All shad measured (upper panel), male shad (middlepanel) and female shad (lower panel). Sex was determined based on extrusion of gonadal products onlive fish and therefore represent fish in a spawning state.
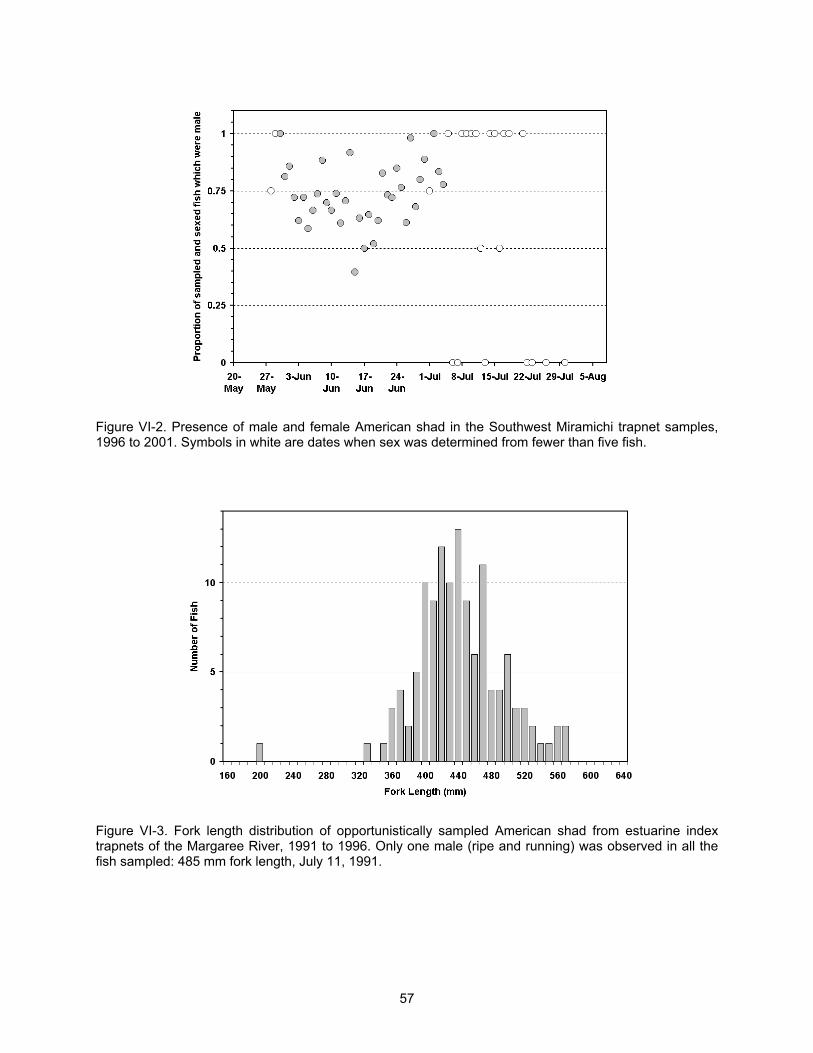
57
Figure VI-2. Presence of male and female American shad in the Southwest Miramichi trapnet samples,1996 to 2001. Symbols in white are dates when sex was determined from fewer than five fish.
Figure VI-3. Fork length distribution of opportunistically sampled American shad from estuarine indextrapnets of the Margaree River, 1991 to 1996. Only one male (ripe and running) was observed in all thefish sampled: 485 mm fork length, July 11, 1991.

58
Extant spawning runs:Northwest Miramichi (1)Southwest Miramichi (2)Saint John: Grand Lake (30)
Washademoak (27)Kennebecasis (28)Hammond (29)
Shubenacadie (18)Stewiacke (19)Annapolis (12)
������������������������������������������������������������
������������������
����������������
����������������
����������������
����������������
������������������
������������������������ ��������
��������Extirpated spawning runs:St. Croix (31)Saint John (above Mactaquac) (26)Petitcodiac (25)
������������������������������������������������������������
��������������������
������������������������������
������������������������������
Status unconfirmed:Richibucto (3), River Philip (4)Mira (5), St. Mary’s (6), Musquodoboit (7),LaHave (8), Mersey (9), Medway (10),Tusket (11), Nictaux (13), Cornwallis (14),Avon (15), St. Croix (16), Kennetcook (17),Hebert (20), Maccan (21), Nappan (22),La Planche (23), Tantramar (24)
������������������������������������������������������������
���������������������������
������������������������
����������������
�������������������������
���������
���������������� ���������
������������������
���������������������������
����������������
������������������
����������������
������������������
����������������������������������������
����������������
����������������
����������������
������������������������
1
2
3027
28
29
3
25
5
26
31
1213
11
10 9
8
67
19
1814
15
17
16
4
20 to 24
Figure VI-4. Summary of status of American shad spawning runs in rivers of the Maritime provinces.

59
Figure VI-5. Run-timing of American shad at the hydro-electric trapping facilities in the Saint John River.Counts of American shad at Beechwood ceased in 1971 after construction of the downstream MactaquacDam.

60
0 10
kilometers20
upstream limits of shad spawning
Grand Lake
Stewiacke
Shubenacadie
Minas Basin
Figure VI-6. Limits of observed spawning of American shad within the Shubenacadie/Stewiacke Riversystem.

61
Figure VII-1. Counts of American shad at the index trapnets in the Miramichi River, 1970 to 2001.
62
Appendix I. American shad observations in marine waters as recorded in the observer database forNewfoundland. Information were provided by Joe Firth, DFO Newfoundland Region.
From the Observer database from 1978 to 2002 (all data for 2002 not reviewed).
The search showed catches of American Shad for 1980, 1994 and 2002.
YEAR MONTH DAY TRIP SET NAFO LAT LONG DEPTH GEAR KEPT DISCARD2002 6 4 199 8 3PS 4734 5719 176 5 2 .
The species name recorded on the Set and catch sheet agrees with the data in the database. TheObserver recorded American Shad on the set and catch.
The records for 1994 were confirmed as errors.
The review of the database showed twenty three records of American Shad for 1980. These recordsoccurred on two trips, Trip 31 and 207. I have reservations concerning these records and would like tosee if we still have the original data sheets to confirm that it is not a coding error. All records except forone show discarded weights with amounts ranging from 5 kgs to 906 kgs. That is a lot of American Shad.I would like to have the opportunity to confirm these records if possible.

63
Appendix II. Research survey and fishery observer catches of American shad from the Gulf ofSt. Lawrence.
Research surveys conducted in the southern Gulf andfishery observer reports of American shad catches from the Gulf of St. Lawrence.
by
Hugues BenoitOceans and Science Branch
Dept. of Fisheries and OceansP.O. Box 5030Moncton, NB
E1C 9B6
September bottom-trawl survey methods
Bottom-trawl surveys of the southern Gulf of St. Lawrence have been conducted eachSeptember since 1971. Surveys have followed a stratified random design, with stratificationbased on depth and geographic area. The target fishing procedure in all years was a 30-mintow at 3.5 knots. The number of tows conducted each year varied between 64-70 tows in the1971-1980 period and over 200 tows in recent years. The distribution of tows is shown for each4-yr block between 1971 and 2002 in Appendix Figure II-1. Further details are given by Hurlbutand Clay (1990).
Fishing in the September survey was by the E.E.Prince using a Yankee-36 trawl from 1971-1985, by the Lady Hammond using a Western IIA trawl from 1985-1991, and by the AlfredNeedler using a Western IIA trawl since 1992. Fishing was restricted to daylight hours (07:00-19:00) in 1971-1984 but conducted 24-hr per day since 1985. Adjustments for differences incatchability between vessels or gears or for differences in catchability between day and nightcannot be reliably estimated for American shad in the Southern Gulf due to lack of data.Consequently the catches of American shad are summarized in 4-yr blocks, standardized to a1.75 nautical mile standard tow (Appendix Figure II-2). Bubble sizes in Appendix Figure II-2 arethe 10, 25, 50, 75 and 90th percentiles based on non-zero catches.
Other research surveys were conducted at different times of the year (Appendix Table II-1, II-3).The protocols for these sruveys were similar to those of the annual September survey.Additional details on the Southeastern Gulf seasonal surveys are provided by Clay (1991).During the seasonal surveys, shad were captured in 2 of 582 sets.
Juvenile cod surveys were run annually in July and August during 1990 to 1995. The surveyarea was concentrated in the Shediac Valley (NB), a principal cod nursery area (Hanson 1996).An average of 44 stations were sampled each year (range 34-54 stations). Although fourdifferent vessels were used over the years, the same trawling gear was used. Details of thesurveys are provided in Sinclair et al. (1995) and Hanson (1996). In the more than 260 setsmade from 1990 to 1995, American shad was observed once: July 4, 1993, (Lat. 46 45 Long 6432 ).
More recently, juvenile shad have been captured in Northumberland Strait during a fall lobstertrawl survey in 2002 (Appendix Table II-4). A total of 850 shad were captured in 56 of 99 sets, in

64
depths ranging between 3 m and 30. The largest single catch was 125 individuals and 70% ofthe sets with shad had ten or fewer individuals. All the shad were juveniles. Surveys in the sameareas in the summer of 2001 and 2002 captured one adult shad in each survey (Mark Hanson,DFO Gulf Region, pers. Comm.).
References
Clay, D. 1991. Seasonal distribution of demersal fish (Osteichthyes) and skates(Chrondrichthyes) in the southeastern Gulf of St. Lawrence, p. 241 – 259. In J.-C. Therriault[ed.] The Gulf of St. Lawrence: small ocean or big estuary? Can. Spec. Publ. Fish. Aquat. Sci.113.
Hanson, J.M. 1996. Seasonal distribution of juvenile Atlantic cod in the southern Gulf of St.Laurence. J. Fish Biol. 49:1138-1152.
Hurlbut, T. and D. Clay. 1990. Protocols for Research Vessel Cruises within the Gulf Region(Demersal Fish) (1970 - 1987). Can. MS Rep. Fish. Aquat. Sci. No. 2082:143 p.
Sinclair, A. F., G. Chouinard, D. Swain, G. Nielsen, M. Hanson, L. Currie, T. Hurlbut, and R.Hébert. 1995. Assessment of the southern Gulf of St. Lawrence cod stock, March 1995. DFOAtl. Fish. Res. Doc. 95/39: 84 p.

65
Appendix Table II-1. Catches of American shad in the research groundfish surveys of the southern Gulf of St. Lawrence.

66
Appendix Table II-2. Length frequency distributions of catches of shad by research trip and set in the annual September groundfishsurvey in the southern Gulf of St. Lawrence.

67
Appendix Table II-3. Timing and location of seasonal surveys conducted in the Southern Gulf ofSt. Lawrence at times other than the standard September surveys, including number of setsfished and number of sets in which American shad were captured. Survey protocols and gearwere identical to the standard bottom-trawl surveys.
Surveyabbreviation
Dates Area surveyed1 Number ofbottom-trawl
sets
Sets withAmerican
shadH166 Dec. 04-09, 1986 S.E. Gulf 34 0N073 Jan. 07-10, 1987 S.E. Gulf 23 0H172 May 19-24,1987 S.E. Gulf 43 1H174 June 17-22, 1987 S.E. Gulf 48 0H209 Dec. 01-07, 1989 S.W. Gulf 24 1H215 Jun. 29-Jul. 6, 1990 S.W. and S.C. Gulf 70 0H223 Nov. 20-28, 1990 S.W. and S.C. Gulf 79 0N151 Apr. 18-28, 1991 S.W. and S.C. Gulf 85 0H245 / N176 Aug. 01-08, 1992 S.W. and S.C. Gulf 68 /
660
1 S.E. (Southeastern Gulf), S.W. (Southwestern Gulf), S.C. (South-central Gulf)
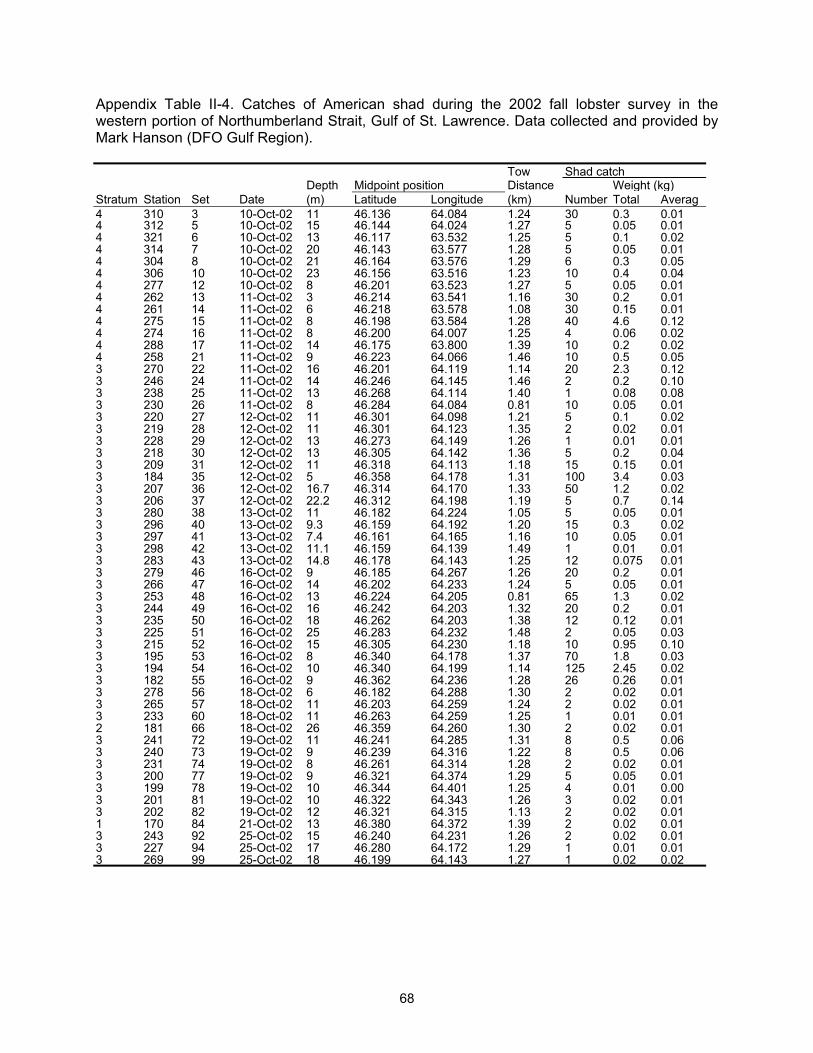
68
Appendix Table II-4. Catches of American shad during the 2002 fall lobster survey in thewestern portion of Northumberland Strait, Gulf of St. Lawrence. Data collected and provided byMark Hanson (DFO Gulf Region).
Tow Shad catchDepth Midpoint position Distance Weight (kg)
Stratum Station Set Date (m) Latitude Longitude (km) Number Total Averag4 310 3 10-Oct-02 11 46.136 64.084 1.24 30 0.3 0.014 312 5 10-Oct-02 15 46.144 64.024 1.27 5 0.05 0.014 321 6 10-Oct-02 13 46.117 63.532 1.25 5 0.1 0.024 314 7 10-Oct-02 20 46.143 63.577 1.28 5 0.05 0.014 304 8 10-Oct-02 21 46.164 63.576 1.29 6 0.3 0.054 306 10 10-Oct-02 23 46.156 63.516 1.23 10 0.4 0.044 277 12 10-Oct-02 8 46.201 63.523 1.27 5 0.05 0.014 262 13 11-Oct-02 3 46.214 63.541 1.16 30 0.2 0.014 261 14 11-Oct-02 6 46.218 63.578 1.08 30 0.15 0.014 275 15 11-Oct-02 8 46.198 63.584 1.28 40 4.6 0.124 274 16 11-Oct-02 8 46.200 64.007 1.25 4 0.06 0.024 288 17 11-Oct-02 14 46.175 63.800 1.39 10 0.2 0.024 258 21 11-Oct-02 9 46.223 64.066 1.46 10 0.5 0.053 270 22 11-Oct-02 16 46.201 64.119 1.14 20 2.3 0.123 246 24 11-Oct-02 14 46.246 64.145 1.46 2 0.2 0.103 238 25 11-Oct-02 13 46.268 64.114 1.40 1 0.08 0.083 230 26 11-Oct-02 8 46.284 64.084 0.81 10 0.05 0.013 220 27 12-Oct-02 11 46.301 64.098 1.21 5 0.1 0.023 219 28 12-Oct-02 11 46.301 64.123 1.35 2 0.02 0.013 228 29 12-Oct-02 13 46.273 64.149 1.26 1 0.01 0.013 218 30 12-Oct-02 13 46.305 64.142 1.36 5 0.2 0.043 209 31 12-Oct-02 11 46.318 64.113 1.18 15 0.15 0.013 184 35 12-Oct-02 5 46.358 64.178 1.31 100 3.4 0.033 207 36 12-Oct-02 16.7 46.314 64.170 1.33 50 1.2 0.023 206 37 12-Oct-02 22.2 46.312 64.198 1.19 5 0.7 0.143 280 38 13-Oct-02 11 46.182 64.224 1.05 5 0.05 0.013 296 40 13-Oct-02 9.3 46.159 64.192 1.20 15 0.3 0.023 297 41 13-Oct-02 7.4 46.161 64.165 1.16 10 0.05 0.013 298 42 13-Oct-02 11.1 46.159 64.139 1.49 1 0.01 0.013 283 43 13-Oct-02 14.8 46.178 64.143 1.25 12 0.075 0.013 279 46 16-Oct-02 9 46.185 64.267 1.26 20 0.2 0.013 266 47 16-Oct-02 14 46.202 64.233 1.24 5 0.05 0.013 253 48 16-Oct-02 13 46.224 64.205 0.81 65 1.3 0.023 244 49 16-Oct-02 16 46.242 64.203 1.32 20 0.2 0.013 235 50 16-Oct-02 18 46.262 64.203 1.38 12 0.12 0.013 225 51 16-Oct-02 25 46.283 64.232 1.48 2 0.05 0.033 215 52 16-Oct-02 15 46.305 64.230 1.18 10 0.95 0.103 195 53 16-Oct-02 8 46.340 64.178 1.37 70 1.8 0.033 194 54 16-Oct-02 10 46.340 64.199 1.14 125 2.45 0.023 182 55 16-Oct-02 9 46.362 64.236 1.28 26 0.26 0.013 278 56 18-Oct-02 6 46.182 64.288 1.30 2 0.02 0.013 265 57 18-Oct-02 11 46.203 64.259 1.24 2 0.02 0.013 233 60 18-Oct-02 11 46.263 64.259 1.25 1 0.01 0.012 181 66 18-Oct-02 26 46.359 64.260 1.30 2 0.02 0.013 241 72 19-Oct-02 11 46.241 64.285 1.31 8 0.5 0.063 240 73 19-Oct-02 9 46.239 64.316 1.22 8 0.5 0.063 231 74 19-Oct-02 8 46.261 64.314 1.28 2 0.02 0.013 200 77 19-Oct-02 9 46.321 64.374 1.29 5 0.05 0.013 199 78 19-Oct-02 10 46.344 64.401 1.25 4 0.01 0.003 201 81 19-Oct-02 10 46.322 64.343 1.26 3 0.02 0.013 202 82 19-Oct-02 12 46.321 64.315 1.13 2 0.02 0.011 170 84 21-Oct-02 13 46.380 64.372 1.39 2 0.02 0.013 243 92 25-Oct-02 15 46.240 64.231 1.26 2 0.02 0.013 227 94 25-Oct-02 17 46.280 64.172 1.29 1 0.01 0.013 269 99 25-Oct-02 18 46.199 64.143 1.27 1 0.02 0.02

69
Appendix Table II-5. Fishery observer reports of American shad in the fisheries of the Gulf of St.Lawrence, 1995 to 2001.
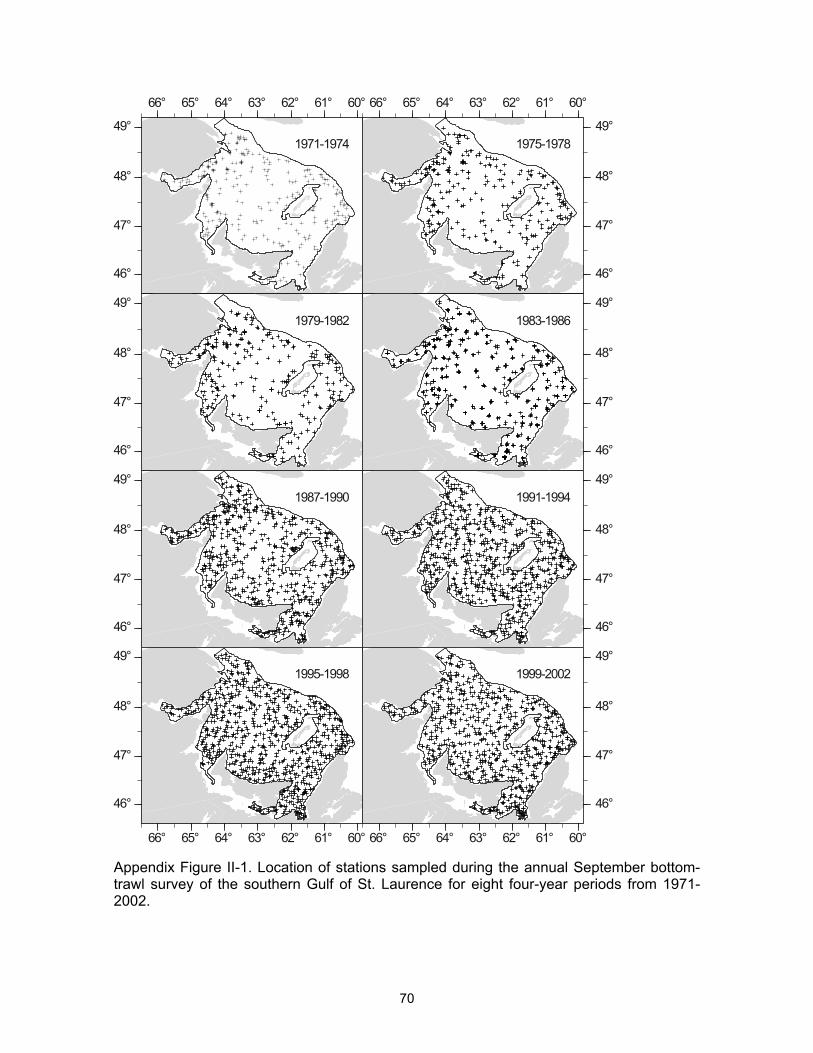
70
1971-1974
46°
47°
48°
49°
66° 65° 64° 63° 62° 61° 60°
1975-1978
46°
47°
48°
49°
66° 65° 64° 63° 62° 61° 60°
1979-1982
46°
47°
48°
49°1983-1986
46°
47°
48°
49°
1987-1990
46°
47°
48°
49°1991-1994
46°
47°
48°
49°
1995-1998
66° 65° 64° 63° 62° 61° 60°
46°
47°
48°
49°1999-2002
66° 65° 64° 63° 62° 61° 60°
46°
47°
48°
49°
Appendix Figure II-1. Location of stations sampled during the annual September bottom-trawl survey of the southern Gulf of St. Laurence for eight four-year periods from 1971-2002.

71
1971-1974
46°
47°
48°
49°
66° 65° 64° 63° 62° 61° 60°
1975-1978
46°
47°
48°
49°
66° 65° 64° 63° 62° 61° 60°
1979-1982
46°
47°
48°
49°1983-1986
46°
47°
48°
49°
1987-1990
46°
47°
48°
49°1991-1994
46°
47°
48°
49°
1995-1998
66° 65° 64° 63° 62° 61° 60°
46°
47°
48°
49°1999-2002
66° 65° 64° 63° 62° 61° 60°
46°
47°
48°
49°
0.911.22.27.8+
Number/Townombres/trait
Appendix Figure II-2. Distribution of catches (number/standard tow) of American shad inthe Southern Gulf of St. Lawrence September surveys.