C RESULTS: SNR of visual gamma oscillations Robust visual gamma responses were observed in 18 of the...
3
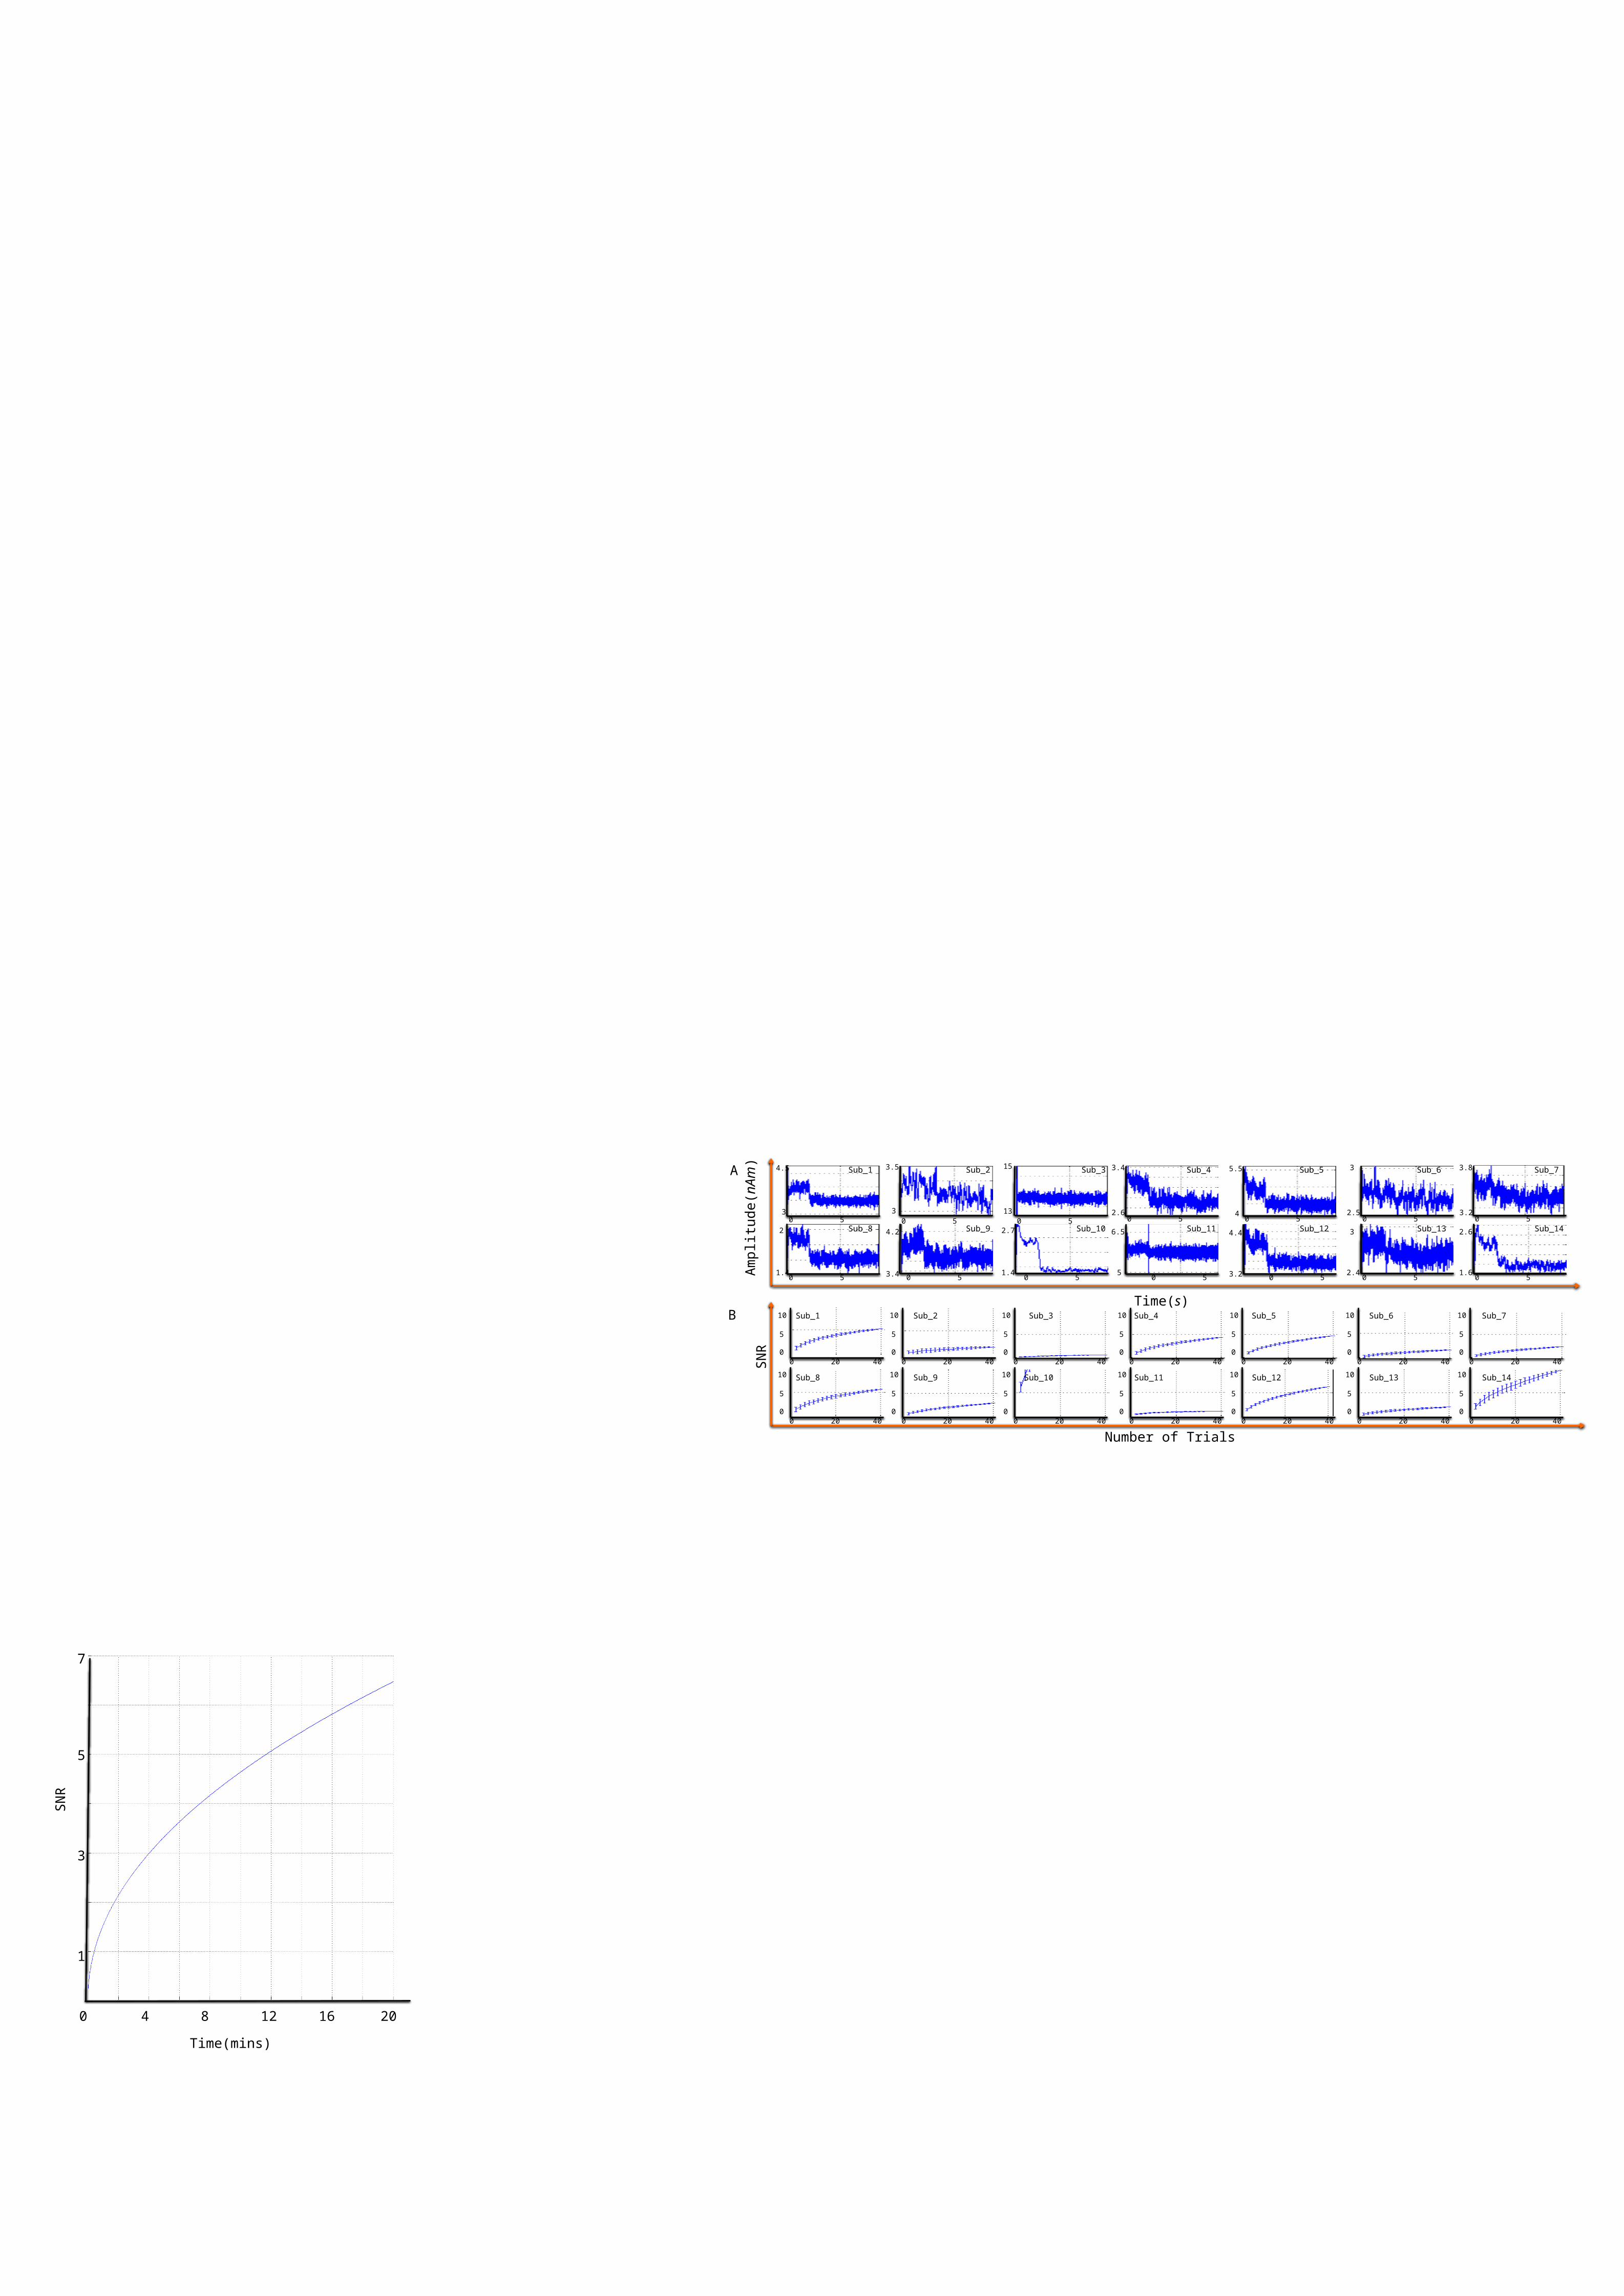
c RESULTS: SNR of visual gamma oscillations Robust visual gamma responses were observed in 18 of the 27 subjects analysed Figure 4: A) SNR plotted as a function of trial count. Error bars show standard error across subjects. B) SNR plotted as a function of experiment time. Figure 3: A) Trial average gamma responses in 14 selected individuals. Note significant variation in magnitude of response across subjects. B) SNR plotted as a function of trial count. Error bars show standard deviation across 500 iterations of trial selection. In agreement with (A) note variation in SNR over subjects. The fit of the mean SNR curve (Eq 1) was found to be close to the anticipated relationship (Eq 2). Using this model, and the optimal trial times discussed above, SNR was plotted against total experiment time. To gain an average SNR of 5, ~12mins total experiment time is required. However for analyses requiring greater SNR, many more trials may be required. Optimal Paradigm Design for Visuo-Motor MEG Studies 1 Ben Hunt, 1 Siân Robson, 1 George O’Neill, 2 Krish Singh, 1 Peter Morris and 1 Matthew Brookes. 1 Sir Peter Mansfield Imaging Centre, School of Physics and Astronomy, University of Nottingham, University Park, Nottingham. 2 Cardiff University Brain Imaging Centre, School of Psychology, Cardiff University, Park Place, Cardiff. Visuo-Motor Tasks (VMT) are increasingly popular in MEG; they are well tolerated by patients, produce robust responses and allow insight into basic physiology b and neuropathology a . VMTs induce changes in visual alpha and gamma oscillations as well as event related desynchronisation (ERD) and subsequent post movement beta rebound (PMBR) in sensorimotor cortex. Despite popularity, experimental design varies widely in terms of inter-stimulus interval (ISI) and number of trials. E.g 5 selected studies used ISIs of 3 to 7 seconds a,b,c,d,e . Here, we investigate the optimal paradigm design required to accurately characterise PMBR and visual gamma synchronisation in MEG. BACKGROUND RESULTS: Post Movement Beta Rebound – latency and longevity c CONCLUSIONS a Robson et al (2015) Abnormal Visuomotor Processing in Schizophrenia. Proc MEG UK 2015 b Muthukumaraswamy et al (2013) Elevating Endogenous GABA Levels with GAT-1 Blockade Modulates Evoked but Not Induced Responses in Human Visual Cortex. Neuropsychopharma. c Jurkiewicz et al (2006) Post-movement beta rebound is generated in motor cortex: Evidence from neuromagnetic recordings. Neuroimage. d Cheyne et al (2008) Self-paced movements induce high-frequency gamma oscillations in primary motor cortex. Neuroimage. e Hall et al (2011) The effect of hypercapnia on resting and stimulus induced MEG signals. Neuroimage. @baehunt Benjamin.hunt@ nottingham.ac.u k PARADIGMS PMBR in sensorimotor cortex exhibits a longevity of ~6-8s thus the ISI in visuo-motor paradigms must be greater than 8s to accurately characterise this response. Studies failing to do this will artifactually exaggerate ERD and diminish PMBR. Gamma SNR varies considerably across individuals. Here, 40 trials generated a SNR of ~4 but results suggest that more benefit could be gained by increasing the trial count further. The visuo-motor paradigm offers a powerful and robust option for MEG studies. However, to obtain optimal measurements the task must be careful designed with an awareness of the trade off between total experiment time, trial length, and SNR. Figure 1: A) Mean time frequency spectrogram across all subjects showing clear beta band response to button press. B) Trial averaged beta band (13Hz-30Hz) envelope. Button press occurred at t = 0s. METHODS Beamformer used to identify locations of interest (LoI): • Task 1 Data: Active window (0s to 10s) compared to control window (10s to 20s); data filtered to the 13Hz to 30Hz band. • Task 2 Data: Active window (0.5s to 1.8s) compared to control window (7s to 8.3s); data filtered to the 30Hz to 70Hz band. Virtual electrode time-series generated for LoI in all subjects: • Task 1 Data: Time frequency spectrogram generated and amplitude envelopes in the beta band (13Hz to 30Hz) extracted. • Task 2 Data: Time frequency spectrogram generated and amplitude envelopes in the gamma band (30Hz to 70Hz) extracted. PMBR analysis in Task 1 Data: • Beta envelope averaged across trials within each subject, and the mean value in the 20s to 25s window subtracted in order to baseline correct. • Savitzky-Golay (SG) filter (first order, 0.5s window width) used to smooth the beta envelope. • Data in the 0s to 20s window (relative to button press) considered and point at which the filtered envelope returned to zero following PMBR measured. Gamma analysis in Task 2 Data: • Within each subject, N trials randomly selected and averaged. Signal-to-Noise-Ratio (SNR) measured as the difference in mean envelope amplitude in the active and control windows, divided by the envelope standard deviation in the control window. (Active window 0.25s to 1.75s; Control window 3s to 8.5s). • N allowed to vary between 2 and 40. Random selection made 500 times and results averaged to avoid bias via selecting trials with a strong response. • Gamma envelope averaged across trials and subjects and plotted. Figure 2: Trial averaged SG filtered beta envelopes for all subjects. The overall subject average is shown overlaid in black. Button press occurred at t = 0s. Note the longevity of the PMBR The mean time point at which the beta envelope reached zero, following the PMPB was 7.9s ± 3.2s relative to the button press. To also incorporate a baseline period for later removal a further two seconds is necessary. As a result the total optimal trial time is 10 seconds which, on average, will give an unbiased measure of ERD and PMBR and sufficient baseline for later adjustment. ACKNOWLEDGEMENTS This study was funded by Medical Research Council Partnership Grant (MR/K005464/1) and NIRG (MR/M006301/1) REFERENCES 90 80 70 60 50 40 30 20 10 -5 0 5 10 15 20 2.5 2 1.5 1 0.5 0 - 0.5 -1 - 1.5 Time(s) Frequency(H z) 2 1.5 1 0.5 0 -0.5 -1 -1.5 -5 0 5 10 15 20 Time(s) Amplitude(nAm) Raw Trace SG-Filtered Trace 0 3 2 1 -1 -2 -3 -5 0 5 10 15 20 Time(s) Amplitude(nAm) + Task 1 Task 2 a 27 participants made multiple button presses during presentation of a visual grating. 45 trials; Total Scan Time: 7mins 2000ms stimulation PARADIGMS 7000ms fixation only baseline Used to investigate optimal trial count for visual gamma measurements 9 participants made a single self- paced left handed button press. Presses made approximately once every ~30s, but subjects did not count intervals. Total scan time 20mins Used to investigate the latency and longevity of the post movement beta rebound in sensorimotor cortex A B + Crosses Zero @ 7.9s +
-
Upload
bertram-dickerson -
Category
Documents
-
view
214 -
download
0
Transcript of C RESULTS: SNR of visual gamma oscillations Robust visual gamma responses were observed in 18 of the...

c
RESULTS: SNR of visual gamma oscillations Robust visual gamma responses were observed in 18 of the 27 subjects analysed
Figure 4: A) SNR plotted as a function of trial count. Error bars show standard error across subjects. B) SNR plotted as a function of experiment time.
Figure 3: A) Trial average gamma responses in 14 selected individuals. Note significant variation in magnitude of response across subjects. B) SNR plotted as a function of trial count. Error bars show standard deviation across 500 iterations of trial selection. In agreement with (A) note variation in SNR over subjects.
The fit of the mean SNR curve (Eq 1) was found to be close to the anticipated relationship (Eq 2). Using this model, and the optimal trial times discussed above, SNR was plotted against total experiment time. To gain an average SNR of 5, ~12mins total experiment time is required. However for analyses requiring greater SNR, many more trials may be required.
Optimal Paradigm Design for Visuo-Motor MEG Studies
1Ben Hunt, 1Siân Robson, 1George O’Neill, 2Krish Singh, 1Peter Morris and 1Matthew Brookes.
1Sir Peter Mansfield Imaging Centre, School of Physics and Astronomy, University of Nottingham, University Park, Nottingham.
2Cardiff University Brain Imaging Centre, School of Psychology, Cardiff University, Park Place, Cardiff.
Visuo-Motor Tasks (VMT) are increasingly popular in MEG; they are well tolerated by patients, produce robust responses and allow insight into basic physiologyb and neuropathologya.
VMTs induce changes in visual alpha and gamma oscillations as well as event related desynchronisation (ERD) and subsequent post movement beta rebound (PMBR) in sensorimotor cortex.
Despite popularity, experimental design varies widely in terms of inter-stimulus interval (ISI) and number of trials. E.g 5 selected studies used ISIs of 3 to 7 secondsa,b,c,d,e.
Here, we investigate the optimal paradigm design required to accurately characterise PMBR and visual gamma synchronisation in MEG.
BACKGROUND RESULTS: Post Movement Beta Rebound – latency and longevity
cCONCLUSIONS
aRobson et al (2015) Abnormal Visuomotor Processing in Schizophrenia. Proc MEG UK 2015 bMuthukumaraswamy et al (2013) Elevating Endogenous GABA Levels with GAT-1 Blockade Modulates Evoked but Not Induced Responses in Human Visual Cortex. Neuropsychopharma. cJurkiewicz et al (2006) Post-movement beta rebound is generated in motor cortex: Evidence from neuromagnetic recordings. Neuroimage. dCheyne et al (2008) Self-paced movements induce high-frequency gamma oscillations in primary motor cortex. Neuroimage. eHall et al (2011) The effect of hypercapnia on resting and stimulus induced MEG signals. Neuroimage.
@baehunt
PARADIGMS
PMBR in sensorimotor cortex exhibits a longevity of ~6-8s thus the ISI in visuo-motor paradigms must be greater than 8s to accurately characterise this response. Studies failing to do this will artifactually exaggerate ERD and diminish PMBR. Gamma SNR varies considerably across individuals. Here, 40 trials generated a SNR of ~4 but results suggest that more benefit could be gained by increasing the trial count further. The visuo-motor paradigm offers a powerful and robust option for MEG studies. However, to obtain optimal measurements the task must be careful designed with an awareness of the trade off between total experiment time, trial length, and SNR.
Figure 1: A) Mean time frequency spectrogram across all subjects showing clear beta band response to button press. B) Trial averaged beta band (13Hz-30Hz) envelope. Button press occurred at t = 0s.
METHODSBeamformer used to identify locations of interest (LoI):• Task 1 Data: Active window (0s to 10s) compared to control window
(10s to 20s); data filtered to the 13Hz to 30Hz band.• Task 2 Data: Active window (0.5s to 1.8s) compared to control
window (7s to 8.3s); data filtered to the 30Hz to 70Hz band.Virtual electrode time-series generated for LoI in all subjects:• Task 1 Data: Time frequency spectrogram generated and amplitude
envelopes in the beta band (13Hz to 30Hz) extracted.• Task 2 Data: Time frequency spectrogram generated and amplitude
envelopes in the gamma band (30Hz to 70Hz) extracted.PMBR analysis in Task 1 Data:• Beta envelope averaged across trials within each subject, and the
mean value in the 20s to 25s window subtracted in order to baseline correct.
• Savitzky-Golay (SG) filter (first order, 0.5s window width) used to smooth the beta envelope.
• Data in the 0s to 20s window (relative to button press) considered and point at which the filtered envelope returned to zero following PMBR measured.
Gamma analysis in Task 2 Data:• Within each subject, N trials randomly selected and averaged. Signal-
to-Noise-Ratio (SNR) measured as the difference in mean envelope amplitude in the active and control windows, divided by the envelope standard deviation in the control window. (Active window 0.25s to 1.75s; Control window 3s to 8.5s).
• N allowed to vary between 2 and 40. Random selection made 500 times and results averaged to avoid bias via selecting trials with a strong response.
• Gamma envelope averaged across trials and subjects and plotted.
Figure 2: Trial averaged SG filtered beta envelopes for all subjects. The overall subject average is shown overlaid in black. Button press occurred at t = 0s. Note the longevity of the PMBRThe mean time point at which the beta envelope reached zero, following the PMPB was 7.9s ± 3.2s relative to the button press. To also incorporate a baseline period for later removal a further two seconds is necessary. As a result the total optimal trial time is 10 seconds which, on average, will give an unbiased measure of ERD and PMBR and sufficient baseline for later adjustment.
ACKNOWLEDGEMENTSThis study was funded by Medical Research Council Partnership Grant (MR/K005464/1) and NIRG (MR/M006301/1)
REFERENCES
90
80
70
60
50
40
30
20
10
-5 0 5 10 15 20
2.5
2
1.5
1
0.5
0
-0.5
-1
-1.5
Time(s)
Freq
uenc
y(H
z)
2
1.5
1
0.5
0
-0.5
-1
-1.5-5 0 5 10 15 20
Time(s)
Ampl
itude
(nAm
)
Raw Trace
SG-Filtered Trace
0
3
2
1
-1
-2
-3-5 0 5 10 15 20
Time(s)
Ampl
itude
(nAm
)
+
Task 1 Task 2 a
27 participants made multiple button presses during presentation of a visual grating. 45 trials; Total Scan Time: 7mins
2000ms stimulation
PARADIGMS
7000ms fixation only
baseline
Used to investigate optimal trial count for visual gamma measurements
9 participants made a single self- paced left handed button press. Presses made approximately once every ~30s, but subjects did not count intervals. Total scan time 20mins
Used to investigate the latency and longevity of the post movement beta rebound in sensorimotor cortex
A B
+
Crosses Zero @ 7.9s
+
0 5 0 5 0 5 0 5 0 5 0 5 0 5
0 5 0 5 0 5 0 5 0 5 0 5 0 5
4.5
3
3.5
3
15
13
3.4
2.6
5.5
4
3
2.5
3.8
3.2
2
1.4
4.2
3.4
2.7
1.4
6.5
5
4.4
3.2
3
2.4
2.6
1.6
Time(s)
Ampl
itude
(nAm
)
Number of Trials
A Sub_1 Sub_2 Sub_3 Sub_4 Sub_5 Sub_6 Sub_7
Sub_8 Sub_9 Sub_10 Sub_11 Sub_12 Sub_13 Sub_14
0 20 40
10
0
5
0 20 40
10
0
5
0 20 40
10
0
5
0 20 40
10
0
5
0 20 40
10
0
5
0 20 40
10
0
5
0 20 40
10
0
5
0 20 40
10
0
5
0 20 40
10
0
5
0 20 40
10
0
5
0 20 40
10
0
5
0 20 40
10
0
5
0 20 40
10
0
5
0 20 40
10
0
5
Sub_1 Sub_2 Sub_3 Sub_4 Sub_5 Sub_6 Sub_7
Sub_8 Sub_9 Sub_10 Sub_11 Sub_12 Sub_13 Sub_14
SNR
B
7
5
3
1
0 4 8 12 16 20
Time(mins)
SNR
Optimal Paradigm Design for Visuo-Motor MEG Studies
1Ben Hunt, 1Siân Robson, 1George O’Neill, 2Krish Singh, 1Peter Morris and 1Matthew Brookes.
1Sir Peter Mansfield Imaging Centre, School of Physics and Astronomy, University of Nottingham, University Park, Nottingham.
2Cardiff University Brain Imaging Centre, School of Psychology, Cardiff University, Park Place, Cardiff.
Visuo-Motor Tasks (VMT) are increasingly popular in MEG; they are well tolerated by patients, produce robust responses and allow insight into basic physiologyb and neuropathologya.
VMTs induce changes in visual alpha and gamma oscillations as well as event related desynchronisation (ERD) and subsequent post movement beta rebound (PMBR) in sensorimotor cortex.
Despite popularity, experimental design varies widely in terms of inter-stimulus interval (ISI) and number of trials. E.g 5 selected studies used ISIs of 3 to 7 secondsa,b,c,d,e.
Here, we investigate the optimal paradigm design required to accurately characterise PMBR and visual gamma synchronisation in MEG.
BACKGROUND RESULTS: Post Movement Beta Rebound – latency and longevity
c
RESULTS: SNR of visual gamma oscillations
cCONCLUSIONS
aRobson et al (2015) Abnormal Visuomotor Processing in Schizophrenia. Proc MEG UK 2015 bMuthukumaraswamy et al (2013) Elevating Endogenous GABA Levels with GAT-1 Blockade Modulates Evoked but Not Induced Responses in Human Visual Cortex. Neuropsychopharma. cJurkiewicz et al (2006) Post-movement beta rebound is generated in motor cortex: Evidence from neuromagnetic recordings. Neuroimage. dCheyne et al (2008) Self-paced movements induce high-frequency gamma oscillations in primary motor cortex. Neuroimage. eHall et al (2011) The effect of hypercapnia on resting and stimulus induced MEG signals. Neuroimage.
@baehunt
PARADIGMS
PMBR in sensorimotor cortex exhibits a longevity of ~6-8s thus the ISI in visuo-motor paradigms must be greater than 8s to accurately characterise this response. Studies failing to do this will artifactually exaggerate ERD and diminish PMBR. Gamma SNR varies considerably across individuals. Here, 40 trials generated a SNR of ~4 but results suggest that more benefit could be gained by increasing the trial count further. The visuo-motor paradigm offers a powerful and robust option for MEG studies. However, to obtain optimal measurements the task must be careful designed with an awareness of the trade off between total experiment time, trial length, and SNR.
Figure 1: A) Mean time frequency spectrogram across all subjects showing clear beta band response to button press. B) Trial averaged beta band (13Hz-30Hz) envelope. Button press occurred at t = 0s.
METHODSBeamformer used to identify locations of interest (LoI):• O’Neill data: Active window (0s to 10s) compared to control window
(10s to 20s); data filtered to the 13Hz to 30Hz band.• Robson data: Active window (0.5s to 1.8s) compared to control
window (7s to 8.3s); data filtered to the 30Hz to 70Hz band.Virtual electrode time-series generated for LoI in all subjects:• O’Neill data: Time frequency spectrogram generated and amplitude
envelopes in the beta band (13Hz to 30Hz) extracted.• Robson data: Time frequency spectrogram generated and amplitude
envelopes in the gamma band (30Hz to 70Hz) extracted.PMBR analysis in O’Neill Data:• Beta envelope averaged across trials within each subject, and the
mean value in the 20s to 25s window subtracted in order to baseline correct.
• Savitzky-Golay (SG) filter (first order, 0.5s window width) used to smooth the beta envelope.
• Data in the 0s to 20s window (relative to button press) considered and point at which the filtered envelope returned to zero following PMBR measured.
Gamma analysis in Robson Data:• Within each subject, N trials randomly selected and averaged. Signal-
to-Noise-Ratio (SNR) measured as the difference in mean envelope amplitude in the active and control windows, divided by the envelope standard deviation in the control window. (Active window 0.25s to 1.75s; Control window 3s to 8.5s).
• N allowed to vary between 2 and 40. Random selection made 500 times and results averaged to avoid bias via selecting trials with a strong response.
• Gamma envelope averaged across trials and subjects and plotted.
Figure 2: Trial averaged SG filtered beta envelopes for all subjects. The overall subject average (9 subjects) is shown overlaid in black. Button press occurred at t = 0s. Note the longevity of the PMBR
The mean time point at which the beta envelope reached zero, following the PMPB was 7.9s ± 3.2s relative to the button press
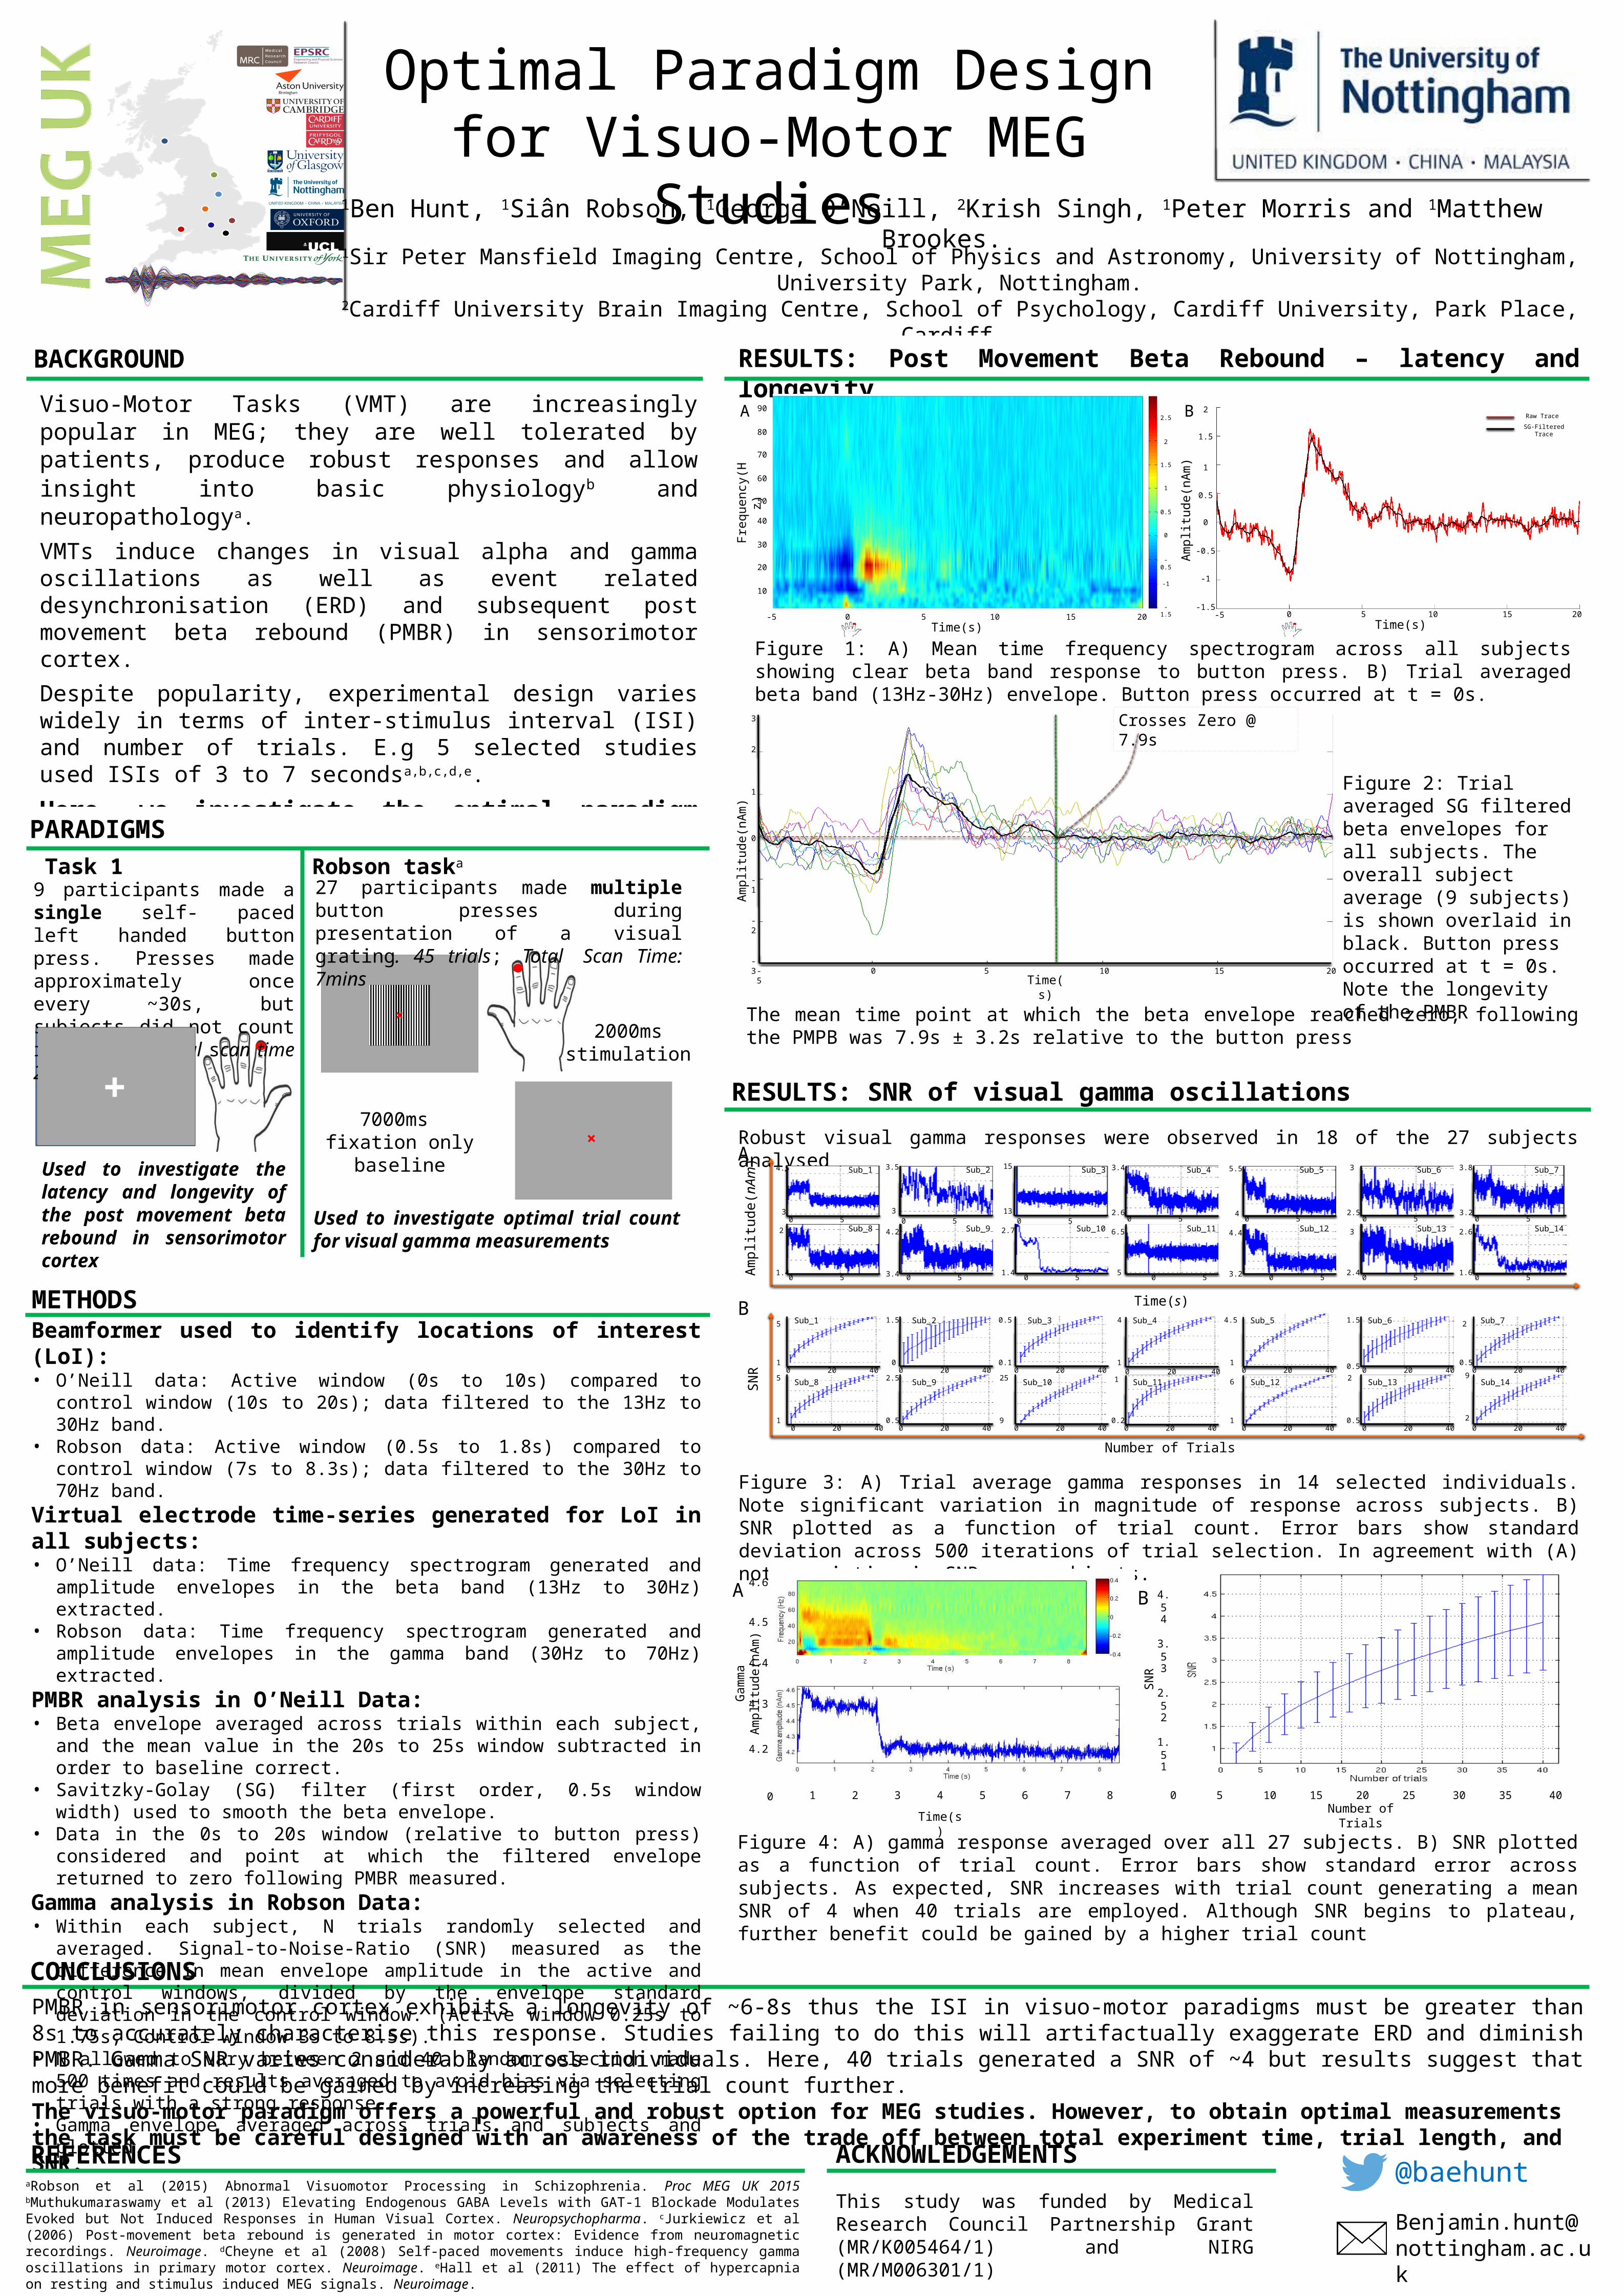
Robust visual gamma responses were observed in 18 of the 27 subjects analysed
Figure 3: A) Trial average gamma responses in 14 selected individuals. Note significant variation in magnitude of response across subjects. B) SNR plotted as a function of trial count. Error bars show standard deviation across 500 iterations of trial selection. In agreement with (A) note variation in SNR over subjects.
Figure 4: A) gamma response averaged over all 27 subjects. B) SNR plotted as a function of trial count. Error bars show standard error across subjects. As expected, SNR increases with trial count generating a mean SNR of 4 when 40 trials are employed. Although SNR begins to plateau, further benefit could be gained by a higher trial count
ACKNOWLEDGEMENTSThis study was funded by Medical Research Council Partnership Grant (MR/K005464/1) and NIRG (MR/M006301/1)
REFERENCES
90
80
70
60
50
40
30
20
10
-5 0 5 10 15 20
2.5
2
1.5
1
0.5
0
-0.5
-1
-1.5
Time(s)
Freq
uenc
y(H
z)
2
1.5
1
0.5
0
-0.5
-1
-1.5-5 0 5 10 15 20
Time(s)
Ampl
itude
(nAm
)
Raw Trace
SG-Filtered Trace
0
3
2
1
-1
-2
-3-5 0 5 10 15 20
Time(s)
Ampl
itude
(nAm
)
4.2
Time(s)
1 2 3 4 5 6 7 8
4.3
4.4
4.5
4.6
0
Gam
ma
Ampl
itude
(nAm
)
0 5 10 15 20 25 30 35 40
1
1.5
2
2.5
3
3.5
4
4.5
Number of Trials
SNR
+
Task 1 Robson taska
27 participants made multiple button presses during presentation of a visual grating. 45 trials; Total Scan Time: 7mins
2000ms stimulation
PARADIGMS
7000ms fixation only
baseline
Used to investigate optimal trial count for visual gamma measurements
9 participants made a single self- paced left handed button press. Presses made approximately once every ~30s, but subjects did not count intervals. Total scan time 20mins
Used to investigate the latency and longevity of the post movement beta rebound in sensorimotor cortex
A B
A
0 5 0 5 0 5 0 5 0 5 0 5 0 5
0 5 0 5 0 5 0 5 0 5 0 5 0 5
4.5
3
3.5
3
15
13
3.4
2.6
5.5
4
3
2.5
3.8
3.2
2
1.4
4.2
3.4
2.7
1.4
6.5
5
4.4
3.2
3
2.4
2.6
1.6
Time(s)
Ampl
itude
(nAm
)
0 20 40 0 20 40 0 20 40 0 20 40 0 20 40 0 20 40
0 20 40 0 20 40 0 20 40 0 20 40 0 20 40 0 20 40
0 20 40
0 20 40
5
1
1.5
0
5
1
2.5
0.5
0.5
0.1
4
1
25
9
1
0.2
4.5
1
1.5
0.5
6
1
2
0.5
2
0.5
9
2
Number of Trials
SNR
Sub_1 Sub_2 Sub_3 Sub_4 Sub_5 Sub_6 Sub_7
Sub_8 Sub_9 Sub_10 Sub_11 Sub_12 Sub_13 Sub_14
Sub_1 Sub_2 Sub_3 Sub_4 Sub_5 Sub_6 Sub_7
Sub_8 Sub_9 Sub_10 Sub_11 Sub_12 Sub_13 Sub_14
B
A B
+
Crosses Zero @ 7.9s
+