C O V E R S H E E T - Petron Corporation Corporation (the “Company” or “Petron”), a...
57
- 1 - 3 1 1 7 1 P E T R O N C O R P O R A T I O N S M C H E A D O F F I C E 4 0 S A N M I G U E L A V E. M A N D A L U Y O N G C I T Y 1 2 - 3 1 0 5 1 9 Dept. Requiring this Doc. Total No. of Stockholders Remarks = pls. use black ink for scanning purposes C O V E R S H E E T S. E. C. Registration Number (Company's Full Name) Fiscal Year Month (Business Address: No. Street City / Town / Province) ATTY. JOEL ANGELO C. CRUZ 886-3888 Contact Person Company Telephone Number SEC Form 17-Q (1st Quarter 2015) FORM TYPE Month Day Secondary License Type, if Applicable N/A Day Annual Meeting Domestic Foreign To be accomplished by SEC Personnel concerned Amended Articles Number/Section Total Amount of Borrowings S T A M P S Fiscal Number LCU Document I. D. Cashier (For 2015) Permit to offer securities 151,182 (as of December 31, 2014)
-
Upload
truongtram -
Category
Documents
-
view
216 -
download
0
Transcript of C O V E R S H E E T - Petron Corporation Corporation (the “Company” or “Petron”), a...

- 1 -
3 1 1 7 1
P E T R O N C O R P O R A T I O N
S M C H E A D O F F I C E 4 0 S A N M I G U E L
A V E. M A N D A L U Y O N G C I T Y
1 2 - 3 1
0 5 1
9
Dept. Requiring this Doc.
Total No. of Stockholders
Remarks = pls. use black ink for scanning purposes
C O V E R S H E E T
S. E. C. Registration Number
(Company's Full Name)
Fiscal Year Month
(Business Address: No. Street City / Town / Province)
ATTY. JOEL ANGELO C. CRUZ 886-3888 Contact Person Company Telephone Number
SEC Form 17-Q (1st Quarter 2015) FORM TYPE Month Day
Secondary License Type, if Applicable
N/A
Day Annual Meeting
Domestic Foreign
To be accomplished by SEC Personnel concerned
Amended Articles Number/Section
Total Amount of Borrowings
S T A M P S
Fiscal Number LCU
Document I. D. Cashier
(For 2015)
Permit to offer securities
151,182 (as of December 31, 2014)


- 3 -
11. Are any or all of these securities listed on the Philippine Stock Exchange.
Yes [X ] No [ ]
If yes, state the name of such stock exchange and the classes of securities listed
therein:
Philippine Stock Exchange Common and Preferred Shares
12. Indicate by check mark whether the Registrant:
(a) has filed all reports required to be filed by Section 17 of the Code and SRC Rule
17 thereunder or Sections 11 of the RSA and RSA Rule 11 (a)-1 thereunder, and
Sections 26 and 141 of the Corporation Code of the Philippines, during the
preceding 12 months (or for such shorter period the registrant was required to file
such reports).
Yes [X ] No [ ]
(b) has been subject to such filing requirements for the past 90 days.
Yes [X ] No [ ]

- 4 -
Page No.
PART I - FINANCIAL INFORMATION
Item 1 Financial Statements
Petron Corporation & Subsidiaries
Consolidated Statements of Financial
Position
5-6
Petron Corporation & Subsidiaries
Consolidated Statements of Income 7
Petron Corporation & Subsidiaries
Consolidated Statements of Comprehensive
Income
8
Petron Corporation & Subsidiaries
Consolidated Statements of Changes in
Equity
9
Petron Corporation & Subsidiaries
Consolidated Statements of Cash Flows 10-11
Selected Notes to Consolidated Financial
Statements 12-50
Details of Accounts Receivables 49
Item 2 Management’s Discussion and Analysis of
Financial Conditions and Results of
Operations
50-55
PART II - OTHER INFORMATION
Other Information 56
SIGNATURES 57

- 5 -
PETRON CORPORATION AND SUBSIDIARIES
CONSOLIDATED INTERIM STATEMENTS OF
FINANCIAL POSITION
(Amounts in Million Pesos)
Unaudited Audited
March 31 December 31
Note 2015 2014
ASSETS
Current Assets
Cash and cash equivalents 9, 10 P44,668 P90,602
Financial assets at fair value through
profit or loss 9, 10 423 470
Available-for-sale financial assets 9, 10 271 430
Trade and other receivables - net 9, 10 53,241 56,299
Inventories 40,588 53,180
Other current assets 17,139 18,048
Total Current Assets 156,330 219,029
Noncurrent Assets
Available-for-sale financial assets 9, 10 216 451
Property, plant and equipment - net 5 157,648 153,650
Investment in an associate 1,709 1,162
Investment property - net 113 113
Deferred tax assets 205 242
Goodwill 8,414 8,921
Other noncurrent assets - net 9, 10 7,378 7,756
Total Noncurrent Assets 175,683 172,295
P332,013 P391,324
LIABILITIES AND EQUITY
Current Liabilities
Short-term loans 8, 9, 10 P106,691 P133,388
Liabilities for crude oil and petroleum
product importation 9, 10 23,675 24,032
Trade and other payables 9, 10 20,910 39,136
Derivative liabilities 9, 10 121 98
Income tax payable 89 73
Current portion of long-term debt - net 9, 10 5,883 5,860
Total Current Liabilities 157,369 202,587
Forward


- 10 -
PETRON CORPORATION AND SUBSIDIARIES
CONSOLIDATED INTERIM STATEMENTS OF
CASH FLOWS
(UNAUDITED)
(Amounts in Million Pesos)
For the Three Months Ended
March 31
Note 2015
2014
CASH FLOWS FROM OPERATING
ACTIVITIES
Income before income tax P295 P3,035
Adjustments for:
Share in net gains of an associate (21) (16)
Retirement benefits cost 75 26
Interest expense and other financing charges 1,371 1,236
Depreciation and amortization 1,439 1,480
Interest income (238) (289)
Unrealized foreign exchange losses - net 23 492
Other gains (207) (762)
Operating income before working capital changes 2,737 5,202
Changes in noncash assets, certain current
liabilities and others (8,689) (6,255)
Interest paid (2,164) (1,765)
Income taxes paid (68) (56)
Interest received 323 1,021
Net cash flows used in operating activities (7,861) (1,853)
CASH FLOWS FROM INVESTING
ACTIVITIES
Additions to Property, plant and equipment 5 (5,891) (4,634)
Proceeds from sale of property, plant and
equipment 2 21
Decrease (increase) in:
Other receivables 6,371 (222)
Other noncurrent assets (183) 3,486
Reductions from (additions to):
Financial assets at fair value through
profit or loss 54 328
Available-for-sale financial assets
Investment in an associate
394
(525)
367
-
Net cash flows provided by (used in) investing
activities 222 (654)
Forward


- 12 -
PETRON CORPORATION AND SUBSIDIARIES
SELECTED NOTES TO THE CONSOLIDATED INTERIM FINANCIAL STATEMENTS
(Amounts in Million Pesos, Except Par Value, Number of Shares and Per Share Data, Exchange
Rates and Commodity Volumes)
1. Reporting Entity
Petron Corporation (the “Company” or “Petron”), a subsidiary of San Miguel Corporation
(SMC or the Intermediate Parent), was incorporated under the laws of the Republic of the
Philippines and was registered with the Philippine Securities and Exchange Commission
(SEC) on December 22, 1966. Top Frontier Investment Holdings, Inc. (Top Frontier) is the
ultimate Parent Company of Petron.
Petron is the largest oil refining and marketing company in the Philippines supplying nearly
40% of the country’s fuel requirements. Petron is committed to its vision to be the leading
provider of total customer solutions in the energy sector and its derivative businesses.
The registered office address of Petron is No. 40 San Miguel Avenue, Mandaluyong City.
2. Statement of Compliance
The consolidated interim financial statements have been prepared in accordance with
Philippine Accounting Standard (PAS) 34, Interim Financial Reporting. Selected explanatory
notes are included to explain events and transactions that are significant to the understanding
of the changes in financial position and performance of the Group since the last annual
consolidated financial statements as at and for the year ended December 31, 2014. The
consolidated interim financial statements do not include all the information required for full
annual financial statements in accordance with Philippine Financial Reporting Standards
(PFRS), and should be read in conjunction with the audited consolidated financial statements
of Petron Corporation and Subsidiaries (collectively referred to as the “Group”) as at and for
the year ended December 31, 2014. The audited consolidated financial statements are
available upon request from the Group’s registered office at SMC Head Office Complex, 40
San Miguel Avenue, Mandaluyong City.
3. Significant Accounting Policies
Except as described below, the accounting policies applied by the Group in these consolidated
interim financial statements are the same as those applied by the Group in its consolidated
financial statements as at and for the year ended December 31, 2014. The following changes
in accounting policies are also expected to be reflected in the Group’s consolidated financial
statements as at and for the year ended December 31, 2015.
Adoption of New Standards, Amendments to Standards and Interpretations
The Financial Reporting Standards Council (FRSC) approved the adoption of new or revised
standards, amendments to standards and interpretations [based on International Financial
Reporting Interpretation Committee (IFRIC) Interpretations] as part of PFRS.
- 13 -
Amendments to Standards and Interpretation Adopted in 2015
The Group has adopted the following applicable PFRS starting January 1, 2015 and
accordingly, changed its accounting policies in the following areas:
Defined Benefit Plans: Employee Contributions (Amendments to PAS 19, Employee Benefits).
The amendments apply to contributions from employees or third parties to the defined benefit
plans. The objective of the amendments is to simplify the accounting for contributions that are
independent of the number of years of employee service (i.e., employee contributions that are
calculated according to a fixed percentage of salary). The adoption of the amendments is
required to be applied retrospectively for annual periods beginning on or after July 1, 2014.
Annual Improvements to PFRSs: 2010 - 2012 and 2011 - 2013 Cycles - Amendments were
made to a total of nine standards, with changes made to the standards on business
combinations and fair value measurement in both cycles. Most amendments will apply
prospectively for annual periods beginning on or after July 1, 2014. Earlier application is
permitted, in which case the related consequential amendments to other PFRSs would also
apply. Special transitional requirements have been set for amendments to the following
standards: PFRS 2, PAS 16, PAS 38 and PAS 40. The following are the said improvements
or amendments to PFRSs, none of which has a significant effect on the separate financial
statements of the Company.
Classification and measurement of contingent consideration (Amendment to PFRS 3). The
amendment clarifies the classification and measurement of contingent consideration in a
business combination. When contingent consideration is a financial instrument, its
classification as a liability or equity is determined by reference to PAS 32 Financial
Instruments: Presentation, rather than to any other PFRSs. Contingent consideration that is
classified as an asset or a liability is always subsequently measured at fair value, with changes
in fair value recognized in profit or loss.
Consequential amendments are also made to PAS 39 Financial Instruments: Recognition and
Measurement and PFRS 9 Financial Instruments to prohibit contingent consideration from
subsequently being measured at amortized cost. In addition, PAS 37 Provisions, Contingent
Liabilities and Contingent Assets is amended to exclude provisions related to contingent
consideration. The adoption of the amendments is required to be applied for annual periods
beginning on or after July 1, 2014.
Scope exclusion for the formation of joint arrangements (Amendment to PFRS 3). PFRS 3 has
been amended to clarify that the standard does not apply to the accounting for the formation
of all types of joint arrangements in PFRS 11 Joint Arrangements - i.e. including joint
operations - in the financial statements of the joint arrangements themselves.
Disclosures on the aggregation of operating segments (Amendment to PFRS 8). PFRS 8 has
been amended to explicitly require the disclosure of judgments made by management in
applying the aggregation criteria. The disclosures include: a brief description of the operating
segments that have been aggregated; and the economic indicators that have been assessed in
determining that the operating segments share similar economic characteristics. In addition,
this amendment clarifies that a reconciliation of the total of the reportable segments’ assets to
the entity’s assets is required only if this information is regularly provided to the entity’s chief
operating decision maker. This change aligns the disclosure requirements with those for
segment liabilities.
Measurement of short-term receivables and payables (Amendment to PFRS 13). The
amendment clarifies that, in issuing PFRS 13 and making consequential amendments to
PAS 39 and PFRS 9, the intention is not to prevent entities from measuring short-term

- 14 -
receivables and payables that have no stated interest rate at their invoiced amounts without
discounting, if the effect of not discounting is immaterial. The adoption of the amendments is
required to be applied for annual periods beginning on or after July 1, 2014.
Scope of portfolio exception (Amendment to PFRS 13). The scope of the PFRS 13 portfolio
exception - whereby entities are exempted from measuring the fair value of a group of
financial assets and financial liabilities with offsetting risk positions on a net basis if certain
conditions are met - has been aligned with the scope of PAS 39 and PFRS 9.
PFRS 13 has been amended to clarify that the portfolio exception potentially applies to
contracts in the scope of PAS 39 and PFRS 9 regardless of whether they meet the definition of
a financial asset or financial liability under PAS 32 - e.g. certain contracts to buy or sell non-
financial items that can be settled net in cash or another financial instrument. The adoption of
the amendment is required to be retrospectively applied for annual periods beginning on or
after July 1, 2014.
Definition of ‘Related Party’ (Amendments to PAS 24, Related Parties). The definition of a
‘related party’ is extended to include a management entity that provides key management
personnel (KMP) services to the reporting entity, either directly or through a group entity.
For related party transactions that arise when KMP services are provided to a reporting entity,
the reporting entity is required to separately disclose the amounts that it has recognized as an
expense for those services that are provided by a management entity; however, it is not
required to ‘look through’ the management entity and disclose compensation paid by the
management entity to the individuals providing the KMP services. The reporting entity will
also need to disclose other transactions with the management entity under the existing
disclosure requirements of PAS 24 - e.g. loans. The amendment is required to be applied
prospectively for annual periods beginning on or after July 1, 2014.
Inter-relationship of PFRS 3 and PAS 40 (Amendment to PAS 40). PAS 40 has been amended
to clarify that an entity should assess whether an acquired property is an investment property
under PAS 40 and perform a separate assessment under PFRS 3 to determine whether the
acquisition of the investment property constitutes a business combination. Entities will still
need to use judgment to determine whether the acquisition of an investment property is an
acquisition of a business under PFRS 3.
New or Revised Standards, Amendments to Standards and Interpretations Not Yet Adopted
A number of new and amended standards are effective for annual periods beginning after
January 1, 2015 and have not been applied in preparing the interim consolidated financial
statements. Unless otherwise indicated, none of these is expected to have a significant effect
on the interim consolidated financial statements.
The Group will adopt the following new and amended standards on the respective effective
dates:
Disclosure Initiative (Amendments to PAS 1, Presentation of Financial Statements). The
amendments clarify the following: (i) the materiality requirements in PAS 1; (ii) that
specific line items in the consolidated statements of income and consolidated statement of
comprehensive income and the consolidated statement of financial position may be
disaggregated; (iii) that entities have flexibility as to the order in which they present the
notes to the consolidated financial statements; and (iv) that share of other comprehensive
income of associates and joint ventures accounted for using the equity method must be
presented in aggregate as a single line item, and classified between those items that will or
will not be subsequently reclassified to profit or loss. Furtheremore, the amendments
clarify the requirements that apply when additional subtotals are presented in the

- 15 -
consolidated statement of financial position and the consolidated statements of income
and consolidated statement of comprehensive income
Accounting for Acquisitions of Interests in Joint Operations (Amendments to
PFRS 11). The amendments require business combination accounting to be applied to
acquisitions of interests in a joint operation that constitutes a business. Business
combination accounting also applies to the acquisition of additional interests in a joint
operation while the joint operator retains joint control. The additional interest acquired
will be measured at fair value. The previously held interests in the joint operation will not
be remeasured. The amendments place the focus firmly on the definition of a business,
because this is key to determining whether the acquisition is accounted for as a business
combination or as the acquisition of a collection of assets. As a result, this places pressure
on the judgment applied in making this determination. The amendments are required to
be applied prospectively for annual periods beginning on or after January 1, 2016. Early
adoption is permitted
Clarification of Acceptable Methods of Depreciation and Amortization (Amendments to
PAS 16 and PAS 38). The amendments to PAS 38 Intangible Assets introduce a rebuttable
presumption that the use of revenue-based amortization methods for intangible assets is
inappropriate. This presumption can be overcome only when revenue and the
consumption of the economic benefits of the intangible asset are ‘highly correlated’, or
when the intangible asset is expressed as a measure of revenue.
The amendments to PAS 16 Property, Plant and Equipment explicitly state that revenue-
based methods of depreciation cannot be used for property, plant and equipment. This is
because such methods reflect factors other than the consumption of economic benefits
embodied in the asset - e.g. changes in sales volumes and prices.
The amendments are effective for annual periods beginning on or after January 1, 2016,
and are to be applied prospectively. Early application is permitted.
Sale or Contribution of Assets between an Investor and its Associate or Joint Venture
(Amendments to PFRS 10 and PAS 28). The amendments address an inconsistency
between the requirements in PFRS 10 and in PAS 28, in dealing with the sale or
contribution of assets between an investor and its associate or joint venture.
The amendments require that a full gain or loss is recognized when a transaction involves
a business (whether it is housed in a subsidiary or not). A partial gain or loss is recognized
when a transaction involves assets that do not constitute a business, even if these assets
are housed in a subsidiary.
The amendments apply prospectively for annual periods beginning on or after January 1,
2016. Early adoption is permitted.
Annual Improvements to PFRSs 2012 - 2014 Cycle. This cycle of improvements contains
amendments to four standards, none of which are expected to have significant impact on
the Group’s consolidated financial statements. The amendments are effective for annual
periods beginning on or after January 1, 2016. Earlier application is permitted.
Changes in method for disposal (Amendment to PFRS 5). PFRS 5 is amended to clarify
that:
if an entity changes the method of disposal of an asset (or disposal group) – i.e.
reclassifies an asset (or disposal group) from held-for-distribution to owners to held-
for-sale (or vice versa) without any time lag – then the change in classification is

- 16 -
considered a continuation of the original plan of disposal and the entity continues to
apply held-for-distribution or held-for-sale accounting. At the time of the change in
method, the entity measures the carrying amount of the asset (or disposal group) and
recognizes any write-down (impairment loss) or subsequent increase in the fair value
less costs to sell/distribute of the asset (or disposal group); and
if an entity determines that an asset (or disposal group) no longer meets the criteria to
be classified as held-for-distribution, then it ceases held-for-distribution accounting in
the same way as it would cease held-for-sale accounting.
Any change in method of disposal or distribution does not, in itself, extend the period in
which a sale has to be completed.
The amendment to PFRS 5 is applied prospectively in accordance with PAS 8 to changes
in methods of disposal that occur on or after January 1, 2016.
‘Continuing Involvement’ for Servicing Contracts (Amendments to PFRS 7, Financial
Instruments: Disclosures). PFRS 7 is amended to clarify when servicing arrangements are
in the scope of its disclosure requirements on continuing involvement in transferred
financial assets in cases when they are derecognized in their entirety. A servicer is
deemed to have continuing involvement if it has an interest in the future performance of
the transferred asset - e.g. if the servicing fee is dependent on the amount or timing of the
cash flows collected from the transferred financial asset; however, the collection and
remittance of cash flows from the transferred financial asset to the transferee is not, in
itself, sufficient to be considered ‘continuing involvement.’ The amendments to PFRS 7
are applied retrospectively, in accordance with PAS 8, except that the PFRS 7
amendments relating to servicing contracts need not be applied for any period presented
that begins before the annual period for which the entity first applies those amendments.
The amendment to PFRS 7 is applied retrospectively, in accordance with PAS 8
Accounting Policies, Changes in Accounting Estimates and Errors, except that the PFRS
7 amendment relating to servicing contracts need not be applied for any period presented
that begins before the annual period for which the entity first applies this amendment.
PFRS 9 Financial Instruments (2014). PFRS 9 (2014) replaces PAS 39 Financial
Instruments: Recognition and Measurement and supersedes the previously published
versions of PFRS 9 that introduced new classifications and measurement requirements (in
2009 and 2010) and a new hedge accounting model (in 2013). PFRS 9 includes revised
guidance on the classification and measurement of financial assets, including a new
expected credit loss model for calculating impairment, guidance on own credit risk on
financial liabilities measured at fair value and supplements the new general hedge
accounting requirements published in 2013. PFRS 9 incorporates new hedge accounting
requirements that represent a major overhaul of hedge accounting and introduces
significant improvements by aligning the accounting more closely with risk management.
The new standard is to be applied retrospectively for annual periods beginning on or after
January 1, 2018 with early adoption permitted.
The Company is assessing the potential impact on its separate financial statements
resulting from the application of PFRS 9.

- 17 -
4. Segment Information
Management identifies segments based on business and geographical locations. These
operating segments are monitored and strategic decisions are made on the basis of adjusted
segment operating results. The Chief Executive Officer (the chief operating decision maker)
reviews management reports on a regular basis.
The Group’s major sources of revenues are as follows:
a. Sales of petroleum and other related products which include gasoline, diesel and kerosene
offered to motorists and public transport operators through its service station network
around the country and in Malaysia.
b. Insurance premiums from the business and operation of all kinds of insurance and
reinsurance, on sea as well as on land, of properties, goods and merchandise,
of transportation or conveyance, against fire, earthquake, marine perils, accidents and all
other forms and lines of insurance authorized by law, except life insurance.
c. Lease of acquired real estate properties for petroleum, refining, storage and distribution
facilities, gasoline service stations and other related structures.
d. Sales on wholesale or retail and operation of service stations, retail outlets, restaurants,
convenience stores and the like.
e. Export sales of various petroleum and non-fuel products to other Asian countries such as
China, Indonesia, Taiwan, Cambodia, Malaysia and Singapore.
f. Sale of polypropylene resins to domestic plastic converters of yarn, film and injection
moulding grade plastic products.
Segment Assets and Liabilities
Segment assets include all operating assets used by a segment and consist principally of
operating cash, receivables, inventories, and property, plant and equipment, net of allowances
and impairment. Segment liabilities include all operating liabilities and consist principally of
accounts payable, wages, taxes currently payable and accrued liabilities. Segment assets and
liabilities do not include deferred taxes.
Inter-segment Transactions
Segment revenues, expenses and performance include sales and purchases between operating
segments. Transfer prices between operating segments are set on an arm’s length basis in a
manner similar to transactions with third parties. Such transfers are eliminated in
consolidation.
Major Customer
The Group does not have a single external customer from which sales revenue generated
amounted to 10% or more of the total revenue of the Group.

- 18 -
The following tables present revenue and income information and certain asset and liability
information regarding the business segments as of and for the periods ended March 31, 2015,
December 31, 2014 and March 31, 2014:
Petroleum Insurance Leasing Marketing
Elimination/
Others Total
March 31, 2015
Revenue:
External sales P86,170 P - P - P574 P - P86,744
Inter-segment sales 30,451 27 140 - (30,618) -
Operating income 2,767 14 68 23 96 2,968
Net income 158 22 33 19 25 257
Assets and liabilities:
Segment assets 354,899 2,172 5,284 1,071 (31,618) 331,808
Segment liabilities 239,118 951 4,171 344 (15,206) 229,378
Other segment
information:
Property, plant and
equipment 152,217 - - 226 5,205 157,648
Depreciation and
amortization 1,412 - - 10 17 1,439
Interest expense and
other financing charges 1,371 - 46 - (46) 1,371
Interest income 279 3 - 2 (46) 238
Income tax expense 21 4 6 5 2 38
Petroleum Insurance Leasing Marketing
Elimination/
Others Total
December 31, 2014
Revenue:
External sales P479,753 P - P - P2,782 P - P482,535
Inter-segment sales 249,428 82 550 - (250,060) -
Operating income 7,154 53 238 59 101 7,605
Net income 3,172 85 36 70 (354) 3,009
Assets and liabilities:
Segment assets 422,442 1,388 5,090 1,072 (38,910) 391,082
Segment liabilities 292,491 185 4,010 360 (22,885) 274,161
Other segment information:
Property, plant and
equipment 148,256 - - 232 5,162 153,650
Depreciation and
amortization 5,920 - 2 45 66 6,033
Interest expense 5,528 - 189 - (189) 5,528
Interest income 1,011 14 1 6 (188) 844
Income tax expense 809 11 22 14 (52) 804
Petroleum Insurance Leasing Marketing
Elimination/
Others Total
March 31, 2014
Revenue:
External sales P124,471 P - P - P703 P - P125,174
Inter-segment sales 61,798 32 138 - (61,968) -
Operating income 3,317 7 211 7 (118) 3,424
Net income 2,187 34 16 12 (24) 2,225
Assets and liabilities:
Segment assets 405,309 2,487 5,053 1,029 (42,140) 371,738
Segment liabilities 276,753 1,324 3,994 258 (26,886) 255,443
Other segment nformation:
Property, plant and
equipment 142,530 - - 244 5,148 147,922
Depreciation and
amortization 1,452 - - 11 17 1,480
Interest expense 1,236 - 45 - (45) 1,236
Interest income 328 5 - 1 (45) 289
Income tax expense 800 3 6 1 - 810
- 19 -
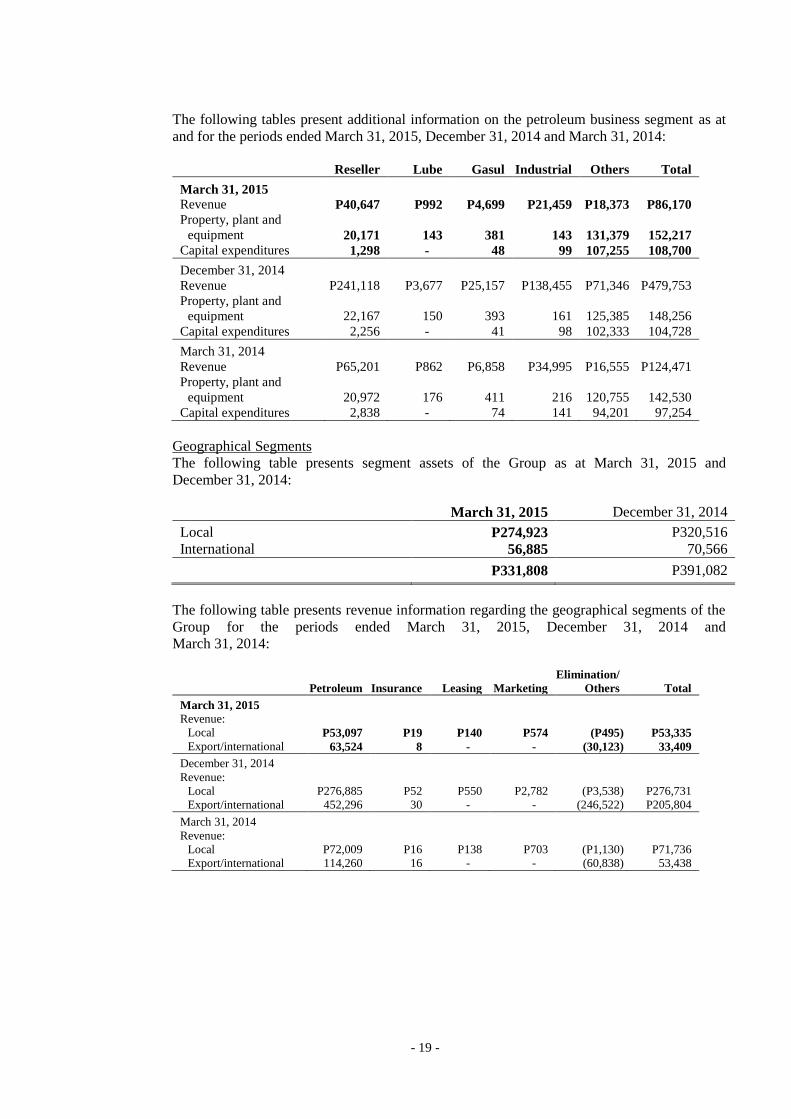
The following tables present additional information on the petroleum business segment as at
and for the periods ended March 31, 2015, December 31, 2014 and March 31, 2014:
Reseller Lube Gasul Industrial Others Total
March 31, 2015
Revenue P40,647 P992 P4,699 P21,459 P18,373 P86,170
Property, plant and
equipment 20,171 143 381 143 131,379 152,217
Capital expenditures 1,298 - 48 99 107,255 108,700
December 31, 2014
Revenue P241,118 P3,677 P25,157 P138,455 P71,346 P479,753
Property, plant and
equipment 22,167 150 393 161 125,385 148,256
Capital expenditures 2,256 - 41 98 102,333 104,728
March 31, 2014
Revenue P65,201 P862 P6,858 P34,995 P16,555 P124,471
Property, plant and
equipment 20,972 176 411 216 120,755 142,530
Capital expenditures 2,838 - 74 141 94,201 97,254
Geographical Segments
The following table presents segment assets of the Group as at March 31, 2015 and
December 31, 2014:
March 31, 2015 December 31, 2014
Local P274,923 P320,516
International 56,885 70,566
P331,808 P391,082
The following table presents revenue information regarding the geographical segments of the
Group for the periods ended March 31, 2015, December 31, 2014 and
March 31, 2014:
Petroleum Insurance Leasing Marketing
Elimination/
Others Total
March 31, 2015
Revenue:
Local P53,097 P19 P140 P574 (P495) P53,335
Export/international 63,524 8 - - (30,123) 33,409
December 31, 2014
Revenue:
Local P276,885 P52 P550 P2,782 (P3,538) P276,731
Export/international 452,296 30 - - (246,522) P205,804
March 31, 2014
Revenue:
Local P72,009 P16 P138 P703 (P1,130) P71,736
Export/international 114,260 16 - - (60,838) 53,438

- 20 -
5. Property, Plant and Equipment
This account consists of:
Buildings
and Related
Facilities
Refinery
and Plant
Equipment
Service
Stations
and Other
Equipment
Computers,
Office and
Motor
Equipment
Land and
Leasehold
Improvements
Construction
In-progress Total
Cost:
December 31, 2013 P27,862 P49,647 P15,669 P4,157 P12,302 P92,268 P201,905
Additions 161 207 687 219 57 14,591 15,922
Disposals/reclassifications/
acquisition of subsidiaries 695 1,265 179 (8) 2,327 (2,020) 2,438
Currency translation
adjustment (388) (587) (393) (40) (411) (110) (1,929)
December 31, 2014 28,330 50,532 16,142 4,328 14,275 104,729 218,336
Additions 103 60 169 19 66 6,209 6,626
Disposals/reclassifications 28 (2) (121) (12) 1 (59) (165)
Currency translation
adjustment (532) (646) (426) (50) (446) (146) (2,246)
March 31, 2015 27,929 49,944 15,764 4,285 13,896 110,733 222,551
Accumulated depreciation
and amortization:
December 31, 2013 15,803 30,285 9,673 2,897 1,600 - 60,258
Additions 1,331 1,887 1,310 863 103 - 5,494
Disposals/reclassifications/
acquisition of subsidiaries (49) (40) (274) (47) 422 - 12
Currency translation
adjustment (319) 86 (238) (578) (29) - (1,078)
December 31, 2014 16,766 32,218 10,471 3,135 2,096 - 64,686
Additions 308 477 318 190 25 - 1,318
Disposals/reclassifications (6) - (24) (8) - - (38)
Currency translation
adjustment (290) (374) (230) (142) (27) - (1,063)
March 31, 2015 16,778 32,321 10,535 3,175 2,094 - 64,903
Net book value:
December 31, 2014 P11,564 P18,314 P5,671 P1,193 P12,179 P104,729 P153,650
March 31, 2015 P11,151 P17,623 P5,229 P1,110 P11,802 P110,733 P157,648
Capital Commitments
As at March 31, 2015 and December 31, 2014, the Group has outstanding commitments to
acquire property, plant and equipment amounting to P4,828 and P4,537, respectively.
6. Fuel Supply Contract
The Parent Company entered into various fuel supply contracts with National Power
Corporation (NPC) and Power Sector Assets and Liabilities Management Corporation
(PSALM). Under these contracts, Petron supplies the bunker fuel, diesel fuel oil and engine
lubricating oil requirements of selected NPC and PSALM plants, and NPC-supplied
Independent Power Producers (IPP) plants.
As at March 31, 2015, the following are the fuel supply contracts granted to the Parent
Company:

- 21 -
NPC
Date of Contract Volume in KL Contract Price
Bid Date Award Duration DFO* IFO* ELO* DFO* IFO* ELO*
Nov. 12,
2013
Jan. 2,
2014
NPC Lubuangan DP &
Others 2014 (with 6
months extension)
33,851 1,516
Jan. 22,
2014
Feb. 21,
2014
NPC Lubuangan DP &
Others (with 6 months
extension)
9,950 370
Jun 3,
2014
Jul 11,
2014
NPC ELO Patnanungan
DP & Others (with 6
months extension)
180 23
Dec. 19,
2014
Jan. 20,
2015
NPC Jomalig DP &
Others (Jan.-Dec. 2015
with 6 months
extension)
45,004 1,836
Dec. 19,
2014
Feb. 2,
2015
NPC Boac DP &
Others (Jan.-Dec. 2015
with 6 months
extension)
49,387 1,987
PSALM
Date of Contract Volume in KL Contract Price
Bid Date Award Duration DFO* IFO* ELO* DFO* IFO* ELO*
Mar. 26,
2014
Apr. 23,
2014
Power Barge 101 &
102 (April-December
2014 with 6 months
extension)
411 18
Mar. 26,
2014
Apr. 23,
2014
Power Barge 104
(April-December 2014
with 6 months
extension)
260 11
Mar. 26,
2014
Apr. 23,
2014
Naga Plant Complex
Corporation
(April-December 2014
with 6 months
extension)
301 13
Mar. 26,
2014
Apr. 23,
2014
Southern Philippines
Power Corporation
(April-December with
6 months extension)
90 4
Jun. 26,
2014
Jul. 25,
2014
Power Barge 101 &
102 (April-December
2014 with 6 months
extension)
2,091 72
Jun. 26,
2014
Jul. 25,
2014
Power Barge 104
(April-December 2014
with 6 months
extension)
2,554 87
May 27,
2014
Aug. 12,
2014
Power Barge 101 and
102 (August-December
2014 with 6 months
extension)
60 6
May 27,
2014
Aug. 12,
2014
Power Barge 104
(August-December
2014 with 6 months
extension)
90 9
Apr. 4,
2014
Aug. 22,
2014
Power Barge 104
Supplemental (August-
December 2014 with 6
months extension)
60 2
Feb. 24,
2014
Aug. 22,
2014
Naga Plant Complex
Corporation
Supplemental (August-
December 2014 with 6
months extension
500 21
Jul. 10,
2014
Aug. 22,
2014
Malaya Thermal
(August-December
2014 with 6 months
extension)
1,000 41
* IFO = Industrial Fuel Oil
DFO = Diesel Fuel Oil
ELO= Engine Lubricating Oil
KL = Kilo Liters

- 22 -
7. Related Party Disclosures
The Parent Company, certain subsidiaries, associate, joint venture and SMC and its
subsidiaries, in the normal course of business, purchase products and services from one
another. Transactions with related parties are made at normal market prices and terms. An
assessment is undertaken at each financial year by examining the financial position of the
related party and the market in which the related party operates.
The balances and transactions with related parties as of and for the periods ended
March 31, 2015 and December 31, 2014 follow:
Note Year
Revenue
from Related
Parties
Purchases
from Related
Parties
Amounts
Owed by Related
Parties
Amounts
Owed to Related
Parties Terms Conditions
Retirement e 2015 P52 P - P6,336 P - On demand/ Unsecured; plan 2014 428 - 6,263 - long-term; No
Interest bearing impairment
Intermediate a, d 2015 1 - 3 12 On demand; Unsecured; Parent 2014 5 133 5 46 Non-interest No
bearing Impairment
Under common a, b, c 2015 1,184 2,299 761 990 On demand; Unsecured; control 2014 7,261 7,298 1,026 1,089 Non-interest No
bearing Impairment
Associate a 2015 32 - 34 - On demand; Unsecured; 2014 152 - 29 - Non-interest No
bearing Impairment
Joint venture b 2015 - 40 9 - On demand; Unsecured; 2014 - 87 11 12 Non-interest No
bearing impairment
2015 P1,269 P2,339 P7,143 P1,002
2014 P7,846 P7,514 P7,334 P1,147
a. Sales relate to the Parent Company’s supply agreements with associate and various SMC
subsidiaries. Under these agreements, the Parent Company supplies the bunker, diesel
fuel, gasoline and lube requirements of selected SMC plants and subsidiaries.
b. Purchases relate to purchase of goods and services such as construction, information
technology, power and shipping from a joint venture and various subsidiaries of SMC.
c. The Parent Company entered into a lease agreement with San Miguel Properties, Inc. for
its office space covering 6,802 square meters with a monthly rate of P7.7. The lease,
which commenced on June 1, 2014, is for a period of one year and may be renewed in
accordance with the written agreement of the parties.
d. The Parent Company also pays SMC for its share in common expenses such as utilities
and administrative fees.
e. The Parent Company has interest bearing advances to Petron Corporation Employee
Retirement Plan (PCERP), included as part of “Other receivable” and “Other noncurrent
assets” accounts in the consolidated statements of financial position.
f. Amounts owed by related parties consist of trade and nontrade receivables, advances and
security deposits.
g. Amounts owed to related parties consist of trade and nontrade payables and other
noncurrent liabilities.

- 23 -
8. Loans and Borrowings
Short-term Loans
The movements of short-term loans for the three months ended March 31, 2015 follow:
Balance at January 1, 2015 P133,388
Loan availments 49,041
Loan repayments (74,891)
Translation adjustment (847)
Balance at March 31, 2015 P106,691
Average interest rates and maturities for these loans are consistent with that of
December 31, 2014.
9. Financial Risk Management Objectives and Policies
The Group’s principal financial instruments include cash and cash equivalents, debt and
equity securities, bank loans and derivative instruments. The main purpose of bank loans is to
finance working capital relating to importation of crude and petroleum products, as well as for
other general corporate purposes. The Group has other financial assets and liabilities such as
trade and other receivables and trade and other payables, which are generated directly from its
operations.
It is the Group’s policy not to enter into derivative transactions for speculative purposes. The
Group uses hedging instruments to protect its margin on its products from potential price
volatility of crude oil and products. It also enters into short-term forward currency contracts
to hedge its currency exposure on crude oil importations.
The main risks arising from the Group’s financial instruments are foreign currency risk,
interest rate risk, credit risk, liquidity risk and commodity price risk. The BOD regularly
reviews and approves the policies for managing these financial risks. Details of each of these
risks are discussed below, together with the related risk management structure.
Risk Management Structure
The Group follows an enterprise-wide risk management framework for identifying, assessing
and addressing the risk factors that affect or may affect its businesses.
The Group’s risk management process is a bottom-up approach, with each risk owner
mandated to conduct regular assessment of its risk profile and formulate action plans for
managing identified risks. As the Group’s operation is an integrated value chain, risks
emanate from every process, while some could cut across groups. The results of these
activities flow up to the Management Committee and, eventually, the BOD through the
Group’s annual business planning process.

- 24 -
Oversight and technical assistance is likewise provided by corporate units and committees
with special duties. These groups and their functions are:
a. The Risk and Insurance Management Group, which is mandated with the overall
coordination and development of the enterprise-wide risk management process.
b. The Financial Risk Management Unit of the Treasurer’s Department, which is in charge
of foreign currency hedging transactions.
c. The Transaction Management Unit of Controllers Department, which provides backroom
support for all hedging transactions.
d. The Corporate Technical & Engineering Services Group, which oversees strict adherence
to safety and environmental mandates across all facilities.
e. The Internal Audit Department, which has been tasked with the implementation of a risk-
based auditing.
f. The Commodity Risk Management Department (CRMD), which sets new and updates
existing hedging policies by the Board, provides the strategic targets and recommends
corporate hedging strategy to the Commodity Risk Management Committee and Steering
Committee.
g. Petron Singapore Trading Pte Ltd. (PSTPL) executes the hedging transactions involving
crude and product imports on behalf of the Group.
The BOD also created separate board-level entities with explicit authority and responsibility
in managing and monitoring risks, as follows:
a. The Audit Committee, which ensures the integrity of internal control activities throughout
the Group. It develops, oversees, checks and pre-approves financial management
functions and systems in the areas of credit, market, liquidity, operational, legal and other
risks of the Group, and crisis management. The Internal Audit Department and the
External Auditor directly report to the Audit Committee regarding the direction, scope
and coordination of audit and any related activities.
b. The Compliance Officer, who is a senior officer of the Parent Company reports to the
BOD. The Compliance Officer monitors compliance with the provisions and
requirements of the Corporate Governance Manual, determines any possible violations
and recommends corresponding penalties, subject to review and approval of the BOD.
The Compliance Officer identifies and monitors compliance risk. Lastly, the Compliance
Officer represents the Group before the SEC regarding matters involving compliance with
the Corporate Governance Manual.
Foreign Currency Risk
The Parent Company’s functional currency is the Philippine peso, which is the denomination
of the bulk of the Group’s revenues. The Group’s exposures to foreign currency risk arise
mainly from US dollar-denominated sales as well as purchases principally of crude oil and
petroleum products. As a result of this, the Group maintains a level of US dollar-denominated
assets and liabilities during the period. Foreign currency risk occurs due to differences in the
levels of US dollar-denominated assets and liabilities.
The Group’s exposure to foreign currency risks also arise from US dollar-denominated sales
and purchases, principally of crude oil and petroleum products, of Petron Malaysia whose
transactions are in Malaysian ringgit, which are subsequently converted into US dollar before

- 25 -
ultimately translated to equivalent Philippine peso amount using applicable rates for the
purpose of consolidation.
The Group pursues a policy of mitigating foreign currency risk by entering into hedging
transactions or by substituting US dollar-denominated liabilities with peso-based debt. The
natural hedge provided by US dollar-denominated assets is also factored in hedging decisions.
As a matter of policy, currency hedging is limited to the extent of 100% of the underlying
exposure.
The Group is allowed to engage in active risk management strategies for a portion of its
foreign currency risk exposure. Loss limits are in place, monitored daily and regularly
reviewed by management.
Information on the Group’s US dollar-denominated financial assets and liabilities and their
Philippine peso equivalents are as follows:
March 31, 2015 December 31, 2014
US Dollar
Phil. Peso
Equivalent US Dollar
Phil. Peso
Equivalent
Assets
Cash and cash equivalents 876 39,164 1,252 56,039
Trade and other receivables 468 20,949 585 26,168
Other assets 45 1,997 53 2,357
1,389 62,110 1,890 84,564
Liabilities
Short-term loans 454 20,280 776 34,713
Liabilities for crude oil and
petroleum product importation 617 27,600 945 42,263
Long-term debts (including current
maturities) 1,106 49,432 1,111 49,676
Other liabilities 368 16,444 712 31,869
2,545 113,756 3,544 158,521
Net foreign currency -
denominated monetary liabilities (1,156) (51,646) (1,654) (73,957)
The Group incurred net foreign currency losses amounting to P431 and P846 for the period
ended March 31, 2015 and March 31, 2014, respectively, that were mainly countered by
certain marked-to-market gains (losses) and hedging gains (losses) (Note 10). The foreign
currency rates from Philippine peso (Php) to US dollar (US$) as of reporting dates are shown
in the following table:
Peso to US Dollar
December 31, 2013 44.40
March 31, 2014 44.82
December 31, 2014 44.72
March 31, 2015 44.70
The management of foreign currency risk is also supplemented by monitoring the sensitivity
of the Group’s financial instruments to various foreign currency exchange rate scenarios.
Foreign currency exchange movements affect reported equity in the following ways:
through the retained earnings arising from increases or decreases in unrealized and
realized foreign currency gains or losses; and
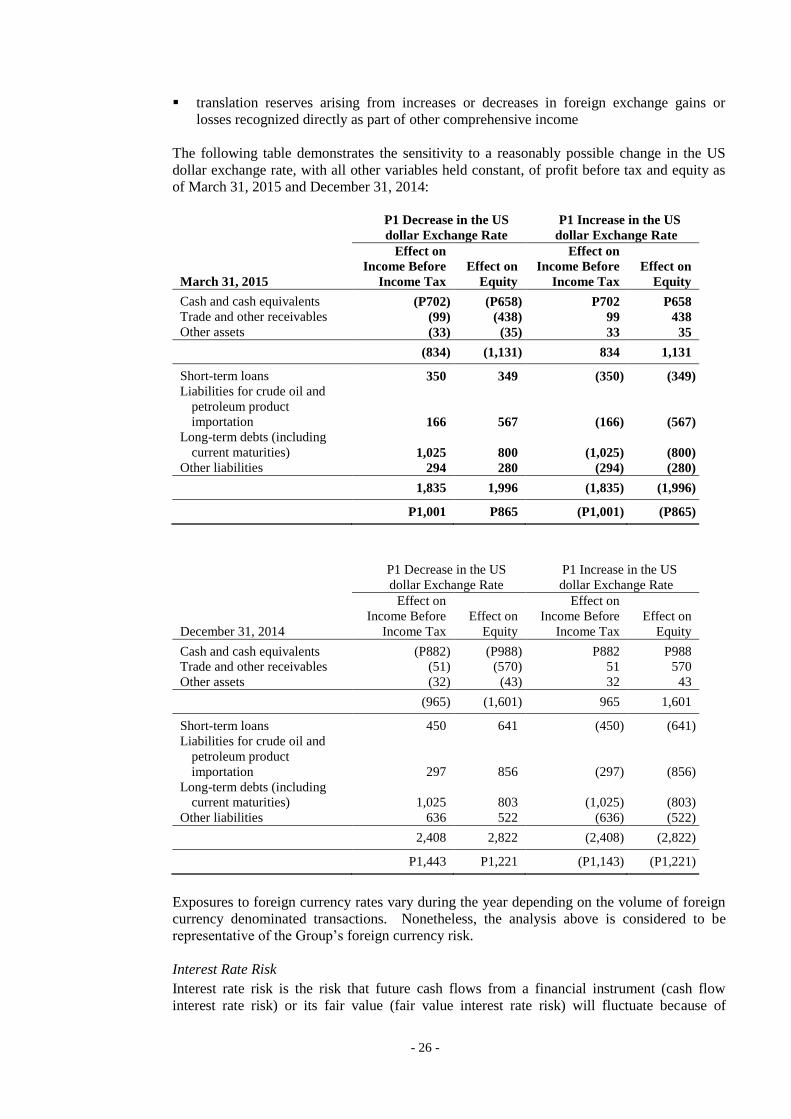
- 26 -
translation reserves arising from increases or decreases in foreign exchange gains or
losses recognized directly as part of other comprehensive income
The following table demonstrates the sensitivity to a reasonably possible change in the US
dollar exchange rate, with all other variables held constant, of profit before tax and equity as
of March 31, 2015 and December 31, 2014:
P1 Decrease in the US
dollar Exchange Rate
P1 Increase in the US
dollar Exchange Rate
March 31, 2015
Effect on
Income Before
Income Tax
Effect on
Equity
Effect on
Income Before
Income Tax
Effect on
Equity
Cash and cash equivalents (P702) (P658) P702 P658
Trade and other receivables (99) (438) 99 438
Other assets (33) (35) 33 35
(834) (1,131) 834 1,131
Short-term loans 350 349 (350) (349)
Liabilities for crude oil and
petroleum product
importation 166 567 (166) (567)
Long-term debts (including
current maturities) 1,025 800 (1,025) (800)
Other liabilities 294 280 (294) (280)
1,835 1,996 (1,835) (1,996)
P1,001 P865 (P1,001) (P865)
P1 Decrease in the US
dollar Exchange Rate
P1 Increase in the US
dollar Exchange Rate
December 31, 2014
Effect on
Income Before
Income Tax
Effect on
Equity
Effect on
Income Before
Income Tax
Effect on
Equity
Cash and cash equivalents (P882) (P988) P882 P988
Trade and other receivables (51) (570) 51 570
Other assets (32) (43) 32 43
(965) (1,601) 965 1,601
Short-term loans 450 641 (450) (641)
Liabilities for crude oil and
petroleum product
importation 297 856 (297) (856)
Long-term debts (including
current maturities) 1,025 803 (1,025) (803)
Other liabilities 636 522 (636) (522)
2,408 2,822 (2,408) (2,822)
P1,443 P1,221 (P1,143) (P1,221)
Exposures to foreign currency rates vary during the year depending on the volume of foreign
currency denominated transactions. Nonetheless, the analysis above is considered to be
representative of the Group’s foreign currency risk.
Interest Rate Risk
Interest rate risk is the risk that future cash flows from a financial instrument (cash flow
interest rate risk) or its fair value (fair value interest rate risk) will fluctuate because of

- 27 -
changes in market interest rates. The Group’s exposure to changes in interest rates relates
primarily to the Group’s long-term borrowings and investment securities. Investments
acquired or borrowings issued at fixed rates expose the Group to fair value interest rate risk.
On the other hand, investment securities or borrowings issued at variable rates expose the
Group to cash flow interest rate risk.
The Group manages its interest costs by using an optimal combination of fixed and variable
rate debt instruments. Management is responsible for monitoring the prevailing market-based
interest rates and ensures that the mark-up rates charged on its borrowings are optimal and
benchmarked against the interest rates charged by other creditor banks.
On the other hand, the Group’s investment policy is to maintain an adequate yield to match or
reduce the net interest cost from its borrowings pending the deployment of funds to their
intended use in the Group’s operations and working capital management. However, the Group
invests only in high-quality securities while maintaining the necessary diversification to avoid
concentration risk.
In managing interest rate risk, the Group aims to reduce the impact of short-term volatility on
the Group earnings. Over the longer term, however, permanent changes in interest rates would
have an impact on profit or loss.
The management of interest rate risk is also supplemented by monitoring the sensitivity of the
Group’s financial instruments to various standard and non-standard interest rate scenarios.
Interest rate movements affect reported equity through the retained earnings arising from
increases or decreases in interest income or interest expense as well as fair value changes
reported in profit or loss, if any.
The sensitivity to a reasonably possible 1% increase in the interest rates, with all other
variables held constant, would have decreased the Group’s profit before tax (through the
impact on floating rate borrowings) by P495 and P497 for the period ended
March 31, 2015 and for the year ended December 31, 2014, respectively. A 1% decrease in
the interest rate would have had the equal but opposite effect. These charges are considered to
be reasonably possible given the observation of prevailing market conditions in those periods.
There is no impact on the Group’s other comprehensive income.
Interest Rate Risk Table
As at March 31, 2015 and December 31, 2014, the terms and maturity profile of the interest-
bearing financial instruments, together with its gross amounts, are shown in the following
tables:
March 31, 2015 <1 Year 1-<2 Years 2-<3 Years 3-<4 Years 4-<5 Years >5 Years Total
Fixed Rate
Philippine peso
denominated P36 P36 P20,036 P678 P29 P2,677 P23,492
Interest rate 6.3% - 7.2% 6.3% - 7.2% 6.3% - 7.2% 6.3% - 7.2%% 6.3% - 7.2% 6.3% - 7.2%
Floating Rate
Malaysian ringgit
denominated
(expressed in PhP) - 1,002 1,204 1,204 202 - 3,612
Interest rate 1.5%+COF 1.5%+COF 1.5%+COF 1.5%+COF
US$ denominated
(expressed in Php) 6,098 18,391 12,261 6,066 3,033 - 45,849
Interest rate*
1, 3, 6 mos.
Libor +
margin
1, 3, 6 mos.
Libor +
margin
1, 3, 6 mos.
Libor +
margin
1, 3, 6 mos.
Libor +
margin
1, 3, 6 mos.
Libor +
margin
P6,134 P19,429 P33,501 P7,948 P3,264 P2,677 P72,953
*The group reprices every 3 months but has been given an option to reprice every 1 or 6 months.

- 28 -
December 31, 2014 <1 Year 1-<2 Years 2-<3 Years 3-<4 Years 4-<5 Years >5 Years Total
Fixed Rate
Philippine peso
denominated P36 P36 P20,036 P678 P29 P2,677 P23,492
Interest rate 6.3% - 7.2% 6.3% - 7.2% 6.3% - 7.2% 6.3% - 7.2%% 6.3% - 7.2% 6.3% - 7.2%
Floating Rate
Malaysian ringgit
denominated
(expressed in PhP) - 746 1,280 1,280 534 - 3,840
Interest rate 1.5%+COF 1.5%+COF 1.5%+COF 1.5%+COF
US$ denominated
(expressed in Php) 6,101 18,399 12,266 6,069 3,035 - 45,870
Interest rate*
1, 3, 6 mos.
Libor +
margin
1, 3, 6 mos.
Libor +
margin
1, 3, 6 mos.
Libor +
margin
1, 3, 6 mos.
Libor +
margin
1, 3, 6 mos.
Libor +
margin
P6,137 P19,181 P33,582 P8,027 P3,598 P2,677 P73,202
*The group reprices every 3 months but has been given an option to reprice every 1 or 6 months.
Credit Risk
Credit Risk is the risk of financial loss to the Group if a customer or counterparty to a
financial instrument fails to meet its contractual obligations. In effectively managing credit
risk, the Group regulates and extends credit only to qualified and credit-worthy customers and
counterparties, consistent with established Group credit policies, guidelines and credit
verification procedures. Requests for credit facilities from trade customers undergo stages of
review by the Sales and Finance Divisions. Approvals, which are based on amounts of credit
lines requested, are vested among line managers and top management that includes the
President and the Chairman. Generally, the maximum credit risk exposure of financial assets
is the total carrying amount of the financial assets as shown on the face of the consolidated
statements of financial position or in the notes to the consolidated financial statements, as
summarized below:
March 31, 2015 December 31, 2014
Cash in bank and cash equivalents
(net of cash on hand) P42,867 P87,906
Financial assets at FVPL 143 136
Derivative assets 280 334
Available-for-sale financial assets 487 881
Trade and other receivables - net 53,241 56,299
Due from related parties 1,746 1,747
Long-term receivables - net 43 43
Noncurrent deposits 86 90
P98,893 P147,436
The credit risk for cash in bank and cash equivalents and derivative financial instruments is
considered negligible, since the counterparties are reputable entities with high quality external
credit ratings. The credit quality of these financial assets is considered to be high grade.
In monitoring trade receivables and credit lines, the Group maintains up-to-date records where
daily sales and collection transactions of all customers are recorded in real-time and month-
end statements of accounts are forwarded to customers as collection medium. Finance
Division’s Credit Department regularly reports to management trade receivables balances
(monthly), past due accounts (weekly) and credit utilization efficiency (semi-annually).
- 29 -
Collaterals. To the extent practicable, the Group also requires collateral as security for a
credit facility to mitigate credit risk in trade receivables. Among the collaterals held are
letters of credit, bank guarantees, real estate mortgages, cash bonds and cash deposits valued
at P4,608 and P4,653 as March 31, 2015 and December 31, 2014, respectively. These
securities may only be called on or applied upon default of customers.
Credit Risk Concentration. The Group’s exposure to credit risk arises from default of
counterparty. Generally, the maximum credit risk exposure of trade and other receivables is
its carrying amount without considering collaterals or credit enhancements, if any. The Group
has no significant concentration of credit risk since the Group deals with a large number of
homogenous trade customers. The Group does not execute any guarantee in favor of any
counterparty.
Credit Quality. In monitoring and controlling credit extended to counterparty, the Group
adopts a comprehensive credit rating system based on financial and non-financial assessments
of its customers. Financial factors being considered comprised of the financial standing of the
customer while the non-financial aspects include but are not limited to the assessment of the
customer’s nature of the business, management profile, industry background, payment habit
and both present and potential business dealings with the Group.
Class A “High Grade” are accounts with strong financial capacity and business performance
and with the lowest default risk.
Class B “Moderate Grade” refers to accounts of satisfactory financial capability and credit
standing but with some elements of risks where certain measure of control is necessary in
order to mitigate risk of default.
Class C “Low Grade” are accounts with high probability of delinquency and default.
Liquidity Risk
Liquidity risk pertains to the risk that the Group will encounter difficulty in meeting
obligations associated with financial liabilities that are settled by delivering cash or another
financial asset.
The Group’s objectives in managing its liquidity risk are as follows: a) to ensure that adequate
funding is available at all times; b) to meet commitments as they arise without incurring
unnecessary costs; c) to be able to access funding when needed at the least possible cost; and
d) to maintain an adequate time spread of refinancing maturities.
The Group constantly monitors and manages its liquidity position, liquidity gaps or surplus on
a daily basis. A committed stand-by credit facility from several local banks is also available to
ensure availability of funds when necessary. The Group also uses derivative instruments such
as forwards and swaps to manage liquidity.
- 30 -
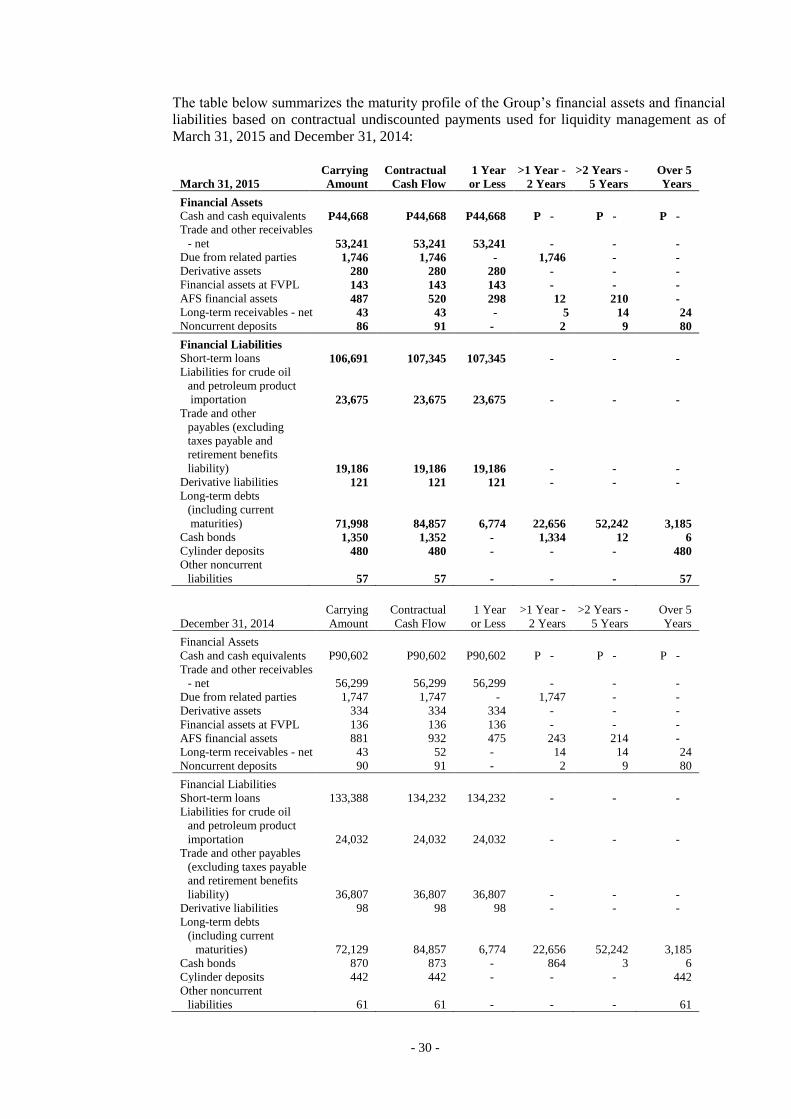
The table below summarizes the maturity profile of the Group’s financial assets and financial
liabilities based on contractual undiscounted payments used for liquidity management as of
March 31, 2015 and December 31, 2014:
March 31, 2015
Carrying
Amount
Contractual
Cash Flow
1 Year
or Less
>1 Year -
2 Years
>2 Years -
5 Years
Over 5
Years
Financial Assets
Cash and cash equivalents P44,668 P44,668 P44,668 P - P - P -
Trade and other receivables
- net 53,241 53,241 53,241 - - -
Due from related parties 1,746 1,746 - 1,746 - -
Derivative assets 280 280 280 - - -
Financial assets at FVPL 143 143 143 - - -
AFS financial assets 487 520 298 12 210 -
Long-term receivables - net 43 43 - 5 14 24
Noncurrent deposits 86 91 - 2 9 80
Financial Liabilities
Short-term loans 106,691 107,345 107,345 - - -
Liabilities for crude oil
and petroleum product
importation 23,675 23,675 23,675 - - -
Trade and other
payables (excluding
taxes payable and
retirement benefits
liability) 19,186 19,186 19,186 - - -
Derivative liabilities 121 121 121 - - -
Long-term debts
(including current
maturities) 71,998 84,857 6,774 22,656 52,242 3,185
Cash bonds 1,350 1,352 - 1,334 12 6
Cylinder deposits 480 480 - - - 480
Other noncurrent
liabilities 57 57 - - - 57
December 31, 2014
Carrying
Amount
Contractual
Cash Flow
1 Year
or Less
>1 Year -
2 Years
>2 Years -
5 Years
Over 5
Years
Financial Assets
Cash and cash equivalents P90,602 P90,602 P90,602 P - P - P -
Trade and other receivables
- net 56,299 56,299 56,299 - - -
Due from related parties 1,747 1,747 - 1,747 - -
Derivative assets 334 334 334 - - -
Financial assets at FVPL 136 136 136 - - -
AFS financial assets 881 932 475 243 214 -
Long-term receivables - net 43 52 - 14 14 24
Noncurrent deposits 90 91 - 2 9 80
Financial Liabilities
Short-term loans 133,388 134,232 134,232 - - -
Liabilities for crude oil
and petroleum product
importation 24,032 24,032 24,032 - - -
Trade and other payables
(excluding taxes payable
and retirement benefits
liability) 36,807 36,807 36,807 - - -
Derivative liabilities 98 98 98 - - -
Long-term debts
(including current
maturities) 72,129 84,857 6,774 22,656 52,242 3,185
Cash bonds 870 873 - 864 3 6
Cylinder deposits 442 442 - - - 442
Other noncurrent
liabilities 61 61 - - - 61

- 31 -
Commodity Price Risk
Commodity price risk is the risk that future cash flows from a financial instrument will
fluctuate because of changes in market prices. The Group enters into various commodity
derivatives to manage its price risks on strategic commodities. Commodity hedging allows
stability in prices, thus offsetting the risk of volatile market fluctuations. Through hedging,
prices of commodities are fixed at levels acceptable to the Group, thus protecting raw material
cost and preserving margins. For consumer (buy) hedging transactions, if prices go down,
hedge positions may show marked-to-market losses; however, any loss in the marked-to-
market position is offset by the resulting lower physical raw material cost. While for producer
(sell) hedges, if prices go down, hedge positions may show marked-to-market gains; however,
any gain in the marked-to-market position is offset by the resulting lower selling price.
To minimize the Group’s risk of potential losses due to volatility of international crude and
product prices, the Group implemented commodity hedging for crude and petroleum products.
The hedges are intended to protect crude inventories from downward price risk and margins
of MOPS (Mean of Platts of Singapore)-based sales. Hedging policy (including the use of
commodity price swaps, buying of put options, collars and 3-way options) developed by the
Commodity Risk Management Committee is in place. Decisions are guided by the conditions
set and approved by the Group’s management.
Other Market Price Risk
The Group’s market price risk arises from its investments carried at fair value [financial assets
at fair value through profit or loss (FVPL) and available for sale (AFS) financial assets]. The
Group manages its risk arising from changes in market price by monitoring the changes in the
market price of the investments.
Capital Management
The Group’s capital management policies and programs aim to provide an optimal capital
structure that would ensure the Group’s ability to continue as a going concern while at the
same time provide adequate returns to the shareholders. As such, it considers the best trade-
off between risks associated with debt financing and relatively higher cost of equity funds.
An enterprise resource planning system is used to monitor and forecast the Group’s overall
financial position. The Group regularly updates its near-term and long-term financial
projections to consider the latest available market data in order to preserve the desired capital
structure. The Group may adjust the amount of dividends paid to shareholders, issue new
shares as well as increase or decrease assets and/or liabilities, depending on the prevailing
internal and external business conditions.
The Group monitors capital via carrying amount of equity as stated in the consolidated
statements of financial position. The Group’s capital for the covered reporting period is
summarized in the table below:
March 31, 2015 December 31, 2014
Total assets P332,013 P391,324
Total liabilities 232,697 277,632
Total equity 99,316 113,692
Debt to equity ratio 2.3:1 2.4:1
There were no changes in the Group’s approach to capital management during the period.
- 32 -
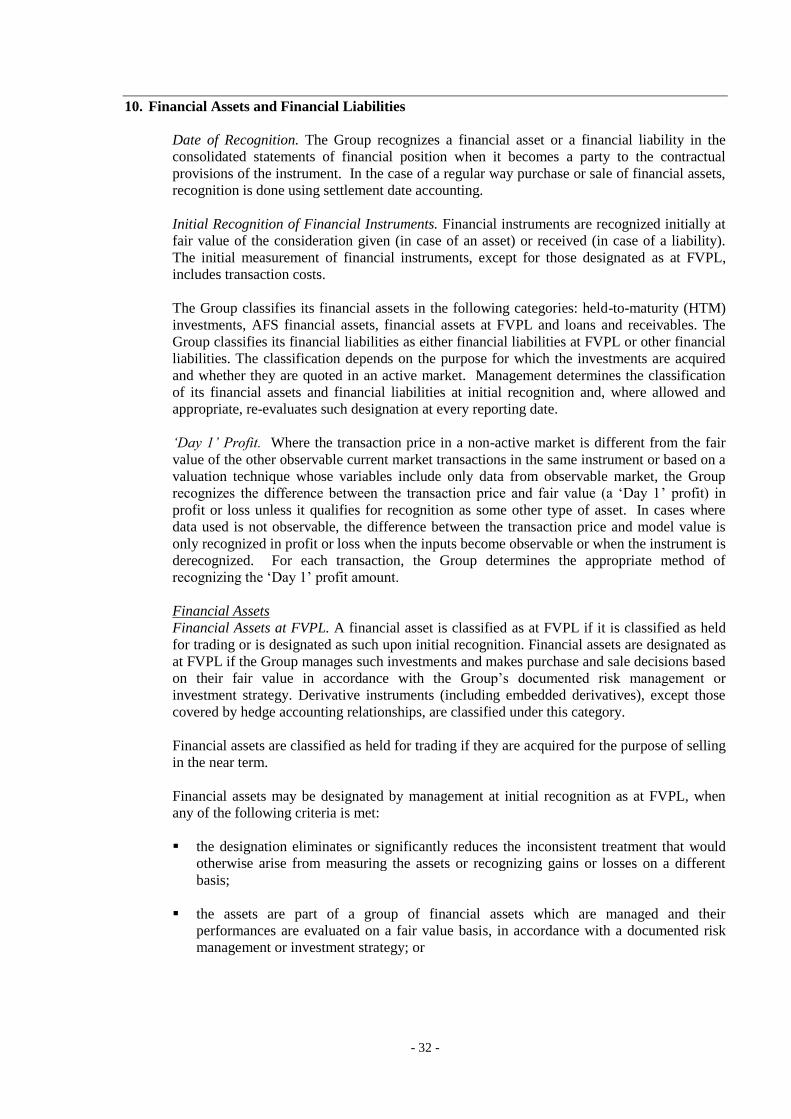
10. Financial Assets and Financial Liabilities
Date of Recognition. The Group recognizes a financial asset or a financial liability in the
consolidated statements of financial position when it becomes a party to the contractual
provisions of the instrument. In the case of a regular way purchase or sale of financial assets,
recognition is done using settlement date accounting.
Initial Recognition of Financial Instruments. Financial instruments are recognized initially at
fair value of the consideration given (in case of an asset) or received (in case of a liability).
The initial measurement of financial instruments, except for those designated as at FVPL,
includes transaction costs.
The Group classifies its financial assets in the following categories: held-to-maturity (HTM)
investments, AFS financial assets, financial assets at FVPL and loans and receivables. The
Group classifies its financial liabilities as either financial liabilities at FVPL or other financial
liabilities. The classification depends on the purpose for which the investments are acquired
and whether they are quoted in an active market. Management determines the classification
of its financial assets and financial liabilities at initial recognition and, where allowed and
appropriate, re-evaluates such designation at every reporting date.
‘Day 1’ Profit. Where the transaction price in a non-active market is different from the fair
value of the other observable current market transactions in the same instrument or based on a
valuation technique whose variables include only data from observable market, the Group
recognizes the difference between the transaction price and fair value (a ‘Day 1’ profit) in
profit or loss unless it qualifies for recognition as some other type of asset. In cases where
data used is not observable, the difference between the transaction price and model value is
only recognized in profit or loss when the inputs become observable or when the instrument is
derecognized. For each transaction, the Group determines the appropriate method of
recognizing the ‘Day 1’ profit amount.
Financial Assets
Financial Assets at FVPL. A financial asset is classified as at FVPL if it is classified as held
for trading or is designated as such upon initial recognition. Financial assets are designated as
at FVPL if the Group manages such investments and makes purchase and sale decisions based
on their fair value in accordance with the Group’s documented risk management or
investment strategy. Derivative instruments (including embedded derivatives), except those
covered by hedge accounting relationships, are classified under this category.
Financial assets are classified as held for trading if they are acquired for the purpose of selling
in the near term.
Financial assets may be designated by management at initial recognition as at FVPL, when
any of the following criteria is met:
the designation eliminates or significantly reduces the inconsistent treatment that would
otherwise arise from measuring the assets or recognizing gains or losses on a different
basis;
the assets are part of a group of financial assets which are managed and their
performances are evaluated on a fair value basis, in accordance with a documented risk
management or investment strategy; or

- 33 -
the financial instrument contains an embedded derivative, unless the embedded derivative
does not significantly modify the cash flows or it is clear, with little or no analysis, that it
would not be separately recognized.
The Group uses commodity price swaps to protect its margin on petroleum products from
potential price volatility of international crude and product prices. It also enters into short-
term forward currency contracts to hedge its currency exposure on crude oil importations. In
addition, the Parent Company has identified and bifurcated embedded foreign currency
derivatives from certain non-financial contracts.
Derivative instruments are initially recognized at fair value on the date in which a derivative
transaction is entered into or bifurcated, and are subsequently re-measured at fair value.
Derivatives are presented in the consolidated statements of financial position as assets when
the fair value is positive and as liabilities when the fair value is negative. Unrealized gains
and losses from changes in fair value of forward currency contracts and embedded derivatives
are recognized under the caption marked-to-market gains (losses) included as part of “Other
income (expenses)” in the consolidated statements of income. Unrealized gains or losses
from changes in fair value of commodity price swaps are recognized under the caption
hedging gains - net included as part of “Other income (expenses)” in the consolidated
statements of income. Realized gains or losses on the settlement of commodity price swaps
are recognized under “Others” included as part of “Cost of goods sold” in the consolidated
statements of income.
The fair values of freestanding and bifurcated forward currency transactions are calculated by
reference to current exchange rates for contracts with similar maturity profiles. The fair values
of commodity swaps are determined based on quotes obtained from counterparty banks.
The Group’s financial assets at FVPL and derivative assets are included in this category.
The carrying values of financial assets under this category amounted to P423 and P470 as of
March 31, 2015 and December 31, 2014, respectively.
Loans and Receivables. Loans and receivables are non-derivative financial assets with fixed
or determinable payments and maturities that are not quoted in an active market. They are not
entered into with the intention of immediate or short-term resale and are not designated as
AFS financial assets or financial assets at FVPL.
Subsequent to initial measurement, loans and receivables are carried at amortized cost using
the effective interest rate method, less any impairment in value. Any interest earned on loans
and receivables is recognized as part of “Interest income” in consolidated statements of
income on an accrual basis. Amortized cost is calculated by taking into account any discount
or premium on acquisition and fees that are integral part of the effective interest rate. The
periodic amortization is also included as part of “Interest income” in the consolidated
statements of income. Gains or losses are recognized in profit or loss when loans and
receivables are derecognized or impaired.
Cash includes cash on hand and in banks which are stated at face value. Cash equivalents are
short-term, highly liquid investments that are readily convertible to known amounts of cash
and are subject to an insignificant risk of changes in value.
The Group’s cash and cash equivalents, trade and other receivables, due from related parties,
long-term receivables and noncurrent deposits are included in this category.
The combined carrying values of financial assets under this category amounted to P99,784
and P148,781 as of March 31, 2015 and December 31, 2014, respectively.

- 34 -
AFS Financial Assets. AFS financial assets are non-derivative financial assets that are either
designated in this category or not classified in any of the other financial asset categories.
Subsequent to initial recognition, AFS financial assets are measured at fair value and changes
therein, other than impairment losses and foreign currency differences on AFS debt
instruments, are recognized in other comprehensive income and presented in the consolidated
statements of changes in equity. The effective yield component of AFS debt securities is
reported as part of “Interest income” account in the consolidated statements of income.
Dividends earned on holding AFS equity securities are recognized as “Dividend income”
when the right to receive payment has been established. When individual AFS financial
assets are either derecognized or impaired, the related accumulated unrealized gains or losses
previously reported in equity are transferred to and recognized in profit or loss.
For all other financial instruments not listed in an active market, the fair value is determined
by using the appropriate valuation techniques. Valuation techniques include the discounted
cash flow method price comparison to similar instruments for which observable prices exist,
option pricing level or other relevant valuation method.
The Group’s investments in equity and debt securities included under “AFS” account are
classified under this category.
The carrying values of financial assets under this category amounted to P487 and P881 as of
March 31, 2015 and December 31, 2014, respectively.
Financial Liabilities
Financial Liabilities at FVPL. Financial liabilities are classified under this category through
the fair value option. Derivative instruments (including embedded derivatives) with negative
fair values, except those covered by hedge accounting relationships, are also classified under
this category.
The Group carries financial liabilities at FVPL using their fair values and reports fair value
changes in the consolidated statements of income.
The Group’s derivative liabilities are classified under this category.
The carrying values of financial liabilities under this category amounted to P121 and P98 as
of March 31, 2015 and December 31, 2014, respectively.
Other Financial Liabilities. This category pertains to financial liabilities that are not
designated or classified as at FVPL. After initial measurement, other financial liabilities are
carried at amortized cost using the effective interest rate method. Amortized cost is calculated
by taking into account any premium or discount and any directly attributable transaction costs
that are considered an integral part of the effective interest rate of the liability.
The Group’s liabilities arising from its short term loans, liabilities for crude oil and petroleum
product importation, trade and other payables, long-term debt, cash bonds, cylinder deposits
and other non-current liabilities are included in this category.
The combined carrying values of financial liabilities under this category amounted to
P223,437 and P267,706 as of March 31, 2015 and December 31, 2014, respectively.
Debt Issue Costs
Debt issue costs are considered as directly attributable transaction cost upon initial
measurement of the related debt and subsequently considered in the calculation of amortized
cost using the effective interest method.

- 35 -
Embedded Derivatives
The Group assesses whether embedded derivatives are required to be separated from host
contracts when the Group becomes a party to the contract.
An embedded derivative is separated from the host contract and accounted for as a derivative
if all of the following conditions are met: a) the economic characteristics and risks of the
embedded derivative are not closely related to the economic characteristics and risks of the
host contract; b) a separate instrument with the same terms as the embedded derivative would
meet the definition of a derivative; and c) the hybrid or combined instrument is not recognized
at FVPL. Reassessment only occurs if there is a change in the terms of the contract that
significantly modifies the cash flows that would otherwise be required.
Derecognition of Financial Assets and Financial Liabilities
Financial Assets. A financial asset (or, where applicable, a part of a financial asset or part of a
group of similar financial assets) is primarily derecognized when:
the right to receive cash flows from the asset have expired; or
the Group has transferred its rights to receive cash flows from the asset or has assumed an
obligation to pay them in full without material delay to a third party under a “pass-
through” arrangement; and either: (a) has transferred substantially all the risks and
rewards of the asset; or (b) has neither transferred nor retained substantially all the risks
and rewards of the asset, but has transferred control of the asset.
When the Group has transferred its rights to receive cash flows from an asset or has entered
into a pass-through arrangement, it evaluates if and to what extent it has retained the risks and
rewards of the ownership. When it has neither transferred nor retained substantially all the
risks and rewards of the asset nor transferred control of the asset, the Group continues to
recognize the transferred asset to the extent of Group’s continuing involvement. In that case,
the Group also recognizes the associated liability. The transferred asset and the associated
liability are measured on the basis that reflects the rights and obligations that the Group has
retained.
Financial Liabilities. A financial liability is derecognized when the obligation under the
liability is discharged, cancelled or expired. When an existing financial liability is replaced by
another from the same lender on substantially different terms, or the terms of an existing
liability are substantially modified, such an exchange or modification is treated as a
derecognition of the original liability and the recognition of a new liability. The difference in
the respective carrying amounts is recognized in profit or loss.
Impairment of Financial Assets
The Group assesses, at the reporting date, whether there is objective evidence that a financial
asset or group of financial assets is impaired.
A financial asset or a group of financial assets is deemed to be impaired if, and only if, there
is objective evidence of impairment as a result of one or more events that have occurred after
the initial recognition of the asset (an incurred loss event) and that loss event has an impact on
the estimated future cash flows of the financial asset or the group of financial assets that can
be reliably estimated.
Assets Carried at Amortized Cost. For financial assets carried at amortized cost such as loans
and receivables, the Group first assesses whether objective evidence of impairment exists
individually for financial assets that are individually significant, or collectively for financial
assets that are not individually significant. If no objective evidence of impairment has been

- 36 -
identified for a particular financial asset that was individually assessed, the Group includes the
asset as part of a group of financial assets with similar credit risk characteristics and
collectively assesses the group for impairment. Assets that are individually assessed for
impairment and for which an impairment loss is, or continues to be, recognized are not
included in the collective impairment assessment.
Evidence of impairment for specific impairment purposes may include indications that the
borrower or a group of borrowers is experiencing financial difficulty, default or delinquency
in principal or interest payments, or may enter into bankruptcy or other form of financial
reorganization intended to alleviate the financial condition of the borrower. For collective
impairment purposes, evidence of impairment may include observable data on existing
economic conditions or industry-wide developments indicating that there is a measurable
decrease in the estimated future cash flows of the related assets.
If there is objective evidence of impairment, the amount of loss is measured as the difference
between the asset’s carrying amount and the present value of estimated future cash flows
(excluding future credit losses) discounted at the financial asset’s original effective interest
rate (i.e., the effective interest rate computed at initial recognition). Time value is generally
not considered when the effect of discounting the cash flows is not material. If a loan or
receivable has a variable rate, the discount rate for measuring any impairment loss is the
current effective interest rate, adjusted for the original credit risk premium. For collective
impairment purposes, impairment loss is computed based on their respective default and
historical loss experience.
The carrying amount of the asset shall be reduced either directly or through use of an
allowance account. The impairment loss for the period is recognized in profit or loss. If, in a
subsequent period, the amount of the impairment loss decreases and the decrease can be
related objectively to an event occurring after the impairment was recognized, the previously
recognized impairment loss is reversed. Any subsequent reversal of an impairment loss is
recognized in profit or loss, to the extent that the carrying amount of the asset does not exceed
its amortized cost at the reversal date.
AFS Financial Assets. For equity instruments carried at fair value, the Group assesses, at each
reporting date, whether objective evidence of impairment exists. Objective evidence of
impairment includes a significant or prolonged decline in the fair value of an equity
instrument below its cost. ‘Significant’ is evaluated against the original cost of the investment
and ‘prolonged’ is evaluated against the period in which the fair value has been below its
original cost. The Group generally regards fair value decline as being significant when decline
exceeds 25%. A decline in a quoted market price that persists for 12 months is generally
considered to be prolonged.
If an AFS financial asset is impaired, an amount comprising the difference between the cost
(net of any principal payment and amortization) and its current fair value, less any impairment
loss on that financial asset previously recognized in profit or loss, is transferred from equity to
profit or loss. Reversals of impairment losses in respect of equity instruments classified as
AFS financial assets are not recognized in profit or loss. Reversals of impairment losses on
debt instruments are recognized in profit or loss, if the increase in fair value of the instrument
can be objectively related to an event occurring after the impairment loss was recognized in
profit or loss.
In the case of an unquoted equity instrument or of a derivative asset linked to and must be
settled by delivery of an unquoted equity instrument for which its fair value cannot be reliably
measured, the amount of impairment loss is measured as the difference between the asset’s
carrying amount and the present value of estimated future cash flows from the asset
discounted using its historical effective rate of return on the asset.

- 37 -
Classification of Financial Instruments between Debt and Equity
From the perspective of the issuer, a financial instrument is classified as debt instrument if it
provides for a contractual obligation to:
deliver cash or another financial asset to another entity;
exchange financial assets or financial liabilities with another entity under conditions that
are potentially unfavorable to the Group; or
satisfy the obligation other than by the exchange of a fixed amount of cash or another
financial asset for a fixed number of own equity shares.
If the Group does not have an unconditional right to avoid delivering cash or another financial
asset to settle its contractual obligation, the obligation meets the definition of a financial
liability.
Offsetting Financial Instruments
Financial assets and financial liabilities are offset and the net amount is reported in the
consolidated statements of financial position if, and only if, there is a currently enforceable
legal right to offset the recognized amounts and there is an intention to settle on a net basis, or
to realize the asset and settle the liability simultaneously. This is not generally the case with
master netting agreements, and the related assets and liabilities are presented gross in the
consolidated statements of financial position.
The table below presents a comparison by category of carrying amounts and fair values of the
Group’s financial instruments as of March 31, 2015 and December 31, 2014:
March 31, 2015 December 31, 2014
Carrying
Value
Fair
Value
Carrying
Value
Fair
Value
Financial assets (FA):
Cash and cash equivalents P44,668 P44,668 P90,602 P90,602
Trade and other
receivables - net 53,241 53,241 56,299 56,299
Due from related parties 1,746 1,746 1,747 1,747
Long-term receivables - net 43 43 43 43
Noncurrent deposits 86 86 90 90
Loans and receivables 99,784 99,784 148,781 148,781
AFS financial assets 487 487 881 881
Financial assets at FVPL 143 143 136 136
Derivative assets 280 280 334 334
FA at FVPL 423 423 470 470
Total financial assets P100,694 P100,694 P150,132 P150,132
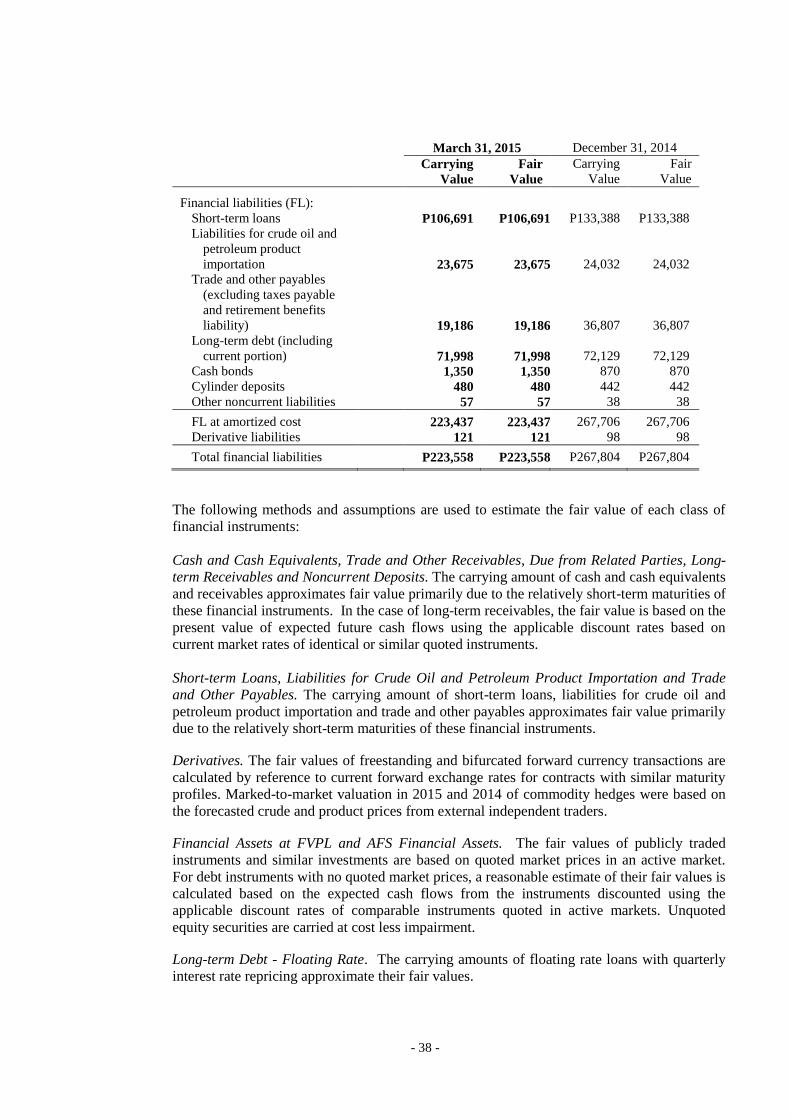
- 38 -
March 31, 2015 December 31, 2014
Carrying
Value
Fair
Value
Carrying
Value
Fair
Value
Financial liabilities (FL):
Short-term loans P106,691 P106,691 P133,388 P133,388
Liabilities for crude oil and
petroleum product
importation 23,675 23,675 24,032 24,032
Trade and other payables
(excluding taxes payable
and retirement benefits
liability) 19,186 19,186 36,807 36,807
Long-term debt (including
current portion) 71,998 71,998 72,129 72,129
Cash bonds 1,350 1,350 870 870
Cylinder deposits 480 480 442 442
Other noncurrent liabilities 57 57 38 38
FL at amortized cost 223,437 223,437 267,706 267,706
Derivative liabilities 121 121 98 98
Total financial liabilities P223,558 P223,558 P267,804 P267,804
The following methods and assumptions are used to estimate the fair value of each class of
financial instruments:
Cash and Cash Equivalents, Trade and Other Receivables, Due from Related Parties, Long-
term Receivables and Noncurrent Deposits. The carrying amount of cash and cash equivalents
and receivables approximates fair value primarily due to the relatively short-term maturities of
these financial instruments. In the case of long-term receivables, the fair value is based on the
present value of expected future cash flows using the applicable discount rates based on
current market rates of identical or similar quoted instruments.
Short-term Loans, Liabilities for Crude Oil and Petroleum Product Importation and Trade
and Other Payables. The carrying amount of short-term loans, liabilities for crude oil and
petroleum product importation and trade and other payables approximates fair value primarily
due to the relatively short-term maturities of these financial instruments.
Derivatives. The fair values of freestanding and bifurcated forward currency transactions are
calculated by reference to current forward exchange rates for contracts with similar maturity
profiles. Marked-to-market valuation in 2015 and 2014 of commodity hedges were based on
the forecasted crude and product prices from external independent traders.
Financial Assets at FVPL and AFS Financial Assets. The fair values of publicly traded
instruments and similar investments are based on quoted market prices in an active market.
For debt instruments with no quoted market prices, a reasonable estimate of their fair values is
calculated based on the expected cash flows from the instruments discounted using the
applicable discount rates of comparable instruments quoted in active markets. Unquoted
equity securities are carried at cost less impairment.
Long-term Debt - Floating Rate. The carrying amounts of floating rate loans with quarterly
interest rate repricing approximate their fair values.

- 39 -
Cash Bonds, Cylinder Deposits and Other Noncurrent Liabilities. Fair value is estimated as
the present value of all future cash flows discounted using the market rates for similar types of
instruments as of reporting date.
Derivative Financial Instruments
The Group’s derivative financial instruments according to the type of financial risk being
managed and the details of freestanding and embedded derivative financial instruments are
discussed below.
The Group enters into various currency and commodity derivative contracts to manage its
exposure on foreign currency and commodity price risk. The portfolio is a mixture of
instruments including forwards, swaps and options. These include freestanding and
embedded derivatives found in host contracts, which are not designated as accounting hedges.
Changes in fair value of these instruments are recognized directly in profit or loss.
Freestanding Derivatives
Freestanding derivatives consist of commodity and currency derivatives entered into by the
Group.
Currency Forwards
As of March 31, 2015 and December 31, 2014, the Group has outstanding foreign currency
forward contracts with aggregate notional amount of US$1,204 and US$1,673 respectively,
and with various maturities in 2015. As of March 31, 2015 the net fair value of these
currency forwards amounted to P51 while the December 31, 2014 figure is minimal.
Commodity Swaps
The Group has outstanding swap agreements covering its oil requirements, with various
maturities in 2015. Under the agreements, payment is made either by the Group or its
counterparty for the difference between the hedged fixed price and the relevant monthly
average index price.
Total outstanding equivalent notional quantity covered by the commodity swaps were
25.3 million barrels and 6.6 million barrels for March 31, 2015 and December 31, 2014,
respectively. The estimated net receipts for these transactions amounted to P246 and P1,420
for March 31, 2015 and December 31, 2014, respectively.
Embedded Derivatives
Embedded foreign currency derivatives exist in certain US dollar-denominated sales and
purchases contracts for various fuel products of Petron. Under the sales and purchase
contracts, the peso equivalent is determined using the average Philippine Dealing System rate
on the month preceding the month of delivery.
As of March 31, 2015 and December 31, 2014, the total outstanding notional amount of
currency forwards embedded in non-financial contracts are minimal. These non-financial
contracts consist mainly of foreign currency-denominated service contracts, purchase orders
and sales agreements. The embedded forwards are not clearly and closely related to their
respective host contracts. The net negative fair values of these embedded currency forwards
are minimal for both March 31, 2015 and December 31, 2014.
For the periods ended March 31, 2015 and December 31, 2014, the Group recognized
marked-to-market gains from freestanding and embedded derivatives amounting to P65 and
P733, respectively.

- 40 -
Fair Value Hierarchy
Financial assets and liabilities measured at fair value in the consolidated statements of
financial position are categorized in accordance with the fair value hierarchy. This hierarchy
groups financial assets and liabilities into three levels based on the significance of inputs used
in measuring the fair value of the financial assets and liabilities.
The Group measures a number of financial and non-financial assets and liabilities at fair value
at each reporting date.
Fair value is the price that would be received to sell an asset or paid to transfer a liability in an
orderly transaction between market participants at the measurement date. The fair value
measurement is based on the presumption that the transaction to sell the asset or transfer the
liability takes place either in the principal market for the asset or liability, or in the absence of
a principal market, in most advantageous market for the asset or liability. The principal or
most advantageous market must be accessible to the Group.
The fair value of an asset or liability is measured using the assumptions that market
participants would use when pricing the asset or liability, assuming the market participants act
in their economic best interest.
The Group uses valuation techniques that are appropriate in the circumstances and for which
sufficient data are available to measure fair value, maximizing the use of relevant observable
inputs and minimizing the use of unobservable inputs.
All assets and liabilities for which fair value is measured or disclosed in the consolidated
financial statements are categorized within the fair value hierarchy, described as follows,
based on the lowest level input that is significant to their fair value measurement as a whole:
Level 1: quoted prices (unadjusted) in active markets for identical assets or liabilities;
Level 2: inputs other than quoted prices included within Level 1 that are observable for
the asset or liability, either directly or indirectly; and
Level 3: inputs for the asset or liability that are not based on observable market data.
For assets and liabilities that are recognized in the consolidated financial statements on a
recurring basis, the Group determines whether transfers have occurred between Levels in the
hierarchy by re-assessing the categorization at the end of each reporting period.
For purposes of the fair value disclosure, the Group has determined classes of assets and
liabilities on the basis of nature, characteristics and risks of the asset or liability and the level
of the fair value hierarchy, as explained above.
The table below analyzes financial instruments carried at fair value by valuation method:
March 31, 2015 Level 1 Level 2 Total
Financial Assets:
FVPL P143 P - P143
Derivative assets - 280 280
AFS financial assets 167 320 487
Financial Liabilities:
Derivative liabilities - (121) (121)
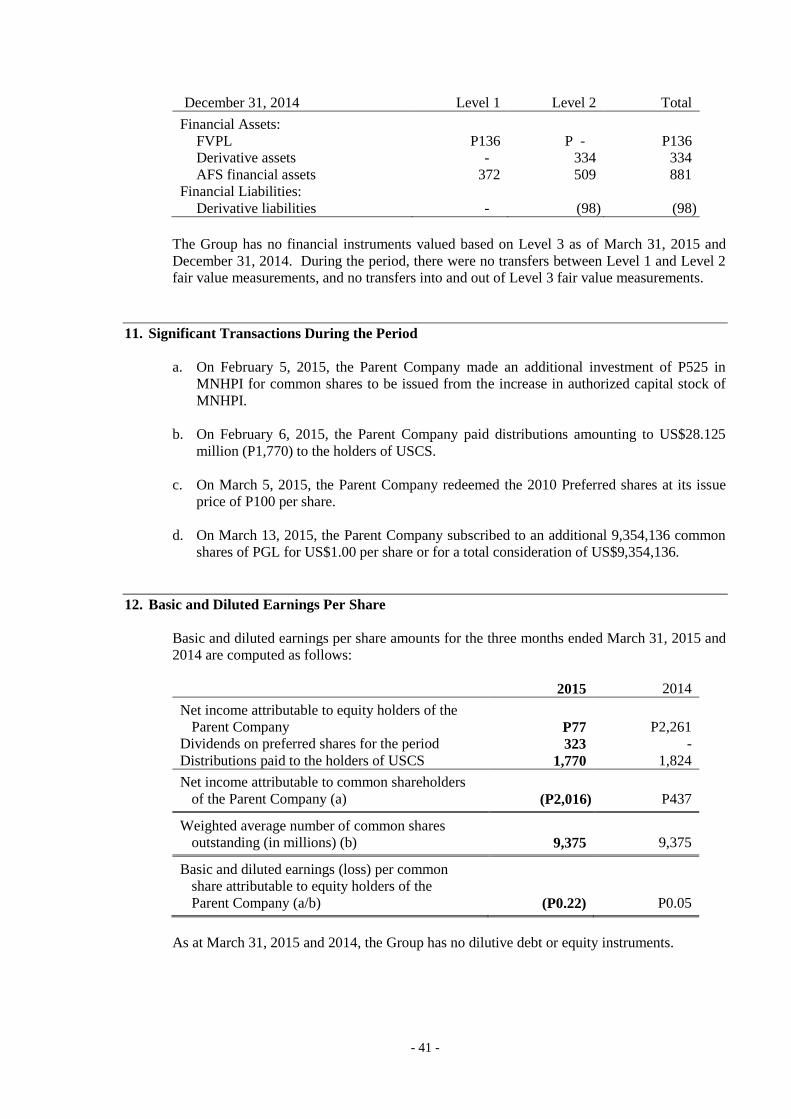
- 41 -
December 31, 2014 Level 1 Level 2 Total
Financial Assets:
FVPL P136 P - P136
Derivative assets - 334 334
AFS financial assets 372 509 881
Financial Liabilities:
Derivative liabilities - (98) (98)
The Group has no financial instruments valued based on Level 3 as of March 31, 2015 and
December 31, 2014. During the period, there were no transfers between Level 1 and Level 2
fair value measurements, and no transfers into and out of Level 3 fair value measurements.
11. Significant Transactions During the Period
a. On February 5, 2015, the Parent Company made an additional investment of P525 in
MNHPI for common shares to be issued from the increase in authorized capital stock of
MNHPI.
b. On February 6, 2015, the Parent Company paid distributions amounting to US$28.125
million (P1,770) to the holders of USCS.
c. On March 5, 2015, the Parent Company redeemed the 2010 Preferred shares at its issue
price of P100 per share.
d. On March 13, 2015, the Parent Company subscribed to an additional 9,354,136 common
shares of PGL for US$1.00 per share or for a total consideration of US$9,354,136.
12. Basic and Diluted Earnings Per Share
Basic and diluted earnings per share amounts for the three months ended March 31, 2015 and
2014 are computed as follows:
2015 2014
Net income attributable to equity holders of the
Parent Company P77 P2,261
Dividends on preferred shares for the period 323 -
Distributions paid to the holders of USCS 1,770 1,824
Net income attributable to common shareholders
of the Parent Company (a) (P2,016) P437
Weighted average number of common shares
outstanding (in millions) (b) 9,375 9,375
Basic and diluted earnings (loss) per common
share attributable to equity holders of the
Parent Company (a/b) (P0.22) P0.05
As at March 31, 2015 and 2014, the Group has no dilutive debt or equity instruments.

- 42 -
13. Dividends
On March 17, 2015, the BOD approved cash dividends for common and series 2 preferred
shareholders with the following details:
Type
Per
share Record date Payment date
Common P0.0500 April 1, 2015 April 16, 2015
Series 2A 15.7500 April 17, 2015 May 4, 2015
Series 2B 17.1458 April 17, 2015 May 4, 2015
Series 2A 15.7500 July 20, 2015 August 3, 2015
Series 2B 17.1458 July 20, 2015 August 3, 2015
14. Commitments and Contingencies
Supply and Lease Agreements
The Parent Company assigned all its rights and obligations to Petron Singapore Trading Pte.
Ltd. (as Assignee) to have a term contract to purchase the Parent Company’s crude oil
requirements from Saudi Arabian American Oil Company (“Saudi Aramco”), based on the
latter’s standard Far East selling prices. The contract is for a period of one year from
November 1, 2013 to December 31, 2014 with automatic one-year extensions thereafter
unless terminated at the option of either party, within 60 days’ written notice. Outstanding
liabilities of the Parent Company for such purchases are shown as part of “Liabilities for
Crude Oil and Petroleum Product Importation” account in the consolidated statements of
financial position as at March 31, 2015 and December 31, 2014.
On March 31, 2009, New Ventures Realty Corporation (NVRC) entered into a 30-year lease
with Philippine National Oil Company (PNOC) without rent-free period, covering a property
which is being used as site for its refinery, commencing January 1, 2010 and ending on
December 31, 2039. Based on the latest re-appraisal made, the annual rental shall be P138,
starting 2012, payable on the 15th day of January each year without the necessity of demand.
This non-cancelable lease is subject to renewal options and annual escalation clauses of 3%
per annum to be applied starting 2013 until the next re-appraisal is conducted. The leased
premises shall be reappraised in 2017 and every fifth year thereafter in which the new rental
rate shall be determined equivalent to 5% of the reappraised value, and still subject to annual
escalation clause of 3% for the four years following the re-appraisal. Prior to this agreement,
Petron had an outstanding lease agreement on the same property from PNOC. Also, as at
March 31, 2015, Petron leases other parcels of land from PNOC for its bulk plants and service
stations.
Unused Letters of Credit and Outstanding Standby Letters of Credit
Petron has unused letters of credit totaling approximately P24,448 and P31,396 as at
March 31, 2015 and December 31, 2014, respectively.
Tax Credit Certificates-Related Matters
In 1998, the Bureau of Internal Revenue (BIR) issued a deficiency excise tax assessment
against Petron relating to Petron’s use of P659 of Tax Credit Certificate (“TCCs”) to pay
certain excise tax obligations from 1993 to 1997. The TCCs were transferred to Petron by
suppliers as payment for fuel purchases. Petron contested the BIR’s assessment before the
Court of Tax Appeals (CTA). In July 1999, the CTA ruled that as a fuel supplier of BOI-
registered companies, Petron was a qualified transferee of the TCCs and that the collection of
the BIR of the alleged deficiency excise taxes was contrary to law. On March 21, 2012, the
- 43 -
Court of Appeals promulgated a decision in favor of Petron and against the BIR affirming the
ruling of the CTA striking down the assessment issued by the BIR to Petron. On
April 19, 2012, a motion for reconsideration was filed by the BIR, which was denied by the
Court of Appeals in its resolution dated October 10, 2012. The BIR elevated the case to the
Supreme Court through a petition for review on certiorari dated December 5, 2012. On
June 17, 2013, Petron filed its comment on the petition for review filed by the BIR. The
petition was still pending as of March 31, 2015.
Pandacan Terminal Operations
In November 2001, the City of Manila enacted Ordinance No. 8027 (Ordinance 8027)
reclassifying the areas occupied by the oil terminals of the Company, Pilipinas Shell
Petroleum Corporation (Shell) and Chevron Philippines Inc. (Chevron) from industrial to
commercial. This reclassification made the operation of the oil terminals in Pandacan,
Manila illegal. However, in June 2002, the Company, together with Shell and Chevron,
entered into a Memorandum of Understanding (MOU) with the City of Manila and the
Department of Energy (DOE), agreeing to scale down operations, recognizing that this was a
sensible and practical solution to reduce the economic impact of Ordinance 8027. In
December 2002, in reaction to the MOU, the Social Justice Society (SJS) filed a petition with
the Supreme Court against the Mayor of Manila asking that the latter be ordered to enforce
Ordinance 8027. In April 2003, the Company filed a petition with the Regional Trial Court
(RTC) to annul Ordinance 8027 and enjoin its implementation. On the basis of a status quo
order issued by the RTC, Mayor of Manila ceased implementation of Ordinance 8027.
The City of Manila subsequently issued the Comprehensive Land Use Plan and Zoning
Ordinance (Ordinance 8119), which applied to the entire City of Manila. Ordinance 8119
allowed the Company (and other non-conforming establishments) a seven-year grace period
to vacate. As a result of the passage of Ordinance 8119, which was thought to effectively
repeal Ordinance 8027, in April 2007, the RTC dismissed the petition filed by the Company
questioning Ordinance 8027.
However, on March 7, 2007, in the case filed by SJS, the Supreme Court rendered a decision
(March 7 Decision) directing the Mayor of Manila to immediately enforce Ordinance 8027.
On March 12, 2007, the Company, together with Shell and Chevron, filed motions with the
Supreme Court seeking intervention and reconsideration of the March 7 Decision. In the
same year, the Company also filed a petition before the RTC of Manila praying for the
nullification of Ordinance 8119 on the grounds that the reclassification of the oil terminals
was arbitrary, oppressive and confiscatory, and thus unconstitutional, and that the said
Ordinance contravened the provisions of the Water Code of the Philippines (Presidential
Decree No. 1067, the Water Code). On February 13, 2008, the Company, Shell and Chevron
were allowed by the Supreme Court to intervene in the case filed by SJS but their motions for
reconsideration were denied. The Supreme Court declared Ordinance 8027 valid and
dissolved all existing injunctions against the implementation of the Ordinance 8027.
In May 2009, Manila City Mayor Alfredo Lim approved Ordinance No. 8187 (Ordinance
8187), which amended Ordinance 8027 and Ordinance 8119 and permitted the continued
operations of the oil terminals in Pandacan.
On August 24, 2012 (August 4 Decision), the RTC of Manila ruled that Section 23 of
Ordinance 8119 relating to the reclassification of subject oil terminals had already been
repealed by Ordinance 8187; hence any issue pertaining thereto had become moot and
academic. The RTC of Manila also declared Section 55 of Ordinance 8119 null and void for
being in conflict with the Water Code. Nonetheless, the RTC upheld the validity of all other
provisions of Ordinance 8119. On September 25, 2012, the Company sought clarification and
partial consideration of the August 24 decision and prayed for the nullification of the entire
Ordinance 8119. In an Order dated December 18, 2012, the RTC of Manila denied the

- 44 -
motion filed by the Company. The Company filed a notice of appeal on January 23, 2013. In
an Order dated February 6, 2013, the RTC of Manila directed that the records of the case be
forwarded to the Court of Appeals. On April 15, 2013, the Company received an Order dated
April 1, 2013 requiring it to file its appellant’s brief. The Company submitted its appellant’s
brief on July 29, 2013. On December 19, 2013, the Company, through its counsel, received
the City of Manila’s appellee’s brief dated December 12, 2013. The Company filed its
appellant’s reply brief on February 11, 2014. As of March 31, 2015, the appeal remained
pending.
As regard to Ordinance 8187, petitions were filed before the Supreme Court, seeking for its
nullification and the enjoinment of its implementation. The Company filed a manifestation on
November 30, 2010 informing the Supreme Court that, without prejudice to its position in the
cases, it had decided to cease operation of its petroleum product storage facilities in Pandacan
within 5 years or not later than January 2016 due to the many unfounded environmental issues
being raised that tarnish the image of the Company and the various amendments being made
to the zoning ordinances of the City of Manila when the composition of the local government
changes that prevented the Company from making long-term plans. In a letter dated July 6,
2012 (with copies to the offices of the Vice Mayor and the City Council of Manila), the
Company reiterated its commitment to cease the operation of its petroleum product storage
facilities and transfer them to another location by January 2016.
On November 25, 2014, the Supreme Court issued a Decision (November 25 Decision)
declaring Ordinance 8187 unconstitutional and invalid with respect to the continued stay of
the oil terminals in Pandacan. The Company, Shell and Chevron were given 45 days from
receipt of the November 25 Decision to submit a comprehensive plan and relocation schedule
to the RTC of Manila. Acting on a motion for reconsideration filed by Shell, a Motion for
Clarification filed by Chevron, and a Manifestation filed by the Company, on
March 10, 2015, the Supreme Court denied Shell’s motion with finality and clarified that
relocation and transfer necessarily include removal of the facilities in the Pandacan terminals
and should be part of the required comprehensive plan and relocation schedule. The
Company has until May 14, 2015 to submit the documents required.
On May 5, 2015, the Company received a copy of the Order of the RTC of Manila dated
April 15, 2015, requiring it, together with Shell and Chevron, to proof compliance with the
November 25 Decision within 5 days from notice.
Oil Spill Incident in Guimaras
On August 11, 2006, MT Solar I, a third party vessel contracted by the Parent Company to
transport approximately two million liters of industrial fuel oil, sank 13 nautical miles
southwest of Guimaras, an island province in the Western Visayas region of the Philippines.
In separate investigations by the Philippine Department of Justice (DOJ) and the Special
Board of Marine Inquiry (SBMI), both agencies found the owners of MT Solar I liable. The
DOJ found the Company not criminally liable, but the SBMI found the Company to have
overloaded the vessel. The Company has appealed the findings of the SBMI to the Philippine
Department of Transportation and Communication (DOTC) and is awaiting its resolution. The
Company believes that SBMI can impose administrative penalties on vessel owners and crew,
but has no authority to penalize other parties, such as the Company, which are charterers.
In 2009, complaints for violation of the Philippine Clean Water Act of 2004 (Republic Act
No. 9275, the Clean Water Act) and homicide and less serious physical injuries were filed
against the Company. Complainants claim that their exposure to and close contact with waters
along the shoreline and mangroves affected by the oil spill has caused them major health
problems. On February 13, 2012, an Information was filed against the owner and the Captain
of MT Solar 1 and Messrs. Khalid Al-Faddagh and Nicasio Alcantara, former President and

- 45 -
Chairman of the Company, respectively, for violation of the Clean Water Act. On
March 28, 2012, the court dismissed the information for lack of probable cause and for lack of
jurisdiction over the offense charged. The Provincial Prosecutor and the private prosecutor
filed a motion for reconsideration of this March 28 Order of the court. On August 13, 2012,
the court issued an order denying the said motion for reconsideration.
Other complaints for non-payment of compensation for the clean-up operations during the oil
spill were filed by a total of 1,063 plaintiffs who allegedly did not receive any payment of
their claims for damages arising from the oil spill. The total claims for both cases amount to
P292,000. Both cases were pending as of March 31, 2015.
15. Other Matters
a. There were no seasonal aspects that had a material effect on the financial position or
financial performance of the Group.
b. There were no material off-statements of financial position items, arrangements,
obligations (including contingent obligations), and other relationship of the Group with
unconsolidated entities or other persons created during the reporting period, except for the
notional values of outstanding derivative transactions entered by the Group as of and for
the period ended March 31, 2015.
c. Known trends, demands, commitments, events or uncertainties that will have a material
impact on the Group’s liquidity:
Gross Domestic Product (GDP)
GDP expanded by 6.1% in 2014, peaking in the fourth quarter (4Q) at 6.9%. Although
2014 GDP performance is lower than the 2013 growth of 7.2%, it is still remarkable and
higher than the average growth of about 5% in the last 10 years. Growth was supported
by manufacturing, construction and the services sector (such as tourism and BPO). Robust
OFW remittance inflows and a weaker peso boosted purchasing power resulting in strong
household consumption. The improving economy of US, number two export destination
of the Philippines, also upheld GDP growth. For the first quarter (1Q) 2015, analysts
forecast GDP to continue to post strong growth of around 6% to 7% supported by low
inflation, increased government spending as the administration fast tracks progress on its
key projects and continued growth of OFW remittances, which as of year-to-date (YTD)-
February was at 2.1%, to spur personal consumption.
91-Day Treasury-Bill (T-bill) Rate
91-day T-Bills averaged 1.47% in the 1Q 2015, higher than the rates in the same quarter
last year at 1.065%, and the rate during the previous quarter 4Q 2014 at 1.286%. T-bill
rates are going up due to expectations of interest rate hike in the US by the second half
(2H) of 2015.
Peso-Dollar Exchange Rate
Peso averaged P44.4/$ in the 1Q15, a slight appreciation from the P44.8/$ average in
1Q14 and the previous quarter. Stable remittances and growing investment in the BPO
sector supports the steady peso performance.

- 46 -
Inflation
The rate of increase in prices of commodities and services slowed down in 1Q15
with inflation averaging 2.4%, from 4.1% in the same period last year and 3.6% in
the previous quarter. Lower prices were observed in the housing, water,
electricity, gas and other fuels and transport indices, while slower increase in other
commodities such as food, beverages, clothing etc. were seen.
Dubai price (Dubai)
After the plunge in oil prices starting the 3Q14, Dubai started to climb up in 2015.
Bottoming in January with Dubai average at $45.6/bbl, Dubai strengthened and
almost reached $60/bbl in March, bringing 1Q15 average at $51.8/bbl. While
some recovery was seen, Dubai remains low compared to the same quarter last
year average of $104.4/bbl and the previous quarter 4Q14 average of $74.4/bbl.
Prices dropped due to oversupply in the oil market with increased production in
the US, coupled by easing demand growth in China and Europe. The OPEC
maintaining its production target to compete in the oil market further affirmed the
abundance of supply. Providing relief to the plunge in oil prices are the
geopolitical tensions in Yemen and Libya, and the reduction in oil rig count in US
due to the lower prices.
Industry Oil Demand
Oil demand in 2014 is estimated to be robust with a favorable business
environment, continued growth of OFW remittances (at 6.3%), and a remarkable
30% growth in vehicle sales. Tightness in power supply also prompted the higher
utilization of oil-based power plants.
Illegal trading practices. Cases of smuggling and illegal trading (e.g. “bote-bote”
retailing, illegal refilling) continue to be a concern. These illegal practices have resulted in
unfair competition among players.
Known trends, events or uncertainties that have had or that are reasonably expected to
have a favorable or unfavorable impact on net sales or revenues or income from
continuing operation:
Existing or Probable Government Regulation
Philippine National Standard (PNS) Specification for E-Gasoline. DOE issued
Department Circular 2013-09-0021, dated September 19, 2013 and which took effect on
October 7, 2013, revising the PNS for gasoline. This Circular prescribes the new Research
Octane Number (RON) rating for gasoline as follows: (i) regular grade at 91 RON
minimum; (ii) premium grade at 95 RON minimum; and (iii) premium plus at 97 RON
minimum.
EO 890: Removing Import Duties on All Crude and Refined Petroleum Products. After
the ASEAN Trade in Goods Agreement (ATIGA) was implemented starting 2010, tariff
rate structure in the oil industry was distorted with crude and product imports from
ASEAN countries enjoying zero tariff while crude and product imports from outside the
ASEAN being levied 3%. To level the playing field, Petron filed a petition with the Tariff
Commission to apply the same tariff duty on crude and petroleum product imports,

- 47 -
regardless of source. In June 2010, the government approved Petron’s petition and issued
Executive Order 890 which eliminated import duties on all crude and petroleum products
regardless of source. The reduction of duties took effect on July 4, 2010.
Biofuels Act of 2006. The Biofuels Act of 2006 mandates that ethanol comprise 5% of
total gasoline volumes, and diesel contain 2% coco methyl esther (CME) systems. By
February 2012, all gasoline grades should contain 10% ethanol. However, the DOE
extended an exemption to regular gasoline and gasoline with above 97 RON from the
mandated ethanol content pending completion of technical testing on ethanol
compatibility with motor vehicle engines especially the 2-stroke motorcycle engines. For
diesel, increasing CME content to 5% is currently being evaluated.
To produce compliant fuels, the Company invested in CME injection systems at the
refinery and depots. Prior to the mandatory blending of ethanol into gasoline by 2009, the
Company already started selling ethanol blended gasoline in selected service stations in
Metro Manila in May 2008.
Currently, the increase in CME content to 5% for diesel and the continued exemption of
97 RON from ethanol content are being evaluated. Meanwhile, regular gasoline’s RON
specification was upgraded to minimum 91RON based on DOE’s DC2013-09-0021,
effectively removing the exemption of regular gasoline from the ethanol content mandate.
Laws on Oil Pollution. To address issues on marine pollution and oil spillage, the
MARINA mandated the use of double-hull vessels for transporting black products
beginning end-2008 and by January 2012 for white products.
Petron is already using double-hull vessels in transporting all products.
Clean Air Act. The Clean Air Act mandated standards on emissions of stationary and
mobile sources and fuel sulfur specifications that will enable meeting the emission
standards. Petron invested in a Gasoil Hydrotreater Plant and in an Isomerization Plant to
enable it to produce diesel and gasoline compliant with the standards set by law.
Liquefied Petroleum Gas (LPG) Bill. This bill aims to ensure safe practices and quality
standards and mitigate unfair competition in the LPG sector. All participants in the LPG
business (e.g. refillers, cylinder seal suppliers, cylinder requalifiers, repairers, scrapping
centers etc.) must obtain a license/accreditation/certification from appropriate government
agencies (e.g. Department of Energy, Department of Trade and Industry etc.) before they
operate. The Bill also imposes penalties on underfilling, underdelivering, illegal refilling
and storage, sale or distribution of LPG-filled cylinders without seals, illegal possession
of LPG cylinder seal, hoarding, and importation of used or second-hand LPG cylinders,
refusal of inspection, and non-compliance to standards.
Inclusion of LPG and kerosene in Price Act. Republic Act No. 10623, which was signed
into law by the President of the Philippines on September 6, 2013, amended the Price Act
to include household LPG and kerosene, among others, to the list of basic necessities
which are under strict monitoring by the government. Prices of these goods can be
subject to price control or price ceiling in the event of emergencies, calamities, war,
rebellion, etc.
Compliance with Euro 4 standards. The Department of Environment and Natural
Resources (DENR) issued on September 2010 an administrative order (AO 2010-23)
mandating that by 2016, all new motor vehicles that will be introduced in the market shall
comply with Euro 4 emission limits subject to Euro 4 fuel availability. The oil industry is

- 48 -
currently conducting discussions on the fuel specification requirements to comply with
the DENR administrative order come 2016.

- 49 -
PETRON CORPORATION AND SUBSIDIARIES
RECEIVABLES
As of March 31, 2015
(Amounts in Million Pesos)
Breakdown:
Accounts Receivable – Trade P20,698
Accounts Receivable – Non-Trade 32,543
Total Accounts Receivable P53,241
AGING OF TRADE ACCOUNTS RECEIVABLES
Receivables 1 – 30 days P19,296
31 – 60 days 158
61 – 90 days 42
Over 90 days 1,995
Total 21,491
Allowance for doubtful accounts 793
Accounts Receivable – Trade P20,698

- 50 -
Interim Financial Report as of March 31, 2015 Management’s Discussion and Analysis of Financial Position and Performance Financial Performance 2015 vs 2014 Petron Corporation posted a consolidated net income of P= 0.26 billion for the first quarter of 2015, significantly lower compared to the P= 2.23 billion reported during the same period in 2014. The Company continued to incur inventory losses as crude prices plunged by another US$15/bbl in January 2015 from December 2014 level. Lower margin was further reduced by the increase in non-operating charges.
Variance- Fav (Unfav)
(In Million Pesos) 2015 2014 Amt %
Sales 86,744 125,174 (38,430) (31)
Cost of Goods Sold 80,928 118,860 37,932 (32)
Gross Margin 5,816 6,314 (498) (8)
Selling and Administrative Expenses 2,848 2,890 42 1
Non-operating Charges 2,673 389 (2,284) (high)
Net Income 257 2,225 (1,968) (88)
EBITDA 3,401 5,430 (2,029) (37)
Sales Volume (MB) 22,903 20,766 2,137 10
Earnings (Loss) per Share (0.22) 0.05 (0.27) (high)
Return on Sales (%) 0.3 1.8 (1.5) (83)
Similarly, earnings before interest, taxes, depreciation and amortization (EBITDA) of P= 3.40 billion stood 37% below the P= 5.43 billion level recorded a year ago; while return on sales slid to 0.3% from 1.8%. This quarter’s payment of distributions to holders of undated subordinated capital securities resulted to P= 0.22 loss per share to common shareholders. The first quarter performance was highlighted by the following:
Sales volume grew by 2.1 million barrels (MMB) or 10% and reached 22.9 MMB with Philippine operations leading the growth. Petron Philippines (PP) volumes stood at 14.3 MMB, 20% ahead from last year due to improved gasoline and diesel sales driven by strong retail volume and increased trading transactions with competitors. LPG business and exports of petrochemicals also grew by 325 MB and 281 MB, respectively. Increases were toned down by the strategic reduction in sales of fuel oil.
Net sales dipped by 31% or P= 38.43 billion to P= 86.74 billion primarily on account of lower selling prices as regional market prices of finished products fell along with the weakened global crude oil prices. During this period, reference crude Dubai averaged US$52/bbl, only half of the US$104/bbl average in same quarter last year. The decline in selling prices, however, was tempered by the 10% increase in sales volume.
Similarly, Cost of Goods Sold (CGS) went down to P= 80.93 billion from last year’s P= 118.86 billion, or by 32% due to the cheaper cost of crude and imported products that formed part of CGS, partly offset by the cost of higher sales volume.

- 51 -
Selling and Administrative Expenses (OPEX) amounted to P= 2.85 billion, barely 1% lower than 2014’s P= 2.89 billion brought about by the decrease in advertising expenses at the back of higher LPG cylinder purchases and terminal fee resulting from move-out from Pandacan Terminal. Consolidated OPEX per liter of volume sold was lower by P= 0.09 at P= 0.78.
Net Financing Costs and Other Charges climbed to P= 2.67 billion or by P= 2.28 billion largely due to marked-to-market losses on outstanding commodity hedges during the quarter (vs gain in 2014), aggravated by the net foreign exchange losses on US dollar-denominated transactions, increased hedging costs, higher interest expense amid lower interest income.
2014 vs 2013 For the first quarter of 2014, the Company earned a consolidated net income of P= 2.23 billion, slightly better than the P= 2.20 billion earnings recorded in the first quarter of 2013. Higher earnings were due primarily to Petron Philippines’ better margin resulting from selling more profitable products. During the current period, reference prices for both crude oil and finished products stood lower but were more stable compared with the same period last year. However, the Philippine Peso (PHP) significantly depreciated versus the US Dollar (USD) from P= 40.70 to P= 44.88, thus, resulting in higher selling prices.
Variance- Fav (Unfav)
(In Million Pesos) 2014 2013 Amt %
Sales 125,174 111,998 13,176 12
Cost of Goods Sold 118,860 105,698 (13,162) (12)
Gross Margin 6,314 6,300 14 0.2
Selling and Administrative Expenses 2,890 2,587 (303) (12)
Non-operating Charges 389 724 335 46
Net Income 2,225 2,198 27 1
EBITDA 5,430 5,822 (392) (7)
Sales Volume (MB) 20,766 19,974 792 4
Earnings per Share 0.05 0.17 (0.12) (71)
Return on Sales (%) 1.8 2.0 (0.2) (10)
EBITDA declined by 7% or P= 392 million to P= 5.43 billion this quarter owing mainly to weaker operating income by P= 289 million or 8%. While net income slightly improved, earnings per share dipped to P= 0.05 from last year’s P= 0.17 as the net income attributable to common shareholders was reduced by payment of distributions to holders of undated subordinated capital securities. Return on sales stood at 1.8%. Highlights of the first quarter performance are the following:
Sales volume of 20.8 MMB exceeded previous year’s 20.0 MMB traced mainly to higher sales to Retail and Industrial sectors; partly tempered by lower Gasul and Exports volume. On a per product basis, Diesel and Gasoline surpassed last year’s sales volume level while Fuel Oil and LPG registered reductions in line with the Company’s initiative to achieve a more favorable sales mix.
Net sales revenue rose by 12% or P= 13.17 billion from P= 112 billion to P= 125.17 billion in 2014 due mainly to higher selling price prompted by the depreciation of the PHP against the USD, better sales mix, supplemented by the 4% increase in volume.

- 52 -
Cost of Goods Sold (CGS) climbed to P= 118.86 billion from last year’s P= 105.70 billion on account of the hike in cost per liter combined with higher sales volume. The increase in cost was driven mainly by the P= 4.18 depreciation of the PHP tempered by the lower crude cost that went to CGS (2014: US$111.59/barrel vs. 2013: US$112.99/barrel).
Selling and Administrative Expenses (OPEX) reached P= 2.89 billion, 12% more than last year’s P= 2.59 billion. The surge in OPEX was triggered primarily by the depreciation, rent and property taxes of additional service stations in the Philippines, increases in advertising expense and salaries and wages, and higher expenditures for the requalification of LPG cylinders and rebranding-related expenses for service stations in Malaysia. Consolidated OPEX per liter of volume sold at P= 0.88 was higher than last year’s P= 0.81.
Net Financing Costs and Other Charges dropped by P= 335 million (46%) to P= 389 million from prior year’s P= 724 million due to higher capitalized interest on loans used to finance the RMP-2 project and reduced interest expense owing to lower interest rate despite higher borrowing level; partly tempered by the decreases in unrealized commodity hedging gains and net translation gains in 2014.
Financial Position 2015 vs 2014 Petron’s consolidated assets as of March 31, 2015 reached P= 332.01 billion, 15% or P= 59.31 billion lower compared to end-December 2014 level of P= 391.32 billion brought about by the reduction in Cash and cash equivalents, Inventories and Trade and other receivables, partly offset by the increase in Property, Plant and Equipment. Cash and cash equivalents stood lower by more than half (51% or P= 45.93 billion) to close at P= 44.67 billion. Funds were used to pay short-term loans, dividends and interest as well as in redeeming the Company’s preferred shares issued in 2010. Financial assets at fair value through profit or loss showed a 10% reduction (P= 47 million) to P= 423 million emanated from lower marked-to-market gain on outstanding commodity hedges. Available-for-sale financial assets (current and non-current) posted a 45% reduction (P= 394 million) from P= 881 million to P= 487 million triggered by the maturity of government bonds of insurance subsidiaries. Trade and other receivables-net of P= 53.24 billion went down by 5% (P= 3.06 billion) with the collection of advances to crude supplier. Inventories dropped by 24% (or P= 12.59 billion) from P= 53.18 billion in December 2014 to P= 40.59 billion in March 2015 largely due to lower volume of crude and finished product of PP. Other current assets recorded a 5% decrease (P= 909 million) to P= 17.14 billion owing to lower balance of net input VAT. Investment in associates increased by 47% (P= 547 million) to P= 1.71 billion boosted by the additional investment in and the share in net income from the Company’s lone associate, Manila North Harbour Port, Inc. (MNHPI). Deferred Tax Assets slid to P= 205 million (by P= 37 million or 15%) prompted by the reversal of the expired Net Operating Loss Carry-Over (NOLCO) of a subsidiary. The continuous depreciation of the Malaysian ringgit versus the US dollar resulted to the 6% (P= 507 million) decline in Goodwill from P= 8.92 billion to P= 8.41 billion.

- 53 -
Other noncurrent assets-net of P= 7.38 billion registered a 5% reduction (by P= 378 million) primarily due to the amortization of PM’s long term prepaid expenses. Short-term loans and liabilities for crude oil and petroleum product importations summed-up to P= 130.37 billion, 17% or P= 27.05 billion lower than the P= 157.42 billion in December 2014 due to net settlement of short-term loans. Trade and other payables declined to P= 20.91 billion (by 47% or P= 18.23 billion) mainly attributed to payments made to various contractors and suppliers. Derivative liabilities moved up by 23% from P= 98 million to P= 121 million traced to higher marked-to-market loss on outstanding commodity hedges. Income tax payable grew by 22% or P= 16 million to P= 89 million brought about by higher taxes payable of PSTPL, NVRC and PMC. Other noncurrent liabilities of P= 1.89 billion rose by 37% (P= 514 million) due to additional cash bond received from customers. During the quarter, the redemption of the company’s preferred shares issued in 2010 resulted to the recognition of Treasury Stock of P= 10.00 billion. Other reserves amounted to negative P= 3.61 billion, 68% (P= 1.46 billion) higher than the end-December 2014 level of negative P= 2.15 billion as a result of the movement in foreign exchange translation related to the Company’s investment in foreign subsidiaries. 2014 vs 2013 Petron’s consolidated assets as of March 31, 2014 reached P= 371.90 billion, 4% or P= 14.45 billion higher compared to end-December 2013 level of P= 357.46 billion due largely to the increases in Cash and cash equivalents, Inventories, and Property, plant and equipment. Cash and cash equivalents stood higher by 8% or P= 3.88 billion to P= 54.28 billion sourced mainly from collection of advances to Petron Corporation Employees Retirement Plan (PCERP) and proceeds from additional loans. Available cash were used to purchase crude and finished product, spend for additional capital expenses for RMP-2 project and rebranding expenses at PM and pay dividends and distributions to holders of undated subordinated capital securities (USCS). Financial assets at fair value through profit or loss dropped by 41% (P= 321 million) to P= 462 million emanating from lower marked-to-market gain on outstanding foreign currency forward contracts. Inventories ballooned by 15% from P= 51.72 billion to P= 59.23 billion brought about by higher volume of finished product in PP and crude in PM. Other current assets of P= 15.80 billion was up 22% from the P= 12.93 billion level in December 2013 owing to input VAT and various prepayments such as insurance, taxes and rent. Available-for-sale financial assets (current and non-current) declined by 40% (P= 367 million) from P= 915 million to P= 548 million traced to the maturity of government securities of insurance subsidiaries. Other noncurrent assets-net decreased by 25% or P= 5.26 billion to P= 15.59 billion basically due to partial collection of advances from PCERP. Short-term loans and liabilities for crude oil and petroleum product importations moved up by 6% or P= 8.96 billion to P= 147.74 billion attributed to increased loan availments and higher crude and finished product importations.

- 54 -
Trade and other payables grew by 9% (P= 2.76 billion) to P= 32.05 billion prompted by higher liabilities to company’s contractors and suppliers. Derivative liabilities went up by 12% from P= 152 million to P= 170 million on account of higher marked-to-market loss on outstanding foreign currency forwards partly countered by lower loss on transactions with embedded derivatives. Income tax payable increased by 44% or P= 85 million to P= 279 million as a result of higher taxes payable of PM. Retirement benefits liability rose from P= 820 million to P= 860 million due to pension expense of PM. Other noncurrent liabilities escalated by 7% (P= 338 million) to P= 4.88 billion resulting from higher cylinder deposits. Other reserves amounted to negative P= 331 million as of end-March 2014, 54% (P= 390 million) better than the end-December 2013 level of negative P= 721 million brought about by the translation gain of equity in foreign subsidiaries due to the depreciation of the Philippine peso versus the US dollar.
Cash Flows
Cash outflows from operating activities for the first quarter of this year amounted to P= 7.86 billion as the Company’s internally generated cash from operations of P= 2.74 billion were not enough to fund the working capital requirements and payment of interest. Meanwhile, investing activities generated cash of P= 0.22 billion. Financing activities registered a net outflow of P= 38.23 billion due to payments of short-term loans, dividends, and distributions to holders of USCS, aside from the redemption of the 2010 issued preferred shares.
In Million Pesos
March 31, 2015
March 31, 2014
Change
Operating outflows (7,861) (1,853) (6,008)
Investing inflows/(outflows) 222 (654) (876)
Financing inflows/(outflows) (38,230) 6,185 (44,415)
Discussion of the company’s key performance indicators:
Ratio
March 31, 2015
December 31, 2014
Current Ratio 1.0 1.1
Debt to Equity Ratio 2.6 2.7
Return on Equity (%) 1.0 2.7
Interest Rate Coverage Ratio 2.5 2.8
Assets to Equity Ratio 3.3 3.4
Current Ratio - Total current assets divided by total current liabilities.

- 55 -
This ratio is a rough indication of a company's ability to service its current obligations. Generally, the higher the current ratio, the greater the "cushion" between current obligations and a company's ability to pay them as they fall due. Debt to Equity Ratio - Total liabilities divided by tangible net worth. This ratio expresses the relationship between capital contributed by creditors and that contributed by owners. It expresses the degree of protection provided by the owners for the creditors. The higher the ratio, the greater the risk being assumed by creditors. A lower ratio generally indicates greater long-term financial safety. Return on Equity - Net income divided by average total stockholders’ equity. This ratio reveals how much profit a company earned in comparison to the total amount of shareholder equity found on the statements of financial position. For the most part, the higher a company’s return on equity compared to its industry, the better. Interest Rate Coverage Ratio – EBITDA divided by interest expense and other financing charges. This ratio is used to assess the company’s financial stability by examining whether it is profitable enough to pay off its interest expenses. A ratio greater than 1 indicates that the company has more than enough interest coverage to pay off its interest expense. Assets to Equity Ratio – Total assets divided by total equity (including non-controlling interest). This ratio is used as a measure of financial leverage and long-term solvency. In essence, the function of the ratio is to determine the value of the total assets of the company, less any portion of the assets that are owned by the shareholders of the corporation.

- 56 -
PART II – OTHER INFORMATION
The issuer may, at its option, report under this item any information not previously reported
in a report on SEC Form 17-C. If disclosure of such information is made under this Part II, it
need not be repeated in a report on Form 17-C which would otherwise be required to be filed
with respect to such information or in a subsequent report on Form 17-Q.
NONE.