C HANNIBAL, MISSOURI M Channibal-mo.gov/.../Hannibal_Residential_Demand_Ana… · ·...
123
RESIDENTIAL DEMAND ANALYSIS CITY OF HANNIBAL, MISSOURI MARION COUNTY March 24, 2008 HANNIBAL DOWNTOWN MARKET AREA
Transcript of C HANNIBAL, MISSOURI M Channibal-mo.gov/.../Hannibal_Residential_Demand_Ana… · ·...

RESIDENTIAL DEMAND ANALYSIS
CITY OF HANNIBAL, MISSOURI MARION COUNTY
March 24, 2008
HANNIBAL DOWNTOWN MARKET AREA

ACKNOWLEDGMENTS
DOWNTOWN REVITALIZATION AND ECONOMIC ASSISTANCE FOR MISSOURI (DREAM) PROGRAM SPONSORS:
PLANNING CONSULTANT
PREPARED BY MISSOURI HOUSING DEVELOPMENT COMMISSION
This Page Intentionally Left Blank

Downtown Revitalization and Economic Assistance for Missouri Residential Demand Analysis
3/24/08 - i - 82112-05
Hannibal, Missouri
TABLE OF CONTENTS
Section Page
USPAP Required Information........................................................................................... ..... ...1
I. Executive Summary……………………………………………………………….. .................. 3
II. Area of Study…............................................................................................... ............7
III. Review of Previous Housing Market Studies ................................................................ 21
IV. Demographic Overview ........................................................................................... 23
• IRS Migration Data ................................................................................................ 37
V. Economic Overview……….………….................…………………………………………...41
VI. Existing Rental Housing Options………… ........................... ……………………………..45
VII. Existing Home Ownership Market……………………………… .................. ……………..77
VIII. Identification of Primary and Secondary Market Areas……………………...................... 85
- HISTA Demographic Data........................................................................................ 86
IX. Potential Residential Downtown Housing Demand…................... …………………..…...93
• Affordable Senior Rental Housing Demand Analysis…................... ……………...101
• Affordable Family Rental Housing Demand Analysis………… ................... ……..105
• Market Rate Rental Housing Demand Analysis…… .................. ………………….108
• Home Ownership Housing Demand Analysis…………….……………....………...111
• Housing Production Considerations and Financing……………................... …….113
X. Assumptions and Limiting Conditions…………………… ...................………………….115
XI. Appraisers Certification…………………………………… ................………………..…..117

Downtown Revitalization and Economic Assistance for Missouri Residential Demand Analysis
3/24/08 - ii - 82112-05
Hannibal, Missouri
This Page Intentionally Left Blank

Downtown Revitalization and Economic Assistance for Missouri Residential Demand Analysis
3/24/08 82112-05 - 1 -
Hannibal, Missouri
USPAP REQUIRED INFORMATION
The following information is required to comply with the Uniform Standards of Professional Appraisal Practice (USPAP). Intended Use of Report The intent of this report is to assist the community of Hannibal in its effort to revitalize its downtown area through the DREAM Initiative by analyzing the possible demand for housing that would support that effort. Intended Users of Report The intended users of this report are Missouri Housing Development Commission (Employer), the City of Hannibal, Peckham, Guyton, Albers & Viets, Missouri Development Finance Board, and Missouri Department of Economic Development. Analysis, Recommendation, or Opinion to be Developed The analysis, recommendations, or opinions will include the following: • A review of previous housing market studies or consumer surveys; • Identification of Primary and Secondary Market Areas • Identification of existing housing inventory and competitive locations; • Demographic analysis for the area; • Economic profile of the market; • Opinion of present and future housing demands; • Recommendations regarding the size of the residential demand pool for residential units in
the Downtown Market Area of Hannibal that could complement the downtown revitalization efforts.
Effective Date of the Report The effective date of the report is March 24, 2008. Physical, Legal, and Economic Characteristics of the Market Area The physical, legal, and economic characteristics of the market area are as described in the DREAM application submitted by the community and as further delineated in this report.

Downtown Revitalization and Economic Assistance for Missouri Residential Demand Analysis
3/24/08 82112-05 - 2 -
Hannibal, Missouri
Extraordinary Assumptions In preparing this report the appraiser has relied on various physical, economic, and demographic data and information from various sources, including market studies submitted to MHDC from other analysts, and believes the information to be to be credible, reliable, and critical to the preparation of this report. Scope of Work The scope of work necessary to prepare this report is as follows: • Physical survey of the area that is the subject of the report; • Physical survey of existing housing options in the market; • Economic survey and competitive analysis of existing housing options in the market; • Obtain and review general and historical information about the market; • Obtain and review any housing related studies prepared for the market; • Obtain and review any current information regarding activities in the market that could affect
the marketability of housing; • Obtain and analyze demographic information for the primary and secondary market areas; • Estimate the current and future household demand in the primary market area that would be
attracted to housing options in the downtown Hannibal market area; • Prepare a target market analysis for affordable, market rate, and for-sale housing in the
primary market area for family and senior households;

Downtown Revitalization and Economic Assistance for Missouri Residential Demand Analysis
3/24/08 82112-05 - 3 -
Hannibal, Missouri
SECTION I
EXECUTIVE SUMMARY The purpose of this market study is to quantify the potential residential demand in downtown Hannibal, Missouri that would complement the overall revitalization efforts of the downtown area. The analysis will consider the projected change in the number of households in the market, migration patterns of new households to the market, mobility patterns of existing households, and the profile of households that would be the likely target group for residential units in the downtown area.
Some of the conclusions of the report are as follows:
• A baseline assessment of the current residential conditions in and around the downtown revitalization area is that at the present time the housing options are limited. The recently renovated Mark Twain Hotel, which serves limited income senior households, is the highest quality housing option along Main Street, one of the primary traffic arteries in the downtown market area. The only other housing options along Main Street are upper floor units of commercial buildings. Some have been reported to be leased and some are owner occupied. There are a few residential units along Broadway, the other major traffic artery in the downtown area, but those units are limited to small multifamily dwellings and a few rental units on the upper floors of some of the commercial buildings along Broadway. There are residential historic districts in the downtown neighborhoods north of Broadway, which contain historically and architecturally significant homes. Mixed within these neighborhoods are also many single family and small multi family dwellings that generally appear to be in fair condition. No homes of historic designation were noted in the neighborhood just south of Broadway. This area contained many dwellings that were considered to be in fair to poor condition.
• The downtown area of Hannibal contains a high percentage of renter occupied units. The area contains many dwellings that were originally built as small multifamily dwellings, which has had the adverse affect of tipping the tenure of the area towards renter occupied units. Approximately 40% of the occupied units in the downtown area are renter occupied as compared to 25% to 30% in other areas of the city.
• Like many downtown areas around the country the downtown area of Hannibal has gone through a period of physical and economic decline where people and businesses have moved outward to other areas of the community. The revitalization of the downtown area will require a reversal of that trend and an increase in the 24 hour people presence in the area. Local residents need to be attracted to the downtown market area by the creation of new and unique housing options that take advantage of the urban walkability of the area and the market appeal of the proximity to the river.
• The increase in the people presence in the downtown area, like many other communities, may have to be driven by affordable rental housing. At the present time the downtown area has little housing market demand, which limits the amount of rents and home prices that can be commanded in the market. High quality affordable housing has been used effectively in other communities as a catalyst for residential renaissance in downtown markets.

Downtown Revitalization and Economic Assistance for Missouri Residential Demand Analysis
3/24/08 82112-05 - 4 -
Hannibal, Missouri
• The housing complement to the downtown revitalization efforts will be a stepped process that has already began with the renovation of the Mark Twain Hotel. The second step may have to be another affordable senior housing development or a good quality affordable family development. Once the desirability of the housing market has been established the third step can be market rate rental housing for middle and upper income households. And the final step in the process would be to repopulate the area with households in homeownership units, in the form of small homes, townhomes, condos, or lofts.
• Developers should be consider “vertical development” that takes advantage of one of the
cities greatest market attributes, which is the majestic view of the Mississippi River. Residential units that are built to allow views of the river will have strong drawing power to households from outside of the primary market area and could attract households from other parts of the county, state, and country.
• A growing and diverse residential market in the downtown market area of Hannibal will
help to support and attract existing and new businesses for local residents and make it viable for businesses to extend their business hours.
• At the present time all of the affordable housing rental markets in Hannibal seem to have
strong occupancy, and in some cases waiting lists. Much of the excess demand can be served by rental housing in the downtown market area. Affordable housing developments of good quality should be able to capture a large portion of the available demand.
• The demand for market rate rental units in multifamily developments is also reported to be
good. There does though seem to be an excess supply of single family and small multifamily rentals currently on the market, particularly in the downtown market area. Many for rent signs were observed. Any new, good quality, affordable market rate rental units developed in the downtown market area may further soften the market in the short term, but in the long run raising the quality of market rate rental housing options in the downtown market should expand the pool of prospective tenants and increase the demand for market rate rental units in the market.
• At the present time the home ownership and residential new construction market in
Hannibal has slowed down, as in most parts of the country. Like much of the country, Hannibal has probably also started to see an increase in mortgage defaults due to sub prime lending practices over the last couple of years. Many of the homes could be in the downtown market area.
• New residential units in the downtown market area should primarily be marketable to
young, small households and Empty Nesters. Both household types generally have few or no children and both groups are in a transient period in their lives.
• An area that would seem to have the greatest impact in terms of downtown revitalization is
Broadway, which seems to be the “gateway to downtown”. Curing the eyesores along this thoroughfare by the renovation, conversion, or construction of space for residential purposes will significantly improve the façade of the area in general. People judge the environment of an area by the look of its major thoroughfares, so it is critical to put the best face on Broadway.

Downtown Revitalization and Economic Assistance for Missouri Residential Demand Analysis
3/24/08 82112-05 - 5 -
Hannibal, Missouri
• The opportunity exists to use some of the lower and upper floor space of existing commercial buildings in the downtown area for residential purposes. The adaptive reuse of space in former commercial buildings has been a tremendous success in bringing the properties back to economic life and repopulating downtown markets.
• The city should consider reviewing its zoning and building codes to try and ensure that they
don’t prevent a barrier to residential production in the downtown market area. Building codes should not require existing building renovations to meet standards for new construction and zoning should allow more high density residential developments.
• The city should consider requiring owners of commercial buildings in the downtown area to
provide window treatment on the upper floor windows to eliminate the detrimental look of the “vacant unit look”.
• The Mark Twain attractions draw a large number of visitors to the community annually.
This could provide Hannibal with the opportunity to have an “open house” and showcase new and unique housing options in the downtown market area to visitors from outside of the community that may be charmed by the river and the small town charm. More thought and planning could be given to linking the visitors and tourists with the benefits of permanent residence in Hannibal.
• Some things the city could consider in order to help with downtown residential development
are to donate land or make it available below market value, use its powers of eminent domain, assist developers with land assemblage, provide parking for downtown residential developments, consider special districts for sales and income tax waivers, real estate tax abatement, consider reducing or waiving construction related fees, consider fast tracking the permit approval process, consider assisting developers with demolition and remediation costs, if necessary, and consider forming public/private partnerships with developers as a catalyst for downtown residential development.
• A quantitative analysis of the period between 2007 and 2012 indicates that the downtown
area of Hannibal could have a potential annual demand from 40 limited income senior households for affordable senior rental housing in the downtown market area of Hannibal. The demand could be higher if developments will have rental subsidy.
• A quantitative analysis of the period between 2007 and 2012 indicates that the downtown
area of Hannibal could have a potential annual demand from 41 limited income households for affordable family rental housing in the downtown market area of Hannibal.
• A quantitative analysis of the period between 2007 and 2012 indicates that the downtown
area of Hannibal could have a potential annual demand from 30 moderate income households for market rate rental housing in the downtown market area of Hannibal.
• A quantitative analysis of the period between 2007 and 2012 indicates that the downtown
area of Hannibal could have a potential annual demand from 10 households for home ownership in the downtown market area of Hannibal.
Downtown Revitalization and Economic Assistance for Missouri Residential Demand Analysis
3/24/08 82112-05 - 6 -
Hannibal, Missouri
This Page Intentionally Left Blank
Downtown Revitalization and Economic Assistance for Missouri Residential Demand Analysis
3/24/08 82112-05 - 7 -
Hannibal, Missouri
SECTION II
AREA OF STUDY
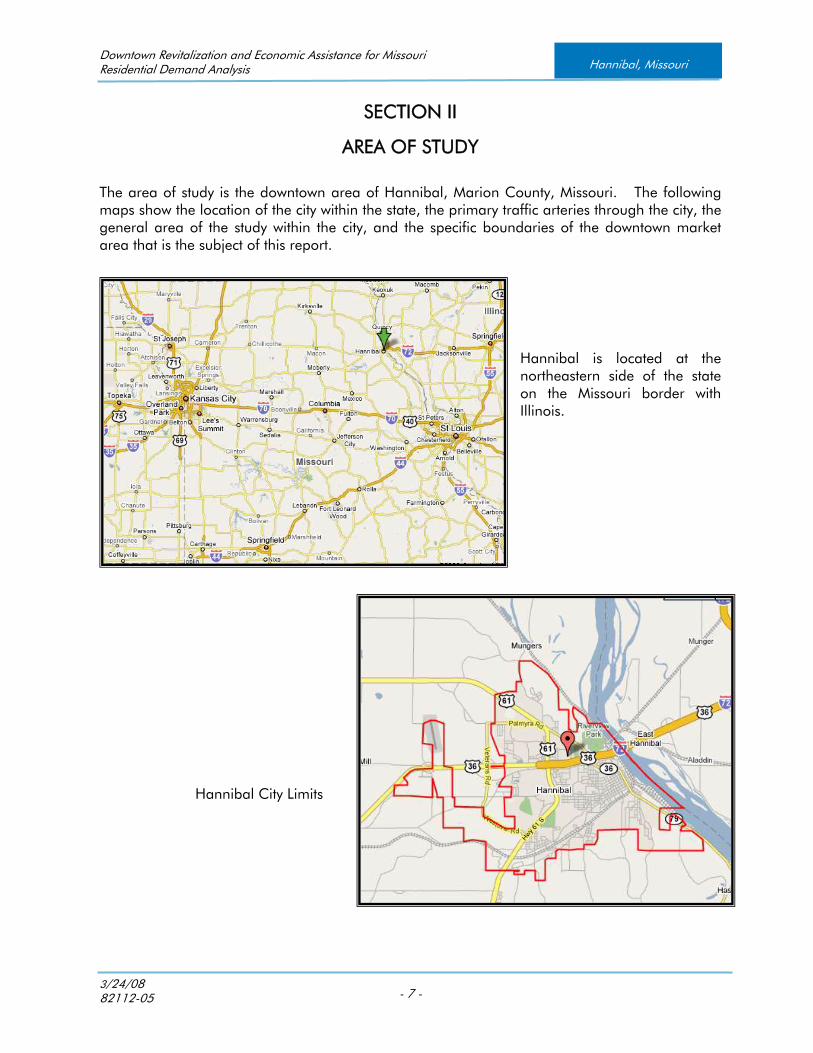
The area of study is the downtown area of Hannibal, Marion County, Missouri. The following maps show the location of the city within the state, the primary traffic arteries through the city, the general area of the study within the city, and the specific boundaries of the downtown market area that is the subject of this report.
Hannibal is located at the northeastern side of the state on the Missouri border with Illinois.
Hannibal City Limits

Downtown Revitalization and Economic Assistance for Missouri Residential Demand Analysis
3/24/08 82112-05 - 8 -
Hannibal, Missouri
The highlighted areas of the maps for purposes of this report are considered to be the downtown market area of Hannibal, Missouri.
Downtown Revitalization and Economic Assistance for Missouri Residential Demand Analysis
3/24/08 82112-05 - 9 -
Hannibal, Missouri
The downtown area of Hannibal is located at the eastern edge of the community, bordering the Mississippi River. The boundaries for purposes of this report are generally considered to be Mark Twain Avenue on the north, Colfax Avenue to the south, the Mississippi River on the east, and Grand Avenue to the west. Like many downtown areas, Hannibal’s is the center of government. In addition to the municipal government offices, Hannibal’s downtown is the location of the county government offices of Marion County and the Hannibal Federal Building. All are located on Broadway Avenue. The downtown area also contains many businesses that are associated with the governments (attorney’s offices, title companies, etc.). The downtown area also contains banks, a library, a post office, residential units, and many small businesses. Some of the small businesses in the downtown area are targeted for the local community and many are targeted for the tourists and located in a historic district related to the community’s most famous resident, Mark Twain. Mark Twain was considered to be America’s greatest humorist of 19th century American literature and the author of The Adventures of Tom Sawyer and Adventures of Huckleberry Finn. The history of Mark Twain and the fictional sites mentioned in his famous novels are a major tourist draw for the City of Hannibal and in particularly the downtown area, which is where his home is located. The primary streets in the downtown area are Main Street, which is a north/south traffic artery that is the location of most of the historic sites and tourist related businesses relating to Mark Twain, and Broadway, which is an east/west artery that is the location of the local governments and other businesses related to the local community. Because of the access to the river Hannibal in the late 1800’s became a regional marketing center for livestock and grain as well as other products produced locally, such as cement, soap, and shoes. Both people and products moved through the area by riverboats, and most of the commerce in the early days of Hannibal took place in the downtown area. Hannibal’s riverfront has not been fully developed to the level that is planned, but still attracts local visitors and tourists who are drawn to the majesty of the river, the riverboat excursions, the gardens and parks, and the boat docks. In addition to the historical sites Main Street also contains gift shops, antique stores, galleries, bars, the Mark Twain Museum, restaurants, a new car dealership, tourist related businesses and sites, and a totally renovated hotel, which is now a senior housing development. Most of the buildings along Main Street are multi-story and some have space on the upper floors that is utilized for business and residential purposes. Most of the upper floor space appears to be vacant. Because of window treatments to generally all of the upper floor windows it is not apparent that the spaces are vacant, so consequently they do not have an adverse impact on the building facades. Broadway, which is a primary east west traffic artery, is very wide and is one of the major avenues in the community. Although there are many occupied buildings along the Broadway thoroughfare, including the previously mentioned city, county and federal government offices, there are some buildings, particularly east of Seventh Street which appears to be either vacant or underutilized. Many of the buildings along Broadway also have upper floor space that in most cases appear to be vacant. Unlike the upper floors of the buildings along Main Street, the upper floors of many of the buildings along Broadway look vacant because of a lack of window covers.

Downtown Revitalization and Economic Assistance for Missouri Residential Demand Analysis
3/24/08 82112-05 - 10 -
Hannibal, Missouri
In years gone by the upper floors of commercial buildings in downtown provided many small households with affordable residential space. As times changed and the downtown area of Hannibal changed those upper floor spaces, like in many cities, lost their appeal in the expanding residential market. With the resurgence of downtown areas across America, there is a renewed interest in these upper floor areas of older commercial buildings, which are being improved as “loft style” residential units. The inventory of vacant and underutilized upper floor space in downtown Hannibal may provide opportunities for unique housing options for both prospective tenants and homeowners. The area within the boundaries of the downtown market for purposes of this study also contains a large number of residential units in the neighborhoods to the north and south of Broadway. The neighborhoods to the north of Broadway contain designated historic districts, where many of the homes are large homes of architectural and historical significance that have been maintained or restored to their near original state. Mixed among these large historic homes are also many non-historical single family and small multifamily structures that are in varying states of physical condition. Many are in average condition, but a significant number appear to be in fair to poor condition. The residential neighborhood in the downtown area that is south of Broadway does not have the same historic character as north of Broadway, and this area appears to contain a higher density of residential structures that suffer from physical deterioration and deferred maintenance. One of the characteristics of the Hannibal downtown residential area which was noted is a significant number of small multifamily dwellings. The area contains many dwellings that were originally built as two family dwellings. These types of dwellings were designed for transient households of modest incomes and unfortunately have established large parts of these neighborhoods for renter household occupancy. The latest U.S. Census data indicates that over 40% of the occupied units in the downtown market area are renter occupied. This is a much higher renter household density than any other area of the city. A benefit to the downtown revitalization efforts would be an increase in homeownership in these neighborhoods and a decrease in the level of non-owner occupied residential dwellings. Owners are stakeholders and tend to be more motivated to invest in the upkeep and improvement of their properties. Owners also are less transient, which promotes neighborhood stability. The downtown area has been replaced by the shopping centers along U.S. Highway 61 as the primary retail and service areas in the city. The Huck Finn and River Bend Shopping Centers along U.S. 61 contain Wal-Mart, J.C. Penney, Kroger, and numerous other smaller retail, service, and eating establishments. Holiday Inn and other hotel/motels are also in this area. The driving distance between downtown and the shopping areas along U.S. Highway 61 is relatively short, but residents of the downtown area would probably prefer more shopping options in the downtown area. This is especially true of senior residents.

Downtown Revitalization and Economic Assistance for Missouri Residential Demand Analysis
3/24/08 82112-05 - 11 -
Hannibal, Missouri
Plans to enhance the riverfront are in progress and when completed should make a very positive difference in the area by creating an amphitheater, walking trail, sports complex, boat harbor, and additional parking. A couple of major entertainment venues are in the works for downtown. A multi screen movie theater is planned near South Main and Broadway and the baseball park that anchors the southeast section of downtown will host collegiate baseball games. In addition, the recent historical renovation of the Mark Twain Hotel has not only restored one of Hannibal’s most notable downtown landmarks, it has also brought 34 new households to the downtown area. Overall the downtown area is stable and improving. There are clear signs of progress and many good plans in the pipeline, but there are areas of blight that must be arrested, particularly along Broadway, east of 6th Street, and in the downtown residential areas to the south of Broadway.
Looking east down Broadway from 11th Street
Old Marion County Courthouse

Downtown Revitalization and Economic Assistance for Missouri Residential Demand Analysis
3/24/08 82112-05 - 12 -
Hannibal, Missouri
South side of 6th and Broadway
Apartment building on 5th and Broadway
Buildings on south side of 4th and Broadway

Downtown Revitalization and Economic Assistance for Missouri Residential Demand Analysis
3/24/08 82112-05 - 13 -
Hannibal, Missouri
Park at 4th and Broadway
John Garth Memorial Library
Buildings on south side of 3rd and Broadway

Downtown Revitalization and Economic Assistance for Missouri Residential Demand Analysis
3/24/08 82112-05 - 14 -
Hannibal, Missouri
Buildings on north side of 3rd and Broadway
Buildings on north side of 3rd and Broadway
Buildings on south side of 3rd and Broadway

Downtown Revitalization and Economic Assistance for Missouri Residential Demand Analysis
3/24/08 82112-05 - 15 -
Hannibal, Missouri
Buildings on the south side of 2nd and Broadway
Buildings on north side of 2nd and Broadway
Looking west on Broadway from near Main
Street

Downtown Revitalization and Economic Assistance for Missouri Residential Demand Analysis
3/24/08 82112-05 - 16 -
Hannibal, Missouri
Buildings at southwest corner of Main and
Broadway
Mark Twain Statue in Riverview Park
Mark Twain historical sites in downtown
Hannibal
Downtown Revitalization and Economic Assistance for Missouri Residential Demand Analysis
3/24/08 82112-05 - 17 -
Hannibal, Missouri
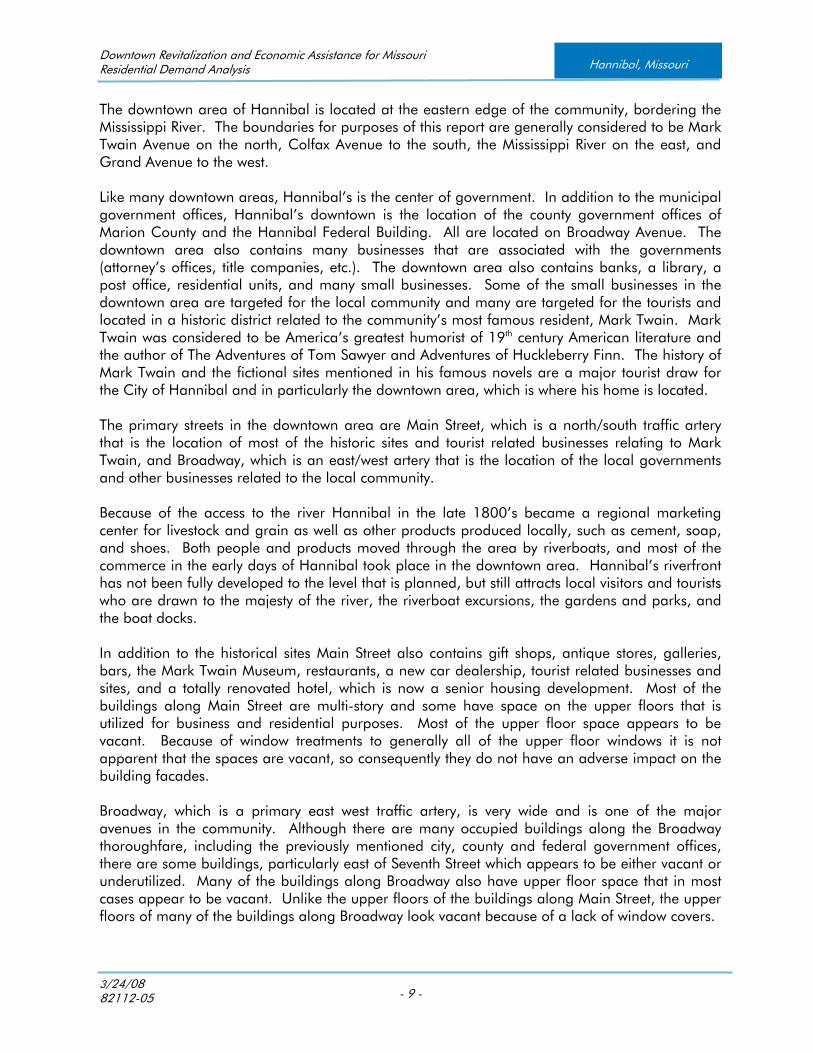
Riverboat docked on Mississippi River at
Hannibal
Looking north down Main Street from
Broadway
Looking south down Main Street in the
Evening

Downtown Revitalization and Economic Assistance for Missouri Residential Demand Analysis
3/24/08 82112-05 - 18 -
Hannibal, Missouri
Boat dock on Hannibal riverfront
Mark Twain Hotel Senior Apartments
Mississippi River and Bridge at Hannibal to
Illinois

Downtown Revitalization and Economic Assistance for Missouri Residential Demand Analysis
3/24/08 82112-05 - 19 -
Hannibal, Missouri
Docks at Hannibal Riverfront

Downtown Revitalization and Economic Assistance for Missouri Residential Demand Analysis
3/24/08 82112-05 - 20 -
Hannibal, Missouri
This Page Intentionally Left Blank
Downtown Revitalization and Economic Assistance for Missouri Residential Demand Analysis
3/24/08 82112-05 - 21 -
Hannibal, Missouri
SECTION III
REVIEW OF PREVIOUS HOUSING MARKET STUDIES
Following are points from studies or reports that were prepared for the city of Hannibal that relate to housing in the downtown market area: Comprehensive Plan for the City of Hannibal, Missouri November 4, 2003 • “As the city continues to attract new manufacturing jobs and our educational, medical and
public service positions increase, affordable housing in the $100,000-$125,000 range must be built.”
The Comprehensive Plan, Hannibal, Missouri July, 1985 • “Encourage residential growth to the west and northwest, the most suitable areas of the city
for development.” • “Develop more multi-family dwellings and condominiums, in order for housing types in
Hannibal to be nearer national trends.” • “Encourage and support the continued revitalization of older neighborhoods, recognizing the
value and importance of the older housing stock in these areas. City efforts should concentrate on enforcing city codes, maintaining public facilities, and providing community services.”
• “Construction of new housing is only part of the housing picture in Hannibal. Maintenance
of older housing is an economic and desirable way to properly house residents. However, some older housing is not worth saving and should be demolished”
• “The land use plan encourages up to 40 percent of new residential units be multifamily
(condominium and rental).”

Downtown Revitalization and Economic Assistance for Missouri Residential Demand Analysis
3/24/08 82112-05 - 22 -
Hannibal, Missouri
This Page Intentionally Left Bank

Downtown Revitalization and Economic Assistance for Missouri Residential Demand Analysis
3/24/08 82112-05 - 23 -
Hannibal, Missouri
SECTION IV
DEMOGRAPHIC OVERVIEW
In this section of the report is population, household, income, and housing demographic data in the market area of Hannibal, Missouri. The following information was obtained from the United States Census Bureau, U.S. Department of Agriculture, the Mid America Regional Information System, and several national proprietary data providers, including Applied Geographic Solutions, and Claritas.
Table 1----Total Population
Total Population
Year Hannibal
Annual
Change
%
Marion
County
Annual
Change
% Missouri
Annual
Change
%
1990 18,090 27,682 5,117,083
2000 17,757 -0.2% 28,289 0.2% 5,595,211 0.9%
2007 17,632 -0.1% 28,387 0.1% 5,877,928 0.8%
2012 17,205 -0.5% 28,621 0.2% 6,071,973 0.7%
Source: Applied Geographic Solutions, MHDC
The population of Hannibal decreased from 1990 to 2000 and the declining population trend is projected to continue. That negative growth pattern differs from Marion County and the State of Missouri. The reasons for the decline could be related to a lack of jobs or housing.

Downtown Revitalization and Economic Assistance for Missouri Residential Demand Analysis
3/24/08 82112-05 - 24 -
Hannibal, Missouri
Table 2----Population by Age
Population By Age Group
Hannibal, Missouri
Age Cohort 1990 Percent 2000 Percent 2007 Percent 2012 Percent
0-19 5,366 30% 5,227 29% 4,854 28% 4,671 27%
20-24 1,104 6% 1,238 7% 1,347 8% 1,331 8%
25-34 2,658 15% 2,158 12% 2,271 13% 2,308 13%
35-54 3,997 22% 4,805 27% 4,581 26% 4,177 24%
55-64 1,600 9% 1,361 8% 1,826 10% 2,025 12%
65-74 1,687 9% 1,330 7% 1,225 7% 1,296 8%
75-84 1,179 7% 1,128 6% 1,047 6% 944 5%
85+ 499 3% 510 3% 481 3% 453 3%
Source: Applied Geographic Solutions, MHDC The above table indicates that the largest age cohorts in the community are 0-19 years of age and 35-54 years of age. These age groups are expected to remain the largest through 2012.
Table 3----Median Age of Population
Total Population Median Age
Hannibal, Missouri
Year
1990 34.7
2000 36.0
2007 36.7
2012 36.5
Source: Applied Geographic Solutions, MHDC
The table illustrates that between 1990 and 2007 the median age of the population is estimated to have increased, which is a trend that is occurring across the state and the nation. In a trend that differs from the state and the nation the median age is projected to increase between 2007 and 2012. The increase could be attributed to a projected increase in the student population at the Hannibal-LaGrange College.

Downtown Revitalization and Economic Assistance for Missouri Residential Demand Analysis
3/24/08 82112-05 - 25 -
Hannibal, Missouri
Table 4----Population by Gender
Population By Gender
Hannibal, Missouri
Gender 1990 Percent 2000 Percent 2007 Percent 2012 Percent
Male 8,370 46% 8,237 46% 8,329 47% 8,098 47%
Female 9,720 54% 9,520 54% 9,303 53% 9,107 53%
Source: Applied Geographic Solutions, MHDC
The table illustrates that the past population gender distribution that included a majority of females is expected to remain the same through 2012.
Table 5----Total Households
Total Households
Hannibal, Missouri
Annual Annual
Year Hannibal Change %
Marion
County Change %
1990 7,112 10,728
2000 7,017 -0.1% 11,066 0.3%
2007 7,023 0.0% 11,360 0.4%
2012 7,053 0.1% 11,607 0.4%
Source: Applied Geographic Solutions, MHDC The table indicates that between 1990 and 2000 the number of households in Hannibal declined, but since that time the estimate and projection is for a slight increase through 2012.
Table 6----Average Household Size
Average Household Size
Hannibal, Missouri
Year Average
1990 2.45
2000 2.40
2007 2.34
2012 2.31
Source: Applied Geographic Solutions, MHDC

Downtown Revitalization and Economic Assistance for Missouri Residential Demand Analysis
3/24/08 82112-05 - 26 -
Hannibal, Missouri
Average household size is a statistical average calculated by dividing the number of persons living in households by the number of households (which is the same as occupied housing units). The table illustrates that the average size of households in the city has been on a decline since 1990 and is projected to continue to decline through 2012.
Table 7----Households by Size
Households By Size
Hannibal, Missouri
1990 2000 2007 2012
Household Size Number Percent Number Percent Number Percent Number Percent
1 Person 2,170 30.5% 2,155 30.7% 2,225 31.7% 2,247 31.9%
2 Persons 2,180 30.7% 2,255 32.1% 2,352 33.5% 2,361 33.5%
3 Persons 1,124 15.8% 1,137 16.2% 1,109 15.8% 1,123 15.9%
4 Persons 981 13.8% 885 12.6% 786 11.2% 781 11.1%
5 Persons 437 6.1% 409 5.8% 362 5.2% 352 5.0%
6 Persons 157 2.2% 103 1.5% 116 1.7% 119 1.7%
7+ Persons 62 0.9% 73 1.0% 73 1.0% 70 1.0%
Total 7,111 100.0% 7,017 100% 7,023 100% 7,053 100%
Source: Applied Geographic Solutions, MHDC
The table indicates that there has not been a significant change in the distribution of households in Hannibal based on the size of the household. The projection through 2012 is the same.
Table 8----Tenure by Number of Households
Tenure by Number of Households
Hannibal, Missouri
Owner Occupied Units Renter Occupied Units
Year Number Percent Number Percent
1990 4,739 67% 2,372 33%
2000 4,561 65% 2,456 35%
2007 4,599 65% 2,424 35%
2012 4,575 65% 2,478 35%
Source: Applied Geographic Solutions, MHDC
The table illustrates that the tenure patterns of the community seem to be very stable. Future tenure patterns can be influenced by a higher level of production of either owner occupied or renter occupied units.

Downtown Revitalization and Economic Assistance for Missouri Residential Demand Analysis
3/24/08 82112-05 - 27 -
Hannibal, Missouri
Table 9----Tenure by Household Size (Owner)
Tenure By Household Size
Owner Occupied Housing Units
Hannibal, Missouri
Household Size 1990 Percent 2000 Percent % Change 90-2000
1 Person 1,132 23.9% 1,168 24.7% 3.2%
2 Persons 1,697 35.8% 1,718 36.3% 1.2%
3 Persons 721 15.2% 785 16.6% 8.9%
4 Persons 684 14.4% 642 13.6% -6.1%
5 Persons 400 8.4% 285 6.0% -28.8%
6 Persons 98 2.1% 77 1.6% -21.4%
7+ Persons 10 0.2% 60 1.3% 500.0%
Source: U.S. Census Bureau The table indicates that the largest percentage of owner occupied housing units is by two-person households. Table 10----Tenure by Household Size (Renter)
Tenure By Household Size
Renter Occupied Housing Units
Hannibal, Missouri
Household Size 1990 Percent 2000 Percent % Change 90-2000
1 Person 1,040 44.5% 959 42.1% -7.8%
2 Persons 476 20.4% 519 22.8% 9.0%
3 Persons 391 16.7% 340 14.9% -13.0%
4 Persons 280 12.0% 278 12.2% -0.7%
5 Persons 95 4.1% 133 5.8% 40.0%
6 Persons 36 1.5% 34 1.5% -5.6%
7+ Persons 17 0.7% 16 0.7% -6%
Source: U.S. Census Bureau The table indicates that the largest percentage of renter occupied housing units has been one-person households.
Downtown Revitalization and Economic Assistance for Missouri Residential Demand Analysis
3/24/08 82112-05 - 28 -
Hannibal, Missouri
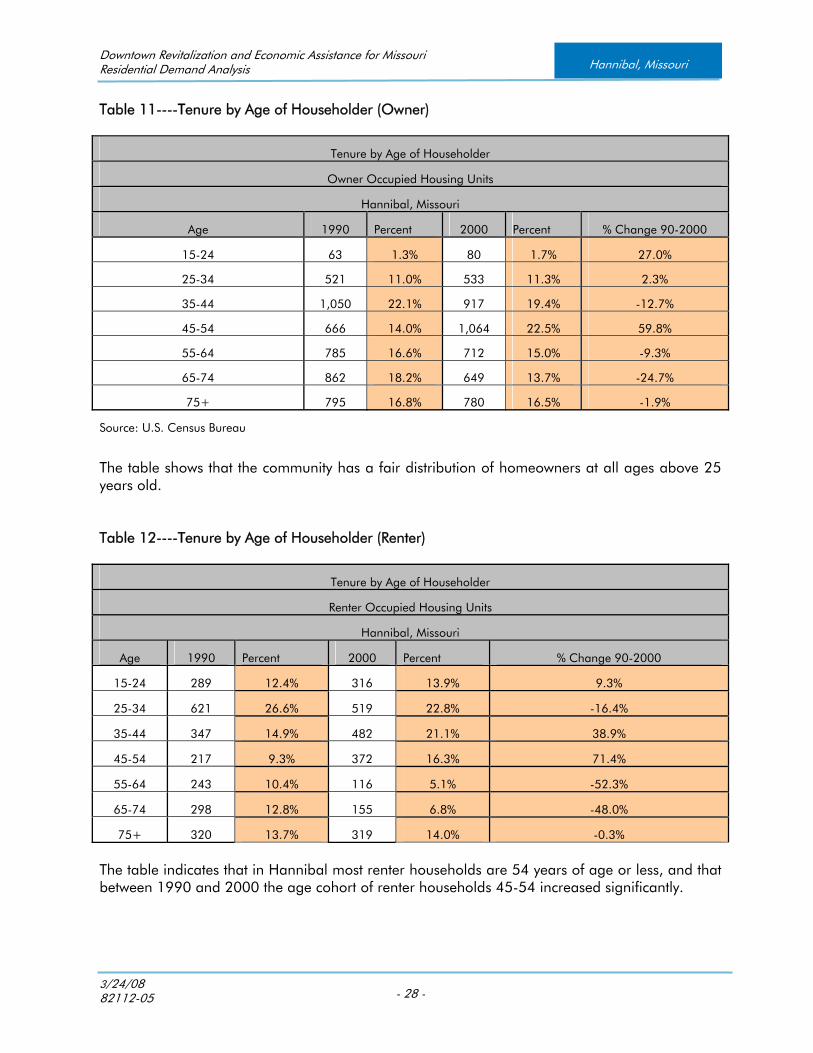
Table 11----Tenure by Age of Householder (Owner)
Tenure by Age of Householder
Owner Occupied Housing Units
Hannibal, Missouri
Age 1990 Percent 2000 Percent % Change 90-2000
15-24 63 1.3% 80 1.7% 27.0%
25-34 521 11.0% 533 11.3% 2.3%
35-44 1,050 22.1% 917 19.4% -12.7%
45-54 666 14.0% 1,064 22.5% 59.8%
55-64 785 16.6% 712 15.0% -9.3%
65-74 862 18.2% 649 13.7% -24.7%
75+ 795 16.8% 780 16.5% -1.9%
Source: U.S. Census Bureau
The table shows that the community has a fair distribution of homeowners at all ages above 25 years old. Table 12----Tenure by Age of Householder (Renter)
Tenure by Age of Householder
Renter Occupied Housing Units
Hannibal, Missouri
Age 1990 Percent 2000 Percent % Change 90-2000
15-24 289 12.4% 316 13.9% 9.3%
25-34 621 26.6% 519 22.8% -16.4%
35-44 347 14.9% 482 21.1% 38.9%
45-54 217 9.3% 372 16.3% 71.4%
55-64 243 10.4% 116 5.1% -52.3%
65-74 298 12.8% 155 6.8% -48.0%
75+ 320 13.7% 319 14.0% -0.3%
The table indicates that in Hannibal most renter households are 54 years of age or less, and that between 1990 and 2000 the age cohort of renter households 45-54 increased significantly.

Downtown Revitalization and Economic Assistance for Missouri Residential Demand Analysis
3/24/08 82112-05 - 29 -
Hannibal, Missouri
Table 13----Tenure by Bedrooms (Owner Occupied)
Tenure By Bedrooms (2000)
Owner Occupied
Hannibal, Missouri
Bedrooms Households Percentage
No BR. - 0.0%
1 199 4.2%
2 1,545 32.6%
3 2,011 42.5%
4 823 17.4%
5 or more 157 3.3%
Source: U.S. Census Bureau
The table above indicates that the majority of the owner occupied homes in Hannibal were three bedroom homes. Table 14----Tenure by Bedrooms (Renter Occupied)
Tenure By Bedrooms (2000)
Renter Occupied
Hannibal, Missouri
Bedrooms Households Percentage
No BR. 52 2.3%
1 696 30.5%
2 1,015 44.5%
3 419 18.4%
4 81 3.6%
5 or more 16 0.7%
Source: U.S. Census Bureau
The table above indicates that the distribution of rental units by bedrooms size is typical in that there are more two-bedroom units, followed by one-bedroom units, and then three-bedroom units.

Downtown Revitalization and Economic Assistance for Missouri Residential Demand Analysis
3/24/08 82112-05 - 30 -
Hannibal, Missouri
Table 15----Female Head of Household with Children
Female Head of Household with Children
Hannibal, Missouri
Year Number
1990 532
2000 654
2007 772
2012 888
Source: Applied Geographic Solutions, MHDC
The table indicates that in Hannibal there has been a consistent increase in the number of households headed by females with children and that the number of households is projected to continue to grow through 2012. Table 16----Hispanic Households
Hispanic Households
Hannibal, Missouri
Year Number
2000 58
2007 83
2012 95
Source: Applied Geographic Solutions, MHDC
The table indicates that in Hannibal there has been a consistent increase in the number of Hispanic households and the growth trend is projected through 2012.

Downtown Revitalization and Economic Assistance for Missouri Residential Demand Analysis
3/24/08 82112-05 - 31 -
Hannibal, Missouri
Table 17----Households by Income Distribution
Household Income Distribution
Hannibal, Missouri
1990 2000 2007 2012
Income Cohort Number Percent Number Percent Number Percent Number Percent
< than $10,000 1,746 24.6% 933 13.3% 806 11.5% 741 10.5%
$10,000-$14,999 974 13.7% 751 10.7% 550 7.8% 472 6.7%
$15,000-$19,999 815 11.5% 667 9.5% 581 8.3% 562 8.0%
$20,000-$24,999 721 10.1% 545 7.8% 542 7.7% 538 7.6%
$25,000-$29,999 673 9.5% 678 9.7% 475 6.8% 351 5.0%
$30,000-$34,999 562 7.9% 581 8.3% 538 7.7% 450 6.4%
$35,000-$39,999 360 5.1% 333 4.7% 464 6.6% 513 7.3%
$40,000-$49,999 529 7.4% 671 9.6% 618 8.8% 693 9.8%
$50,000-$59,999 364 5.1% 637 9.1% 570 8.1% 511 7.2%
$60,000-$74,999 166 2.3% 546 7.8% 739 10.5% 752 10.7%
$75,000-$99,999 97 1.4% 345 4.9% 585 8.3% 723 10.3%
$100,000 + 105 1.5% 330 4.7% 555 7.9% 747 10.6%
Total 7,112 100.0% 7,017 100.0% 7,023 100.0% 7,053 100.0%
Source: Applied Geographic Solutions, MHDC The table indicates that there is a wide distribution of households at various income levels in Hannibal. The number of households with incomes of $60,000 or more is projected to increase by approximately 18% between 2007 and 2012.

Downtown Revitalization and Economic Assistance for Missouri Residential Demand Analysis
3/24/08 82112-05 - 32 -
Hannibal, Missouri
Table 18----Cost Burdened Households (Hannibal) The following table illustrates the percentage of cost burdened households as of the last census (2000). A household is cost burdened if their total housing cost exceeds 30% of their income and severely cost burdened if their total housing cost exceeds 50% of their income.
Cost Burdened Households (2000) - Hannibal
Renter Owner Renter & Owner
Total 2,253 4,676 6,929
Cost Burdened >30% 28.6% 9.9% 16.0%
Severely Cost Burdened >50% 13.7% 3.8% 7.0%
Elderly 1 & 2 Persons 442 1482 1,924
Cost Burdened >30% 24.7% 10.8% 14.0%
Severely Cost Burdened >50% 7.0% 4.1% 4.8%
Single Person Non-Elderly 722 524 1,246
Cost Burdened >30% 29.1% 18.9% 24.8%
Severely Cost Burdened >50% 18.0% 11.1% 15.1%
Small Fam 2-4 Persons 914 2,270 3,184
Cost Burdened >30% 31.5% 8.0% 14.7%
Severely Cost Burdened >50% 14.1% 2.3% 5.7%
Large Fam 5+ Persons 175 400 575
Cost Burdened >30% 21.1% 5.5% 10.2%
Severely Cost Burdened >50% 10.3% 1.0% 3.8%
Source: 2000 Chas Data
Downtown Revitalization and Economic Assistance for Missouri Residential Demand Analysis
3/24/08 82112-05 - 33 -
Hannibal, Missouri
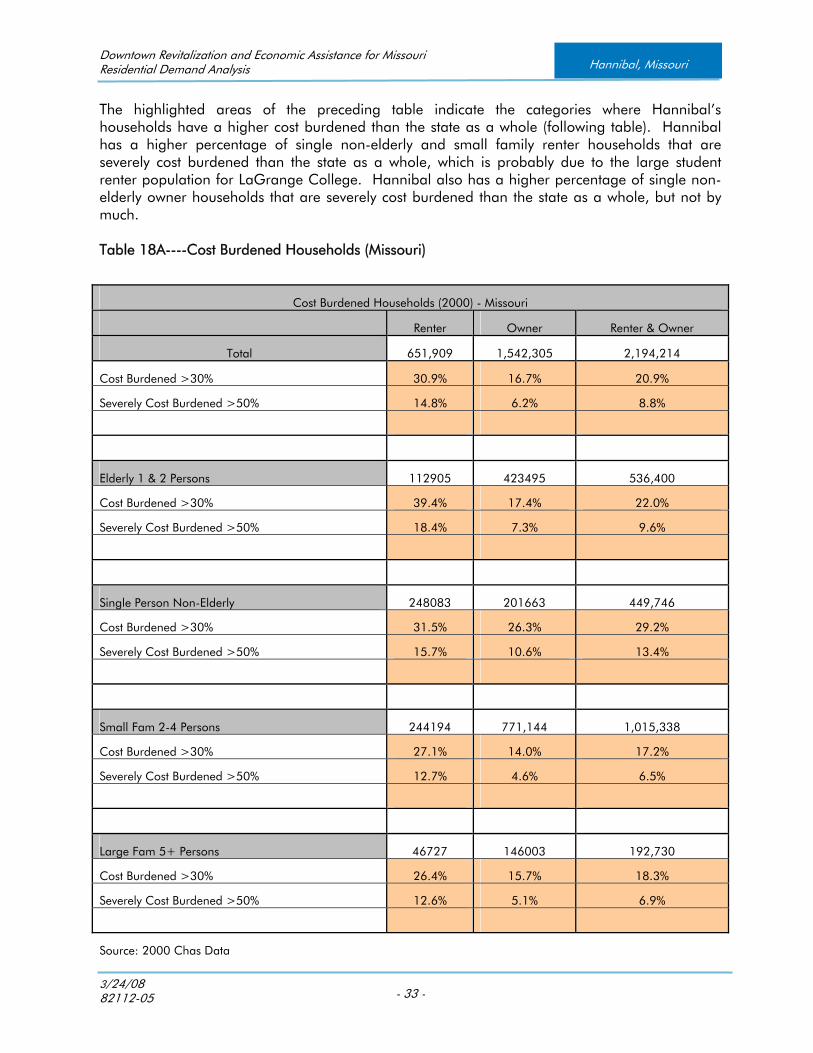
The highlighted areas of the preceding table indicate the categories where Hannibal’s households have a higher cost burdened than the state as a whole (following table). Hannibal has a higher percentage of single non-elderly and small family renter households that are severely cost burdened than the state as a whole, which is probably due to the large student renter population for LaGrange College. Hannibal also has a higher percentage of single non-elderly owner households that are severely cost burdened than the state as a whole, but not by much. Table 18A----Cost Burdened Households (Missouri)
Cost Burdened Households (2000) - Missouri
Renter Owner Renter & Owner
Total 651,909 1,542,305 2,194,214
Cost Burdened >30% 30.9% 16.7% 20.9%
Severely Cost Burdened >50% 14.8% 6.2% 8.8%
Elderly 1 & 2 Persons 112905 423495 536,400
Cost Burdened >30% 39.4% 17.4% 22.0%
Severely Cost Burdened >50% 18.4% 7.3% 9.6%
Single Person Non-Elderly 248083 201663 449,746
Cost Burdened >30% 31.5% 26.3% 29.2%
Severely Cost Burdened >50% 15.7% 10.6% 13.4%
Small Fam 2-4 Persons 244194 771,144 1,015,338
Cost Burdened >30% 27.1% 14.0% 17.2%
Severely Cost Burdened >50% 12.7% 4.6% 6.5%
Large Fam 5+ Persons 46727 146003 192,730
Cost Burdened >30% 26.4% 15.7% 18.3%
Severely Cost Burdened >50% 12.6% 5.1% 6.9%
Source: 2000 Chas Data

Downtown Revitalization and Economic Assistance for Missouri Residential Demand Analysis
3/24/08 82112-05 - 34 -
Hannibal, Missouri
Table 19----Housing Units
Housing Units-Hannibal Missouri
Year 2000 2007 2012 Housing Units 7,910 7,947 8,016
Occupied Housing Units 7,017 7,023 7,053
Vacant Housing Units 893 924 963
Owner Occ. Housing Units 4,678 4,599 4,575
Renter Occ. Housing Units 2,339 2,424 2,478 % Owner Occ. Housing Units 59.14% 57.87% 57.07%
% Renter Occ. Housing Units 29.57% 30.51% 30.91% % Vacant Housing Units 11.29% 11.63% 12.01%
Source: Applied Geographic Solutions, MHDC The table indicates that the number of housing units in the city is estimated to increase by approximately 70 units between 2007 and 2012, that approximately 12% of the housing stock is vacant, and that the projected trend in the city is a decline in the percentage of owner occupied units. Table 20----Units in Structure
Units in Structure (2000)
Hannibal, Missouri
Type Number Percentage
1, attached 5,594 71.1%
1, detached 189 2.4%
2 738 9.4%
3 or 4 466 5.9%
5 to 9 279 3.5%
10 to 19 105 1.3%
20 or more 296 3.8%
Mobile Home 203 2.6%
Total 7,870 100.0%
Source: U.S. Census Bureau The table shows that as of the last census 73.5% of the units in Hannibal were single unit structures. The balance of the units was spread across the other residential construction types, including 2.6% mobile homes.

Downtown Revitalization and Economic Assistance for Missouri Residential Demand Analysis
3/24/08 82112-05 - 35 -
Hannibal, Missouri
Table 21----Year Structure Built
Year Structure Built (2000)
Hannibal, Missouri
Year Number Percentage
1999 to March 2000 91 1.2%
1995 to 1998 376 4.8%
1990 to 1994 342 4.3%
1980 to 1989 737 9.4%
1970 to 1979 986 12.5%
1960 to 1969 759 9.6%
1950 to 1959 807 10.3%
1940 to 1949 661 8.4%
1939 or earlier 3,111 39.5%
Source: U.S. Census Bureau The table shows that as of the last census 90% of the structures in Hannibal were built prior to 1990. Table 22----Affordable Housing Program Maximum Incomes and Rents The table below illustrates the maximum income and rents for the HOME and Housing Tax Credit programs for Marion County
Maximum Income and Rents for HOME and Housing Tax Credit Programs for Marion County
Maximum Incomes Maximum HOME/LIHTC Rents
2007 Median Income
Income
% Persons in Household Bedroom Sizes
1 2 3 4 5 6 0Br 1Br 2Br 3Br 4Br
50% 17,900 20,450 23,000 25,550 27,600 29,650 447 479 575 664 741
60% 21,480 24,540 27,600 30,660 33,120 35,580 537 575 690 797 889
$48,500 HUD Fair Market Rents
Source: HUD, IRS, MHDC 329 383 505 657 676
Downtown Revitalization and Economic Assistance for Missouri Residential Demand Analysis
3/24/08 82112-05 - 36 -
Hannibal, Missouri
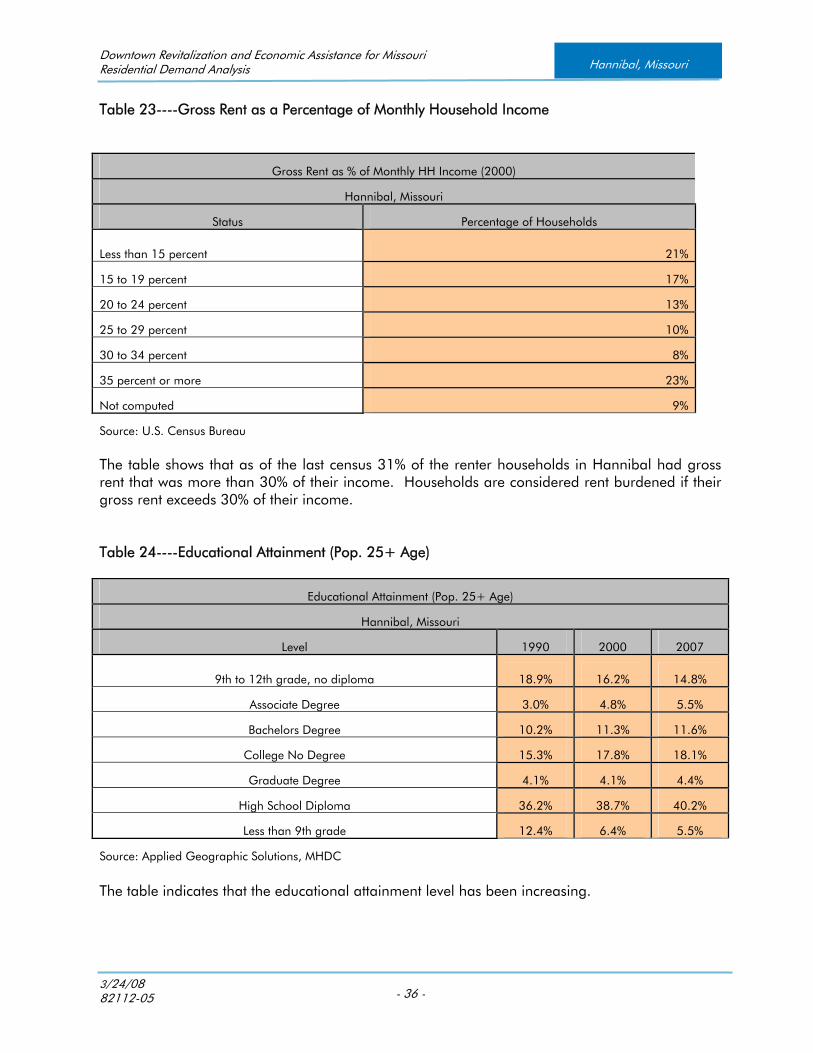
Table 23----Gross Rent as a Percentage of Monthly Household Income
Gross Rent as % of Monthly HH Income (2000)
Hannibal, Missouri
Status Percentage of Households
Less than 15 percent 21%
15 to 19 percent 17%
20 to 24 percent 13%
25 to 29 percent 10%
30 to 34 percent 8%
35 percent or more 23%
Not computed 9%
Source: U.S. Census Bureau The table shows that as of the last census 31% of the renter households in Hannibal had gross rent that was more than 30% of their income. Households are considered rent burdened if their gross rent exceeds 30% of their income. Table 24----Educational Attainment (Pop. 25+ Age)
Educational Attainment (Pop. 25+ Age)
Hannibal, Missouri
Level 1990 2000 2007
9th to 12th grade, no diploma 18.9% 16.2% 14.8%
Associate Degree 3.0% 4.8% 5.5%
Bachelors Degree 10.2% 11.3% 11.6%
College No Degree 15.3% 17.8% 18.1%
Graduate Degree 4.1% 4.1% 4.4%
High School Diploma 36.2% 38.7% 40.2%
Less than 9th grade 12.4% 6.4% 5.5%
Source: Applied Geographic Solutions, MHDC
The table indicates that the educational attainment level has been increasing.

Downtown Revitalization and Economic Assistance for Missouri Residential Demand Analysis
3/24/08 82112-05 - 37 -
Hannibal, Missouri
Table 25----Marital Status (Pop. 15+ Age)
Marital Status (Pop. 15+ Age)
Hannibal, Missouri
Status 1990 2000 2007
Divorced 9.9% 11.6% 11.6%
Never Married 20.5% 22.2% 22.2%
Now Married 56.1% 50.1% 50.2%
Separated 1.5% 6.0% 5.9%
Widowed 12.0% 10.2% 10.1%
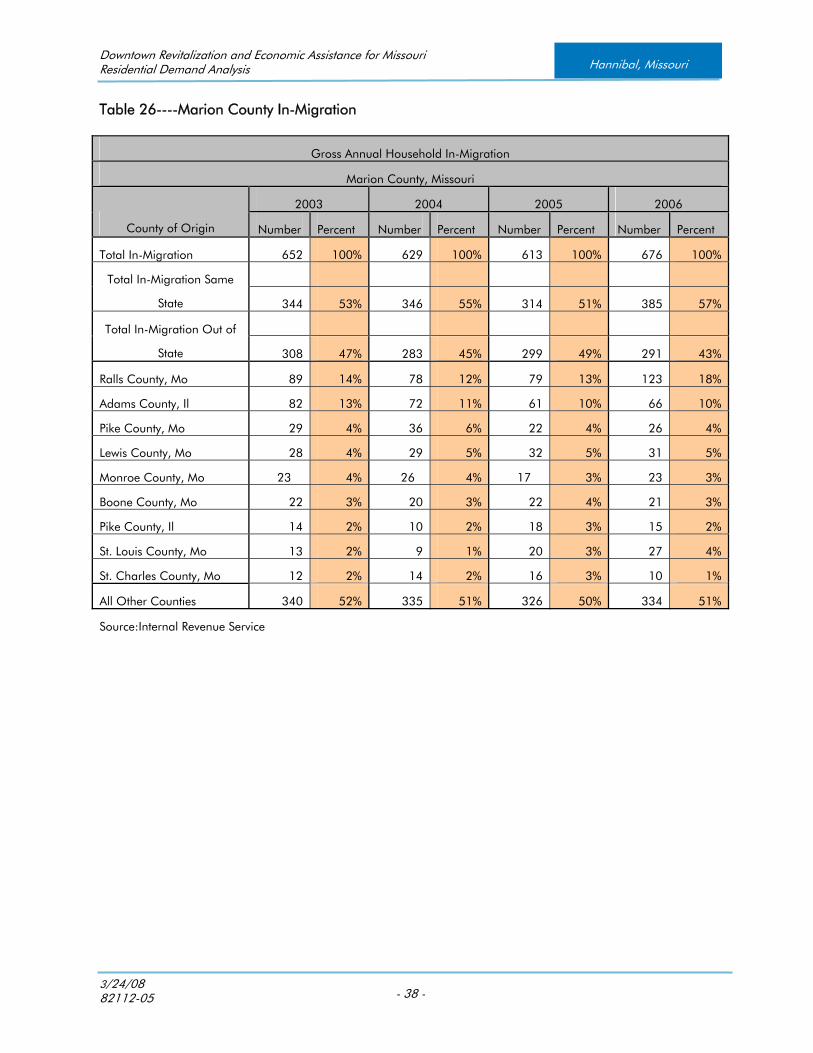
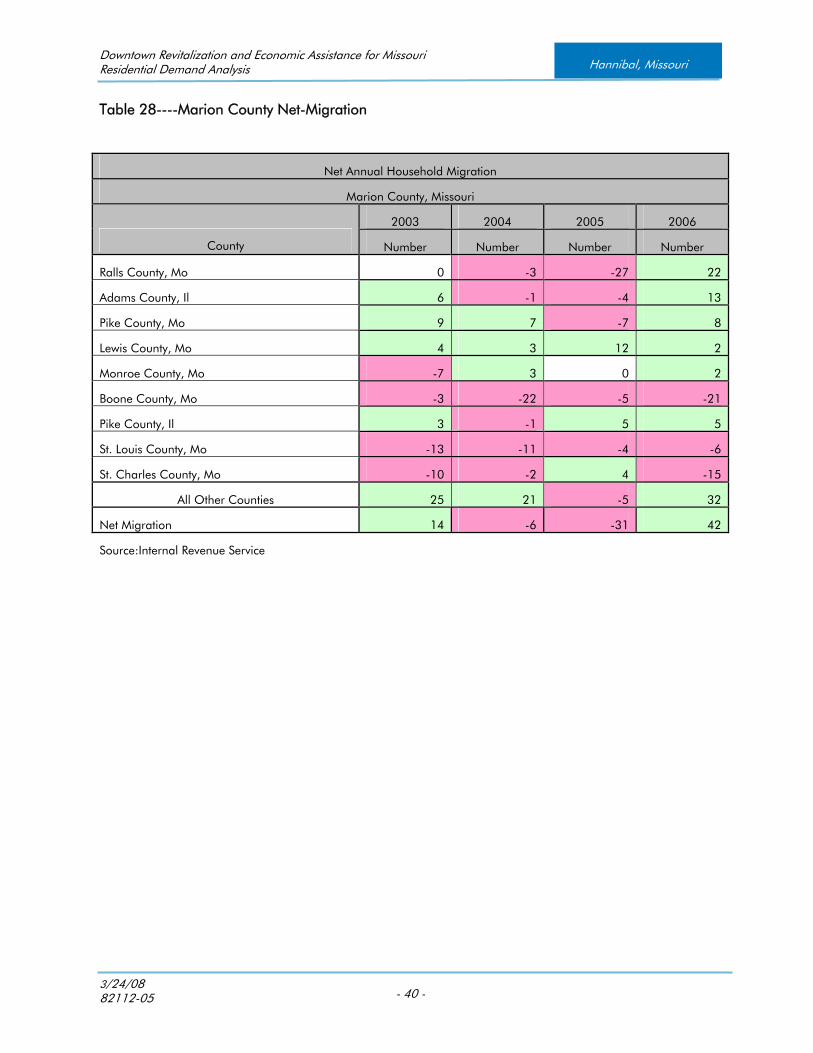
Source: Applied Geographic Solutions, MHDC The table indicates consistent marital trends in Hannibal between 2000 and 2007. IRS Migration Data Taxpayer migration data is a very helpful tool in tracking the movement of households into and out of the market area. The data is maintained at the county level by the Internal Revenue Service and provides a clear representation of migration patterns. Following are tables that show the migration patterns for Marion County. The migration tables that follow indicate that Marion County attracts more than 600 new households annually, but it also loses more than 600 households annually. Between 2003 and 2006 the net migration statistics for Marion County show a fluctuating picture, but in 2006 the net migration number was positive, meaning more households moved in than moved out. The tables also indicate that while Marion County has a negative migration relationship with the larger metropolitan areas represented by St. Louis, St. Charles, and Boone Counties, it has a positive net migration pattern with most of the surrounding counties, including Adams and Pike Counties in Illinois. The number of households migrating to the City of Hannibal is unknown, but since it is the largest city in Marion County it can be assumed that the migration patterns of the county are reflective of the migration patterns of Hannibal.
Downtown Revitalization and Economic Assistance for Missouri Residential Demand Analysis
3/24/08 82112-05 - 38 -
Hannibal, Missouri
Table 26----Marion County In-Migration
Gross Annual Household In-Migration
Marion County, Missouri
2003 2004 2005 2006
County of Origin Number Percent Number Percent Number Percent Number Percent
Total In-Migration 652 100% 629 100% 613 100% 676 100%
Total In-Migration Same
State 344 53% 346 55% 314 51% 385 57%
Total In-Migration Out of
State 308 47% 283 45% 299 49% 291 43%
Ralls County, Mo 89 14% 78 12% 79 13% 123 18%
Adams County, Il 82 13% 72 11% 61 10% 66 10%
Pike County, Mo 29 4% 36 6% 22 4% 26 4%
Lewis County, Mo 28 4% 29 5% 32 5% 31 5%
Monroe County, Mo 23 4% 26 4% 17 3% 23 3%
Boone County, Mo 22 3% 20 3% 22 4% 21 3%
Pike County, Il 14 2% 10 2% 18 3% 15 2%
St. Louis County, Mo 13 2% 9 1% 20 3% 27 4%
St. Charles County, Mo 12 2% 14 2% 16 3% 10 1%
All Other Counties 340 52% 335 51% 326 50% 334 51%
Source:Internal Revenue Service

Downtown Revitalization and Economic Assistance for Missouri Residential Demand Analysis
3/24/08 82112-05 - 39 -
Hannibal, Missouri
Table 27----Marion County Out-Migration
Gross Annual Household Out-Migration
Marion County, Missouri
2003 2004 2005 2006
Destination County Number Percent Number Percent Number Percent Number Percent
Total Out-Migration 638 100% 635 100% 644 100% 634 100%
Total Out-Migration Same
State 367 58% 350 55% 388 60% 379 60%
Total Out-Migration Out of
State 271 42% 285 45% 256 40% 255 40%
Ralls County, Mo 89 14% 81 13% 106 16% 101 16%
Adams County, Il 76 12% 73 11% 65 10% 53 8%
Pike County, Mo 20 3% 29 5% 29 5% 18 3%
Lewis County, Mo 24 4% 26 4% 20 3% 29 5%
Monroe County, Mo 30 5% 23 4% 17 3% 21 3%
Boone County, Mo 25 4% 42 7% 27 4% 42 7%
Pike County, Il 11 2% 11 2% 13 2% 10 2%
St. Louis County, Mo 26 4% 20 3% 24 4% 33 5%
St. Charles County, Mo 22 3% 16 3% 12 2% 25 4%
All Other Counties 315 49% 314 49% 331 51% 302 48%
Source:Internal Revenue Service
Downtown Revitalization and Economic Assistance for Missouri Residential Demand Analysis
3/24/08 82112-05 - 40 -
Hannibal, Missouri
Table 28----Marion County Net-Migration
Net Annual Household Migration
Marion County, Missouri
2003 2004 2005 2006
County Number Number Number Number
Ralls County, Mo 0 -3 -27 22
Adams County, Il 6 -1 -4 13
Pike County, Mo 9 7 -7 8
Lewis County, Mo 4 3 12 2
Monroe County, Mo -7 3 0 2
Boone County, Mo -3 -22 -5 -21
Pike County, Il 3 -1 5 5
St. Louis County, Mo -13 -11 -4 -6
St. Charles County, Mo -10 -2 4 -15
All Other Counties 25 21 -5 32
Net Migration 14 -6 -31 42
Source:Internal Revenue Service

Downtown Revitalization and Economic Assistance for Missouri Residential Demand Analysis
3/24/08 82112-05 - 41 -
Hannibal, Missouri
SECTION V
ECONOMIC OVERVIEW
The following section includes an analysis of the economy of the market area. The analysis will focus on employment by industry, the major employers, and the area employment, unemployment, and labor force trends. MHDC has obtained economic information from the Missouri Department of Economic Development, Bureau of Labor Statistics, U.S. Census Bureau, and the Hannibal, Missouri Chamber of Commerce. Local Area Employment Table 29----Employment/ Unemployment
Local Area Unemployment Statistics - Marion County
Year Labor Force Employment Unemployment Rate Missouri Rate
2007 14,063 13,309 755 5.4% 5.0%
2006 14,075 13,375 700 5.0% 5.8%
2005 14,000 13,258 742 5.3% 5.6%
2004 14,130 13,323 807 5.7% 5.2%
2003 14,084 13,256 828 5.9% 4.5%
Source: Missouri Department of Economic Development The preceding table indicates that unemployment rates in Marion County have been on a declining trend from 2003 to 2006, but began to rise in 2007. The unemployment rate for Marion County in 2007 is higher than the state unemployment rate.

Downtown Revitalization and Economic Assistance for Missouri Residential Demand Analysis
3/24/08 82112-05 - 42 -
Hannibal, Missouri
Table 30----Hannibal Area Major Employers
Major Employers - Hannibal Area
Employers Type of Business Employees
Hannibal Regional Hospital Healthcare 855
General Mills Manufacturing 800
Intermet (Monroe and Palmyra, Missouri) Manufacturing 700
Public Schools Education 530
Dura Automotive Systems (Hannibal, Ralls County) Manufacturing 175
Watlow (Hannibal, Ralls County) Manufacturing 425
Wal-Mart Super Center Retail 400
Buckhorn Rubber Products (Hannibal, Ralls County) Manufacturing 210
Hannibal Clinic Operations Healthcare 300
BASF (Palmyra, Missouri) Manufacturing 245
City of Hannibal Government 225
Continental Cement Manufacturing 220
Bleigh Construction Construction 225
Hannibal-LaGrange College Education 175
Source: Hannibal Chamber of Commerce and City of Hannibal

Downtown Revitalization and Economic Assistance for Missouri Residential Demand Analysis
3/24/08 82112-05 - 43 -
Hannibal, Missouri
Table 31----Area Employment by Industry
The following table details the average employment by industry and monthly wages for Marion County, Missouri.
Average Employment and Wages - Marion County, Missouri
2007* 2006 2005 2004
Industry
Avg.
Employment
Avg.
Mthly.
Wages
Avg.
Employment
Avg.
Mthly.
Wages
Avg.
Employment
Avg.
Mthly.
Wages
Avg.
Employment
Avg.
Mthly.
Wages
11 - Agriculture, Etc. 17 $1,998 26 $2,169 38 $2,191 33 $2,352
21 - Mining ? $3,424 ? $3,934 ? $3,889 43 $3,622
22 - Utilities 112 $4,209 117 $4,372 120 $4,037 123 $3,889
23 - Construction 761 $2,649 580 $3,000 718 $3,635 720 $3,247
31 - Manufacturing 1,704 $4,146 1,776 $3,880 1,740 $3,554 1,707 $2,807
42 - Wholesale trade 273 $2,905 259 $2,803 295 $3,171 627 $4,290
44 - Retail Trade 2227 $1,474 2240 $1,523 2212 $1,480 2102 $1,500
48 - Transportation and
warehousing
361 $2,416 330 $2,587 308 $2,453 306 $2,348
51 - Information 189 $2,328 178 $2,430 152 $2,321 95 $2,024
52 - Finance & Ins. 353 $2,730 357 $2,827 353 $2,665 341 $2,425
53 - Real estate 66 $2,927 62 $1,513 71 $1,551 75 $1,622
54 - Professional and
technical services
335 $2,606 308 $2,709 301 $2,612 278 $2,822
55 - Mgmt. (companies) 43 $2,651 38 $2,328 ? $2,239 31 $2,122
56 - Administrative, etc. 349 $2,330 366 $2,115 309 $1,841 247 $1,952
61 - Educational 1471 $2,255 1355 $2,380 1286 $2,280 1250 $2,247
62 - Health care, social 2539 $2,671 2725 $2,660 2845 $2,577 2724 $2,540
71 - Arts, etc. 238 $812 234 $1,028 217 $1,074 210 $1,109
72 - Accom. & food srvc 1,158 $960 1,224 $1,027 1,188 $1,004 1,145 $961
81 - Other services 334 $1,386 329 $1,432 379 $1,555 392 $1,478
Public Administration 625 $2,677 637 $2,519 634 $2,466 639 $2,390
*Information available to date
Source:U.S. Census Bureau
Downtown Revitalization and Economic Assistance for Missouri Residential Demand Analysis
3/24/08 82112-05 - 44 -
Hannibal, Missouri
The table indicates that most jobs in the county are in the healthcare, retail trade, manufacturing, and accommodation and food services industries. Of these industries the highest average monthly wages have been in manufacturing. The data indicates that the number of jobs in manufacturing has been stable and that wages have increased significantly from 2004 to 2007. The health care and social services industry, which has the largest number of jobs in the county, have experienced modest wage increases. Recent economic related news stories in Hannibal include the following: • BASF will be investing approximately $50 million in its facility near Hannibal. • The State has approved Hannibal’s creation of enhanced enterprise zones, one of which will
be in the downtown area and allow 25 year 100% tax abatement. • Hannibal will be home to a Central Illinois Collegiate League team in 2009. • At least two investors are looking at building upscale lodging facilities in Hannibal. • General Mills is planning a $55 million expansion project. • A new 8 screen movie theater is planned for downtown Hannibal.

Downtown Revitalization and Economic Assistance for Missouri Residential Demand Analysis
3/24/08 82112-05 - 45 -
Hannibal, Missouri
SECTION VI
EXISTING RENTAL HOUSING OPTIONS
An attempt was made to document the rental housing inventory in Hannibal. Contained in this section are a list, maps, and brief narratives for most of the multifamily rental housing options in the Hannibal market. Most of the rental developments are located west of business 61 Highway. The data indicates that multifamily developments in Hannibal for market rate and limited income households, for seniors and family housing all seem to have good occupancy and in some cases waiting lists. A survey of the market seemed to indicate that the same may not be true for smaller rental developments (single family homes, duplexes). A large number of for rent signs were noted in the yards of single family homes and duplexes, primarily in the downtown area. The downtown area contained a large number of rental properties, some single family homes, some single family conversions to multi-unit rentals, and a large number of two to four unit rentals that were originally built for that purpose in the early 1900’s. The significant number of small rental structures in the downtown market area seems to indicate that even though the area contained very nice, and in some cases very large and stately homes, the area was also developed for a transient population base of tenant households. The following pictures are examples of the units that are currently for rent in the downtown area, many of which are multi-tenant buildings.

Downtown Revitalization and Economic Assistance for Missouri Residential Demand Analysis
3/24/08 82112-05 - 46 -
Hannibal, Missouri

Downtown Revitalization and Economic Assistance for Missouri Residential Demand Analysis
3/24/08 82112-05 - 47 -
Hannibal, Missouri

Downtown Revitalization and Economic Assistance for Missouri Residential Demand Analysis
3/24/08 82112-05 - 48 -
Hannibal, Missouri
The map below indicates the census tracts for the city of Hannibal. Census tract 9605 contains most of the residential housing in the downtown area.
Data based on the 2000 census, with estimates and projections for 2007 and 2012, is detailed in the following table and indicates that census tract 9605, which is located in the downtown area, contains a higher percentage of rental housing than any other area of the city. Data indicates that 41% of the occupied units in this tract are renter occupied. Other census tracts in the city generally have from 24% to 31% renter occupied housing units.
Table 32----Percentage of Renter Occupied Housing Units
Percentage of Renter Occupied Housing Units
Census Tract 2000 Census Data 2007 Estimate 2012 Projection
9604 27.0% 28.0% 28.6% 9605 40.5% 41.0% 41.9% 9606 27.8% 28.8% 29.1%
9608 31.2% 32.3% 32.7% 9609 23.8% 24.7% 25.1%
Source: Applied Geographic Solutions One of the changes in the downtown area that could benefit the downtown revitalization efforts would be to diminish the percentage of renter occupied units in the downtown area and increase the number of owner occupied units. A more permanent resident base would help to stabilize and improve the area by increasing the number of households that would have a long term interest. Although many of the residential structures in the downtown are historically and architecturally significant, many are in a state of disrepair and suffer from deferred maintenance. Consequently the area in general, and in particular the area south of Broadway appears to be in a state of decline. A major part of the downtown revitalization efforts will have to include some inducement for existing property owners to make improvements to their properties and to perform regular maintenance, and for more prospective homebuyers to consider buying a home in the area. Property improvement and an increase in home ownership will increase property values, increase the marketability of the area, encourage further investment, and increase tax revenue for the area and the community.
Downtown Revitalization and Economic Assistance for Missouri Residential Demand Analysis
3/24/08 82112-05 - 49 -
Hannibal, Missouri
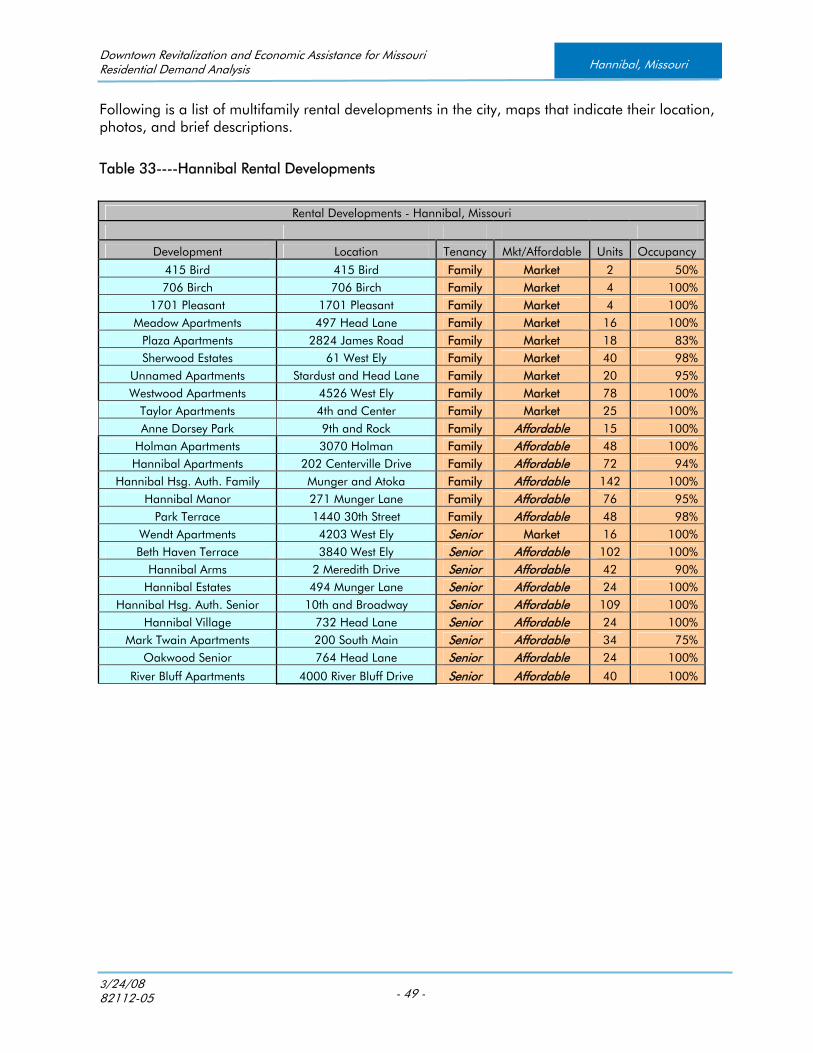
Following is a list of multifamily rental developments in the city, maps that indicate their location, photos, and brief descriptions.
Table 33----Hannibal Rental Developments
Rental Developments - Hannibal, Missouri
Development Location Tenancy Mkt/Affordable Units Occupancy
415 Bird 415 Bird Family Market 2 50% 706 Birch 706 Birch Family Market 4 100%
1701 Pleasant 1701 Pleasant Family Market 4 100% Meadow Apartments 497 Head Lane Family Market 16 100%
Plaza Apartments 2824 James Road Family Market 18 83% Sherwood Estates 61 West Ely Family Market 40 98%
Unnamed Apartments Stardust and Head Lane Family Market 20 95% Westwood Apartments 4526 West Ely Family Market 78 100%
Taylor Apartments 4th and Center Family Market 25 100% Anne Dorsey Park 9th and Rock Family Affordable 15 100%
Holman Apartments 3070 Holman Family Affordable 48 100% Hannibal Apartments 202 Centerville Drive Family Affordable 72 94%
Hannibal Hsg. Auth. Family Munger and Atoka Family Affordable 142 100% Hannibal Manor 271 Munger Lane Family Affordable 76 95%
Park Terrace 1440 30th Street Family Affordable 48 98% Wendt Apartments 4203 West Ely Senior Market 16 100% Beth Haven Terrace 3840 West Ely Senior Affordable 102 100%
Hannibal Arms 2 Meredith Drive Senior Affordable 42 90% Hannibal Estates 494 Munger Lane Senior Affordable 24 100%
Hannibal Hsg. Auth. Senior 10th and Broadway Senior Affordable 109 100% Hannibal Village 732 Head Lane Senior Affordable 24 100%
Mark Twain Apartments 200 South Main Senior Affordable 34 75% Oakwood Senior 764 Head Lane Senior Affordable 24 100%
River Bluff Apartments 4000 River Bluff Drive Senior Affordable 40 100%

Downtown Revitalization and Economic Assistance for Missouri Residential Demand Analysis
3/24/08 82112-05 - 50 -
Hannibal, Missouri
Map #1 - Hannibal Apartment
Downtown Revitalization and Economic Assistance for Missouri Residential Demand Analysis
3/24/08 82112-05 - 51 -
Hannibal, Missouri
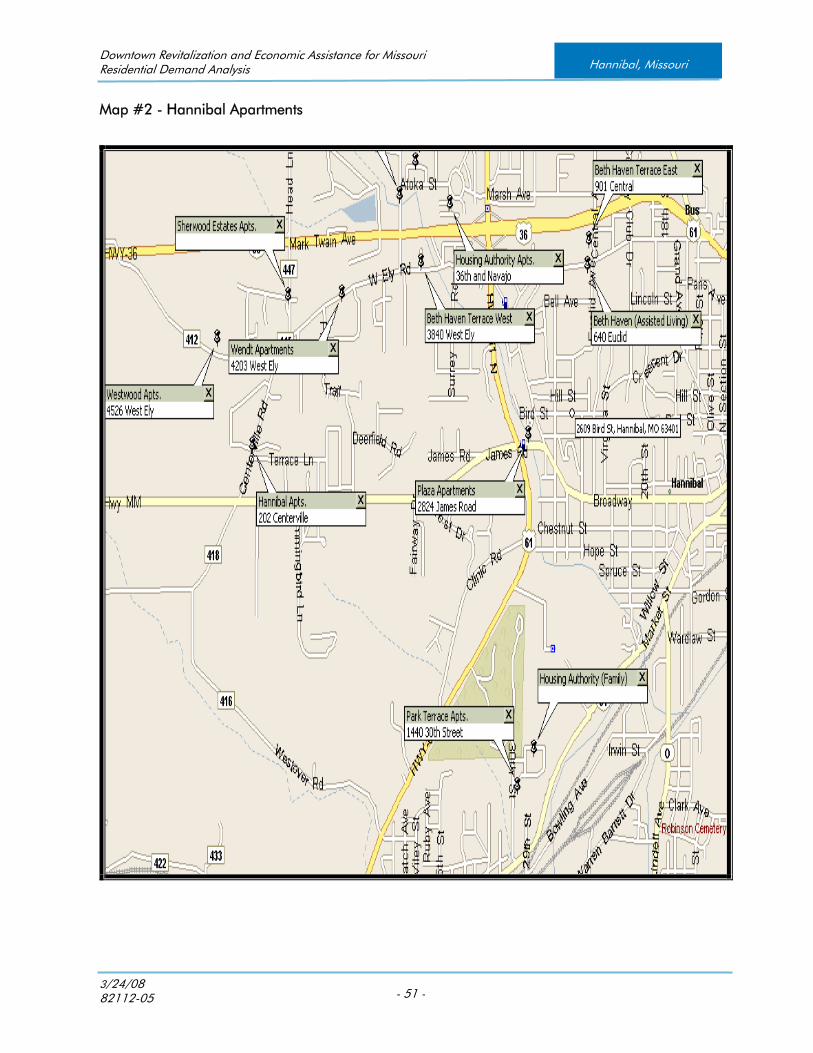
Map #2 - Hannibal Apartments

Downtown Revitalization and Economic Assistance for Missouri Residential Demand Analysis
3/24/08 82112-05 - 52 -
Hannibal, Missouri
Map #3 – Hannibal Apartments (Downtown Area)
The map above highlights the multifamily developments that are located within the boundaries of the downtown market area. As previously mentioned the area also contains a large number of small rental properties.

Downtown Revitalization and Economic Assistance for Missouri Residential Demand Analysis
3/24/08 82112-05 - 53 -
Hannibal, Missouri
Development: Duplex For Rent
Location: 415 Bird
Hannibal, Missouri
Tenancy: Market Rate Family
Total Units: 4
Zero Bedroom Units/Rent: 0
One Bedroom Units/Rent: 4/$325-$375
Two Bedrooms Units/Rent: 0
Three Bedrooms Units/Rent: 0
Occupancy: 50%
Source: Rob Holstine, 573-221-1901

Downtown Revitalization and Economic Assistance for Missouri Residential Demand Analysis
3/24/08 82112-05 - 54 -
Hannibal, Missouri
Development: Duplex for Rent
Location: 706 Birch
Hannibal, Missouri
Tenancy: Family
Total Units: 4
Zero Bedroom Units/Rent: 0
One Bedroom Units/Rent: 0
Two Bedrooms Units/Rent: 4/$325-$350
Three Bedrooms Units/Rent: 0
Occupancy: 100%
Source: Rob Holstine, 573-221-1901

Downtown Revitalization and Economic Assistance for Missouri Residential Demand Analysis
3/24/08 82112-05 - 55 -
Hannibal, Missouri
Development: Duplexes
Location: 1701 Pleasant
Hannibal, Missouri
Tenancy: Family
Total Units: 4
Zero Bedroom Units/Rent: 0
One Bedroom Units/Rent: 0
Two Bedrooms Units/Rent: 0
Three Bedrooms Units/Rent: 4/$495
Occupancy: 100%
Source: Rob Holstine, 573-221-1901
Downtown Revitalization and Economic Assistance for Missouri Residential Demand Analysis
3/24/08 82112-05 - 56 -
Hannibal, Missouri
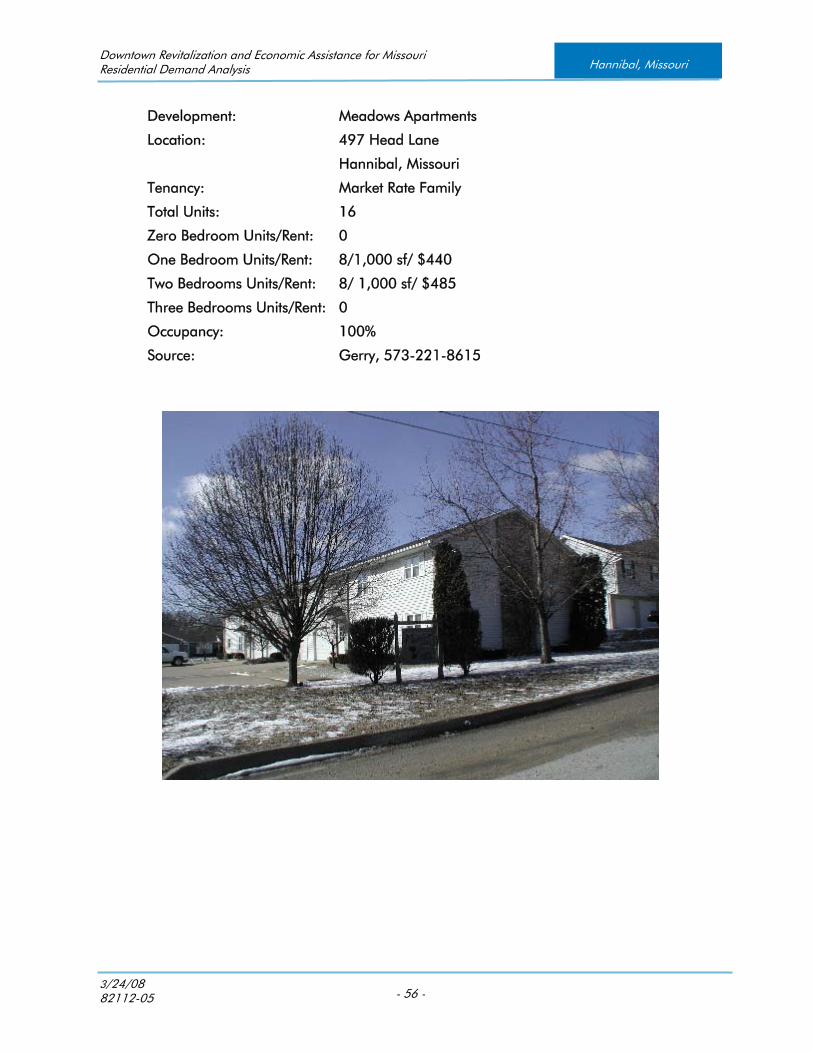
Development: Meadows Apartments
Location: 497 Head Lane
Hannibal, Missouri
Tenancy: Market Rate Family
Total Units: 16
Zero Bedroom Units/Rent: 0
One Bedroom Units/Rent: 8/1,000 sf/ $440
Two Bedrooms Units/Rent: 8/ 1,000 sf/ $485
Three Bedrooms Units/Rent: 0
Occupancy: 100%
Source: Gerry, 573-221-8615
Downtown Revitalization and Economic Assistance for Missouri Residential Demand Analysis
3/24/08 82112-05 - 57 -
Hannibal, Missouri
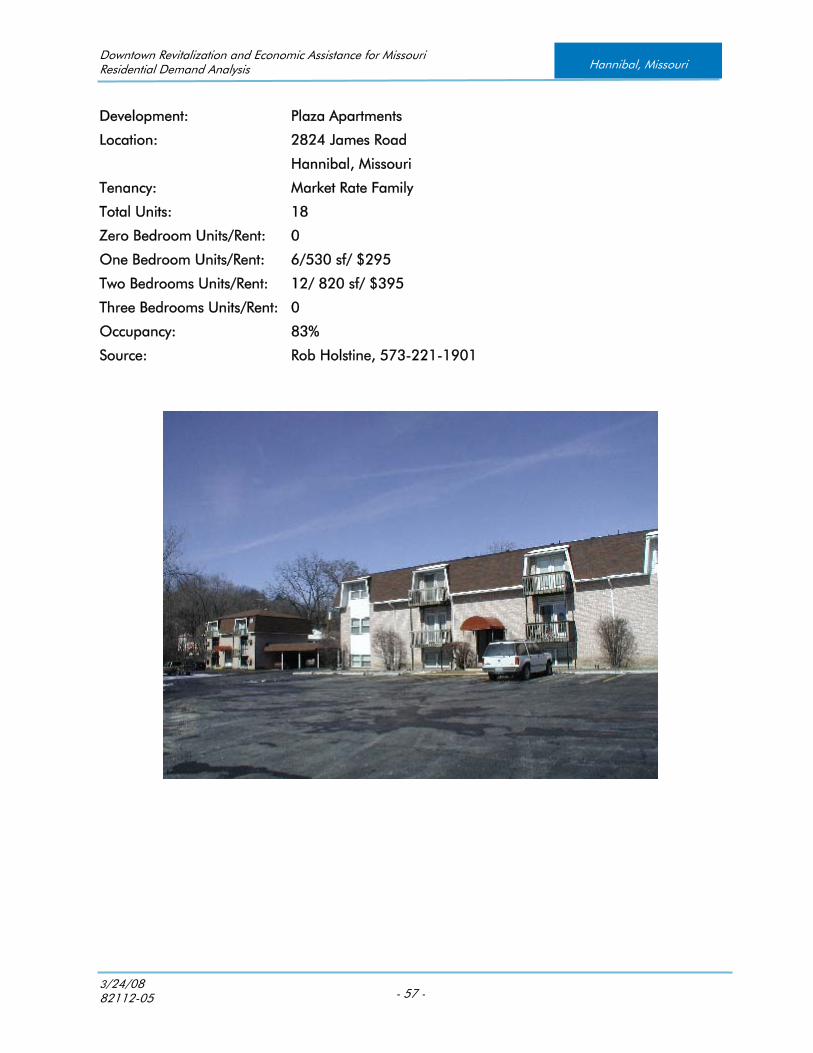
Development: Plaza Apartments
Location: 2824 James Road
Hannibal, Missouri
Tenancy: Market Rate Family
Total Units: 18
Zero Bedroom Units/Rent: 0
One Bedroom Units/Rent: 6/530 sf/ $295
Two Bedrooms Units/Rent: 12/ 820 sf/ $395
Three Bedrooms Units/Rent: 0
Occupancy: 83%
Source: Rob Holstine, 573-221-1901
Downtown Revitalization and Economic Assistance for Missouri Residential Demand Analysis
3/24/08 82112-05 - 58 -
Hannibal, Missouri
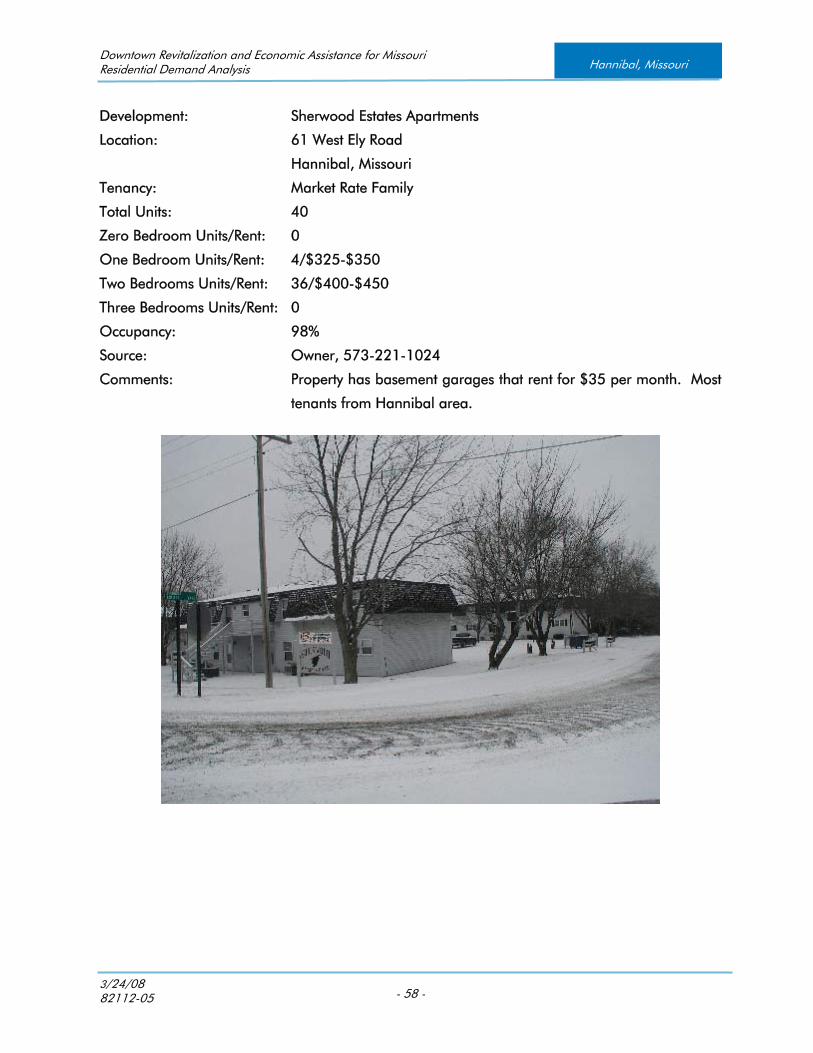
Development: Sherwood Estates Apartments
Location: 61 West Ely Road
Hannibal, Missouri
Tenancy: Market Rate Family
Total Units: 40
Zero Bedroom Units/Rent: 0
One Bedroom Units/Rent: 4/$325-$350
Two Bedrooms Units/Rent: 36/$400-$450
Three Bedrooms Units/Rent: 0
Occupancy: 98%
Source: Owner, 573-221-1024
Comments: Property has basement garages that rent for $35 per month. Most
tenants from Hannibal area.

Downtown Revitalization and Economic Assistance for Missouri Residential Demand Analysis
3/24/08 82112-05 - 59 -
Hannibal, Missouri
Development: Unnamed
Location: Head Lane and Stardust
Hannibal, Missouri
Tenancy: Market Rate Family
Total Units: 20
Zero Bedroom Units/Rent: 0
One Bedroom Units/Rent: 0
Two Bedrooms Units/Rent: 18/$385
Three Bedrooms Units/Rent: 2/$500
Occupancy: 95%
Source: Bryan, 573-221-1240

Downtown Revitalization and Economic Assistance for Missouri Residential Demand Analysis
3/24/08 82112-05 - 60 -
Hannibal, Missouri
Development: Westwood Apartments
Location: 4526 West Ely Road
Hannibal, Missouri
Tenancy: Market Rate Family
Total Units: 78
Zero Bedroom Units/Rent: 0
One Bedroom Units/Rent: 4/750 sf/$425
Two Bedrooms Units/Rent: 74/950-1,200 sf/$475-$500
Three Bedrooms Units/Rent: 0
Occupancy: 100% 8/2007
Source: Owner, 573-221-1232
Comments: Tenants primarily from Hannibal area

Downtown Revitalization and Economic Assistance for Missouri Residential Demand Analysis
3/24/08 82112-05 - 61 -
Hannibal, Missouri
Development: Taylor Apartments
Location: 203 N. 4th & 404 Center
Hannibal, Missouri
Tenancy: Market Rate Family
Total Units: 25
Zero Bedroom Units/Rent: 4/$225-$275
One Bedroom Units/Rent: 17/$425-$450
Two Bedrooms Units/Rent: 3/$450
Three Bedrooms Units/Rent: 1/$550
Occupancy: 100%
Source: Deanna Taylor, 573-221-0836
Downtown Revitalization and Economic Assistance for Missouri Residential Demand Analysis
3/24/08 82112-05 - 62 -
Hannibal, Missouri
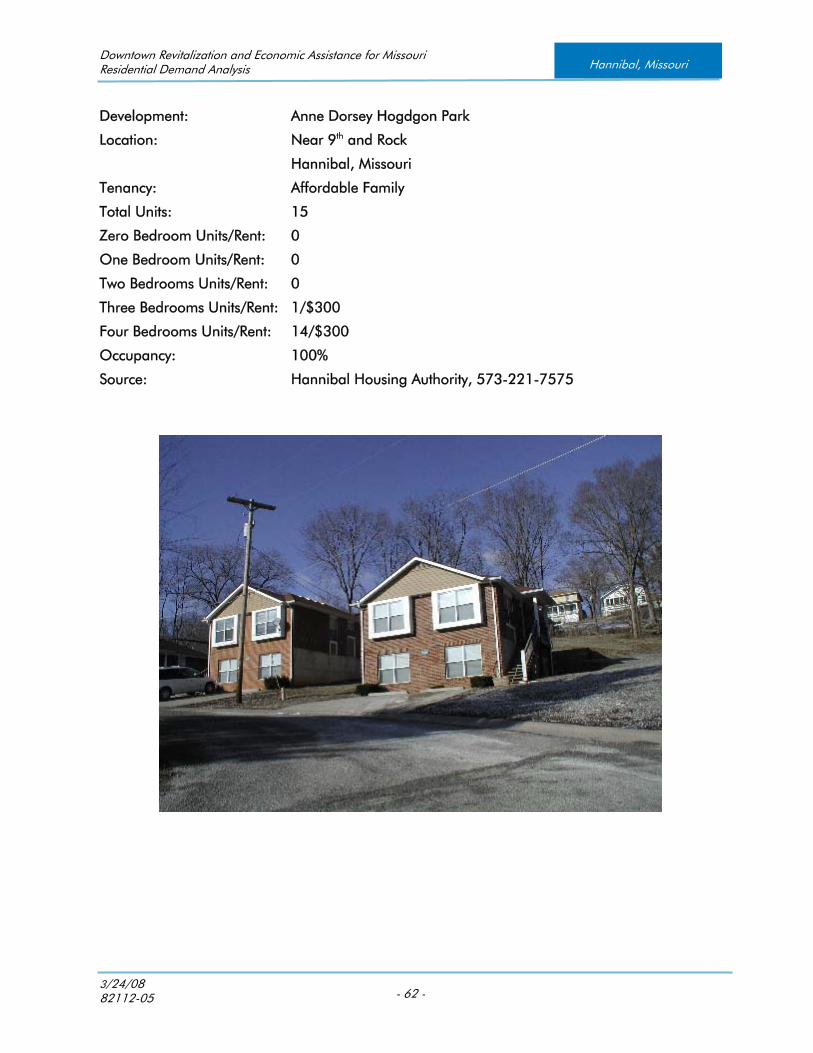
Development: Anne Dorsey Hogdgon Park
Location: Near 9th and Rock
Hannibal, Missouri
Tenancy: Affordable Family
Total Units: 15
Zero Bedroom Units/Rent: 0
One Bedroom Units/Rent: 0
Two Bedrooms Units/Rent: 0
Three Bedrooms Units/Rent: 1/$300
Four Bedrooms Units/Rent: 14/$300
Occupancy: 100%
Source: Hannibal Housing Authority, 573-221-7575

Downtown Revitalization and Economic Assistance for Missouri Residential Demand Analysis
3/24/08 82112-05 - 63 -
Hannibal, Missouri
Development: Holman Apartments
(Known by MHDC as College Apts.)
Location: 3070 Holman
Hannibal, Missouri
Tenancy: Affordable Family
Total Units: 48
Zero Bedroom Units/Rent: 0
One Bedroom Units/Rent: 0
Two Bedrooms Units/Rent: 40/$420
Three Bedrooms Units/Rent: 8/$470
Occupancy: 100% as of 12/2007
Source: MHDC occupancy data. Apartment site # 573-221-5450

Downtown Revitalization and Economic Assistance for Missouri Residential Demand Analysis
3/24/08 82112-05 - 64 -
Hannibal, Missouri
Development: Hannibal Apartments
Location: 202 Centerville Rd.
Hannibal, Missouri
Tenancy: Affordable Family (RD)
Total Units: 72 (54 w subsidy)
Zero Bedroom Units/Rent: 0
One Bedroom Units/Rent: 16
Two Bedrooms Units/Rent: 56
Three Bedrooms Units/Rent: 0
Occupancy: 94%
Source: RD Occupancy Records
Comments: In the process of physical update.

Downtown Revitalization and Economic Assistance for Missouri Residential Demand Analysis
3/24/08 82112-05 - 65 -
Hannibal, Missouri
Development: Hannibal Housing Authority Apartments
Location: Near Munger and Atoka
Hannibal, Missouri
Tenancy: Affordable Family
Total Units: 142
Zero Bedroom Units/Rent: 0
Two Bedroom Units/Rent: 60/$293
Three Bedroom Units/Rent: 72/$302
Four Bedrooms Units/Rent: 10/$436
Occupancy: Generally 100%
Source: Linda, 573-221-7575
Comments: The majority of the units are located around Munger and Atoka,
and some are scattered in other locations in the city
Downtown Revitalization and Economic Assistance for Missouri Residential Demand Analysis
3/24/08 82112-05 - 66 -
Hannibal, Missouri
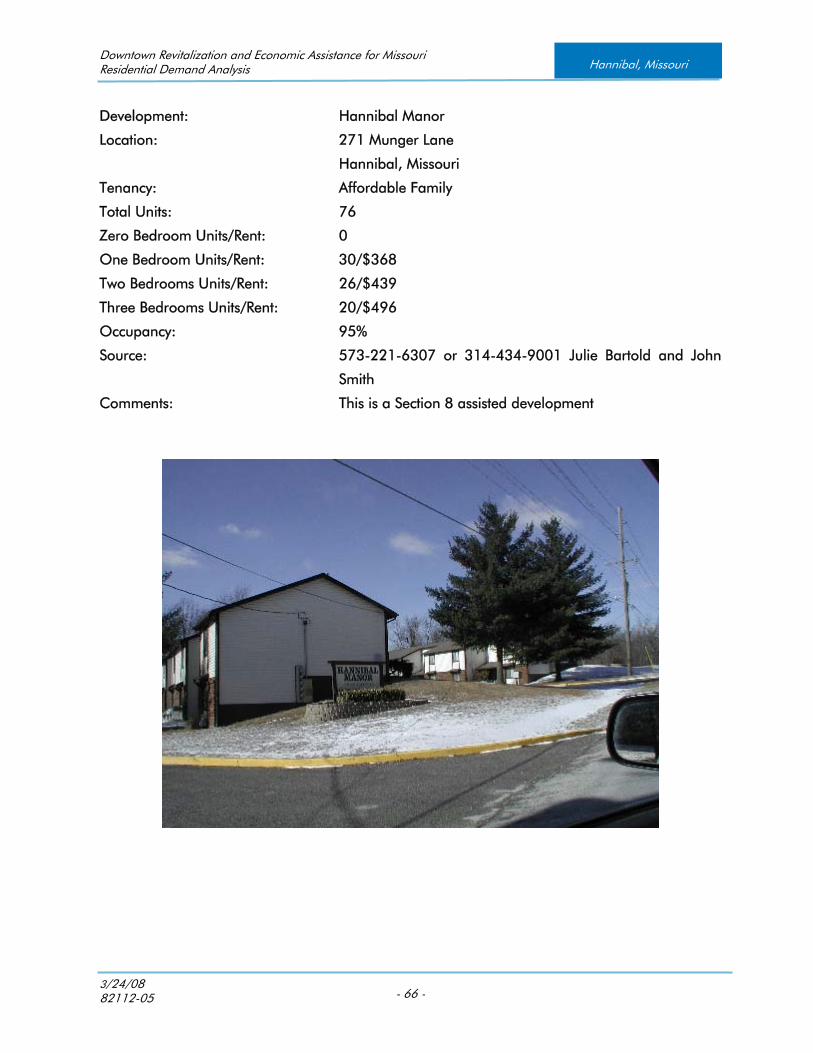
Development: Hannibal Manor
Location: 271 Munger Lane
Hannibal, Missouri
Tenancy: Affordable Family
Total Units: 76
Zero Bedroom Units/Rent: 0
One Bedroom Units/Rent: 30/$368
Two Bedrooms Units/Rent: 26/$439
Three Bedrooms Units/Rent: 20/$496
Occupancy: 95%
Source: 573-221-6307 or 314-434-9001 Julie Bartold and John
Smith
Comments: This is a Section 8 assisted development

Downtown Revitalization and Economic Assistance for Missouri Residential Demand Analysis
3/24/08 82112-05 - 67 -
Hannibal, Missouri
Development: Park Terrace Apartments
Location: 1440 30th Street
Hannibal, Missouri
Tenancy: Affordable Family (RD)
Total Units: 48 (39 w subsidy)
Zero Bedroom Units/Rent: 0
One Bedroom Units/Rent: 16/Income Based
Two Bedrooms Units/Rent: 32/Income Based
Three Bedrooms Units/Rent: 0
Occupancy: 98%
Source: RD Occupancy Records

Downtown Revitalization and Economic Assistance for Missouri Residential Demand Analysis
3/24/08 82112-05 - 68 -
Hannibal, Missouri
Development: Wendt Apartments
Location: 4203 West Ely Road
Hannibal, Missouri
Tenancy: Market Rate (Primarily Seniors)
Total Units: 16
Zero Bedroom Units/Rent: 0
One Bedroom Units/Rent: 16/700 sf/ $400
Two Bedrooms Units/Rent: 0
Three Bedrooms Units/Rent: 0
Occupancy: 100%
Source: Mr. Wendt, 573-221-6714

Downtown Revitalization and Economic Assistance for Missouri Residential Demand Analysis
3/24/08 82112-05 - 69 -
Hannibal, Missouri
Development: Beth Haven Terrace East and West
Location: 901 Central and 3840 West Ely
Hannibal, Missouri
Tenancy: Affordable Senior
Total Units: 102
Zero Bedroom Units/Rent: 0
One Bedroom Units/Rent: 101/$479
Two Bedrooms Units/Rent: 1/$592
Three Bedrooms Units/Rent: 0
Occupancy: 100%
Source: Paul Ewert, 573-221-0015
Comments: 90% of the tenants are from the local area.

Downtown Revitalization and Economic Assistance for Missouri Residential Demand Analysis
3/24/08 82112-05 - 70 -
Hannibal, Missouri
Development: Hannibal Arms Apartments
Location: 2 Meredith Drive
Hannibal, Missouri
Tenancy: Affordable Senior (RD)
Total Units: 42
Zero Bedroom Units/Rent: 0
One Bedroom Units/Rent: 42/$415
Two Bedrooms Units/Rent: 0
Three Bedrooms Units/Rent: 0
Occupancy: 90%
Source: Star Rhodes, 972-881-9052 X104
Comments: Vacancies could be due to adverse appeal of adjacent
development, and the fact that approximately 20% of units are
occupied by non-elderly disabled. The mix of tenants may be
hurting the marketability of the development to senior households.

Downtown Revitalization and Economic Assistance for Missouri Residential Demand Analysis
3/24/08 82112-05 - 71 -
Hannibal, Missouri
Development: Hannibal Estates Apartments
Location: 494 Munger Lane
Hannibal, Missouri
Tenancy: Affordable Family (RD)
Total Units: 24 (22 w subsidy)
Zero Bedroom Units/Rent: 0
One Bedroom Units/Rent: 0
Two Bedrooms Units/Rent: 24/Income Based
Three Bedrooms Units/Rent: 0
Occupancy: 100%
Source: RD Occupancy records
Downtown Revitalization and Economic Assistance for Missouri Residential Demand Analysis
3/24/08 82112-05 - 72 -
Hannibal, Missouri
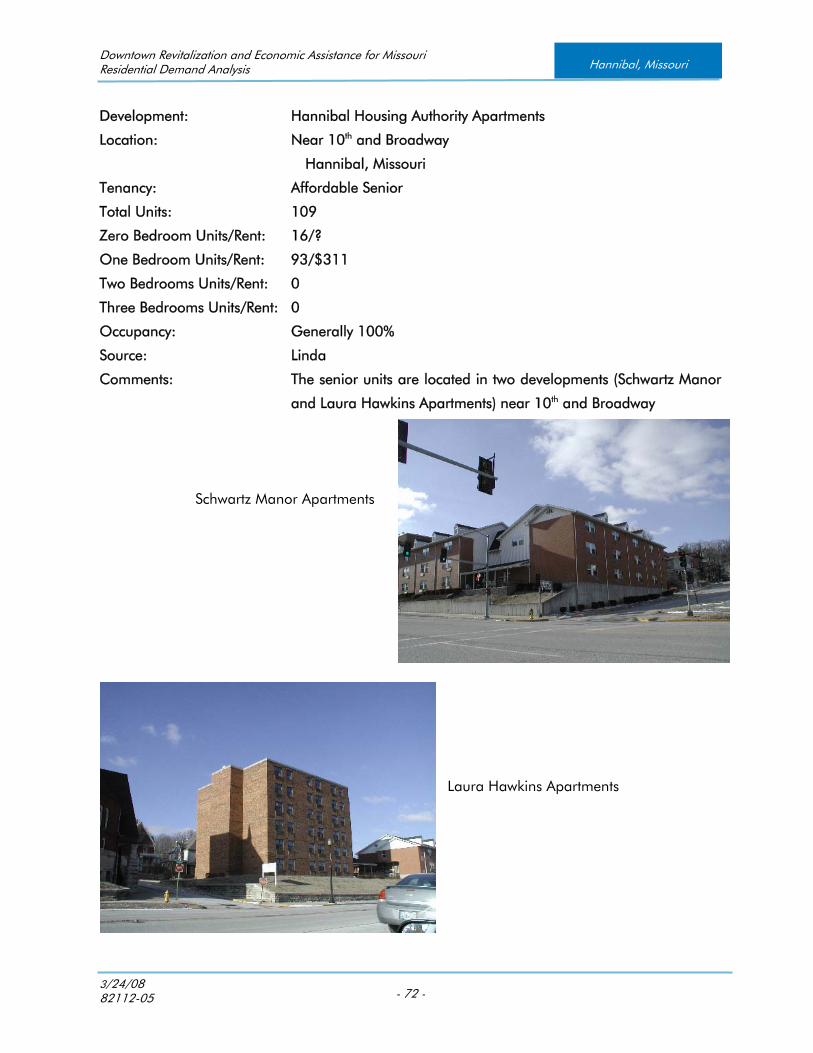
Development: Hannibal Housing Authority Apartments
Location: Near 10th and Broadway
Hannibal, Missouri
Tenancy: Affordable Senior
Total Units: 109
Zero Bedroom Units/Rent: 16/?
One Bedroom Units/Rent: 93/$311
Two Bedrooms Units/Rent: 0
Three Bedrooms Units/Rent: 0
Occupancy: Generally 100%
Source: Linda
Comments: The senior units are located in two developments (Schwartz Manor
and Laura Hawkins Apartments) near 10th and Broadway
Schwartz Manor Apartments
Laura Hawkins Apartments
Downtown Revitalization and Economic Assistance for Missouri Residential Demand Analysis
3/24/08 82112-05 - 73 -
Hannibal, Missouri
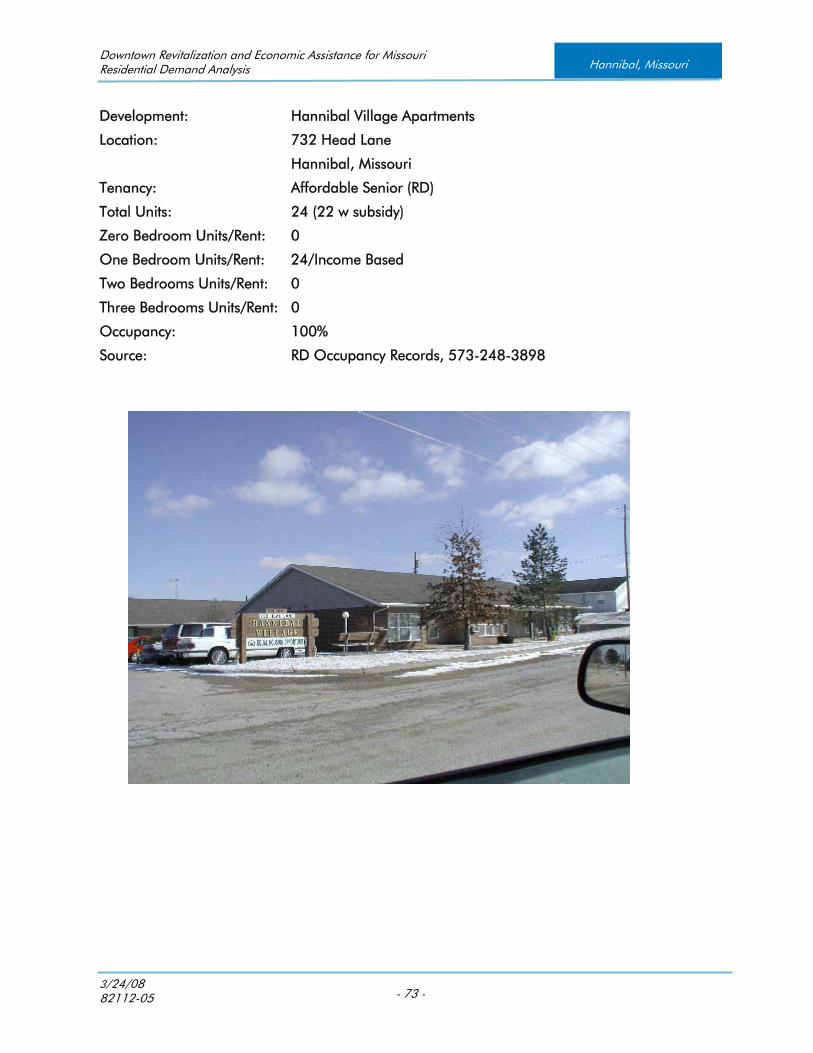
Development: Hannibal Village Apartments
Location: 732 Head Lane
Hannibal, Missouri
Tenancy: Affordable Senior (RD)
Total Units: 24 (22 w subsidy)
Zero Bedroom Units/Rent: 0
One Bedroom Units/Rent: 24/Income Based
Two Bedrooms Units/Rent: 0
Three Bedrooms Units/Rent: 0
Occupancy: 100%
Source: RD Occupancy Records, 573-248-3898

Downtown Revitalization and Economic Assistance for Missouri Residential Demand Analysis
3/24/08 82112-05 - 74 -
Hannibal, Missouri
Development: Mark Twain Apartments
Location: 200 South Main
Hannibal, Missouri
Tenancy: Affordable Senior /Tax Credit
Total Units: 34
Zero Bedroom Units/Rent: 0
One Bedroom Units/Rent: 28/578-1,023 sf/$385-$410
Two Bedrooms Units/Rent: 6/858-1,026 sf/$420-$430
Three Bedrooms Units/Rent: 0
Occupancy: Currently in Lease Up. Development is 70% leased
Source: Site Manager, 2/2008

Downtown Revitalization and Economic Assistance for Missouri Residential Demand Analysis
3/24/08 82112-05 - 75 -
Hannibal, Missouri
Development: Oakwood Senior Apts.
Location: 764 Head Lane
Hannibal, Missouri
Tenancy: Affordable Senior (RD)
Total Units: 24 (20 w subsidy)
Zero Bedroom Units/Rent: 0
One Bedroom Units/Rent: 24/Income Based
Two Bedrooms Units/Rent: 0
Three Bedrooms Units/Rent: 0
Occupancy: 100% 5/2007
Source: RD Occupancy Records, 573-221-5023

Downtown Revitalization and Economic Assistance for Missouri Residential Demand Analysis
3/24/08 82112-05 - 76 -
Hannibal, Missouri
Development: River Bluff Apartments
Location: 4000 River Bluff Drive
Hannibal, Missouri
Tenancy: Affordable Senior
Total Units: 40
Zero Bedroom Units/Rent: 0
One Bedroom Units/Rent: 20/$229
Two Bedrooms Units/Rent: 20/$299
Three Bedrooms Units/Rent: 0
Occupancy: 100% with waiting list
Source: Debra, 573-221-1638
Comments: This development is less than 10 years old and is one of the few
senior developments with two bedroom units.

Downtown Revitalization and Economic Assistance for Missouri Residential Demand Analysis
3/24/08 82112-05 - 77 -
Hannibal, Missouri
SECTION VII
EXISTING HOME OWNERSHIP MARKET
This section includes brief information regarding the Hannibal home ownership market. It is intended to provide information regarding home ownership opportunities in the city of Hannibal in order to assess the feasibility of home ownership options in the downtown area of Hannibal. Information available on Realtor.com, a site that lists homes currently for sale by Realtors in the Hannibal market, shows that the price range of habitable homes currently for sale in Hannibal are from $14,000 to $750,000. The site indicates that there are currently 268 homes listed for sale through Realtors in the Hannibal market. That total does not include homes being offered for sale by owners, which could total another 100 to 150 homes for sale. The following table contains actual sales information over a number of years. Table 34----Multiple Listing Service Sales Statistics
MLS Real Estate Sales Statistics-Hannibal, Missouri
Detached Attached
Year Sales Avg. Price Sales Avg. Price
2007 263 $ 90,444 4 $ 77,500
2006 214 $ 92,963 1 $ 116,000
2005 65 $ 99,618 0 N/A
2004 73 $ 73,900 0 N/A
2003 46 $ 81,930 2 $ 88,250
Source: Mid America Regional Information System The preceding real estate sales information was obtained from the Mid America Regional Information System. The data indicates that sales increased dramatically in 2006 and continued into 2007 at the same pace. The dramatic increase in sales is probably attributable to the sub-prime lending products that became available around the end of 2005, which allowed many buyers to purchase homes with very little to no down-payment. If many of the sales were financed with adjustable rate loans there is a possibility, as in most parts of the country, that the market will experience a substantial increase in the number of foreclosures as owners are unable to make the higher payments at the time of rate adjustment. Sales prices for single family homes in the Hannibal market between 2003 and 2007 have increased by approximately 10%. The data shows that there have not been many documented sales of attached ownership housing in the market. In 2004 and 2005 no sales were noted.

Downtown Revitalization and Economic Assistance for Missouri Residential Demand Analysis
3/24/08 82112-05 - 78 -
Hannibal, Missouri
The following table illustrates the number of residential housing permits issued in Hannibal between 2003 and 2006. Table 35----Building Permits
Building Permits - Hannibal
Units
Units in Bldg. 2006 2005 2004 2003
1 11 12 20 18
2 8 10 4 8
3 to 4 0 0 3 4
5+ 0 0 0 0
Total 19 22 27 30
Source: U.S. Census Bureau The above table indicates that most new residential units constructed are single family homes, but that there are some duplex style buildings that are constructed annually. There are currently a few new homes that are under construction in the market. Following are the subdivisions and price ranges:
Subdivision Price Range
Hummingbird $250,000 - $300,000
Woodland Acres $200,000 - $750,000+
Skyline Estates $250,000 - $700,000+
Orchard Point $400,000 - $1,000,000+
Deerfield $250,000 - $300,000
Clear Creek Condos $200,000 - $225,000
Westridge Condos $167,000 – $182,000

Downtown Revitalization and Economic Assistance for Missouri Residential Demand Analysis
3/24/08 82112-05 - 79 -
Hannibal, Missouri
Following are photos of a few of the new homes in the Hannibal market:
Hummingbird Subdivision

Downtown Revitalization and Economic Assistance for Missouri Residential Demand Analysis
3/24/08 82112-05 - 80 -
Hannibal, Missouri
Woodland Acres Subdivision
Skyline Estates Subdivision
Orchard Point
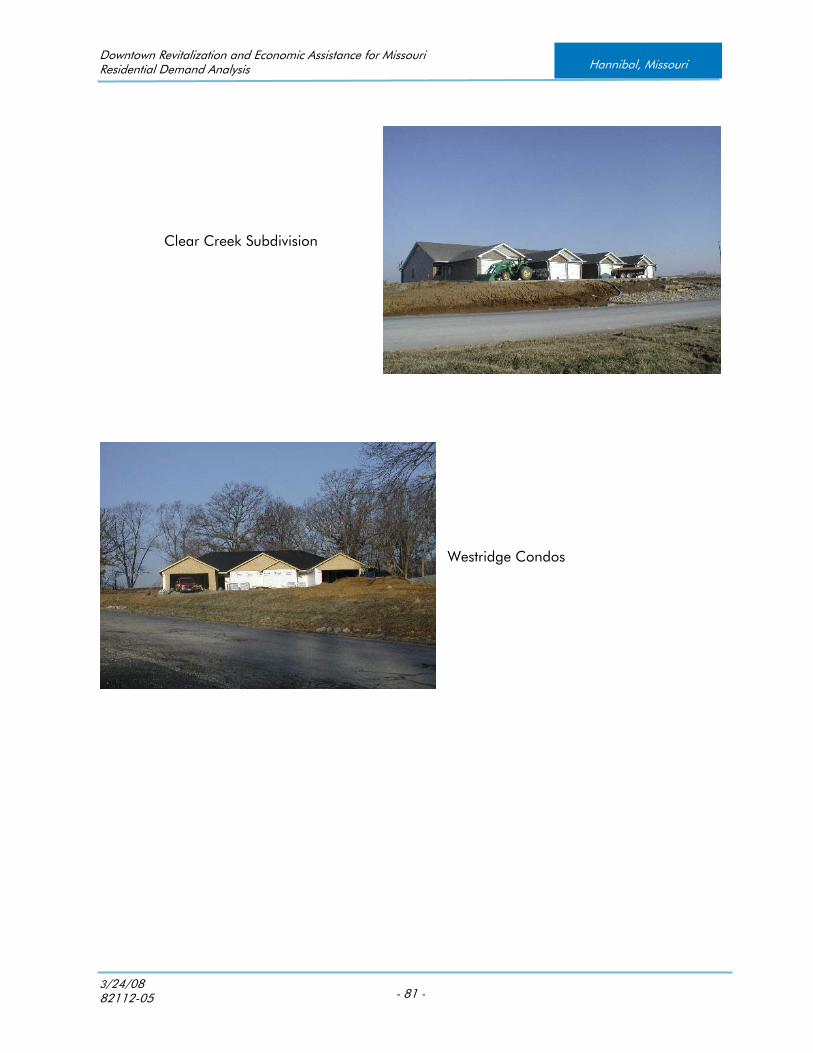
Downtown Revitalization and Economic Assistance for Missouri Residential Demand Analysis
3/24/08 82112-05 - 81 -
Hannibal, Missouri
Clear Creek Subdivision
Westridge Condos

Downtown Revitalization and Economic Assistance for Missouri Residential Demand Analysis
3/24/08 82112-05 - 82 -
Hannibal, Missouri
Although it is not a new development Huckleberry Heights is a garden style condominium development located off of 61 Highway, just south of MM Highway that offers the benefits of ownership without most of the burdens of maintenance. There were no other garden style condo developments of its type that were noted in the market. Currently units in the development are for sale from $70,000 to $90,000.
Huckleberry Heights Condos
In the downtown market area homeowners primarily reside in single family homes that appear to be older than 80 years. Some are large historic and architecturally significant homes, particularly north of Broadway and east of Maple. Following are examples of some of the historical homes in the downtown area.

Downtown Revitalization and Economic Assistance for Missouri Residential Demand Analysis
3/24/08 82112-05 - 83 -
Hannibal, Missouri
Most of the homes in the downtown market, especially in the area south of Broadway, were well constructed of average design, but are not historically or architecturally significant. Many of the homes in the downtown neighborhood suffer from physical deterioration and deferred maintenance. Consequently, the downtown residential homeownership market is mixed with housing qualities and conditions. As previously mentioned in another section, the downtown market area has the highest percentage of renter occupied units in the city. Approximately 40% of the units in the area are renter occupied as compared to approximately 25% to 30% for all other areas of the city. Two of the keys to downtown revitalization are an improvement in the physical condition of the residential housing stock in the downtown market area and the increase of homeownership in the market. The surveyor is unaware of any condos or lofts that have been marketed for sale in the downtown area. Most of the current occupancy of the upper floors of commercial buildings in the downtown area is generally a few rental units and a few units that may be occupied by the building owners. The loft/condo market appears to be a market that is relatively untapped in downtown Hannibal. There are relatively few residential units in the downtown market area that take advantage of the majestic river views. Few communities have the advantage of such a magnificent natural resource that could be used for residential marketing purposes to draw households from within and outside the community.
Downtown Revitalization and Economic Assistance for Missouri Residential Demand Analysis
3/24/08 82112-05 - 84 -
Hannibal, Missouri
This Page Intentionally Left Blank
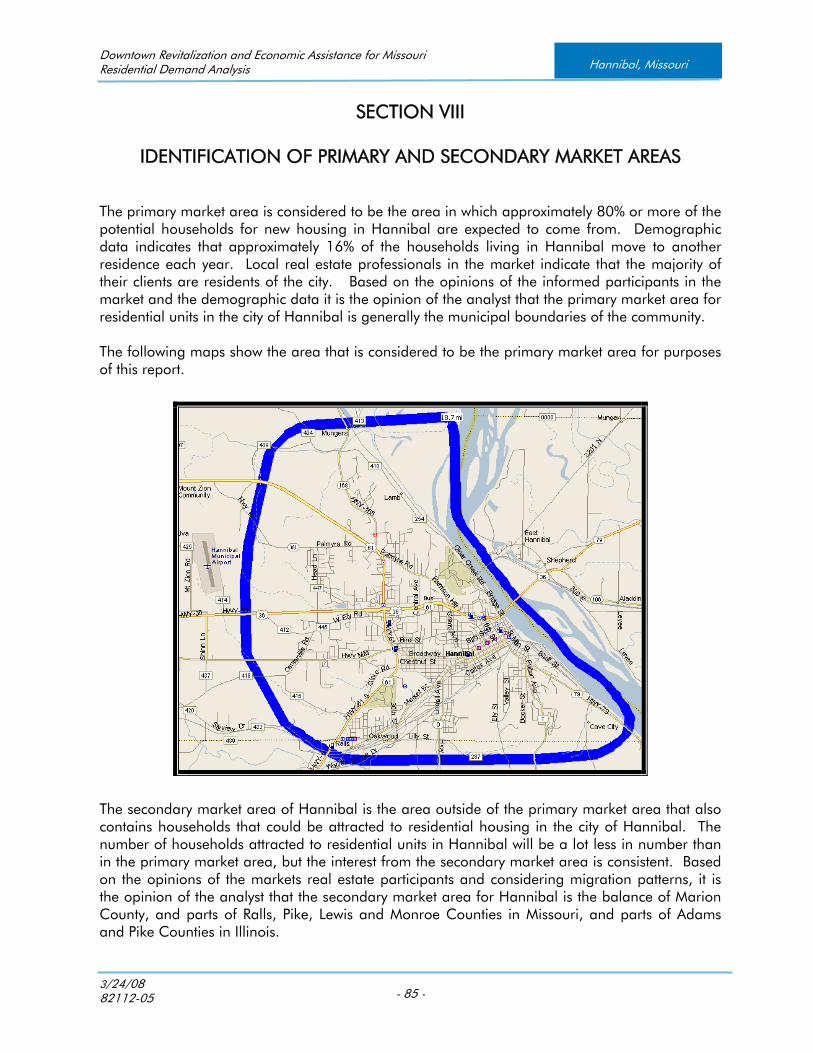
Downtown Revitalization and Economic Assistance for Missouri Residential Demand Analysis
3/24/08 82112-05 - 85 -
Hannibal, Missouri
SECTION VIII
IDENTIFICATION OF PRIMARY AND SECONDARY MARKET AREAS
The primary market area is considered to be the area in which approximately 80% or more of the potential households for new housing in Hannibal are expected to come from. Demographic data indicates that approximately 16% of the households living in Hannibal move to another residence each year. Local real estate professionals in the market indicate that the majority of their clients are residents of the city. Based on the opinions of the informed participants in the market and the demographic data it is the opinion of the analyst that the primary market area for residential units in the city of Hannibal is generally the municipal boundaries of the community. The following maps show the area that is considered to be the primary market area for purposes of this report.
The secondary market area of Hannibal is the area outside of the primary market area that also contains households that could be attracted to residential housing in the city of Hannibal. The number of households attracted to residential units in Hannibal will be a lot less in number than in the primary market area, but the interest from the secondary market area is consistent. Based on the opinions of the markets real estate participants and considering migration patterns, it is the opinion of the analyst that the secondary market area for Hannibal is the balance of Marion County, and parts of Ralls, Pike, Lewis and Monroe Counties in Missouri, and parts of Adams and Pike Counties in Illinois.

Downtown Revitalization and Economic Assistance for Missouri Residential Demand Analysis
3/24/08 82112-05 - 86 -
Hannibal, Missouri
The following map shows the area that is considered to be the secondary market area for purposes of this report.
HISTA Demographic Data Claritas, Inc., a leading national demographic data provider, working with another company, Ribbon Demographics, has recently developed a unique data product that is designed specifically for housing analysis. The product is called HISTA. HISTA breaks households down by income, household size, tenure and broad age groups. It is a custom four-way cross tabulation of household data; not extrapolations of SF3 data. It eliminates the need for the analyst to perform various extrapolation steps, which is not as accurate as cross tabulation. Following are the HISTA tables for the Primary Market Area for 2007 and 2012. They will be used for the rental housing demand analysis. The tables contain current household estimates for the Primary Market Area by tenure (renter or homeowner), income, and household size, for age groups 18-54, 55-61, and aged 62+. The same type of tables is shown based on year 2012 household projections. The differences in the number of households in each of the categories provide a good indication of future potential residential growth or decline. The Primary Market Area has been delineated as the City of Hannibal, which includes U.S. Census Tracts 9604, 9605, 9607, 9608, and 9609.

Downtown Revitalization and Economic Assistance for Missouri Residential Demand Analysis
3/24/08 82112-05 - 87 -
Hannibal, Missouri
Table 36----PMA Owner Households (Under Age 55 Years) - 2007 Estimates
Owner Households Under Age 55 Years
Current Year Estimates - 2007 1-Person 2-Person 3-Person 4-Person 5+-Person Household Household Household Household Household Total
$0-10,000 31 16 18 0 3 68 $10,000-20,000 40 30 28 26 15 139 $20,000-30,000 120 47 71 48 13 299 $30,000-40,000 96 102 117 97 21 433 $40,000-50,000 31 86 70 78 53 318 $50,000-60,000 22 73 58 107 63 323
$60,000+ 24 251 232 185 173 865
Total 364 605 594 541 341 2,445
Source: Claritas, Ribbon Demographics
Table 37----PMA Owner Households (Aged 55-61) - 2007 Estimates
Owner Households Aged 55-61 Years
Current Year Estimates - 2007 1-Person 2-Person 3-Person 4-Person 5+-Person Household Household Household Household Household Total
$0-10,000 19 9 4 0 0 32 $10,000-20,000 17 1 0 3 0 21 $20,000-30,000 23 31 3 0 0 57 $30,000-40,000 39 82 8 4 0 133 $40,000-50,000 0 58 0 5 0 63 $50,000-60,000 4 46 12 3 1 66
$60,000+ 10 234 37 5 18 304
Total 112 461 64 20 19 676
Source: Claritas, Ribbon Demographic

Downtown Revitalization and Economic Assistance for Missouri Residential Demand Analysis
3/24/08 82112-05 - 88 -
Hannibal, Missouri
Table 38----PMA Owner Households (Aged 62+) - 2007 Estimates
Owner Households Aged 62+ Years
Current Year Estimates - 2007 1-Person 2-Person 3-Person 4-Person 5+-Person Household Household Household Household Household Total
$0-10,000 129 12 5 0 0 146 $10,000-20,000 256 81 0 0 0 337 $20,000-30,000 117 123 13 3 0 256 $30,000-40,000 66 195 36 0 5 302 $40,000-50,000 37 28 32 8 1 106 $50,000-60,000 12 85 0 0 3 100
$60,000+ 44 183 44 0 15 286
Total 661 707 130 11 24 1,533
Source: Claritas, Ribbon Demographic
Table 39----PMA Renter Households (Under Age 55 Years) - 2007 Estimates
Renter Households Under Age 55 Years
Current Year Estimates - 2007
1-Person 2-Person 3-Person 4-Person 5+-Person
Household Household Household Household Household Total
$0-10,000 166 57 50 61 12 346 $10,000-
20,000 187 94 128 35 27 471 $20,000-
30,000 139 118 36 59 34 386 $30,000-
40,000 6 47 55 33 24 165 $40,000-
50,000 21 39 11 28 25 124 $50,000-
60,000 0 37 9 0 0 46
$60,000+ 16 40 17 43 48 164
Total 535 432 306 259 170 1,702
Source: Claritas, Ribbon Demographics

Downtown Revitalization and Economic Assistance for Missouri Residential Demand Analysis
3/24/08 82112-05 - 89 -
Hannibal, Missouri
Table 40----PMA Renter Households (Aged 55-61) - 2007 Estimates
Renter Households Aged 55-61 Years
Current Year Estimates - 2007
1-Person 2-Person 3-Person 4-Person 5+-Person
Household Household Household Household Household Total
$0-10,000 40 0 0 0 0 40 $10,000-
20,000 33 17 0 1 0 51 $20,000-
30,000 6 1 0 0 0 7 $30,000-
40,000 0 4 6 0 0 10 $40,000-
50,000 8 0 0 0 0 8 $50,000-
60,000 1 1 1 1 1 5
$60,000+ 0 8 0 0 0 8
Total 88 31 7 2 1 129
Source: Claritas, Ribbon Demographics
Table 41----PMA Renter Households (Aged 62+) - 2007 Estimates
Renter Households Aged 62+ Years
Current Year Estimates - 2007
1-Person 2-Person 3-Person 4-Person 5+-Person
Household Household Household Household Household Total
$0-10,000 187 3 0 0 0 190 $10,000-
20,000 150 23 4 0 0 177 $20,000-
30,000 37 0 3 0 0 40 $30,000-
40,000 9 5 0 8 0 22 $40,000-
50,000 1 1 2 1 1 6 $50,000-
60,000 5 4 0 0 0 9
$60,000+ 16 7 25 0 0 48
Total 405 43 34 9 1 492
Source: Claritas, Ribbon Demographics

Downtown Revitalization and Economic Assistance for Missouri Residential Demand Analysis
3/24/08 82112-05 - 90 -
Hannibal, Missouri
Table 42----PMA Owner Households (Under Age 55 Years) - 2012 Projections
Owner Households Under Age 55 Years
Five Year Projections - 2012
1-Person 2-Person 3-Person 4-Person 5+-Person
Household Household Household Household Household Total
$0-10,000 29 15 16 0 1 61 $10,000-
20,000 33 22 20 20 10 105 $20,000-
30,000 107 36 58 40 9 250 $30,000-
40,000 96 86 98 91 17 388 $40,000-
50,000 25 68 58 71 50 272 $50,000-
60,000 20 71 61 101 56 309
$60,000+ 27 262 246 201 188 924
Total 337 560 557 524 331 2,309
Source: Claritas, Ribbon Demographics
Table 43----PMA Owner Households (Aged 55-61) - 2012 Projections
Owner Households Aged 55-61 Years
Five Year Projections - 2012
1-Person 2-Person 3-Person 4-Person 5+-Person
Household Household Household Household Household Total
$0-10,000 19 11 4 0 0 34 $10,000-
20,000 20 1 1 3 1 26 $20,000-
30,000 23 30 3 0 0 56 $30,000-
40,000 37 74 11 4 0 126 $40,000-
50,000 1 72 2 7 1 83 $50,000-
60,000 2 53 13 3 1 72
$60,000+ 15 287 55 7 25 389
Total 117 528 89 24 28 786
Source: Claritas, Ribbon Demographics

Downtown Revitalization and Economic Assistance for Missouri Residential Demand Analysis
3/24/08 82112-05 - 91 -
Hannibal, Missouri
Table 44----PMA Owner Households (Aged 62+) - 2012 Projections Owner Households Aged 62+ Years
Five Year Projections - 2012
1-Person 2-Person 3-Person 4-Person 5+-Person
Household Household Household Household Household Total
$0-10,000 104 9 3 0 0 116 $10,000-
20,000 227 65 0 0 0 292 $20,000-
30,000 130 120 15 3 0 268 $30,000-
40,000 73 177 33 0 5 288 $40,000-
50,000 52 36 51 12 6 157 $50,000-
60,000 13 78 0 0 5 96
$60,000+ 56 211 51 0 15 333
Total 655 696 153 15 31 1,550
Source: Claritas, Ribbon Demographics
Table 45----PMA Renter Households (Under Age 55 Years) – 2012 Projections
Renter Households Under Age 55 Years
Five Year Projections - 2012
1-Person 2-Person 3-Person 4-Person 5+-Person
Household Household Household Household Household Total
$0-10,000 157 50 46 55 11 319 $10,000-
20,000 167 78 106 27 23 401 $20,000-
30,000 138 106 34 55 29 362 $30,000-
40,000 5 45 52 32 23 157 $40,000-
50,000 27 39 8 30 25 129 $50,000-
60,000 0 34 9 0 0 43
$60,000+ 22 49 19 54 60 204
Total 516 401 274 253 171 1,615
Source: Claritas, Ribbon Demographics

Downtown Revitalization and Economic Assistance for Missouri Residential Demand Analysis
3/24/08 82112-05 - 92 -
Hannibal, Missouri
Table 46----PMA Renter Households (Aged 55-61) – 2012 Projections
Aged 55-61 Years
Five Year Projections - 2012
1-Person 2-Person 3-Person 4-Person 5+-Person
Household Household Household Household Household Total
$0-10,000 42 0 0 0 0 42 $10,000-
20,000 38 16 1 1 1 57 $20,000-
30,000 6 1 0 0 0 7 $30,000-
40,000 0 4 4 0 0 8 $40,000-
50,000 13 1 2 1 1 18 $50,000-
60,000 1 1 1 1 1 5
$60,000+ 0 13 0 0 0 13
Total 100 36 8 3 3 150
Source: Claritas, Ribbon Demographic
Table 47----PMA Renter Households (Aged 62+) – 2012 Projections
Renter Households Aged 62+ Years
Five Year Projections - 2012
1-Person 2-Person 3-Person 4-Person 5+-Person
Household Household Household Household Household Total
$0-10,000 181 2 0 0 0 183 $10,000-
20,000 159 20 3 0 0 182 $20,000-
30,000 47 0 2 0 0 49 $30,000-
40,000 11 5 0 10 0 26 $40,000-
50,000 5 4 6 5 5 25 $50,000-
60,000 7 3 0 0 0 10
$60,000+ 21 10 36 0 0 67
Total 431 44 47 15 5 542
Source: Claritas, Ribbon Demographics

Downtown Revitalization and Economic Assistance for Missouri Residential Demand Analysis
3/24/08 82112-05 - 93 -
Hannibal, Missouri
SECTION IX
POTENTIAL RESIDENTIAL DOWNTOWN HOUSING DEMAND
The purpose of this study is to determine if residential development would complement the downtown revitalization efforts, the household type(s) that would comprise the residential market, the type of housing that should be considered, and the approximate number of households that can be captured for residential units in the Downtown Market Area. In order for the downtown area to attract permanent residents it first has to become an area that does a better job of attracting people in general. A “critical mass” of pedestrian scale uses that include a complex mix of businesses and attractions must be present to attract people to the area. Presently the area lacks many of the businesses that are important to local residents like a grocer, pharmacy, hardware store, larger choice of eating establishments, etc.. The pioneering residents of the downtown area will need to make sacrifices until a critical mass of people can be formed to affect the feasibility of bringing more neighborhood oriented businesses to the area. The existing downtown area of Hannibal is like an uncompleted canvas. Although there are some historical attractions and related businesses the true culture and potential of the area has yet to be defined and fulfilled. Beyond the attraction for tourists the downtown area could also be an entertainment center for the local community and the location of new and different housing opportunities for various types of households. Plans are already in place to increase the entertainment in the downtown area with the proposed movie theater, the proposed amphitheater and other improvements to the riverfront, and the possibility of college level baseball being played at the baseball facility in the downtown area. The downtown area is beginning to see a growing art culture. Artists from within and outside of the area are beginning to form a cluster of galleries along Main Street and some are living in loft style units in the downtown area. Many downtown areas have suffered from urban sprawl as new shopping centers and commercial strip malls have been developed outside of the central business district, attracting people and businesses away from downtown. This is the case of Hannibal as most shopping is now done along U.S. Highway 61. In many cities the trend is being reversed as communities began to value walkable urban opportunities. Walkable urbanity is a new trend where people have convenient walking access to many of their typical daily destinations, such as a park, a grocery store, a movie theatre, employment, restaurants, shopping, nightlife and civic institutions. Hannibal has the opportunity in its downtown area to create a walkable urban village that could contain shopping, eating and entertainment venues and new and unique residential opportunities. The river is one of the greatest assets of the community, but very few residential structures exist to allow residents to view the river from their own residence. The risks of flooding in the downtown area must be considered and taken into consideration, but an obvious residential opportunity that currently does not exist within the downtown area is residential units with the elevations to grant majestic views of the river. Very few communities have such a tremendous natural asset. Vertical development in the downtown area should be considered to take advantage of the river’s attraction.

Downtown Revitalization and Economic Assistance for Missouri Residential Demand Analysis
3/24/08 82112-05 - 94 -
Hannibal, Missouri
In addition to the river another significant asset in the opinion of the market analyst that should be taken advantage of for the benefit of downtown revitalization is Broadway Avenue. Broadway has the feel of a boulevard and appeared to be the primary “Gateway” into the downtown area. Unfortunately some of the buildings located along Broadway that were either in disrepair, vacant, or underutilized are detracting from the street’s image. As part of the strategy to revitalize the downtown area special attention should be given to Broadway because of its high visibility. It is a street that carries a lot of weight in defining the area. It would be beneficial to downtown revitalization to cure the blight created by the deteriorated, vacant and underutilized buildings by mandating that owners make improvements, and implement strategies to make the best use of the land and buildings to make a positive impact on the area. Part of that strategy should include utilizing some of the space for unique housing opportunities. Improvements along Broadway could be the catalyst for improvements to properties in the surrounding neighborhoods. From a market perspective the assets of the Hannibal downtown area are significant. Some of them include the following: • Historic attractions and tourism: The power of the Mark Twain legacy and the related
attractions in the downtown area draws many tourists to the area annually, creating an “open house” to the community.
• Potential residential sites: Empty or underutilized buildings, vacant or underutilized tracts of
land, and depressed real estate prices are negative attributes in the downtown market, but they also present an opportunity for business and residential development.
• Employment: The downtown is still the center of municipal, county, and federal government,
which draws people to the area during the daylight hours. • Culture: The area is developing into an art district, with a growing number of small art
galleries. • Niche Shopping: The downtown area contains a number of antique stores, gift shops, and
specialty stores. • Natural Asset: The area is located along the Mississippi River and has magnificent views of
the river. The river views are very marketable and can provide the basis for unique housing opportunities.
• Walkability: The downtown area is compact with a friendly street pattern that allows for
leisurely strolls. • Accessibility: Access to and from the area is relatively easy in all directions. • Gathering place: The riverfront in the downtown area is the site of many major community
events.
Downtown Revitalization and Economic Assistance for Missouri Residential Demand Analysis
3/24/08 82112-05 - 95 -
Hannibal, Missouri
From a market perspective, the current challenges of the Downtown Hannibal Market area are also significant. They include the following: • Sense of place: The downtown area needs to re-establish its sense of place in the community
by continuing to highlight and elevate its cultural and historical assets. • People presence: The downtown area needs to attract more permanent residents to the area
to help support and attract existing and new businesses and to give the area a 24 hour people presence.
• Lack of housing opportunities: The downtown area needs more high quality housing
opportunities to attract permanent residents by marketing the unique types of housing experience that would only be possible in the downtown area.
• Retailers: The downtown area has very few neighborhood oriented businesses that would
support the needs of area residents, especially its senior residents. • Dining and entertainment: The downtown area has very few dining and entertainment
venues. Dining and entertainment venues will attract more people and more people will attract other types of businesses.
The revitalization of downtown Hannibal will generally need to follow the pattern that many downtown areas have followed during their revitalization process. There first must be a reason for people to come to the downtown area. More than government or business there must be an entertainment reason for a critical mass of people to want to spend their time and money in the downtown area. The second step is to create rental housing opportunities for the pioneers, who in most cases will be young households looking for a unique lifestyle not available in other areas of the community. Some of the artists that have recently moved into the downtown area are part of the pioneering process. In a previous section of this report it was noted that the downtown area has a very high percentage of rental units as compared to the rest of the community and that one of the goals should be to try and increase homeownership in the area. This may be a case of taking one step back in order to take two steps forward because it may be important to create more rental housing opportunities in specific locations (along Main, 3rd Street and Broadway) early on in the revitalization process in order to grow the residential market to the point that there is increased homeownership demand. And the majority of that rental housing may have to be units produced under affordable housing programs because of the economic constraints of the market. Once the residential market begins to gain economic momentum rents and lender interest should increase making it feasible to develop market rate rental units for young renter households of higher incomes. In Hannibal the pioneering process has already begun with the rehabilitation of the Mark Twain Hotel that has brought a group of senior households to the downtown area. A survey of existing senior housing developments indicated that the existing senior housing market has good occupancy. Although the Mark Twain Hotel currently has a 75% occupancy rate, it soon will be filled to capacity and the community will again have a shortfall of available, affordable rental housing units for senior households. A development beginning the planning process today probably won’t be available to the market until late 2009 at the earliest. In addition to senior
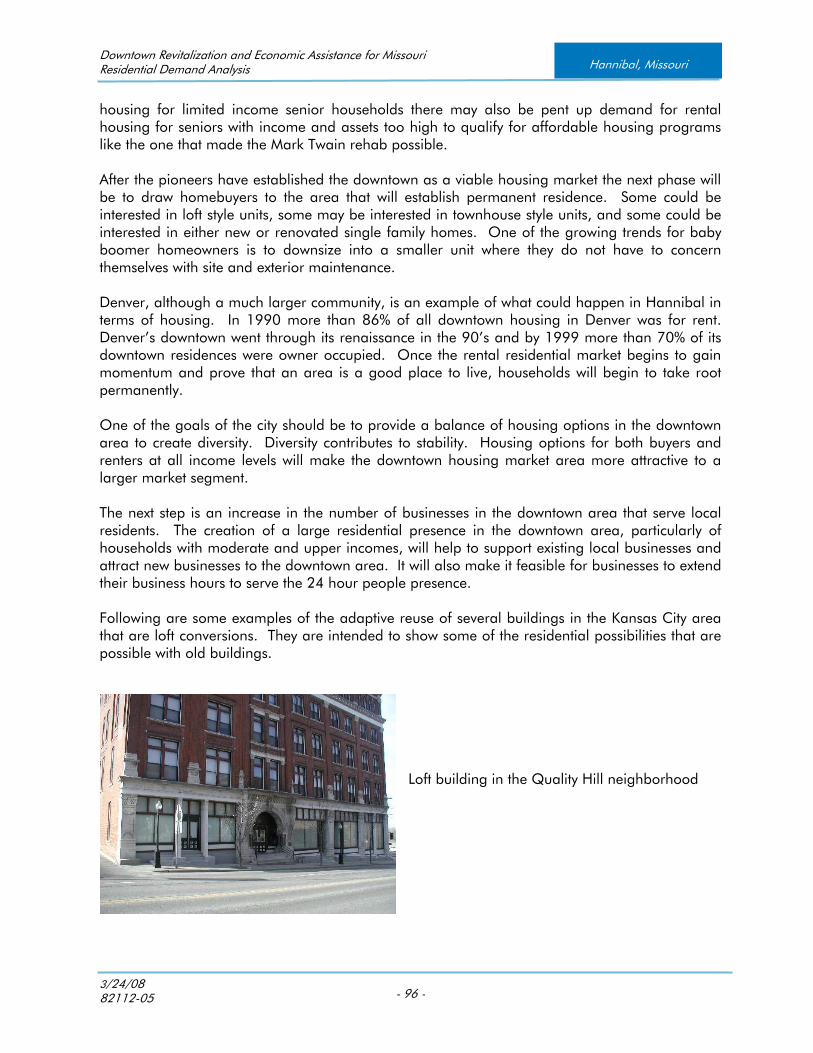
Downtown Revitalization and Economic Assistance for Missouri Residential Demand Analysis
3/24/08 82112-05 - 96 -
Hannibal, Missouri
housing for limited income senior households there may also be pent up demand for rental housing for seniors with income and assets too high to qualify for affordable housing programs like the one that made the Mark Twain rehab possible. After the pioneers have established the downtown as a viable housing market the next phase will be to draw homebuyers to the area that will establish permanent residence. Some could be interested in loft style units, some may be interested in townhouse style units, and some could be interested in either new or renovated single family homes. One of the growing trends for baby boomer homeowners is to downsize into a smaller unit where they do not have to concern themselves with site and exterior maintenance. Denver, although a much larger community, is an example of what could happen in Hannibal in terms of housing. In 1990 more than 86% of all downtown housing in Denver was for rent. Denver’s downtown went through its renaissance in the 90’s and by 1999 more than 70% of its downtown residences were owner occupied. Once the rental residential market begins to gain momentum and prove that an area is a good place to live, households will begin to take root permanently. One of the goals of the city should be to provide a balance of housing options in the downtown area to create diversity. Diversity contributes to stability. Housing options for both buyers and renters at all income levels will make the downtown housing market area more attractive to a larger market segment. The next step is an increase in the number of businesses in the downtown area that serve local residents. The creation of a large residential presence in the downtown area, particularly of households with moderate and upper incomes, will help to support existing local businesses and attract new businesses to the downtown area. It will also make it feasible for businesses to extend their business hours to serve the 24 hour people presence. Following are some examples of the adaptive reuse of several buildings in the Kansas City area that are loft conversions. They are intended to show some of the residential possibilities that are possible with old buildings.
Loft building in the Quality Hill neighborhood

Downtown Revitalization and Economic Assistance for Missouri Residential Demand Analysis
3/24/08 82112-05 - 97 -
Hannibal, Missouri
Coates House Lofts and Apartments
Opera House Lofts
Jewell Lofts
Pacific House Lofts in River Market
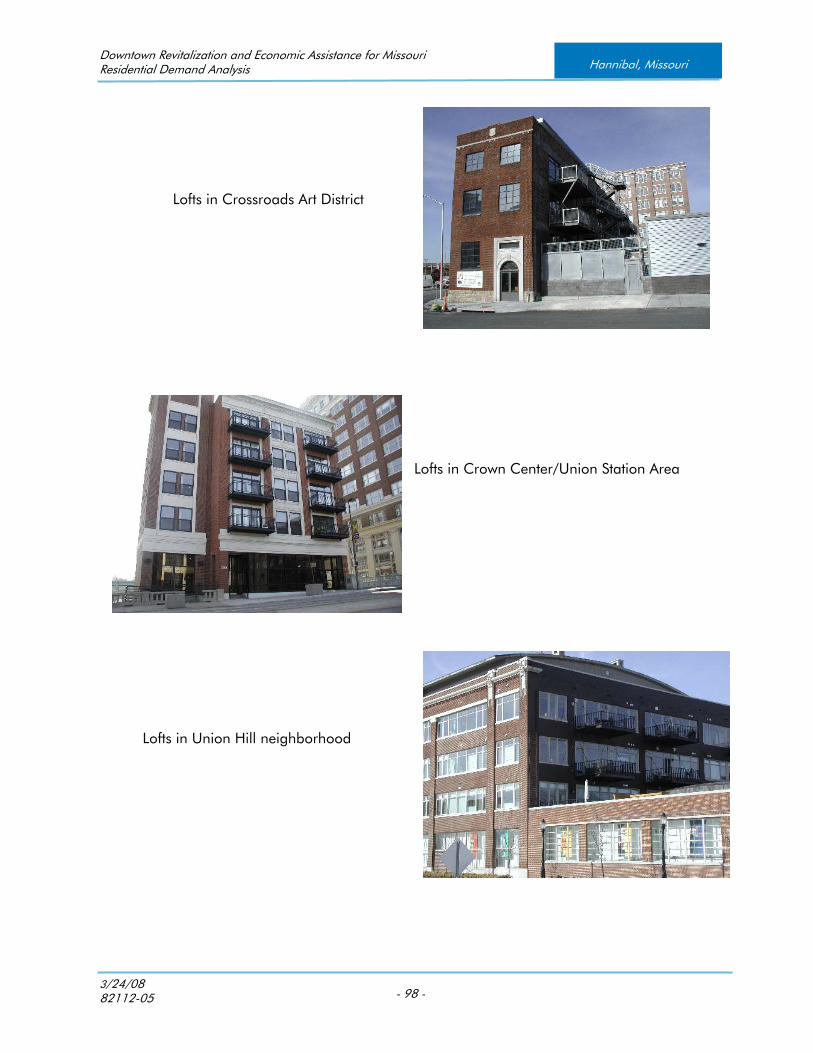
Downtown Revitalization and Economic Assistance for Missouri Residential Demand Analysis
3/24/08 82112-05 - 98 -
Hannibal, Missouri
Lofts in Crossroads Art District
Lofts in Crown Center/Union Station Area
Lofts in Union Hill neighborhood
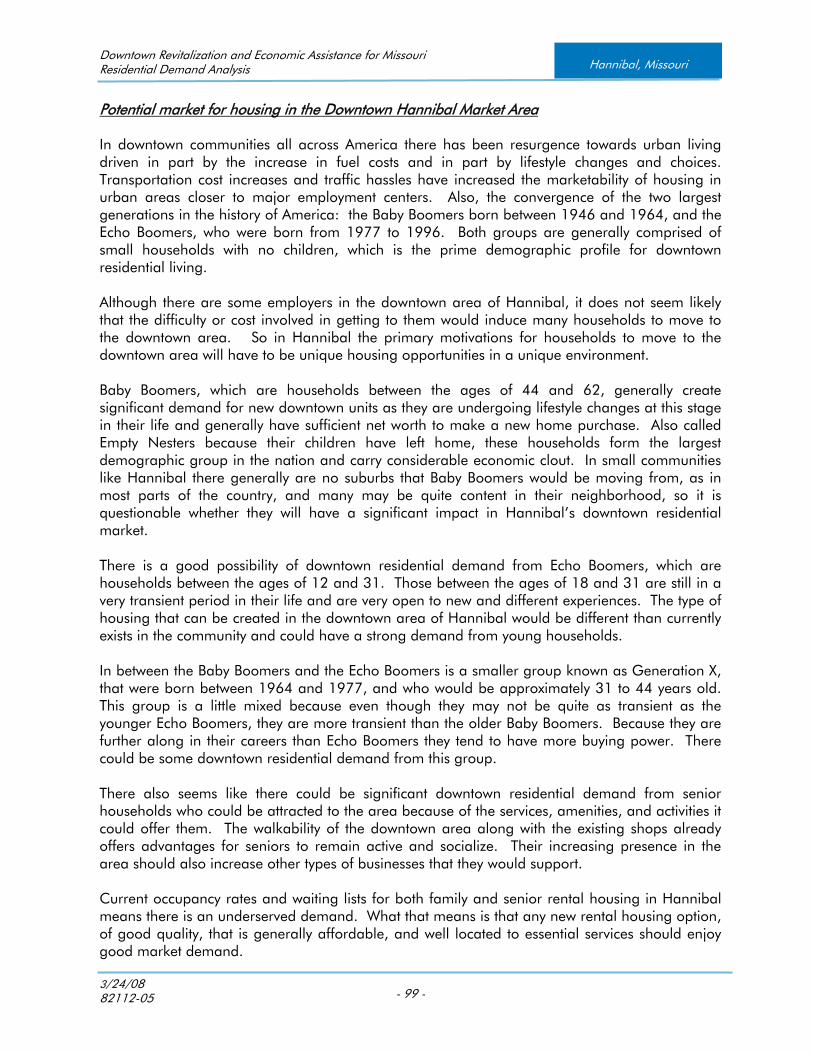
Downtown Revitalization and Economic Assistance for Missouri Residential Demand Analysis
3/24/08 82112-05 - 99 -
Hannibal, Missouri
Potential market for housing in the Downtown Hannibal Market Area In downtown communities all across America there has been resurgence towards urban living driven in part by the increase in fuel costs and in part by lifestyle changes and choices. Transportation cost increases and traffic hassles have increased the marketability of housing in urban areas closer to major employment centers. Also, the convergence of the two largest generations in the history of America: the Baby Boomers born between 1946 and 1964, and the Echo Boomers, who were born from 1977 to 1996. Both groups are generally comprised of small households with no children, which is the prime demographic profile for downtown residential living. Although there are some employers in the downtown area of Hannibal, it does not seem likely that the difficulty or cost involved in getting to them would induce many households to move to the downtown area. So in Hannibal the primary motivations for households to move to the downtown area will have to be unique housing opportunities in a unique environment. Baby Boomers, which are households between the ages of 44 and 62, generally create significant demand for new downtown units as they are undergoing lifestyle changes at this stage in their life and generally have sufficient net worth to make a new home purchase. Also called Empty Nesters because their children have left home, these households form the largest demographic group in the nation and carry considerable economic clout. In small communities like Hannibal there generally are no suburbs that Baby Boomers would be moving from, as in most parts of the country, and many may be quite content in their neighborhood, so it is questionable whether they will have a significant impact in Hannibal’s downtown residential market. There is a good possibility of downtown residential demand from Echo Boomers, which are households between the ages of 12 and 31. Those between the ages of 18 and 31 are still in a very transient period in their life and are very open to new and different experiences. The type of housing that can be created in the downtown area of Hannibal would be different than currently exists in the community and could have a strong demand from young households. In between the Baby Boomers and the Echo Boomers is a smaller group known as Generation X, that were born between 1964 and 1977, and who would be approximately 31 to 44 years old. This group is a little mixed because even though they may not be quite as transient as the younger Echo Boomers, they are more transient than the older Baby Boomers. Because they are further along in their careers than Echo Boomers they tend to have more buying power. There could be some downtown residential demand from this group. There also seems like there could be significant downtown residential demand from senior households who could be attracted to the area because of the services, amenities, and activities it could offer them. The walkability of the downtown area along with the existing shops already offers advantages for seniors to remain active and socialize. Their increasing presence in the area should also increase other types of businesses that they would support. Current occupancy rates and waiting lists for both family and senior rental housing in Hannibal means there is an underserved demand. What that means is that any new rental housing option, of good quality, that is generally affordable, and well located to essential services should enjoy good market demand.

Downtown Revitalization and Economic Assistance for Missouri Residential Demand Analysis
3/24/08 82112-05 - 100 -
Hannibal, Missouri
Estimated number of households that could create residential housing demand in the Downtown Hannibal Market area within the next few years In order to estimate the number of households that could create residential housing demand in the downtown Hannibal market area it will first be necessary to estimate demand from the primary and secondary market areas for the Hannibal market as a whole. The next step would be to apply a capture rate to the Hannibal residential demand estimate of households that have the potential of creating the residential demand in the downtown market area of Hannibal. The demographic data that will be used for the analysis is a product by Claritas and Ribbon Demographics called HISTA. HISTA breaks households down by income, household size, tenure and broad age groups. It is a custom four-way cross tabulation of household data; not extrapolations of SF3 data. It eliminates the need for the analyst to perform various extrapolation steps, which is not as accurate as cross tabulation. Following are the HISTA tables for the primary market area (PMA) for 2007 and 2012 and for owner households and renters. The tables contain current household estimates for the PMA by tenure (renter or homeowner), income, and household size, for age groups 18-54, 55-61, and aged 62+. The same type of tables is shown based on year 2012 household projections. The differences in the number of households in each of the categories provide a good indication of future potential residential growth or housing demand. The annual growth potential added to the current years demand estimate provides a good indication of the annual demand for the various housing types over the next few years. The conclusions of the analysis are that annually between 2007 and 2012 the Downtown Market Area of Hannibal could have estimated residential demands as follows:
Hannibal, Missouri Annual Downtown Residential Market Demand 2007-2012
Type Households
Affordable Senior Rental Housing 40
Affordable Family Rental Housing 41
Market Rate Family Rental Housing 30
Homeownership 10
Total 121
The potential residential demand estimates above are representative of the size of the typical residential market in the downtown market area for the various housing types annually between 2007 and 2012 and are based on the current supply and demand in the Hannibal market.

Downtown Revitalization and Economic Assistance for Missouri Residential Demand Analysis
3/24/08 82112-05 - 101 -
Hannibal, Missouri
Demand Capture Rate Methodology The quantitative analysis will be a capture rate analysis, which is an estimate of the number of qualified households in the primary market area that could create residential demand in the downtown area of Hannibal. The estimate will be based on the premise that a portion, or percentage of the qualified households that have the propensity to move into, or within the primary market area could be attracted to residential units in the downtown area of Hannibal. A capture rate will be applied to the potential pool of qualified households to yield an estimate of the potential draw power of available residential units in the downtown area. The capture rate estimate is determined by considering the size of the primary and secondary market areas and the current supply of residential units in the primary market area that would be considered competitive with the downtown residential units. The Capture Rate Analysis that follows should not be construed as the number of units that should be built in the downtown area, but as the estimated size of the residential demand pool for various housing types. With that information a developer could then consider how many units could be feasible to produce based on their interpretation of the market risk. The analysis includes conclusions by the analyst, but more importantly provides a framework for evaluation that can be considered and used by developers and other interested parties.
AFFORDABLE SENIOR RENTAL HOUSING DEMAND ANALYSIS
Early on in the downtown revitalization process rental housing should play a key role by housing the pioneers of the downtown residential renaissance. The market for affordable senior rental housing could be one of the first to develop in the downtown market area because of the attraction of the downtown area to seniors, the financial ease of producing senior affordable housing, and the pent up demand that exists in the market. This section contains an analysis of the annual potential residential demand in the downtown area for affordable senior rental units. Starting with HISTA demographic data the following analysis concludes that between 2007 and 2012 there could be an annual potential household demand for affordable senior rental units in the Downtown Market Area of Hannibal from approximately 40 households. Following is the analysis: Affordable Senior Rental Potential Demand Analysis
PMA Qualified Household Demand (2007) 1BR/2BR
1 Gross Rent (includes utility costs paid by tenants) $ 500
2 Percentage of Income to Housing 50%
3 Minimum Income (Affordability) $ 12,000
4 Maximum Income (Tax Credit Limit) $ 23,010
Appropriate Sized, Income Qualified,
5 Renter Households, Age 62+ (2007) 149
Percentage of Existing Senior Renter Households Likely to Move if 6 New Affordable Housing Were Available 15%

Downtown Revitalization and Economic Assistance for Missouri Residential Demand Analysis
3/24/08 82112-05 - 102 -
Hannibal, Missouri
Number of Existing Senior Renter Households Likely to Move if 7 New Affordable Housing Were Available 22
Appropriate Sized, Income Qualified,
8 Owner Households, Age 62+ (2007) 342
Percentage of Existing Senior Owner Households Likely to Move
9 if New Affordable Rental Housing Were Available 5%
Number of Existing Senior Owner Households Likely to Move 10 If New Affordable Rental Housing Were Available 17
Number of Existing Senior Non-Head of Households Likely to Move
11 If New Affordable Rental Housing Were Available 4
12 PMA Qualified Household Demand (2007) 43
13 SMA Qualified Household Demand (2007) 9
14 PMA and SMA Affordable Senior Housing Potential Hsld Demand (2007) 52
PMA Projected Qualified Household Growth 2007-2012 1BR/2BR
15 Gross Rent (includes utility costs paid by tenants) $ 552
16 Percentage of Income to Housing 50%
17 Minimum Income (Affordability) $ 13,248
18 Maximum Income (Tax Credit Limit) $ 25,403
Appropriate Sized, Income Qualified,
19 Renter Households, Age 62+ (2012) 165
Percentage of Projected Senior Renter Households Likely to Move if
20 New Affordable Housing Were Available 15%
Number of Projected Senior Renter Households Likely to Move if
21 New Affordable Housing Were Available 25
Appropriate Sized, Income Qualified, 22 Owner Households, Age 62+ (2012) 363
Percentage of Projected Senior Owner Households Likely to Move
23 if New Affordable Rental Housing Were Available 5%
Number of Projected Senior Owner Households Likely to Move 24 If New Affordable Rental Housing Were Available 18
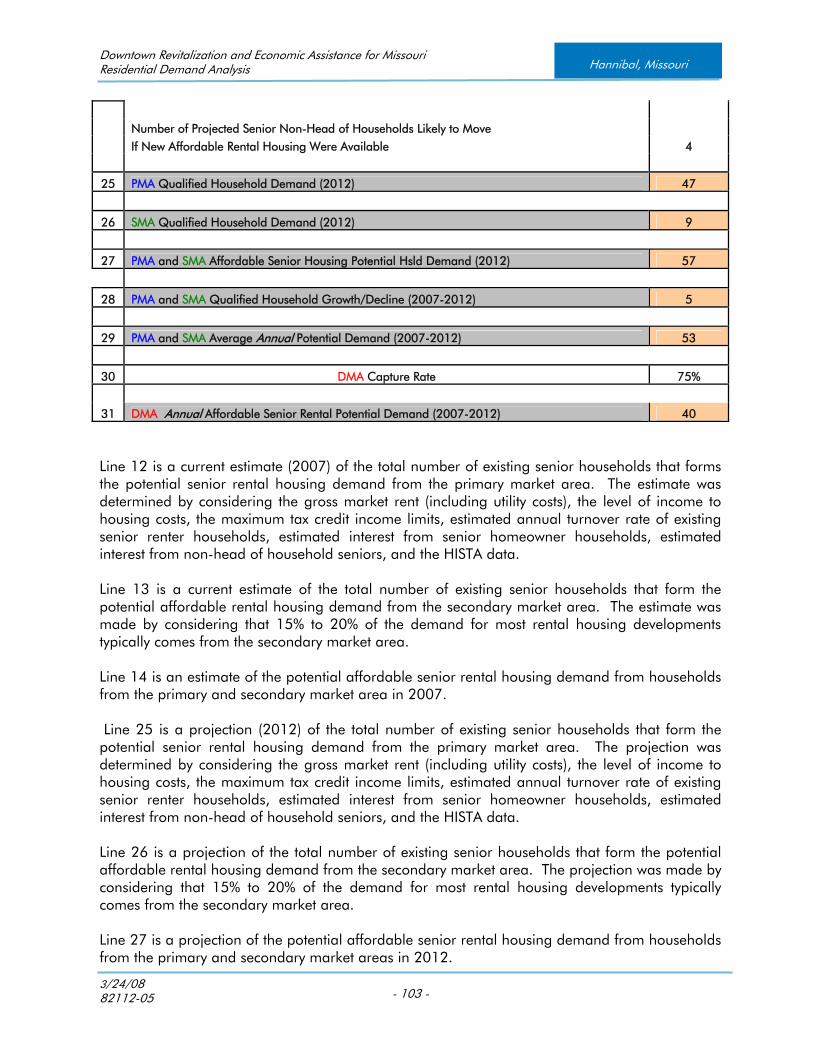
Downtown Revitalization and Economic Assistance for Missouri Residential Demand Analysis
3/24/08 82112-05 - 103 -
Hannibal, Missouri
Number of Projected Senior Non-Head of Households Likely to Move If New Affordable Rental Housing Were Available 4
25 PMA Qualified Household Demand (2012) 47
26 SMA Qualified Household Demand (2012) 9
27 PMA and SMA Affordable Senior Housing Potential Hsld Demand (2012) 57
28 PMA and SMA Qualified Household Growth/Decline (2007-2012) 5
29 PMA and SMA Average Annual Potential Demand (2007-2012) 53
30 DMA Capture Rate 75%
31 DMA Annual Affordable Senior Rental Potential Demand (2007-2012) 40
Line 12 is a current estimate (2007) of the total number of existing senior households that forms the potential senior rental housing demand from the primary market area. The estimate was determined by considering the gross market rent (including utility costs), the level of income to housing costs, the maximum tax credit income limits, estimated annual turnover rate of existing senior renter households, estimated interest from senior homeowner households, estimated interest from non-head of household seniors, and the HISTA data. Line 13 is a current estimate of the total number of existing senior households that form the potential affordable rental housing demand from the secondary market area. The estimate was made by considering that 15% to 20% of the demand for most rental housing developments typically comes from the secondary market area. Line 14 is an estimate of the potential affordable senior rental housing demand from households from the primary and secondary market area in 2007. Line 25 is a projection (2012) of the total number of existing senior households that form the potential senior rental housing demand from the primary market area. The projection was determined by considering the gross market rent (including utility costs), the level of income to housing costs, the maximum tax credit income limits, estimated annual turnover rate of existing senior renter households, estimated interest from senior homeowner households, estimated interest from non-head of household seniors, and the HISTA data. Line 26 is a projection of the total number of existing senior households that form the potential affordable rental housing demand from the secondary market area. The projection was made by considering that 15% to 20% of the demand for most rental housing developments typically comes from the secondary market area. Line 27 is a projection of the potential affordable senior rental housing demand from households from the primary and secondary market areas in 2012.
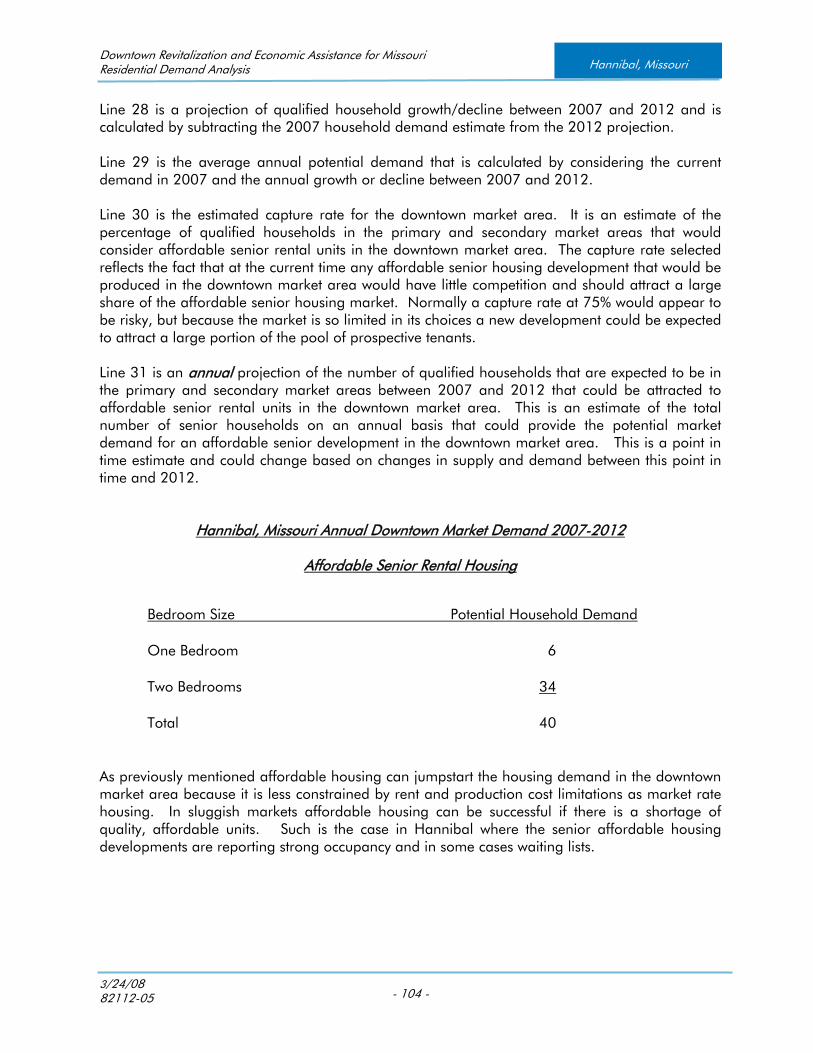
Downtown Revitalization and Economic Assistance for Missouri Residential Demand Analysis
3/24/08 82112-05 - 104 -
Hannibal, Missouri
Line 28 is a projection of qualified household growth/decline between 2007 and 2012 and is calculated by subtracting the 2007 household demand estimate from the 2012 projection. Line 29 is the average annual potential demand that is calculated by considering the current demand in 2007 and the annual growth or decline between 2007 and 2012. Line 30 is the estimated capture rate for the downtown market area. It is an estimate of the percentage of qualified households in the primary and secondary market areas that would consider affordable senior rental units in the downtown market area. The capture rate selected reflects the fact that at the current time any affordable senior housing development that would be produced in the downtown market area would have little competition and should attract a large share of the affordable senior housing market. Normally a capture rate at 75% would appear to be risky, but because the market is so limited in its choices a new development could be expected to attract a large portion of the pool of prospective tenants. Line 31 is an annual projection of the number of qualified households that are expected to be in the primary and secondary market areas between 2007 and 2012 that could be attracted to affordable senior rental units in the downtown market area. This is an estimate of the total number of senior households on an annual basis that could provide the potential market demand for an affordable senior development in the downtown market area. This is a point in time estimate and could change based on changes in supply and demand between this point in time and 2012.
Hannibal, Missouri Annual Downtown Market Demand 2007-2012
Affordable Senior Rental Housing
Bedroom Size Potential Household Demand
One Bedroom 6
Two Bedrooms 34
Total 40
As previously mentioned affordable housing can jumpstart the housing demand in the downtown market area because it is less constrained by rent and production cost limitations as market rate housing. In sluggish markets affordable housing can be successful if there is a shortage of quality, affordable units. Such is the case in Hannibal where the senior affordable housing developments are reporting strong occupancy and in some cases waiting lists.

Downtown Revitalization and Economic Assistance for Missouri Residential Demand Analysis
3/24/08 82112-05 - 105 -
Hannibal, Missouri
AFFORDABLE FAMILY RENTAL HOUSING DEMAND ANALYSIS
As previously mentioned in the preceding section, early on in the downtown revitalization process rental housing could play a key role by housing some of the pioneers of the downtown residential renaissance. The market for affordable family rental housing like affordable senior rental housing could be one of the first markets to develop in the downtown market area because of the limited affordable rental options in the community and the financial ease of producing this type of development. Because of rent and production cost constraints it is generally easier to develop affordable rental housing using the many subsidy programs that are available than it is to develop market rate rental housing. This section will contain an analysis of the potential residential demand in the downtown area for affordable family rental units. Starting with HISTA demographic data the following analysis concludes that between 2007 and 2012 there could be an annual potential household demand for affordable family rental units in the Downtown Market Area of Hannibal from approximately 41 households. Following is the analysis: Affordable Family Rental Potential Demand Analysis
PMA Qualified Household Demand (2007) 1BR 2BR 3BR
1 Gross Rent (includes utility costs paid by tenants) $ 475 $ 525 $ 625
2 Percentage of Income to Housing 35% 35% 35%
3 Minimum Income (Affordability) $ 16,286 $ 18,000 $ 21,429
4 Maximum Income (Tax Credit Limits) $ 23,010 $ 27,600 $ 33,120
Appropriate Sized (1-5 Person HH) , Income Qualified,
5 Renter HH, Age 18-61 (2007) 156 109 97
6 Percentage of Annual Turnover of Existing HH 25% 25% 25%
7 Number of Renter HH Turnover 39 27 24
8 Number of Non-Head of Household Potential Tenants 12 8 7
9 PMA Qualified Household Demand (2007) 51 35 32
10 SMA Qualified Household Demand (2007) 10 7 6
11 PMA and SMA Affordable Family Rental Potential Hshld Demand (2007) 61 43 38
PMA Qualified Household Demand (2012) 1BR 2BR 3BR
12 Gross Rent (includes utility costs paid by tenants) $ 524 $ 580 $ 690
13 Percentage of Income to Housing 35% 35% 35%
14 Minimum Income (Affordability) $ 17,979 $ 19,872 $ 23,657

Downtown Revitalization and Economic Assistance for Missouri Residential Demand Analysis
3/24/08 82112-05 - 106 -
Hannibal, Missouri
15 Maximum Income (Tax Credit Limits) $ 25,403 $ 30,470 $ 36,564
Appropriate Sized (1-5 Person HH) , Income Qualified,
16 Renter HH, Age 18-61 (2012) 158 93 89
17 Percentage of Annual Turnover of Existing HH 25% 25% 25%
18 Number of Renter HH Turnover 40 23 22
19 Number of Non-Head of Household Potential Tenants 12 7 7
20 PMA Qualified Household Demand (2012) 51 30 29
21 SMA Qualified Household Demand (2012) 10 6 6
22 PMA and SMA Affordable Family Rental Potential Hshld Demand (2012) 62 36 35
23 PMA and SMA Qualified Household Growth/Decline (2007-2012) 1 -6 -3
24 PMA and SMA Average Annual Potential Demand (2007-2012) 61 41 37
25 DMA Capture Rates 35% 35% 15%
1BR 2BR 3BR
26 DMA Annual Affordable Family Rental Potential Demand (2007-2012) 21 14 6
Line 9 is a current estimate (2007) of the total number of existing limited income households that form the potential affordable rental housing demand from the primary market area. The estimate was determined by considering the gross market rents (including utility costs), the level of income to housing costs, the maximum tax credit income limits, estimated annual turnover rate of renter households, estimated interest from non-head of household individuals, and the HISTA data. Line 10 is a current estimate of the total number of limited income households that form the potential affordable housing demand from the secondary market area. The estimate was made by considering that 15% to 20% of the demand for most rental housing developments typically comes from the secondary market area. Line 11 is an estimate of the potential affordable housing demand from households from the primary and secondary market area in 2007. Line 20 is a projection (2012) of the total number of limited income households that form the potential affordable rental housing demand from the primary market area. The projection was determined by considering the gross market rents (including utility costs), the level of income to housing costs, the maximum tax credit income limits, estimated annual turnover rate of renter households, estimated interest from non-head of household individuals, and the HISTA data.
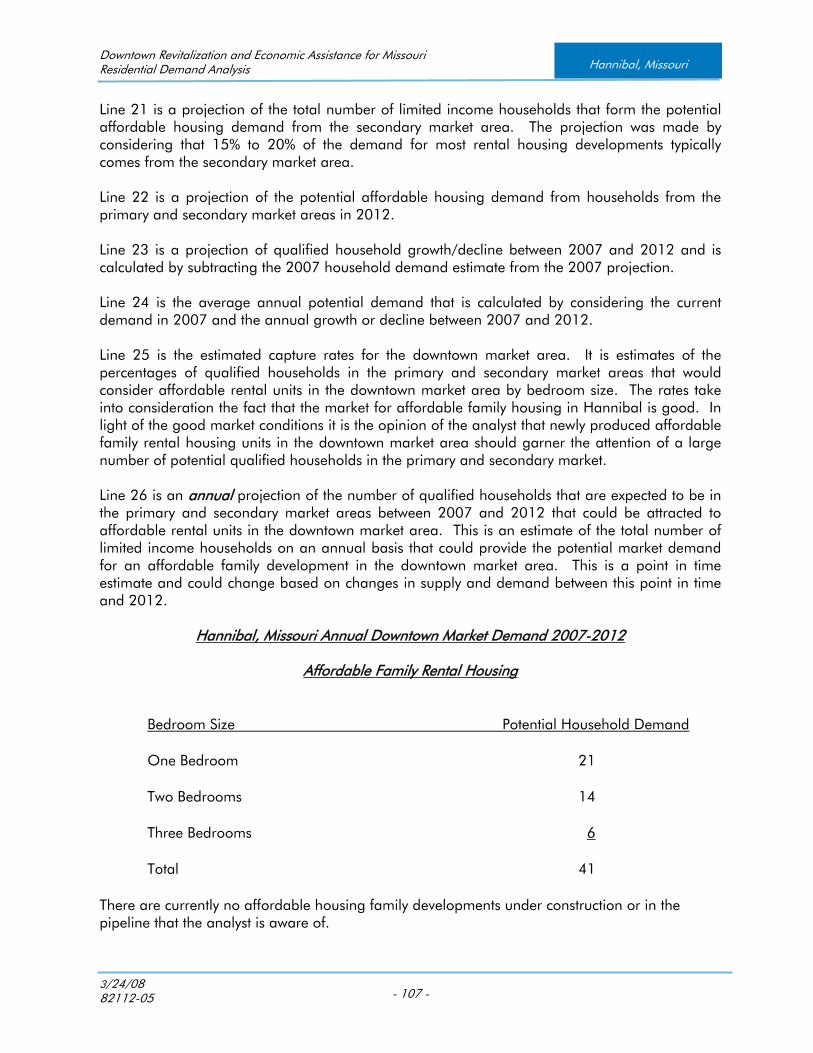
Downtown Revitalization and Economic Assistance for Missouri Residential Demand Analysis
3/24/08 82112-05 - 107 -
Hannibal, Missouri
Line 21 is a projection of the total number of limited income households that form the potential affordable housing demand from the secondary market area. The projection was made by considering that 15% to 20% of the demand for most rental housing developments typically comes from the secondary market area. Line 22 is a projection of the potential affordable housing demand from households from the primary and secondary market areas in 2012. Line 23 is a projection of qualified household growth/decline between 2007 and 2012 and is calculated by subtracting the 2007 household demand estimate from the 2007 projection. Line 24 is the average annual potential demand that is calculated by considering the current demand in 2007 and the annual growth or decline between 2007 and 2012. Line 25 is the estimated capture rates for the downtown market area. It is estimates of the percentages of qualified households in the primary and secondary market areas that would consider affordable rental units in the downtown market area by bedroom size. The rates take into consideration the fact that the market for affordable family housing in Hannibal is good. In light of the good market conditions it is the opinion of the analyst that newly produced affordable family rental housing units in the downtown market area should garner the attention of a large number of potential qualified households in the primary and secondary market. Line 26 is an annual projection of the number of qualified households that are expected to be in the primary and secondary market areas between 2007 and 2012 that could be attracted to affordable rental units in the downtown market area. This is an estimate of the total number of limited income households on an annual basis that could provide the potential market demand for an affordable family development in the downtown market area. This is a point in time estimate and could change based on changes in supply and demand between this point in time and 2012.
Hannibal, Missouri Annual Downtown Market Demand 2007-2012
Affordable Family Rental Housing
Bedroom Size Potential Household Demand
One Bedroom 21
Two Bedrooms 14
Three Bedrooms 6
Total 41
There are currently no affordable housing family developments under construction or in the pipeline that the analyst is aware of.

Downtown Revitalization and Economic Assistance for Missouri Residential Demand Analysis
3/24/08 82112-05 - 108 -
Hannibal, Missouri
MARKET RATE RENTAL HOUSING DEMAND ANALYSIS
Early on in the downtown revitalization process rental housing will play a key role by housing some of the pioneers of the downtown residential renaissance. The market for non-subsidized, market rate rental housing will probably follow the lead of affordable housing into the downtown area due to rent and production cost limitations, but should play a key role in attracting more moderate and upper income households as the market gains momentum. This section will contain an analysis of the potential residential demand in the downtown area for market rate rental units. Currently there are no high quality rental units in the downtown market area that would be marketable to upper income tenants. Starting with HISTA demographic data the following analysis concludes that between 2007 and 2012 there could be an annual potential household demand for market rate rental units in the Downtown Market Area of Hannibal from approximately 30 households. Following is the analysis:
Market Rate Family Rental Potential Demand Analysis
PMA Qualified Household Demand (2007) 1BR 2BR 3BR
1 Gross Rent (includes utility costs paid by tenants) $ 525 $ 575 $ 675
2 Percentage of Income to Housing 25% 25% 25%
3 Minimum Income (Affordability) $ 25,200 $ 27,600 $ 32,400
Appropriate Sized (1-5 Person HH) , Income Qualified,
4 Renter HH, Age 18-61 (2007) 239 211 189
5 Percentage of Annual Turnover of Existing HH 25% 25% 25%
Number of Renter HH Turnover 60 53 47
6 Number of Non-Head of Household Potential Tenants 18 16 14
7 PMA Qualified Household Demand (2007) 78 69 61
8 SMA Qualified Household Demand (2007) 16 14 12
9 PMA and SMA Market Rate Rental Potential Household Demand (2007) 93 82 74
PMA Qualified Households (2012) 1BR 2BR 3BR
10 Gross Rent (includes utility costs paid by tenants) $ 580 $ 635 $ 745
11 Percentage of Income to Housing 25% 25% 25%
12 Minimum Income (Affordability) $ 27,821 $ 30,470 $ 35,770

Downtown Revitalization and Economic Assistance for Missouri Residential Demand Analysis
3/24/08 82112-05 - 109 -
Hannibal, Missouri
Appropriate Sized (1-5 Person HH) , Income Qualified,
13 Renter HH, Age 18-61 (2012) 203 187 196
14 Percentage of Annual Turnover of Existing HH 25% 25% 25%
15 Number of Renter HH Turnover 51 47 49
16 Number of Non-Head of Household Potential Tenants 15 14 15
17 PMA Qualified Household Demand (2012) 66 61 64
18 SMA Qualified Household Demand (2012) 13 12 13
19 PMA and SMA Market Rate Rental Potential Household Demand (2012) 79 73 76
20 PMA and SMA Qualified Household Growth/Decline (2007-2012) -14 -9 3
21 PMA and SMA Average Annual Potential Demand (2007-2012) 90 80 74
22 DMA Capture Rates 15% 15% 5%
1BR 2BR 3BR
23 DMA Annual Market Rate Family Rental Potential Demand (2007-2012) 14 12 4
Line 7 is a current estimate (2007) of the total number of existing households that form the potential market rate rental housing demand from the primary market area. The estimate was determined by considering the gross market rents (including utility costs), the level of income to housing costs, estimated annual turnover rate of renter households, estimated interest from non-head of household seniors, and the HISTA data. Line 8 is a current estimate of the total number of households that form the potential market rate rental housing demand from the secondary market area. The estimate was made by considering that 15% to 20% of the demand for most rental housing developments typically comes from the secondary market area. Line 9 is an estimate of the potential market rate rental housing demand from households from the primary and secondary market areas in 2007. Line 17 is a projection (2012) of the total number of households that form the potential market rate rental housing demand from the primary market area. The projection was determined by considering the gross market rents (including utility costs), the level of income to housing costs, estimated annual turnover rate of renter households, estimated interest from non-head of household individuals, and the HISTA data.

Downtown Revitalization and Economic Assistance for Missouri Residential Demand Analysis
3/24/08 82112-05 - 110 -
Hannibal, Missouri
Line 18 is a projection of the total number of households that form the potential market rate rental housing demand from the secondary market area. The projection was made by considering that 15% to 20% of the demand for most rental housing developments typically comes from the secondary market area. Line 19 is a projection of the potential market rate rental housing demand from households from the primary and secondary market areas in 2012. Line 20 is a projection of qualified household growth/decline between 2007 and 2012 and is calculated by subtracting the 2007 household demand estimate from the 2012 projection. Line 21 is the average annual potential demand that is calculated by considering the current demand in 2007 and the annual growth or decline between 2007 and 2012. Line 22 is the estimated capture rates for the downtown market area. It is an estimate of the percentages of qualified households in the primary and secondary market areas that would consider market rate rental units in the downtown market area by bedroom size. It takes into consideration the fact that there presently are no high quality market rate rental units in the Hannibal market for upper moderate income tenant households. It is the opinion of the analyst that a newly produced rental housing development in the downtown market area should garner the attention of a large number of potential qualified households and individuals in the primary and secondary markets. Line 23 is an annual projection of the number of qualified households that are expected to be in the primary and secondary market areas between 2007 and 2012 that could be attracted to market rate rental units in the downtown market area. This is an estimate of the total number of households on an annual basis that could provide the potential market demand for a market rate family rental development in the downtown market area. This is a point in time estimate and could change based on changes in supply and demand between this point in time and 2012.
Hannibal, Missouri Annual Downtown Market Demand 2007-2012
Market Rate Family Rental Housing
Bedroom Size Potential Household Demand
One Bedroom 14
Two Bedrooms 12
Three Bedrooms 4
Total 30

Downtown Revitalization and Economic Assistance for Missouri Residential Demand Analysis
3/24/08 82112-05 - 111 -
Hannibal, Missouri
Hannibal currently has a significant number of market rate rental properties available in the downtown area. Most are either single family homes or duplexes and most appear to be in fair condition and in need of updating. Any new or newly rehabilitated rental units of good quality, that are physically unique to the market, such as a loft style or town house, especially units with superior locational, site, and unit amenities will most likely serve a higher income tenant market, which would help to economically integrate the area and complement the downtown revitalization efforts.
HOME OWNERSHIP HOUSING DEMAND ANALYSIS
The downtown area of Hannibal has a lot of underutilized and vacant building space that could be improved to create new residential opportunities. Much of this space is on the upper floors of some of the existing commercial buildings, which can be converted to apartments and lofts for rental or ownership. In addition to the existing buildings there are some tracts of land in the downtown area that could be improved with new rental or ownership housing opportunities. The purpose of this analysis is to estimate the potential homeownership demand in the downtown area of Hannibal over the next few years.
Generally the demand for homeownership in reviving downtown areas follows the period of time in which young urban pioneers have reestablished the downtown area as a place to live by creating a rental market. Once the area proves itself to be a desirable and safe place to live it should attract less transient households with sufficient credit, net worth, and desire to locate permanently to the area. The typical households that comprise the initial homebuyers in reviving downtowns are generally young professionals and Empty Nesters.
The purpose of this analysis is to estimate the number of potential homebuyers for units in the Downtown Market Area of Hannibal between the present and 2012. While there may be interest in homeownership from households with a wide range of income this analysis considers the most typical potential homebuyers in the downtown Hannibal market. The most typical potential homebuyers would probably be small households of one to three persons, under 62 years of age, with incomes from $30,000 to $75,000, for ownership units that could be priced from $90,000 to $225,000.
Using a combination of Census Data and HISTA demographic data the following analysis concludes that between 2007 and 2012 there could be an annual potential demand for new ownership units in the Downtown Market Area of Hannibal from approximately 10 households. Following is the analysis and an explanation of the process used in the analysis: Home Ownership Potential Demand Analysis
1 Owner Occupied Units (2007) 4,599
2 Estimated Annual Owner Unit Turnover Rate 4%
3 Existing Homeowner Turnover 184
4 First Time Homebuyers (40% of market) 123

Downtown Revitalization and Economic Assistance for Missouri Residential Demand Analysis
3/24/08 82112-05 - 112 -
Hannibal, Missouri
5 Total Estimated Homebuyers 307
6 Estimated Age, Size, and Income Target HH for Downtown (2007) 86
7 Owner Occupied Units (2012) 4,575
8 Estimated Annual Owner Unit Turnover Rate 4%
9 Existing Homeowner Turnover 183
10 First Time Homebuyers (40% of market) 122
11 Total Estimated Homebuyers 305
12 Estimated Age, Size, and Income Target HH for Downtown (2012) 85
13 PMA Target HH Growth/Decline (2007-2012) (1)
14 PMA Target HH Annual Potential Demand (2007-2012) 86
15 DMA Capture Rate 12%
16 DMA Annual Homebuyer Potential Demand (2007-2012) 10
Line 6 is an estimate of the total number of target households in the primary market area in 2007 that was determined by considering the total number of occupied units, the estimated annual turnover rate of existing homeowners, the estimated number of first time homebuyers, and the profile of target households in the downtown area of Hannibal. The target profile are small households (1-3 persons), aged 18-61, with incomes from $30,000 to $75,000. Line 12 is a projection of the total number of target households in the primary market area in 2012 that was determined by considering the total number of occupied units, the estimated annual turnover rate of existing homeowners, the estimated number of first time homebuyers, and the profile of target households in the downtown area of Hannibal. The target profile are small households (1-3 persons), aged 18-61, with incomes from $30,000 to $75,000. Line 13 is the projected target household growth/decline in the primary market area from 2007 to 2012 that was determined by subtracting the total target households in 2007 from the target households in 2012. Line 14 is the average annual target household potential demand (2007-2012) in the Hannibal market area.

Downtown Revitalization and Economic Assistance for Missouri Residential Demand Analysis
3/24/08 82112-05 - 113 -
Hannibal, Missouri
Line 15 is the estimated capture rate for the downtown market area. It is an estimate of the percentage of target households in the primary market area that would consider homeowner options in the downtown market area. The rate selected is considered to be a conservative estimate because the homeownership market in downtown at this time is unproven and other homeownership options exist in the primary market area. As the homeownership market in downtown Hannibal takes form, it is very likely that the capture rate for the area should increase. Line 16 is an annual projection of the number of target households that are expected to be in the primary market area between 2007 and 2012 that could be attracted to homeownership options in the downtown market area. This is a point in time estimate and could change based on changes in supply and demand between this point in time and 2012.
Hannibal, Missouri Annual Downtown Market Demand 2007-2012
Home Ownership
10 Households
There does not appear to be many attached homes for sale in the market. Lofts and attached style homes would seem to fit well in the downtown area because they are very limited in the community and are attractive to young, small, or older and small resident households who are looking for a unique housing experience without the burden of exterior home maintenance. Initially price levels will tend to be conservative and targeted to moderate income households. As the market matures there should be increased interest for higher quality ownership units from higher income homebuyers. The demand early on for home ownership in the downtown area may be slow, but should grow as the revitalization of the area continues and more households and businesses come back.
HOUSING PRODUCTION CONSIDERATIONS AND FINANCING
Financing housing production in the downtown area initially may require a plan that draws on many different sources. Because the market is unproven, initially it will be easier to finance affordable rental housing than market rate housing due to rent and cost constraints. Once the market is established as a viable housing environment it should be possible to produce rental housing at higher rent levels and eventually residential units for sale. In addition to the many programs designed for affordable housing production there are ways that the city can assist developers to get development started in the downtown area. Following is a list of housing production ideas and sources of financing that could be considered: • City owned land in the downtown market area that can be used for residential development
can be made available below market value. • City can use its powers of eminent domain to condemn property in the downtown area to
make it available for residential development.

Downtown Revitalization and Economic Assistance for Missouri Residential Demand Analysis
3/24/08 82112-05 - 114 -
Hannibal, Missouri
• City can assist developers with land assemblage by helping them to work with multiple land owners.
• City can reduce the cost of residential development in downtown by providing parking. • City can consider special districts for sales and income tax abatement. • City can consider reducing or waiving fees for construction related items, such as permits,
plan review, inspections, infrastructure hook up, etc. • City can consider increasing the flexibility of building and zoning codes. • City can help to fast track the permit approval process. • City can consider working with private developers in public/private partnerships initially as a
catalyst for change. Examples of this could be the city leasing a portion of a mixed use development or the city developing a portion of a mixed use development for its own use.
• City can help to absorb some of the site costs, such as demolition and if necessary
remediation. • Real estate tax abatement • Tax Increment Financing • Federal and State Affordable Housing Tax Credit • Federal and State Historic Tax Credit • New Markets Tax Credit • Federal and State Subordinated loans and grants • State First Time Homebuyer Loan Program • State Down Payment Assistance Program • Federal Home Loan Bank Board Housing Programs • State Home Improvement Grant Program

Downtown Revitalization and Economic Assistance for Missouri Residential Demand Analysis
3/24/08 82112-05 - 115 -
Hannibal, Missouri
SECTION X
ASSUMPTIONS AND LIMITING CONDITIONS 1. The area description supplied to the appraiser is assumed to be correct; 2. No survey of the area has been made or reviewed by the appraiser, and no responsibility is
assumed in connection with such matters. Illustrative material, including maps and plot plans, utilized in this report are included only to assist the reader in visualizing the property. Area dimensions and sizes are considered to be approximate;
3. No responsibility is assumed for matters of a legal nature affecting title to properties in the
area, nor is any opinion of title rendered. Property titles are assumed to be good and merchantable unless otherwise stated;
4. Information furnished by others is believed to be true, correct, and reliable. However, no
responsibility for its accuracy is assumed by the appraiser; 5. All mortgages, liens, encumbrances, leases, and servitudes have been disregarded unless
so specified within the report. The property in the area is assumed to be under responsible, financially sound ownership and competent management;
6. It is assumed that there are no hidden or unapparent conditions to the subsoil or structures
which would render the properties more or less valuable. No responsibility is assumed for such conditions or for arranging for engineering studies which may be required to discover them;
7. Unless otherwise stated in this report, the existence of hazardous material, which may or
may not be present in the area, was not observed by the appraiser. However, the appraiser is not qualified to detect such substances. The presence of
substances such as asbestos, urea-formaldehyde foam insulation or other potentially hazardous materials may affect the value of the property. The conclusions in this report are predicated on the assumption that there are no such materials on or in the area that would cause a loss of value. No responsibility is assumed for any such conditions, or for the expertise required to discover them. The client is urged to retain an expert in this field if desired. The analysis and demand conclusions in this report are null and void should any hazardous material be discovered;
8. Unless otherwise stated in this report, no environmental impact studies were either
requested or made in conjunction with this report. The appraiser reserves the right to alter, amend, revise, or rescind any opinions of demand based upon any subsequent environmental impact studies, research, or investigation;
9. It is assumed that there is full compliance with all applicable federal, state. And local
environmental regulations and laws unless noncompliance is specified, defined, and considered in this report;
Downtown Revitalization and Economic Assistance for Missouri Residential Demand Analysis
3/24/08 82112-05 - 116 -
Hannibal, Missouri
10. It is assumed that all applicable zoning and use regulations and restrictions have been complied with, unless non-conformity has been specified, defined and considered in this report;
11. It is assumed that all required licenses, certificates of occupancy, consents, or other
legislative or administrative authority from any local, state, or federal governmental or private entity or organization have been or can be obtained or renewed for any use on which the demand estimate is based;
12. The appraiser will not be required to give testimony or appear in court because of having
made this report, unless arrangements have previously been made; 13. Possession of this report, or a copy thereof, does not carry with it the right of publication. It
may not be used for any purpose by any person other than the intended users without the written consent of the appraiser, and in any event, only with properly written qualification and only in its entirety;
14. The liability of the appraiser is limited to the intended users only. There is no accountability,
obligation, or liability to any third party. If this report is placed in the hands of anyone other than the intended users, they shall make such party aware of all limiting conditions and assumptions of the assignment and related discussions;
15. Acceptance and/or use of this report constitutes acceptance of the foregoing assumptions
and limiting conditions.
Downtown Revitalization and Economic Assistance for Missouri Residential Demand Analysis
3/24/08 82112-05 - 117 -
Hannibal, Missouri
SECTION XI
APPRAISER’S CERTIFICATION I certify that, to the best of my knowledge and belief: • The statements of fact contained in this report are true and correct. • The reported analyses, opinions, and conclusions are limited only by the reported
assumptions and limiting conditions, and is my personal, impartial, and unbiased professional analyses, opinions, conclusions, and recommendations.
• I have no (or the specified) present or prospective interest in the market that is the subject of
this report, and I have no (or the specified) personal interest with respect to the parties involved.
• I have no bias with respect to any property that is the within the market of this report or to the
parties involved with this assignment. • My engagement in this assignment was not contingent upon developing or reporting
predetermined results. • My compensation for completing this assignment is not contingent upon the development or
reporting of a predetermined value or direction in value that favors the cause of the client, the amount of the value opinion, the attainment of a stipulated result, or the occurrence of a subsequent event directly related to the intended use of this appraisal consulting assignment.
• My analyses, opinions, and conclusions were developed, and this report has been prepared,
in conformity with the Uniform Standards of Professional Appraisal Practice. • I have made a personal inspection of the market that is the subject of this report. • Robert Odell provided significant real property appraisal or appraisal consulting assistance to
the person signing this certification. By: Steve Sillimon-Certified General Real Estate Appraiser # RA003250
Missouri Housing Development Commission March 24, 2008