C de Oliveira, T; Rodrigues, PT; Menezes, MJ; …researchonline.lshtm.ac.uk/4258931/1/Genome-wide...
25
C de Oliveira, T; Rodrigues, PT; Menezes, MJ; Gonalves-Lopes, RM; Bastos, MS; Lima, NF; Barbosa, S; Gerber, AL; Loss de Morais, G; Bern, L; Phelan, J; Robello, C; de Vasconcelos, ATR; Alves, JMP; Ferreira, MU (2017) Genome-wide diversity and differentiation in New World populations of the human malaria parasite Plasmodium vivax. PLoS neglected tropical diseases, 11 (7). e0005824. ISSN 1935-2727 DOI: https://doi.org/10.1371/journal.pntd.0005824 Downloaded from: http://researchonline.lshtm.ac.uk/4258931/ DOI: 10.1371/journal.pntd.0005824 Usage Guidelines Please refer to usage guidelines at http://researchonline.lshtm.ac.uk/policies.html or alterna- tively contact [email protected]. Available under license: http://creativecommons.org/licenses/by/2.5/
Transcript of C de Oliveira, T; Rodrigues, PT; Menezes, MJ; …researchonline.lshtm.ac.uk/4258931/1/Genome-wide...

C de Oliveira, T; Rodrigues, PT; Menezes, MJ; Gonalves-Lopes, RM;Bastos, MS; Lima, NF; Barbosa, S; Gerber, AL; Loss de Morais, G;Bern, L; Phelan, J; Robello, C; de Vasconcelos, ATR; Alves, JMP;Ferreira, MU (2017) Genome-wide diversity and differentiation inNew World populations of the human malaria parasite Plasmodiumvivax. PLoS neglected tropical diseases, 11 (7). e0005824. ISSN1935-2727 DOI: https://doi.org/10.1371/journal.pntd.0005824
Downloaded from: http://researchonline.lshtm.ac.uk/4258931/
DOI: 10.1371/journal.pntd.0005824
Usage Guidelines
Please refer to usage guidelines at http://researchonline.lshtm.ac.uk/policies.html or alterna-tively contact [email protected].
Available under license: http://creativecommons.org/licenses/by/2.5/

RESEARCH ARTICLE
Genome-wide diversity and differentiation in
New World populations of the human malaria
parasite Plasmodium vivax
Thais C. de Oliveira1, Priscila T. Rodrigues1, Maria Jose Menezes1, Raquel M. Goncalves-
Lopes1, Melissa S. Bastos1, Nathalia F. Lima1, Susana Barbosa1, Alexandra L. Gerber2,
Guilherme Loss de Morais2, Luisa Berna3, Jody Phelan4, Carlos Robello3, Ana Tereza
R. de Vasconcelos2, João Marcelo P. Alves1☯, Marcelo U. Ferreira1☯*
1 Department of Parasitology, Institute of Biomedical Sciences, University of São Paulo, São Paulo, Brazil,
2 Unit of Computational Genomics Darcy Fontoura de Almeida, Laboratory of Bioinformatics, National
Laboratory of Scientific Computation, Petropolis, Brazil, 3 Unit of Molecular Biology, Pasteur Institute of
Montevideo, Montevideo, Uruguay, 4 London School of Hygiene and Tropical Medicine, London, United
Kingdom
☯ These authors contributed equally to this work.
Abstract
Background
The Americas were the last continent colonized by humans carrying malaria parasites. Plas-
modium falciparum from the New World shows very little genetic diversity and greater link-
age disequilibrium, compared with its African counterparts, and is clearly subdivided into
local, highly divergent populations. However, limited available data have revealed extensive
genetic diversity in American populations of another major human malaria parasite, P.
vivax.
Methods
We used an improved sample preparation strategy and next-generation sequencing to char-
acterize 9 high-quality P. vivax genome sequences from northwestern Brazil. These new
data were compared with publicly available sequences from recently sampled clinical P.
vivax isolates from Brazil (BRA, total n = 11 sequences), Peru (PER, n = 23), Colombia
(COL, n = 31), and Mexico (MEX, n = 19).
Principal findings/Conclusions
We found that New World populations of P. vivax are as diverse (nucleotide diversity πbetween 5.2 × 10⁻⁴ and 6.2 × 10⁻⁴) as P. vivax populations from Southeast Asia, where
malaria transmission is substantially more intense. They display several non-synonymous
nucleotide substitutions (some of them previously undescribed) in genes known or sus-
pected to be involved in antimalarial drug resistance, such as dhfr, dhps, mdr1, mrp1, and
mrp-2, but not in the chloroquine resistance transporter ortholog (crt-o) gene. Moreover, P.
vivax in the Americas is much less geographically substructured than local P. falciparum
PLOS Neglected Tropical Diseases | https://doi.org/10.1371/journal.pntd.0005824 July 31, 2017 1 / 24
a1111111111
a1111111111
a1111111111
a1111111111
a1111111111
OPENACCESS
Citation: de Oliveira TC, Rodrigues PT, Menezes
MJ, Goncalves-Lopes RM, Bastos MS, Lima NF, et
al. (2017) Genome-wide diversity and
differentiation in New World populations of the
human malaria parasite Plasmodium vivax. PLoS
Negl Trop Dis 11(7): e0005824. https://doi.org/
10.1371/journal.pntd.0005824
Editor: Photini Sinnis, Johns Hopkins Bloomberg
School of Public Health, UNITED STATES
Received: June 2, 2017
Accepted: July 20, 2017
Published: July 31, 2017
Copyright: © 2017 C. de Oliveira et al. This is an
open access article distributed under the terms of
the Creative Commons Attribution License, which
permits unrestricted use, distribution, and
reproduction in any medium, provided the original
author and source are credited.
Data Availability Statement: Isolate codes and
SRA accession numbers of samples used in this
analysis are given in S1 Table. All sequence data
have been deposited in the SRA database.
Funding: Research was supported by research
grants from the Conselho Nacional de
Desenvolvimento Cientıfico e Tecnologico (CNPq;
http://cnpq.br/), Brazil (590106/2011-2 to MUF),
the Fundacão de Amparo à Pesquisa do Estado de
São Paulo (FAPESP; http://www.fapesp.br/), Brazil

populations, with relatively little between-population genome-wide differentiation (pairwise
FST values ranging between 0.025 and 0.092). Finally, P. vivax populations show a rapid
decline in linkage disequilibrium with increasing distance between pairs of polymorphic
sites, consistent with very frequent outcrossing. We hypothesize that the high diversity of
present-day P. vivax lineages in the Americas originated from successive migratory waves
and subsequent admixture between parasite lineages from geographically diverse sites.
Further genome-wide analyses are required to test the demographic scenario suggested by
our data.
Author summary
Plasmodium vivax is the most common human malaria parasite in the Americas, but how
and when this species arrived in the New World remains unclear. Here we describe high-
quality whole-genome sequence data for nine P. vivax isolates from Brazil, a country that
accounts for 37% of the malaria burden in this continent, and compare these data with
additional publicly available P. vivax genomes from Brazil, Peru, Colombia, and Mexico.
P. vivax populations from the New World were found to be as diverse as their counter-
parts from areas with substantially higher malaria transmission, such as Southeast Asia,
and to carry several non-synonymous substitutions in candidate drug-resistance genes.
Moreover, genome-wide patterns of linkage disequilibrium between pairs of polymorphic
sites are consistent with very frequent outcrossing in these populations. Interestingly,
local P. vivax is more polymorphic, with less between-population differentiation, than
sympatric populations of P. falciparum, possibly as a result of different demographic histo-
ries of these two species in the Americas. We hypothesize that local P. vivax lineages origi-
nated from successive migratory waves and subsequent admixture between parasites from
geographically diverse sites.
Introduction
Plasmodium vivax is the human malaria parasite with the widest global distribution and
accounts for nearly half of the combined malaria burden in South and Southeast Asia, Oceania,
and Central and South America. Over one-third of the world’s population is currently at risk
of infection with this species, with 16 million clinical cases recorded each year [1]. Although P.
vivax has most likely evolved from parasites that infect chimpanzees and gorillas in sub-Saha-
ran Africa [2,3], it is nowadays rare in most of this continent, where human populations lack a
key erythrocyte receptor for host cell invasion by blood-stage parasites, the Duffy antigen/
receptor for chemokines (DARC) [4]. Where both species coexist, P. vivax typically causes less
severe cases and fewer deaths than P. falciparum, the most virulent human malaria parasite,
but represents a major challenge for ongoing malaria elimination efforts worldwide [1].
The Americas were the last continent colonized by humans carrying malaria parasites, but
the dates and routes of migration of P. vivax to the New World are still debated [5–7]. Archae-
ological evidence for infection with this parasite in indigenous, pre-Columbian populations is
currently limited to a single report of P. vivax antigens being visualized by immunohistochem-
istry in the liver and spleen of South American mummies dating from 3,000 to 600 years ago
[8]. Interestingly, specific antibodies failed to detect P. falciparum antigens in these same sam-
ples [8]. These findings are consistent with the hypothesis that P. vivax, but not P. falciparum,
Plasmodium vivax genomes from the New World
PLOS Neglected Tropical Diseases | https://doi.org/10.1371/journal.pntd.0005824 July 31, 2017 2 / 24
(2010/51835-7 to MUF), and the National Institute
of Allergy and Infectious Diseases (NIAID), National
Institutes of Health (NIH; https://www.niaid.nih.
gov/), USA (International Centers of Excellence in
Malaria Research [ICEMR] program, U19
AI089681 to Joseph M. Vinetz, University of
California, San Diego); PTR was supported by a
scholarship from CNPq, which also provided a
senior researcher scholarship to MUF. RMG-L
(2010/51938-0), NFL (2013/26928-0), and SB
(2013/23770-6) were supported by scholarships
from FAPESP and TCO was supported by a
scholarship from the Coordenacão de
Aperfeicoamento de Pessoal de Nıvel Superior
(CAPES; http://www.capes.gov.br/), Brazil. The
funders had no role in study design, data collection
and analysis, decision to publish, or preparation of
the manuscript.
Competing interests: The authors have declared
that no competing interests exist.

was brought to the New World by early human migrations from East Asia or the Western
Pacific [5], but more specific molecular techniques are required to confirm them [9]. Never-
theless, present-day New World populations of P. vivax appear to be more closely related to
extant African and South Asian parasites and now extinct European lineages than to East
Asian and Melanesian strains [10–12], consistent with much more recent parasite migrations
with European conquerors and African slaves during the colonial era [7,13].
Clinical isolates from Brazil are underrepresented in global genomic analyses of P. vivax[11,14]. However, this country contributes 37% of the malaria burden in the Americas, a
region with over 20 million people at high risk of infection [1]. Obtaining large amounts of
host-free P. vivaxDNA from clinical samples from Brazil has been a major challenge for
genome sequencing projects, because (a) blood-stage parasite densities are typically very low
[15], (b) clinical blood samples are heavily contaminated with human DNA from leukocytes,
and (c) methods for long-term in vitro propagation of P. vivax are neither practical nor widely
reproducible [16–18]. Here, we combined an improved sample preparation strategy, for reduc-
ing human DNA contamination and increasing target parasite’s DNA yield, with next-genera-
tion genome re-sequencing to examine a local population of P. vivax from the Amazon Basin
of Brazil. Our nine high-quality genome sequences were compared to those previously
obtained from four countries (Brazil [BRA], Peru [PER], Colombia [COL], and Mexico
[MEX]) [11,14] to reveal local and regional patterns of diversity and differentiation in extant
P. vivax populations from the New World.
Methods
Ethics statement
Study protocols were approved by the Institutional Review Board of the Institute of Biomedical
Sciences, University of São Paulo, Brazil (936/CEP, 2010 and 1183/CEPSH, 2014). Written
informed consent was obtained from all patients.
Sample collection
Parasite samples were collected between November 2012 and June 2013 in eastern Acre and
southern Amazonas, Amazon Basin of Brazil, close to the borders with Peru and Bolivia.
Malaria epidemiology in the study sites has been characterized in detail elsewhere [15,19].
Venous blood samples (10 ml) were collected from eight adult patients attending malaria clin-
ics in the town of Acrelandia, Acre (9˚43’ S, 66˚53’ W), and one adult patient living in the
farming settlement of Remansinho, Amazonas (9˚40’ S-9˚43’ S, 66˚52’ W -66˚59’ W), 120 km
east of Acrelandia (Fig 1). P. vivax infection was diagnosed by on-site microscopy and later
confirmed by qPCR as described below.
Leukocyte depletion and sample cryopreservation
We adapted BioR 01 Plus leukocyte-depletion filters (Fresenius Kabi, Bad Homburg, Ger-
many; S1A Fig) to process 10 to 50-ml volumes of venous blood in our field laboratory in the
Amazon [20]. The per-unit cost of these filters in Brazil is around US$ 25. We first cut off
under sterile conditions, with a scissor, the tubing that connects the filtering device to the
400-ml blood storage bag and to the adapter (S1B and S1C Fig). S1D Fig shows how the filter-
ing device was used in a laminar flow hood; briefly, a 10-ml syringe was used to apply blood
treated with acid citrate dextrose anticoagulant, while a second 10-ml syringe was adapted to
the end of the remaining tubing to recover the filtered, leucocyte-depleted material, which was
transferred to 50-ml sterile centrifuge tubes. No priming with saline was required. After the
Plasmodium vivax genomes from the New World
PLOS Neglected Tropical Diseases | https://doi.org/10.1371/journal.pntd.0005824 July 31, 2017 3 / 24

filtration process, the leukocyte depletion device was washed through with at least twice the
volume of RPMI medium as the original blood sample to recover red blood cells (RBCs) that
had been retained in the filter and tubing. Next, the mixture of filtered blood and RPMI
medium recovered in 50-ml tubes was centrifuged at 800 g for 5 minutes and the supernatant
(plasma plus RPMI medium) was removed with a sterile Pasteur pipette.
For cryopreservation, the RBC pellet was resuspended dropwise in Glycerolyte-57 solution
(Fenwall, Fresenius Kabi), at the proportion of 1.66 ml of Glycerolyte for each 1 ml of cell
pellet, under gentle agitation. One ml aliquots of the RBC-Glycerolyte mixture were trans-
ferred to screw-capped cryovials and placed in a Nalgene Mr. Frosty freezing container
Fig 1. Map showing the sampling locations of the New World P. vivax isolates analyzed in this study, comprising Brazil, Peru,
Colombia, and Mexico. The insert shows the study sites in northwestern Brazil (Acrelandia and Remansinho, 120 km apart), close to the
border with Bolivia and Peru. Adapted from [15] and https://commons.wikimedia.org/wiki/Atlas_of_the_world#/media/File:BlankMap-
World6.svg.
https://doi.org/10.1371/journal.pntd.0005824.g001
Plasmodium vivax genomes from the New World
PLOS Neglected Tropical Diseases | https://doi.org/10.1371/journal.pntd.0005824 July 31, 2017 4 / 24

(ThermoFisher Scientific, Waltham, MA) that was kept at -80˚C for 24 hours. The next day,
cryovials were plunged in liquid nitrogen for long-term storage. Samples were shipped to São
Paulo in liquid nitrogen, for subsequent schizont maturation.
Short-term in vitro culture for P. vivax schizont maturation and
chloroquine resistance testing
For sample thawing, cryovials were removed from the liquid nitrogen and maintained for 1
min at room temperature (20–25˚C) and 1 min at 37˚C. The 1-ml samples were then trans-
ferred to 50-ml centrifuge tubes, gently mixed with 200 μl of 12% NaCl solution, and let stand
for 1 minute. Next, 10 ml of 1.6% NaCl were gently added, the mixture was gently agitated,
and centrifuged at 180 g for 8 min [21]. After removing the supernatant, the RBC pellet was
washed twice in incomplete McCoy’s 5A medium supplemented with glucose (0.5% w/v),
HEPES (25 mM), and hypoxantine (0.005% w/v), and resuspended in complete McCoy
medium (as above but supplemented with 25% AB+ heat-inactivated human serum) to a final
hematocrit of 2%. Short-term culture in vitro was carried in flat-bottomed dishes placed in a
gas chamber with controlled O2 and CO2 levels that was kept at 37˚C for up to 48 hours. Para-
site growth and maturation were monitored as described [17].
Chloroquine resistance (CQR) was evaluated using an ex-vivo schizont maturation assay in
selected P. vivax samples with> 1,000 parasites/μl of blood and> 50% ring stages at the time
of thawing [22]. There is no consensus regarding the 50% inhibitory concentration (IC50)
indicative of CQR in P. vivax; suggested cut off values range between 100 nM [23] and 220 nM
[24], but all IC50 values in our samples were < 50 nM (Table 1).
DNA isolation and quantification of human and P. vivax DNA with real-
time PCR
DNA templates were isolated from 200-μl aliquots of either whole venous blood (before leuko-
cyte removal) or RBC pellet (after leukocyte removal) using QIAamp DNA blood kits (Qiagen,
Table 1. Field-collected Plasmodium vivax isolates from Brazil with nuclear genomes newly sequenced in this study and summary of sequencing
statistics.
Isolate Sitea Date of
collection
IC50 for
CQb(mM)
No. reads (×106)
Percent reads
mapped to Sal-IcAverage sequence
depth
Percent Sal-I
genome covered
No.
SNPsd
17 Acrelandia Jun/13 11.3 17.85 95% 49.79× 84% 6445
18 Acrelandia Dec/12 - -e 23.40 93% 59.35× 85% 6232
19 Acrelandia Nov/12 11.1 23.87 95% 71.93× 86% 5524
20 Acrelandia Apr/13 14.5 18.80 93% 58.91× 89% 6188
32 Acrelandia Jun/13 20.5 22.51 92% 69.09× 93% 5528
51 Acrelandia Jun/13 - - 20.93 94% 58.24× 83% 5819
52 Acrelandia Jun/13 - - 21.43 94% 62.90× 89% 6158
207 Remansinho Apr/13 46.7 21.08 95% 70.13× 89% 6041
ACR Acrelandia Nov/12 20.9 21.04 93% 78.65× 92% 5414
Average 21.21 94% 64.33× 88% 5927.7
aSample collection sites are shown in Fig 1.b50% inhibitory concentration for chloroquine (CQ) determined by ex-vivo schizont maturation test.cSal I = reference assembled genome, P. vivax monkey-adapted strain Sal 1 [61]dNumber of remaining high-quality single-nucleotide polymorphisms (SNPs) after applying the quality filters described in the main text.e--not determined.
https://doi.org/10.1371/journal.pntd.0005824.t001
Plasmodium vivax genomes from the New World
PLOS Neglected Tropical Diseases | https://doi.org/10.1371/journal.pntd.0005824 July 31, 2017 5 / 24

Hilden, Germany). To estimate the relative proportion of human and parasite DNA, we used
SYBR Green qPCR targeting single-copy genes coding for human topoisomerase III and P.
vivax aldolase. Each 15 μl qPCR mixture contained 2 μl of template DNA, 7.5 μl of 2× Maxima
SYBR Green qPCR master mixture (Fermentas, Burlington, Canada) and 0.3 μM of each of the
primer pairs, Pvaldo-F (GAC AGT GCC ACC ATC CTT ACC) plus Pvaldo-R (CCT TCT
CAA CAT TCT CCT TCT TTC C) and Top3-F (CAT GTT TGA GCT GAG CCT GA) plus
Top3-R (CCA CAC CAC ACC CCT AAC TT). Standard curves were prepared with serial ten-
fold dilutions of a plasmid containing both target sequences to allow for copy number quanti-
tation (number of amplicons/μl of blood). We used a Step One Plus Real-Time PCR System
(Applied Biosystems, Foster City, CA) for PCR amplification with a template denaturation
step at 95˚C for 10 min, followed by 40 cycles of 15 sec at 95˚C and 1 minute at 60˚C, with
fluorescence acquisition at the end of each extension step. Amplification was followed by a
melting program consisting of 15 sec at 95˚C, 15 sec at 60˚C, and a stepwise temperature
increase of 0.2˚C/sec until 95˚C, with fluorescence acquisition at each temperature transition.
All reactions were made in triplicate. We measured parasite DNA enrichment as the parasite:
human copy-number ratio after filtering divided by parasite:human copy-number ratio before
filtering. To estimate the proportion of host and parasite DNA in each sample, we considered
the amplicon copy numbers and the genome size of humans (3.2 Gb) and P. vivax (26.8 Mb;
Sal-I assembly); the DNA content in each copy of the human genome corresponds approxi-
mately to that of 119 copies of the P. vivax genome.
DNA library preparation and whole-genome sequencing
Parasite DNA templates were quantified by fluorometry using a Qubit 3.0 fluorometer (Invi-
trogen, Carlsbad, CA) and sequenced using Ion Torrent Personal Genome Machine (PGM)
and Ion Proton platforms (Life Technologies, Foster City, CA) at the Unit of Computational
Genomics, Laboratory of Bioinformatics, National Laboratory of Scientific Computation, Bra-
zil. Separate libraries were prepared for each sequencing platform, using 1 μg of template DNA
per isolate. DNA samples were sheared using the Bioruptor UCD-200 TS (Diagenode, Liege,
Belgium) sonication system until fragment sizes of 200 bp (for Ion PGM libraries) or 150 bp
(for Ion Proton libraries) were obtained. Libraries were prepared using the Ion Xpress Plus
Fragment Library kit, with Ion Xpress Barcode adapters according to the Ion Xpress Plus
gDNA Fragment Library Preparation protocol (Life Technologies). Size selection was per-
formed on E-Gel SizeSelect 2% agarose gels using the E-Gel iBase Power System (Thermo-
Fisher Scientific). Emulsion PCR was done on the Ion OneTouch 2 system (Life Technologies)
with the Ion PGM Template OT2 200 kit or the Ion PI Template OT2 200 kit version 2 for Ion
PGM and Ion Proton, respectively, following the manufacturer’s instructions (Life Technolo-
gies). Ion PGM libraries were loaded on Ion318 chips v2 and sequenced using the Ion PGM
Sequencing 200 kit v2; Ion Proton libraries were loaded on Ion PI chips v2 and sequenced
using the Ion PI Sequencing 200 kit v2 (Life Technologies). All samples were sequenced on
both platforms; sequence reads (150–200 bp) from two runs in each platform were merged
into a single fastq file per sample.
Additional genomic data sets
To place our genomic data in a regional context, we reanalyzed raw paired-end Illumina reads
from 107 additional P. vivax clinical isolates from the Americas. Fastq files were downloaded
from the Sequence Read Archive (SRA) of the National Center for Biotechnology Information,
United States, and processed in the same way as our newly obtained sequences. Three clinical
isolates from Brazil had sequence data generated on an Illumina Genome Analyzer II platform
Plasmodium vivax genomes from the New World
PLOS Neglected Tropical Diseases | https://doi.org/10.1371/journal.pntd.0005824 July 31, 2017 6 / 24

at the Welcome Trust Sanger Institute (Hinxton, Cambridge, UK), as part of the P. vivaxgenome variation project coordinated by the MalariaGEN network [14]. Other isolates—20
from Brazil, 34 from Peru, 31 from Colombia, and 19 from Mexico—had whole-genome
sequence data generated on an Illumina HiSeq 2000 platform at the Broad Institute of MIT
and Harvard (Cambridge, MA, USA), as part of the International Centers of Excellence for
Malaria Research (ICEMR) program [11]. All isolates from Brazil sequenced in these two pre-
vious studies were collected in endemic areas surrounding Acrelandia, Acre State, between
2008 and 2011.
Single-nucleotide polymorphism (SNP) calling
Fastq files were first filtered for quality; 8 SRA samples were excluded from further analysis
because of mean quality scores� 30 (expected base call accuracy� 99.9%). We next mapped
the high quality reads onto the PlasmoDB version 10.0 of the Sal-1 reference (http://plasmodb.
org/common/downloads/release-10.0/PvivaxSal1/fasta/data/PlasmoDB-10.0_PvivaxSal1_
Genome.fasta) [25], using Bowtie2 version 2.2.6 [26] with the “very sensitive” preset, allowing
one mismatch per seed region; 11 SRA samples were excluded at this stage because of< 60%
mapping over the reference. The resulting alignments were merged into BAM files with SAM-
tools [27], duplicate reads were identified and marked using the Picard version 2.0.1 MarkDu-
plicates tool, and files were indexed with SAMtools.
We used GATK version 2.0 [28] for SNP calling following the GATK Best Practices
(https://software.broadinstitute.org/gatk/best-practices/). GATK UnifiedGenotyper with the
BaseAlignmentQuality option was used to obtain high-confidence SNPs by applying stringent
VariantFiltration criteria: (a) coverage > 20×, (b) mapping quality > 30, (c) base quality > 30,
read depth and allelic fraction by sample� 1, and (d) haplotype score� 3. We removed all
SNPs with> 2 alleles and those with minor allele frequency < 0.01 (reads counted across all
sequenced samples).
SnpEff [29] was used to identify SNPs mapping to coding sequences (further classified as
synonymous or nonsynonymous), introns, and intergenic regions of the Sal-I reference
genome. The resulting catalogue of 94,122 high-confidence SNPs was used to genotype each
individual sample using GATK UnifiedGenotyper with default parameters except for the mini-
mum phred-scaled confidence threshold, with a calling variant = 50 and emitting variant = 10.
Heterozygote calls were converted to the majority allele if�75% of the reads in that sample
were the majority allele; otherwise, the allele was undetermined. Sites with < 5× coverage in a
given sample were filtered out at this stage.
The final data set of P. vivax nuclear genome sequences from the New World comprised
our 9 newly sequenced samples from BRA and 75 high-quality SRA samples (2 from BRA, 23
from PER, 31 from COL, and 19 from MEX); 13 SRA samples were removed during the geno-
typing process because the number of SNPs identified (range: 13 to 2,889) was below the pre-
defined minimum of 3,000 nucleotide differences compared to the Sal-I reference, consistent
with poor sequencing coverage. Overall, we excluded 21 (out of 23) SRA samples from BRA
and 11 (out of 34) SRA samples from PER at different stages of this analysis. Isolate codes and
SRA accession numbers of samples used in this analysis are given in S1 Table.
Within-population genetic diversity and recombination
The average pairwise nucleotide diversity (π, average number of nucleotide differences per site
between pairs of DNA sequences) was calculated within each geographic population using
VCFtools [30]. Values were plotted, using R version 3.3.0, as moving averages within 1-kb slid-
ing windows across each chromosome. We recalculated π after masking out subtelomeric
Plasmodium vivax genomes from the New World
PLOS Neglected Tropical Diseases | https://doi.org/10.1371/journal.pntd.0005824 July 31, 2017 7 / 24

regions and three hypervariable internal chromosome regions (containing sera, msp-3, and
msp-7 gene families) that were more prone to sequence misalignments and poor read mapping
in a previous analysis [14]. The coordinates of these regions are given in the Supplementary
Table 2 of Pearson et al. [14].
Similarly, Tajima’s D values [31] were calculated using VCFtools; mean Tajima’s D across
1-kb windows were plotted for each population. Frequency distributions of π and Tajima’s Dvalues within 1-kb windows were plotted for each population. We defined windows with the
top 50 π values within each population as highly variable genomic regions. We defined as outli-
ers the 1-kb windows with the 50 highest and 50 lowest mean Tajima’s D values within each
population. We also examined the minor allele frequency (MAF) spectrum separately in each
population.
We next estimated, for each population, the rate at which pairwise linkage disequilibrium
(LD) decreased with increasing physical distance between SNPs due to meiotic recombination.
The squared correlation coefficient r2 between pairs of SNPs of varying distance across the
same chromosome was measured using VCFtools; r2 values were binned by distance (50-bp
windows) and medians within each window were plotted against physical distance between
SNPs. The level of background LD between unlinked markers within each population was esti-
mated by calculating median r2 between all pairs of SNPs on different chromosomes.
Between-population genetic differentiation and population structure
The Wright’s fixation index FST, a measure of population differentiation due to genetic struc-
ture [32], was calculated with VCFtools for each SNP in every pairwise comparison of popula-
tions. Values were averaged across all SNPs to estimate overall pairwise differentiation
between populations. The 100 SNPs with the highest average FST values across all populations
were further characterized.
To assess population structure, we first used the PLINK software (https://www.cog-
genomics.org/plink2 [33]) to carry out principal component analysis (PCA); up to 10 compo-
nents were analyzed. For phylogenetic analysis, a neighbor-joining tree was constructed via
the maximum composite likelihood substitution model with 1,000 bootstrap pseudoreplicates
using MEGA 7.0 (http://www.megasoftware.net/). To estimate the ancestry shared between
individual isolates, we used the ADMIXTURE software package [34] with either all 94,122
high-quality SNPs or a curtailed set of 12,762 SNPs that are not linked. To this end, we
removed each SNP that had an r2 value > 0.1 with any other SNP within a 60-SNP sliding win-
dow advanced by 10 SNPs each time. The optimal number of clusters (K) was determined by
performing multiple runs of the software under different K values (2–10) and selecting the Kvalues (K = 2 and K = 3) associated with the lowest cross-validation error compared to other Kvalues (S2 Fig).
Data availability
The sequence data supporting the conclusions of this article are available in the Sequence Read
Archive of the National Center for Biotechnology Information, United States; accession num-
bers are provided in S1 Table.
Results and discussion
Sample preparation and genome sequencing
We designed a single-step procedure to reduce human DNA content in P. vivax-infected
blood using commercially available leukocyte-depletion filters (S1 Fig). Leucocyte depletion in
Plasmodium vivax genomes from the New World
PLOS Neglected Tropical Diseases | https://doi.org/10.1371/journal.pntd.0005824 July 31, 2017 8 / 24
17 clinical samples, with initial parasitemias ranging between 854 and 43,177 (median: 7,566)
parasites/μl, decreased the percent human DNA content from a median of 99.2% (range: 82.7–
99.9%) to 23.3% (range: 0–97.6%). No human DNA could be detected by quantitative real-
time polymerase chain reaction (qPCR) in three filtered samples (i.e., 0% host DNA contami-
nation). The residual human DNA content in our leukocyte-depleted samples was similar to
the median of 33.9% (range: 1.6–68.6%) found in blood samples from Indonesia after double
filtration through CF-11 cellulose columns [17]. The increase in parasite:human DNA ratio
after leukocyte depletion ranged between 1.7 and 3,060-fold (median: 227-fold) and appeared
to be inversely proportional to the initial, pre-treatment parasite:human DNA ratio (Spearman
correlation coefficient rs = -0.512, P = 0.061; S3 Fig), but did not correlate with the initial para-
sitemia (rs = 0.165, P = 0.412).
The next challenge consisted in selectively increasing parasite DNA yield for genome
sequencing. To this end, leukocyte-depleted P. vivax samples were cultured in vitro for up to
44 h to allow uninucleate trophozoites to mature to multinucleate blood-stage schizonts,
increasing parasite DNA content by�4-fold [17]. We obtained enough template DNA for
library preparation and sequencing from 9 cultured samples, achieving 49.8–78.6× average
genome sequencing depth; 91.8–94.7% of the reads mapped to reference Sal-I genome
(Table 1). These results compared favorably with the coverage and percentage of reads map-
ping onto the reference P. vivax genome obtained with other different methods for clinical
sample preparation: (a) single CF-11 column filtration (0.8–42.1× depth and 0.4–27.8% map-
ping in 8 isolates from Colombia [35] and 4.2–28.1× depth and 18.3–55.4% mapping in 11 iso-
lates from Peru [36,37]), (b) double CF-11 column filtration (70–407× depth and 15.0–46.2%
mapping in 5 isolates from Cambodia and Madagascar [38]), (c) double CF-11 column filtra-
tion followed by in vitro schizont maturation (18–116× depth and 11.0–89.1% mapping in 22
isolates from Thailand and returning travelers [17]), and (d) in-situ hybridization for P. vivaxwhole-genome capture in unfiltered samples (21.9–160.4× depth and 20.2–80.1% mapping in
5 isolates from Peru [16] and 34.8–118.2× depth and 19.6–39.7% mapping in 3 isolates from
East Asia [39]). Therefore, the sample preparation strategy described here allowed for high
sequence coverage and depth, but further comparisons are limited by the use of different next-
generation sequencing platforms across studies (Ion PGM and Ion Proton here and Illumina
in other studies).
Local and regional patterns of genome-wide diversity
We used the Ion PGM and Ion Proton platforms to generate between 17.8 and 23.9 million
sequence reads from 9 clinical samples of P. vivax from Brazil (Table 1). To explore local levels
of genomic diversity, our sequence data were combined with those from two P. vivax clinical
samples from Brazil that were previously obtained with Illumina platforms [11,14]. Sequence
reads from these additional samples (PV4 and Brazil32) covered 86.2% and 95.0% of the refer-
ence genome, respectively (S1 Table). Since all isolates from Brazil (n = 11) were collected
from sites within a radius of 120 km in the Amazon Basin (Fig 1), we define BRA as a local,
nearly sympatric P. vivax population. After applying stringent quality control filters to raw
sequence reads (see Methods), we uncovered 27,360 high-confidence single-nucleotide poly-
morphisms (SNPs) in the BRA population. The overall nucleotide diversity π was estimated at
5.6 x 10⁻⁴).
We next compared BRA sequence data with those from three other New World populations
of P. vivax: PER (n = 23), COL (n = 31), and MEX (n = 19) [11], from clinical isolates sampled
in sites shown in Fig 1. Two populations were geographically heterogeneous: PER samples
were collected in three departments (Loreto and Madre de Dios, both in the Amazon Basin,
Plasmodium vivax genomes from the New World
PLOS Neglected Tropical Diseases | https://doi.org/10.1371/journal.pntd.0005824 July 31, 2017 9 / 24
and Piura, on the northwestern Pacific coast), while COL samples came from four depart-
ments (Nariño, Valle del Cauca, and Choco along the Pacific Coast, and Cordoba, on the
Caribbean coast). MEX samples were from five different sites, but all in the southern state of
Chiapas (S1 Table). We characterized 94,122 biallelic SNPs passing our high-quality filters in
84 samples; 55.0% of them are located in intergenic regions, 8.8% in introns, and 36.2% in cod-
ing regions. Most (61.2%) coding SNPs were non-synonymous (nsSNPs), as previously found
in other regional P. vivax populations [14,38]. Unsurprisingly, the number of SNPs found in
each population was directly proportional to sample size, being lowest in BRA (n = 27,360)
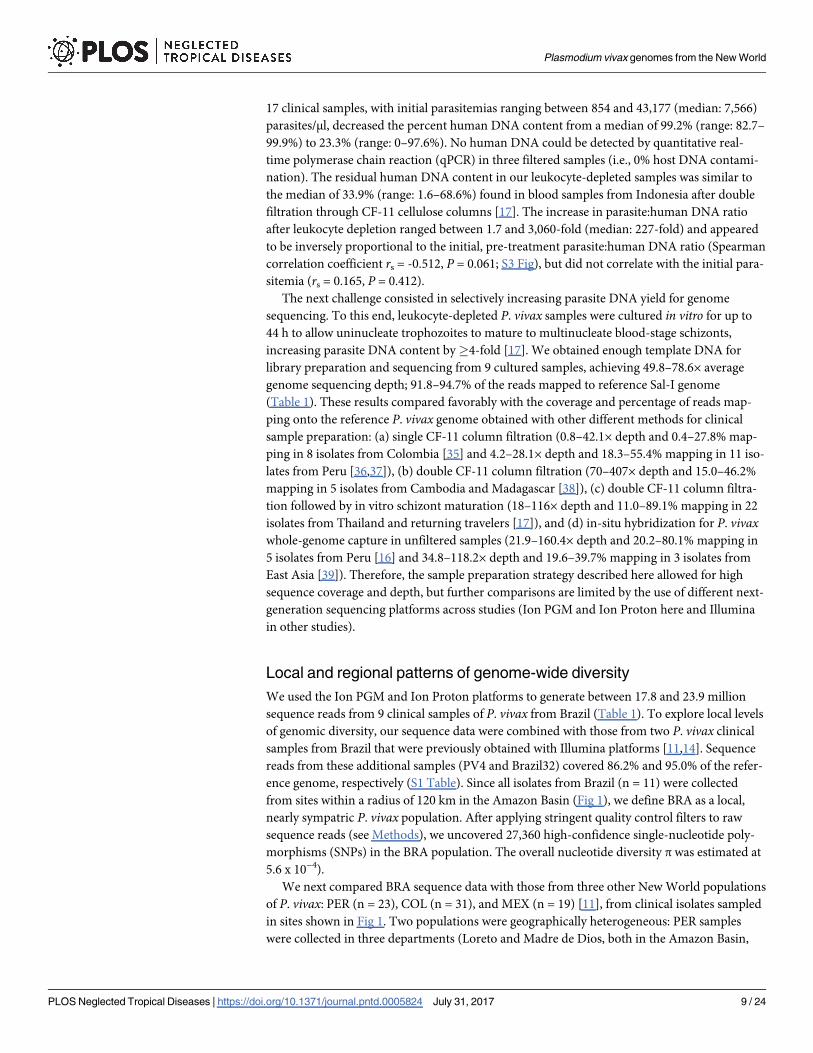
and highest in COL (n = 57,262; Fig 2). Overall, 49,598 (52.3%) SNPs were unique to a popula-
tion (i.e., private) and 8,529 (9.1%) were shared by all populations (Fig 2). Of the 6,891 private
SNPs found in BRA, 40.0% mapped to coding sequences; 65.2% of the coding SNPs were non-
synonymous. PER and COL shared the highest number of SNPs (n = 28,667), followed by
COL and MEX (n = 24,107) (Fig 2).
Nucleotide diversity in PER (π = 5.2 x 10⁻⁴), COL (π = 5.5 x 10⁻⁴), and MEX (π = 6.2 x
10−4) was similar to that in BRA (π = 5.6 x 10⁻⁴), showing that the local BRA population was as
diverse as geographically heterogeneous sample sets from other American countries. Similar
levels of genome-wide nucleotide diversity were recently reported in P. vivax populations from
Colombia (π = 6.8 x 10⁻⁴; n = 8) [35], Thailand (π = 5.3 x 10⁻⁴; n = 88), Cambodia (π = 5.0 x
10−4; n = 19), and Indonesia (π = 5.0 x 10⁻⁴; n = 41) [14], but the differences across studies in
genome sequencing depth and criteria for defining high-quality SNPs limit such comparisons.
The frequency distribution of π values within 1-kb sequence windows across the genome
was quite similar in all countries (S4 Fig); the interquartile ranges (IQR) were 1.7 x 10⁻⁴ to 6.9
x 10−4 in BRA, 1.7 x 10⁻⁴ to 6.5 x 10⁻⁴ in PER, 1.3 x 10⁻⁴ to 6.6 x 10⁻⁴ in COL, and 1.9 x 10⁻⁴ to
Fig 2. Venn diagram showing the number of SNPs shared by P. vivax samples from Brazil (n = 11 isolates), Peru
(n = 23), Colombia (n = 31), and Mexico (n = 19).
https://doi.org/10.1371/journal.pntd.0005824.g002
Plasmodium vivax genomes from the New World
PLOS Neglected Tropical Diseases | https://doi.org/10.1371/journal.pntd.0005824 July 31, 2017 10 / 24

7.5 x 10⁻⁴ in MEX. All distributions were right-skewed, with asymmetry coefficients ranging
between 3.37 (BRA) and 3.84 (MEX).
We defined domains with the top 50 π values in a population as highly variable genomic
regions. They comprised, in addition to numerous sequences coding for hypothetical proteins,
gene families such as pst-a, fam-b, fam-d, and fam-e [40] and those coding for major parasite
antigens, such as the vir family (>300 genes, mostly in subtelomeric domains, on several chro-
mosomes), the serine repeat antigen (sera) family (13 genes on chromosome 4), the merozoite
surface protein (msp)-7 family (11 genes on chromosome 12), and the msp-3 family (11 genes
on chromosome 10) (S2 Table) (see also [11,14,36]).
These findings are not unexpected, since natural selection favors increased diversity in anti-
gen-coding genes to evade host immunity, but must be interpreted with caution because mis-
alignments of paralogous sequences may have inflated nucleotide diversity estimates in gene
families. We thus recalculated genome-wide π values after masking out subtelomeric domains
and the internal chromosomal regions comprising the sera, msp-3 and msp-7 gene families
[14], but this procedure affected our overall estimates very little; recalculated values were: BRA
(π = 5.5 × 10⁻⁴), PER (π = 5.2 × 10⁻⁴), COL (π = 4.7 × 10⁻⁴), and MEX (π = 5.2 × 10⁻⁴). The sin-
gle-copy msp-1 gene [41] also mapped to a highly variable genomic region in BRA. However,
our nucleotide diversity estimates for msp-1may have been affected by likely sequence mis-
alignments in the numerous repetitive domains across this locus [42,43].
Signatures of selection and population expansion
The expected value for Tajima’s D is zero under a neutral model that assumes random mating,
no recombination, mutation-drift equilibrium, infinite sites, and constant population size.
High Tajima’s D values are usually due to balancing selection or recent population size
reduction, while negative D values are consistent with population size expansion or purifying
selection [44]. Although the P. vivax genomes from COL and PER were not part of a single
population (while BRA and MEX genomes are), the Tajima’s D distribution provides informa-
tion on how the pattern of mutations changes across the genome. All distributions of Tajima’s
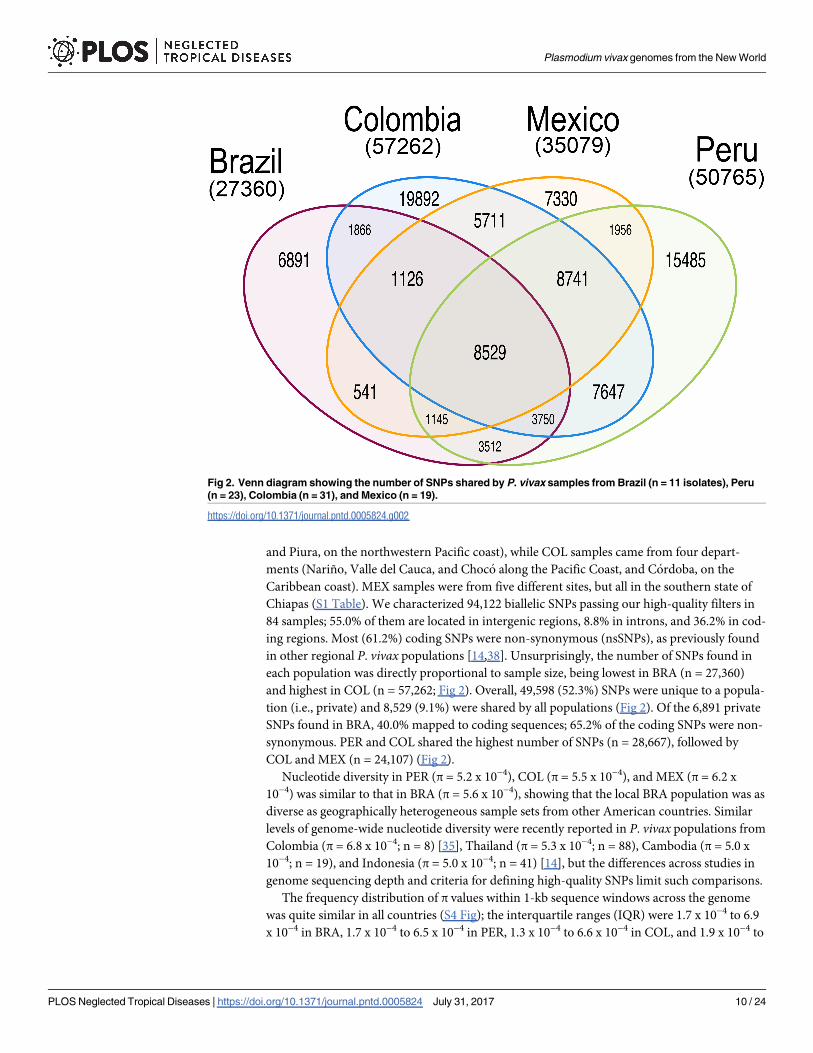
D values in our populations were right-skewed, with asymmetry coefficients of 0.477 (BRA),
0.841 (PER), 0.902 (COL), and 0.412 (MEX) (Fig 3). Negative D values predominated in PER
(median: -0.439; IQR: -0.959 to -0.003) and COL (median: -0.466; IQR: -0.959 to 0.039), but
not in BRA (median: 0.026; IQR: -0.571 to 0.595) and MEX (median: 0.039; IQR: -0.724 to
0.748).
Interestingly, the genomic regions with the 50 lowest Tajima’s D values within each popula-
tion (threshold D values: -1.096 in BRA, -1.622 in PER, -1.724 in COL, and -1.376 in MEX)
comprised several hypothetical and housekeeping genes, but also members of gene families
such as vir, sera, msp-3, pst-a, and fam-a (S3 Table). Only two regions with low Tajima’s D val-
ues were shared by two populations; one had no annotated gene and the other had a gene cod-
ing for a hypothetical protein (S3 Table).
Similarly, the genomic regions with the 50 highest Tajima’s D values within each population
(cut-off values: 2.024 in BRA, 1.890 in PER, 2.078 in COL, and 2.407 in MEX) also comprised
several hypothetical and housekeeping genes and a few surface antigen genes (sera, circum-
sporozoite protein [csp], and msp-3) that may be under balancing selection (S4 Table). How-
ever, different genomic regions giving top 50 Tajima’s D values were typically found in each
population and only 11 of them (none comprising antigen-coding genes) were shared by two
or more populations. Whether the high Tajima’s D values found in certain domains are due
to random effects of the parasite’s demographic history or to balancing selection on specific
genes remains to be further examined in larger population samples.
Plasmodium vivax genomes from the New World
PLOS Neglected Tropical Diseases | https://doi.org/10.1371/journal.pntd.0005824 July 31, 2017 11 / 24
MAF distributions were L-shaped in all New World P. vivax populations (S5 Fig), similar
to patterns described for P. falciparum populations from sub-Saharan Africa [45,46]. The pro-
portion of SNPs with allele frequencies� 0.1 were 51.6% in BRA, 66.3% in PER, 71.5% in
COL, and 55.1% in MEX. Despite the relatively small sample sizes, we interpret the clear pre-
dominance of negative Tajima’s D values in PER and COL and of rare alleles in all populations,
but mainly in PER and COL, as suggestive of a recent P. vivax population expansion in the
Americas. Data from an extensive mitochondrial genome analysis of local parasites are also
consistent with the demographic expansion hypothesis [47].
Genetic differentiation and population structure
P. vivax genomic sequences from the New World were previously shown to cluster mostly
according to their geographic origins, with the majority of MEX samples (that show more
extensive evidence of identity by descent) clustering together in PCA plots [11]. These findings
are particularly relevant to malaria-eliminating countries in the continent; if parasites can be
assigned by molecular genotyping to their countries of origin, locally acquired and imported
Fig 3. Frequency distribution of Tajima’s D values calculated within 1-kb windows of genomic sequence
in four New World populations of P. vivax. BRA = Brazil (n = 11 isolates), PER = Peru (n = 23),
COL = Colombia (n = 31), and MEX = Mexico (n = 19).
https://doi.org/10.1371/journal.pntd.0005824.g003
Plasmodium vivax genomes from the New World
PLOS Neglected Tropical Diseases | https://doi.org/10.1371/journal.pntd.0005824 July 31, 2017 12 / 24
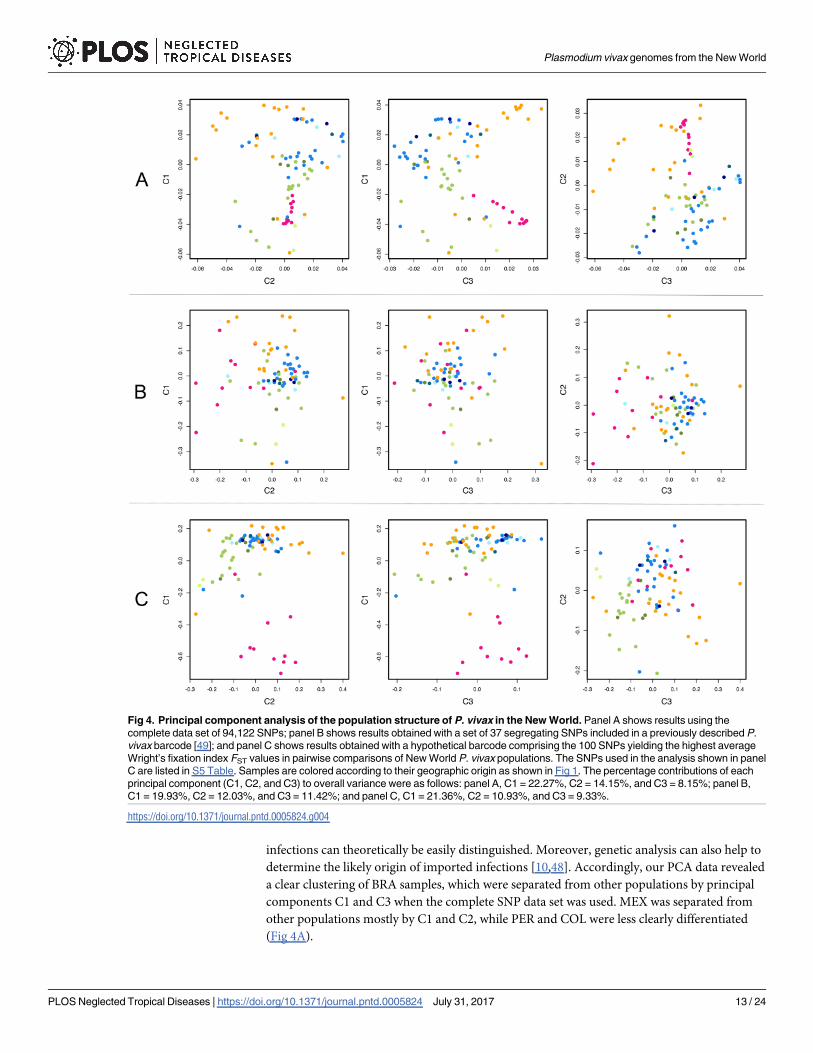
infections can theoretically be easily distinguished. Moreover, genetic analysis can also help to
determine the likely origin of imported infections [10,48]. Accordingly, our PCA data revealed
a clear clustering of BRA samples, which were separated from other populations by principal
components C1 and C3 when the complete SNP data set was used. MEX was separated from
other populations mostly by C1 and C2, while PER and COL were less clearly differentiated
(Fig 4A).
Fig 4. Principal component analysis of the population structure of P. vivax in the New World. Panel A shows results using the
complete data set of 94,122 SNPs; panel B shows results obtained with a set of 37 segregating SNPs included in a previously described P.
vivax barcode [49]; and panel C shows results obtained with a hypothetical barcode comprising the 100 SNPs yielding the highest average
Wright’s fixation index FST values in pairwise comparisons of New World P. vivax populations. The SNPs used in the analysis shown in panel
C are listed in S5 Table. Samples are colored according to their geographic origin as shown in Fig 1. The percentage contributions of each
principal component (C1, C2, and C3) to overall variance were as follows: panel A, C1 = 22.27%, C2 = 14.15%, and C3 = 8.15%; panel B,
C1 = 19.93%, C2 = 12.03%, and C3 = 11.42%; and panel C, C1 = 21.36%, C2 = 10.93%, and C3 = 9.33%.
https://doi.org/10.1371/journal.pntd.0005824.g004
Plasmodium vivax genomes from the New World
PLOS Neglected Tropical Diseases | https://doi.org/10.1371/journal.pntd.0005824 July 31, 2017 13 / 24
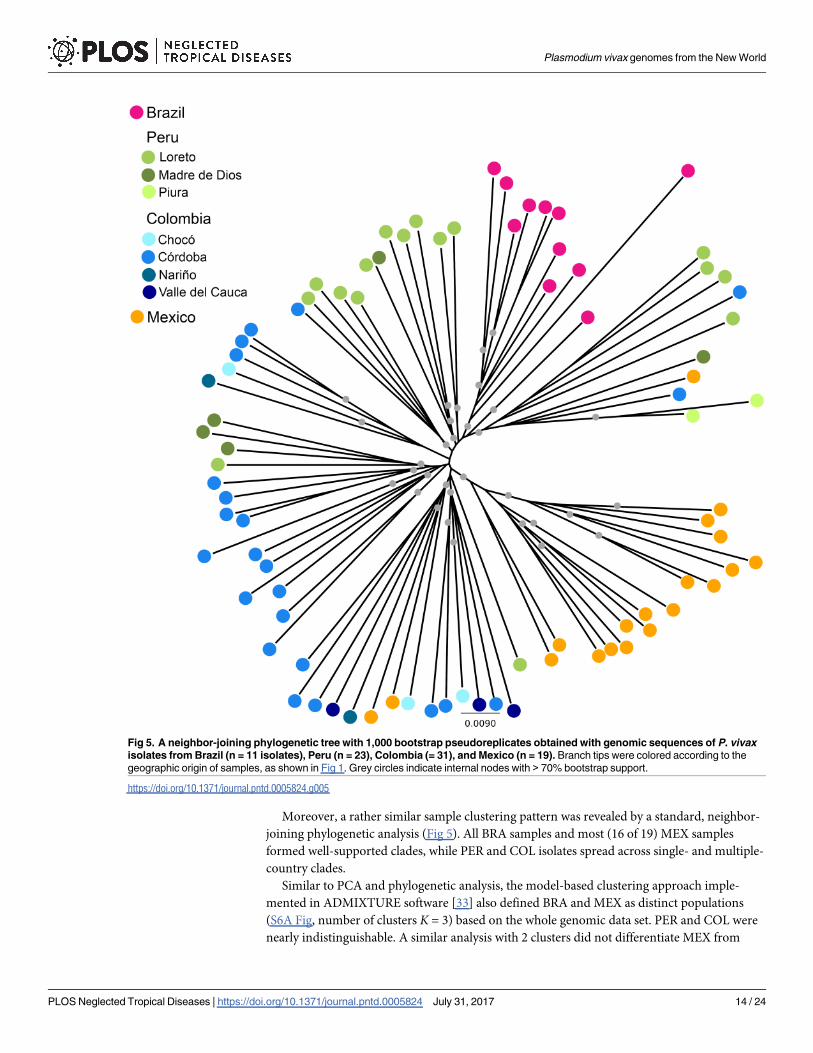
Moreover, a rather similar sample clustering pattern was revealed by a standard, neighbor-
joining phylogenetic analysis (Fig 5). All BRA samples and most (16 of 19) MEX samples
formed well-supported clades, while PER and COL isolates spread across single- and multiple-
country clades.
Similar to PCA and phylogenetic analysis, the model-based clustering approach imple-
mented in ADMIXTURE software [33] also defined BRA and MEX as distinct populations
(S6A Fig, number of clusters K = 3) based on the whole genomic data set. PER and COL were
nearly indistinguishable. A similar analysis with 2 clusters did not differentiate MEX from
Fig 5. A neighbor-joining phylogenetic tree with 1,000 bootstrap pseudoreplicates obtained with genomic sequences of P. vivax
isolates from Brazil (n = 11 isolates), Peru (n = 23), Colombia (= 31), and Mexico (n = 19). Branch tips were colored according to the
geographic origin of samples, as shown in Fig 1. Grey circles indicate internal nodes with > 70% bootstrap support.
https://doi.org/10.1371/journal.pntd.0005824.g005
Plasmodium vivax genomes from the New World
PLOS Neglected Tropical Diseases | https://doi.org/10.1371/journal.pntd.0005824 July 31, 2017 14 / 24
COL (S6A Fig, number of clusters K = 2). ADMIXTURE analysis using a curtailed data set
(12,762 unlinked SNPs) allowed a poor differentiation between populations (S6B Fig, number
of clusters K = 2 or 3). Not surprisingly, the most geographically homogeneous samples (BRA
and MEX) formed well-defined clusters.
We next tested whether a recently described P. vivax SNP barcode [49] would be able
to correctly assign New World isolates to their countries of origin. Of the 42 SNPs
originally included in the barcode, five did not segregate in our populations. PCA with
the remaining 37 SNPs was unable to cluster our parasite populations by their countries
of origin (Fig 4B).
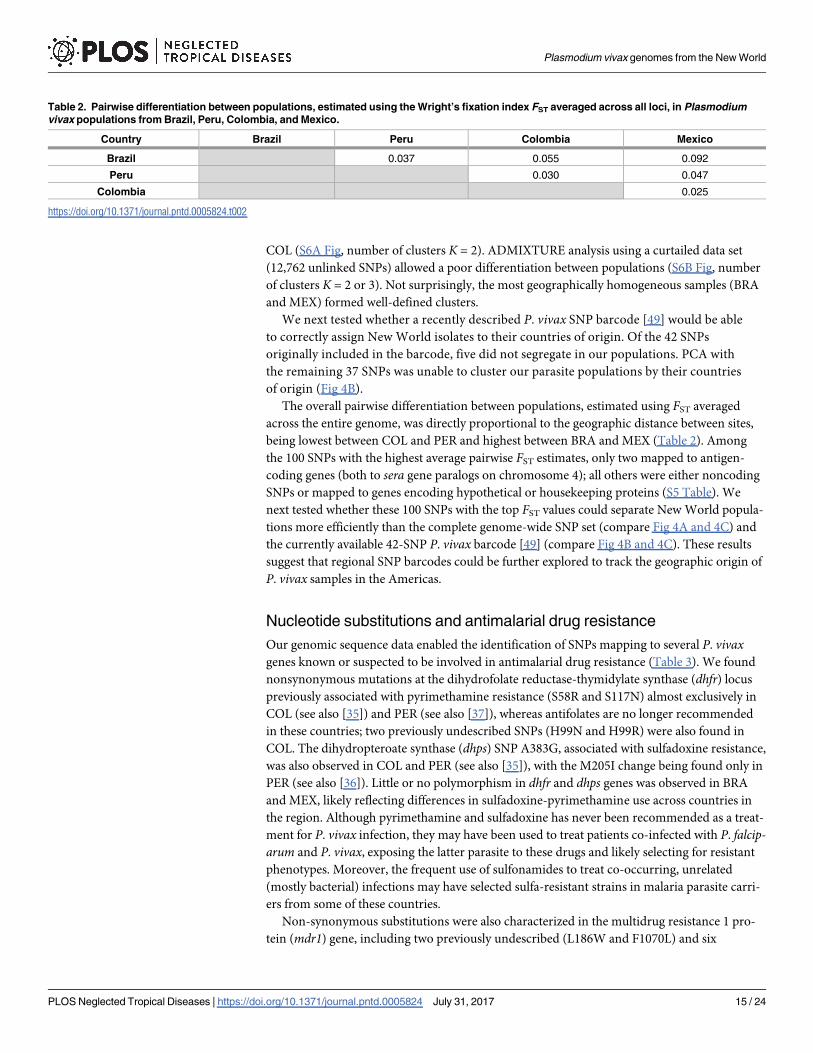
The overall pairwise differentiation between populations, estimated using FST averaged
across the entire genome, was directly proportional to the geographic distance between sites,
being lowest between COL and PER and highest between BRA and MEX (Table 2). Among
the 100 SNPs with the highest average pairwise FST estimates, only two mapped to antigen-
coding genes (both to sera gene paralogs on chromosome 4); all others were either noncoding
SNPs or mapped to genes encoding hypothetical or housekeeping proteins (S5 Table). We
next tested whether these 100 SNPs with the top FST values could separate New World popula-
tions more efficiently than the complete genome-wide SNP set (compare Fig 4A and 4C) and
the currently available 42-SNP P. vivax barcode [49] (compare Fig 4B and 4C). These results
suggest that regional SNP barcodes could be further explored to track the geographic origin of
P. vivax samples in the Americas.
Nucleotide substitutions and antimalarial drug resistance
Our genomic sequence data enabled the identification of SNPs mapping to several P. vivaxgenes known or suspected to be involved in antimalarial drug resistance (Table 3). We found
nonsynonymous mutations at the dihydrofolate reductase-thymidylate synthase (dhfr) locus
previously associated with pyrimethamine resistance (S58R and S117N) almost exclusively in
COL (see also [35]) and PER (see also [37]), whereas antifolates are no longer recommended
in these countries; two previously undescribed SNPs (H99N and H99R) were also found in
COL. The dihydropteroate synthase (dhps) SNP A383G, associated with sulfadoxine resistance,
was also observed in COL and PER (see also [35]), with the M205I change being found only in
PER (see also [36]). Little or no polymorphism in dhfr and dhps genes was observed in BRA
and MEX, likely reflecting differences in sulfadoxine-pyrimethamine use across countries in
the region. Although pyrimethamine and sulfadoxine has never been recommended as a treat-
ment for P. vivax infection, they may have been used to treat patients co-infected with P. falcip-arum and P. vivax, exposing the latter parasite to these drugs and likely selecting for resistant
phenotypes. Moreover, the frequent use of sulfonamides to treat co-occurring, unrelated
(mostly bacterial) infections may have selected sulfa-resistant strains in malaria parasite carri-
ers from some of these countries.
Non-synonymous substitutions were also characterized in the multidrug resistance 1 pro-
tein (mdr1) gene, including two previously undescribed (L186W and F1070L) and six
Table 2. Pairwise differentiation between populations, estimated using the Wright’s fixation index FST averaged across all loci, in Plasmodium
vivax populations from Brazil, Peru, Colombia, and Mexico.
Country Brazil Peru Colombia Mexico
Brazil 0.037 0.055 0.092
Peru 0.030 0.047
Colombia 0.025
https://doi.org/10.1371/journal.pntd.0005824.t002
Plasmodium vivax genomes from the New World
PLOS Neglected Tropical Diseases | https://doi.org/10.1371/journal.pntd.0005824 July 31, 2017 15 / 24

previously reported SNPs (V221L, M908L, T958M, Y976F, and F1076L [50]). The Y976F
change, originally believed to confer chloroquine resistance (CQR) in Southeast Asia and Mel-
anesia [24], occurred in a single BRA sample whose CQR phenotype could not be determined
(Table 2). Interestingly, we found no coding changes in the chloroquine resistance transporter
Table 3. Nonsynonymous single-nucleotide polymorphism (SNPs) detected in drug resistance genes by whole-genome sequencing in Plasmo-
dium vivax isolates from Brazil, Peru, Colombia, and Mexico.
Gene Chromosome Amino acid change No. (%) samples with SNP per country
Brazil Peru Colombia Mexico
dhfr (PVX_089950) 5 S58R 0 (0.0%) 2 (8.7%) 5 (16.1%) 0 (0.0%)
H99N 0 (0.0%) 0 (0.0%) 2 (6.4%) 0 (0.0%)
H99R 0 (0.0%) 0 (0.0%) 2 (6.4%) 0 (0.0%)
S117N 1 (9.1%) 4 (17.4%) 17 (54.8%) 0 (0.0%)
dhps (PVX_123230) 14 M205I 0 (0.0%) 1 (4.3%) 0 (0.0%) 0 (0.0%)
A383G 0 (0.0%) 1 (4.3%) 1 (3.2%) 0 (0.0%)
mdr1 (PVX_080100) 10 L186W 0 (0.0%) 1 (4.3%) 0 (0.0%) 0 (0.0%)
V221L 0 (0.0%) 2 (8.7%) 0 (0.0%) 0 (0.0%)
M908L 0 (0.0%) 8 (34.8%) 3 (9.7%) 0 (0.0%)
T958M 0 (0.0%) 9 (39.1%) 6 (19.3%) 4 (21.0%)
Y976F 1 (9.1%)a 0 (0.0%) 0 (0.0%) 0 (0.0%)
F1070L 0 (0.0%) 2 (8.7%) 0 (0.0%) 0 (0.0%)
F1076L 1 (9.1%)a 1 (4.3%) 0 (0.0%) 0 (0.0%)
mrp1 (PVX_097025) 2 T259R 0 (0.0%) 1 (4.3%) 13 (56.5%) 12 (63.2%)
T282M 0 (0.0%) 0 (0.0%) 5 (16.1%) 0 (0.0%)
K542E 0 (0.0%) 0 (0.0%) 1 (3.2%) 0 (0.0%)
Q906E 0 (0.0%) 7 (30.4%) 9 (29.0%) 0 (0.0%)
L1282I 0 (0.0%) 0 (0.0%) 2 (6.4%) 0 (0.0%)
Y1393D 3 (27.3%)b 8 (34.8%) 0 (0.0%) 2 (10.5%)
G1419A 1 (9.1%)c 5 (21.8%) 2 (6.4%) 1 (5.3%)
V1478I 2 (18.2%)d 4 (17.4%) 1 (3.2%) 1 (5.3%)
I1480V 0 (0.0%) 0 (0.0%) 1 (3.2%) 0 (0.0%)
T1525I 0 (0.0%) 0 (0.0%) 1 (3.2%) 0 (0.0%)
H1586I 0 (0.0%) 4 (17.4%) 0 (0.0%) 0 (0.0%)
mrp2 (PVX_124085) 14 S1701L 0 (0.0%) 1 (4.3%) 0 (0.0%) 0 (0.0%)
T1698K 0 (0.0%) 2 (8.7%) 0 (0.0%) 5 (26.5%)
P1600H 0 (0.0%) 0 (0.0%) 0 (0.0%) 1 (5.3%)
Q1419E 0 (0.0%) 2 (8.7%) 3 (9.7%) 3 (6.9%)
N1263Y 0 (0.0%) 2 (8.7%) 1 (3.2%) 0 (0.0%)
P1196S 0 (0.0%) 0 (0.0%) 1 (3.2%) 4 (21.0%)
G1166E 0 (0.0%) 0 (0.0%) 0 (0.0%) 5 (26.5%)
A1106S 0 (0.0%) 0 (0.0%) 3 (9.7%) 7 (37.1%)
V1022M 1 (9.1%) 4 (17.4%) 2 (6.4%) 0 (0.0%)
S681I 0 (0.0%) 0 (0.0%) 5 (16.1%) 0 (0.0%)
R294M 1 (9.1%) 3 (12.9%) 16 (51.2%) 12 (63.6%)
aThe sample from Brazil carrying these two mutations (#18) was not tested for chloroquine resistance.bTwo of three samples (#20 and #207) carrying this mutation were characterized as chloroquine-sensitive using an ex-vivo schizont maturation test (IC50 =
14.5 and 46.7 mM, respectively); the third sample (#Brazil32) [11] was not tested for chloroquine resistance.cThe sample from Brazil carrying this mutation (#207) was characterized as chloroquine-sensitive (IC50 = 46.7 mM)dOne sample from Brazil carrying this mutation (#32) was characterized as chloroquine-sensitive (IC50 = 20.5 mM); the second sample (#Brazil32) [11] was
not tested for chloroquine resistance.
https://doi.org/10.1371/journal.pntd.0005824.t003
Plasmodium vivax genomes from the New World
PLOS Neglected Tropical Diseases | https://doi.org/10.1371/journal.pntd.0005824 July 31, 2017 16 / 24

ortholog (crt-o) gene (PVX 087980), whose ortholog in P. falciparum displays a key non-syn-
onymous substitution leading to CQR [51].
Five of 12 mutations found at the multidrug resistance associated protein 1 (mrp1 [PVX
097025]) locus, which codes for an ATP-cassette binding (ABC) transporter putatively
involved in antimalarial drug efflux [52], had been described in a clinical sample from Peru
(L1282I, Y1393D, G1419A, V1478I, and H1586I [36]). Similarly, six of 11 had been previously
described in Colombia (Q1419E, P1196S, A1106S, V1022M, S681I, R294M [35]) and six in
Peru (S1701L, T1698K, Q1419E, A1106S, V1022M, and R294M [37]), in multidrug resistance
associated protein 2 gene (PVX_124085). The antimalarial drug-resistance phenotype (if any)
associated with these mutations remains undetermined.
Linkage disequilibrium
Here we found a sharp LD decline within 100 bp of distance between pairs of SNPs in BRA
and MEX, with very low LD in COL and negligible LD in PER (Fig 6). Interestingly, the LD
decay in BRA and MEX populations, originating from the sites with the lowest malaria trans-
mission [53], was even faster than that described for P. vivax populations from Southeast Asia,
where P. vivax endemicity is substantially higher [14], and that described for P. falciparumpopulations from areas of much higher endemicity in Sub-Saharan Africa [54, 55, 56] and
Southeast Asia [56]. These results are consistent with a very high outcrossing rate in P. vivaxpopulations and imply that SNP array-based genome-wide association studies (GWAS) would
require a very high marker density (inter-marker distance < 100 bp) to help find genetic loci
that determine phenotypes of interest, such as drug resistance and virulence, in BRA and MEX
populations. SNP-based association studies are unlikely to be successful in PER and COL pop-
ulations, given the negligible LD. In contrast, P. falciparum populations from the Pacific Coast
Fig 6. Linkage disequilibrium (LD) decay with increasing distance between SNPs on the same
chromosome. Solid lines show median r2 estimates for SNPs along the same chromosome plotted against
the inter-marker physical distance for Brazil (pink), Peru (green), Colombia (blue), and Mexico (orange).
Dotted lines show the background genome-wide LD (median r2 estimates for unlinked SNPs—those mapping
to different chromosomes).
https://doi.org/10.1371/journal.pntd.0005824.g006
Plasmodium vivax genomes from the New World
PLOS Neglected Tropical Diseases | https://doi.org/10.1371/journal.pntd.0005824 July 31, 2017 17 / 24

of Colombia showed a much more gradual LD decline, reaching background LD levels only at
an inter-marker distance of 240 kb [57].
Conclusions
We found high genome-wide diversity and relatively little geographic structure in P. vivaxpopulations from areas of relatively low malaria transmission in the Americas. These find-
ings contrast with the low genetic diversity and clear subdivision into local, highly divergent
populations that is typical of New World populations of P. falciparum [57–61]. Interestingly,
local P. vivax populations are nearly as polymorphic as their P. falciparum counterparts
from Africa [45,46,54] and their P. vivax counterparts from Southeast Asia [11,14]. More-
over, the low levels of between-population differentiation in P. vivax from the Americas are
reminiscent of those in P. falciparum populations from hyperendemic sub-Saharan Africa
[45,46,59, 62].
Demographic history might explain, at least in part, the observed differences between P.
vivax and P. falciparum populations from the New World. The original diversity of the ances-
tral P. falciparum population may have been partially lost during (a) its migration to the Amer-
icas in post-Columbian times [63] followed by the adaptation to entirely different local vectors
[64], (b) recent selective sweeps driven by antimalarial drugs, such as chloroquine [65] and
pyrimethamine [66], and (c) local extinctions and clonal expansions following eradication
attempts in the Americas between the mid-1950s and late 1960s [53,60]. These events would
have resulted in small and fragmented, mostly inbred P. falciparum populations being scat-
tered throughout the region. The significantly greater genome-wide diversity currently found
in P. vivax populations worldwide, compared with P. falciparum [11,67], suggests that (a) this
species retained more ancestral diversity than P. falciparum when transferred from apes to
humans and following subsequent spread out of Africa and/or (b) P. vivax is simply older than
P. falciparum and therefore has accumulated more mutations over time. Moreover, these spe-
cies might also differ in the ways they colonized the New World. The high diversity of present-
day P. vivax lineages across this continent is consistent with an admixture of parasite lineages
originating from geographically diverse regions [5, 7, 47], including now extinct European lin-
eages [12]. The success of colonization events and the recombination between these intro-
duced strains may have been favored by the ability of P. vivax to stay dormant in the liver as
hypnozoites, prolonging the duration of parasite carriage in human hosts and increasing the
probability of superinfections leading to the co-occurrence of genetically diverse clones that
may recombine once transmitted to mosquito vectors. Moreover, genome-wide P. vivax diver-
sity in the region appears to have been little affected by recent selective sweeps driven by pyri-
methamine [35,37] in Brazil and Colombia. Interestingly, P. vivax resistance to chloroquine
remains relatively infrequent in the New World [68] and is unlikely to have induced a major
selective sweep in local parasites.
Improved methods for clinical sample preparation and next-generation sequencing now
enable further genome-wide analyses of additional P. vivax isolates from the New World, to
test the demographic scenarios suggested by our data.
Supporting information
S1 Fig. Single-step filtering procedure used to remove leukocytes from clinical blood sam-
ples in a field laboratory. A, BioR 01 Plus leukocyte depletion filter (Fresenius Kabi, Bad
Homburg, Germany). B and C, cutting off with a scissor, under sterile conditions, the tubing
connecting the filtering device to the 400-ml blood storage bag and the adapter. D, use of filter-
ing device in a laminar flow hood, indicating how the blood sample is introduced and
Plasmodium vivax genomes from the New World
PLOS Neglected Tropical Diseases | https://doi.org/10.1371/journal.pntd.0005824 July 31, 2017 18 / 24

collected, with 10-ml syringes, after filtering.
(PDF)
S2 Fig. Cross-validation errors estimated for Admixture analysis under K values ranging
between 2 and 10. Panel A shows results for analysis comprising all 94,122 high-quality SNPs,
while Panel B shows those for the curtailed set of 12,762 SNPs that are not linked.
(PDF)
S3 Fig. Enrichment of P. vivaxDNA isolated from clinical samples using the single-step fil-
tering procedure described in S1 Fig. Fold increase in parasite:human DNA ratio after leuko-
cyte depletion is shown in relation to the initial, pre-filtering parasite:human DNA ratio. Data
on x and y axes are shown in log scale.
(PDF)
S4 Fig. Frequency distribution of nucleotide diversity (π) calculated within 1-kb windows
of genomic sequence in four New World populations of P. vivax. BRA = Brazil (n = 11 iso-
lates), PER = Peru (n = 23), COL = Colombia (n = 31), and MEX = Mexico (n = 19).
(PDF)
S5 Fig. Relative frequency (%) distribution of minor allele frequencies (MAF) in four
New World populations of P. vivax. BRA = Brazil (n = 11 isolates), PER = Peru (n = 23),
COL = Colombia (n = 31), and MEX = Mexico (n = 19).
(PDF)
S6 Fig. Population structure evaluated using a model-based clustering approach imple-
mented in the software Admixture [34]. We show Admixture plots obtained with K = 2 and
K = 3 clusters with all 94,122 high-quality SNPs (panel A) or a curtailed set of 12,762 SNPs that
are not linked (panel B). Although K = 2 was associated with the lowest cross-validation error
(S4 Fig), the analysis of all high-quality SNPs under K = 3 appeared more able to separate BRA
and MEX from the other populations. The analysis with the curtailed SNP set yielded less clear
differentiation among populations.
(PDF)
S1 Table. P. vivax sequence data sets from the New World analyzed in this study. Isolate
codes, country of origin, and Sequence Read Archive (SRA) accession numbers are provided.
(PDF)
S2 Table. List of annotated genes mapping to the 50 windows (1 kb) with the highest π val-
ues in each New World P. vivax population.
(PDF)
S3 Table. List of annotated genes mapping to the 50 windows (1 kb) with the lowest Taji-
ma’s D values in each New World P. vivax population.
(PDF)
S4 Table. List of annotated genes mapping to the 50 windows (1 kb) with the highest Taji-
ma’s D values in each New World P. vivax population.
(PDF)
S5 Table. List of SNPs with the 100 highest average Wright’s fixation index FST values in
pairwise comparisons of New World P. vivax populations.
(PDF)
Plasmodium vivax genomes from the New World
PLOS Neglected Tropical Diseases | https://doi.org/10.1371/journal.pntd.0005824 July 31, 2017 19 / 24
http://journals.plos.org/plosntds/article/asset?unique&id=info:doi/10.1371/journal.pntd.0005824.s002
http://journals.plos.org/plosntds/article/asset?unique&id=info:doi/10.1371/journal.pntd.0005824.s003
http://journals.plos.org/plosntds/article/asset?unique&id=info:doi/10.1371/journal.pntd.0005824.s004
http://journals.plos.org/plosntds/article/asset?unique&id=info:doi/10.1371/journal.pntd.0005824.s005
http://journals.plos.org/plosntds/article/asset?unique&id=info:doi/10.1371/journal.pntd.0005824.s006
http://journals.plos.org/plosntds/article/asset?unique&id=info:doi/10.1371/journal.pntd.0005824.s007
http://journals.plos.org/plosntds/article/asset?unique&id=info:doi/10.1371/journal.pntd.0005824.s008
http://journals.plos.org/plosntds/article/asset?unique&id=info:doi/10.1371/journal.pntd.0005824.s009
http://journals.plos.org/plosntds/article/asset?unique&id=info:doi/10.1371/journal.pntd.0005824.s010
Acknowledgments
We thank all sample donors for their participation in this study; Kezia K. G. Scopel for help in
field work; Danielle S. Menchaca Vega for laboratory support; and Daniel E. Neafsey for a crit-
ical reading of the manuscript. This publication uses sequence data generated by the Wellcome
Trust Sanger Institute (Hinxton, UK) as part of the MalariaGEN P. vivaxGenome Variation
project (available at https://www.malariagen.net/data/p-vivax-genome-variation-may-2016-
data-release) and by the Broad Institute of MIT and Harvard (Cambridge, MA), as part of the
International Centers of Excellence for Malaria Research (ICEMR) program of the National
Institute of Allergy and Infectious Diseases (NIAID) of the National Institutes of Health
(NIH), United States.
Author Contributions
Conceptualization: Thais C. de Oliveira, Marcelo U. Ferreira.
Data curation: Thais C. de Oliveira, Susana Barbosa, Guilherme Loss de Morais, João Marcelo
P. Alves.
Formal analysis: Thais C. de Oliveira, Susana Barbosa, Guilherme Loss de Morais, Luisa
Berna, Jody Phelan, Carlos Robello, Ana Tereza R. de Vasconcelos, João Marcelo P. Alves,
Marcelo U. Ferreira.
Funding acquisition: Marcelo U. Ferreira.
Investigation: Priscila T. Rodrigues, Maria Jose Menezes, Raquel M. Goncalves-Lopes, Melissa
S. Bastos, Nathalia F. Lima, Alexandra L. Gerber, Marcelo U. Ferreira.
Methodology: Raquel M. Goncalves-Lopes.
Project administration: Marcelo U. Ferreira.
Resources: Guilherme Loss de Morais, Luisa Berna, Carlos Robello, Ana Tereza R. de Vascon-
celos, João Marcelo P. Alves.
Software: Susana Barbosa, João Marcelo P. Alves.
Supervision: Marcelo U. Ferreira.
Visualization: Thais C. de Oliveira.
Writing – original draft: Thais C. de Oliveira, Alexandra L. Gerber, João Marcelo P. Alves,
Marcelo U. Ferreira.
Writing – review & editing: Thais C. de Oliveira, Priscila T. Rodrigues, Alexandra L. Gerber,
Ana Tereza R. de Vasconcelos, João Marcelo P. Alves, Marcelo U. Ferreira.
References1. World Health Organization: World Malaria Report 2015. Geneva: World Health Organization. 2015.
2. Liu W, Li Y, Shaw KS, Learn GH, Plenderleith LJ, Malenke JA, et al. African origin of the malaria para-
site Plasmodium vivax. Nat Commun. 2014; 5:3346. https://doi.org/10.1038/ncomms4346 PMID:
24557500
3. Loy DE, Liu W, Li Y, Learn GH, Plenderleith LJ, Sundararaman SA, et al. Out of Africa: origins and evo-
lution of the human malaria parasites Plasmodium falciparum and Plasmodium vivax. Int J Parasitol.
2017; 47:87–97. https://doi.org/10.1016/j.ijpara.2016.05.008 PMID: 27381764
4. Zimmerman PA, Ferreira MU, Howes RE, Mercereau-Puijalon O. Red blood cell polymorphism and
susceptibility to Plasmodium vivax. Adv Parasitol. 2013; 81:27–76. https://doi.org/10.1016/B978-0-12-
407826-0.00002-3 PMID: 23384621
Plasmodium vivax genomes from the New World
PLOS Neglected Tropical Diseases | https://doi.org/10.1371/journal.pntd.0005824 July 31, 2017 20 / 24

5. Carter R. Speculations on the origins of Plasmodium vivax malaria. Trends Parasitol. 2003; 19:214–9.
PMID: 12763427
6. de Castro MC, Singer BH. Was malaria present in the Amazon before the European conquest? Avail-
able evidence and future research agenda. J Archaeol Sci. 2005; 32:337–340.
7. Culleton R, Carter R. African Plasmodium vivax: distribution and origins. Int J Parasitol. 2012; 42:1091–
7. https://doi.org/10.1016/j.ijpara.2012.08.005 PMID: 23017235
8. Gerszten E, Allison MJ, Maguire B. Paleopathology in South American mummies: a review and new
findings. Pathobiology. 2012; 79:247–56. https://doi.org/10.1159/000334087 PMID: 22722564
9. Bianucci R, Araujo A, Pusch CM, Nerlich AG. The identification of malaria in paleopathology—An in-
depth assessment of the strategies to detect malaria in ancient remains. Acta Trop. 2015; 152:176–80.
https://doi.org/10.1016/j.actatropica.2015.09.002 PMID: 26366472
10. Rodrigues PT, Alves JM, Santamaria AM, Calzada JE, Xayavong M, Parise M, et al. Using mitochondrial
genome sequences to track the origin of imported Plasmodium vivax infections diagnosed in the United
States. Am J Trop Med Hyg. 2014; 90:1102–8. https://doi.org/10.4269/ajtmh.13-0588 PMID: 24639297
11. Hupalo DN, Luo Z, Melnikov A, Sutton PL, Rogov P, Escalante A, et al. Population genomics studies
identify signatures of global dispersal and drug resistance in Plasmodium vivax. Nat Genet. 2016;
48:953–8. https://doi.org/10.1038/ng.3588 PMID: 27348298
12. Gelabert P, Sandoval-Velasco M, Olalde I, Fregel R, Rieux A, Escosa R, et al. Mitochondrial DNA from
the eradicated European Plasmodium vivax and P. falciparum from 70-year-old slides from the Ebro
Delta in Spain. Proc Natl Acad Sci USA. 2016; 113:11495–11500. https://doi.org/10.1073/pnas.
1611017113 PMID: 27671660
13. Culleton R, Coban C, Zeyrek FY, Cravo P, Kaneko A, Randrianarivelojosia M, et al. The origins of Afri-
can Plasmodium vivax; insights from mitochondrial genome sequencing. PLoS One. 2011; 6:e29137.
https://doi.org/10.1371/journal.pone.0029137 PMID: 22195007
14. Pearson RD, Amato R, Auburn S, Miotto O, Almagro-Garcia J, Amaratunga C, et al. Genomic analysis
of local variation and recent evolution in Plasmodium vivax. Nat Genet. 2016; 48:959–64. https://doi.
org/10.1038/ng.3599 PMID: 27348299
15. Barbosa S, Gozze AB, Lima NF, Batista CL, Bastos Mda S, Nicolete VC, et al. Epidemiology of disap-
pearing Plasmodium vivax malaria: a case study in rural Amazonia. PLoS Negl Trop Dis. 2014; 8:
e3109. https://doi.org/10.1371/journal.pntd.0003109 PMID: 25166263
16. Bright AT, Tewhey R, Abeles S, Chuquiyauri R, Llanos-Cuentas A, Ferreira MU, et al. Whole genome
sequencing analysis of Plasmodium vivax using whole genome capture. BMC Genomics. 2012;
13:262. https://doi.org/10.1186/1471-2164-13-262 PMID: 22721170
17. Auburn S, Marfurt J, Maslen G, Campino S, Ruano Rubio V, Manske M, et al. Effective preparation of
Plasmodium vivax field isolates for high-throughput whole genome sequencing. PLoS One. 2013; 8:
e53160. https://doi.org/10.1371/journal.pone.0053160 PMID: 23308154
18. Luo Z, Sullivan SA, Carlton JM. The biology of Plasmodium vivax explored through genomics. Ann N Y
Acad Sci. 2015; 1342:53–61. https://doi.org/10.1111/nyas.12708 PMID: 25693446
19. da Silva-Nunes M, Codeco CT, Malafronte RS, da Silva NS, Juncansen C, Muniz PT, et al. Malaria on
the Amazonian frontier: transmission dynamics, risk factors, spatial distribution, and prospects for con-
trol. Am J Trop Med Hyg. 2008; 79:624–35. PMID: 18840755
20. Carlton JM, Volkman SK, Uplekar S, Hupalo DN, Pereira Alves JM, Cui L, et al. Population genetics,
evolutionary genomics, and genome-wide studies of malaria: A view accross the International Centers
of Excellence for Malaria Research. Am J Trop Med Hyg. 2015; 93(3 Suppl):87–98. https://doi.org/10.
4269/ajtmh.15-0049 PMID: 26259940
21. Shaw-Saliba K, Clarke D, Santos JM, Menezes MJ, Lim C, Mascarenhas A, et al. Infection of laboratory
colonies of Anopheles mosquitoes with Plasmodium vivax from cryopreserved clinical isolates. Int J
Parasitol. 2016; 46:679–83. https://doi.org/10.1016/j.ijpara.2016.06.003 PMID: 27456552
22. Russell B, Chalfein F, Prasetyorini B, Kenangalem E, Piera K, Suwanarusk R, et al. Determinants of in
vitro drug susceptibility testing of Plasmodium vivax. Antimicrob Agents Chemother. 2008; 52:1040–5.
https://doi.org/10.1128/AAC.01334-07 PMID: 18180357
23. Druilhe P, Brasseur P, Blanc C, Makler M. Improved assessment of Plasmodium vivax response to anti-
malarial drugs by a colorimetric double-site Plasmodium lactate dehydrogenase antigen capture
enzyme-linked immunosorbent assay. Antimicrob Agents Chemother. 2007; 51:2112–6. https://doi.org/
10.1128/AAC.01385-06 PMID: 17387158
24. Suwanarusk R, Russell B, Chavchich M, Chalfein F, Kenangalem E, Kosaisavee V, et al. Chloroquine
resistant Plasmodium vivax: in vitro characterisation and association with molecular polymorphisms.
PLoS One. 2007; 2:e1089. https://doi.org/10.1371/journal.pone.0001089 PMID: 17971853
Plasmodium vivax genomes from the New World
PLOS Neglected Tropical Diseases | https://doi.org/10.1371/journal.pntd.0005824 July 31, 2017 21 / 24
25. Carlton JM, Adams JH, Silva JC, Bidwell SL, Lorenzi H, Caler E, et al. Comparative genomics of the
neglected human malaria parasite Plasmodium vivax. Nature. 2008; 455:757–63. https://doi.org/10.
1038/nature07327 PMID: 18843361
26. Langmead B, Salzberg SL. Fast gapped-read alignment with Bowtie 2. Nat Methods. 2012; 9:357–9.
https://doi.org/10.1038/nmeth.1923 PMID: 22388286
27. Li H, Handsaker B, Wysoker A, Fennell T, Ruan J, Homer N, et al. The Sequence Alignment/Map format
and SAMtools. Bioinformatics. 2009; 25:2078–9. https://doi.org/10.1093/bioinformatics/btp352 PMID:
19505943
28. McKenna A, Hanna M, Banks E, Sivachenko A, Cibulskis K, Kernytsky A, et al. The Genome Analysis
Toolkit: a MapReduce framework for analyzing next-generation DNA sequencing data. Genome Res.
2010; 20:1297–303. https://doi.org/10.1101/gr.107524.110 PMID: 20644199
29. Cingolani P, Platts A, Wang le L, Coon M, Nguyen T, Wang L, et al. A program for annotating and pre-
dicting the effects of single nucleotide polymorphisms, SnpEff: SNPs in the genome of Drosophila mela-
nogaster strain w1118; iso-2; iso-3. Fly (Austin). 2012; 6:80–92.
30. Danecek P, Auton A, Abecasis G, Albers CA, Banks E, DePristo MA, et al. The variant call format and
VCFtools. Bioinformatics. 2011; 27:2156–8. https://doi.org/10.1093/bioinformatics/btr330 PMID:
21653522
31. Tajima F. Statistical method for testing the neutral mutation hypothesis by DNA polymorphism. Genet-
ics. 1989; 123:585–95. PMID: 2513255
32. Weir B, Cockerham C. Estimating F statistics for the analysis of population structure. Evolution. 1984;
38:1358–70. https://doi.org/10.1111/j.1558-5646.1984.tb05657.x PMID: 28563791
33. Purcell S, Neale B, Todd-Brown K, Thomas L, Ferreira MA, Bender D, et al. PLINK: a tool set for whole-
genome association and population-based linkage analyses. Am J Hum Genet. 2007; 81:559–75.
https://doi.org/10.1086/519795 PMID: 17701901
34. Alexander DH, Lange K. Enhancements to the ADMIXTURE algorithm for individual ancestry estima-
tion. BMC Bioinformatics. 2011; 12:246. https://doi.org/10.1186/1471-2105-12-246 PMID: 21682921
35. Winter DJ, Pacheco MA, Vallejo AF, Schwartz RS, Arevalo-Herrera M, Herrera S, et al. Whole genome
sequencing of field isolates reveals extensive genetic diversity in Plasmodium vivax from Colombia.
PLoS Negl Trop Dis. 2015; 9:e0004252. https://doi.org/10.1371/journal.pntd.0004252 PMID: 26709695
36. Dharia NV, Bright AT, Westenberger SJ, Barnes SW, Batalov S, Kuhen K, et al. Whole-genome
sequencing and microarray analysis of ex-vivo Plasmodium vivax reveal selective pressure on putative
drug resistance genes. Proc Natl Acad Sci USA. 2010; 107:20045–50. https://doi.org/10.1073/pnas.
1003776107 PMID: 21037109
37. Flannery EL, Wang T, Akbari A, Corey VC, Gunawan F, Bright AT, et al. Next-generation sequencing of
Plasmodium vivax patient samples shows evidence of direct evolution in drug-resistance genes. ACS
Infect Dis. 2015; 1:367–79. https://doi.org/10.1021/acsinfecdis.5b00049 PMID: 26719854
38. Chan ER, Menard D, David PH, Ratsimbasoa A, Kim S, Chim P, et al. Whole genome sequencing of
field isolates provides robust characterization of genetic diversity in Plasmodium vivax. PLoS Negl Trop
Dis. 2012; 6:e1811. https://doi.org/10.1371/journal.pntd.0001811 PMID: 22970335
39. Bright AT, Manary MJ, Tewhey R, Arango EM, Wang T, Schork NJ, et al. A high resolution case study
of a patient with recurrent Plasmodium vivax infections shows that relapses were caused by meiotic sib-
lings. PLoS Negl Trop Dis. 2014; 8:e2882. https://doi.org/10.1371/journal.pntd.0002882 PMID:
24901334
40. Frech C, Chen N. Variant surface antigens of malaria parasites: functional and evolutionary insights
from comparative gene family classification and analysis. BMC Genomics. 2013; 14:427. https://doi.
org/10.1186/1471-2164-14-427 PMID: 23805789
41. del Portillo HA, Longacre S, Khouri E, David PH. Primary structure of the merozoite surface antigen 1 of
Plasmodium vivax reveals sequences conserved between different Plasmodium species. Proc Natl
Acad Sci USA. 1991; 88:4030–4. PMID: 2023952
42. Putaporntip C, Jongwutiwes S, Sakihama N, Ferreira MU, Kho WG, Kaneko A, et al. Mosaic organiza-
tion and heterogeneity in frequency of allelic recombination of the Plasmodium vivax merozoite surface
protein-1 locus. Proc Natl Acad Sci USA. 2002; 99:16348–53. https://doi.org/10.1073/pnas.252348999
PMID: 12466500
43. Bastos MS, da Silva-Nunes M, Malafronte RS, Hoffmann EH, Wunderlich G, Moraes SL, et al. Antigenic
polymorphism and naturally acquired antibodies to Plasmodium vivax merozoite surface protein 1 in
rural Amazonians. Clin Vaccine Immunol. 2007; 14:1249–59. https://doi.org/10.1128/CVI.00243-07
PMID: 17699838
44. Simonsen KL, Churchill GA, Aquadro CF. Properties of statistical tests of neutrality for DNA polymor-
phism data. Genetics. 1995; 141:413–29. PMID: 8536987
Plasmodium vivax genomes from the New World
PLOS Neglected Tropical Diseases | https://doi.org/10.1371/journal.pntd.0005824 July 31, 2017 22 / 24

45. MalariaGEN Plasmodium falciparum Community Project. Genomic epidemiology of artemisinin resis-
tant malaria. Elife. 2016; 5: e08714. https://doi.org/10.7554/eLife.08714 PMID: 26943619
46. Mobegi VA, Duffy CW, Amambua-Ngwa A, Loua KM, Laman E, Nwakanma DC, et al. Genome-wide
analysis of selection on the malaria parasite Plasmodium falciparum in West African populations of dif-
fering infection endemicity. Mol Biol Evol. 2014; 31:1490–9. https://doi.org/10.1093/molbev/msu106
PMID: 24644299
47. Taylor JE, Pacheco MA, Bacon DJ, Beg MA, Machado RL, Fairhurst RM, et al. The evolutionary history
of Plasmodium vivax as inferred from mitochondrial genomes: parasite genetic diversity in the Ameri-
cas. Mol Biol Evol. 2013; 30:2050–64. https://doi.org/10.1093/molbev/mst104 PMID: 23733143
48. Ferreira MU, Rodrigues PT. Tracking malaria parasites in the eradication era. Trends Parasitol. 2014;
30:465–6. https://doi.org/10.1016/j.pt.2014.08.003 PMID: 25154542
49. Baniecki ML, Faust AL, Schaffner SF, Park DJ, Galinsky K, Daniels RF, et al. Development of a single
nucleotide polymorphism barcode to genotype Plasmodium vivax infections. PLoS Negl Trop Dis. 2015;
9:e0003539. https://doi.org/10.1371/journal.pntd.0003539 PMID: 25781890
50. Orjuela-Sanchez P, de Santana Filho FS, Machado-Lima A, Chehuan YF, Costa MR, Alecrim MG,
et al. Analysis of single-nucleotide polymorphisms in the crt-o and mdr1 genes of Plasmodium vivax
among chloroquine-resistant isolates from the Brazilian Amazon region. Antimicrob Agents Chemother
2009; 53:3561–4. https://doi.org/10.1128/AAC.00004-09 PMID: 19451296
51. Nomura T, Carlton JM, Baird JK, del Portillo HA, Fryauff DJ, Rathore D, et al. Evidence for different
mechanisms of chloroquine resistance in 2 Plasmodium species that cause human malaria. J Infect
Dis. 2001; 183:1653–61. https://doi.org/10.1086/320707 PMID: 11343215
52. Leprohon P, Legare D, Ouellette M. ABC transporters involved in drug resistance in human parasites.
Essays Biochem. 2011; 50:121–44. https://doi.org/10.1042/bse0500121 PMID: 21967055
53. Carter KH, Singh P, Mujica OJ, Escalada RP, Ade MP, Castellanos LG, et al. Malaria in the Americas:
trends from 1959 to 2011. Am J Trop Med Hyg. 2015; 92:302–16. https://doi.org/10.4269/ajtmh.14-
0368 PMID: 25548378
54. Chang HH, Park DJ, Galinsky KJ, Schaffner SF, Ndiaye D, Ndir O, et al. Genomic sequencing of Plas-
modium falciparum malaria parasites from Senegal reveals the demographic history of the population.
Mol Biol Evol. 2012; 29:3427–39. https://doi.org/10.1093/molbev/mss161 PMID: 22734050
55. Neafsey DE, Schaffner SF, Volkman SK, Park D, Montgomery P, Milner DA Jr, et al. Genome-wide
SNP genotyping highlights the role of natural selection in Plasmodium falciparum population diver-
gence. Genome Biol. 2008; 9:R171. https://doi.org/10.1186/gb-2008-9-12-r171 PMID: 19077304
56. Samad H, Coll F, Preston MD, Ocholla H, Fairhurst RM, Clark TG. Imputation-Based Population Genet-
ics Analysis of Plasmodium falciparum Malaria Parasites. PLoS genetics. 2015; 11:1005131.
57. Echeverry DF, Nair S, Osorio L, Menon S, Murillo C, Anderson TJ. Long term persistence of clonal
malaria parasite Plasmodium falciparum lineages in the Colombian Pacific region. BMC Genet. 2013;
14:2. https://doi.org/10.1186/1471-2156-14-2 PMID: 23294725
58. Anderson TJ, Haubold B, Williams JT, Estrada-Franco JG, Richardson L, Mollinedo R, et al. Microsatel-
lite markers reveal a spectrum of population structures in the malaria parasite Plasmodium falciparum.
Mol Biol Evol. 2000; 17:1467–82. PMID: 11018154
59. Machado RL, Povoa MM, Calvosa VS, Ferreira MU, Rossit AR, dos Santos EJ, et al. Genetic structure
of Plasmodium falciparum populations in the Brazilian Amazon region. J Infect Dis. 2004; 190:1547–55.
https://doi.org/10.1086/424601 PMID: 15478058
60. Griffing SM, Mixson-Hayden T, Sridaran S, Alam MT, McCollum AM, Cabezas C, et al. South American
Plasmodium falciparum after the malaria eradication era: clonal population expansion and survival of
the fittest hybrids. PLoS One. 2011; 6:e23486. https://doi.org/10.1371/journal.pone.0023486 PMID:
21949680
61. Griffing SM, Viana GM, Mixson-Hayden T, Sridaran S, Alam MT, de Oliveira AM, Barnwell JW, et al.
Historical shifts in Brazilian P. falciparum population structure and drug resistance alleles. PLoS One.
2013; 8:e58984. https://doi.org/10.1371/journal.pone.0058984 PMID: 23554964
62. Duffy CW, Assefa SA, Abugri J, Amoako N, Owusu-Agyei S, Anyorigiya T, et al. Comparison of geno-
mic signatures of selection on Plasmodium falciparum between different regions of a country with high
malaria endemicity. BMC Genomics. 2015; 16:527. https://doi.org/10.1186/s12864-015-1746-3 PMID:
26173872
63. Tanabe K, Mita T, Jombart T, Eriksson A, Horibe S, Palacpac N, et al. Plasmodium falciparum accom-
panied the human expansion out of Africa. Curr Biol. 2010; 20:1283–9. https://doi.org/10.1016/j.cub.
2010.05.053 PMID: 20656209
Plasmodium vivax genomes from the New World
PLOS Neglected Tropical Diseases | https://doi.org/10.1371/journal.pntd.0005824 July 31, 2017 23 / 24
64. Molina-Cruz A, Zilversmit MM, Neafsey DE, Hartl DL, Barillas-Mury C. Mosquito vectors and the globali-
zation of Plasmodium falciparum malaria. Annu Rev. Genet 2016; 23; 50:447–65. https://doi.org/10.
1146/annurev-genet-120215-035211 PMID: 27732796
65. Wootton JC, Feng X, Ferdig MT, Cooper RA, Mu J, Baruch DI, et al. Genetic diversity and chloroquine
selective sweeps in Plasmodium falciparum. Nature. 2002; 418:320–3. https://doi.org/10.1038/
nature00813 PMID: 12124623
66. Nair S, Williams JT, Brockman A, Paiphun L, Mayxay M, Newton PN, et al. A selective sweep driven by
pyrimethamine treatment in Southeast Asian malaria parasites. Mol Biol Evol. 2003; 20:1526–36.
https://doi.org/10.1093/molbev/msg162 PMID: 12832643
67. Neafsey DE, Galinsky K, Jiang RH, Young L, Sykes SM, Saif S, et al. The malaria parasite Plasmodium
vivax exhibits greater genetic diversity than Plasmodium falciparum. Nat Genet. 2012; 44:1046–50.
https://doi.org/10.1038/ng.2373 PMID: 22863733
68. Goncalves LA, Cravo P, Ferreira MU. Emerging Plasmodium vivax resistance to chloroquine in South
America: an overview. Mem Inst Oswaldo Cruz. 2014; 109:534–9. https://doi.org/10.1590/0074-
0276130579 PMID: 25184999
Plasmodium vivax genomes from the New World
PLOS Neglected Tropical Diseases | https://doi.org/10.1371/journal.pntd.0005824 July 31, 2017 24 / 24