C D (Not drawn to scale) - hmxearthscience.com It is inferred that during the early Archean Era the...
84
Line of sight Observer (Not drawn to scale)
Transcript of C D (Not drawn to scale) - hmxearthscience.com It is inferred that during the early Archean Era the...

P.S./E. Sci.–June ’08 [4]
12 Diagram 1 shows the Moon in its orbit at four positions labeled A, B, C, and D. Diagram 2 shows a phaseof the Moon as viewed from New York State.
At which labeled Moon position would the phase of the Moon shown in diagram 2 beobserved from New York State?(1) A (3) C(2) B (4) D
13 The diagram below shows an observer measuring the altitude of Polaris.
What is the latitude of the observer?(1) 20° N (3) 70° N(2) 20° S (4) 70° S
Line of sight
Observer
(Not drawn to scale)
AB
NorthPole
(Not drawn to scale)
Diagram 1
Diagram 2
Earth
Sun’srays
DC

Part A
Answer all questions in this part.
Directions (1–35): For each statement or question, write on your separate answer sheet the number of theword or expression that, of those given, best completes the statement or answers the question. Some questionsmay require the use of the Earth Science Reference Tables.
1 Evidence that the universe is expanding is bestprovided by the(1) red shift in the light from distant galaxies(2) change in the swing direction of a Foucault
pendulum on Earth(3) parallelism of Earth’s axis in orbit(4) spiral shape of the Milky Way Galaxy
2 Which object forms by the contraction of a largesphere of gases causing the nuclear fusion oflighter elements into heavier elements?(1) comet (3) star(2) planet (4) moon
3 In New York State, summer is warmer than winter because in summer New York State has(1) fewer hours of daylight and receives low-
angle insolation(2) fewer hours of daylight and receives high-
angle insolation(3) more hours of daylight and receives low-angle
insolation(4) more hours of daylight and receives high-
angle insolation
4 The diagram below shows an observer on Earthviewing the star Polaris.
What is this observer’s latitude?(1) 38° N (3) 52° N(2) 38° S (4) 52° S
5 The arrows in the diagram below represent themovement of water in the water cycle.
Which arrow represents the process of trans piration?(1) A (3) C(2) B (4) D
6 Which statement best describes the position ofthe Sun at sunrise and sunset as seen by anobserver in New York State on June 21?(1) The Sun rises north of due east and sets north
of due west.(2) The Sun rises south of due east and sets south
of due west.(3) The Sun rises north of due east and sets south
of due west.(4) The Sun rises south of due east and sets north
of due west.
7 On a cold winter day, the air temperature is 2°Cand the wet-bulb temperature is –1°C. What isthe relative humidity at this location?(1) 6% (3) 51%(2) 37% (4) 83%
A
CD
B
Polaris
Horizon
Altitudeof 52°
P.S./E. Sci.–June ’09 [2]

1 Which statement correctly compares the size,composition, and density of Neptune to Earth?(1) Neptune is smaller, more gaseous, and less dense.(2) Neptune is larger, more gaseous, and less dense.(3) Neptune is smaller, more solid, and more dense.(4) Neptune is larger, more solid, and more dense.
2 A person in New York State worked outdoors insunlight for several hours on a day in July. Whichtype of clothing should the person have worn toabsorb the least electromagnetic radiation?(1) dark colored with a rough surface(2) dark colored with a smooth surface(3) light colored with a rough surface(4) light colored with a smooth surface
3 The diagram below shows an observer on Earthmeasuring the altitude of Polaris.
What is the latitude of this observer?(1) 43° N (3) 47° N(2) 43° S (4) 47° S
4 The diagram below represents Earth at a specificposition in its orbit as viewed from space. Theshaded area represents nighttime.
Which Earth latitude receives the greatest inten-sity of insolation when Earth is at the positionshown in the diagram?
(1) 0° (3) 66 ° N
(2) 23 ° N (4) 90° N
5 Surface ocean currents curve to the right in theNorthern Hemisphere because(1) the Moon spins on its axis(2) the Moon travels in an orbit around Earth(3) Earth spins on its axis(4) Earth travels in an orbit around the Sun
6 Which star color indicates the hottest star surfacetemperature?(1) blue (3) yellow(2) white (4) red
7 What is the dewpoint temperature when the dry-bulb temperature is 12°C and the wet-bulb temperature is 4°C?(1) –9°C (3) 8°C(2) 19°C (4) 4°C
12
12
23 o N
23 o S
Equator
66 o S
66 o N
Sun’srays
NorthPole
SouthPole
Horizon
43°
47°
PolarisZenith
P.S./E. Sci.–Aug. ’03 [2]
Part A
Answer all questions in this part.
Directions (1–35): For each statement or question, write on your separate answer sheet the number of theword or expression that, of those given, best completes the statement or answers the question. Some questionsmay require the use of the Earth Science Reference Tables.

P.S./E. Sci.–June ’06 [2]
Part A
Answer all questions in this part.
Directions (1–35): For each statement or question, write on your separate answer sheet the number of theword or expression that, of those given, best completes the statement or answers the question. Some questionsmay require the use of the Earth Science Reference Tables.
1 Which object is closest to Earth?(1) the Sun (3) the Moon(2) Venus (4) Mars
2 The diagram below shows an observer on Earthmeasuring the altitude of Polaris.
What is the latitude of this observer?(1) 90° N (3) 43° N(2) 66.5° N (4) 23.5° N
3 What is the minimum water velocity needed in astream to maintain the transportation of thesmallest boulder?(1) 100 cm/sec (3) 300 cm/sec(2) 200 cm/sec (4) 500 cm/sec
4 Earth’s early atmosphere formed during theEarly Archean Era. Which gas was generallyabsent from the atmosphere at that time?(1) water vapor (3) nitrogen(2) carbon dioxide (4) oxygen
5 The diagram below shows the Moon orbitingEarth, as viewed from space above Earth’s NorthPole. The Moon is shown at eight positions in itsorbit.
Spring ocean tides occur when the difference inheight between high tide and low tide is greatest.At which two positions of the Moon will springtides occur on Earth?(1) 1 and 5 (3) 3 and 7(2) 2 and 6 (4) 4 and 8
6 Compared to other groups of stars, the group thathas relatively low luminosities and relatively lowtemperatures is the (1) Red Dwarfs (3) Red Giants(2) White Dwarfs (4) Blue Supergiants
7 Which sequence correctly lists the relative sizesfrom smallest to largest?(1) our solar system, universe, Milky Way Galaxy(2) our solar system, Milky Way Galaxy, universe(3) Milky Way Galaxy, our solar system, universe(4) Milky Way Galaxy, universe, our solar system
Sun’srays5
7
1
3
Earth
(Not drawn to scale)
4
6 8
2
Moon’sorbit
NorthPole
Polaris
Horizon
Zenith23.5°
66.5°

P.S./E. Sci.–Jan. ’04 [11] [OVER]
44 The field map below shows air temperature measurements, in degrees Celsius, taken at the same elevationwithin a closed room. Two reference points, A and B, are shown.
Which temperature field map shows correctly drawn isotherms?
20A
21 22 24 28B
21 22 24 25 26
20 22 25 25 25
18 21 22 24 25
19 21 23 23 24
( 2 )
20A
21 22 24 28B
21 22 24 25 26
20 22 25 25 25
18 21 22 24 25
19 21 23 23 24
( 4 )
20A
21 22 24 28B
21 22 24 25 26
20 22 25 25 25
18 21 22 24 25
19 21 23 23 24
( 1 )
20A
21 22 24 28B
21 22 24 25 26
20 22 25 25 25
18 21 22 24 25
19 21 23 23 24
( 3 )
20A
21 22 24 28B
21 22 24 25 26
20 22 25 25 25
18 21 22 24 25
19 21 23 23 24
Distance scale
Meters0 1 2 3 4

Base your answers to questions 72 through 74 on the map below, the graph on the next page, and yourknowledge of Earth science. The map shows the length of the growing season in New York State, expressed indays. The growing season is the average number of days between the last frost in spring and the first frost in fall.The graph line shows the relationship between the latitudes of Riverhead, New York; Albany, New York; andMassena, New York; and the length of the growing season at these three locations.
Lake Ontario
Length of Growing Season (in days)
165
150 150
120
105
90
150
165
150120
210
180195
195180
135
150135120120135150165
Massena
Riverhead
135
165
165
Elmira
Albany
135
180Oswego
P.S./E. Sci.–Jan. ’05 [24]

7 It is inferred that during the early Archean Erathe atmosphere of Earth contained water vapor,carbon dioxide, nitrogen, and other gases in smallamounts. These gases probably came from(1) precipitation of groundwater(2) volcanic eruptions(3) evaporation of Paleozoic oceans(4) convection currents in the mantle
8 Which ocean current flows northeast along theeastern coast of North America?(1) Gulf Stream (3) California(2) North Equatorial (4) Labrador
9 Which type of land surface would probably reflectthe most incoming solar radiation?(1) light colored and smooth(2) light colored and rough(3) dark colored and smooth(4) dark colored and rough
10 There is evidence that an asteroid or a cometcrashed into the Gulf of Mexico at the end of theMesozoic Era. Consequences of this impactevent may explain the(1) extinction of many kinds of marine animals,
including trilobites(2) extinction of ammonoids and dinosaurs(3) appearance of the earliest birds and mammals(4) appearance of great coal-forming forests and
insects
11 What is the approximate location of the CanaryIslands hot spot?(1) 32° S 18° W (3) 32° N 18° W(2) 32° S 18° E (4) 32° N 18° E
12 How long would it take for the first S-wave toarrive at a seismic station 4,000 kilometers awayfrom the epicenter of an earthquake?(1) 5 min 40 sec (3) 12 min 40 sec(2) 7 min 0 sec (4) 13 min 20 sec
13 Which New York State river flows generallysouthward?(1) St. Lawrence River (3) Genesee River(2) Niagara River (4) Hudson River
14 The map below shows the stream drainage pat-terns for a region of Earth’s surface. Points A, B,C, and D are locations in the region.
The highest elevation most likely exists at point(1) A (3) C(2) B (4) D
15 Outwash plains are formed as a result of deposi-tion by(1) landslides(2) ocean waves(3) winds from hurricanes(4) meltwater from glaciers
16 A stream with a velocity of 100 centimeters persecond flows into a lake. Which sediment-size particles would the stream most likely deposit firstas it enters the lake?(1) boulders (3) pebbles(2) cobbles (4) sand
•A •B
•C
D•
Lake
0 10 20 km
Lake
Lake
Lake
P.S./E. Sci.–Jan. ’05 [3] [OVER]

Base your answers to questions 47 and 48 on the topographic maps and block diagrams of two landscaperegions shown below. The block diagrams show a three-dimensional view of the topographic maps directlyabove them. Elevations are measured in feet. Points A, B, C, and D are locations on Earth’s surface.
47 Which contour interval is used on both topographic maps?(1) 10 ft (3) 30 ft(2) 20 ft (4) 40 ft
48 A stream begins to flow downhill from point D toward the depression. After a period of time, the depression fills with water. Overflowing water from the depression moves downhill toward point C. Which topographic map shows the mostlikely resulting change in the contour lines?
290
( 3 )
CD290
280
300
300
310
330300
( 4 )
CD
280
300
310
330
( 2 )
CD290
300
300300
280
310
330
( 1 )
CD290
300
300280
300
310
330
300
300
280
AB
CD
AB
280300
290300
300300
280
290
300
300
Landscape 1
C
Landscape 2
D30
0
310
330
P.S./E. Sci.–Jan ’07 [15] [OVER]

Base your answers to questions 38 and 39 on the isoline map below, which shows the average yearlyprecipitation, in inches, across New York State.
38 Which New York State landscape region receives the greatest average yearlyprecipitation?(1) Catskills (3) Adirondack Mountains(2) Tug Hill Plateau (4) Taconic Mountains
39 Approximately how many inches of average yearly precipitation does Rochester, NewYork, receive?(1) 26 (3) 38(2) 30 (4) 42
44
48
40
32
28
36
44
48
44
52
48
44
4044
4436
32
36
40
4444 44
32
36
48 484448
60
48
56
52
40 40
3652
44
P.S./E. Sci.–August ’07 [10]

47 The temperature field map below represents surface air temperatures within a park. The location of a lakewithin the park is also indicated.
Which graph best represents the temperature profile along a straight line from pointA to point B?
Distance
( 1 )
Tem
pera
ture
(°C
)
Point A Point B
Distance
( 2 )
Tem
pera
ture
(°C
)
Point A Point B
Distance
( 3 )
Tem
pera
ture
(°C
)
Point A Point B
Distance
( 4 )
Tem
pera
ture
(°C
)
Point A Point B
20°C
26°C
LakePoint B
Point A
24°C26°C
E
P.S./E. Sci.–Jan. ’03 [17] [OVER]

P.S./E. Sci.–Jan. ’10 [6]
Base your answers to questions 28 and 29 on the diagram below, which shows air movement over amountain range. The arrows indicate the direction of airflow. Points 1 through 3 represent locations on Earth’ssurface.
28 Compared to the climate at location 1, the climate at location 3 is(1) cooler and drier (3) warmer and drier(2) cooler and wetter (4) warmer and wetter
29 Cloud formation at location 2 is the direct result of air that is rising,(1) expanding, and cooling (3) compressing, and cooling(2) expanding, and warming (4) compressing, and warming
30 The diagram below shows the latitude and longitude lines on Earth. Points A and B are locations on Earth’ssurface.
If it is 4 a.m. at location A, what time is it at location B?(1) 10 a.m. (3) 6 a.m.(2) 2 a.m. (4) 8 a.m.
MountainOcean
Clouds
3
2
1

Part A
Answer all questions in this part.
Directions (1–35): For each statement or question, write on your separate answer sheet the number of theword or expression that, of those given, best completes the statement or answers the question. Some questionsmay require the use of the 2010 Edition Reference Tables for Physical Setting/Earth Science.
1 The diagram below shows latitude measurementsevery 10 degrees and longitude measurementsevery 15 degrees.
What is the latitude and longitude of point X?(1) 40° S 45° E (3) 60° S 30° W(2) 50° N 45° W (4) 75° N 30° E
2 In which sequence are the items listed from leasttotal mass to greatest total mass?(1) solar system, Milky Way, universe(2) Milky Way, solar system, universe(3) universe, Milky Way, solar system(4) Milky Way, universe, solar system
3 The red shift of visible light waves that isobserved by astronomers on Earth is used todetermine the(1) sizes of nearby galaxies(2) relative motions of distant galaxies(3) densities of the planets(4) rotation periods of the planets
4 At which New York State location would anobserver measure the highest altitude of Polaris?(1) New York City (3) Niagara Falls(2) Slide Mountain (4) Plattsburgh
5 How many days are required for the Moon to gofrom one full-Moon phase to the next full-Moonphase when viewed from Earth?(1) 24 (3) 29.5(2) 27.3 (4) 365
6 If the average distance between Earth and theSun were doubled, what changes would occur inthe Sun’s gravitational pull on Earth and Earth’speriod of revolution?(1) Gravitational pull would decrease and period
of revolution would increase.(2) Gravitational pull would decrease and period
of revolution would decrease.(3) Gravitational pull would increase and period
of revolution would increase.(4) Gravitational pull would increase and period
of revolution would decrease.
7 The Foucault pendulum provides evidence ofEarth’s(1) revolution around the Sun in a geocentric
solar system(2) revolution around the Sun in a heliocentric
solar system(3) rotation on its axis in a geocentric solar system(4) rotation on its axis in a heliocentric solar system
8 The first S-wave arrived at a seismograph station11 minutes after an earthquake occurred. Howlong after the arrival of the first P-wave did thisfirst S-wave arrive?(1) 3 min 15 s (3) 6 min 05 s(2) 4 min 55 s (4) 9 min 00 s
North Pole
Prim
em
erid
ian
Equator
X
P.S./E. Sci.–Jan. ’10 [2]

P.S./E. Sci.–Jan. ’06 [2]
Part A
Answer all questions in this part.
Directions (1–35): For each statement or question, write on your separate answer sheet the number of theword or expression that, of those given, best completes the statement or answers the question. Some questionsmay require the use of the Earth Science Reference Tables.
1 Which event takes the most time?(1) one revolution of Earth around the Sun(2) one revolution of Venus around the Sun(3) one rotation of the Moon on its axis(4) one rotation of Venus on its axis
2 Compared to the Jovian planets in our solarsystem, Earth is (1) less dense and closer to the Sun(2) less dense and farther from the Sun(3) more dense and closer to the Sun(4) more dense and farther from the Sun
3 A Foucault pendulum appears to change itsdirection of swing due to the (1) tilt of Earth’s axis (2) spin of Earth on its axis (3) deflection of Earth’s planetary winds (4) movement of Earth in its orbit around the
Sun
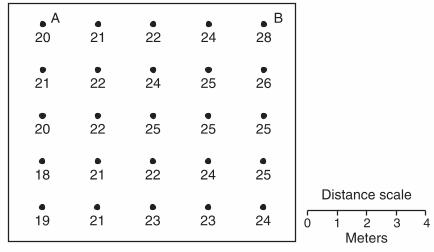
4 The lines on which set of views best representEarth’s latitude system?
5 The diagram below shows a satellite in fourdifferent positions as it revolves around a planet.
Which graph best represents the changes in thissatellite’s orbital velocity as it revolves around theplanet?
A
B
C
Planet
(Not drawn to scale)
SatelliteD
Equatorialview
Polarview
Equatorialview
Polarview
Polarview
Equatorialview
Equatorialview
Polarview
( 1 ) ( 3 )
( 2 ) ( 4 )
A B C D
Orb
ital V
eloc
ity
Satellite Position( 3 )
A B C
Orb
ital V
eloc
ity
Satellite Position( 2 )
D
A B C D
Orb
ital V
eloc
ity
Satellite Position( 1 )
A B C D
Orb
ital V
eloc
ity
Satellite Position( 4 )

P.S. E./Sci.–June ’01 [3] [OVER]
4 The diagram below represents two planets in oursolar system drawn to scale, Jupiter and planet A.
Planet A most likely represents
(1) Earth (3) Saturn(2) Venus (4) Uranus
5 The graph below represents the brightness andtemperature of stars visible from Earth.
Which location on the graph best represents astar with average brightness and temperature?
(1) A (3) C(2) B (4) D
6 The length of an Earth year is based on Earth’s
(1) rotation of 15°/hr(2) revolution of 15°/hr(3) rotation of approximately 1°/day(4) revolution of approximately 1°/day
7 Earth’s hydrosphere is best described as the
(1) solid outer layer of Earth(2) liquid outer layer of Earth(3) magma layer located below Earth’s stiffer
mantle(4) gaseous layer extending several hundred
kilometers from Earth into space
8 The passage of the Moon into Earth’s shadowcauses a
(1) lunar eclipse (3) new Moon(2) solar eclipse (4) full Moon
9 The diagram below shows the latitude-longitudegrid on an Earth model. Points A and B are loca-tions on the surface.
On Earth, the solar time difference betweenpoint A and point B would be
(1) 1 hour (3) 12 hours(2) 5 hours (4) 24 hours
10 The diagram below represents part of Earth’slatitude-longitude system.
What is the latitude and longitude of point L?
(1) 5° E 30° N (3) 5° N 30° E(2) 5° W 30° S (4) 5° S 30° W
20°
45° 30° 15° 0° 15° 30° 45°30°
20°
10°
0°
10°
30°
N
L
0°
15°
30°
45°
60°
75°
15°
30°
15°
15° 0°
30° 45° 60° 75°
90°
B A
B
Lum
inos
ity
Temperature
Bright
DimHot Cool
Supergiants
DC
AWhiteDwarfs
Main Sequence
Giants
Planet AJupiter

Base your answers to questions 80 through 83 on the world map shown below and on your knowledge ofEarth science. Letters A through H represent locations on Earth’s surface.
80 Explain why most earthquakes that occur in the crust beneath location B are shallower than most earthquakes that occur in the crust beneath location C. [1]
81 Explain why location A has a greater probability of experiencing a major earthquakethan location D. [1]
82 Explain why a volcanic eruption is more likely to occur at location E than at location F.[1]
83 Explain why the geologic age of the oceanic bedrock increases from location G tolocation H. [1]
70
60
50
403020100
70
60
50
40302010
70
60
50
403020100
70
60
50
40302010
120 140 160 180 160 140 120 100 80 60 40 20 0 20 40 60 80 100 120
120 140 160 180 160 140 120 100 80 60 40 20 0 20 40 60 80 100 120
Asia
Australia
NorthAmerica
SouthAmerica
Antarctica Antarctica
Atlantic OceanAfrica
AsiaEurope
Indian Ocean
Pacific Ocean
HawaiianIslands
A
D
H
B
G
F
C
E
P.S./E. Sci.–June ’05 [22]

P.S./E. Sci.–June ’07 [11] [OVER]
Base your answers to questions 36 through 38 on the world map below. Letters A through D represent locations on Earth’s surface.
36 At which location could an observer not see Polaris in the night sky at any time during the year?(1) A (3) C(2) B (4) D
37 Which location receives 12 hours of daylight and 12 hours of darkness on June 21?(1) A (3) C(2) B (4) D
38 At which location on December 21 is the Sun directly overhead at solar noon?(1) A (3) C(2) B (4) D
North
latit
ude
Sout
h la
titud
e
A
B
C
D
160° 140° 120° 80° 40° 20° 0°100° 60°180° 20° 40° 60° 80° 100° 120° 140° 160° 180°
75°
60°
30°
0°
30°
75°
60°
30°
0°
30°
West longitude East longitude
160° 140° 120° 80° 40° 20° 0°100° 60°180° 20° 40° 60° 80° 100° 120° 140° 160° 180°
Part B–1
Answer all questions in this part.
Directions (36–50): For each statement or question, write on your separate answer sheet the number of theword or expression that, of those given, best completes the statement or answers the question. Some questionsmay require the use of the Earth Science Reference Tables.

P.S./E. Sci.–June ’08 [7] [OVER]
20 On the map below, the darkened areas represent locations where living corals currently exist. The arrowpoints to a location where coral fossils have been found in Devonian-age bedrock in New York State.
Devonian-age coral fossils found in some New York State bedrock are not located inthe same general region that present-day corals are living because during theDevonian Period(1) corals migrated to New York State(2) corals lived everywhere on Earth (3) New York State was closer to the equator (4) New York State had a colder climate
21 Which index fossil may be found in the surface bedrock near Ithaca, New York?

8 Letters A, B, C, D, and X on the map below represent locations on Earth. The map shows the latitude-longitude grid.
Solar time is based on the position of the Sun. If the solar time is 1 p.m. at location X, at which location is the solar time 5 p.m.?(1) A (3) C(2) B (4) D
9 The table below shows the duration of insolation (hours of daylight) measured by four observers, W, X, Y,and Z, at four different Earth latitudes on both March 21 and June 21. There were clear skies at all four latitudes on both days.
Which observer was located at the Equator?(1) W (3) Y(2) X (4) Z
Africa
SouthAmerica
NorthAmerica
Europe
Australia
Asia
C
DB
XA
180° 120°120°90° 90° 60° 30° 0° 30° 60° E150° 150°
80° N
60°
30°
0°
60° S
30°
P.S./E. Sci.–Aug. ’03 [3] [OVER]
Observer Duration of InsolationMarch 21
Duration of InsolationJune 21
W 12 hr 0 hr
X 12 hr 12 hr
Y 12 hr 18 hr
Z 12 hr 24 hr

P.S. E./Sci.–June ’01 [3] [OVER]
4 The diagram below represents two planets in oursolar system drawn to scale, Jupiter and planet A.
Planet A most likely represents
(1) Earth (3) Saturn(2) Venus (4) Uranus
5 The graph below represents the brightness andtemperature of stars visible from Earth.
Which location on the graph best represents astar with average brightness and temperature?
(1) A (3) C(2) B (4) D
6 The length of an Earth year is based on Earth’s
(1) rotation of 15°/hr(2) revolution of 15°/hr(3) rotation of approximately 1°/day(4) revolution of approximately 1°/day
7 Earth’s hydrosphere is best described as the
(1) solid outer layer of Earth(2) liquid outer layer of Earth(3) magma layer located below Earth’s stiffer
mantle(4) gaseous layer extending several hundred
kilometers from Earth into space
8 The passage of the Moon into Earth’s shadowcauses a
(1) lunar eclipse (3) new Moon(2) solar eclipse (4) full Moon
9 The diagram below shows the latitude-longitudegrid on an Earth model. Points A and B are loca-tions on the surface.
On Earth, the solar time difference betweenpoint A and point B would be
(1) 1 hour (3) 12 hours(2) 5 hours (4) 24 hours
10 The diagram below represents part of Earth’slatitude-longitude system.
What is the latitude and longitude of point L?
(1) 5° E 30° N (3) 5° N 30° E(2) 5° W 30° S (4) 5° S 30° W
20°
45° 30° 15° 0° 15° 30° 45°30°
20°
10°
0°
10°
30°
N
L
0°
15°
30°
45°
60°
75°
15°
30°
15°
15° 0°
30° 45° 60° 75°
90°
B A
B
Lum
inos
ity
Temperature
Bright
DimHot Cool
Supergiants
DC
AWhiteDwarfs
Main Sequence
Giants
Planet AJupiter
P.S./E. Sci.–Jan. ’06 [2]
Part A
Answer all questions in this part.
Directions (1–35): For each statement or question, write on your separate answer sheet the number of theword or expression that, of those given, best completes the statement or answers the question. Some questionsmay require the use of the Earth Science Reference Tables.
1 Which event takes the most time?(1) one revolution of Earth around the Sun(2) one revolution of Venus around the Sun(3) one rotation of the Moon on its axis(4) one rotation of Venus on its axis
2 Compared to the Jovian planets in our solarsystem, Earth is (1) less dense and closer to the Sun(2) less dense and farther from the Sun(3) more dense and closer to the Sun(4) more dense and farther from the Sun
3 A Foucault pendulum appears to change itsdirection of swing due to the (1) tilt of Earth’s axis (2) spin of Earth on its axis (3) deflection of Earth’s planetary winds (4) movement of Earth in its orbit around the
Sun
4 The lines on which set of views best representEarth’s latitude system?
5 The diagram below shows a satellite in fourdifferent positions as it revolves around a planet.
Which graph best represents the changes in thissatellite’s orbital velocity as it revolves around theplanet?
A
B
C
Planet
(Not drawn to scale)
SatelliteD
Equatorialview
Polarview
Equatorialview
Polarview
Polarview
Equatorialview
Equatorialview
Polarview
( 1 ) ( 3 )
( 2 ) ( 4 )
A B C D
Orb
ital V
eloc
ity
Satellite Position( 3 )
A B C
Orb
ital V
eloc
ity
Satellite Position( 2 )
D
A B C D
Orb
ital V
eloc
ity
Satellite Position( 1 )
A B C D
Orb
ital V
eloc
ity
Satellite Position( 4 )

11 Energy is transferred from the Sun to Earthmainly by(1) molecular collisions(2) density currents(3) electromagnetic waves(4) red shifts
12 Which surface ocean current transports warmwater to higher latitudes?(1) Labrador Current (3) Gulf Stream(2) Falkland Current (4) West Wind Drift
13 Which factor has the greatest influence on theweathering rate of Earth’s surface bedrock?(1) local air pressure(2) angle of insolation(3) age of the bedrock(4) regional climate
14 Compared to dull and rough rock surfaces, shinyand smooth rock surfaces are most likely tocause sunlight to be(1) reflected (3) scattered(2) refracted (4) absorbed
9 Jamestown received more rainfall per year thanElmira. A reason for this difference is thatJamestown is located(1) closer to a large body of water(2) at a higher latitude(3) at a lower elevation(4) in the prevailing southerly wind belt
10 Which of these locations had the lowest averageannual precipitation?(1) Kingston (3) Old Forge(2) New York City (4) Plattsburgh
Base your answers to questions 9 and 10 on the field map below, which shows the average annual precipi-tation in New York State for the past 25 years. Isoline values represent inches per year.
0 50 miles
0 50 kilometers
N
44
44
4456
40
36
3240
3652
4844
48
48
48
4444
48
40
36
40
4852
44
40
3232
28
4444 36
4452
44
P.S. E./Sci.–Jan. ’02 [3] [OVER]

P.S./E. Sci.–Aug. ’05 [2]
Part A
Answer all questions in this part.
Directions (1–35): For each statement or question, write on your separate answer sheet the number of theword or expression that, of those given, best completes the statement or answers the question. Some questionsmay require the use of the Earth Science Reference Tables.
1 Compared to Earth’s solar system, the universe isinferred to be (1) younger and larger (3) older and larger(2) younger and smaller (4) older and smaller
2 Terrestrial planets move more rapidly in theirorbits than the Jovian planets because terrestrialplanets are(1) rotating on a tilted axis(2) more dense(3) more massive(4) closer to the Sun
3 Which event is a direct result of Earth’s revolu-tion?(1) the apparent deflection of winds (2) the changing of the Moon phases (3) the seasonal changes in constellations viewed
in the night sky(4) the daily rising and setting of the Sun
4 The cyclic rise and fall of ocean tides on Earth isprimarily caused by Earth’s rotation and the(1) temperature differences in ocean currents(2) revolution of Earth around the Sun(3) direction of Earth’s planetary winds(4) gravitational attraction of the Moon and the
Sun
5 The apparent change in direction of a swingingFoucault pendulum is the result of the (1) rotation of Earth(2) revolution of Earth(3) tilt of Earth’s axis(4) shape of Earth’s orbit
6 Which statement about Polaris is best illustratedby the diagrams shown below?
(1) Polaris is located in a winter constellation.(2) Polaris is located at the zenith at each location.(3) Polaris’ apparent movement through the sky
follows a south-to-north orientation.(4) Polaris’ altitude is equal to a location’s latitude.
At New Orleans, Louisiana
Polaris
30°
At North Pole
To Polaris
90°
Polaris
At Equator

1 Which diagram correctly shows the apparent motion of Polaris from sunset to midnight for an observer innorthern Canada?
Sunsetposition
( 1 )
SMidnightposition
W
E
Sunset position
( 2 )
S
W
E
(No apparent motion)
( 4 )
S
W
E
Sunset and midnight position
( 3 )
W
ES
Midnight position
Midnight positionSunset position
N
N N
N
= Polaris
Key
Apparent path of Polaris
P.S./E. Sci.–Jan. ’03 [2]
Part A
Answer all questions in this part.
Directions (1–35): For each statement or question, write on your separate answer sheet the number of theword or expression that, of those given, best completes the statement or answers the question. Some questionsmay require the use of the Earth Science Reference Tables.
2 Earth’s orbital velocity is slowest on July 5 because(1) the Moon is closest to Earth(2) Earth’s distance from the Sun is greatest (3) Earth, the Moon, and the Sun are located
along a straight line in space (4) the highest maximum temperatures occur in
the Northern Hemisphere
3 Three planets that are relatively large, gaseous,and of low density are(1) Mercury, Jupiter, and Saturn(2) Venus, Jupiter, and Neptune(3) Mars, Jupiter, and Uranus(4) Jupiter, Saturn, and Uranus

P.S./E. Sci.–Aug. ’05 [2]
Part A
Answer all questions in this part.
Directions (1–35): For each statement or question, write on your separate answer sheet the number of theword or expression that, of those given, best completes the statement or answers the question. Some questionsmay require the use of the Earth Science Reference Tables.
1 Compared to Earth’s solar system, the universe isinferred to be (1) younger and larger (3) older and larger(2) younger and smaller (4) older and smaller
2 Terrestrial planets move more rapidly in theirorbits than the Jovian planets because terrestrialplanets are(1) rotating on a tilted axis(2) more dense(3) more massive(4) closer to the Sun
3 Which event is a direct result of Earth’s revolu-tion?(1) the apparent deflection of winds (2) the changing of the Moon phases (3) the seasonal changes in constellations viewed
in the night sky(4) the daily rising and setting of the Sun
4 The cyclic rise and fall of ocean tides on Earth isprimarily caused by Earth’s rotation and the(1) temperature differences in ocean currents(2) revolution of Earth around the Sun(3) direction of Earth’s planetary winds(4) gravitational attraction of the Moon and the
Sun
5 The apparent change in direction of a swingingFoucault pendulum is the result of the (1) rotation of Earth(2) revolution of Earth(3) tilt of Earth’s axis(4) shape of Earth’s orbit
6 Which statement about Polaris is best illustratedby the diagrams shown below?
(1) Polaris is located in a winter constellation.(2) Polaris is located at the zenith at each location.(3) Polaris’ apparent movement through the sky
follows a south-to-north orientation.(4) Polaris’ altitude is equal to a location’s latitude.
At New Orleans, Louisiana
Polaris
30°
At North Pole
To Polaris
90°
Polaris
At Equator

1 The apparent rising and setting of the Sun, asviewed from Earth, is caused by(1) Earth’s rotation(2) Earth’s revolution(3) the Sun’s rotation(4) the Sun’s revolution
2 In which direction on the horizon does the Sunappear to rise on July 4 in New York State?(1) due north (3) north of due east(2) due south (4) south of due east
3 Which graph best represents the change in gravi-tational attraction between the Sun and a cometas the distance between them increases?
4 The best evidence that Earth spins on its axis isprovided by(1) variations in atmospheric density(2) apparent shifts in the swing of a Foucault
pendulum(3) changes in the position of sunspots on the Sun(4) eclipses of the Moon
5 A major belt of asteroids is located between Marsand Jupiter. What is the approximate average dis-tance between the Sun and this major asteroid belt?(1) 110 million kilometers(2) 220 million kilometers(3) 390 million kilometers(4) 850 million kilometers
6 A cycle of Moon phases can be seen from Earthbecause the (1) Moon’s distance from Earth changes at a pre-
dictable rate (2) Moon’s axis is tilted(3) Moon spins on its axis(4) Moon revolves around Earth
7 Which diagram represents the approximate alti-tude of Polaris as seen by an observer located inSyracuse, New York?
8 Compared to Earth’s crust, Earth’s core isbelieved to be(1) less dense, cooler, and composed of more iron(2) less dense, hotter, and composed of less iron(3) more dense, hotter, and composed of more iron(4) more dense, cooler, and composed of less iron
N S
( 1 )
90°
S
( 3 )
0°
N S
( 2 )
43°
S
( 4 )
20°
N
N
Distance
( 2 )
Gra
vita
tiona
lA
ttra
ctio
n
Distance
( 4 )
Gra
vita
tiona
lA
ttra
ctio
n
Distance
( 3 )
Gra
vita
tiona
lA
ttra
ctio
n
Distance
( 1 )
Gra
vita
tiona
lA
ttra
ctio
n
P.S./E. Sci.–Aug. ’02 [2]
Part A
Answer all questions in this part.
Directions (1–35): For each statement or question, write on your separate answer sheet the number of theword or expression that, of those given, best completes the statement or answers the question. Some questionsmay require the use of the Earth Science Reference Tables.

P.S./E. Sci.– June ’11 [8]
35 The contour map below shows elevations recorded in meters. Line AB is a reference line on the map.
Which graph best represents the profile from point A to point B?
( 4 )
A B
500El
evat
ion
(m)
( 1 )
0A B
500
Elev
atio
n (m
)
( 3 )0
A B
500
0A B
500
Elev
atio
n (m
)
( 2 )
0Distance
Distance
Distance
Distance
Elev
atio
n (m
)El
evat
ion
(m)
500
A B
Ocean
Contour interval = 100 m
N

P.S./E. Sci.– June ’11 [8]
35 The contour map below shows elevations recorded in meters. Line AB is a reference line on the map.
Which graph best represents the profile from point A to point B?
( 4 )
A B
500
Elev
atio
n (m
)
( 1 )
0A B
500El
evat
ion
(m)
( 3 )0
A B
500
0A B
500
Elev
atio
n (m
)
( 2 )
0Distance
Distance
Distance
Distance
Elev
atio
n (m
)El
evat
ion
(m)
500
A B
Ocean
Contour interval = 100 m
N

P.S./E. Sci.– June ’11 [8]
35 The contour map below shows elevations recorded in meters. Line AB is a reference line on the map.
Which graph best represents the profile from point A to point B?
( 4 )
A B
500
Elev
atio
n (m
)
( 1 )
0A B
500
Elev
atio
n (m
)
( 3 )0
A B
500
0A B
500El
evat
ion
(m)
( 2 )
0Distance
Distance
Distance
Distance
Elev
atio
n (m
)El
evat
ion
(m)
500
A B
Ocean
Contour interval = 100 m
N

P.S./E. Sci.– June ’11 [8]
35 The contour map below shows elevations recorded in meters. Line AB is a reference line on the map.
Which graph best represents the profile from point A to point B?
( 4 )
A B
500
Elev
atio
n (m
)
( 1 )
0A B
500
Elev
atio
n (m
)
( 3 )0
A B
500
0A B
500
Elev
atio
n (m
)
( 2 )
0Distance
Distance
Distance
Distance
Elev
atio
n (m
)El
evat
ion
(m)
500
A B
Ocean
Contour interval = 100 m
N

Base your answers to questions 36 through 38 on the topographic map below. Points X, Y, and Z are loca-tions on the map. Elevations are expressed in meters.
N
Y
Z
X
Ocean
200
200
300
100
Mill
River
Contour interval = 20 meters
P.S. E./Sci.–Aug. ’01 [8]
Part B–1
Answer all questions in this part.
Directions (36–52): For each statement or question, write on your separate answer sheet the number of theword or expression that, of those given, best completes the statement or answers the question. Some questionsmay require the use of the Earth Science Reference Tables.
36 Which profile best represents the topographyalong the dashed line from point X to point Y?
37 Mill River generally flows toward the(1) southeast (3) northeast(2) southwest (4) northwest
38 What is the elevation of point Z?(1) 190 m (3) 240 m(2) 220 m (4) 250 mE
leva
tion
(m)
0
200
400
X Y
( 3 )
Ele
vatio
n (m
)
0
200
400
X Y
( 2 )
Ele
vatio
n (m
)
0
200
400
X Y
( 4 )
Ele
vatio
n (m
)
0
200
400
X Y
( 1 )

P.S./E. Sci.–Aug. ’05 [15] [OVER]
43 Which statement correctly describes one difference between these maps?(1) Map A has a greater relief (elevation change between high and low locations)
than map B.(2) Map A represents a much larger surface area than map B.(3) Map A shows more contour lines than map B.(4) Map A generally shows gentler slopes than map B.
44 On map B, what is the approximate straight-line distance from the center of the Xwithin grid area B–11 to the center of the X within grid area H–11?(1) 0.3 mi (3) 1.2 mi(2) 0.6 mi (4) 1.5 mi
45 Which direction is the stream mainly flowing within grid area H–1 on map B?(1) northward (3) eastward(2) southward (4) westward
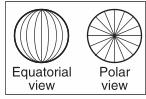
46 Which cross section best represents the topographic profile along the straight linefrom point Y to point Z on map B?
( 2 )Y Z
9800
9400
9000
8600Ele
vatio
n (f
t)
( 1 )Y Z
9800
9400
9000
8600Ele
vatio
n (f
t)
( 3 )Y Z
( 4 )Y Z
9800
9400
9000
8600Ele
vatio
n (f
t)
9800
9400
9000
8600Ele
vatio
n (f
t)

P.S./E. Sci.–Aug. ’05 [15] [OVER]
43 Which statement correctly describes one difference between these maps?(1) Map A has a greater relief (elevation change between high and low locations)
than map B.(2) Map A represents a much larger surface area than map B.(3) Map A shows more contour lines than map B.(4) Map A generally shows gentler slopes than map B.
44 On map B, what is the approximate straight-line distance from the center of the Xwithin grid area B–11 to the center of the X within grid area H–11?(1) 0.3 mi (3) 1.2 mi(2) 0.6 mi (4) 1.5 mi
45 Which direction is the stream mainly flowing within grid area H–1 on map B?(1) northward (3) eastward(2) southward (4) westward
46 Which cross section best represents the topographic profile along the straight linefrom point Y to point Z on map B?
( 2 )Y Z
9800
9400
9000
8600Ele
vatio
n (f
t)
( 1 )Y Z
9800
9400
9000
8600Ele
vatio
n (f
t)
( 3 )Y Z
( 4 )Y Z
9800
9400
9000
8600Ele
vatio
n (f
t)
9800
9400
9000
8600Ele
vatio
n (f
t)
P.S./E. Sci.–Aug. ’05 [15] [OVER]
43 Which statement correctly describes one difference between these maps?(1) Map A has a greater relief (elevation change between high and low locations)
than map B.(2) Map A represents a much larger surface area than map B.(3) Map A shows more contour lines than map B.(4) Map A generally shows gentler slopes than map B.
44 On map B, what is the approximate straight-line distance from the center of the Xwithin grid area B–11 to the center of the X within grid area H–11?(1) 0.3 mi (3) 1.2 mi(2) 0.6 mi (4) 1.5 mi
45 Which direction is the stream mainly flowing within grid area H–1 on map B?(1) northward (3) eastward(2) southward (4) westward
46 Which cross section best represents the topographic profile along the straight linefrom point Y to point Z on map B?
( 2 )Y Z
9800
9400
9000
8600Ele
vatio
n (f
t)( 1 )
Y Z
9800
9400
9000
8600Ele
vatio
n (f
t)( 3 )
Y Z
( 4 )Y Z
9800
9400
9000
8600Ele
vatio
n (f
t)
9800
9400
9000
8600Ele
vatio
n (f
t)

P.S./E. Sci.–Aug. ’05 [15] [OVER]
43 Which statement correctly describes one difference between these maps?(1) Map A has a greater relief (elevation change between high and low locations)
than map B.(2) Map A represents a much larger surface area than map B.(3) Map A shows more contour lines than map B.(4) Map A generally shows gentler slopes than map B.
44 On map B, what is the approximate straight-line distance from the center of the Xwithin grid area B–11 to the center of the X within grid area H–11?(1) 0.3 mi (3) 1.2 mi(2) 0.6 mi (4) 1.5 mi
45 Which direction is the stream mainly flowing within grid area H–1 on map B?(1) northward (3) eastward(2) southward (4) westward
46 Which cross section best represents the topographic profile along the straight linefrom point Y to point Z on map B?
( 2 )Y Z
9800
9400
9000
8600Ele
vatio
n (f
t)
( 1 )Y Z
9800
9400
9000
8600Ele
vatio
n (f
t)
( 3 )Y Z
( 4 )Y Z
9800
9400
9000
8600Ele
vatio
n (f
t)9800
9400
9000
8600Ele
vatio
n (f
t)

P.S./E. Sci.–Aug. ’06 [13] [OVER]
43 Which graph best represents the profile along line AB?
44 What evidence can be used to determine that the land surface in the northeastcorner of the map is relatively flat?(1) a rapidly flowing river (3) the dark contour line labeled 300(2) a large region covered by water (4) the absence of many contour lines
500
400
300
200
Distance (mi)
Ele
vatio
n (f
t)
A B
( 1 )
500
400
300
200
Distance (mi)
Ele
vatio
n (f
t)
A B
( 3 )
500
400
300
200
Distance (mi)
Ele
vatio
n (f
t)
A B
( 2 )
500
400
300
200
Distance (mi)
Ele
vatio
n (f
t)
A B
( 4 )

Base your answers to questions 51 and 52 on the diagrams below. The top diagram shows a depression andhill on a gently sloping area. The bottom diagram is a topographic map of the same area. Points A, X, and Y arelocations on Earth’s surface. A dashed line connects points X and Y. Elevation is indicated in feet.
51 What is a possible elevation of point A? [1]
52 On the grid in your answer booklet, construct a topographic profile along line XY,by plotting a point for the elevation of each contour line that crosses line XY. PointsX and Y have already been plotted on the grid. Connect the points with a smooth,curved line to complete the profile. [2]
X
A
Y
10
20
10
2010
2030
40
N
P.S./E. Sci.–June ’06 [16]
Part B–2
Answer all questions in this part.
Directions (51–64): Record your answers in the spaces provided in your answer booklet. Some questionsmay require the use of the Earth Science Reference Tables.

Base your answers to questions 77 through 81 on the passage and map below. Point F on the map shows thelocation where an unusual mammal fossil was found.
Fossil Jaw of Mammal Found in South America
Paleontologists working in Patagonia have found the tiny fossil jaw that may be thefirst evidence of early mammals in South America.
The fossil, which measures less than a quarter-inch long, is believed to be from themiddle or late Jurassic Period. Researchers said it suggests that mammals developedindependently in the Southern Hemisphere.
The fossil, named Asfaltomylos patagonicus, was discovered in a shale formation inPatagonia. Dinosaurs were the dominant land animal at that time. Mammals were tiny,and hunted insects in the dense tropical vegetation. The now-arid region also has yieldedsome remarkable dinosaur fossils from the same period in a vast ancient boneyard covering hundreds of square miles.
77 State the latitude and longitude of point F, to the nearest degree, where the fossilAsfaltomylos patagonicus was discovered. Include the correct units and compassdirections in your answer. [1]
78 State the name of the dominant sediment particle that was compacted to form theshale in which this fossil was found. [1]
F
Pat
agon
ia
An
d e s
Mo
un
tai n
s
45° W60° W75° W 30° W90° W
45° S
0°
15° S
45° S
30° S
0°
15° S
45° W60° W75° W90° W
S o u t h A m e r i c a
30° S
105° W
P.S./E. Sci.–Jan. ’09 [24]

1 The dashed line on the map below shows a ship’sroute from Long Island, New York, to Florida.As the ship travels south, the star Polarisappears lower in the northern sky each night.
The best explanation for this observation is thatPolaris(1) rises and sets at different locations each day(2) has an elliptical orbit around Earth(3) is located directly over Earth’s Equator(4) is located directly over Earth’s North Pole
2 When the dry-bulb temperature is 22°C and thewet-bulb temperature is 13°C, the relativehumidity is(1) 10% (3) 41%(2) 33% (4) 59%
3 As the altitude increases within Earth’s strato-sphere, air temperature generally(1) decreases, only(2) increases, only(3) decreases, then increases(4) increases, then decreases
4 The diagrams below represent four rock sam-ples. Which rock was formed by rapid cooling ina volcanic lava flow? [The diagrams are not toscale.]
5 On June 21, some Earth locations have 24 hoursof daylight. These locations are all between thelatitudes of
(1) 0° and 23 ° N
(2) 23 ° N and 47° N
(3) 47° N and 66 ° N
(4) 66 ° N and 90° N
6 The Milky Way galaxy is best described as (1) a type of solar system(2) a constellation visible to everyone on Earth(3) a region in space between the orbits of Mars
and Jupiter(4) a spiral-shaped formation composed of
billions of stars
12
12
12
12
( 1 ) ( 3 )
( 2 ) ( 4 )
Bands of alternatinglight and darkminerals
Glassy black rockthat breaks with ashell-shape fracture
Easily split layers of0.0001-cm-diameterparticles cemented together
Interlocking0.5-cm-diametercrystals of various colors
New YorkState
Florida
N
P.S. E./Sci.–June ’02 [2]
Part A
Answer all questions in this part.
Directions (1–35): For each statement or question, write on your separate answer sheet the number of theword or expression that, of those given, best completes the statement or answers the question. Some questionsmay require the use of the Earth Science Reference Tables.

P.S./E. Sci.–Aug. ’05 [4]
15 If the time in Buffalo, New York, is 5 a.m., what time would it be in San Francisco,California?(1) 8 a.m. (3) 3 a.m.(2) 2 a.m. (4) 4 a.m.
16 The basis for the time difference between adjoining time zones is Earth’s(1) 1° per hour rate of revolution (3) 15° per hour rate of revolution (2) 1° per hour rate of rotation (4) 15° per hour rate of rotation
Base your answers to questions 15 and 16 on the United States time zone map shown below. The dashedlines represent meridians (lines of longitude).
120° W 105° W 90° W 75° W
San Francisco
Dallas
Denver
Pacifictime zone
Centraltime zone
Easterntime zone
Mountaintime zone
Buffalo
New YorkCity

P.S./E. Sci.–Jan. ’08 [21] [OVER]
Base your answers to questions 71 and 72 on the passage and time zones map shown below.
Time Zones
In 1883, Earth was divided into 24 time zones. The United States (excluding Alaskaand Hawaii) has four time zones, which are indicated by different shadings on the map.Each zone is roughly centered on lines of longitude that are 15° apart. These lines areshown as dashed lines on the map. Most locations within a time zone have the same time.This time is called standard time. As you move to the west, the time in each zone is onehour earlier than the previous time zone.
71 When it is 1 a.m. in New York City, what time is it in Denver? [1]
72 Explain, in terms of Earth’s rotation, why the time zones are 15° of longitude apart. [1]
Dallas
Denver
Pacifictime zone
Centraltime zone
Easterntime zone
Mountaintime zone
Buffalo
New YorkCity
120° W 105° W 90° W 75° W
San Francisco

Base your answers to questions 57 through 59 on the topographic map below of an area in New York State.Points X and Y are locations on Squab Hollow Creek.
57 In the space provided in your answer booklet, determine the gradient of SquabHollow Creek between point X and point Y by following the directions below.a Using the Earth Science Reference Tables, write the equation used to determine
the gradient.b Substitute values into the equation. [1] c Solve the equation and label the answer with the correct units. [2]
58 Describe one way to determine the direction of flow of Coover Hollow Creek frominformation shown on the map. [1]
59 Based on the latitude and longitude coordinates given, identify the New York Statelandscape region in which this map region is located. [1]
10 2 3 4 5 6 7 8 9 10kilometers
42o 00' 42o 00'
77o 37' 30'' 77o 30'
42o 07' 30'' 42o 07' 30''77o 37' 30'' 77o 30'
600600
600
600
600
600
600
600
Contour interval 50 meters
Y
500
HollowSquab Creek
Young
X
Hickory
CreekHollow
Creek
Coover
Hollow
P.S. E./Sci.–June ’02 [13] [OVER]

P.S./E. Sci.–June ’03 [16]
Part B–2
Answer all questions in this part.
Directions (51–60): Record your answers in the spaces provided in your answer booklet. Some questionsmay require the use of the Earth Science Reference Tables.
Base your answers to questions 51 through 54 on the topographic map below. Points A, B, Y, and Z are ref-erence points on the topographic map. The symbol !!• 533 represents the highest elevation on Aurora Hill.
51 State the general compass direction in which Maple Stream is flowing. [1]
52 Calculate the gradient between points Y and Z on the map, and label the answerwith the correct units. [2]
Contour Interval 10 feet
A
Y
HollandHill
Aurora Hill
GirardHill
500
Lake Lackawanna
0 2 4 6 miles
N
Col
den
Cre
ek
Map
leS
tream
550533
B
Z

Base your answers to questions 41 through 45 on the maps below. Points A, B, C, X, and Y are locations on thetopographic map. The small map identifies the New York State region shown in the topographic map.
New YorkState
1500
1500
1000
1500
1500
1000
1000
76°32'30"42°10'00"42°10'00"
42°07'30"
76°35'00"
76°35'00"42°07'30"
76°32'30"
1 mile1 1/2 0 1/2
Cay
uta
Cre
e k
B CA
Cayuta Creek
X Y
Topographic Map
Contour interval 100 feet
P.S./E. Sci.–June ’04 [12]

Base your answers to questions 42 through 44 on the topographic map below. Points A, B, C, D, and Xrepresent locations on the map. Elevations are measured in feet.
42 What is the highest possible elevation of point X on Rock Mountain?(1) 1,599 ft (3) 1,601 ft (2) 1,600 ft (4) 1,699 ft
43 What is the average gradient of the slope along straight line CD?(1) 100 ft/mi (3) 500 ft/mi(2) 250 ft/mi (4) 1,000 ft/mi
BFish Creek
1500
A1000
900
C
D
Lake
Lake
X
0 1 2 3 4 5 6 milesN
800
900
900
R o c k M o u n t a i n
P.S./E. Sci.–June ’05 [10]
P.S./E. Sci.–June ’06 [5] [OVER]
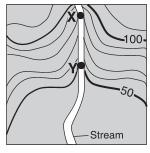
20 The four streams shown on the topographic mapsbelow have the same volume between X and Y.The distance from X to Y is also the same. All themaps are drawn to the same scale and have thesame contour interval. Which map shows thestream with the greatest velocity between pointsX and Y?
21 A student obtains a cup of quartz sand from abeach. A saltwater solution is poured into thesand and allowed to evaporate. The mineralresidue from the saltwater solution cements thesand grains together, forming a material that ismost similar in origin to(1) an extrusive igneous rock(2) an intrusive igneous rock(3) a clastic sedimentary rock(4) a foliated metamorphic rock
22 Which coastal area is most likely to experience asevere earthquake?(1) east coast of North America(2) east coast of Australia(3) west coast of Africa(4) west coast of South America
23 Which characteristic is most useful in correlatingDevonian-age sedimentary bedrock in New YorkState with Devonian-age sedimentary bedrock inother parts of the world?(1) color (3) rock types(2) index fossils (4) particle size
24 A seismic station 4000 kilometers from the epi-center of an earthquake records the arrival timeof the first P-wave at 10:00:00. At what time didthe first S-wave arrive at this station? (1) 9:55:00 (3) 10:07:05(2) 10:05:40 (4) 10:12:40
25 Which statement correctly describes the densityof Earth’s mantle compared to the density ofEarth’s core and crust?(1) The mantle is less dense than the core but
more dense than the crust.(2) The mantle is less dense than both the core
and the crust.(3) The mantle is more dense than the core but
less dense than the crust.(4) The mantle is more dense than both the core
and the crust.
26 Convection currents in the plastic mantle arebelieved to cause divergence of lithosphericplates at the (1) Peru-Chile Trench(2) Mariana Trench(3) Canary Islands Hot Spot(4) Iceland Hot Spot
27 According to fossil evidence, which sequenceshows the order in which these four life-formsfirst appeared on Earth?(1) reptiles ! amphibians ! insects ! fish(2) insects ! fish ! reptiles ! amphibians(3) amphibians ! reptiles ! fish ! insects(4) fish ! insects ! amphibians ! reptiles
Y
XY Stre
am
Stream
( 3 )
( 4 )( 2 )
( 1 )
100
50
100
50
Stream 50
X
StreamY
X50
100
Y
X

P.S./E. Sci.–June ’06 [5] [OVER]
20 The four streams shown on the topographic mapsbelow have the same volume between X and Y.The distance from X to Y is also the same. All themaps are drawn to the same scale and have thesame contour interval. Which map shows thestream with the greatest velocity between pointsX and Y?
21 A student obtains a cup of quartz sand from abeach. A saltwater solution is poured into thesand and allowed to evaporate. The mineralresidue from the saltwater solution cements thesand grains together, forming a material that ismost similar in origin to(1) an extrusive igneous rock(2) an intrusive igneous rock(3) a clastic sedimentary rock(4) a foliated metamorphic rock
22 Which coastal area is most likely to experience asevere earthquake?(1) east coast of North America(2) east coast of Australia(3) west coast of Africa(4) west coast of South America
23 Which characteristic is most useful in correlatingDevonian-age sedimentary bedrock in New YorkState with Devonian-age sedimentary bedrock inother parts of the world?(1) color (3) rock types(2) index fossils (4) particle size
24 A seismic station 4000 kilometers from the epi-center of an earthquake records the arrival timeof the first P-wave at 10:00:00. At what time didthe first S-wave arrive at this station? (1) 9:55:00 (3) 10:07:05(2) 10:05:40 (4) 10:12:40
25 Which statement correctly describes the densityof Earth’s mantle compared to the density ofEarth’s core and crust?(1) The mantle is less dense than the core but
more dense than the crust.(2) The mantle is less dense than both the core
and the crust.(3) The mantle is more dense than the core but
less dense than the crust.(4) The mantle is more dense than both the core
and the crust.
26 Convection currents in the plastic mantle arebelieved to cause divergence of lithosphericplates at the (1) Peru-Chile Trench(2) Mariana Trench(3) Canary Islands Hot Spot(4) Iceland Hot Spot
27 According to fossil evidence, which sequenceshows the order in which these four life-formsfirst appeared on Earth?(1) reptiles ! amphibians ! insects ! fish(2) insects ! fish ! reptiles ! amphibians(3) amphibians ! reptiles ! fish ! insects(4) fish ! insects ! amphibians ! reptiles
Y
XY Stre
am
Stream
( 3 )
( 4 )( 2 )
( 1 )
100
50
10050
Stream 50
X
StreamY
X50
100
Y
X

P.S./E. Sci.–June ’06 [5] [OVER]
20 The four streams shown on the topographic mapsbelow have the same volume between X and Y.The distance from X to Y is also the same. All themaps are drawn to the same scale and have thesame contour interval. Which map shows thestream with the greatest velocity between pointsX and Y?
21 A student obtains a cup of quartz sand from abeach. A saltwater solution is poured into thesand and allowed to evaporate. The mineralresidue from the saltwater solution cements thesand grains together, forming a material that ismost similar in origin to(1) an extrusive igneous rock(2) an intrusive igneous rock(3) a clastic sedimentary rock(4) a foliated metamorphic rock
22 Which coastal area is most likely to experience asevere earthquake?(1) east coast of North America(2) east coast of Australia(3) west coast of Africa(4) west coast of South America
23 Which characteristic is most useful in correlatingDevonian-age sedimentary bedrock in New YorkState with Devonian-age sedimentary bedrock inother parts of the world?(1) color (3) rock types(2) index fossils (4) particle size
24 A seismic station 4000 kilometers from the epi-center of an earthquake records the arrival timeof the first P-wave at 10:00:00. At what time didthe first S-wave arrive at this station? (1) 9:55:00 (3) 10:07:05(2) 10:05:40 (4) 10:12:40
25 Which statement correctly describes the densityof Earth’s mantle compared to the density ofEarth’s core and crust?(1) The mantle is less dense than the core but
more dense than the crust.(2) The mantle is less dense than both the core
and the crust.(3) The mantle is more dense than the core but
less dense than the crust.(4) The mantle is more dense than both the core
and the crust.
26 Convection currents in the plastic mantle arebelieved to cause divergence of lithosphericplates at the (1) Peru-Chile Trench(2) Mariana Trench(3) Canary Islands Hot Spot(4) Iceland Hot Spot
27 According to fossil evidence, which sequenceshows the order in which these four life-formsfirst appeared on Earth?(1) reptiles ! amphibians ! insects ! fish(2) insects ! fish ! reptiles ! amphibians(3) amphibians ! reptiles ! fish ! insects(4) fish ! insects ! amphibians ! reptiles
Y
XY Stre
am
Stream
( 3 )
( 4 )( 2 )
( 1 )
100
50
100
50
Stream 50
X
StreamY
X50
100
Y
X

28 The fossil below was found in surface bedrock inthe eastern United States.
Which statement best describes the formation ofthe rock containing this fossil?(1) The rock was formed by the metamorphism
of sedimentary rock deposited in a terrestrialenvironment during the Cretaceous Period.
(2) The rock was formed by the compaction andcementation of sediments deposited in a ter-restrial environment during the Triassic Period.
(3) The rock was formed by the compaction andcementation of sediments deposited in amarine environment during the CambrianPeriod.
(4) The rock was formed from the solidificationof magma in a marine environment duringthe Triassic Period.
29 The diagram below shows an index fossil found insurface bedrock in some parts of New York State.
In which New York State landscape region is thisgastropod fossil most likely found in the surfacebedrock?(1) Tug Hill Plateau(2) Allegheny Plateau(3) Adirondack Mountains(4) Newark Lowlands
30 The topographic map below shows a hill. Points Xand Y represent locations on the hill’s surface.Elevations are shown in meters.
What is the gradient between points X and Y?(1) 40 m/km (3) 100 m/km(2) 80 m/km (4) 120 m/km
N
X
Y
400
300
0 2 km1
Maclurites
P.S./E. Sci.–June ’06 [6]

P.S./E. Sci.–June ’07 [21] [OVER]
Base your answers to questions 70 through 73 on the topographic map shown below. Letters A, B, C, D,and E represent locations on Earth’s surface. Letters K, L, M, and N are locations along Copper Creek.Elevations are measured in meters.
70 What is the elevation of location A? [1]
71 Calculate the gradient between points B and C and label your answer with the correct units. [2]
72 On the grid in your answer booklet, construct a topographic profile along line DE byplotting an X for the elevation of each contour line that crosses line DE. Connect theXs with a smooth, curved line to complete the profile. [2]
73 Explain how the map indicates that Copper Creek flows faster between points N andM than between points L and K. [1]
BC
A
50
Amethyst River
Copper Creek
K LM N
E
D 50
50
Contour interval = 10 meters N
KeyDepression contour line
0 1 2 3 km
Ocean
20

Base your answers to questions 69 through 72 on the topographic map below, which shows a small island inan ocean. Points A, B, C, and D represent surface locations on the island. The symbol 134 represents an elevation on the hilltop. Elevations are measured in feet and distances are measured in miles.
69 On the grid in your answer booklet, construct a profile along line AB by plotting an Xfor the elevation of each contour line that crosses line AB. Connect the Xs with asmooth, curved line to complete the profile. [1]
70 Calculate the gradient of Mud Creek between points C and D and label your answerwith the correct units. [1]
71 State the compass direction toward which Mud Creek flows. [1]
72 Explain how the contour lines on the map indicate that the north side of the islandhas the steepest slope. [1]
0 1 2 3 4 5 6 mi
Ocean
134
100
A
D
C
B
Contour interval = 20 feet
N
Mud Creek
P.S./E. Sci.–June ’09 [21] [OVER]

17 On the map below, dark-gray areas representregions of lake-effect snow on a December day.
Which New York State location appears to beexperiencing a lake-effect snowstorm?(1) New York City (3) Plattsburgh(2) Utica (4) Watertown
18 The cross section below shows the generalbedrock structure of an area containing threedifferent landscape regions, A, B, and C.
Which list correctly identifies the type of landscapes represented by letters A, B, and C?(1) A = plain, B = plateau, C = mountain(2) A = mountain, B = plateau, C = plain(3) A = mountain, B = plain, C = plateau(4) A = plateau, B = plain, C = mountain
19 In New York State, the surface bedrock of theCatskills consists mainly of(1) weakly consolidated gravels and sands(2) quartzites, dolostones, marbles, and schists(3) conglomerates, red sandstones, basalt, and
diabase(4) limestones, shales, sandstones, and
conglomerates
20 The topographic map below shows a streamcrossing several contour lines and passingthrough points X and Y. Elevations are measuredin feet.
What is the approximate gradient between point Xand point Y?(1) 10 ft/mi (3) 40 ft/mi(2) 20 ft/mi (4) 80 ft/mi
21 The map below shows an overhead view of sediments that have accumulated at the bottomof a lake. Points A through D represent locationson the shoreline of the lake.
A river most likely flows into the lake nearest tolocation(1) A (3) C(2) B (4) D
22 An increase in which gas in Earth’s atmospherewill most significantly increase global temperatures?(1) methane (3) nitrogen(2) oxygen (4) hydrogen
Sand
Pebbles
Clay
Silt
B
D
A
C
2 km
A BC
(Not drawn to scale)
P.S./E. Sci.–June ’11 [4]

P.S./E. Sci.– June ’11 [8]
35 The contour map below shows elevations recorded in meters. Line AB is a reference line on the map.
Which graph best represents the profile from point A to point B?
( 4 )
A B
500
Elev
atio
n (m
)
( 1 )
0A B
500
Elev
atio
n (m
)
( 3 )0
A B
500
0A B
500
Elev
atio
n (m
)
( 2 )
0Distance
Distance
Distance
Distance
Elev
atio
n (m
)El
evat
ion
(m)
500
A B
Ocean
Contour interval = 100 m
N

Base your answers to questions 36 through 38 on the topographic map below. Points X, Y, and Z are loca-tions on the map. Elevations are expressed in meters.
N
Y
Z
X
Ocean
200
200
300
100
Mill
River
Contour interval = 20 meters
P.S. E./Sci.–Aug. ’01 [8]
Part B–1
Answer all questions in this part.
Directions (36–52): For each statement or question, write on your separate answer sheet the number of theword or expression that, of those given, best completes the statement or answers the question. Some questionsmay require the use of the Earth Science Reference Tables.
36 Which profile best represents the topographyalong the dashed line from point X to point Y?
37 Mill River generally flows toward the(1) southeast (3) northeast(2) southwest (4) northwest
38 What is the elevation of point Z?(1) 190 m (3) 240 m(2) 220 m (4) 250 mE
leva
tion
(m)
0
200
400
X Y
( 3 )
Ele
vatio
n (m
)
0
200
400
X Y
( 2 )
Ele
vatio
n (m
)
0
200
400
X Y
( 4 )
Ele
vatio
n (m
)
0
200
400
X Y
( 1 )

Part B–2
Answer all questions in this part.
Directions (51–59): Record your answers in the spaces provided in your answer booklet. Some questionsmay require the use of the Earth Science Reference Tables.
Base your answers to questions 51 and 52 on the topographic map of an island shown below. Elevations areexpressed in feet. Points A, B, C, and D are locations on the island. A triangulation point shows the highest ele-vation on the island.
BA
Ocean
N
0
300250
200
10050
150
0 2 4 6 8 10 milesScale
325
C
D
P.S./E. Sci.–Aug. ’02 [13] [OVER]
51 On the grid provided in your answer booklet, construct a topographic profile repre-senting the cross-sectional view between point A and point B, following the directionsbelow. a Plot the elevation of the land along line AB by marking, with a dot, the elevation of
each point where a contour line is crossed by line AB. [2]b Connect the dots with a smooth, curved line to complete the topographic profile. [1]
52 What is the average gradient, in feet per mile, along the straight line from point C topoint D? [1]

Base your answers to questions 58 through 61 on the contour map below. Letters A through H representlocations in the area represented by the map. Contour lines are labeled in feet.
58 Calculate the gradient of the slope along the dashed line between points G and Hon the map. Label the answer with the correct units. [2]
59 State how the shape of the contour lines crossing the Green River indicates that thisriver flows toward the southeast. [1]
60 Which letter represents the highest elevation? [1]
61 Explain how the contour lines on the map indicate that the location labeled “SteepCliff ” is accurately named. [1]
H
0 1/2 1 2 3 miles
G
N
A100
100
100
200D
C
EF
200
200200
SteepCliff100
B
Green River
P.S./E. Sci.–Aug. ’03 [15] [OVER]

Base your answers to questions 64 and 65 on the topographic map shown below. Points A, B, C, and D arereference points on the map. Elevations are measured in meters.
64 On the grid provided in your answer booklet, construct a topographic profile along lineAB, by plotting a point for the elevation of each contour line that crosses line AB andconnecting the points with a smooth, curved line to complete the profile. [2]
65 Calculate the gradient of Long Creek between points C and D and label the answerwith the correct units. [2]
C
300
250
D
AB
Contour interval = 10 meters0 1 2 kilometers
N
350
Long
Cre
ek
P.S./E. Sci.–Aug. ’04 [19] [OVER]
Part C
Answer all questions in this part.
Directions (64–77): Record your answers in the spaces provided in your answer booklet. Some questionsmay require the use of the Earth Science Reference Tables.
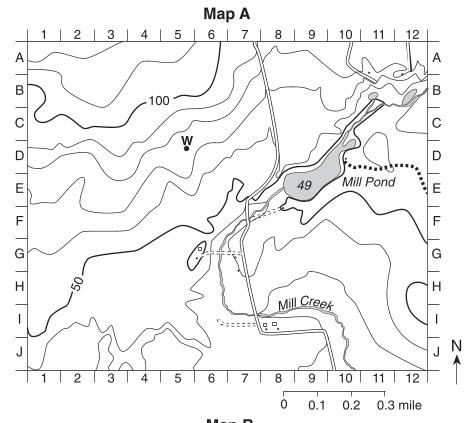
P.S./E. Sci.–Aug. ’05 [14]
Base your answers to questions 43 through 46 on the two topographic maps below. A grid system of num-bers and letters appears along the edge of each map to help locate features. Both maps show elevations in feetabove sea level.
1 2 3 4 5 6 7 8 9 10 11 12
N
N
A
B
C
D
E
F
G
H
I
J
A
B
C
D
E
F
G
H
I
J
1 2 3 4 5 6 7 8 9 10 11 12
A
B
C
D
E
F
G
H
I
J
A
B
C
D
E
F
G
H
I
J
1 2 3 4 5 6 7 8 9 10 11 12
1 2 3 4 5 6 7 8 9 10 11 12
0 0.1 0.2 0.3 mile
50
100
W
49 Mill Pond
0 0.1 0.2 0.3 mile
Map A
Map B
8000
ZY 9000
9400 10000
10292
9400
9848
9200
Mill Creek
X
X

P.S./E. Sci.–Aug. ’06 [12]
Base your answers to questions 41 through 44 on the topographic map below. Elevations are in feet. PointsA and B are locations on the map.
41 Toward which direction does the Green River flow?(1) northeast (3) southeast(2) northwest (4) southwest
42 What is the gradient along the straight line between points A and B?(1) 10 ft/mi (3) 25 ft/mi(2) 20 ft/mi (4) 35 ft/mi
Green
River
N
A
B300
300
400
0 1 2 3 4 5Miles

16 The cross section below shows the direction of airflowing over a mountain. Points A and B are atthe same elevation on opposite sides of themountain.
Compared to the air temperature and humidity atpoint A, the air temperature and humidity atpoint B are usually (1) cooler and drier (3) warmer and drier(2) cooler and wetter (4) warmer and wetter
17 The cross section below shows rock layers A, B,C, D, and fault F. The rock layers have not beenoverturned.
Which sequence places the rock layers and faultin order from oldest to youngest?(1) D ! C ! B ! A ! F(2) A ! B ! C ! D ! F(3) F ! D ! C ! B ! A(4) F ! A ! B ! C ! D
18 The largest sediment particles that can be trans-ported by a stream traveling at a velocity of 200 centimeters per second are(1) boulders (3) pebbles(2) cobbles (4) sand
19 What happens to the density and temperature ofrock within Earth’s interior as depth increases?(1) density decreases and temperature decreases(2) density decreases and temperature increases(3) density increases and temperature increases(4) density increases and temperature decreases
20 Scientists believe that a large asteroid struckEarth approximately 65 million years ago. It isoften theorized that this event contributed to the (1) end of the last ice age(2) breaking up of the supercontinent Pangea(3) evolution of the first birds(4) extinction of the dinosaurs
21 Which two landscape regions in New York Statehave the oldest surface bedrock?(1) Allegheny Plateau and Newark Lowlands(2) Tug Hill Plateau and Erie-Ontario Lowlands(3) Taconic Mountains and the Catskills(4) Adirondack Mountains and Hudson Highlands
22 The topographic map below shows locations Xand Y.
What is the approximate gradient between X and Y?(1) 15 ft/mi (3) 30 ft/mi(2) 20 ft/mi (4) 60 ft/mi
A
B
C
D
A
B
C
D
F
A B
Contour interval: 20 feet
X
Y
N500
Scale of Miles
0 1 2 3
P.S./E. Sci.–Aug. ’08 [6]

Part A
Answer all questions in this part.
Directions (1–35): For each statement or question, write on your separate answer sheet the number of theword or expression that, of those given, best completes the statement or answers the question. Some questionsmay require the use of the Earth Science Reference Tables.
1 Which statement best describes the age of oursolar system and the universe?(1) The universe is at least twice as old as our
solar system. (2) Our solar system is at least twice as old as the
universe.(3) Our solar system and the universe are esti-
mated to be 5 billion years old. (4) Our solar system and the universe are esti-
mated to be 10 billion years old.
2 A Foucault pendulum is used to prove that (1) the Sun rotates on its axis(2) the Sun revolves around Earth(3) Earth rotates on its axis(4) Earth revolves around the Sun
3 Compared to the terrestrial planets, the Jovianplanets are(1) smaller and have lower densities(2) smaller and have greater densities(3) larger and have lower densities(4) larger and have greater densities
4 Which process produces the energy that allowsthe stars of the universe to radiate visible light?(1) convection (3) insolation(2) nuclear fusion (4) radioactive decay
5 A soil sample with a large amount of spacebetween the particles will have a(1) low permeability rate (3) high porosity(2) low infiltration rate (4) high capillarity
6 When Earth cools, most of the energy transferredfrom Earth’s surface to space is transferred by theprocess of(1) conduction (3) refraction(2) reflection (4) radiation
7 The spinning of Earth on its axis causes theapparent rising and setting of the(1) Sun, only(2) Sun and the Moon, only(3) Moon and some stars, only(4) Sun, the Moon, and some stars
8 On sunny summer days, a breeze often developsthat blows from large bodies of water towardnearby landmasses because the (1) temperature of the air above the landmasses
is greater(2) specific heat of the landmasses is greater(3) temperatures of the bodies of water are
greater(4) air over the bodies of water becomes heavier
with additional water vapor
9 The topographic map below shows part of astream.
In which general direction is the stream flowing?(1) northeast (3) southeast(2) northwest (4) southwest
HammerStream
N
200
P.S./E. Sci.–Aug. ’08 [2]

Base your answers to questions 79 through 81 on the topographic map below. Points A, B, X, and Y are locationson Earth’s surface.
79 On the grid in your answer booklet, construct a topographic profile of the landsurface along line AB by plotting an X for the elevation of each contour line thatcrosses line AB. Connect the Xs with a smooth, curved line to complete the profile. [1]
80 Toward which compass direction is Snapper Creek flowing? [1]
81 Calculate the gradient between points X and Y. Units must be included in your answer. [1]
3500
A
B
X
Y
Contour interval =100 feet
N
300
0 3000
0 1 2 3 miles
Sna
pper
Cre
ek
P.S./E. Sci.–August ’09 [22]

Base your answers to questions 51 through 55 on the topographic map shown below. Letters A, B, C, andD represent locations on Earth’s surface. The symbol marks the highest elevation on Patty Hill. Elevationsare shown in feet.
51 What is a possible elevation at the symbol at the top of Patty Hill? [1]
52 Indicate, using a compass direction, the steepest side of Patty Hill. [1]
53 Explain how the shape of the contour lines crossing Blue Creek shows the direction that the creek is flowing. [1]
54 A student placed a floating wooden block in Blue Creek at location A. Fifteen minutes later, the floatingblock arrived at location B. What was the creek’s rate of flow from A to B? Express your answer to the nearest tenth. [1]
55 On the grid in your answer booklet, construct a profile of the land surface along line CD. Plot the elevationof each contour line that crosses line CD. Connect the plots with a line to complete the profile. [1]
BA
CD
Hill
Blue Creek
N
TaylorPond
100
Contour interval = 20 ft 0 1 2 3 miles
Patty
Part B–2
Answer all questions in this part.
Directions (51–65): Record your answers in the spaces provided in your answer booklet. Some questionsmay require the use of the 2010 Edition Reference Tables for Physical Setting/Earth Science.
P.S./E. Sci.–Aug. ’11 [17] [OVER]

Part B–2Answer all questions in this part.
Directions (51–58): Record your answers in the spaces provided in your answer booklet. Some questionsmay require the use of the Earth Science Reference Tables.
Base your answers to questions 51 through 53 on the topographic map below. Points A through D are loca-tions on the map. Elevations are in feet.
D
C
300
250
Jones Creek
A
B
300
250
BM
JonesCenter
250
JonesLake
0 0.5 1 mile N
P.S. E./Sci.–Jan. ’02 [15] [OVER]
51 Explain briefly how the map can be used to determine that Jones Creek is flowingwestward into Jones Lake. [1]
52 Determine the gradient from point A to point B by following the directions below.a Write the equation for determining the gradient.b Substitute data from the map into the equation. [1]c Calculate the gradient and label it with the proper units. [2]
53 On the grid provided in your answer booklet, construct a profile of the land surfacebetween point C and point D by following the directions below.a Plot the elevations along line CD by marking with a dot each point where an isoline
is crossed by line CD. [1]b Connect the dots to complete the profile. [1]

40 Which model best represents the apparent path of the Sun observed at various times during the year at theEquator?
Always thesame path
N S
( 1 )
March, September
N S
( 3 )
DecemberJune
March,September
N S
( 2 )
DecemberJune
( 4 )
March,September
N S
DecemberJune
41 The topographic map below shows a particularlandscape.
Which map best represents the stream drainagepattern for this landscape?
42 Which diagram correctly shows how mantle con-vection currents are most likely moving beneathcolliding lithospheric plates?
43 Which two rocks have the most similar mineralcomposition?(1) marble and rhyolite(2) limestone and basalt(3) quartzite and rock salt(4) granite and phyllite
Plate Plate
( 1 )
AsthenospherePlate Plate
( 3 )
Asthenosphere
Plate Plate
( 2 )
AsthenospherePlate Plate
( 4 )
Asthenosphere( 1 ) ( 3 )
( 2 ) ( 4 )
1000500
P.S./E. Sci.–Jan. ’04 [10]

Base your answers to questions 71 through 74 on the topographic map below. The map shows a portion ofthe Taterskill Creek flowing past the towns of Lawson and Glenton. The shaded area is Taterskill Creek. Thearrows in the creek show its direction of flow. Points A, B, and C are locations on the map. Points A and B areconnected with a reference line.
Mercado Dam is located 32 miles upstream from Lawson. In the remote possibility ofa failure of the Mercado Dam, the Taterskill Creek is expected to rise to the 600-foot contour line in the vicinity of the two towns.
A
101
16
9
16
9
C
B 650 700
750
650
600
650
750
700
650
600
Lawson
Glenton
Taterskill Creek
4
4
N
0 1.00.5 mile
Contour interval = 10 feet
River Road
HillsideRoad
Mai
nS
treet
Mountain
Road
213
213
600
600
Key
Road route number
Bridge
Predicted flood area
Building
Road
Primary highway
P.S./E. Sci.–Jan. ’04 [20]

P.S./E. Sci.–Jan. ’08 [8]
34 Point X is a location on the topographic map below. Elevations are measured in meters.
What is a possible elevation, in meters, of point X?(1) 55 (3) 68(2) 57 (4) 70
35 The topographic map below shows two hills labeled A and B. The tributary streams labeled X and Y havethe same volume of water.
Which statement is best supported by the map?(1) Hill A is higher than hill B. (3) Stream X flows faster than stream Y.(2) Hill B is higher than hill A. (4) Stream Y flows faster than stream X.
Stream
A
B
N
X
Y
75
X
50N

22 In which set are the rock drawings labeled with their correct rock types?
23 The topographic map below shows a lake and two rivers.
In which direction does each of the rivers flow?(1) The Sapphire River and the Garnet River both flow east.(2) The Sapphire River and the Garnet River both flow west.(3) The Sapphire River flows east and the Garnet River flows west.(4) The Sapphire River flows west and the Garnet River flows east.
GemLake
N
Garnet RiverSapphire River
( 1 )
Sedimentary MetamorphicIgneous
( 4 )
Sedimentary MetamorphicIgneous
( 3 )
Sedimentary MetamorphicIgneous
( 2 )
Sedimentary MetamorphicIgneous
P.S./E. Sci.–Jan. ’08 [5] [OVER]

Base your answers to questions 82 through 84 on the topographic map below. Points A and B are referencepoints on the map. The symbols show the highest elevations on Eagle Hill and Timony Hill. Elevations areshown in feet.
82 Identify the general compass direction toward which Auroro Creek is flowing. [1]
83 State a possible elevation of the top of Patriot Hill. [1]
84 On the grid in your answer booklet, construct a topographic profile along line AB byplotting an X for the elevation of each contour line that crosses line AB. Connect theplotted Xs with a smooth, curved line to complete the profile. Points A and B havebeen plotted. [2]
712700
Timony Hill
Lake Muhl
Blu
e R
iver
Auroro Creek
Patriot Hill
730AEag
leHill
700
B
0 2 4 6 miles
N
Topographic Map
600
600
Contour interval = 20 feet
P.S./E. Sci.–Jan. ’09 [26]

PS/E. Sci.–Jan. ’11 [3] [OVER]
10 The least amount of surface water runoff willoccur when soil pore spaces are(1) saturated and the slope is steep(2) saturated and the slope is gentle(3) unsaturated and the slope is steep(4) unsaturated and the slope is gentle
11 Which map best shows the general surface windpattern in a low-pressure system located over theeastern United States?
12 Which landscape surface resulted primarily fromerosion by glaciers?
13 The formation of soil is primarily the result of(1) stream erosion and mass movement(2) stream deposition and runoff(3) precipitation and wind erosion(4) weathering and biological activity
14 Sediments found in glacial moraines are bestdescribed as(1) sorted and layered(2) sorted and not layered(3) unsorted and layered(4) unsorted and not layered
15 Old Forge and Watertown, located at nearly thesame latitude in New York State, have very different landscapes. Which factor is primarilyresponsible for these landscape differences?(1) average annual temperature(2) average annual precipitation(3) bedrock structure(4) soil characteristics
16 The topographic map below shows the location ofa stream. Points A and B are locations on Earth’ssurface.
What is the gradient between points A and B?(1) 1 m/km (3) 10 m/km(2) 2 m/km (4) 20 m/km
A
B
0 1 2 3 4 km
Contour interval = 10 m N
Strea
m100
( 2 ) ( 4 )
( 1 ) ( 3 )
( 1 )
( 2 )
( 3 )
( 4 )
Lowpressure
Lowpressure
Lowpressure
Lowpressure

P.S./E. Sci.–June ’01 [16]
Base your answers to questions 68 through 75 on the reading passage and topographic map below.
A group of Earth science students decided to take an adventurous camping trip, so theyrode bicycles to a New York State park that was located in an isolated area. They traveledup a steep hill. When they reached the top, they looked at the landscape and noticed a lakeat the bottom of the hill. They named it Hidden Lake. To the left of Hidden Lake was alarge field with a small stream. They decided to set up their campsite in the field nearHidden Lake. To get to the field, they cycled down a very steep slope.
The map below shows the location of the bicycle trail and the students’ campsite. Points P and Q are reference points on the map.
68 State the evidence shown on the map that indicates that the area directly north ofHidden Lake is relatively flat. [1]
69 a State the general compass direction in which the stream is flowing. [1]
b State how contour lines provide the evidence for determining this direction. [1]
70 On the grid provided in your answer booklet, draw a profile of the landscape alongthe bicycle trail from point P to point Q by following the directions below.
a Plot the elevation along line PQ by marking with a dot each point where a contourline is crossed by line PQ. Point P and point Q have been plotted for you. [2]
b Connect the dots to complete the profile. [1]
Key
Campsite
Bike trail
N
Contour interval: 20 feet
500
600
P Campsite
Stre
am
HiddenLake
Q
0 1 2 3 miles

Base your answers to questions 47 and 48 on the topographic maps and block diagrams of two landscaperegions shown below. The block diagrams show a three-dimensional view of the topographic maps directlyabove them. Elevations are measured in feet. Points A, B, C, and D are locations on Earth’s surface.
47 Which contour interval is used on both topographic maps?(1) 10 ft (3) 30 ft(2) 20 ft (4) 40 ft
48 A stream begins to flow downhill from point D toward the depression. After a period of time, the depression fills with water. Overflowing water from the depression moves downhill toward point C. Which topographic map shows the mostlikely resulting change in the contour lines?
290
( 3 )
CD290
280
300
300
310
330300
( 4 )
CD
280
300
310
330
( 2 )
CD290
300
300300
280
310
330
( 1 )
CD290
300
300280
300
310
330
300
300
280
AB
CD
AB
280300
290300
300300
280
290
300
300
Landscape 1
C
Landscape 2
D
300
310
330
P.S./E. Sci.–Jan ’07 [15] [OVER]