
c Copyright 2014 Balaban Desalination Publications Notice...
40
This is the author’s version of a work that was submitted/accepted for pub- lication in the following source: Bao, Teng, Chen, Tian-hu, Qing, Chengsong, Jin Xie, Jin, & Frost, Ray L. (2016) Development and application of Palygorskite porous ceramsite in a biolog- ical aerated filter (BAF). Desalination and Water Treatment, 57 (4), pp. 1790-1803. This file was downloaded from: https://eprints.qut.edu.au/79688/ c Copyright 2014 Balaban Desalination Publications The Version of Record of this manuscript has been published and is available in Desalination and Water Treatment <date of publication> http://www.tandfonline.com/10.1080/19443994.2014.976770 Notice: Changes introduced as a result of publishing processes such as copy-editing and formatting may not be reflected in this document. For a definitive version of this work, please refer to the published source: https://doi.org/10.1080/19443994.2014.976770
Transcript of c Copyright 2014 Balaban Desalination Publications Notice...

This is the authorrsquos version of a work that was submittedaccepted for pub-lication in the following source
Bao Teng Chen Tian-hu Qing Chengsong Jin Xie Jin amp Frost Ray L(2016)Development and application of Palygorskite porous ceramsite in a biolog-ical aerated filter (BAF)Desalination and Water Treatment 57 (4) pp 1790-1803
This file was downloaded from httpseprintsquteduau79688
ccopy Copyright 2014 Balaban Desalination Publications
The Version of Record of this manuscript has been publishedand is available in Desalination and Water Treatment ltdate of publicationgthttpwwwtandfonlinecom101080194439942014976770
Notice Changes introduced as a result of publishing processes such ascopy-editing and formatting may not be reflected in this document For adefinitive version of this work please refer to the published source
httpsdoiorg101080194439942014976770
1
Preparation of magnetic porous ceramsite and its application in
biological aerated filters
Teng Baoab Tianhu Chenalowast Haibo Liua bDong Chena b Chengsong Qinga
Ray L Frostblowast
a Laboratory for Nanominerals and Environmental Material School of Resource and
Environmental Engineering Hefei University of Technology China bSchool of Chemistry Physics and Mechanical Engineering Science and
Engineering Faculty Queensland University of Technology Australia
lowastAuthor to whom correspondence should be addressed TianhuChenchentianhhfuteducn Ray L Frost rfrostquteduau
2
Abstract
Ceramsite plays a significant role as a biological aerated filter (BAF) in the treatment
of wastewater In this study a mixture of goethite sawdust and palygorskite clay was
thermally treated to form magnetic porous ceramsite (MPC) An optimization
experiment was conducted to measure the compressive strength of the MPC X-ray
diffraction (XRD) scanning electron microscopy (SEM) and polarizing microscopy
(PM) characterized the pore structure of the MPC The results show that a
combination of goethite sawdust and palygorskite clay with a mass ratio of 1025 is
suitable for the formation of MPC The compressive strength of MPC conforms to the
Chinese national industrial standard (CJT 299-2008) for wastewater treatment The
SEM and PM results also show that the uniform and interconnected pores in MPC
were well suited for microbial growth The MPC produced in this study can serve as a
biomedium for advanced wastewater treatment
Keywords Magnetic porous ceramsite (MPC) Goethite Palygorskite clay
Biological aerated filter (BAF) Biofilm
3
1 Introduction
Porous ceramsite is an effective media used in biological aerated filters (BAFs)
for the treatment of wastewater [1] The characteristics of porous ceramsite are related
to the initial capital outlay process design and operation mode of BAFs These
characteristics also improve the efficiency and daily running costs such as
backwashing and air influx Mineral supports for porous ceramsite include zeolite
clay sand macadam coke anthracite coal and plastic materials such as polyethylene
and polystyrene [2 3] Studies in China during the late 1980s indicated that BAFs
which contained expanded clay as a biofilm support could achieve superior substrate
removal compared to sand and plastic media of similar dimensions [4]
Sawdust is a byproduct of timber processing and extraction In China the annual
production of sawdust amounts to nearly 180 million tons and is increasing by 6 to
8 per year [5] The generation of sawdust in earlier years has resulted in huge
accumulations in many parts of China The management of sawdust waste is a heavy
economic burden to industry [6] and it is important to utilize or add value to waste
sawdust Lu et al [7] reported that at high sintering temperatures the lignin and
cellulose in sawdust can be converted into a carbonaceous porous material which
could be used as a cellular material However to the best of our knowledge only a
small number of studies have reported the use of sawdust as a porous material [8]
Palygorskite is a natural magnesium-aluminum silicate clay mineral with a
diameter of 30-50 nm It is known to contain continuous two-dimensional tetrahedral
sheets but differs from other layered silicates due to its lack of continuous octahedral
sheets The tetrahedral basal oxygen atoms invert apical directions at regular intervals
and thereby forming talc-like ribbons It has a high surface area viscosity and
porosity as well as significant thermal resistance and chemical inertness In China
palygorskite resources are abundant in the eastern part of Anhui Province and western
part of Jiangsu Province It is an excellent absorbent and recent attention has focused
on the utilization of palygorskite [9-11]
To the best of our knowledge there is no study investigating palygorskite for
the production of ceramsite The compositional and structural variations of ceramsite
4
obtained in previous studies were attributed to many factors such as sintering
temperature sintering time and the ratio of palygorskitegoethite However no
studies have yet been conducted to investigate the impact of the specific and
important constituents on the characteristics of ceramsite As one of these components
palygorskite may strongly affect the bloating behavior and crystal formation of
ceramsite during the heat treatment process
The application of magnetic materials to solve environmental problems has
received considerable attention in recent years due to their ability to separate
substances in a liquid medium after adsorption [12-16] Although magnetite (Fe3O4)
has been used to precipitate heterogeneous calcium phosphate its use in the context of
environmental pollution has not received much attention Scarce information is
available on the potential application of magnetite as a phosphate sorbent
[17]Magnetized BAF has been used in treating wastewater mostly to separate solids
or attached microorganisms from effluent Reports indicate that there was an increase
in bacterial activity during the separation process[18]
The selection of a suitable BAF medium is critical in process design and
operation if the required effluent standards are to be met The characteristics of the
filter media can significantly affect the initial investment and operational costs The
selection of the BAF media will depend on many factors including its resistance to
microbial degradation its mechanical strength the type of fluid used its surface
characteristics and its cost In this study the MPC was prepared by sintering a
mixture of goethite sawdust and palygorskite Sawdust was treated at 400-800 degC to
produce a desirable porous material During sintering goethite is transformed into
magnetite in the presence of H2 gas emitted during pyrolysis at 400 degC [19] The
formation of an interior porosity improves microbial growth This study may lead to a
promising new method for the preparation of biofilter carriers
To validate this hypothesis the present study has been conducted to (i) utilize
palygorskitegoethite and sawdust for the production of ceramsite (ii) investigate the
effect of palygorskite and sawdust on the physical characteristics (porosity) of
ceramsite (iii) characterize the ceramsite within the optimal content ranges of
5
palygorskitegoethite and sawdust via thermal analysis morphological structure
analysis X-ray diffraction and compressive strength (iv) analyze the sintering
mechanisms and (v) establish effective evaluation parameters
2 Methods and Materials
21 Material
The raw palygorskite came from Crown Hill located in the city of Mingguang
Anhui province China Sawdust was sampled from the city of Hefei Anhui province
China Goethite was obtained from the city of Zhenjiang Jiangsu province China
The particle size after extrusion cutting and crushing was less than 0074 mm
Commercial ceramsite (CC) was obtained from the city of Maanshan Anhui Province
China The characteristics of MPC and CC are specified in Table 5 MPC were
superior to CC in many ways including porosity specific surface area and apparent
density (Table 5)
22 Preparation of magnetic porous ceramsite (MPC)
The preparation of MPC includes the following steps
1) The mixture of goethite sawdust and palygorskite with the experimental
mass ratio was placed in a small coating machine which produced round granules
with a diameter of 7-13 mm
2) The products were dried at 110 degC
3) The composite iron oxide particles were put in a 2 L quartz tube reactor and
heated at 500 600 700 and 800 degC Each of these temperatures was maintained for
05-4 h under a N2 atmosphere at a flow rate of 30 mLmin
4) The annealed MPC was cooled to room temperature over 12 h
5) The synthesized MPC was stored in a vacuum desiccator for future analysis
23 The application of MPC in biological aerated filters (BAF)
Backwashing is a very important step in BAF operation BAFs need to be
optimized to reduce the water consumption and energy cost of backwashing To
6
achieve this the current methods attempt to reduce the apparent density of biofilter
carriers The increase in apparent density facilitates the merger of well-developed
microbial membranes with biofilter carriers in the BAF This increases the
inefficiency of BAF backwashing and may result in significant BAF short-circuited
current In addition it will create to excessive BAF backwashing These effects can
lead to excessive biofilm detachment which can result in deterioration of effluent
water quality
In this research magnetic porous ceramsite (MPC) is attracted to the
electromagnetic iron-separator (Fig 1) The experiments showed that the
electromagnetic iron-separator can shift the MPC in the BAF The MPC is moved to a
certain height and then the electricity supply is switched off and the MPC sheds
biofilm At the same time the MPC collide into each other and accumulate to form
voids that facilitates regeneration ability This method of making MPC voids obviates
the need for backwashing and the restoration process is much faster than combined
action gas-water backwashing
24 Characterization
The multi-point BrunauerndashEmmettndashTeller (BET) surface area of MPC was
measured using a Quantachrome Nova 3000e automated surface area analyzer X-ray
fluorescence (XRF) chemical composition was measured on a Shimadzu XRF-1800
with Rh radiation X-ray diffraction (XRD) was performed using a Rigaku powder
diffractometer with Cu Kα radiation The tube voltage was 40 kV and the current was
100 mA The XRD diffraction patterns were taken in the range of 5-70 degC at a scan
speed of 4deg min-1 Phase identification (Search-Match) was carried out by comparison
with those included in the Joint Committee of Powder Diffraction Standards (JCPDS)
database Elemental analyses of the sample were carried out by a VARIO ELIII
analyzer (Elemental analysis system Co Ltd Germany) Magnetic susceptibility
analyses of the samples were carried out via a Bartinton MS2 analyzer
The thermal behavior of samples was examined by DTA-TGA7300 using an
EXSTAR simultaneous DTA-TGA7300 analyzer while the samples were heated at a
7
rate of 8 oCmin from 20 to 700 oC with nitrogen atmosphere at 100 mLmin Samples
ranged from 4 to 10 mg in mass and they were compacted into a Pt-Rh crucible with
20 taps
In the biological structures analysis selected MPC were sputter coated with gold
and its surface morphology was examined using a Scanning Electron Microscope
(SEM Philips XL30 ESEM) Biofilm determination was performed as previously
described [20] The growth of biofilm was determined according methods in the
available literature [21] The physical characteristics of the MPC samples were
measured in accordance with the sandstone pore structure method of image analysis
Archimedes law (ie any object placed in a fluid displaces its weight and an
immersed object displaces its volume) is an accurate method for porosity
measurement that we utilized [22]
3 Results and discussion
31 Effects of magnetic porous ceramsite (MPC) preparation
311 Effect of palygorskite
Figure 2 shows the effect of palygorskite on the compressive strength and
porosity of MPC Our study shows that 1) when the content of palygorskite increases
from 10 wt to 50 wt the compressive strength increases from 2 N to 18 N and the
porosity decreases from 84 to 76 and 2) when the content of palygorskite
increases from 50 wt to 70 wt the compressive strength increases from 18 N to 61
N and the porosity decreases from 76 to 53
It should be noted that the effect of palygorskite content on the compressive
strength is significant when the content is 50 wt to 70 wt This result indicates that
the increasing content of palygorskite improves the mechanical strength of MPC The
densification and melting of the MPC surface are possible reasons for the increase in
the compressive strength of MPC with higher palygorskite
(Mg5Si8O2O(OH)2(H2O)4∙5H2O) contents ( SiO2 contentsge5696) This implies
that the texture of MPC may play an important role in determining the compressive
strength [2324] A study by Park and Heo indicated that as the content of palygorskite
8
increases the bonding strength of metal ions increases which can enhance the
compressive strength [25] It should be noted that the effect of palygorskite contents
on the porosity is significant when the content of palygorskite is 50 wt to 70 wt
This result indicates that the increase in palygorskite and sawdust (porosity) accounts
for the decrease in porosity [2627]
312 Effect of sawdust
Figure 3 shows the effect of sawdust on the compressive strength and porosity of
MPC Our study shows that there is a clear tendency for MPC to decrease in
compressive strength as the amount of sawdust increases When sawdust is raised
from 0 wt to 20 wt the compressive strength decreases from 59 to 45 N and the
porosity increases from 3 to 67 When sawdust is raised from 20 wt to 50 wt
the increased sawdust has a large effect on the compressive strength Compressive
strength decrease from 45 to 2 N and the porosity increases from 67 to 90
Reports indicate that sawdust could react with carbon to generate CO2 [28] The CO2
product may diffuse or expand through the interior of the MPC particles reducing the
compressive strength [29] This may explain the decreasing compressive strength with
increasing sawdust when sawdust is a major component in MPC materials (Figure 2) 313 Effect of calcination temperature
Figure 4 shows the effects of calcination temperature on compressive strength
and porosity of MPC With an increase of calcination temperature from 400 degC to
800 degC the compressive strength increases linearly from 20 N to 60 N The
compressive strength increased by 8 N with increases in calcination temperature from
700 degC to 800 degC This indicates that MPC consolidation mechanisms like solid state
and liquid phase sintering are not effective when the sintering temperature is below
500 degC
Figure 4 shows the porosity of MPC treated at different temperatures
(400-800 degC) The relationship between the sintering temperature and the porosity of
MPC (25-75) is clear After sintering at 400-800 degC a continuous increase in the
porosity is observed The MPC sintered at 700 degC has the highest porosity (74) and
9
compressive strength (52 N) At 800 degC there is a slight decrease in the porosity
(74-76) In addition the porosity of MPC after sintering is maximal This implies
that the adsorption and crystallization of water as well as the other adsorbed volatile
compounds vanish from the as-received MPC (Fig 7)
During sintering the Si4+ is solidified in tectosilicate with a tetrahedron network
of SiO44- (Si-O-Si) The raw materials with a proper content of SiO2 can enhance the
formation of liquid phase at temperatures higher than 500 degC because the higher
temperature encloses the solid particles and packs the pores in the solid particles
[30-33] Higher temperatures decrease the pores of MPC and improve the binding
forces between the solid particles through the capillary action The variation in SiO2
contents can either also reduce the liquid phase in the MPC bodies and it can make
the MPC bodies denser with an increase in compressive strength that expands at
temperatures above 500 degC [34] During the MPC sintering process palygorskite
(Al2O3 contents 960) is a skeleton material The Al2O3 (contents 960) can react
with other components when temperatures are higher than 500 degC to form silicate
mineral groups with relatively lower eutectic points and the reaction effectively
lowers the sintering point of the MPC and enhances the formation of the liquid phase
[35] The proper quantities of Al2O3 (960) are beneficial to the liquid phase
sintering at temperatures higher than 500 degC and improve the characteristics of MPC
[36] Our tests show that the calcination temperature has a great impact on the
compressive strength from 500 degC to 700 degC 314 Effect of calcination time
Figure 5 shows that the compressive strength increased by 10 N (from 48 N
increased to 58 N) when the calcination is performed at 700 oC for 05-40 h After 1 h
the MPC compressive strength reached 51 N There are only slight increases as
calcination time is extended from 15 h to 4 h
Figure 5 shows different porosity time curves for MPC When the calcination
time increased (from 05 h to 3 h) the porosity of MPC increased from 50 to 69
When calcined at 500 degC the main forces affecting the porosity of MPC are water
10
molecules sawdust and decomposition of volatile substances The effect of
temperature on MPC diffusion is not obvious but the effect of temperature on
sawdust [3C6H10O5] is known MPC dehydration during calcination causes water
evaporation Thus the space occupied by sawdust is emptied This increases the
porosity
Excessive calcination time (4 h) causes the internal gas pressure to increase
while the resistance is relatively low The gases begin to escape more easily and the
internal microporous structure might be destroyed (Fig 7) [3738] Therefore the
ideal calcination time should be 1 h to 3 h to achieve the ideal effects for compressive
strength
315 Analysis of orthogonal experiments
Goethite was the main component of the MPC tested The palygorskite clay
and sawdust were mixed with goethite to make the new type of MPC
Five factors were considered in the MPC preparation goethite dosage ratio of
palygorskite clay added ratio of sawdust added calcination temperature and
calcination time
The ratio of palygorskite clay and sawdust added both depend on
the goethite dosage Orthogonal tests analyzed the influence of the five factors on the
properties of MPC The results show the optimized experimental conditions for
the preparation of MPC (Tables 1-4)
An orthogonal L943 test was used to optimize the particle preparation conditions
The evaluation index was analyzed statistically The orthogonal test designs are listed
in Table 2 Since we could not select the best preparation conditions based solely on
the outcomes in Table 3 a further orthogonal analysis was warranted Thus the Kmn
and Rn values were calculated We found that the influence on the comprehensive
index of MPC decreases in the following order ratio of palygorskite clay added gt
calcination time gt calcination temperature gt ratio of sawdust added according to the R
values (R1gt R4gt R3 gtR2) The goethite dosage was found to be the most important
determinant of preparation The optimal preparation conditions of goethite were 100
11
g palygorskite at 50 wt and sawdust added at 20 wt The calcination is optimized
at 700 degC for 2 h (Table 4)
32 Magnetic porous ceramsite (MPC) characterization evaluation
The best preparation formula for MPC was a ratio of 1025 (mass
ratio) raw goethite sawdust and palygorskite clay The optimal calcination
temperature and time for MPC are 700 degC and 2 h This formula met the Chinese
national standards for MPC [22] (in Table 5) Contrast pictures of our synthesized
MPC (left) and MPC are shown in Figure 9) The photographs illustrate MPC after
magnetic separation composite particles (Figure 9(a)) magnetic porous ceramsite
(Figure 9(b)) and magnetic separation of the MPC (Figure 9(c))
33 X-ray diffraction (XRD)and magnetic susceptibility
Figure 6 shows the XRD patterns of as-synthesized MPC and MPC (700 degC 2
h) The main minerals in our synthesized MPC include quartz (SiO2) palygorskite
and goethite (FeOOH) (see Figure 6a) In contrast the main minerals in MPC (Fig 6b)
are quartz (SiO2) hematite palygorskite and magnetite (Fe3O4) Comparing the
results in Figure 6b shows that goethite has transformed into magnetic particles after
sintering procession The reflections at 2θ=98 223 27 and 32deg are found and
identified as MPC when compared with the standard JCPDS (89-6538) In addition a
new reflection at 2θ=26deg was also found and identified as quartz [39-42]
In this study a mixture of goethite sawdust and palygorskite clay was
thermally treated (under a N2 atmosphere) to form MPC The magnetic susceptibility
of the MPC( Xmass=1169010-8m3kg )
34 X-ray fluorescence (XRF) and Elemental analysis (EA)
The chemical compositions measured by EA indicate that the sawdust consisted
of C 4609 H 685 O 3509 N 06 S 01 as well as small amounts of Cl P
K and Si The chemical compositions measured by XRF indicate that the goethite
consists of Fe 6607 Si 1580 Al 574 Ca 157 Mg 068 Cr 003 K
12
098 P 007 Na 024 Pb 022 Cu 046 Mn 431 as well as small
amounts of As S Ba Zr Sr Zn Ni and Ti The chemical compositions measured by
XRF indicate that the palygorskite consisted of SiO2 5510 Al2O3 960 Fe2O3
570 Na2O 005 K2O 096 CaO 042 MgO 1070 MnO 001 and TiO2
032 No indication of heavy metals related to the analyzed material indicates that it
is appropriate for filter media and microbial growth Therefore it is speculated that
the presence of so many kinds of elements favors the growth of microorganism
35 Composite particles morphological structures (SEM) analyses
The SEM images of composite particles calcined at 700 degC for 4 h and
composite particles calcined at 800 degC for 4 h are shown in Figure 7 The SEM
observations show that the porous structures become more compact due to the
increasing calcination time (4 h) The observations clearly show that the particulate
nature of the crystals in the composite increases with calcination time Bonding of
sintered crystals is evident by the cohesive necks growing at the composite particle
contact points (Fig 7(a)) As seen in composite particles with calcination time of
700 degC for 4 h there are abundant small pores with thin boundaries and large cracks
with no boundary present on the surface This is caused by the release of gases
(Figure 7(a)) In Figure 7(b) the microstructure of the composite particle interior is
seen after treatment at 700 degC for 4 h The water absorption of the composite particles
at 700 degC for 4 h remains relatively low despite the increasing number of pore space
because the gas produced cannot create sufficient voids in the composite particle
bodies The gases begin to escape more easily and the internal microporous structure
might be destroyed
The surface of the composite particles treated at 800 degC for 4 h has few pores
The micrograph of these particles clearly shows that some micropores (60 microm pore
size 100 microm) are irregularly distributed in the microstructure and macropores (Figure
7(c)) Melting phenomena are also observed on the crystalline surface of the
composite particles treated at 800 degC for 4 h (Fig 7(c)) The release of gases and
melting of raw materials allow the large pores to form The water absorption of the
13
composite particles treated at 800 degC for 4 h remains relatively low despite the larger
pores because the impervious skin layer of the pellets restricts water ingress The
microstructure of these composite particles is also related to the lower viscosity of the
liquid phase produced at 800 degC and the consequent improvement in densification
during the natural cooling process These results indicate that denser and lower porous
ceramsite can be obtained via treatment at 800 degC for 4 h
The increasing densification and neck growth between the calcined composite
particles is seen in Figure 7(d) in the interior of the composite particles treated at
800 degC for 4 h However in Figure 7(d) the calcined composite particles samples
show a clear internal micropore structure between the composite particles that might
be destroyed suggesting melted neck growth The slight expansion of the composite
particles that occurs when sintered at 800 degC is clearly associated with the formation
of a significant number of approximately slit-shaped pores
36 Magnetic porous ceramsite and commercial ceramsite under scanning electron microscopy (SEM)
Several typical SEM images of the ordered structure and biomass growth of
MPCcommercial ceramsite are shown in Figure 8 In Figure 8(a) the appearance of a
rough surface on MPC is a coral-like porosity structure providing shelter from
the wastewater shear forces As observed from Figure 8(a) plenty of macropores are
formed on the surface of the internal surface which may serve as excellent locations
for the colonization of microorganisms In Figure 8(b) the microstructure of the
internal surface and a cross-section of the MPC is seen This indicates that the
prepared MPC has a high number of pores with rectangular openings and pores
interconnected to each other through a ladder-like structure as shown in Figure 8(a)
and Figure 8(b) During sintering macropores form inside the particles when sawdust
is removed via combustion MPC material with such porosity is suitable to serve as
the biomedium in a BAF reactor
The SEM images of the MPC after operation in the BAF reactor are provided in
Figure 8(c) and Figure 8(d) The biofilm overlays on the surface of the MPC Four
kinds of bacteria can be observed filamentous-shape coral-shape spherical and
14
chain-shape (Fig 8(c)) Obviously the more diverse the bacterial community the
more organic pollutants are able to be biodegraded After the growth of a bacterial
population a biofilm can be observed clearly on the surface of the internal porosity in
Figure 8(d) At the start-up phase in the BAF reactor the biofilms first develop when
some bacteria irreversibly attach to the MPC After more metabolites accumulate on
the MPC surface the MPC is completely covered by the biofilms which are observed
randomly on the surface Our MPC has a high capacity for bacterial growth
In Figure 8(e) the micrograph of commercial ceramsite (CC) clearly shows that
pores with diameters ranging from 10 to 50 microm are irregularly distributed on the
surface There are some small pores and smooth surfaces The microstructure in
Figure 8(f) suggests that a small number of microorganisms are immobilized to the
inside and outside surfaces of the pores in CC The CC calcination temperature is
1200 degC This will destroy the clay crystal structure of the main raw material and the
CC surface in high temperature calcination conditions is a crystalline glaze The
biofilm biomass and adsorption performance is poor which impacts the overall
performance of this product [43]
37 Cast thin section of magnetic porous ceramsite (MPC) In a BAF system biofilter carriers play a significant role in meeting effluent
quality requirements The granular media is employed in the biofilter bed for solid
interception and solid-liquid separation The media is also the carrier of biofilm The
characteristics of the biofilter carriers have significant impacts on the treatment
efficiency [44]
The roughness and porosity of the open MPC surface are beneficial for
microorganisms fixed to the surface The microbial biofilm attached to the MPC
surface is a highly hydrophilic substance under conditions of constant flow of sewage
Environmental microorganisms can be transferred through the MPC into the interior
pores (Fig 10(a)) and the microbial biofilm can attach to the surface of the MPC
Wastewater flow can be divided into three layers the aqueous adhesion layer the
aerobic layer and the anoxic layer (Fig 10(b)) The actions of the microorganisms in
15
the biofilm lead to this zonation and create the conditions for simultaneous
nitrification and denitrification
In order to obtain direct evidence of environmental microorganisms in open
porosity of our MPC rubber casting experiments were used to generate quantitative
size and shape data from a thin section of pores Figure 11(a) shows the intergranular
pore textures observed in the thin section The black sections denote calcined
palygorskite biomass residues caused by carbonization while gray areas represent the
intergranular pores of MPC This demonstrates that MPC has a large volume of
internal porosity in which guest microbes can be accommodated The size of those
interconnected pores is approximately 40-65 μm (Fig 11(A) 11(B) and 11(C)) and
most bacteria are 05 microm or less in diameter Thus environmental microorganisms
can achieve a sustained growth of population in the open porosity When impregnated
with blue-dyed epoxy (part B) the fully interconnected porosity with a diameter of 60
μm can be determined from the white section (part A) In fact blue-dyed epoxy in the
porosity system must overcome the capillary resistance of the throat size before they
enter porosity space indicating the narrow composition of the pores 38 Thermal Properties (DT-TG) Analyses
Figure 12 presents the thermal analysis of the palygorskite
claygoethitesawdust mixture The DTA curve has 5 exothermic valleys and an
exothermic peak According to the crystal structure of the palygorskite clay and
crystal chemical formula the water in palygorskite clay has four states including
water adsorbed to the outer surface water adsorbed in tunnels water contained in the
crystal structure and structural water molecules coordinated to Mg(II) cations at the
edge of the octahedral sheets [45] The first endothermic valley is at 65 degC This
belongs to the water adsorbed to the outer surface and has a dehydrating effect The
second endothermic valley is at 98 degC the thermal effect of adsorbed water in
channels emerge and the weight of the adsorbed water on the outer surface and in
pores is 587 The third endothermic valley is at 230 degC and represents the crystal
water absorbing effect produced by extrusion It has a small and narrow endothermic
16
valley with 312 water loss The fourth endothermic valley at 481 degC is wider and
corresponds to the crystal degradation under thermal effects It is a 37 loss The
fifth endothermic valley is at 595 degC corresponding to the degradation of crystal
structure The amount of dehydration is 53
39 Determination of biomass in media
To investigate the performance of MPC and commercial ceramsite in the BAF
reactor the biomass of grown biofilm was determined The biofilm biomass was 541
mg TNg for MPC and 22 mg TNg for commercial ceramsite [46] Also the
structural and morphological characteristics of the porous media seen in Figure 8 and
Figure 11 proved that the MPC surface and internal pores are advantageous to
microbial growth under the conditions tested
4 Conclusions
(1) The MPC can be prepared from a mixture of goethite sawdust and palygorskite
by sintering at 700 degC for 120 min The proper mass ratio of goethite sawdust and
palygorskite is 1025 The results indicate that MPC has a larger specific surface area
(81 m2g) It has a porosity of 78 and a compressive strength range of 53-67 N
compared to commercial ceramsite (CC) which is superior to the regulatory levels in
the Chinese National Standards
(2) In the preparation of MPC the goethite can be transformed into magnetite
particles Thus this kind of ceramsite is a magnetic material Furthermore SEM and
PM results suggest that the uniform and interconnected pores in MPC are suitable for
microbial growth Experimental growth of biofilm in this material is superior to that
on CC It is speculated that these observations will favor the utilization of MPC in the
biotreatment of BAF
Acknowledgements
We gratefully acknowledge the support by the National Natural Science Foundation of
China (41072036 41130206 41372045) the Specialized Research Fund for the Doctoral
Program of Higher Education of China (20110111110003) and the Anhui Provincial
17
Natural Science Foundation (11040606Q30)
References
[1] Yu YZ Feng Y Qiu LP Effect of grain-slag media for the treatment of wastewater
in a biological aerated filter Bioresou Technol 99 (2008) 4120ndash4123
[2] Qiu LP Ma J Zhang LX Characteristics and utilization of biologically aerated
filter backwashed sludge Desalination 208 (2007) 73ndash80
[3] Sang JQ Zhang XH Li LZ et al Improvement of organics removal by
bioceramsite filtration of raw water with addition of phosphorusWater Res 37
(2003) 4711-4718
[4]Shen YJ Wu GX Fan YB et al Performances of biological aerated filter
employing hollow fiber membrane segments of surface-improved ploy (sulfone)
as biofilm carriers J Environ Sci 19 (2007) 811-877
[5] Salehi E Abedi J Harding T Bio-oil from sawdust pyrolysis of sawdust in a
fixed-bed system Energy Fuels 23 (2009)3767ndash3772
[6] Ji GD Zhou Y Tong JJ Nitrogen and phosphorus adsorption behavior of
ceramsite material made from coal ash and metallic iron Environ Eng Sci
27(2010)871-878
[7] Lu XX Song JM Li XG et al Geochemical characteristics of nitrogen in the
southern yellow sea surface sediments J Mar Syst 56 (2005)17-27
[8] Liu HB Chen TH Chang J et al The effect of hydroxyl groups and surface area
of hematite derived from annealing goethite for phosphate removal J Colloid
Interf Sci 398 (2013)88-94
[9]Fangqun Gan Jianmin Zhou Huoyan Wang et al Removal of phosphate from
aqueous solution by thermally treated natural palygorskite Water Res 43
(2009)2907-2915
[10]Hirsiger W Muller-Vonmoos M Wiedemann HG Thermal analysis of
palygorskite Thermochim 13(1975) 223-230
[11]Jha VK Kameshima Y Nakajima A Utilization of steel-making slag for the
uptake of ammonium and phosphate ions from aqueous solution J Hazard Mater
156 (2008)156-162
18
[12]Yavuza H Celebi SS Effects of magnetic field on activity of activated sludge in
wastewater treatment Enzyme Microb Technol 26(2000) 22-27
[13] Goodman EM Greenebaum B Marron MT Magnetic fields after translation in
Escherichia coli Bioelectromagnetics 15 (1994) 77-83
[14] Tabrah FL Mower HF Batkin S Greenwood PB Enhanced mutagenic effect of
a 60 Hz time-varying magnetic field on numbers of a zide-induced TA100
revertant colonies Bioelectromagnetics 15(1994) 85-93
[15] Ozaki H Liu Z Terashima Y Utilization of microorganisms immobilized with
magnetic particles for sewage and wastewater treatment Wat Sci Tech 23(1991)
1125-1136
[16]Jung J Sanji B Godbole S Sofer S Biodegradation of phenol A comparative
study with and without applying magnetic fields J Chem Tech Biotechnol
556(1993) 73-76
[17]Daou TJ Begin-Colin S Grene MJ Phosphate adsorption properties of
magnetite-based nanoparticles Chem Mater 19(2007) 4494-4505
[18] Zou JL Xu GR Pan K Nitrogen removal and biofilm structure affected by
CODNH4+ndashN in a biofilter with porous sludge ceramsite Sep Purif Technol
94(2012) 9-15
[19] Zou XH Chen TH Liu HB et al Structural and chromatic evolution of goethite
by thermal treatment J Chinese Ceramic Society 41(2013) 669-673(in Chinese)
[20] Zhu YR Zhang RY Wu FC Distribution of bioavailable nitrogen and
phosphorus forms and their relationship in the sediments of Dianchi Lake Res
Environ Sci 8(2010) 994-998 (in Chinese)
[21] Sandstone pore structure method of image analysis(Industry standard CJT) (in
Chinese)
[22] Chinese Mohurd Artifical ceramsite filter material for water treatment China
standard publishing house Beijing China 2008
[23] Xu GR Zou JL Li GB Ceramsite made with water and wastewater sludge and
its characteristics affected by SiO2 and Al2O3 Environ Sci Technol 42(2008)
7417-7423
19
[24] Park YJ Heo J Vitrification of fly ash from municipal solid waste incinerator J
Hazard Mater 91(2001) 83-93
[25] Toya T KameshimaY Yasumori A Preparation and properties of glass-ceramics
from wastes (Kira) of silica sand and kaolin clay refining J Eur Ceram Soc
24(2004) 2367-2372
[26] Yilmaz O Unlu K Cokca E Solidificationstabilization of hazardous wastes
containing metals and organic contaminants J Environ Eng 129(2003) 366-376
[27] Li CT Lee WJ Huang KL Vitrification of chromium electroplating sludge
Environ Sci Technol 41(2007) 2950-2956
[28] Gutsey GL Mochena MD Structure and properties of Fe4 with different
coverage by C and CO J Phys Chem 108(2004) 11409-11418
[29] Chen Y Lin B Research on enzyme immobilization by modified ceramsite
particle Chem Indus Eng Pro 10(2008) 1462-1478 (in Chinese)
[30] Huang CP Pan JRS Liu YR Mixing water treatment residual with excavation
waste soil in brick and artificial aggregate making J Environ Eng 131(2005)
272-277
[31] Tay JH Hong SY Show KY Reuse of industrial sludge as palletized aggregate
for concrete J Environ Eng 126 (2000) 279-287
[32] Shih K White T Oleckie J Spinel formation for stabilizing simulated nickel
laden sludge with aluminum rich ceramic precursors Environ Sci Technol
40(2006) 5077-5083
[33] Xu GR Zou JL Li GB Effect of sintering temperature on the characteristics of
sludge ceramsite J Hazard Mater 150(2008) 394-400
[34] Xu GR Zou JL Li GB Stabilization of heavy metals in ceramsite made with
sewage sludge J Hazard Mater 152(2008) 56-61
[35] Xu GR Zou JL Dai Y Utilization of dried sludge for making ceramsite Water
Sci Technol 54(2006) 69-79
[36] Xu GR Zhang WT Li GB Adsorbent obtained from CEPT sludge in wastewater
chemically enhanced treatment Water Res 39(2005) 5175-5185
[37]Fuliana A Conesa JA Font R Formation and destruction of chlorinated
20
pollutants during sewage sludge incineration Environ Sci Technol 38(2004)
2953-2958
[38] Mukherjee PS Lokanatha S Bhattacherjee S High temperature structural studies
in palygorskite J Mater Sci 26(1991) 6073-6077
[39] Frost R Ding Z Ruan H Thermal analysis of goethite J Thermal Anal
Calorim 71(2003) 783-791
[40] Gualtieri A F Venturelli P In situ study of the goethite-hematite phase
transformation by real time synchrotron powder diffraction Am Mineral
84(1999) 895-904
[41] Prasad PSR Shiva Prasad K Krishna Chaitanya V In situ FTIR study on the
dehydration of natural goethite J Asian Earth Sci 27(2006) 503-511
[42] Ozdemir O Dunlop DJ Earth Planet Intermediate magnetite formation during
dehydration of goethite Sci Lett 177(2000) 59-67
[43] He S Xue G Kong H The performance of BAF using natural zeolite as
filtermedia under conditions of low temperature and ammonium shock load J
Hazard Mater 143 (2007) 291-295
[44] Han S Yue Q Yue M et al The characteristics and application of sludge fly ash
ceramic particles (SFCP) as novel filter media J Hazard Mater 171(2009)
809-814
[45] Chen Tianhu Wang Jian Qing Chengsong et al Effect of heat treatment on
structure morphology and surface properties of palygorskite J Chinese Ceramic
Society (in Chinese)34(2006) 1407-1410
[46] Ha JH Ong SK Nitrification and denitrification in partially aerated biological
aerated filter (BAF) with dual size sand media Water Sci Technol 55(2007) 9-17
21
List of Figures
Fig 1 Schematic diagram of the BAF system
Fig 2 The effect of palygorskite clay addition on compressive strength and
porosity of MPC
Fig 3 The effect of sawdust addition on compressive strength and porosity of
MPC
Fig 4 MPC compressive strength and porosity as a function of calcination
temperature
Fig 5 MPC compressive strength and porosity as a function of calcination time
Fig 6 X-ray diffraction patterns of composite particles and prepared MPC
Fig 7 SEM images illustrating the internal and external surfaces of composite
particles calcined at 700 degC for 4 h and composite particles calcined at
800 degC for 4 h
Fig 8 SEM images illustrating the internal and external surfaces of
MPCcommercial ceramsite
Fig 9 Contrast pictures of as-synthesized (left) and calcined (right) MPC after
magnetic separation of the MPC
Fig 10 Images of internal MPC
Fig 11 Porosity of MPC
Fig 12 Differential thermal analysis and thermogravimetric analysis patterns of
MPC
22
Fig 1 Schematic diagram of the BAF system
(A) MPC BAF (B) Effluent pipe (C) Air blower (D) Wastewater pump (E)
Switching mode power supply (F) Electromagnetic iron-separator device (G)
Wastewater tank
D
C Influent Air
Influent Wastewater
V=550L
B B
F
E
A A
G
23
Fig 2 The effect of palygorskite clay addition on compressive strength and porosity of MPC
10 20 30 40 50 60 700
10
20
30
4050
60
70Porosity curve
Compressive strength curve
palygorskite addition
com
pres
sive
stre
ngth
N
50
55
60
65
70
75
80
85
porosity
24
Fig 3 The effect of sawdust addition on compressive strength and porosity of MPC
0 10 20 30 40 500
10
20
30
40
50
60 Compressive strength curve
Porosity curve
co
mpr
essiv
e st
reng
th N
sawdust addition 0
20
40
60
80
100
porosity
25
Fig 4 MPC compressive strength and porosity as a function of calcination temperature
400 500 600 700 80010
20
30
40
50
60
70
Porosity curve
Compressive strength curve
co
mpr
essiv
e st
reng
th N
Calcination temperature C
20
30
40
50
60
70
80
porosity
26
Fig 5 MPC compressive strength and porosity as a function of calcination time
0 2 445
50
55
60
Compressive strength curve
Porosity curve
com
pres
sive
stre
ngth
N
Calcination timeh
50
55
60
65
70
75
porosity
27
Fig 6 X-ray diffraction patterns of composite particles and MPC
(a) Composite particles (b) MPC
(P palygorskite Q quartz M magnetic H hematite)
10 20 30 40 50 60 702-Theta( deg)
H
G
H
G G GPP
G
P
a
b
Q
Rel
ativ
e in
tens
ityC
ps
MP
28
Fig 7 SEM images of composite particles calcined at 700 degC for 4 h and
composite particles calcined at 800 degC for 4 h
(a) raw external surface of composite particles calcined at 700 degC for 4 h
(b) raw internal surface of composite particles calcined at 700 degC for 4 h
(c) raw external surface of composite particles calcined at 800 degC for 4 h
(d) raw internal surface of composite particles calcined at 800 degC for 4 h
a b
c d
500μm 50μm
2μm 50μm
29
Fig 8 SEM images of MPCcommercial ceramsite
(a) raw external surface of MPC
(b) raw internal surface of MPC
(c) microbial load on external surface of MPC
(d) microbial load on internal surface of MPC
(e) raw external surface of CC
(f) microbial load on external surface of CC
5μm 2μm
d
e
a
50μm
b
50μm
c
f
5μm 1μm
30
Fig 9 Contrast pictures of composite particles (left) and MPC (right)
photographs after magnetic separation of the MPC (a) composite particles (b) MPC (c) magnetic separation of the MPC
31
Fig 10 Internal images of MPC
(a) Internal porosity of MPC (b) Layers of MPC when oxygen is introduced into
the system
(1 aqueous adhesion layer 2 aerobic layer 3 anoxic layer)
b
1 2
a
3
32
Fig 11 Porosity of MPC
(a) After calcination (gray ndash MPC) (b) Filled (dark blue ndash open pores)
(c) A higher resolution image illustrating the internal surface of MPC (dark blue
ndash open pores)
33
Fig 12 Differential thermal analysis and thermogravimetric analysis patterns of MPC
0 100 200 300 400 500 600 700 800 900
-1200
-1000
-800
-600
-400
-200
0
Temp( oC)Th
erm
ogra
vim
etri
c A
naly
sis(m
g)
Thermogravimetric Analysis
Differential Thermal Analysis
-10
0
10
20
30
40
50
60Differential Therm
al Analysis(m
gmin)
34
List of Tables
Table 1 Factors and levels of the orthogonal experimental design
Table 2 Factors and levels of the experimental results
Table 3 Design of orthogonal experiments
Table 4 Results of orthogonal experiments
Table 5 The regulatory levels of ceramics in MPC and CC as well as
the corresponding Chinese National Standards
35
Table 1 Factors and levels of the orthogonal experimental design Note the proportion of palygorskite and sawdust is accounted for in
goethite content percent
(A) The level (B) The amount of palygorskite ( wt GT) (C) Sawdust
dosage ( wt GT) (D) Calcination temperature (degC) (E) Calcination
time (h)
A n B n C n D n E n
ⅰ B 1 C 1 D 1 E 1
ⅱ B 2 C 2 D 2 E 2
ⅲ B 3 C 3 D 3 E 3
36
Table 2 Factors and levels values for the orthogonal experiments
A n B n C n D n E n
ⅰ 50 wt GT 20 wt GT 500degC 1h
ⅱ 60 wt GT 30 wt GT 600degC 2h
ⅲ 70 wt GT 40 wt GT 700degC 3h
37
Table 3 Design of orthogonal experiments
Note Ki indicates the level of compression strength R is the difference between
the largest average effect and minimum average effect for every factor An
is the Orthogonal experiment number Bn is Palygorskite (wt GT) Cn is
Sawdust (wt GT) Dn is Calcination temperature (degC) En is Calcination
time (h) and Fn is Compression strength (N)
A n B n C n D n E n Fn
ⅰ B 1 C 1 D 1 E 1 B 1C 1D 1E 1
ⅱ B 1 C 2 D 2 E 2 B 1C 2D 2E 2
ⅲ B 1 C 3 D 3 E 3 B 1C 3D 3E 3
ⅳ B 2 C 1 D 2 E 3 B 2C 1D 2E 3
ⅴ B 2 C 2 D 3 E 1 B 2C 2D 3E 1
ⅵ B 2 C 3 D 1 E 2 B 2C 3D 1E 2
ⅶ B 3 C 1 D 3 E 2 B 3C 1D 3E 2
ⅷ B 3 C 2 D 1 E 3 B 3C 2D 1E 3
ⅸ B 3 C 3 D 2 E 1 B 3C 3D 2E 1
K1n K11 K12 K13 K14
F K2n K21 K22 K23 K24
K3n K31 K32 K33 K34
R n R 1 R 2 R 3 R 4
38
Table 4 Results of orthogonal experiments
A B n C n D n E n Fn
1 50 wt GT 20 wt GT 500 degC 1 h 4940
2 50 wt GT 30 wt GT 600 degC 2 h 5113
3 50 wt GT 40 wt GT 700 degC 3 h 5214
4 60 wt GT 20 wt GT 600 degC 3 h 4512
5 60 wt GT 30 wt GT 700 degC 1 h 4015
6 60 wt GT 40 wt GT 500 degC 2 h 3827
7 70 wt GT 20 wt GT 700 degC 2 h 5865
8 70 wt GT 30 wt GT 500 degC 3 h 4023
9 70 wt GT 40 wt GT 600 degC 1 h 3478
K1 5089 5106 4263 4132 -
F K2 4118 4384 4368 4935 -
K3 4455 4355 5031 4583 -
R n 971 751 768 803 -
39
Table 5 The regulatory levels of ceramics in MPC and CC as well as the corresponding Chinese National Standards
Item Chinese National Standard MPC experimental levels CC experimental levels
Grain diameter dmm 05-90 3-5 4-6
Silt carrying capacity Cs le1 017 le1
Solubility in hydrochloric acid Cha le2 115 le15
Void fraction υ ge40 7631 >42
Specific surface area Swcm2g ge05times104 81times105 ge2times104
Piled density ρpgcm3 -------- 0617 le10
Apparent density ρapgcm3 --------- 1611 14-18
Compression strength N --------- 53-67 ge87
Porosity P --------- 78 --
- 24 Characterization
-

3
1 Introduction
Porous ceramsite is an effective media used in biological aerated filters (BAFs)
for the treatment of wastewater [1] The characteristics of porous ceramsite are related
to the initial capital outlay process design and operation mode of BAFs These
characteristics also improve the efficiency and daily running costs such as
backwashing and air influx Mineral supports for porous ceramsite include zeolite
clay sand macadam coke anthracite coal and plastic materials such as polyethylene
and polystyrene [2 3] Studies in China during the late 1980s indicated that BAFs
which contained expanded clay as a biofilm support could achieve superior substrate
removal compared to sand and plastic media of similar dimensions [4]
Sawdust is a byproduct of timber processing and extraction In China the annual
production of sawdust amounts to nearly 180 million tons and is increasing by 6 to
8 per year [5] The generation of sawdust in earlier years has resulted in huge
accumulations in many parts of China The management of sawdust waste is a heavy
economic burden to industry [6] and it is important to utilize or add value to waste
sawdust Lu et al [7] reported that at high sintering temperatures the lignin and
cellulose in sawdust can be converted into a carbonaceous porous material which
could be used as a cellular material However to the best of our knowledge only a
small number of studies have reported the use of sawdust as a porous material [8]
Palygorskite is a natural magnesium-aluminum silicate clay mineral with a
diameter of 30-50 nm It is known to contain continuous two-dimensional tetrahedral
sheets but differs from other layered silicates due to its lack of continuous octahedral
sheets The tetrahedral basal oxygen atoms invert apical directions at regular intervals
and thereby forming talc-like ribbons It has a high surface area viscosity and
porosity as well as significant thermal resistance and chemical inertness In China
palygorskite resources are abundant in the eastern part of Anhui Province and western
part of Jiangsu Province It is an excellent absorbent and recent attention has focused
on the utilization of palygorskite [9-11]
To the best of our knowledge there is no study investigating palygorskite for
the production of ceramsite The compositional and structural variations of ceramsite
4
obtained in previous studies were attributed to many factors such as sintering
temperature sintering time and the ratio of palygorskitegoethite However no
studies have yet been conducted to investigate the impact of the specific and
important constituents on the characteristics of ceramsite As one of these components
palygorskite may strongly affect the bloating behavior and crystal formation of
ceramsite during the heat treatment process
The application of magnetic materials to solve environmental problems has
received considerable attention in recent years due to their ability to separate
substances in a liquid medium after adsorption [12-16] Although magnetite (Fe3O4)
has been used to precipitate heterogeneous calcium phosphate its use in the context of
environmental pollution has not received much attention Scarce information is
available on the potential application of magnetite as a phosphate sorbent
[17]Magnetized BAF has been used in treating wastewater mostly to separate solids
or attached microorganisms from effluent Reports indicate that there was an increase
in bacterial activity during the separation process[18]
The selection of a suitable BAF medium is critical in process design and
operation if the required effluent standards are to be met The characteristics of the
filter media can significantly affect the initial investment and operational costs The
selection of the BAF media will depend on many factors including its resistance to
microbial degradation its mechanical strength the type of fluid used its surface
characteristics and its cost In this study the MPC was prepared by sintering a
mixture of goethite sawdust and palygorskite Sawdust was treated at 400-800 degC to
produce a desirable porous material During sintering goethite is transformed into
magnetite in the presence of H2 gas emitted during pyrolysis at 400 degC [19] The
formation of an interior porosity improves microbial growth This study may lead to a
promising new method for the preparation of biofilter carriers
To validate this hypothesis the present study has been conducted to (i) utilize
palygorskitegoethite and sawdust for the production of ceramsite (ii) investigate the
effect of palygorskite and sawdust on the physical characteristics (porosity) of
ceramsite (iii) characterize the ceramsite within the optimal content ranges of
5
palygorskitegoethite and sawdust via thermal analysis morphological structure
analysis X-ray diffraction and compressive strength (iv) analyze the sintering
mechanisms and (v) establish effective evaluation parameters
2 Methods and Materials
21 Material
The raw palygorskite came from Crown Hill located in the city of Mingguang
Anhui province China Sawdust was sampled from the city of Hefei Anhui province
China Goethite was obtained from the city of Zhenjiang Jiangsu province China
The particle size after extrusion cutting and crushing was less than 0074 mm
Commercial ceramsite (CC) was obtained from the city of Maanshan Anhui Province
China The characteristics of MPC and CC are specified in Table 5 MPC were
superior to CC in many ways including porosity specific surface area and apparent
density (Table 5)
22 Preparation of magnetic porous ceramsite (MPC)
The preparation of MPC includes the following steps
1) The mixture of goethite sawdust and palygorskite with the experimental
mass ratio was placed in a small coating machine which produced round granules
with a diameter of 7-13 mm
2) The products were dried at 110 degC
3) The composite iron oxide particles were put in a 2 L quartz tube reactor and
heated at 500 600 700 and 800 degC Each of these temperatures was maintained for
05-4 h under a N2 atmosphere at a flow rate of 30 mLmin
4) The annealed MPC was cooled to room temperature over 12 h
5) The synthesized MPC was stored in a vacuum desiccator for future analysis
23 The application of MPC in biological aerated filters (BAF)
Backwashing is a very important step in BAF operation BAFs need to be
optimized to reduce the water consumption and energy cost of backwashing To
6
achieve this the current methods attempt to reduce the apparent density of biofilter
carriers The increase in apparent density facilitates the merger of well-developed
microbial membranes with biofilter carriers in the BAF This increases the
inefficiency of BAF backwashing and may result in significant BAF short-circuited
current In addition it will create to excessive BAF backwashing These effects can
lead to excessive biofilm detachment which can result in deterioration of effluent
water quality
In this research magnetic porous ceramsite (MPC) is attracted to the
electromagnetic iron-separator (Fig 1) The experiments showed that the
electromagnetic iron-separator can shift the MPC in the BAF The MPC is moved to a
certain height and then the electricity supply is switched off and the MPC sheds
biofilm At the same time the MPC collide into each other and accumulate to form
voids that facilitates regeneration ability This method of making MPC voids obviates
the need for backwashing and the restoration process is much faster than combined
action gas-water backwashing
24 Characterization
The multi-point BrunauerndashEmmettndashTeller (BET) surface area of MPC was
measured using a Quantachrome Nova 3000e automated surface area analyzer X-ray
fluorescence (XRF) chemical composition was measured on a Shimadzu XRF-1800
with Rh radiation X-ray diffraction (XRD) was performed using a Rigaku powder
diffractometer with Cu Kα radiation The tube voltage was 40 kV and the current was
100 mA The XRD diffraction patterns were taken in the range of 5-70 degC at a scan
speed of 4deg min-1 Phase identification (Search-Match) was carried out by comparison
with those included in the Joint Committee of Powder Diffraction Standards (JCPDS)
database Elemental analyses of the sample were carried out by a VARIO ELIII
analyzer (Elemental analysis system Co Ltd Germany) Magnetic susceptibility
analyses of the samples were carried out via a Bartinton MS2 analyzer
The thermal behavior of samples was examined by DTA-TGA7300 using an
EXSTAR simultaneous DTA-TGA7300 analyzer while the samples were heated at a
7
rate of 8 oCmin from 20 to 700 oC with nitrogen atmosphere at 100 mLmin Samples
ranged from 4 to 10 mg in mass and they were compacted into a Pt-Rh crucible with
20 taps
In the biological structures analysis selected MPC were sputter coated with gold
and its surface morphology was examined using a Scanning Electron Microscope
(SEM Philips XL30 ESEM) Biofilm determination was performed as previously
described [20] The growth of biofilm was determined according methods in the
available literature [21] The physical characteristics of the MPC samples were
measured in accordance with the sandstone pore structure method of image analysis
Archimedes law (ie any object placed in a fluid displaces its weight and an
immersed object displaces its volume) is an accurate method for porosity
measurement that we utilized [22]
3 Results and discussion
31 Effects of magnetic porous ceramsite (MPC) preparation
311 Effect of palygorskite
Figure 2 shows the effect of palygorskite on the compressive strength and
porosity of MPC Our study shows that 1) when the content of palygorskite increases
from 10 wt to 50 wt the compressive strength increases from 2 N to 18 N and the
porosity decreases from 84 to 76 and 2) when the content of palygorskite
increases from 50 wt to 70 wt the compressive strength increases from 18 N to 61
N and the porosity decreases from 76 to 53
It should be noted that the effect of palygorskite content on the compressive
strength is significant when the content is 50 wt to 70 wt This result indicates that
the increasing content of palygorskite improves the mechanical strength of MPC The
densification and melting of the MPC surface are possible reasons for the increase in
the compressive strength of MPC with higher palygorskite
(Mg5Si8O2O(OH)2(H2O)4∙5H2O) contents ( SiO2 contentsge5696) This implies
that the texture of MPC may play an important role in determining the compressive
strength [2324] A study by Park and Heo indicated that as the content of palygorskite
8
increases the bonding strength of metal ions increases which can enhance the
compressive strength [25] It should be noted that the effect of palygorskite contents
on the porosity is significant when the content of palygorskite is 50 wt to 70 wt
This result indicates that the increase in palygorskite and sawdust (porosity) accounts
for the decrease in porosity [2627]
312 Effect of sawdust
Figure 3 shows the effect of sawdust on the compressive strength and porosity of
MPC Our study shows that there is a clear tendency for MPC to decrease in
compressive strength as the amount of sawdust increases When sawdust is raised
from 0 wt to 20 wt the compressive strength decreases from 59 to 45 N and the
porosity increases from 3 to 67 When sawdust is raised from 20 wt to 50 wt
the increased sawdust has a large effect on the compressive strength Compressive
strength decrease from 45 to 2 N and the porosity increases from 67 to 90
Reports indicate that sawdust could react with carbon to generate CO2 [28] The CO2
product may diffuse or expand through the interior of the MPC particles reducing the
compressive strength [29] This may explain the decreasing compressive strength with
increasing sawdust when sawdust is a major component in MPC materials (Figure 2) 313 Effect of calcination temperature
Figure 4 shows the effects of calcination temperature on compressive strength
and porosity of MPC With an increase of calcination temperature from 400 degC to
800 degC the compressive strength increases linearly from 20 N to 60 N The
compressive strength increased by 8 N with increases in calcination temperature from
700 degC to 800 degC This indicates that MPC consolidation mechanisms like solid state
and liquid phase sintering are not effective when the sintering temperature is below
500 degC
Figure 4 shows the porosity of MPC treated at different temperatures
(400-800 degC) The relationship between the sintering temperature and the porosity of
MPC (25-75) is clear After sintering at 400-800 degC a continuous increase in the
porosity is observed The MPC sintered at 700 degC has the highest porosity (74) and
9
compressive strength (52 N) At 800 degC there is a slight decrease in the porosity
(74-76) In addition the porosity of MPC after sintering is maximal This implies
that the adsorption and crystallization of water as well as the other adsorbed volatile
compounds vanish from the as-received MPC (Fig 7)
During sintering the Si4+ is solidified in tectosilicate with a tetrahedron network
of SiO44- (Si-O-Si) The raw materials with a proper content of SiO2 can enhance the
formation of liquid phase at temperatures higher than 500 degC because the higher
temperature encloses the solid particles and packs the pores in the solid particles
[30-33] Higher temperatures decrease the pores of MPC and improve the binding
forces between the solid particles through the capillary action The variation in SiO2
contents can either also reduce the liquid phase in the MPC bodies and it can make
the MPC bodies denser with an increase in compressive strength that expands at
temperatures above 500 degC [34] During the MPC sintering process palygorskite
(Al2O3 contents 960) is a skeleton material The Al2O3 (contents 960) can react
with other components when temperatures are higher than 500 degC to form silicate
mineral groups with relatively lower eutectic points and the reaction effectively
lowers the sintering point of the MPC and enhances the formation of the liquid phase
[35] The proper quantities of Al2O3 (960) are beneficial to the liquid phase
sintering at temperatures higher than 500 degC and improve the characteristics of MPC
[36] Our tests show that the calcination temperature has a great impact on the
compressive strength from 500 degC to 700 degC 314 Effect of calcination time
Figure 5 shows that the compressive strength increased by 10 N (from 48 N
increased to 58 N) when the calcination is performed at 700 oC for 05-40 h After 1 h
the MPC compressive strength reached 51 N There are only slight increases as
calcination time is extended from 15 h to 4 h
Figure 5 shows different porosity time curves for MPC When the calcination
time increased (from 05 h to 3 h) the porosity of MPC increased from 50 to 69
When calcined at 500 degC the main forces affecting the porosity of MPC are water
10
molecules sawdust and decomposition of volatile substances The effect of
temperature on MPC diffusion is not obvious but the effect of temperature on
sawdust [3C6H10O5] is known MPC dehydration during calcination causes water
evaporation Thus the space occupied by sawdust is emptied This increases the
porosity
Excessive calcination time (4 h) causes the internal gas pressure to increase
while the resistance is relatively low The gases begin to escape more easily and the
internal microporous structure might be destroyed (Fig 7) [3738] Therefore the
ideal calcination time should be 1 h to 3 h to achieve the ideal effects for compressive
strength
315 Analysis of orthogonal experiments
Goethite was the main component of the MPC tested The palygorskite clay
and sawdust were mixed with goethite to make the new type of MPC
Five factors were considered in the MPC preparation goethite dosage ratio of
palygorskite clay added ratio of sawdust added calcination temperature and
calcination time
The ratio of palygorskite clay and sawdust added both depend on
the goethite dosage Orthogonal tests analyzed the influence of the five factors on the
properties of MPC The results show the optimized experimental conditions for
the preparation of MPC (Tables 1-4)
An orthogonal L943 test was used to optimize the particle preparation conditions
The evaluation index was analyzed statistically The orthogonal test designs are listed
in Table 2 Since we could not select the best preparation conditions based solely on
the outcomes in Table 3 a further orthogonal analysis was warranted Thus the Kmn
and Rn values were calculated We found that the influence on the comprehensive
index of MPC decreases in the following order ratio of palygorskite clay added gt
calcination time gt calcination temperature gt ratio of sawdust added according to the R
values (R1gt R4gt R3 gtR2) The goethite dosage was found to be the most important
determinant of preparation The optimal preparation conditions of goethite were 100
11
g palygorskite at 50 wt and sawdust added at 20 wt The calcination is optimized
at 700 degC for 2 h (Table 4)
32 Magnetic porous ceramsite (MPC) characterization evaluation
The best preparation formula for MPC was a ratio of 1025 (mass
ratio) raw goethite sawdust and palygorskite clay The optimal calcination
temperature and time for MPC are 700 degC and 2 h This formula met the Chinese
national standards for MPC [22] (in Table 5) Contrast pictures of our synthesized
MPC (left) and MPC are shown in Figure 9) The photographs illustrate MPC after
magnetic separation composite particles (Figure 9(a)) magnetic porous ceramsite
(Figure 9(b)) and magnetic separation of the MPC (Figure 9(c))
33 X-ray diffraction (XRD)and magnetic susceptibility
Figure 6 shows the XRD patterns of as-synthesized MPC and MPC (700 degC 2
h) The main minerals in our synthesized MPC include quartz (SiO2) palygorskite
and goethite (FeOOH) (see Figure 6a) In contrast the main minerals in MPC (Fig 6b)
are quartz (SiO2) hematite palygorskite and magnetite (Fe3O4) Comparing the
results in Figure 6b shows that goethite has transformed into magnetic particles after
sintering procession The reflections at 2θ=98 223 27 and 32deg are found and
identified as MPC when compared with the standard JCPDS (89-6538) In addition a
new reflection at 2θ=26deg was also found and identified as quartz [39-42]
In this study a mixture of goethite sawdust and palygorskite clay was
thermally treated (under a N2 atmosphere) to form MPC The magnetic susceptibility
of the MPC( Xmass=1169010-8m3kg )
34 X-ray fluorescence (XRF) and Elemental analysis (EA)
The chemical compositions measured by EA indicate that the sawdust consisted
of C 4609 H 685 O 3509 N 06 S 01 as well as small amounts of Cl P
K and Si The chemical compositions measured by XRF indicate that the goethite
consists of Fe 6607 Si 1580 Al 574 Ca 157 Mg 068 Cr 003 K
12
098 P 007 Na 024 Pb 022 Cu 046 Mn 431 as well as small
amounts of As S Ba Zr Sr Zn Ni and Ti The chemical compositions measured by
XRF indicate that the palygorskite consisted of SiO2 5510 Al2O3 960 Fe2O3
570 Na2O 005 K2O 096 CaO 042 MgO 1070 MnO 001 and TiO2
032 No indication of heavy metals related to the analyzed material indicates that it
is appropriate for filter media and microbial growth Therefore it is speculated that
the presence of so many kinds of elements favors the growth of microorganism
35 Composite particles morphological structures (SEM) analyses
The SEM images of composite particles calcined at 700 degC for 4 h and
composite particles calcined at 800 degC for 4 h are shown in Figure 7 The SEM
observations show that the porous structures become more compact due to the
increasing calcination time (4 h) The observations clearly show that the particulate
nature of the crystals in the composite increases with calcination time Bonding of
sintered crystals is evident by the cohesive necks growing at the composite particle
contact points (Fig 7(a)) As seen in composite particles with calcination time of
700 degC for 4 h there are abundant small pores with thin boundaries and large cracks
with no boundary present on the surface This is caused by the release of gases
(Figure 7(a)) In Figure 7(b) the microstructure of the composite particle interior is
seen after treatment at 700 degC for 4 h The water absorption of the composite particles
at 700 degC for 4 h remains relatively low despite the increasing number of pore space
because the gas produced cannot create sufficient voids in the composite particle
bodies The gases begin to escape more easily and the internal microporous structure
might be destroyed
The surface of the composite particles treated at 800 degC for 4 h has few pores
The micrograph of these particles clearly shows that some micropores (60 microm pore
size 100 microm) are irregularly distributed in the microstructure and macropores (Figure
7(c)) Melting phenomena are also observed on the crystalline surface of the
composite particles treated at 800 degC for 4 h (Fig 7(c)) The release of gases and
melting of raw materials allow the large pores to form The water absorption of the
13
composite particles treated at 800 degC for 4 h remains relatively low despite the larger
pores because the impervious skin layer of the pellets restricts water ingress The
microstructure of these composite particles is also related to the lower viscosity of the
liquid phase produced at 800 degC and the consequent improvement in densification
during the natural cooling process These results indicate that denser and lower porous
ceramsite can be obtained via treatment at 800 degC for 4 h
The increasing densification and neck growth between the calcined composite
particles is seen in Figure 7(d) in the interior of the composite particles treated at
800 degC for 4 h However in Figure 7(d) the calcined composite particles samples
show a clear internal micropore structure between the composite particles that might
be destroyed suggesting melted neck growth The slight expansion of the composite
particles that occurs when sintered at 800 degC is clearly associated with the formation
of a significant number of approximately slit-shaped pores
36 Magnetic porous ceramsite and commercial ceramsite under scanning electron microscopy (SEM)
Several typical SEM images of the ordered structure and biomass growth of
MPCcommercial ceramsite are shown in Figure 8 In Figure 8(a) the appearance of a
rough surface on MPC is a coral-like porosity structure providing shelter from
the wastewater shear forces As observed from Figure 8(a) plenty of macropores are
formed on the surface of the internal surface which may serve as excellent locations
for the colonization of microorganisms In Figure 8(b) the microstructure of the
internal surface and a cross-section of the MPC is seen This indicates that the
prepared MPC has a high number of pores with rectangular openings and pores
interconnected to each other through a ladder-like structure as shown in Figure 8(a)
and Figure 8(b) During sintering macropores form inside the particles when sawdust
is removed via combustion MPC material with such porosity is suitable to serve as
the biomedium in a BAF reactor
The SEM images of the MPC after operation in the BAF reactor are provided in
Figure 8(c) and Figure 8(d) The biofilm overlays on the surface of the MPC Four
kinds of bacteria can be observed filamentous-shape coral-shape spherical and
14
chain-shape (Fig 8(c)) Obviously the more diverse the bacterial community the
more organic pollutants are able to be biodegraded After the growth of a bacterial
population a biofilm can be observed clearly on the surface of the internal porosity in
Figure 8(d) At the start-up phase in the BAF reactor the biofilms first develop when
some bacteria irreversibly attach to the MPC After more metabolites accumulate on
the MPC surface the MPC is completely covered by the biofilms which are observed
randomly on the surface Our MPC has a high capacity for bacterial growth
In Figure 8(e) the micrograph of commercial ceramsite (CC) clearly shows that
pores with diameters ranging from 10 to 50 microm are irregularly distributed on the
surface There are some small pores and smooth surfaces The microstructure in
Figure 8(f) suggests that a small number of microorganisms are immobilized to the
inside and outside surfaces of the pores in CC The CC calcination temperature is
1200 degC This will destroy the clay crystal structure of the main raw material and the
CC surface in high temperature calcination conditions is a crystalline glaze The
biofilm biomass and adsorption performance is poor which impacts the overall
performance of this product [43]
37 Cast thin section of magnetic porous ceramsite (MPC) In a BAF system biofilter carriers play a significant role in meeting effluent
quality requirements The granular media is employed in the biofilter bed for solid
interception and solid-liquid separation The media is also the carrier of biofilm The
characteristics of the biofilter carriers have significant impacts on the treatment
efficiency [44]
The roughness and porosity of the open MPC surface are beneficial for
microorganisms fixed to the surface The microbial biofilm attached to the MPC
surface is a highly hydrophilic substance under conditions of constant flow of sewage
Environmental microorganisms can be transferred through the MPC into the interior
pores (Fig 10(a)) and the microbial biofilm can attach to the surface of the MPC
Wastewater flow can be divided into three layers the aqueous adhesion layer the
aerobic layer and the anoxic layer (Fig 10(b)) The actions of the microorganisms in
15
the biofilm lead to this zonation and create the conditions for simultaneous
nitrification and denitrification
In order to obtain direct evidence of environmental microorganisms in open
porosity of our MPC rubber casting experiments were used to generate quantitative
size and shape data from a thin section of pores Figure 11(a) shows the intergranular
pore textures observed in the thin section The black sections denote calcined
palygorskite biomass residues caused by carbonization while gray areas represent the
intergranular pores of MPC This demonstrates that MPC has a large volume of
internal porosity in which guest microbes can be accommodated The size of those
interconnected pores is approximately 40-65 μm (Fig 11(A) 11(B) and 11(C)) and
most bacteria are 05 microm or less in diameter Thus environmental microorganisms
can achieve a sustained growth of population in the open porosity When impregnated
with blue-dyed epoxy (part B) the fully interconnected porosity with a diameter of 60
μm can be determined from the white section (part A) In fact blue-dyed epoxy in the
porosity system must overcome the capillary resistance of the throat size before they
enter porosity space indicating the narrow composition of the pores 38 Thermal Properties (DT-TG) Analyses
Figure 12 presents the thermal analysis of the palygorskite
claygoethitesawdust mixture The DTA curve has 5 exothermic valleys and an
exothermic peak According to the crystal structure of the palygorskite clay and
crystal chemical formula the water in palygorskite clay has four states including
water adsorbed to the outer surface water adsorbed in tunnels water contained in the
crystal structure and structural water molecules coordinated to Mg(II) cations at the
edge of the octahedral sheets [45] The first endothermic valley is at 65 degC This
belongs to the water adsorbed to the outer surface and has a dehydrating effect The
second endothermic valley is at 98 degC the thermal effect of adsorbed water in
channels emerge and the weight of the adsorbed water on the outer surface and in
pores is 587 The third endothermic valley is at 230 degC and represents the crystal
water absorbing effect produced by extrusion It has a small and narrow endothermic
16
valley with 312 water loss The fourth endothermic valley at 481 degC is wider and
corresponds to the crystal degradation under thermal effects It is a 37 loss The
fifth endothermic valley is at 595 degC corresponding to the degradation of crystal
structure The amount of dehydration is 53
39 Determination of biomass in media
To investigate the performance of MPC and commercial ceramsite in the BAF
reactor the biomass of grown biofilm was determined The biofilm biomass was 541
mg TNg for MPC and 22 mg TNg for commercial ceramsite [46] Also the
structural and morphological characteristics of the porous media seen in Figure 8 and
Figure 11 proved that the MPC surface and internal pores are advantageous to
microbial growth under the conditions tested
4 Conclusions
(1) The MPC can be prepared from a mixture of goethite sawdust and palygorskite
by sintering at 700 degC for 120 min The proper mass ratio of goethite sawdust and
palygorskite is 1025 The results indicate that MPC has a larger specific surface area
(81 m2g) It has a porosity of 78 and a compressive strength range of 53-67 N
compared to commercial ceramsite (CC) which is superior to the regulatory levels in
the Chinese National Standards
(2) In the preparation of MPC the goethite can be transformed into magnetite
particles Thus this kind of ceramsite is a magnetic material Furthermore SEM and
PM results suggest that the uniform and interconnected pores in MPC are suitable for
microbial growth Experimental growth of biofilm in this material is superior to that
on CC It is speculated that these observations will favor the utilization of MPC in the
biotreatment of BAF
Acknowledgements
We gratefully acknowledge the support by the National Natural Science Foundation of
China (41072036 41130206 41372045) the Specialized Research Fund for the Doctoral
Program of Higher Education of China (20110111110003) and the Anhui Provincial
17
Natural Science Foundation (11040606Q30)
References
[1] Yu YZ Feng Y Qiu LP Effect of grain-slag media for the treatment of wastewater
in a biological aerated filter Bioresou Technol 99 (2008) 4120ndash4123
[2] Qiu LP Ma J Zhang LX Characteristics and utilization of biologically aerated
filter backwashed sludge Desalination 208 (2007) 73ndash80
[3] Sang JQ Zhang XH Li LZ et al Improvement of organics removal by
bioceramsite filtration of raw water with addition of phosphorusWater Res 37
(2003) 4711-4718
[4]Shen YJ Wu GX Fan YB et al Performances of biological aerated filter
employing hollow fiber membrane segments of surface-improved ploy (sulfone)
as biofilm carriers J Environ Sci 19 (2007) 811-877
[5] Salehi E Abedi J Harding T Bio-oil from sawdust pyrolysis of sawdust in a
fixed-bed system Energy Fuels 23 (2009)3767ndash3772
[6] Ji GD Zhou Y Tong JJ Nitrogen and phosphorus adsorption behavior of
ceramsite material made from coal ash and metallic iron Environ Eng Sci
27(2010)871-878
[7] Lu XX Song JM Li XG et al Geochemical characteristics of nitrogen in the
southern yellow sea surface sediments J Mar Syst 56 (2005)17-27
[8] Liu HB Chen TH Chang J et al The effect of hydroxyl groups and surface area
of hematite derived from annealing goethite for phosphate removal J Colloid
Interf Sci 398 (2013)88-94
[9]Fangqun Gan Jianmin Zhou Huoyan Wang et al Removal of phosphate from
aqueous solution by thermally treated natural palygorskite Water Res 43
(2009)2907-2915
[10]Hirsiger W Muller-Vonmoos M Wiedemann HG Thermal analysis of
palygorskite Thermochim 13(1975) 223-230
[11]Jha VK Kameshima Y Nakajima A Utilization of steel-making slag for the
uptake of ammonium and phosphate ions from aqueous solution J Hazard Mater
156 (2008)156-162
18
[12]Yavuza H Celebi SS Effects of magnetic field on activity of activated sludge in
wastewater treatment Enzyme Microb Technol 26(2000) 22-27
[13] Goodman EM Greenebaum B Marron MT Magnetic fields after translation in
Escherichia coli Bioelectromagnetics 15 (1994) 77-83
[14] Tabrah FL Mower HF Batkin S Greenwood PB Enhanced mutagenic effect of
a 60 Hz time-varying magnetic field on numbers of a zide-induced TA100
revertant colonies Bioelectromagnetics 15(1994) 85-93
[15] Ozaki H Liu Z Terashima Y Utilization of microorganisms immobilized with
magnetic particles for sewage and wastewater treatment Wat Sci Tech 23(1991)
1125-1136
[16]Jung J Sanji B Godbole S Sofer S Biodegradation of phenol A comparative
study with and without applying magnetic fields J Chem Tech Biotechnol
556(1993) 73-76
[17]Daou TJ Begin-Colin S Grene MJ Phosphate adsorption properties of
magnetite-based nanoparticles Chem Mater 19(2007) 4494-4505
[18] Zou JL Xu GR Pan K Nitrogen removal and biofilm structure affected by
CODNH4+ndashN in a biofilter with porous sludge ceramsite Sep Purif Technol
94(2012) 9-15
[19] Zou XH Chen TH Liu HB et al Structural and chromatic evolution of goethite
by thermal treatment J Chinese Ceramic Society 41(2013) 669-673(in Chinese)
[20] Zhu YR Zhang RY Wu FC Distribution of bioavailable nitrogen and
phosphorus forms and their relationship in the sediments of Dianchi Lake Res
Environ Sci 8(2010) 994-998 (in Chinese)
[21] Sandstone pore structure method of image analysis(Industry standard CJT) (in
Chinese)
[22] Chinese Mohurd Artifical ceramsite filter material for water treatment China
standard publishing house Beijing China 2008
[23] Xu GR Zou JL Li GB Ceramsite made with water and wastewater sludge and
its characteristics affected by SiO2 and Al2O3 Environ Sci Technol 42(2008)
7417-7423
19
[24] Park YJ Heo J Vitrification of fly ash from municipal solid waste incinerator J
Hazard Mater 91(2001) 83-93
[25] Toya T KameshimaY Yasumori A Preparation and properties of glass-ceramics
from wastes (Kira) of silica sand and kaolin clay refining J Eur Ceram Soc
24(2004) 2367-2372
[26] Yilmaz O Unlu K Cokca E Solidificationstabilization of hazardous wastes
containing metals and organic contaminants J Environ Eng 129(2003) 366-376
[27] Li CT Lee WJ Huang KL Vitrification of chromium electroplating sludge
Environ Sci Technol 41(2007) 2950-2956
[28] Gutsey GL Mochena MD Structure and properties of Fe4 with different
coverage by C and CO J Phys Chem 108(2004) 11409-11418
[29] Chen Y Lin B Research on enzyme immobilization by modified ceramsite
particle Chem Indus Eng Pro 10(2008) 1462-1478 (in Chinese)
[30] Huang CP Pan JRS Liu YR Mixing water treatment residual with excavation
waste soil in brick and artificial aggregate making J Environ Eng 131(2005)
272-277
[31] Tay JH Hong SY Show KY Reuse of industrial sludge as palletized aggregate
for concrete J Environ Eng 126 (2000) 279-287
[32] Shih K White T Oleckie J Spinel formation for stabilizing simulated nickel
laden sludge with aluminum rich ceramic precursors Environ Sci Technol
40(2006) 5077-5083
[33] Xu GR Zou JL Li GB Effect of sintering temperature on the characteristics of
sludge ceramsite J Hazard Mater 150(2008) 394-400
[34] Xu GR Zou JL Li GB Stabilization of heavy metals in ceramsite made with
sewage sludge J Hazard Mater 152(2008) 56-61
[35] Xu GR Zou JL Dai Y Utilization of dried sludge for making ceramsite Water
Sci Technol 54(2006) 69-79
[36] Xu GR Zhang WT Li GB Adsorbent obtained from CEPT sludge in wastewater
chemically enhanced treatment Water Res 39(2005) 5175-5185
[37]Fuliana A Conesa JA Font R Formation and destruction of chlorinated
20
pollutants during sewage sludge incineration Environ Sci Technol 38(2004)
2953-2958
[38] Mukherjee PS Lokanatha S Bhattacherjee S High temperature structural studies
in palygorskite J Mater Sci 26(1991) 6073-6077
[39] Frost R Ding Z Ruan H Thermal analysis of goethite J Thermal Anal
Calorim 71(2003) 783-791
[40] Gualtieri A F Venturelli P In situ study of the goethite-hematite phase
transformation by real time synchrotron powder diffraction Am Mineral
84(1999) 895-904
[41] Prasad PSR Shiva Prasad K Krishna Chaitanya V In situ FTIR study on the
dehydration of natural goethite J Asian Earth Sci 27(2006) 503-511
[42] Ozdemir O Dunlop DJ Earth Planet Intermediate magnetite formation during
dehydration of goethite Sci Lett 177(2000) 59-67
[43] He S Xue G Kong H The performance of BAF using natural zeolite as
filtermedia under conditions of low temperature and ammonium shock load J
Hazard Mater 143 (2007) 291-295
[44] Han S Yue Q Yue M et al The characteristics and application of sludge fly ash
ceramic particles (SFCP) as novel filter media J Hazard Mater 171(2009)
809-814
[45] Chen Tianhu Wang Jian Qing Chengsong et al Effect of heat treatment on
structure morphology and surface properties of palygorskite J Chinese Ceramic
Society (in Chinese)34(2006) 1407-1410
[46] Ha JH Ong SK Nitrification and denitrification in partially aerated biological
aerated filter (BAF) with dual size sand media Water Sci Technol 55(2007) 9-17
21
List of Figures
Fig 1 Schematic diagram of the BAF system
Fig 2 The effect of palygorskite clay addition on compressive strength and
porosity of MPC
Fig 3 The effect of sawdust addition on compressive strength and porosity of
MPC
Fig 4 MPC compressive strength and porosity as a function of calcination
temperature
Fig 5 MPC compressive strength and porosity as a function of calcination time
Fig 6 X-ray diffraction patterns of composite particles and prepared MPC
Fig 7 SEM images illustrating the internal and external surfaces of composite
particles calcined at 700 degC for 4 h and composite particles calcined at
800 degC for 4 h
Fig 8 SEM images illustrating the internal and external surfaces of
MPCcommercial ceramsite
Fig 9 Contrast pictures of as-synthesized (left) and calcined (right) MPC after
magnetic separation of the MPC
Fig 10 Images of internal MPC
Fig 11 Porosity of MPC
Fig 12 Differential thermal analysis and thermogravimetric analysis patterns of
MPC
22
Fig 1 Schematic diagram of the BAF system
(A) MPC BAF (B) Effluent pipe (C) Air blower (D) Wastewater pump (E)
Switching mode power supply (F) Electromagnetic iron-separator device (G)
Wastewater tank
D
C Influent Air
Influent Wastewater
V=550L
B B
F
E
A A
G
23
Fig 2 The effect of palygorskite clay addition on compressive strength and porosity of MPC
10 20 30 40 50 60 700
10
20
30
4050
60
70Porosity curve
Compressive strength curve
palygorskite addition
com
pres
sive
stre
ngth
N
50
55
60
65
70
75
80
85
porosity
24
Fig 3 The effect of sawdust addition on compressive strength and porosity of MPC
0 10 20 30 40 500
10
20
30
40
50
60 Compressive strength curve
Porosity curve
co
mpr
essiv
e st
reng
th N
sawdust addition 0
20
40
60
80
100
porosity
25
Fig 4 MPC compressive strength and porosity as a function of calcination temperature
400 500 600 700 80010
20
30
40
50
60
70
Porosity curve
Compressive strength curve
co
mpr
essiv
e st
reng
th N
Calcination temperature C
20
30
40
50
60
70
80
porosity
26
Fig 5 MPC compressive strength and porosity as a function of calcination time
0 2 445
50
55
60
Compressive strength curve
Porosity curve
com
pres
sive
stre
ngth
N
Calcination timeh
50
55
60
65
70
75
porosity
27
Fig 6 X-ray diffraction patterns of composite particles and MPC
(a) Composite particles (b) MPC
(P palygorskite Q quartz M magnetic H hematite)
10 20 30 40 50 60 702-Theta( deg)
H
G
H
G G GPP
G
P
a
b
Q
Rel
ativ
e in
tens
ityC
ps
MP
28
Fig 7 SEM images of composite particles calcined at 700 degC for 4 h and
composite particles calcined at 800 degC for 4 h
(a) raw external surface of composite particles calcined at 700 degC for 4 h
(b) raw internal surface of composite particles calcined at 700 degC for 4 h
(c) raw external surface of composite particles calcined at 800 degC for 4 h
(d) raw internal surface of composite particles calcined at 800 degC for 4 h
a b
c d
500μm 50μm
2μm 50μm
29
Fig 8 SEM images of MPCcommercial ceramsite
(a) raw external surface of MPC
(b) raw internal surface of MPC
(c) microbial load on external surface of MPC
(d) microbial load on internal surface of MPC
(e) raw external surface of CC
(f) microbial load on external surface of CC
5μm 2μm
d
e
a
50μm
b
50μm
c
f
5μm 1μm
30
Fig 9 Contrast pictures of composite particles (left) and MPC (right)
photographs after magnetic separation of the MPC (a) composite particles (b) MPC (c) magnetic separation of the MPC
31
Fig 10 Internal images of MPC
(a) Internal porosity of MPC (b) Layers of MPC when oxygen is introduced into
the system
(1 aqueous adhesion layer 2 aerobic layer 3 anoxic layer)
b
1 2
a
3
32
Fig 11 Porosity of MPC
(a) After calcination (gray ndash MPC) (b) Filled (dark blue ndash open pores)
(c) A higher resolution image illustrating the internal surface of MPC (dark blue
ndash open pores)
33
Fig 12 Differential thermal analysis and thermogravimetric analysis patterns of MPC
0 100 200 300 400 500 600 700 800 900
-1200
-1000
-800
-600
-400
-200
0
Temp( oC)Th
erm
ogra
vim
etri
c A
naly
sis(m
g)
Thermogravimetric Analysis
Differential Thermal Analysis
-10
0
10
20
30
40
50
60Differential Therm
al Analysis(m
gmin)
34
List of Tables
Table 1 Factors and levels of the orthogonal experimental design
Table 2 Factors and levels of the experimental results
Table 3 Design of orthogonal experiments
Table 4 Results of orthogonal experiments
Table 5 The regulatory levels of ceramics in MPC and CC as well as
the corresponding Chinese National Standards
35
Table 1 Factors and levels of the orthogonal experimental design Note the proportion of palygorskite and sawdust is accounted for in
goethite content percent
(A) The level (B) The amount of palygorskite ( wt GT) (C) Sawdust
dosage ( wt GT) (D) Calcination temperature (degC) (E) Calcination
time (h)
A n B n C n D n E n
ⅰ B 1 C 1 D 1 E 1
ⅱ B 2 C 2 D 2 E 2
ⅲ B 3 C 3 D 3 E 3
36
Table 2 Factors and levels values for the orthogonal experiments
A n B n C n D n E n
ⅰ 50 wt GT 20 wt GT 500degC 1h
ⅱ 60 wt GT 30 wt GT 600degC 2h
ⅲ 70 wt GT 40 wt GT 700degC 3h
37
Table 3 Design of orthogonal experiments
Note Ki indicates the level of compression strength R is the difference between
the largest average effect and minimum average effect for every factor An
is the Orthogonal experiment number Bn is Palygorskite (wt GT) Cn is
Sawdust (wt GT) Dn is Calcination temperature (degC) En is Calcination
time (h) and Fn is Compression strength (N)
A n B n C n D n E n Fn
ⅰ B 1 C 1 D 1 E 1 B 1C 1D 1E 1
ⅱ B 1 C 2 D 2 E 2 B 1C 2D 2E 2
ⅲ B 1 C 3 D 3 E 3 B 1C 3D 3E 3
ⅳ B 2 C 1 D 2 E 3 B 2C 1D 2E 3
ⅴ B 2 C 2 D 3 E 1 B 2C 2D 3E 1
ⅵ B 2 C 3 D 1 E 2 B 2C 3D 1E 2
ⅶ B 3 C 1 D 3 E 2 B 3C 1D 3E 2
ⅷ B 3 C 2 D 1 E 3 B 3C 2D 1E 3
ⅸ B 3 C 3 D 2 E 1 B 3C 3D 2E 1
K1n K11 K12 K13 K14
F K2n K21 K22 K23 K24
K3n K31 K32 K33 K34
R n R 1 R 2 R 3 R 4
38
Table 4 Results of orthogonal experiments
A B n C n D n E n Fn
1 50 wt GT 20 wt GT 500 degC 1 h 4940
2 50 wt GT 30 wt GT 600 degC 2 h 5113
3 50 wt GT 40 wt GT 700 degC 3 h 5214
4 60 wt GT 20 wt GT 600 degC 3 h 4512
5 60 wt GT 30 wt GT 700 degC 1 h 4015
6 60 wt GT 40 wt GT 500 degC 2 h 3827
7 70 wt GT 20 wt GT 700 degC 2 h 5865
8 70 wt GT 30 wt GT 500 degC 3 h 4023
9 70 wt GT 40 wt GT 600 degC 1 h 3478
K1 5089 5106 4263 4132 -
F K2 4118 4384 4368 4935 -
K3 4455 4355 5031 4583 -
R n 971 751 768 803 -
39
Table 5 The regulatory levels of ceramics in MPC and CC as well as the corresponding Chinese National Standards
Item Chinese National Standard MPC experimental levels CC experimental levels
Grain diameter dmm 05-90 3-5 4-6
Silt carrying capacity Cs le1 017 le1
Solubility in hydrochloric acid Cha le2 115 le15
Void fraction υ ge40 7631 >42
Specific surface area Swcm2g ge05times104 81times105 ge2times104
Piled density ρpgcm3 -------- 0617 le10
Apparent density ρapgcm3 --------- 1611 14-18
Compression strength N --------- 53-67 ge87
Porosity P --------- 78 --
- 24 Characterization
-
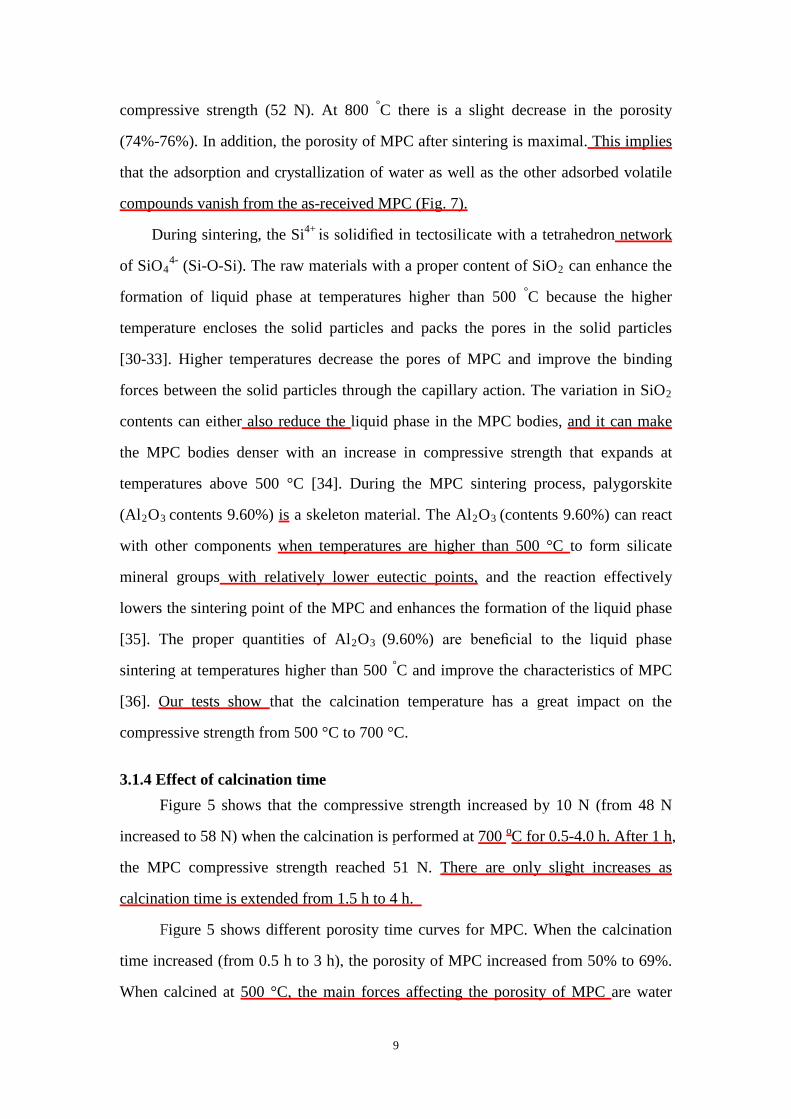

10
molecules sawdust and decomposition of volatile substances The effect of
temperature on MPC diffusion is not obvious but the effect of temperature on
sawdust [3C6H10O5] is known MPC dehydration during calcination causes water
evaporation Thus the space occupied by sawdust is emptied This increases the
porosity
Excessive calcination time (4 h) causes the internal gas pressure to increase
while the resistance is relatively low The gases begin to escape more easily and the
internal microporous structure might be destroyed (Fig 7) [3738] Therefore the
ideal calcination time should be 1 h to 3 h to achieve the ideal effects for compressive
strength
315 Analysis of orthogonal experiments
Goethite was the main component of the MPC tested The palygorskite clay
and sawdust were mixed with goethite to make the new type of MPC
Five factors were considered in the MPC preparation goethite dosage ratio of
palygorskite clay added ratio of sawdust added calcination temperature and
calcination time
The ratio of palygorskite clay and sawdust added both depend on
the goethite dosage Orthogonal tests analyzed the influence of the five factors on the
properties of MPC The results show the optimized experimental conditions for
the preparation of MPC (Tables 1-4)
An orthogonal L943 test was used to optimize the particle preparation conditions
The evaluation index was analyzed statistically The orthogonal test designs are listed
in Table 2 Since we could not select the best preparation conditions based solely on
the outcomes in Table 3 a further orthogonal analysis was warranted Thus the Kmn
and Rn values were calculated We found that the influence on the comprehensive
index of MPC decreases in the following order ratio of palygorskite clay added gt
calcination time gt calcination temperature gt ratio of sawdust added according to the R
values (R1gt R4gt R3 gtR2) The goethite dosage was found to be the most important
determinant of preparation The optimal preparation conditions of goethite were 100
11
g palygorskite at 50 wt and sawdust added at 20 wt The calcination is optimized
at 700 degC for 2 h (Table 4)
32 Magnetic porous ceramsite (MPC) characterization evaluation
The best preparation formula for MPC was a ratio of 1025 (mass
ratio) raw goethite sawdust and palygorskite clay The optimal calcination
temperature and time for MPC are 700 degC and 2 h This formula met the Chinese
national standards for MPC [22] (in Table 5) Contrast pictures of our synthesized
MPC (left) and MPC are shown in Figure 9) The photographs illustrate MPC after
magnetic separation composite particles (Figure 9(a)) magnetic porous ceramsite
(Figure 9(b)) and magnetic separation of the MPC (Figure 9(c))
33 X-ray diffraction (XRD)and magnetic susceptibility
Figure 6 shows the XRD patterns of as-synthesized MPC and MPC (700 degC 2
h) The main minerals in our synthesized MPC include quartz (SiO2) palygorskite
and goethite (FeOOH) (see Figure 6a) In contrast the main minerals in MPC (Fig 6b)
are quartz (SiO2) hematite palygorskite and magnetite (Fe3O4) Comparing the
results in Figure 6b shows that goethite has transformed into magnetic particles after
sintering procession The reflections at 2θ=98 223 27 and 32deg are found and
identified as MPC when compared with the standard JCPDS (89-6538) In addition a
new reflection at 2θ=26deg was also found and identified as quartz [39-42]
In this study a mixture of goethite sawdust and palygorskite clay was
thermally treated (under a N2 atmosphere) to form MPC The magnetic susceptibility
of the MPC( Xmass=1169010-8m3kg )
34 X-ray fluorescence (XRF) and Elemental analysis (EA)
The chemical compositions measured by EA indicate that the sawdust consisted
of C 4609 H 685 O 3509 N 06 S 01 as well as small amounts of Cl P
K and Si The chemical compositions measured by XRF indicate that the goethite
consists of Fe 6607 Si 1580 Al 574 Ca 157 Mg 068 Cr 003 K
12
098 P 007 Na 024 Pb 022 Cu 046 Mn 431 as well as small
amounts of As S Ba Zr Sr Zn Ni and Ti The chemical compositions measured by
XRF indicate that the palygorskite consisted of SiO2 5510 Al2O3 960 Fe2O3
570 Na2O 005 K2O 096 CaO 042 MgO 1070 MnO 001 and TiO2
032 No indication of heavy metals related to the analyzed material indicates that it
is appropriate for filter media and microbial growth Therefore it is speculated that
the presence of so many kinds of elements favors the growth of microorganism
35 Composite particles morphological structures (SEM) analyses
The SEM images of composite particles calcined at 700 degC for 4 h and
composite particles calcined at 800 degC for 4 h are shown in Figure 7 The SEM
observations show that the porous structures become more compact due to the
increasing calcination time (4 h) The observations clearly show that the particulate
nature of the crystals in the composite increases with calcination time Bonding of
sintered crystals is evident by the cohesive necks growing at the composite particle
contact points (Fig 7(a)) As seen in composite particles with calcination time of
700 degC for 4 h there are abundant small pores with thin boundaries and large cracks
with no boundary present on the surface This is caused by the release of gases
(Figure 7(a)) In Figure 7(b) the microstructure of the composite particle interior is
seen after treatment at 700 degC for 4 h The water absorption of the composite particles
at 700 degC for 4 h remains relatively low despite the increasing number of pore space
because the gas produced cannot create sufficient voids in the composite particle
bodies The gases begin to escape more easily and the internal microporous structure
might be destroyed
The surface of the composite particles treated at 800 degC for 4 h has few pores
The micrograph of these particles clearly shows that some micropores (60 microm pore
size 100 microm) are irregularly distributed in the microstructure and macropores (Figure
7(c)) Melting phenomena are also observed on the crystalline surface of the
composite particles treated at 800 degC for 4 h (Fig 7(c)) The release of gases and
melting of raw materials allow the large pores to form The water absorption of the
13
composite particles treated at 800 degC for 4 h remains relatively low despite the larger
pores because the impervious skin layer of the pellets restricts water ingress The
microstructure of these composite particles is also related to the lower viscosity of the
liquid phase produced at 800 degC and the consequent improvement in densification
during the natural cooling process These results indicate that denser and lower porous
ceramsite can be obtained via treatment at 800 degC for 4 h
The increasing densification and neck growth between the calcined composite
particles is seen in Figure 7(d) in the interior of the composite particles treated at
800 degC for 4 h However in Figure 7(d) the calcined composite particles samples
show a clear internal micropore structure between the composite particles that might
be destroyed suggesting melted neck growth The slight expansion of the composite
particles that occurs when sintered at 800 degC is clearly associated with the formation
of a significant number of approximately slit-shaped pores
36 Magnetic porous ceramsite and commercial ceramsite under scanning electron microscopy (SEM)
Several typical SEM images of the ordered structure and biomass growth of
MPCcommercial ceramsite are shown in Figure 8 In Figure 8(a) the appearance of a
rough surface on MPC is a coral-like porosity structure providing shelter from
the wastewater shear forces As observed from Figure 8(a) plenty of macropores are
formed on the surface of the internal surface which may serve as excellent locations
for the colonization of microorganisms In Figure 8(b) the microstructure of the
internal surface and a cross-section of the MPC is seen This indicates that the
prepared MPC has a high number of pores with rectangular openings and pores
interconnected to each other through a ladder-like structure as shown in Figure 8(a)
and Figure 8(b) During sintering macropores form inside the particles when sawdust
is removed via combustion MPC material with such porosity is suitable to serve as
the biomedium in a BAF reactor
The SEM images of the MPC after operation in the BAF reactor are provided in
Figure 8(c) and Figure 8(d) The biofilm overlays on the surface of the MPC Four
kinds of bacteria can be observed filamentous-shape coral-shape spherical and
14
chain-shape (Fig 8(c)) Obviously the more diverse the bacterial community the
more organic pollutants are able to be biodegraded After the growth of a bacterial
population a biofilm can be observed clearly on the surface of the internal porosity in
Figure 8(d) At the start-up phase in the BAF reactor the biofilms first develop when
some bacteria irreversibly attach to the MPC After more metabolites accumulate on
the MPC surface the MPC is completely covered by the biofilms which are observed
randomly on the surface Our MPC has a high capacity for bacterial growth
In Figure 8(e) the micrograph of commercial ceramsite (CC) clearly shows that
pores with diameters ranging from 10 to 50 microm are irregularly distributed on the
surface There are some small pores and smooth surfaces The microstructure in
Figure 8(f) suggests that a small number of microorganisms are immobilized to the
inside and outside surfaces of the pores in CC The CC calcination temperature is
1200 degC This will destroy the clay crystal structure of the main raw material and the
CC surface in high temperature calcination conditions is a crystalline glaze The
biofilm biomass and adsorption performance is poor which impacts the overall
performance of this product [43]
37 Cast thin section of magnetic porous ceramsite (MPC) In a BAF system biofilter carriers play a significant role in meeting effluent
quality requirements The granular media is employed in the biofilter bed for solid
interception and solid-liquid separation The media is also the carrier of biofilm The
characteristics of the biofilter carriers have significant impacts on the treatment
efficiency [44]
The roughness and porosity of the open MPC surface are beneficial for
microorganisms fixed to the surface The microbial biofilm attached to the MPC
surface is a highly hydrophilic substance under conditions of constant flow of sewage
Environmental microorganisms can be transferred through the MPC into the interior
pores (Fig 10(a)) and the microbial biofilm can attach to the surface of the MPC
Wastewater flow can be divided into three layers the aqueous adhesion layer the
aerobic layer and the anoxic layer (Fig 10(b)) The actions of the microorganisms in
15
the biofilm lead to this zonation and create the conditions for simultaneous
nitrification and denitrification
In order to obtain direct evidence of environmental microorganisms in open
porosity of our MPC rubber casting experiments were used to generate quantitative
size and shape data from a thin section of pores Figure 11(a) shows the intergranular
pore textures observed in the thin section The black sections denote calcined
palygorskite biomass residues caused by carbonization while gray areas represent the
intergranular pores of MPC This demonstrates that MPC has a large volume of
internal porosity in which guest microbes can be accommodated The size of those
interconnected pores is approximately 40-65 μm (Fig 11(A) 11(B) and 11(C)) and
most bacteria are 05 microm or less in diameter Thus environmental microorganisms
can achieve a sustained growth of population in the open porosity When impregnated
with blue-dyed epoxy (part B) the fully interconnected porosity with a diameter of 60
μm can be determined from the white section (part A) In fact blue-dyed epoxy in the
porosity system must overcome the capillary resistance of the throat size before they
enter porosity space indicating the narrow composition of the pores 38 Thermal Properties (DT-TG) Analyses
Figure 12 presents the thermal analysis of the palygorskite
claygoethitesawdust mixture The DTA curve has 5 exothermic valleys and an
exothermic peak According to the crystal structure of the palygorskite clay and
crystal chemical formula the water in palygorskite clay has four states including
water adsorbed to the outer surface water adsorbed in tunnels water contained in the
crystal structure and structural water molecules coordinated to Mg(II) cations at the
edge of the octahedral sheets [45] The first endothermic valley is at 65 degC This
belongs to the water adsorbed to the outer surface and has a dehydrating effect The
second endothermic valley is at 98 degC the thermal effect of adsorbed water in
channels emerge and the weight of the adsorbed water on the outer surface and in
pores is 587 The third endothermic valley is at 230 degC and represents the crystal
water absorbing effect produced by extrusion It has a small and narrow endothermic
16
valley with 312 water loss The fourth endothermic valley at 481 degC is wider and
corresponds to the crystal degradation under thermal effects It is a 37 loss The
fifth endothermic valley is at 595 degC corresponding to the degradation of crystal
structure The amount of dehydration is 53
39 Determination of biomass in media
To investigate the performance of MPC and commercial ceramsite in the BAF
reactor the biomass of grown biofilm was determined The biofilm biomass was 541
mg TNg for MPC and 22 mg TNg for commercial ceramsite [46] Also the
structural and morphological characteristics of the porous media seen in Figure 8 and
Figure 11 proved that the MPC surface and internal pores are advantageous to
microbial growth under the conditions tested
4 Conclusions
(1) The MPC can be prepared from a mixture of goethite sawdust and palygorskite
by sintering at 700 degC for 120 min The proper mass ratio of goethite sawdust and
palygorskite is 1025 The results indicate that MPC has a larger specific surface area
(81 m2g) It has a porosity of 78 and a compressive strength range of 53-67 N
compared to commercial ceramsite (CC) which is superior to the regulatory levels in
the Chinese National Standards
(2) In the preparation of MPC the goethite can be transformed into magnetite
particles Thus this kind of ceramsite is a magnetic material Furthermore SEM and
PM results suggest that the uniform and interconnected pores in MPC are suitable for
microbial growth Experimental growth of biofilm in this material is superior to that
on CC It is speculated that these observations will favor the utilization of MPC in the
biotreatment of BAF
Acknowledgements
We gratefully acknowledge the support by the National Natural Science Foundation of
China (41072036 41130206 41372045) the Specialized Research Fund for the Doctoral
Program of Higher Education of China (20110111110003) and the Anhui Provincial
17
Natural Science Foundation (11040606Q30)
References
[1] Yu YZ Feng Y Qiu LP Effect of grain-slag media for the treatment of wastewater
in a biological aerated filter Bioresou Technol 99 (2008) 4120ndash4123
[2] Qiu LP Ma J Zhang LX Characteristics and utilization of biologically aerated
filter backwashed sludge Desalination 208 (2007) 73ndash80
[3] Sang JQ Zhang XH Li LZ et al Improvement of organics removal by
bioceramsite filtration of raw water with addition of phosphorusWater Res 37
(2003) 4711-4718
[4]Shen YJ Wu GX Fan YB et al Performances of biological aerated filter
employing hollow fiber membrane segments of surface-improved ploy (sulfone)
as biofilm carriers J Environ Sci 19 (2007) 811-877
[5] Salehi E Abedi J Harding T Bio-oil from sawdust pyrolysis of sawdust in a
fixed-bed system Energy Fuels 23 (2009)3767ndash3772
[6] Ji GD Zhou Y Tong JJ Nitrogen and phosphorus adsorption behavior of
ceramsite material made from coal ash and metallic iron Environ Eng Sci
27(2010)871-878
[7] Lu XX Song JM Li XG et al Geochemical characteristics of nitrogen in the
southern yellow sea surface sediments J Mar Syst 56 (2005)17-27
[8] Liu HB Chen TH Chang J et al The effect of hydroxyl groups and surface area
of hematite derived from annealing goethite for phosphate removal J Colloid
Interf Sci 398 (2013)88-94
[9]Fangqun Gan Jianmin Zhou Huoyan Wang et al Removal of phosphate from
aqueous solution by thermally treated natural palygorskite Water Res 43
(2009)2907-2915
[10]Hirsiger W Muller-Vonmoos M Wiedemann HG Thermal analysis of
palygorskite Thermochim 13(1975) 223-230
[11]Jha VK Kameshima Y Nakajima A Utilization of steel-making slag for the
uptake of ammonium and phosphate ions from aqueous solution J Hazard Mater
156 (2008)156-162
18
[12]Yavuza H Celebi SS Effects of magnetic field on activity of activated sludge in
wastewater treatment Enzyme Microb Technol 26(2000) 22-27
[13] Goodman EM Greenebaum B Marron MT Magnetic fields after translation in
Escherichia coli Bioelectromagnetics 15 (1994) 77-83
[14] Tabrah FL Mower HF Batkin S Greenwood PB Enhanced mutagenic effect of
a 60 Hz time-varying magnetic field on numbers of a zide-induced TA100
revertant colonies Bioelectromagnetics 15(1994) 85-93
[15] Ozaki H Liu Z Terashima Y Utilization of microorganisms immobilized with
magnetic particles for sewage and wastewater treatment Wat Sci Tech 23(1991)
1125-1136
[16]Jung J Sanji B Godbole S Sofer S Biodegradation of phenol A comparative
study with and without applying magnetic fields J Chem Tech Biotechnol
556(1993) 73-76
[17]Daou TJ Begin-Colin S Grene MJ Phosphate adsorption properties of
magnetite-based nanoparticles Chem Mater 19(2007) 4494-4505
[18] Zou JL Xu GR Pan K Nitrogen removal and biofilm structure affected by
CODNH4+ndashN in a biofilter with porous sludge ceramsite Sep Purif Technol
94(2012) 9-15
[19] Zou XH Chen TH Liu HB et al Structural and chromatic evolution of goethite
by thermal treatment J Chinese Ceramic Society 41(2013) 669-673(in Chinese)
[20] Zhu YR Zhang RY Wu FC Distribution of bioavailable nitrogen and
phosphorus forms and their relationship in the sediments of Dianchi Lake Res
Environ Sci 8(2010) 994-998 (in Chinese)
[21] Sandstone pore structure method of image analysis(Industry standard CJT) (in
Chinese)
[22] Chinese Mohurd Artifical ceramsite filter material for water treatment China
standard publishing house Beijing China 2008
[23] Xu GR Zou JL Li GB Ceramsite made with water and wastewater sludge and
its characteristics affected by SiO2 and Al2O3 Environ Sci Technol 42(2008)
7417-7423
19
[24] Park YJ Heo J Vitrification of fly ash from municipal solid waste incinerator J
Hazard Mater 91(2001) 83-93
[25] Toya T KameshimaY Yasumori A Preparation and properties of glass-ceramics
from wastes (Kira) of silica sand and kaolin clay refining J Eur Ceram Soc
24(2004) 2367-2372
[26] Yilmaz O Unlu K Cokca E Solidificationstabilization of hazardous wastes
containing metals and organic contaminants J Environ Eng 129(2003) 366-376
[27] Li CT Lee WJ Huang KL Vitrification of chromium electroplating sludge
Environ Sci Technol 41(2007) 2950-2956
[28] Gutsey GL Mochena MD Structure and properties of Fe4 with different
coverage by C and CO J Phys Chem 108(2004) 11409-11418
[29] Chen Y Lin B Research on enzyme immobilization by modified ceramsite
particle Chem Indus Eng Pro 10(2008) 1462-1478 (in Chinese)
[30] Huang CP Pan JRS Liu YR Mixing water treatment residual with excavation
waste soil in brick and artificial aggregate making J Environ Eng 131(2005)
272-277
[31] Tay JH Hong SY Show KY Reuse of industrial sludge as palletized aggregate
for concrete J Environ Eng 126 (2000) 279-287
[32] Shih K White T Oleckie J Spinel formation for stabilizing simulated nickel
laden sludge with aluminum rich ceramic precursors Environ Sci Technol
40(2006) 5077-5083
[33] Xu GR Zou JL Li GB Effect of sintering temperature on the characteristics of
sludge ceramsite J Hazard Mater 150(2008) 394-400
[34] Xu GR Zou JL Li GB Stabilization of heavy metals in ceramsite made with
sewage sludge J Hazard Mater 152(2008) 56-61
[35] Xu GR Zou JL Dai Y Utilization of dried sludge for making ceramsite Water
Sci Technol 54(2006) 69-79
[36] Xu GR Zhang WT Li GB Adsorbent obtained from CEPT sludge in wastewater
chemically enhanced treatment Water Res 39(2005) 5175-5185
[37]Fuliana A Conesa JA Font R Formation and destruction of chlorinated
20
pollutants during sewage sludge incineration Environ Sci Technol 38(2004)
2953-2958
[38] Mukherjee PS Lokanatha S Bhattacherjee S High temperature structural studies
in palygorskite J Mater Sci 26(1991) 6073-6077
[39] Frost R Ding Z Ruan H Thermal analysis of goethite J Thermal Anal
Calorim 71(2003) 783-791
[40] Gualtieri A F Venturelli P In situ study of the goethite-hematite phase
transformation by real time synchrotron powder diffraction Am Mineral
84(1999) 895-904
[41] Prasad PSR Shiva Prasad K Krishna Chaitanya V In situ FTIR study on the
dehydration of natural goethite J Asian Earth Sci 27(2006) 503-511
[42] Ozdemir O Dunlop DJ Earth Planet Intermediate magnetite formation during
dehydration of goethite Sci Lett 177(2000) 59-67
[43] He S Xue G Kong H The performance of BAF using natural zeolite as
filtermedia under conditions of low temperature and ammonium shock load J
Hazard Mater 143 (2007) 291-295
[44] Han S Yue Q Yue M et al The characteristics and application of sludge fly ash
ceramic particles (SFCP) as novel filter media J Hazard Mater 171(2009)
809-814
[45] Chen Tianhu Wang Jian Qing Chengsong et al Effect of heat treatment on
structure morphology and surface properties of palygorskite J Chinese Ceramic
Society (in Chinese)34(2006) 1407-1410
[46] Ha JH Ong SK Nitrification and denitrification in partially aerated biological
aerated filter (BAF) with dual size sand media Water Sci Technol 55(2007) 9-17
21
List of Figures
Fig 1 Schematic diagram of the BAF system
Fig 2 The effect of palygorskite clay addition on compressive strength and
porosity of MPC
Fig 3 The effect of sawdust addition on compressive strength and porosity of
MPC
Fig 4 MPC compressive strength and porosity as a function of calcination
temperature
Fig 5 MPC compressive strength and porosity as a function of calcination time
Fig 6 X-ray diffraction patterns of composite particles and prepared MPC
Fig 7 SEM images illustrating the internal and external surfaces of composite
particles calcined at 700 degC for 4 h and composite particles calcined at
800 degC for 4 h
Fig 8 SEM images illustrating the internal and external surfaces of
MPCcommercial ceramsite
Fig 9 Contrast pictures of as-synthesized (left) and calcined (right) MPC after
magnetic separation of the MPC
Fig 10 Images of internal MPC
Fig 11 Porosity of MPC
Fig 12 Differential thermal analysis and thermogravimetric analysis patterns of
MPC
22
Fig 1 Schematic diagram of the BAF system
(A) MPC BAF (B) Effluent pipe (C) Air blower (D) Wastewater pump (E)
Switching mode power supply (F) Electromagnetic iron-separator device (G)
Wastewater tank
D
C Influent Air
Influent Wastewater
V=550L
B B
F
E
A A
G
23
Fig 2 The effect of palygorskite clay addition on compressive strength and porosity of MPC
10 20 30 40 50 60 700
10
20
30
4050
60
70Porosity curve
Compressive strength curve
palygorskite addition
com
pres
sive
stre
ngth
N
50
55
60
65
70
75
80
85
porosity
24
Fig 3 The effect of sawdust addition on compressive strength and porosity of MPC
0 10 20 30 40 500
10
20
30
40
50
60 Compressive strength curve
Porosity curve
co
mpr
essiv
e st
reng
th N
sawdust addition 0
20
40
60
80
100
porosity
25
Fig 4 MPC compressive strength and porosity as a function of calcination temperature
400 500 600 700 80010
20
30
40
50
60
70
Porosity curve
Compressive strength curve
co
mpr
essiv
e st
reng
th N
Calcination temperature C
20
30
40
50
60
70
80
porosity
26
Fig 5 MPC compressive strength and porosity as a function of calcination time
0 2 445
50
55
60
Compressive strength curve
Porosity curve
com
pres
sive
stre
ngth
N
Calcination timeh
50
55
60
65
70
75
porosity
27
Fig 6 X-ray diffraction patterns of composite particles and MPC
(a) Composite particles (b) MPC
(P palygorskite Q quartz M magnetic H hematite)
10 20 30 40 50 60 702-Theta( deg)
H
G
H
G G GPP
G
P
a
b
Q
Rel
ativ
e in
tens
ityC
ps
MP
28
Fig 7 SEM images of composite particles calcined at 700 degC for 4 h and
composite particles calcined at 800 degC for 4 h
(a) raw external surface of composite particles calcined at 700 degC for 4 h
(b) raw internal surface of composite particles calcined at 700 degC for 4 h
(c) raw external surface of composite particles calcined at 800 degC for 4 h
(d) raw internal surface of composite particles calcined at 800 degC for 4 h
a b
c d
500μm 50μm
2μm 50μm
29
Fig 8 SEM images of MPCcommercial ceramsite
(a) raw external surface of MPC
(b) raw internal surface of MPC
(c) microbial load on external surface of MPC
(d) microbial load on internal surface of MPC
(e) raw external surface of CC
(f) microbial load on external surface of CC
5μm 2μm
d
e
a
50μm
b
50μm
c
f
5μm 1μm
30
Fig 9 Contrast pictures of composite particles (left) and MPC (right)
photographs after magnetic separation of the MPC (a) composite particles (b) MPC (c) magnetic separation of the MPC
31
Fig 10 Internal images of MPC
(a) Internal porosity of MPC (b) Layers of MPC when oxygen is introduced into
the system
(1 aqueous adhesion layer 2 aerobic layer 3 anoxic layer)
b
1 2
a
3
32
Fig 11 Porosity of MPC
(a) After calcination (gray ndash MPC) (b) Filled (dark blue ndash open pores)
(c) A higher resolution image illustrating the internal surface of MPC (dark blue
ndash open pores)
33
Fig 12 Differential thermal analysis and thermogravimetric analysis patterns of MPC
0 100 200 300 400 500 600 700 800 900
-1200
-1000
-800
-600
-400
-200
0
Temp( oC)Th
erm
ogra
vim
etri
c A
naly
sis(m
g)
Thermogravimetric Analysis
Differential Thermal Analysis
-10
0
10
20
30
40
50
60Differential Therm
al Analysis(m
gmin)
34
List of Tables
Table 1 Factors and levels of the orthogonal experimental design
Table 2 Factors and levels of the experimental results
Table 3 Design of orthogonal experiments
Table 4 Results of orthogonal experiments
Table 5 The regulatory levels of ceramics in MPC and CC as well as
the corresponding Chinese National Standards
35
Table 1 Factors and levels of the orthogonal experimental design Note the proportion of palygorskite and sawdust is accounted for in
goethite content percent
(A) The level (B) The amount of palygorskite ( wt GT) (C) Sawdust
dosage ( wt GT) (D) Calcination temperature (degC) (E) Calcination
time (h)
A n B n C n D n E n
ⅰ B 1 C 1 D 1 E 1
ⅱ B 2 C 2 D 2 E 2
ⅲ B 3 C 3 D 3 E 3
36
Table 2 Factors and levels values for the orthogonal experiments
A n B n C n D n E n
ⅰ 50 wt GT 20 wt GT 500degC 1h
ⅱ 60 wt GT 30 wt GT 600degC 2h
ⅲ 70 wt GT 40 wt GT 700degC 3h
37
Table 3 Design of orthogonal experiments
Note Ki indicates the level of compression strength R is the difference between
the largest average effect and minimum average effect for every factor An
is the Orthogonal experiment number Bn is Palygorskite (wt GT) Cn is
Sawdust (wt GT) Dn is Calcination temperature (degC) En is Calcination
time (h) and Fn is Compression strength (N)
A n B n C n D n E n Fn
ⅰ B 1 C 1 D 1 E 1 B 1C 1D 1E 1
ⅱ B 1 C 2 D 2 E 2 B 1C 2D 2E 2
ⅲ B 1 C 3 D 3 E 3 B 1C 3D 3E 3
ⅳ B 2 C 1 D 2 E 3 B 2C 1D 2E 3
ⅴ B 2 C 2 D 3 E 1 B 2C 2D 3E 1
ⅵ B 2 C 3 D 1 E 2 B 2C 3D 1E 2
ⅶ B 3 C 1 D 3 E 2 B 3C 1D 3E 2
ⅷ B 3 C 2 D 1 E 3 B 3C 2D 1E 3
ⅸ B 3 C 3 D 2 E 1 B 3C 3D 2E 1
K1n K11 K12 K13 K14
F K2n K21 K22 K23 K24
K3n K31 K32 K33 K34
R n R 1 R 2 R 3 R 4
38
Table 4 Results of orthogonal experiments
A B n C n D n E n Fn
1 50 wt GT 20 wt GT 500 degC 1 h 4940
2 50 wt GT 30 wt GT 600 degC 2 h 5113
3 50 wt GT 40 wt GT 700 degC 3 h 5214
4 60 wt GT 20 wt GT 600 degC 3 h 4512
5 60 wt GT 30 wt GT 700 degC 1 h 4015
6 60 wt GT 40 wt GT 500 degC 2 h 3827
7 70 wt GT 20 wt GT 700 degC 2 h 5865
8 70 wt GT 30 wt GT 500 degC 3 h 4023
9 70 wt GT 40 wt GT 600 degC 1 h 3478
K1 5089 5106 4263 4132 -
F K2 4118 4384 4368 4935 -
K3 4455 4355 5031 4583 -
R n 971 751 768 803 -
39
Table 5 The regulatory levels of ceramics in MPC and CC as well as the corresponding Chinese National Standards
Item Chinese National Standard MPC experimental levels CC experimental levels
Grain diameter dmm 05-90 3-5 4-6
Silt carrying capacity Cs le1 017 le1
Solubility in hydrochloric acid Cha le2 115 le15
Void fraction υ ge40 7631 >42
Specific surface area Swcm2g ge05times104 81times105 ge2times104
Piled density ρpgcm3 -------- 0617 le10
Apparent density ρapgcm3 --------- 1611 14-18
Compression strength N --------- 53-67 ge87
Porosity P --------- 78 --
- 24 Characterization
-
20
pollutants during sewage sludge incineration Environ Sci Technol 38(2004)
2953-2958
[38] Mukherjee PS Lokanatha S Bhattacherjee S High temperature structural studies
in palygorskite J Mater Sci 26(1991) 6073-6077
[39] Frost R Ding Z Ruan H Thermal analysis of goethite J Thermal Anal
Calorim 71(2003) 783-791
[40] Gualtieri A F Venturelli P In situ study of the goethite-hematite phase
transformation by real time synchrotron powder diffraction Am Mineral
84(1999) 895-904
[41] Prasad PSR Shiva Prasad K Krishna Chaitanya V In situ FTIR study on the
dehydration of natural goethite J Asian Earth Sci 27(2006) 503-511
[42] Ozdemir O Dunlop DJ Earth Planet Intermediate magnetite formation during
dehydration of goethite Sci Lett 177(2000) 59-67
[43] He S Xue G Kong H The performance of BAF using natural zeolite as
filtermedia under conditions of low temperature and ammonium shock load J
Hazard Mater 143 (2007) 291-295
[44] Han S Yue Q Yue M et al The characteristics and application of sludge fly ash
ceramic particles (SFCP) as novel filter media J Hazard Mater 171(2009)
809-814
[45] Chen Tianhu Wang Jian Qing Chengsong et al Effect of heat treatment on
structure morphology and surface properties of palygorskite J Chinese Ceramic
Society (in Chinese)34(2006) 1407-1410
[46] Ha JH Ong SK Nitrification and denitrification in partially aerated biological
aerated filter (BAF) with dual size sand media Water Sci Technol 55(2007) 9-17
21
List of Figures
Fig 1 Schematic diagram of the BAF system
Fig 2 The effect of palygorskite clay addition on compressive strength and
porosity of MPC
Fig 3 The effect of sawdust addition on compressive strength and porosity of
MPC
Fig 4 MPC compressive strength and porosity as a function of calcination
temperature
Fig 5 MPC compressive strength and porosity as a function of calcination time
Fig 6 X-ray diffraction patterns of composite particles and prepared MPC
Fig 7 SEM images illustrating the internal and external surfaces of composite
particles calcined at 700 degC for 4 h and composite particles calcined at
800 degC for 4 h
Fig 8 SEM images illustrating the internal and external surfaces of
MPCcommercial ceramsite
Fig 9 Contrast pictures of as-synthesized (left) and calcined (right) MPC after
magnetic separation of the MPC
Fig 10 Images of internal MPC
Fig 11 Porosity of MPC
Fig 12 Differential thermal analysis and thermogravimetric analysis patterns of
MPC
22
Fig 1 Schematic diagram of the BAF system
(A) MPC BAF (B) Effluent pipe (C) Air blower (D) Wastewater pump (E)
Switching mode power supply (F) Electromagnetic iron-separator device (G)
Wastewater tank
D
C Influent Air
Influent Wastewater
V=550L
B B
F
E
A A
G
23
Fig 2 The effect of palygorskite clay addition on compressive strength and porosity of MPC
10 20 30 40 50 60 700
10
20
30
4050
60
70Porosity curve
Compressive strength curve
palygorskite addition
com
pres
sive
stre
ngth
N
50
55
60
65
70
75
80
85
porosity
24
Fig 3 The effect of sawdust addition on compressive strength and porosity of MPC
0 10 20 30 40 500
10
20
30
40
50
60 Compressive strength curve
Porosity curve
co
mpr
essiv
e st
reng
th N
sawdust addition 0
20
40
60
80
100
porosity
25
Fig 4 MPC compressive strength and porosity as a function of calcination temperature
400 500 600 700 80010
20
30
40
50
60
70
Porosity curve
Compressive strength curve
co
mpr
essiv
e st
reng
th N
Calcination temperature C
20
30
40
50
60
70
80
porosity
26
Fig 5 MPC compressive strength and porosity as a function of calcination time
0 2 445
50
55
60
Compressive strength curve
Porosity curve
com
pres
sive
stre
ngth
N
Calcination timeh
50
55
60
65
70
75
porosity
27
Fig 6 X-ray diffraction patterns of composite particles and MPC
(a) Composite particles (b) MPC
(P palygorskite Q quartz M magnetic H hematite)
10 20 30 40 50 60 702-Theta( deg)
H
G
H
G G GPP
G
P
a
b
Q
Rel
ativ
e in
tens
ityC
ps
MP
28
Fig 7 SEM images of composite particles calcined at 700 degC for 4 h and
composite particles calcined at 800 degC for 4 h
(a) raw external surface of composite particles calcined at 700 degC for 4 h
(b) raw internal surface of composite particles calcined at 700 degC for 4 h
(c) raw external surface of composite particles calcined at 800 degC for 4 h
(d) raw internal surface of composite particles calcined at 800 degC for 4 h
a b
c d
500μm 50μm
2μm 50μm
29
Fig 8 SEM images of MPCcommercial ceramsite
(a) raw external surface of MPC
(b) raw internal surface of MPC
(c) microbial load on external surface of MPC
(d) microbial load on internal surface of MPC
(e) raw external surface of CC
(f) microbial load on external surface of CC
5μm 2μm
d
e
a
50μm
b
50μm
c
f
5μm 1μm
30
Fig 9 Contrast pictures of composite particles (left) and MPC (right)
photographs after magnetic separation of the MPC (a) composite particles (b) MPC (c) magnetic separation of the MPC
31
Fig 10 Internal images of MPC
(a) Internal porosity of MPC (b) Layers of MPC when oxygen is introduced into
the system
(1 aqueous adhesion layer 2 aerobic layer 3 anoxic layer)
b
1 2
a
3
32
Fig 11 Porosity of MPC
(a) After calcination (gray ndash MPC) (b) Filled (dark blue ndash open pores)
(c) A higher resolution image illustrating the internal surface of MPC (dark blue
ndash open pores)
33
Fig 12 Differential thermal analysis and thermogravimetric analysis patterns of MPC
0 100 200 300 400 500 600 700 800 900
-1200
-1000
-800
-600
-400
-200
0
Temp( oC)Th
erm
ogra
vim
etri
c A
naly
sis(m
g)
Thermogravimetric Analysis
Differential Thermal Analysis
-10
0
10
20
30
40
50
60Differential Therm
al Analysis(m
gmin)
34
List of Tables
Table 1 Factors and levels of the orthogonal experimental design
Table 2 Factors and levels of the experimental results
Table 3 Design of orthogonal experiments
Table 4 Results of orthogonal experiments
Table 5 The regulatory levels of ceramics in MPC and CC as well as
the corresponding Chinese National Standards
35
Table 1 Factors and levels of the orthogonal experimental design Note the proportion of palygorskite and sawdust is accounted for in
goethite content percent
(A) The level (B) The amount of palygorskite ( wt GT) (C) Sawdust
dosage ( wt GT) (D) Calcination temperature (degC) (E) Calcination
time (h)
A n B n C n D n E n
ⅰ B 1 C 1 D 1 E 1
ⅱ B 2 C 2 D 2 E 2
ⅲ B 3 C 3 D 3 E 3
36
Table 2 Factors and levels values for the orthogonal experiments
A n B n C n D n E n
ⅰ 50 wt GT 20 wt GT 500degC 1h
ⅱ 60 wt GT 30 wt GT 600degC 2h
ⅲ 70 wt GT 40 wt GT 700degC 3h
37
Table 3 Design of orthogonal experiments
Note Ki indicates the level of compression strength R is the difference between
the largest average effect and minimum average effect for every factor An
is the Orthogonal experiment number Bn is Palygorskite (wt GT) Cn is
Sawdust (wt GT) Dn is Calcination temperature (degC) En is Calcination
time (h) and Fn is Compression strength (N)
A n B n C n D n E n Fn
ⅰ B 1 C 1 D 1 E 1 B 1C 1D 1E 1
ⅱ B 1 C 2 D 2 E 2 B 1C 2D 2E 2
ⅲ B 1 C 3 D 3 E 3 B 1C 3D 3E 3
ⅳ B 2 C 1 D 2 E 3 B 2C 1D 2E 3
ⅴ B 2 C 2 D 3 E 1 B 2C 2D 3E 1
ⅵ B 2 C 3 D 1 E 2 B 2C 3D 1E 2
ⅶ B 3 C 1 D 3 E 2 B 3C 1D 3E 2
ⅷ B 3 C 2 D 1 E 3 B 3C 2D 1E 3
ⅸ B 3 C 3 D 2 E 1 B 3C 3D 2E 1
K1n K11 K12 K13 K14
F K2n K21 K22 K23 K24
K3n K31 K32 K33 K34
R n R 1 R 2 R 3 R 4
38
Table 4 Results of orthogonal experiments
A B n C n D n E n Fn
1 50 wt GT 20 wt GT 500 degC 1 h 4940
2 50 wt GT 30 wt GT 600 degC 2 h 5113
3 50 wt GT 40 wt GT 700 degC 3 h 5214
4 60 wt GT 20 wt GT 600 degC 3 h 4512
5 60 wt GT 30 wt GT 700 degC 1 h 4015
6 60 wt GT 40 wt GT 500 degC 2 h 3827
7 70 wt GT 20 wt GT 700 degC 2 h 5865
8 70 wt GT 30 wt GT 500 degC 3 h 4023
9 70 wt GT 40 wt GT 600 degC 1 h 3478
K1 5089 5106 4263 4132 -
F K2 4118 4384 4368 4935 -
K3 4455 4355 5031 4583 -
R n 971 751 768 803 -
39
Table 5 The regulatory levels of ceramics in MPC and CC as well as the corresponding Chinese National Standards
Item Chinese National Standard MPC experimental levels CC experimental levels
Grain diameter dmm 05-90 3-5 4-6
Silt carrying capacity Cs le1 017 le1
Solubility in hydrochloric acid Cha le2 115 le15
Void fraction υ ge40 7631 >42
Specific surface area Swcm2g ge05times104 81times105 ge2times104
Piled density ρpgcm3 -------- 0617 le10
Apparent density ρapgcm3 --------- 1611 14-18
Compression strength N --------- 53-67 ge87
Porosity P --------- 78 --
- 24 Characterization
-
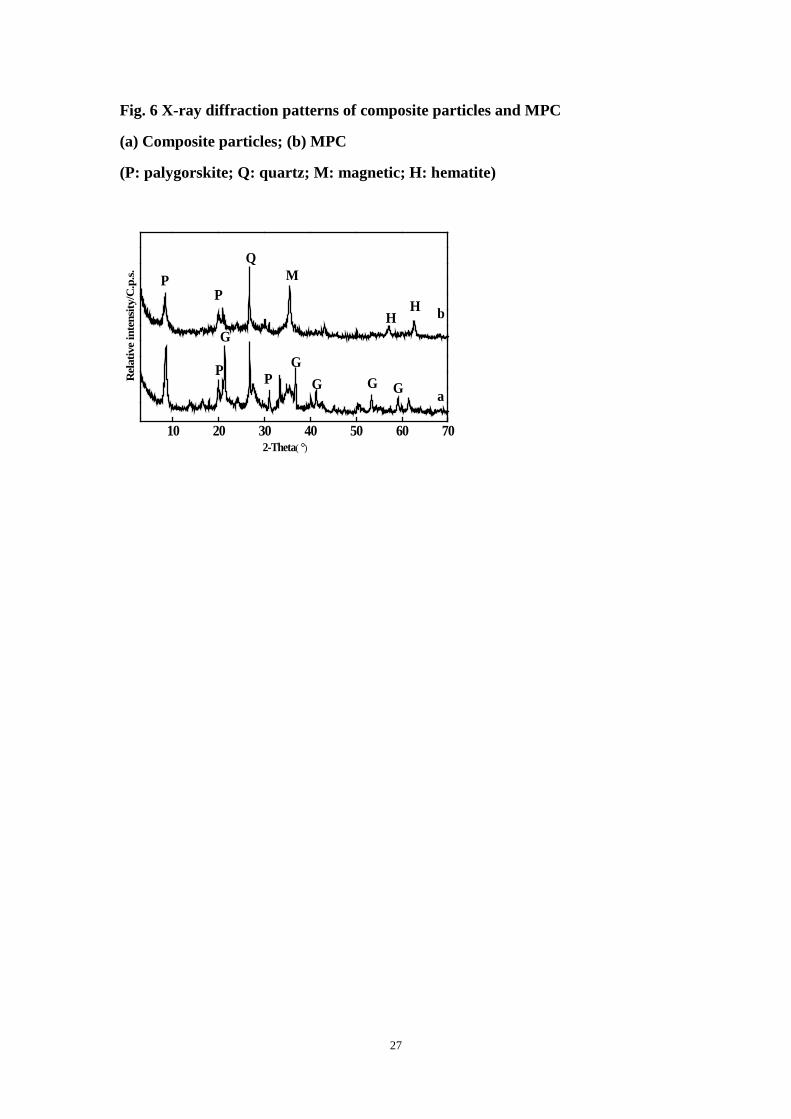

30
Fig 9 Contrast pictures of composite particles (left) and MPC (right)
photographs after magnetic separation of the MPC (a) composite particles (b) MPC (c) magnetic separation of the MPC
31
Fig 10 Internal images of MPC
(a) Internal porosity of MPC (b) Layers of MPC when oxygen is introduced into
the system
(1 aqueous adhesion layer 2 aerobic layer 3 anoxic layer)
b
1 2
a
3
32
Fig 11 Porosity of MPC
(a) After calcination (gray ndash MPC) (b) Filled (dark blue ndash open pores)
(c) A higher resolution image illustrating the internal surface of MPC (dark blue
ndash open pores)
33
Fig 12 Differential thermal analysis and thermogravimetric analysis patterns of MPC
0 100 200 300 400 500 600 700 800 900
-1200
-1000
-800
-600
-400
-200
0
Temp( oC)Th
erm
ogra
vim
etri
c A
naly
sis(m
g)
Thermogravimetric Analysis
Differential Thermal Analysis
-10
0
10
20
30
40
50
60Differential Therm
al Analysis(m
gmin)
34
List of Tables
Table 1 Factors and levels of the orthogonal experimental design
Table 2 Factors and levels of the experimental results
Table 3 Design of orthogonal experiments
Table 4 Results of orthogonal experiments
Table 5 The regulatory levels of ceramics in MPC and CC as well as
the corresponding Chinese National Standards
35
Table 1 Factors and levels of the orthogonal experimental design Note the proportion of palygorskite and sawdust is accounted for in
goethite content percent
(A) The level (B) The amount of palygorskite ( wt GT) (C) Sawdust
dosage ( wt GT) (D) Calcination temperature (degC) (E) Calcination
time (h)
A n B n C n D n E n
ⅰ B 1 C 1 D 1 E 1
ⅱ B 2 C 2 D 2 E 2
ⅲ B 3 C 3 D 3 E 3
36
Table 2 Factors and levels values for the orthogonal experiments
A n B n C n D n E n
ⅰ 50 wt GT 20 wt GT 500degC 1h
ⅱ 60 wt GT 30 wt GT 600degC 2h
ⅲ 70 wt GT 40 wt GT 700degC 3h
37
Table 3 Design of orthogonal experiments
Note Ki indicates the level of compression strength R is the difference between
the largest average effect and minimum average effect for every factor An
is the Orthogonal experiment number Bn is Palygorskite (wt GT) Cn is
Sawdust (wt GT) Dn is Calcination temperature (degC) En is Calcination
time (h) and Fn is Compression strength (N)
A n B n C n D n E n Fn
ⅰ B 1 C 1 D 1 E 1 B 1C 1D 1E 1
ⅱ B 1 C 2 D 2 E 2 B 1C 2D 2E 2
ⅲ B 1 C 3 D 3 E 3 B 1C 3D 3E 3
ⅳ B 2 C 1 D 2 E 3 B 2C 1D 2E 3
ⅴ B 2 C 2 D 3 E 1 B 2C 2D 3E 1
ⅵ B 2 C 3 D 1 E 2 B 2C 3D 1E 2
ⅶ B 3 C 1 D 3 E 2 B 3C 1D 3E 2
ⅷ B 3 C 2 D 1 E 3 B 3C 2D 1E 3
ⅸ B 3 C 3 D 2 E 1 B 3C 3D 2E 1
K1n K11 K12 K13 K14
F K2n K21 K22 K23 K24
K3n K31 K32 K33 K34
R n R 1 R 2 R 3 R 4
38
Table 4 Results of orthogonal experiments
A B n C n D n E n Fn
1 50 wt GT 20 wt GT 500 degC 1 h 4940
2 50 wt GT 30 wt GT 600 degC 2 h 5113
3 50 wt GT 40 wt GT 700 degC 3 h 5214
4 60 wt GT 20 wt GT 600 degC 3 h 4512
5 60 wt GT 30 wt GT 700 degC 1 h 4015
6 60 wt GT 40 wt GT 500 degC 2 h 3827
7 70 wt GT 20 wt GT 700 degC 2 h 5865
8 70 wt GT 30 wt GT 500 degC 3 h 4023
9 70 wt GT 40 wt GT 600 degC 1 h 3478
K1 5089 5106 4263 4132 -
F K2 4118 4384 4368 4935 -
K3 4455 4355 5031 4583 -
R n 971 751 768 803 -
39
Table 5 The regulatory levels of ceramics in MPC and CC as well as the corresponding Chinese National Standards
Item Chinese National Standard MPC experimental levels CC experimental levels
Grain diameter dmm 05-90 3-5 4-6
Silt carrying capacity Cs le1 017 le1
Solubility in hydrochloric acid Cha le2 115 le15
Void fraction υ ge40 7631 >42
Specific surface area Swcm2g ge05times104 81times105 ge2times104
Piled density ρpgcm3 -------- 0617 le10
Apparent density ρapgcm3 --------- 1611 14-18
Compression strength N --------- 53-67 ge87
Porosity P --------- 78 --
- 24 Characterization
-


![EffectofCapillaryWaterAbsorptiononElectricalResistivityof ... · 2021. 5. 3. · according to ASTM C1585 [31]; the effect of the coal gangue ceramsite on sorptivity of the matrix](https://static.fdocuments.us/doc/165x107/6135efbb0ad5d2067647b1fc/effectofcapillarywaterabsorptiononelectricalresistivityof-2021-5-3-according.jpg)


