C CIITTYY OOFF
90
C C C I I I T T T Y Y Y O O O F F F
Transcript of C CIITTYY OOFF

CCCIIITTTYYY OOOFFF
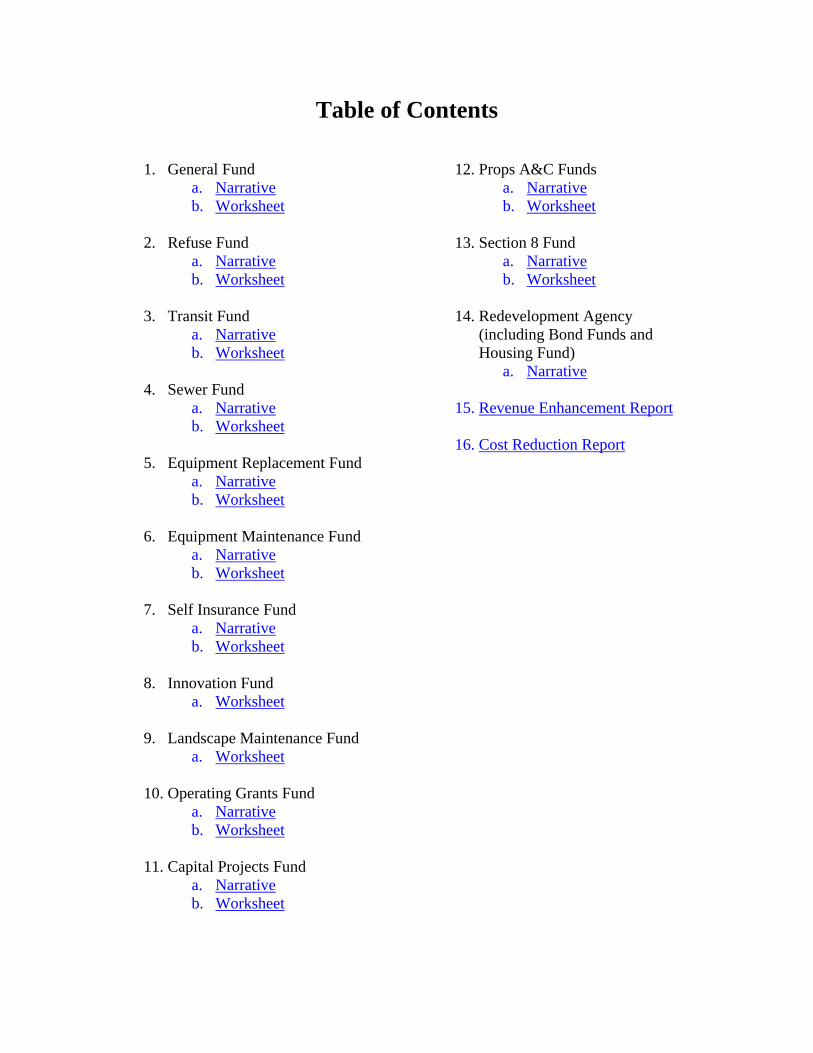
Table of Contents
1. General Fund a. Narrative b. Worksheet
2. Refuse Fund
a. Narrative b. Worksheet
3. Transit Fund
a. Narrative b. Worksheet
4. Sewer Fund
a. Narrative b. Worksheet
5. Equipment Replacement Fund
a. Narrative b. Worksheet
6. Equipment Maintenance Fund
a. Narrative b. Worksheet
7. Self Insurance Fund
a. Narrative b. Worksheet
8. Innovation Fund
a. Worksheet
9. Landscape Maintenance Fund a. Worksheet
10. Operating Grants Fund
a. Narrative b. Worksheet
11. Capital Projects Fund
a. Narrative b. Worksheet
12. Props A&C Funds a. Narrative b. Worksheet
13. Section 8 Fund
a. Narrative b. Worksheet
14. Redevelopment Agency
(including Bond Funds and Housing Fund)
a. Narrative
15. Revenue Enhancement Report
16. Cost Reduction Report
Comprehensive Financial Plan – General Fund
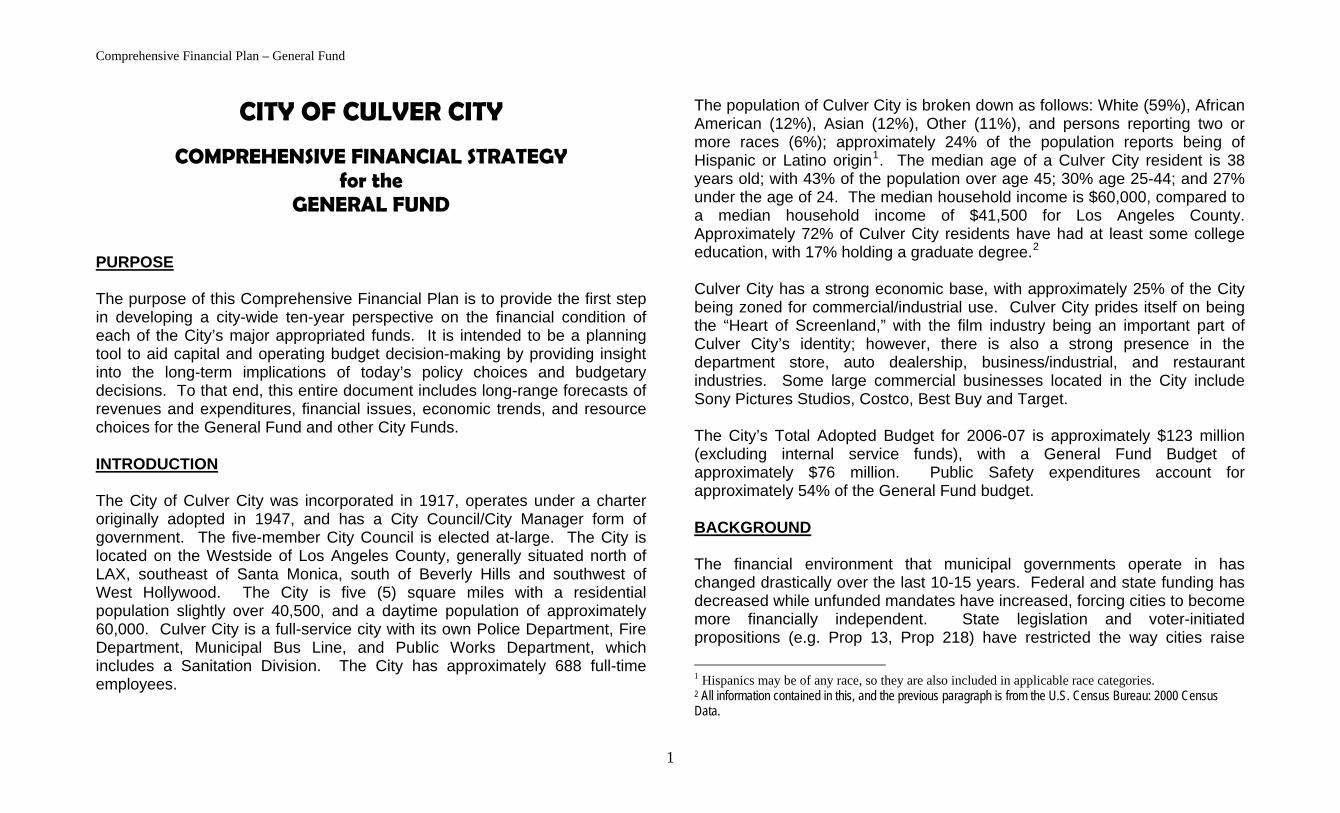
CITY OF CULVER CITY
COMPREHENSIVE FINANCIAL STRATEGY for the
GENERAL FUND
PURPOSE The purpose of this Comprehensive Financial Plan is to provide the first step in developing a city-wide ten-year perspective on the financial condition of each of the City’s major appropriated funds. It is intended to be a planning tool to aid capital and operating budget decision-making by providing insight into the long-term implications of today’s policy choices and budgetary decisions. To that end, this entire document includes long-range forecasts of revenues and expenditures, financial issues, economic trends, and resource choices for the General Fund and other City Funds. INTRODUCTION The City of Culver City was incorporated in 1917, operates under a charter originally adopted in 1947, and has a City Council/City Manager form of government. The five-member City Council is elected at-large. The City is located on the Westside of Los Angeles County, generally situated north of LAX, southeast of Santa Monica, south of Beverly Hills and southwest of West Hollywood. The City is five (5) square miles with a residential population slightly over 40,500, and a daytime population of approximately 60,000. Culver City is a full-service city with its own Police Department, Fire Department, Municipal Bus Line, and Public Works Department, which includes a Sanitation Division. The City has approximately 688 full-time employees.
The population of Culver City is broken down as follows: White (59%), African American (12%), Asian (12%), Other (11%), and persons reporting two or more races (6%); approximately 24% of the population reports being of Hispanic or Latino origin1. The median age of a Culver City resident is 38 years old; with 43% of the population over age 45; 30% age 25-44; and 27% under the age of 24. The median household income is $60,000, compared to a median household income of $41,500 for Los Angeles County. Approximately 72% of Culver City residents have had at least some college education, with 17% holding a graduate degree.2 Culver City has a strong economic base, with approximately 25% of the City being zoned for commercial/industrial use. Culver City prides itself on being the “Heart of Screenland,” with the film industry being an important part of Culver City’s identity; however, there is also a strong presence in the department store, auto dealership, business/industrial, and restaurant industries. Some large commercial businesses located in the City include Sony Pictures Studios, Costco, Best Buy and Target. The City’s Total Adopted Budget for 2006-07 is approximately $123 million (excluding internal service funds), with a General Fund Budget of approximately $76 million. Public Safety expenditures account for approximately 54% of the General Fund budget. BACKGROUND The financial environment that municipal governments operate in has changed drastically over the last 10-15 years. Federal and state funding has decreased while unfunded mandates have increased, forcing cities to become more financially independent. State legislation and voter-initiated propositions (e.g. Prop 13, Prop 218) have restricted the way cities raise 1 Hispanics may be of any race, so they are also included in applicable race categories. 2 All information contained in this, and the previous paragraph is from the U.S. Census Bureau: 2000 Census Data.
1
Comprehensive Financial Plan – General Fund
revenues and levy taxes, forcing cities to become more financially responsible by increasing efficiency and cost effectiveness. Changes to financial reporting requirements by the Government Accounting Standards Board (GASB) have increased financial transparency3, forcing cities to be more financially accountable. As a result, cities have had to make the tough decision of reducing certain programs/services, contracting out their services, or finding other financing mechanisms to maintain their finances in order to continue to provide the same level of service to their residents. In addition, a string of devastating natural disasters (i.e. hurricanes and tsunamis) and ever increasing threats to national security has taught cities they will need to be prepared to deal with emergencies without relying heavily on state and/or federal aid. Double digit percentage increases in personnel costs, such as medical insurance premiums, pension costs, retiree medical benefits, and workers’ compensation costs, have severely limited financial resources available for the City’s day-to-day operations, including maintenance, capital projects, and unfunded future liabilities. In the past few years, Culver City has experienced the same challenges as a number of California cities and was forced to take drastic measures, including reductions in personnel, which subsequently impacted the service level to residents. Culver City is striving to solidify its financial future and address many of the looming issues before the City’s options become severely limited. To accomplish this, the City needs to develop a plan that lays out the myriad of financial needs and options to meet those needs. This document discusses the current economic environment the City is operating in and identifies the revenue constraints and basic operational expenses that must be met. This Comprehensive Financial Plan also 3 For example: GASB 34 required cities to track and report fixed assets and GASB 45 will require cities to report retiree medical benefits as a liability.
includes operational needs that departments have identified in order to maintain the current level of service over the next five years and into the future. ECONOMIC OVERVIEW BACKGROUND Before being able to predict where the economy is going, it is imperative to understand where the economy has been and what events have led us to the current economic situation. For the most part, the US economy has been strong over the last 25 years. In fact, there have only been two recessions in that time period, both of which lasted less than a year (1991 and 2001). The 1990’s and early 2000’s marked a long economic expansion, a burgeoning stock market that seemed to be heading skyward forever, and strong consumer confidence in both the economic and the political environment. The California economy was also booming! After a slow recovery from the recession in the early 1990’s, California’s economy exploded. By the late 1990’s and early 2000’s, California made up about 1/8th of the U.S. economy and ranked as the 6th largest economy in the world; behind only Japan, Germany, the U.K., and France (and the U.S. of course). The technology Industry was hot and was a key driver that propelled an exponential increase in personal wealth for many Californians. The California Public Employee Retirement System (CalPERS) experienced such great returns on investments in the late 1990’s that they informed cities that pension plans were super-funded and the CalPERS rate for the Employer portion would remain zero for many years into the future. As a result, most cities granted increased retirement benefits for employees.
2
Comprehensive Financial Plan – General Fund
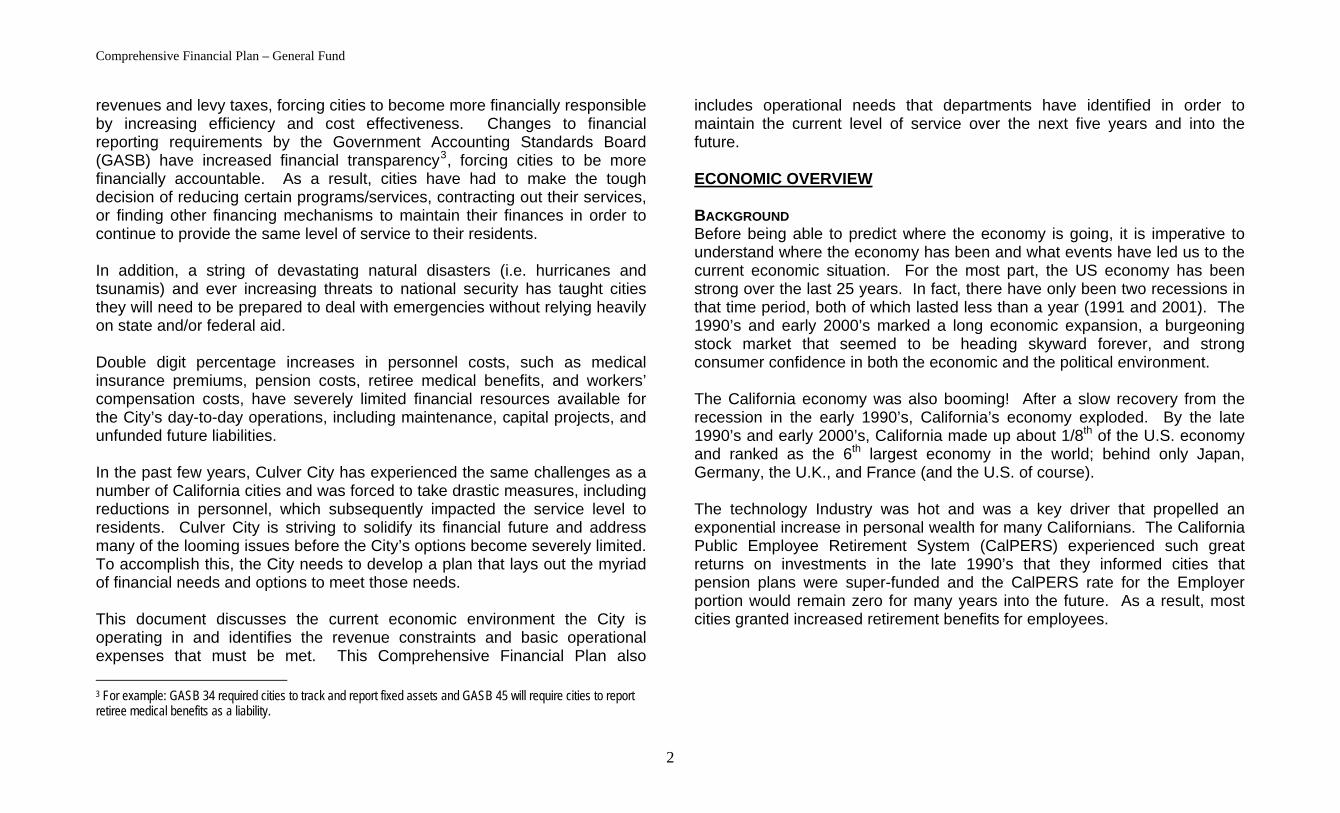
Unfortunately, that would all change with the ushering in of the new millennia. The bursting of the stock market bubble and the terrorist attacks on the World Trade Center had severe economic impacts, resulting in a recession in 2001. Since then, the economy has experienced a modest recovery. Investors are
more tentative with their money, and both the NYSE and NASDAQ have been restored to more historic “real” stock valuations. California was hit hard by the bursting stock market. The High-Tech sector was a source of wealth for many Californians.
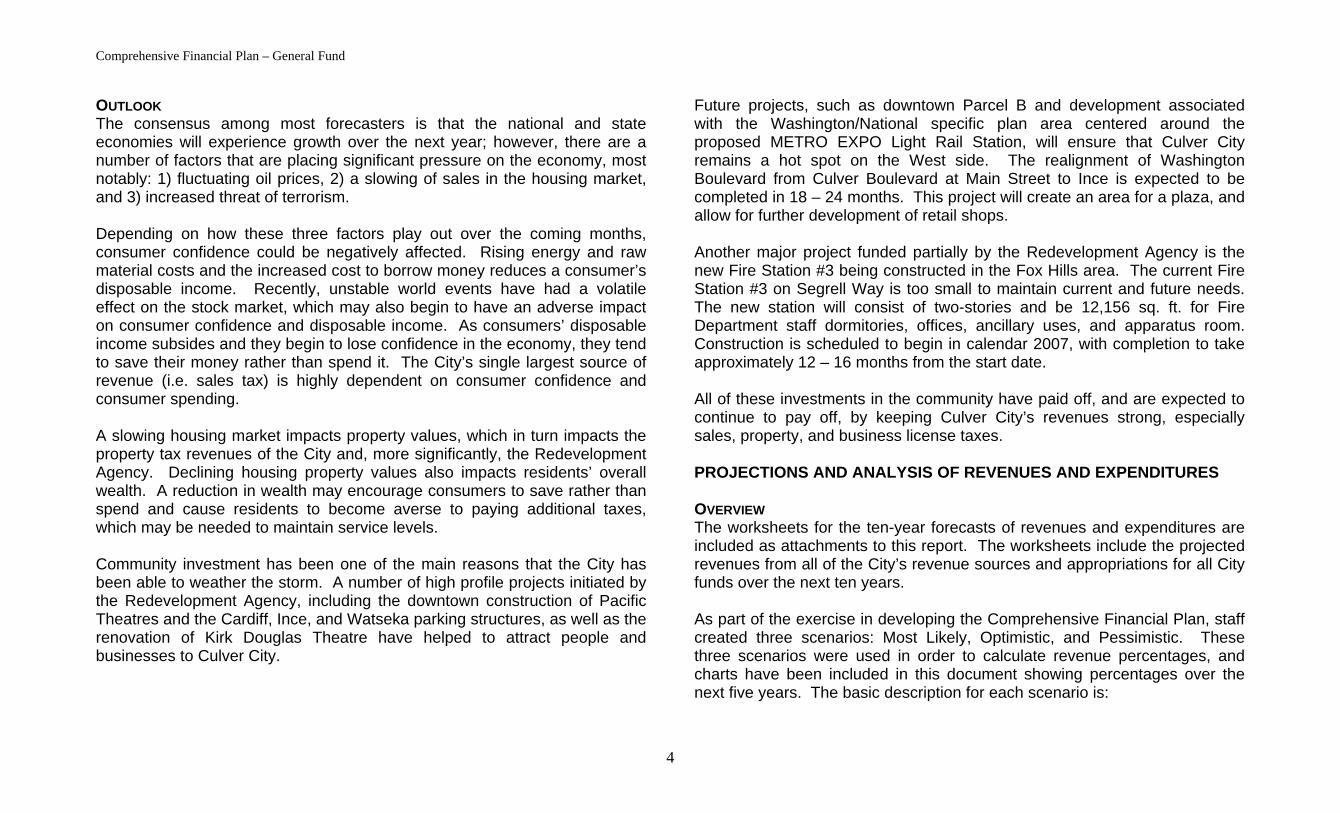
Many of those Californians experienced a rapid decline in wealth and the Gross State Product was significantly impacted. However, thanks to the diversity of California’s economy (see pie chart below) the decline was relatively short-lived and the state economy began to bounce back quickly.
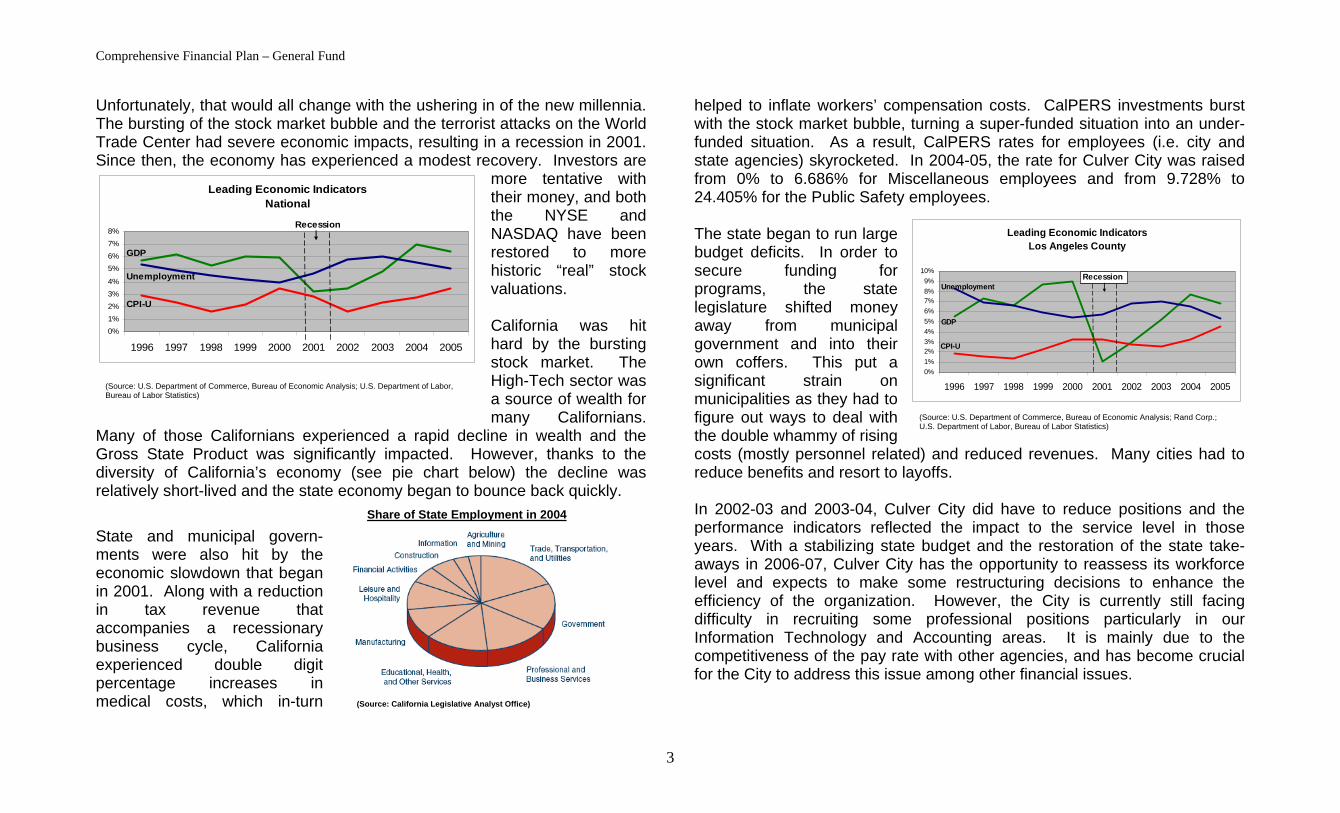
State and municipal govern-ments were also hit by the economic slowdown that began in 2001. Along with a reduction in tax revenue that accompanies a recessionary business cycle, California experienced double digit percentage increases in medical costs, which in-turn
helped to inflate workers’ compensation costs. CalPERS investments burst with the stock market bubble, turning a super-funded situation into an under-funded situation. As a result, CalPERS rates for employees (i.e. city and state agencies) skyrocketed. In 2004-05, the rate for Culver City was raised from 0% to 6.686% for Miscellaneous employees and from 9.728% to 24.405% for the Public Safety employees. Leading Economic Indicators
National
0%1%2%3%4%
5%6%7%8%
1996 1997 1998 1999 2000 2001 2002 2003 2004 2005
GDP
Unemployment
CPI-U
Recession The state began to run large budget deficits. In order to secure funding for programs, the state legislature shifted money away from municipal government and into their own coffers. This put a significant strain on municipalities as they had to figure out ways to deal with the double whammy of rising costs (mostly personnel related) and reduced revenues. Many cities had to reduce benefits and resort to layoffs.
Leading Economic Indicators Los Angeles County
0%1%2%3%4%5%6%7%8%9%
In 2002-03 and 2003-04, Culver City did have to reduce positions and the performance indicators reflected the impact to the service level in those years. With a stabilizing state budget and the restoration of the state take-aways in 2006-07, Culver City has the opportunity to reassess its workforce level and expects to make some restructuring decisions to enhance the efficiency of the organization. However, the City is currently still facing difficulty in recruiting some professional positions particularly in our Information Technology and Accounting areas. It is mainly due to the competitiveness of the pay rate with other agencies, and has become crucial for the City to address this issue among other financial issues.
10%
(Source: California Legislative Analyst Office)
1996 1997 1998 1999 2000 2001 2002 2003 2004 2005
Recession
GDP
Unemployment
CPI-U
(Source: U.S. Department of Commerce, Bureau of Economic Analysis; U.S. Department of Labor, Bureau of Labor Statistics)
(Source: U.S. Department of Commerce, Bureau of Economic Analysis; Rand Corp.; U.S. Department of Labor, Bureau of Labor Statistics)
Share of State Employment in 2004
3
Comprehensive Financial Plan – General Fund
OUTLOOK The consensus among most forecasters is that the national and state economies will experience growth over the next year; however, there are a number of factors that are placing significant pressure on the economy, most notably: 1) fluctuating oil prices, 2) a slowing of sales in the housing market, and 3) increased threat of terrorism. Depending on how these three factors play out over the coming months, consumer confidence could be negatively affected. Rising energy and raw material costs and the increased cost to borrow money reduces a consumer’s disposable income. Recently, unstable world events have had a volatile effect on the stock market, which may also begin to have an adverse impact on consumer confidence and disposable income. As consumers’ disposable income subsides and they begin to lose confidence in the economy, they tend to save their money rather than spend it. The City’s single largest source of revenue (i.e. sales tax) is highly dependent on consumer confidence and consumer spending. A slowing housing market impacts property values, which in turn impacts the property tax revenues of the City and, more significantly, the Redevelopment Agency. Declining housing property values also impacts residents’ overall wealth. A reduction in wealth may encourage consumers to save rather than spend and cause residents to become averse to paying additional taxes, which may be needed to maintain service levels. Community investment has been one of the main reasons that the City has been able to weather the storm. A number of high profile projects initiated by the Redevelopment Agency, including the downtown construction of Pacific Theatres and the Cardiff, Ince, and Watseka parking structures, as well as the renovation of Kirk Douglas Theatre have helped to attract people and businesses to Culver City.
Future projects, such as downtown Parcel B and development associated with the Washington/National specific plan area centered around the proposed METRO EXPO Light Rail Station, will ensure that Culver City remains a hot spot on the West side. The realignment of Washington Boulevard from Culver Boulevard at Main Street to Ince is expected to be completed in 18 – 24 months. This project will create an area for a plaza, and allow for further development of retail shops. Another major project funded partially by the Redevelopment Agency is the new Fire Station #3 being constructed in the Fox Hills area. The current Fire Station #3 on Segrell Way is too small to maintain current and future needs. The new station will consist of two-stories and be 12,156 sq. ft. for Fire Department staff dormitories, offices, ancillary uses, and apparatus room. Construction is scheduled to begin in calendar 2007, with completion to take approximately 12 – 16 months from the start date. All of these investments in the community have paid off, and are expected to continue to pay off, by keeping Culver City’s revenues strong, especially sales, property, and business license taxes. PROJECTIONS AND ANALYSIS OF REVENUES AND EXPENDITURES OVERVIEW The worksheets for the ten-year forecasts of revenues and expenditures are included as attachments to this report. The worksheets include the projected revenues from all of the City’s revenue sources and appropriations for all City funds over the next ten years. As part of the exercise in developing the Comprehensive Financial Plan, staff created three scenarios: Most Likely, Optimistic, and Pessimistic. These three scenarios were used in order to calculate revenue percentages, and charts have been included in this document showing percentages over the next five years. The basic description for each scenario is:
4
Comprehensive Financial Plan – General Fund
Most Likely – This scenario is based on current historical percentage
growth to forecast revenues over the next ten years. It is calculated using a “business as usual” approach.
Optimistic – This scenario is based on revenues coming in at a higher
than expected rate due to such actions as an upswing in the economy and new development.
Pessimistic – This scenario is based on revenues coming in at a lower
rate due to such unknowns as a downturn in the economy or other losses of revenue.
The following section of this report identifies the methodology and assumptions used in developing these forecasts. There is also a brief discussion and analysis of a number of specific revenues and expenditures. FORECASTING METHODOLOGY: REVENUES In order to develop a reasonable ten-year forecast of General Fund revenues, it is important to analyze past data to establish a trend over time. Therefore, ten years of actual data (1994-95 through 2004-05) and two years of budgeted data (2005-06 and 2006-07) were collected. In order to get a complete picture of the trends, a number of statistical analysis techniques were considered, including calculating linear time trend models (i.e. regression) and average annual growth rates over the ten year period. The average annual growth rate served as the basis for the forecast, with adjustments being made as appropriate to more closely reflect the current state of the economy. Using the average annual growth rate methodology produces a somewhat conservative growth rate by smoothing out extraordinary revenue gains and dips. A limitation of this methodology is it does not account for structural changes in revenue generation, such as a new tax being implemented during
the time period or a significant change in the economic base. To capture some of the structural changes, staff has adjusted the appropriate revenues up or down accordingly. Staff also worked with Keyser Marston Associates, a real estate firm, who provided the City with revenue projections based on identified projects that were most likely to be developed within the City during the next ten years, and also for those that had been completed during fiscal 2006-07. The report has been included with this package for City Council’s information. A major outcome of the projections showed that, in most cases, the methodology used by staff to project the revenue for the plan is fairly close to the results provided by the consultant, within a reasonable margin of variance. For this reason, staff has only included additional Transient Occupancy Tax (TOT) revenues that are above staff’s original projections as they are from new development and are significantly above forecasted base revenue trends. It is important to note that these are not definite revenues as the developments are not yet completed. If the projects do come to fruition, though, the additional revenues are expected to be an additional $355,000 beginning in 2008-09, and another $1.1 million beginning in 2009-10. Additionally, because of the economic uncertainty over the next five to ten years, data from the separate scenarios were used to reflect anticipated economic trends. Each of the three scenarios, Most Likely, Optimistic, and Pessimistic, were developed using different underlying assumptions about the overall state of the economy during the next five to ten years. The underlying assumption for the “Most Likely” scenario is that the overall economy will remain relatively stable and things will continue as-is for the next ten years. Despite looming economic pressures (i.e. increasing oil prices, slowing housing market, and increasing interest rates), the Most Likely scenario assumes that an increase in some revenues (e.g. fees and charges, new development impact fees, etc.) will be sufficient to cover poorer performing revenues. Overall, the Most Likely scenario assumes General
5
Comprehensive Financial Plan – General Fund
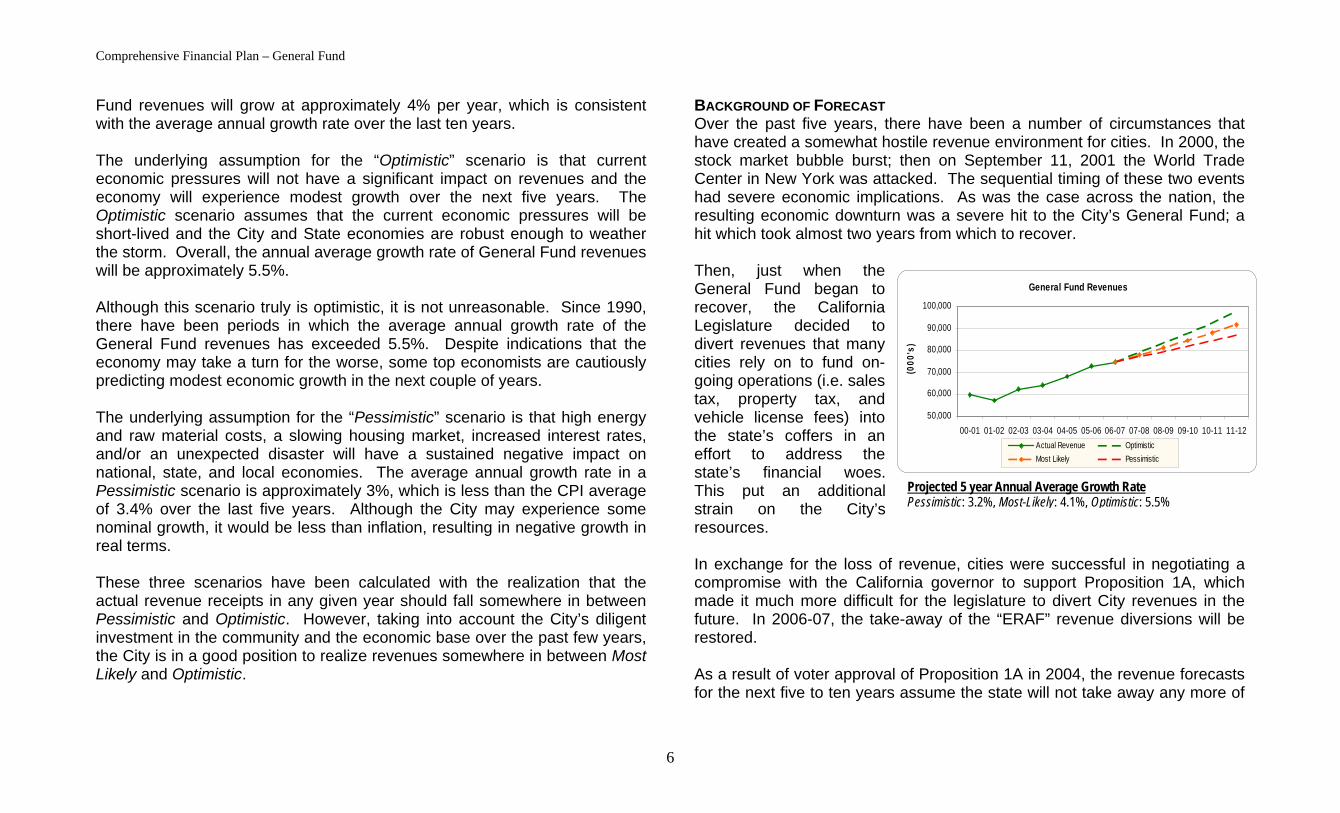
Fund revenues will grow at approximately 4% per year, which is consistent with the average annual growth rate over the last ten years. The underlying assumption for the “Optimistic” scenario is that current economic pressures will not have a significant impact on revenues and the economy will experience modest growth over the next five years. The Optimistic scenario assumes that the current economic pressures will be short-lived and the City and State economies are robust enough to weather the storm. Overall, the annual average growth rate of General Fund revenues will be approximately 5.5%. Although this scenario truly is optimistic, it is not unreasonable. Since 1990, there have been periods in which the average annual growth rate of the General Fund revenues has exceeded 5.5%. Despite indications that the economy may take a turn for the worse, some top economists are cautiously predicting modest economic growth in the next couple of years. The underlying assumption for the “Pessimistic” scenario is that high energy and raw material costs, a slowing housing market, increased interest rates, and/or an unexpected disaster will have a sustained negative impact on national, state, and local economies. The average annual growth rate in a Pessimistic scenario is approximately 3%, which is less than the CPI average of 3.4% over the last five years. Although the City may experience some nominal growth, it would be less than inflation, resulting in negative growth in real terms. These three scenarios have been calculated with the realization that the actual revenue receipts in any given year should fall somewhere in between Pessimistic and Optimistic. However, taking into account the City’s diligent investment in the community and the economic base over the past few years, the City is in a good position to realize revenues somewhere in between Most Likely and Optimistic.
BACKGROUND OF FORECAST Over the past five years, there have been a number of circumstances that have created a somewhat hostile revenue environment for cities. In 2000, the stock market bubble burst; then on September 11, 2001 the World Trade Center in New York was attacked. The sequential timing of these two events had severe economic implications. As was the case across the nation, the resulting economic downturn was a severe hit to the City’s General Fund; a hit which took almost two years from which to recover. Then, just when the General Fund began to recover, the California Legislature decided to divert revenues that many cities rely on to fund on-going operations (i.e. sales tax, property tax, and vehicle license fees) into the state’s coffers in an effort to address the state’s financial woes. This put an additional strain on the City’s resources.
General Fund Revenues
50,000
60,000
70,000
80,000
90,000
100,000
00-01 01-02 02-03 03-04 04-05 05-06 06-07 07-08 08-09 09-10 10-11 11-12
(000
's)
Actual Revenue OptimisticMost Likely Pessimistic
Projected 5 year Annual Average Growth Rate Pessimistic: 3.2%, Most-Likely: 4.1%, Optimistic: 5.5%
In exchange for the loss of revenue, cities were successful in negotiating a compromise with the California governor to support Proposition 1A, which made it much more difficult for the legislature to divert City revenues in the future. In 2006-07, the take-away of the “ERAF” revenue diversions will be restored. As a result of voter approval of Proposition 1A in 2004, the revenue forecasts for the next five to ten years assume the state will not take away any more of
6
Comprehensive Financial Plan – General Fund
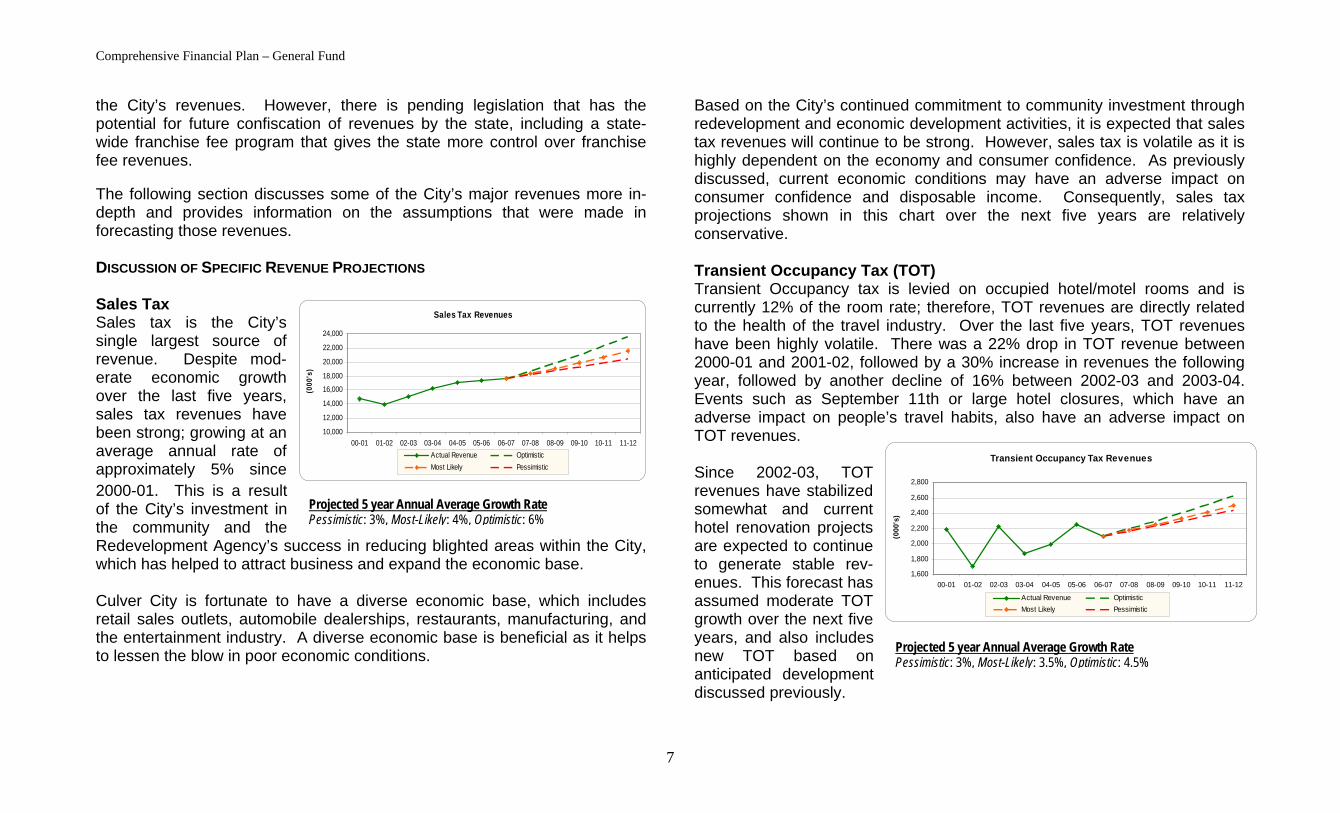
the City’s revenues. However, there is pending legislation that has the potential for future confiscation of revenues by the state, including a state-wide franchise fee program that gives the state more control over franchise fee revenues. The following section discusses some of the City’s major revenues more in-depth and provides information on the assumptions that were made in forecasting those revenues. DISCUSSION OF SPECIFIC REVENUE PROJECTIONS Sales Tax Sales tax is the City’s single largest source of revenue. Despite mod-erate economic growth over the last five years, sales tax revenues have been strong; growing at an average annual rate of approximately 5% since 2000-01. This is a result of the City’s investment in the community and the Redevelopment Agency’s success in reducing blighted areas within the City, which has helped to attract business and expand the economic base. Culver City is fortunate to have a diverse economic base, which includes retail sales outlets, automobile dealerships, restaurants, manufacturing, and the entertainment industry. A diverse economic base is beneficial as it helps to lessen the blow in poor economic conditions.
Based on the City’s continued commitment to community investment through redevelopment and economic development activities, it is expected that sales tax revenues will continue to be strong. However, sales tax is volatile as it is highly dependent on the economy and consumer confidence. As previously discussed, current economic conditions may have an adverse impact on consumer confidence and disposable income. Consequently, sales tax projections shown in this chart over the next five years are relatively conservative. Transient Occupancy Tax (TOT) Transient Occupancy tax is levied on occupied hotel/motel rooms and is currently 12% of the room rate; therefore, TOT revenues are directly related to the health of the travel industry. Over the last five years, TOT revenues have been highly volatile. There was a 22% drop in TOT revenue between 2000-01 and 2001-02, followed by a 30% increase in revenues the following year, followed by another decline of 16% between 2002-03 and 2003-04. Events such as September 11th or large hotel closures, which have an adverse impact on people’s travel habits, also have an adverse impact on TOT revenues.
Sales Tax Revenues
10,000
12,000
14,000
16,000
18,000
20,000
22,000
24,000
00-01 01-02 02-03 03-04 04-05 05-06 06-07 07-08 08-09 09-10 10-11 11-12
(000
's)
Actual Revenue OptimisticMost Likely Pessimistic
Since 2002-03, TOT revenues have stabilized somewhat and current hotel renovation projects are expected to continue to generate stable rev-enues. This forecast has assumed moderate TOT growth over the next five years, and also includes new TOT based on anticipated development discussed previously.
Transient Occupancy Tax Revenues
1,600
1,800
2,000
2,200
2,400
2,600
2,800
00-01 01-02 02-03 03-04 04-05 05-06 06-07 07-08 08-09 09-10 10-11 11-12
(000
's)
Projected 5 year Annual Average Growth Rate Pessimistic: 3%, Most-Likely: 4%, Optimistic: 6%
Actual Revenue OptimisticMost Likely Pessimistic
Projected 5 year Annual Average Growth Rate Pessimistic: 3%, Most-Likely: 3.5%, Optimistic: 4.5%
7
Comprehensive Financial Plan – General Fund
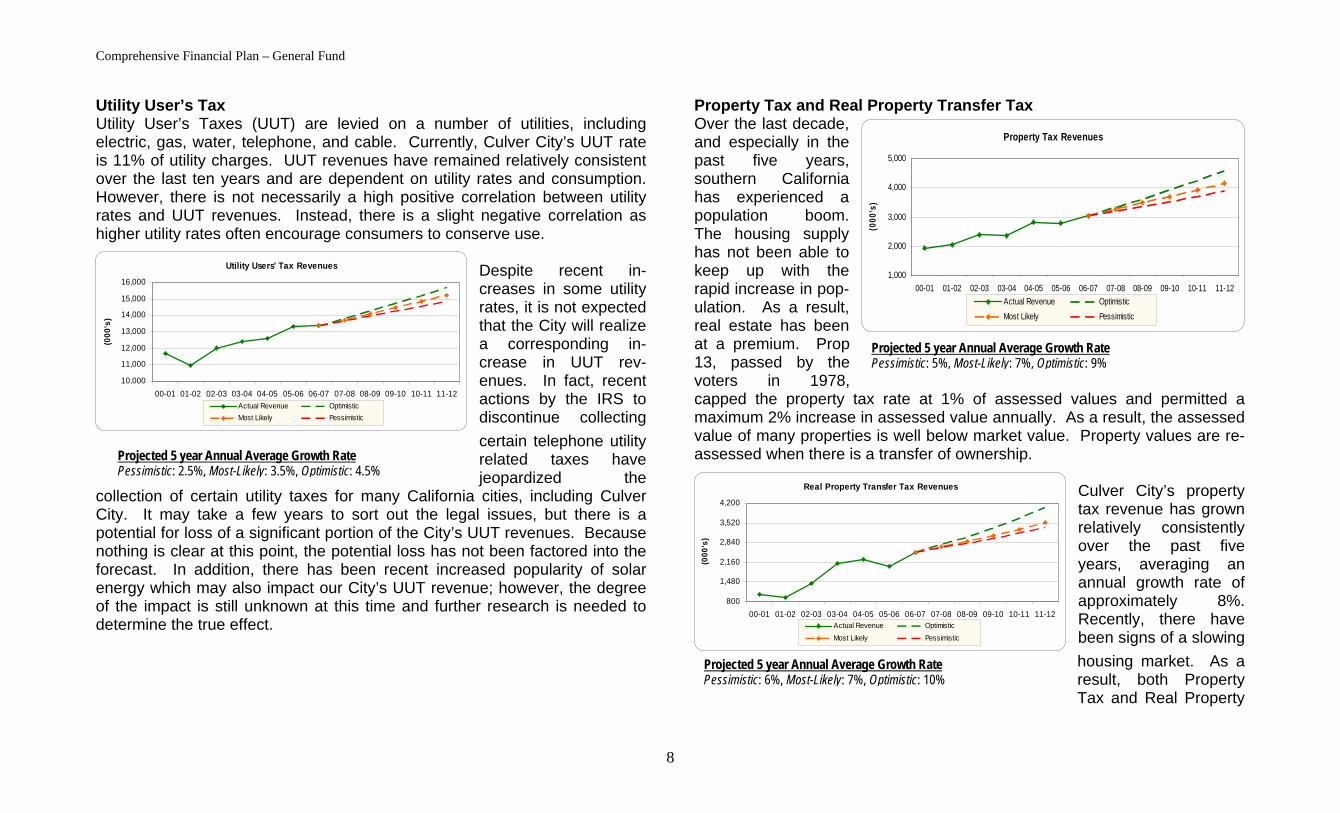
Utility User’s Tax Utility User’s Taxes (UUT) are levied on a number of utilities, including electric, gas, water, telephone, and cable. Currently, Culver City’s UUT rate is 11% of utility charges. UUT revenues have remained relatively consistent over the last ten years and are dependent on utility rates and consumption. However, there is not necessarily a high positive correlation between utility rates and UUT revenues. Instead, there is a slight negative correlation as higher utility rates often encourage consumers to conserve use.
Despite recent in-creases in some utility rates, it is not expected that the City will realize a corresponding in-crease in UUT rev-enues. In fact, recent actions by the IRS to discontinue collecting certain telephone utility related taxes have jeopardized the
collection of certain utility taxes for many California cities, including Culver City. It may take a few years to sort out the legal issues, but there is a potential for loss of a significant portion of the City’s UUT revenues. Because nothing is clear at this point, the potential loss has not been factored into the forecast. In addition, there has been recent increased popularity of solar energy which may also impact our City’s UUT revenue; however, the degree of the impact is still unknown at this time and further research is needed to determine the true effect.
Property Tax and Real Property Transfer Tax Over the last decade, and especially in the past five years, southern California has experienced a population boom. The housing supply has not been able to keep up with the rapid increase in pop-ulation. As a result, real estate has been at a premium. Prop 13, passed by the voters in 1978, capped the property tax rate at 1% of assessed values and permitted a maximum 2% increase in assessed value annually. As a result, the assessed value of many properties is well below market value. Property values are re-assessed when there is a transfer of ownership.
Property Tax Revenues
1,000
2,000
000
4,000
5,000
00-01 01-02 02-03 03-04 04-05 05-06 06-07 07-08 08-09 09-10 10-11 11-12
(000
's)
Culver City’s property tax revenue has grown relatively consistently over the past five years, averaging an annual growth rate of approximately 8%. Recently, there have been signs of a slowing housing market. As a result, both Property Tax and Real Property
3,
Projected 5 year Annual Average Growth Rate Pessimistic: 2.5%, Most-Likely: 3.5%, Optimistic: 4.5%
Projected 5 year Annual Average Growth Rate Pessimistic: 6%, Most-Likely: 7%, Optimistic: 10%
Utility Users' Tax Revenues
10,000
11,000
12,000
13,000
14,000
15,000
16,000
00-01 01-02 02-03 03-04 04-05 05-06 06-07 07-08 08-09 09-10 10-11 11-12
(000
's)
Actual Revenue OptimisticMost Likely Pessimistic
Actual Revenue OptimisticMost Likely Pessimistic
Projected 5 year Annual Average Growth Rate Pessimistic: 5%, Most-Likely: 7%, Optimistic: 9%
Real Property Transfer Tax Revenues
800
1,480
2,160
2,840
3,520
4,200
00-01 01-02 02-03 03-04 04-05 05-06 06-07 07-08 08-09 09-10 10-11 11-12
(000
's)
Actual Revenue OptimisticMost Likely Pessimistic
8
Comprehensive Financial Plan – General Fund
Transfer tax revenues are projected to slow somewhat over the next five years, with a “Most-Likely” projection of 7%. It is expected that, despite the potential for a slowing housing market, current development activities will help to sustain property values in Culver City over the next five years.
Business Tax All entities conducting businesses in Culver City are required to pay a Business Tax annually. This tax has experienced relatively stable growth over the past five years, a testament to the grow-ing economic base in the City. During the 2006-07 budget prep-aration process,
Business Certificate application fees were reviewed. As a result, the City Council approved an increase to the Business Certificate application fees, which had not been increased since the early 1990’s. This should generate some additional on-going revenue for the City. All Other Revenue All other revenues make up approx-imately 36% of the
General Fund. The most significant of which are Charges for Services. During 2006-07, a comprehensive user fees and charges rate study will be performed by an outside consultant. This will aid the City in establishing a baseline for all current fees and charges as well as recommend possible new fees that the City may consider in order to adequately recoup the cost of providing certain services. It is expected that this study will result in some additional revenue for the City. Business License Revenues
5,000
6,000
7,000
8,000
9,000
10,000
11,000
12,000
00-01 01-02 02-03 03-04 04-05 05-06 06-07 07-08 08-09 09-10 10-11 11-12
(000
's)
Actual Revenue OptimisticMost Likely Pessimistic
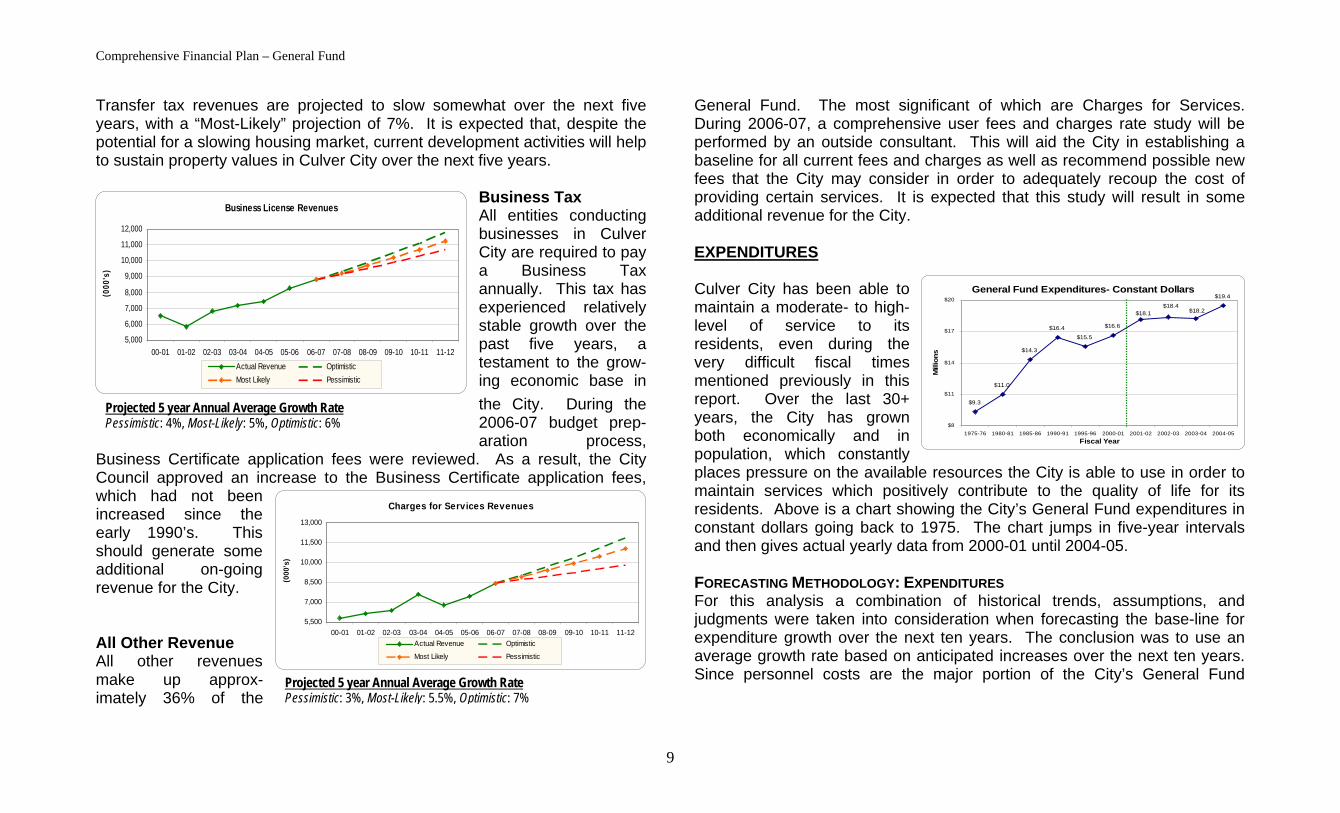
EXPENDITURES Culver City has been able to maintain a moderate- to high-level of service to its residents, even during the very difficult fiscal times mentioned previously in this report. Over the last 30+ years, the City has grown both economically and in population, which constantly places pressure on the available resources the City is able to use in order to maintain services which positively contribute to the quality of life for its residents. Above is a chart showing the City’s General Fund expenditures in constant dollars going back to 1975. The chart jumps in five-year intervals and then gives actual yearly data from 2000-01 until 2004-05.
General Fund Expenditures- Constant Dollars
$9.3
$11.0
$14.3
$16.4$15.5
$16.6
$19.4
$18.2$18.4
$18.1
$8
$11
$14
$17
$20
1975-76 1980-81 1985-86 1990-91 1995-96 2000-01 2001-02 2002-03 2003-04 2004-05Fiscal Year
Mill
ions
Projected 5 year Annual Average Growth Rate Pessimistic: 4%, Most-Likely: 5%, Optimistic: 6%
Charges for Services Revenues
5,500
7,000
8,500
10,000
11,500
13,000
00-01 01-02 02-03 03-04 04-05 05-06 06-07 07-08 08-09 09-10 10-11 11-12
(000
's FORECASTING METHODOLOGY: EXPENDITURES For this analysis a combination of historical trends, assumptions, and judgments were taken into consideration when forecasting the base-line for expenditure growth over the next ten years. The conclusion was to use an average growth rate based on anticipated increases over the next ten years. Since personnel costs are the major portion of the City’s General Fund
)
Actual Revenue Optimistic
Most Likely Pessimistic
Projected 5 year Annual Average Growth Rate Pessimistic: 3%, Most-Likely: 5.5%, Optimistic: 7%
9
Comprehensive Financial Plan – General Fund
expenditures, they were the driving force in calculating the average percentage increase applied to expenditures for this analysis. There are a few drawbacks in using an average growth rate to calculate expenditures, especially on those which are tied to economic forces. While some expenses are driven by economic forces, many are based on set increases from year to year, such as cost-of-living adjustments which will be discussed further in the document.
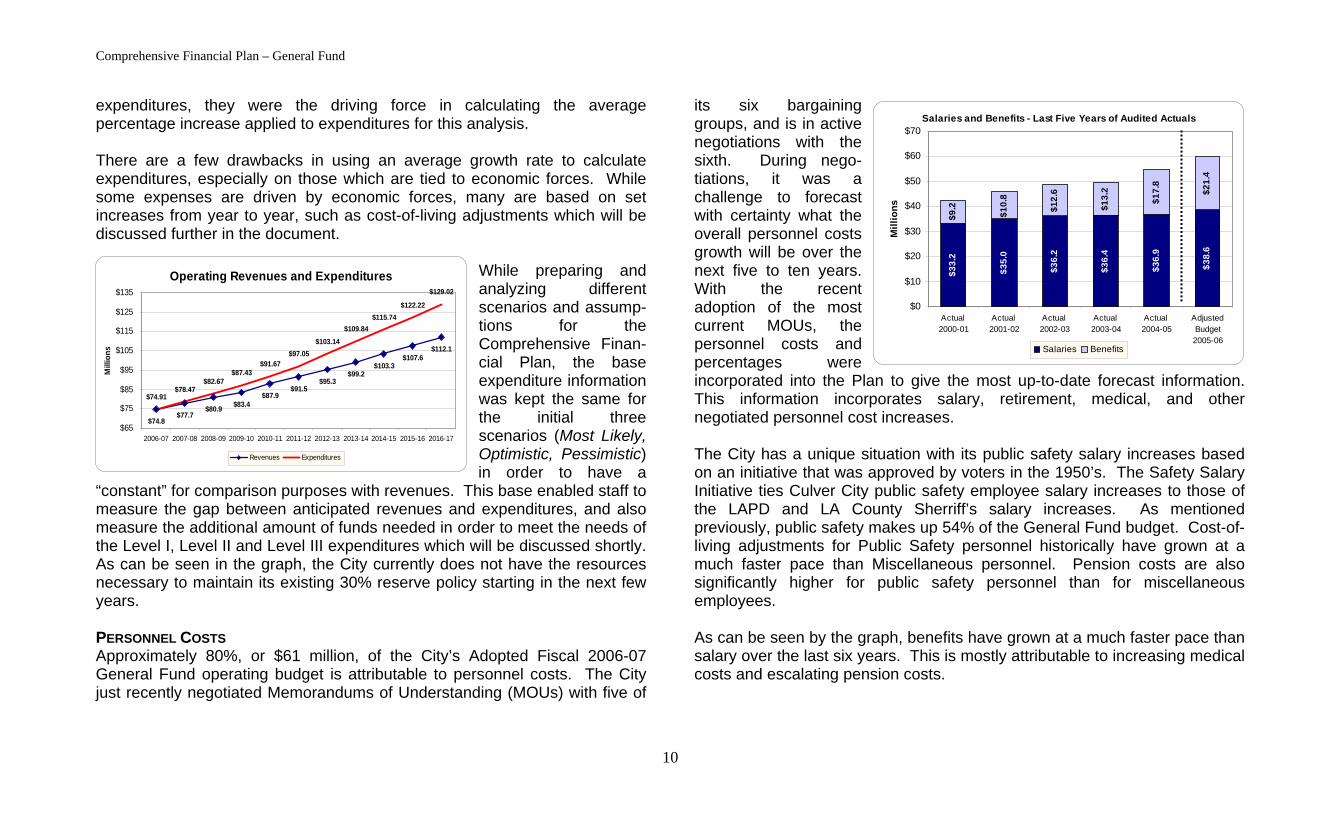
While preparing and analyzing different scenarios and assump-tions for the Comprehensive Finan-cial Plan, the base expenditure information was kept the same for the initial three scenarios (Most Likely, Optimistic, Pessimistic) in order to have a
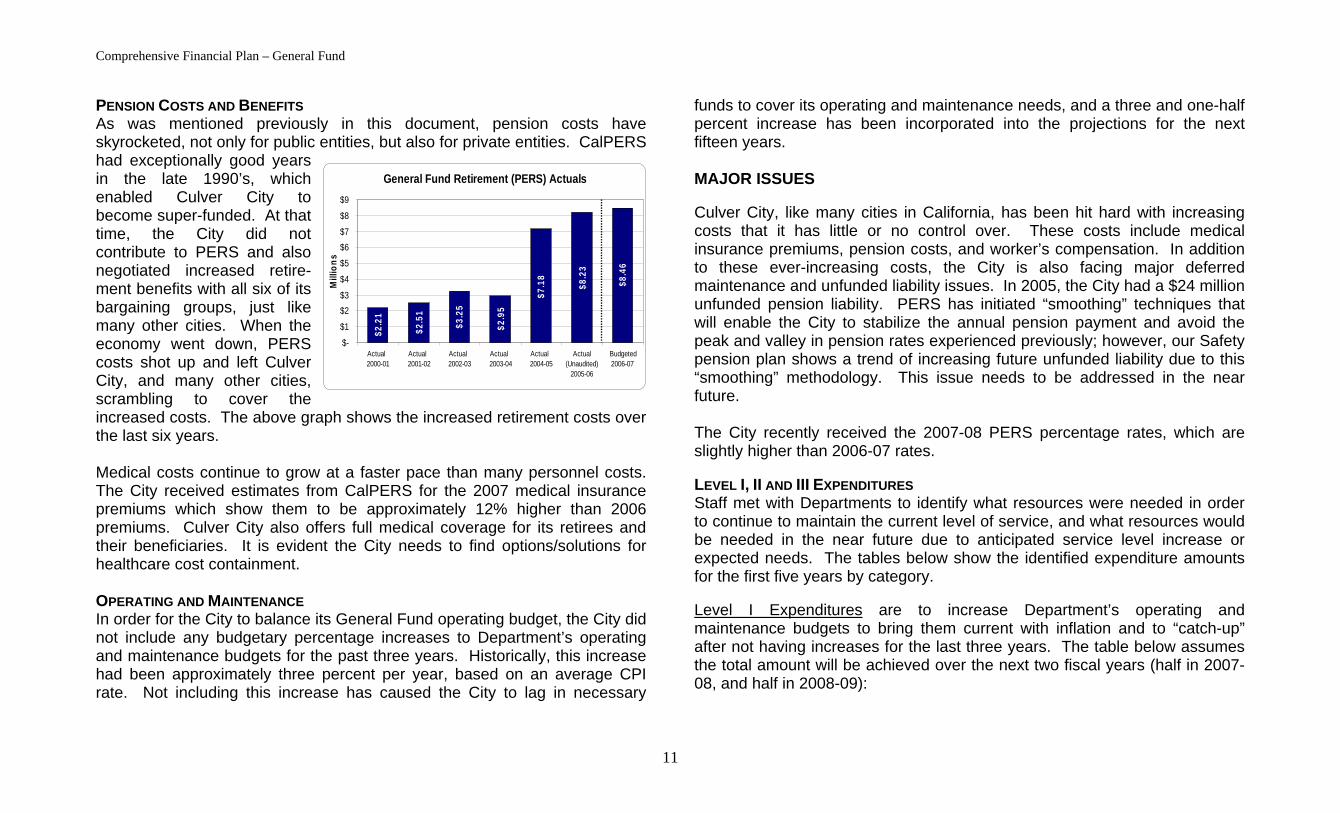
“constant” for comparison purposes with revenues. This base enabled staff to measure the gap between anticipated revenues and expenditures, and also measure the additional amount of funds needed in order to meet the needs of the Level I, Level II and Level III expenditures which will be discussed shortly. As can be seen in the graph, the City currently does not have the resources necessary to maintain its existing 30% reserve policy starting in the next few years. PERSONNEL COSTS Approximately 80%, or $61 million, of the City’s Adopted Fiscal 2006-07 General Fund operating budget is attributable to personnel costs. The City just recently negotiated Memorandums of Understanding (MOUs) with five of
its six bargaining groups, and is in active negotiations with the sixth. During nego-tiations, it was a challenge to forecast with certainty what the overall personnel costs growth will be over the next five to ten years. With the recent adoption of the most current MOUs, the personnel costs and percentages were incorporated into the Plan to give the most up-to-date forecast information. This information incorporates salary, retirement, medical, and other negotiated personnel cost increases.
Salaries and Benefits - Last Five Years of Audited Actuals
$33.
2
$35.
0
$36.
2
$36.
4
$36.
9
$38.
6
$9.2
$10.
8
$12.
6
$13.
2
$17.
8
$21.
4
$0
$10
$20
$30
$40
$50
$60
$70
Actual 2000-01
Actual 2001-02
Actual 2002-03
Actual 2003-04
Actual 2004-05
AdjustedBudget
2005-06
Mill
ions
Salaries Benefits
Operating Revenues and Expenditures
$74.8$77.7
$80.9 $83.4$87.9
$91.5$95.3
$99.2$103.3
$107.6$112.1
$74.91$78.47
$82.67$87.43
$91.67$97.05
$103.14$109.84
$115.74$122.22
$129.02
$65
$75
$85
$95
$105
$115
$125
$135
2006-07 2007-08 2008-09 2009-10 2010-11 2011-12 2012-13 2013-14 2014-15 2015-16 2016-17
Mill
ions
Revenues Expenditures
The City has a unique situation with its public safety salary increases based on an initiative that was approved by voters in the 1950’s. The Safety Salary Initiative ties Culver City public safety employee salary increases to those of the LAPD and LA County Sherriff’s salary increases. As mentioned previously, public safety makes up 54% of the General Fund budget. Cost-of-living adjustments for Public Safety personnel historically have grown at a much faster pace than Miscellaneous personnel. Pension costs are also significantly higher for public safety personnel than for miscellaneous employees. As can be seen by the graph, benefits have grown at a much faster pace than salary over the last six years. This is mostly attributable to increasing medical costs and escalating pension costs.
10
Comprehensive Financial Plan – General Fund
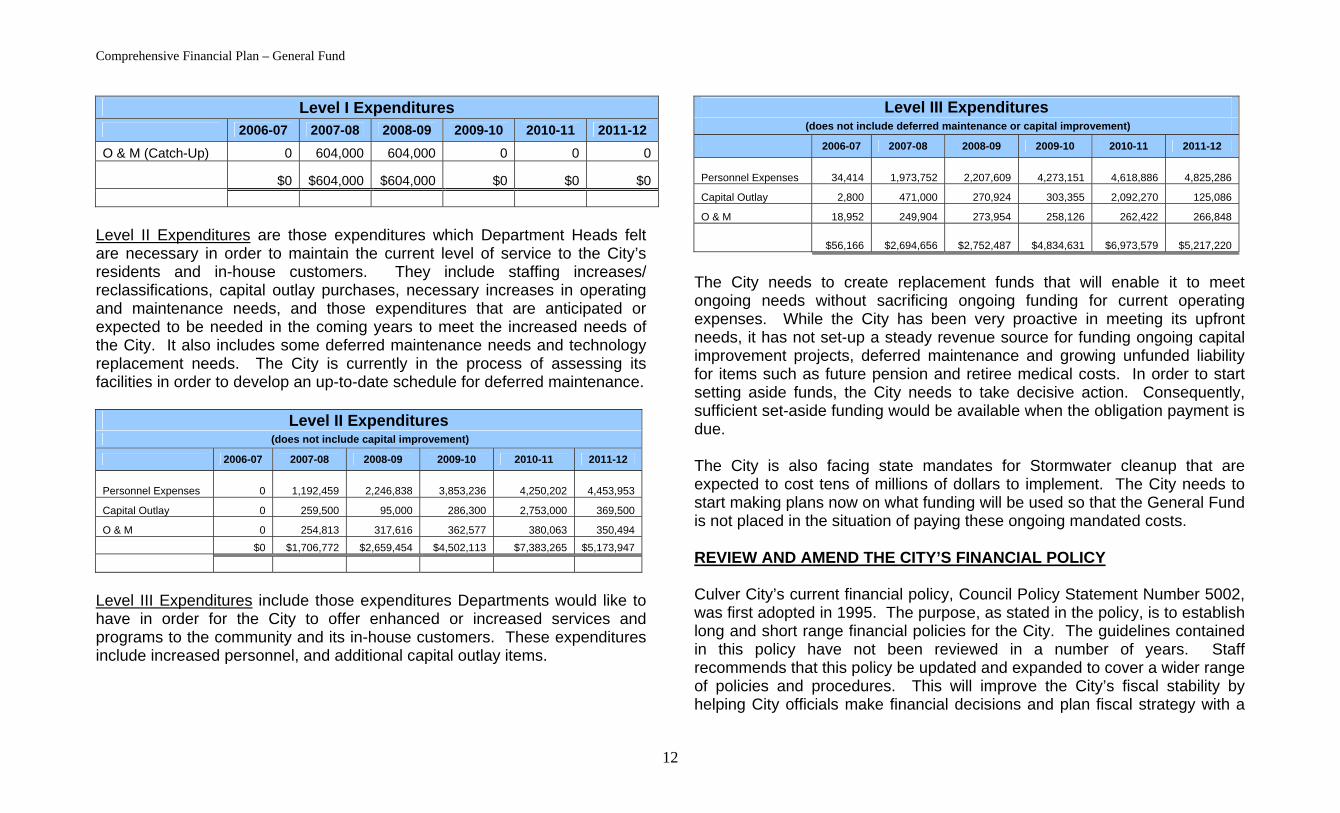
PENSION COSTS AND BENEFITS As was mentioned previously in this document, pension costs have skyrocketed, not only for public entities, but also for private entities. CalPERS had exceptionally good years in the late 1990’s, which enabled Culver City to become super-funded. At that time, the City did not contribute to PERS and also negotiated increased retire-ment benefits with all six of its bargaining groups, just like many other cities. When the economy went down, PERS costs shot up and left Culver City, and many other cities, scrambling to cover the increased costs. The above graph shows the increased retirement costs over the last six years. Medical costs continue to grow at a faster pace than many personnel costs. The City received estimates from CalPERS for the 2007 medical insurance premiums which show them to be approximately 12% higher than 2006 premiums. Culver City also offers full medical coverage for its retirees and their beneficiaries. It is evident the City needs to find options/solutions for healthcare cost containment. OPERATING AND MAINTENANCE In order for the City to balance its General Fund operating budget, the City did not include any budgetary percentage increases to Department’s operating and maintenance budgets for the past three years. Historically, this increase had been approximately three percent per year, based on an average CPI rate. Not including this increase has caused the City to lag in necessary
funds to cover its operating and maintenance needs, and a three and one-half percent increase has been incorporated into the projections for the next fifteen years.
General Fund Retirement (PERS) Actuals
$8.4
6
$8.2
3
$7.1
8
$2.9
5
$3.2
5
$2.5
1
$2.2
1
$-
$1
$2$3
$4
$5
$6$7
$8
$9
Actual 2000-01
Actual 2001-02
Actual 2002-03
Actual 2003-04
Actual 2004-05
Actual(Unaudited)
2005-06
Budgeted2006-07
Mill
ions
MAJOR ISSUES Culver City, like many cities in California, has been hit hard with increasing costs that it has little or no control over. These costs include medical insurance premiums, pension costs, and worker’s compensation. In addition to these ever-increasing costs, the City is also facing major deferred maintenance and unfunded liability issues. In 2005, the City had a $24 million unfunded pension liability. PERS has initiated “smoothing” techniques that will enable the City to stabilize the annual pension payment and avoid the peak and valley in pension rates experienced previously; however, our Safety pension plan shows a trend of increasing future unfunded liability due to this “smoothing” methodology. This issue needs to be addressed in the near future. The City recently received the 2007-08 PERS percentage rates, which are slightly higher than 2006-07 rates. LEVEL I, II AND III EXPENDITURES Staff met with Departments to identify what resources were needed in order to continue to maintain the current level of service, and what resources would be needed in the near future due to anticipated service level increase or expected needs. The tables below show the identified expenditure amounts for the first five years by category. Level I Expenditures are to increase Department’s operating and maintenance budgets to bring them current with inflation and to “catch-up” after not having increases for the last three years. The table below assumes the total amount will be achieved over the next two fiscal years (half in 2007-08, and half in 2008-09):
11
Comprehensive Financial Plan – General Fund
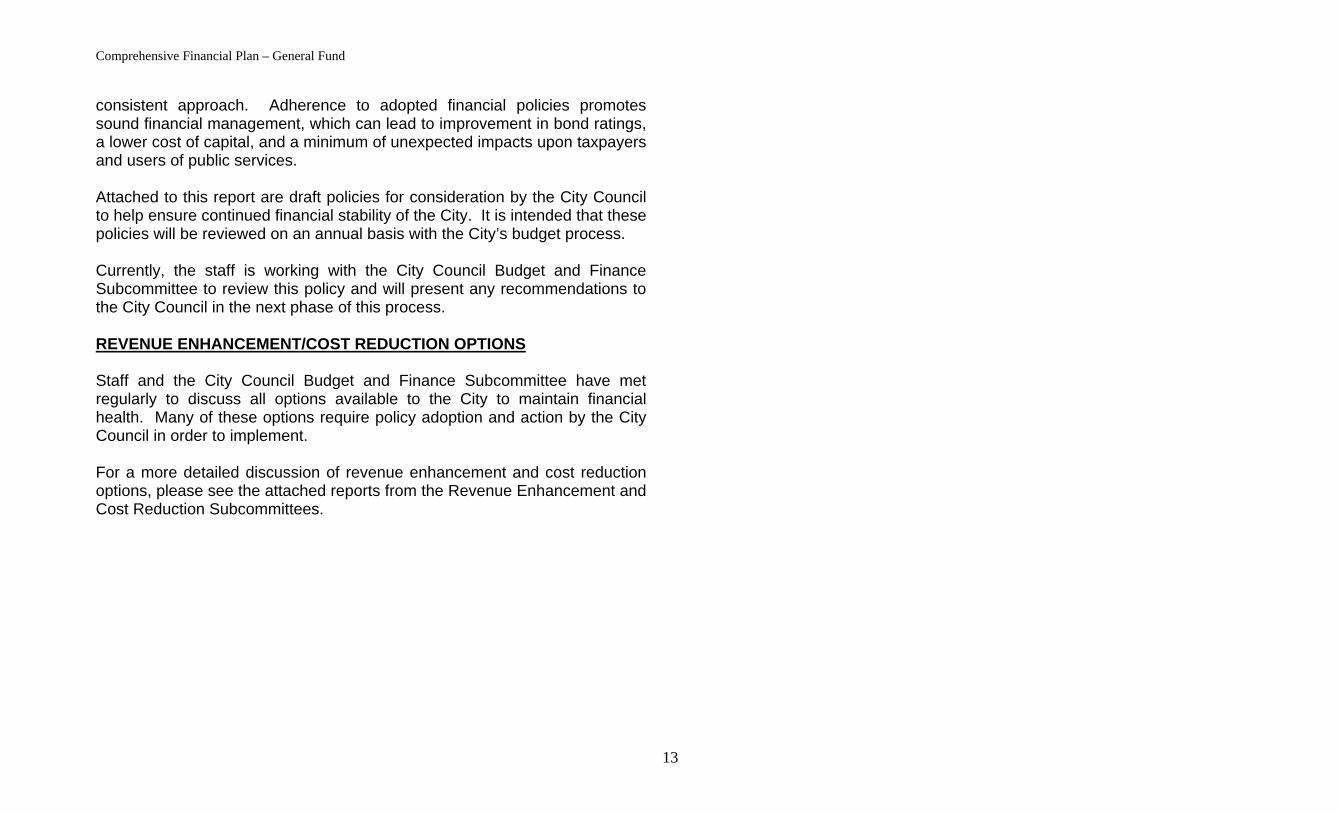
Level I Expenditures 2006-07 2007-08 2008-09 2009-10 2010-11 2011-12
O & M (Catch-Up) 0 604,000 604,000 0 0 0
$0 $604,000 $604,000 $0 $0 $0
Level II Expenditures are those expenditures which Department Heads felt are necessary in order to maintain the current level of service to the City’s residents and in-house customers. They include staffing increases/ reclassifications, capital outlay purchases, necessary increases in operating and maintenance needs, and those expenditures that are anticipated or expected to be needed in the coming years to meet the increased needs of the City. It also includes some deferred maintenance needs and technology replacement needs. The City is currently in the process of assessing its facilities in order to develop an up-to-date schedule for deferred maintenance.
Level II Expenditures (does not include capital improvement)
2006-07 2007-08 2008-09 2009-10 2010-11 2011-12
Personnel Expenses 0 1,192,459 2,246,838 3,853,236 4,250,202 4,453,953
Capital Outlay 0 259,500 95,000 286,300 2,753,000 369,500
O & M 0 254,813 317,616 362,577 380,063 350,494 $0 $1,706,772 $2,659,454 $4,502,113 $7,383,265 $5,173,947
Level III Expenditures include those expenditures Departments would like to have in order for the City to offer enhanced or increased services and programs to the community and its in-house customers. These expenditures include increased personnel, and additional capital outlay items.
Level III Expenditures (does not include deferred maintenance or capital improvement)
2006-07 2007-08 2008-09 2009-10 2010-11 2011-12
Personnel Expenses 34,414 1,973,752 2,207,609 4,273,151 4,618,886 4,825,286
Capital Outlay 2,800 471,000 270,924 303,355 2,092,270 125,086
O & M 18,952 249,904 273,954 258,126 262,422 266,848
$56,166 $2,694,656 $2,752,487 $4,834,631 $6,973,579 $5,217,220
The City needs to create replacement funds that will enable it to meet ongoing needs without sacrificing ongoing funding for current operating expenses. While the City has been very proactive in meeting its upfront needs, it has not set-up a steady revenue source for funding ongoing capital improvement projects, deferred maintenance and growing unfunded liability for items such as future pension and retiree medical costs. In order to start setting aside funds, the City needs to take decisive action. Consequently, sufficient set-aside funding would be available when the obligation payment is due. The City is also facing state mandates for Stormwater cleanup that are expected to cost tens of millions of dollars to implement. The City needs to start making plans now on what funding will be used so that the General Fund is not placed in the situation of paying these ongoing mandated costs. REVIEW AND AMEND THE CITY’S FINANCIAL POLICY Culver City’s current financial policy, Council Policy Statement Number 5002, was first adopted in 1995. The purpose, as stated in the policy, is to establish long and short range financial policies for the City. The guidelines contained in this policy have not been reviewed in a number of years. Staff recommends that this policy be updated and expanded to cover a wider range of policies and procedures. This will improve the City’s fiscal stability by helping City officials make financial decisions and plan fiscal strategy with a
12
Comprehensive Financial Plan – General Fund
consistent approach. Adherence to adopted financial policies promotes sound financial management, which can lead to improvement in bond ratings, a lower cost of capital, and a minimum of unexpected impacts upon taxpayers and users of public services. Attached to this report are draft policies for consideration by the City Council to help ensure continued financial stability of the City. It is intended that these policies will be reviewed on an annual basis with the City’s budget process. Currently, the staff is working with the City Council Budget and Finance Subcommittee to review this policy and will present any recommendations to the City Council in the next phase of this process. REVENUE ENHANCEMENT/COST REDUCTION OPTIONS Staff and the City Council Budget and Finance Subcommittee have met regularly to discuss all options available to the City to maintain financial health. Many of these options require policy adoption and action by the City Council in order to implement. For a more detailed discussion of revenue enhancement and cost reduction options, please see the attached reports from the Revenue Enhancement and Cost Reduction Subcommittees.
13
Description 2006-07 2007-08 2008-09 2009-10 2010-11 2011-12 2012-13 2013-14 2014-15 2015-16 2016-17
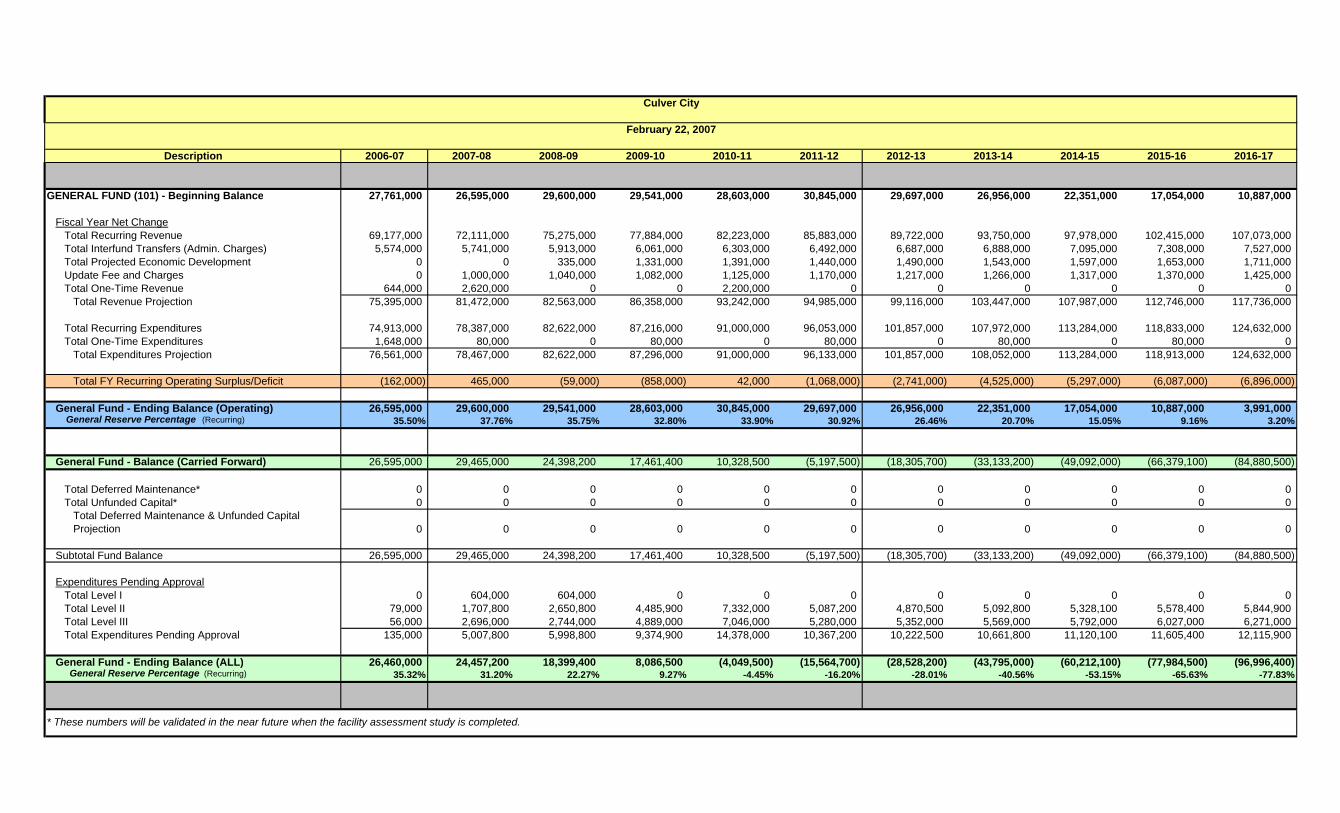
GENERAL FUND (101) - Beginning Balance 27,761,000 26,595,000 29,600,000 29,541,000 28,603,000 30,845,000 29,697,000 26,956,000 22,351,000 17,054,000 10,887,000
Fiscal Year Net ChangeTotal Recurring Revenue 69,177,000 72,111,000 75,275,000 77,884,000 82,223,000 85,883,000 89,722,000 93,750,000 97,978,000 102,415,000 107,073,000Total Interfund Transfers (Admin. Charges) 5,574,000 5,741,000 5,913,000 6,061,000 6,303,000 6,492,000 6,687,000 6,888,000 7,095,000 7,308,000 7,527,000Total Projected Economic Development 0 0 335,000 1,331,000 1,391,000 1,440,000 1,490,000 1,543,000 1,597,000 1,653,000 1,711,000Update Fee and Charges 0 1,000,000 1,040,000 1,082,000 1,125,000 1,170,000 1,217,000 1,266,000 1,317,000 1,370,000 1,425,000Total One-Time Revenue 644,000 2,620,000 0 0 2,200,000 0 0 0 0 0 0
Total Revenue Projection 75,395,000 81,472,000 82,563,000 86,358,000 93,242,000 94,985,000 99,116,000 103,447,000 107,987,000 112,746,000 117,736,000
Total Recurring Expenditures 74,913,000 78,387,000 82,622,000 87,216,000 91,000,000 96,053,000 101,857,000 107,972,000 113,284,000 118,833,000 124,632,000Total One-Time Expenditures 1,648,000 80,000 0 80,000 0 80,000 0 80,000 0 80,000 0
Total Expenditures Projection 76,561,000 78,467,000 82,622,000 87,296,000 91,000,000 96,133,000 101,857,000 108,052,000 113,284,000 118,913,000 124,632,000
Total FY Recurring Operating Surplus/Deficit (162,000) 465,000 (59,000) (858,000) 42,000 (1,068,000) (2,741,000) (4,525,000) (5,297,000) (6,087,000) (6,896,000)
General Fund - Ending Balance (Operating) 26,595,000 29,600,000 29,541,000 28,603,000 30,845,000 29,697,000 26,956,000 22,351,000 17,054,000 10,887,000 3,991,000 General Reserve Percentage (Recurring) 35.50% 37.76% 35.75% 32.80% 33.90% 30.92% 26.46% 20.70% 15.05% 9.16% 3.20%
General Fund - Balance (Carried Forward) 26,595,000 29,465,000 24,398,200 17,461,400 10,328,500 (5,197,500) (18,305,700) (33,133,200) (49,092,000) (66,379,100) (84,880,500)
Total Deferred Maintenance* 0 0 0 0 0 0 0 0 0 0 0Total Unfunded Capital* 0 0 0 0 0 0 0 0 0 0 0
Total Deferred Maintenance & Unfunded Capital Projection 0 0 0 0 0 0 0 0 0 0 0
Subtotal Fund Balance 26,595,000 29,465,000 24,398,200 17,461,400 10,328,500 (5,197,500) (18,305,700) (33,133,200) (49,092,000) (66,379,100) (84,880,500)
Expenditures Pending ApprovalTotal Level I 0 604,000 604,000 0 0 0 0 0 0 0 0Total Level II 79,000 1,707,800 2,650,800 4,485,900 7,332,000 5,087,200 4,870,500 5,092,800 5,328,100 5,578,400 5,844,900Total Level III 56,000 2,696,000 2,744,000 4,889,000 7,046,000 5,280,000 5,352,000 5,569,000 5,792,000 6,027,000 6,271,000Total Expenditures Pending Approval 135,000 5,007,800 5,998,800 9,374,900 14,378,000 10,367,200 10,222,500 10,661,800 11,120,100 11,605,400 12,115,900
General Fund - Ending Balance (ALL) 26,460,000 24,457,200 18,399,400 8,086,500 (4,049,500) (15,564,700) (28,528,200) (43,795,000) (60,212,100) (77,984,500) (96,996,400) General Reserve Percentage (Recurring) 35.32% 31.20% 22.27% 9.27% -4.45% -16.20% -28.01% -40.56% -53.15% -65.63% -77.83%
Culver City
February 22, 2007
* These numbers will be validated in the near future when the facility assessment study is completed.
Comprehensive Financial Plan – Refuse Fund
CITY OF CULVER CITY
COMPREHENSIVE FINANCIAL STRATEGY for
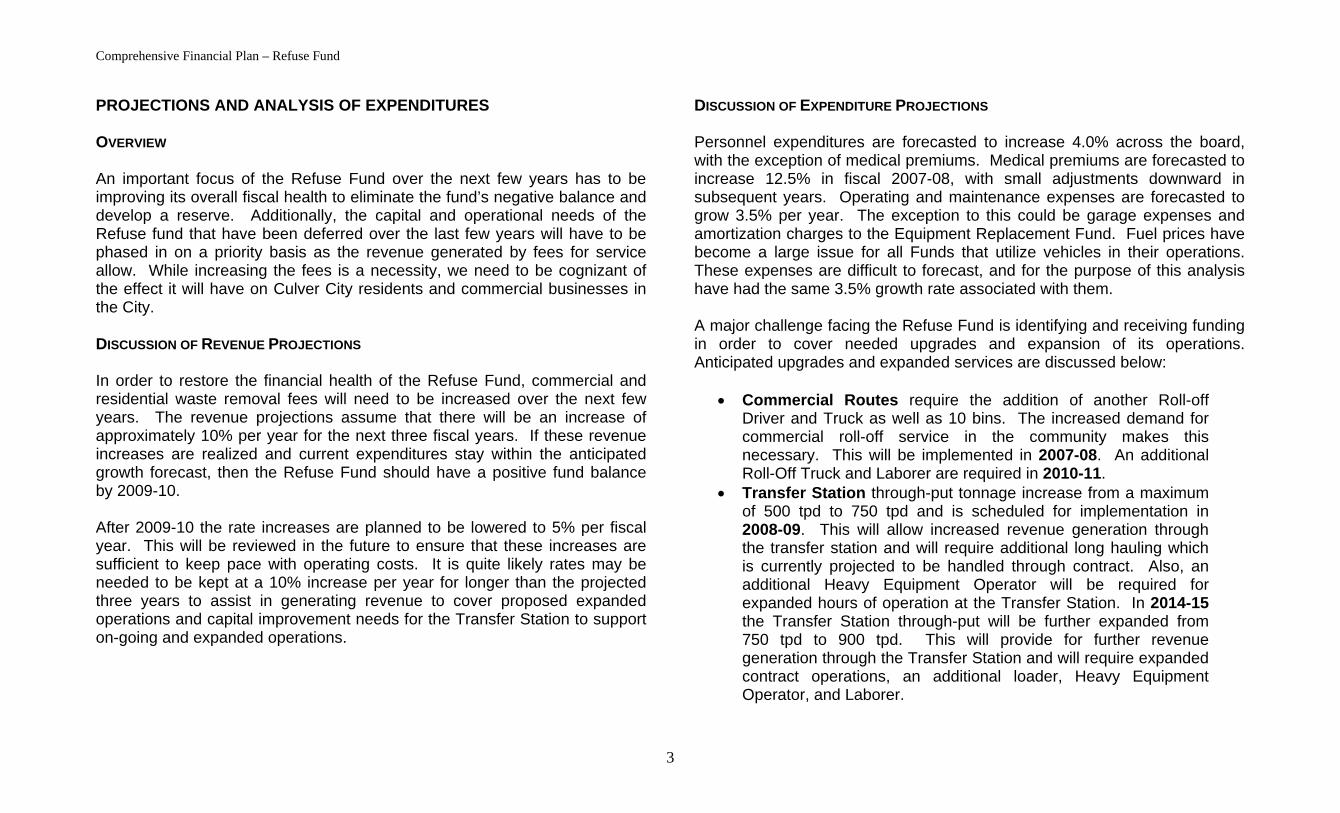
Refuse Fund INTRODUCTION The Refuse Fund is an Enterprise Fund that was established to provide for municipal waste removal and recycling services from the residential, commercial, and industrial areas of the City. The Refuse Fund also provides funds for operation of a transfer station to dispose of non-hazardous solid wastes to material processors for reuse or recycling and transfer all other materials to disposal sites. The Refuse operation strives to provide efficient and effective municipal waste removal services and recover the maximum volume of recyclable or reusable material from the waste stream. The refuse collection operation is responsible for the administration of the City’s street sweeping contract and the removal of solid waste from the residential, commercial, and industrial areas of the City. Residential crews provide weekly trash and bi-weekly recycling removal service to family dwellings consisting of up to four units in size. Residents are billed annually for the trash services through the LA County tax collection system. Commercial collection crews provide scheduled and non-scheduled trash removal to all businesses and multi-family residential units consisting of more than four units. The commercial collection crews also service pedestrian receptacles located throughout the City, and remove large bulky items set out by residents and businesses. Businesses and property managers are billed monthly for the commercial service that occurs during the month.
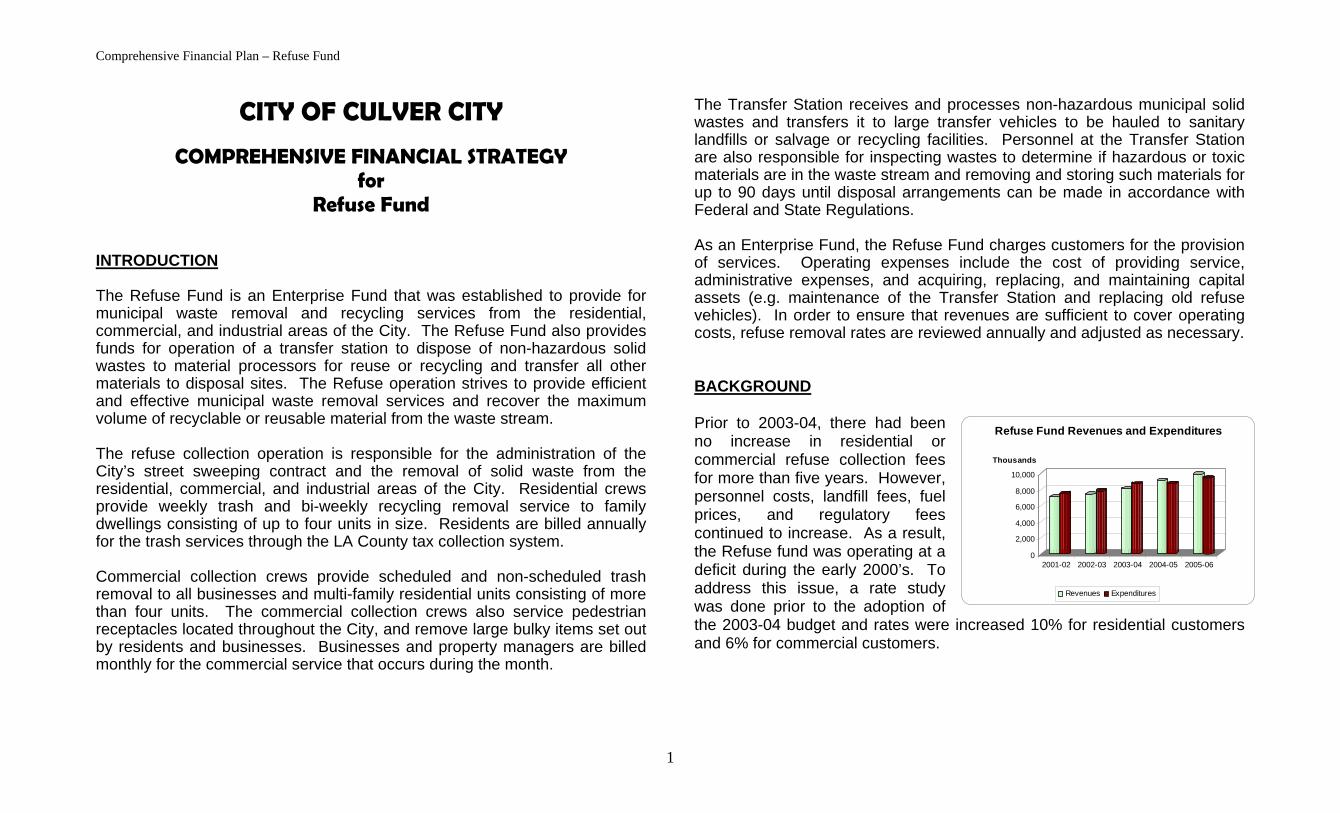
The Transfer Station receives and processes non-hazardous municipal solid wastes and transfers it to large transfer vehicles to be hauled to sanitary landfills or salvage or recycling facilities. Personnel at the Transfer Station are also responsible for inspecting wastes to determine if hazardous or toxic materials are in the waste stream and removing and storing such materials for up to 90 days until disposal arrangements can be made in accordance with Federal and State Regulations. As an Enterprise Fund, the Refuse Fund charges customers for the provision of services. Operating expenses include the cost of providing service, administrative expenses, and acquiring, replacing, and maintaining capital assets (e.g. maintenance of the Transfer Station and replacing old refuse vehicles). In order to ensure that revenues are sufficient to cover operating costs, refuse removal rates are reviewed annually and adjusted as necessary. BACKGROUND Prior to 2003-04, there had been no increase in residential or commercial refuse collection fees for more than five years. However, personnel costs, landfill fees, fuel prices, and regulatory fees continued to increase. As a result, the Refuse fund was operating at a deficit during the early 2000’s. To address this issue, a rate study was done prior to the adoption of the 2003-04 budget and rates were increased 10% for residential customers and 6% for commercial customers.
0
2,000
4,000
6,000
8,000
10,000
Thousands
2001-02 2002-03 2003-04 2004-05 2005-06
Refuse Fund Revenues and Expenditures
Revenues Expenditures
1
Comprehensive Financial Plan – Refuse Fund
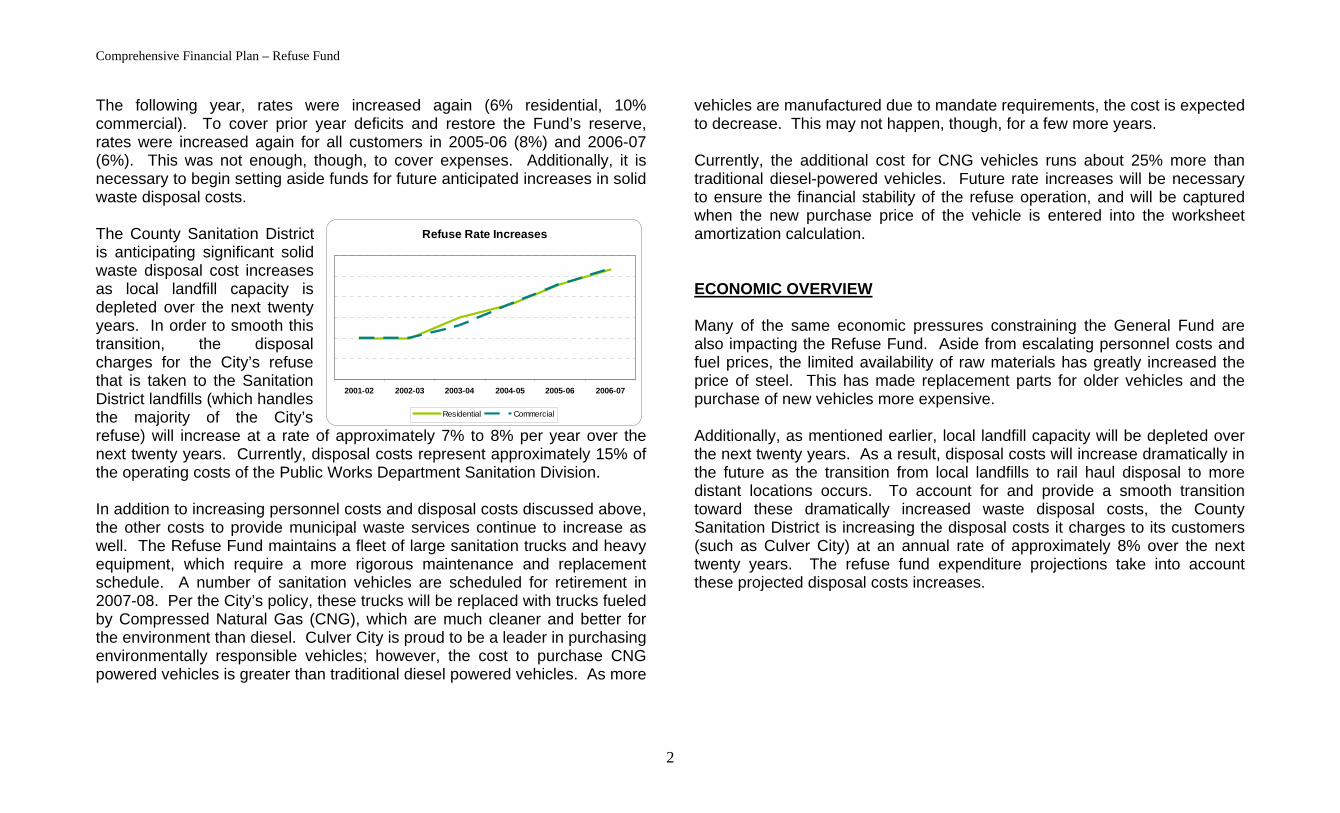
The following year, rates were increased again (6% residential, 10% commercial). To cover prior year deficits and restore the Fund’s reserve, rates were increased again for all customers in 2005-06 (8%) and 2006-07 (6%). This was not enough, though, to cover expenses. Additionally, it is necessary to begin setting aside funds for future anticipated increases in solid waste disposal costs.
Refuse Rate Increases
2001-02 2002-03 2003-04 2004-05 2005-06 2006-07
Residential Commercial
The County Sanitation District is anticipating significant solid waste disposal cost increases as local landfill capacity is depleted over the next twenty years. In order to smooth this transition, the disposal charges for the City’s refuse that is taken to the Sanitation District landfills (which handles the majority of the City’s refuse) will increase at a rate of approximately 7% to 8% per year over the next twenty years. Currently, disposal costs represent approximately 15% of the operating costs of the Public Works Department Sanitation Division. In addition to increasing personnel costs and disposal costs discussed above, the other costs to provide municipal waste services continue to increase as well. The Refuse Fund maintains a fleet of large sanitation trucks and heavy equipment, which require a more rigorous maintenance and replacement schedule. A number of sanitation vehicles are scheduled for retirement in 2007-08. Per the City’s policy, these trucks will be replaced with trucks fueled by Compressed Natural Gas (CNG), which are much cleaner and better for the environment than diesel. Culver City is proud to be a leader in purchasing environmentally responsible vehicles; however, the cost to purchase CNG powered vehicles is greater than traditional diesel powered vehicles. As more
vehicles are manufactured due to mandate requirements, the cost is expected to decrease. This may not happen, though, for a few more years. Currently, the additional cost for CNG vehicles runs about 25% more than traditional diesel-powered vehicles. Future rate increases will be necessary to ensure the financial stability of the refuse operation, and will be captured when the new purchase price of the vehicle is entered into the worksheet amortization calculation. ECONOMIC OVERVIEW Many of the same economic pressures constraining the General Fund are also impacting the Refuse Fund. Aside from escalating personnel costs and fuel prices, the limited availability of raw materials has greatly increased the price of steel. This has made replacement parts for older vehicles and the purchase of new vehicles more expensive. Additionally, as mentioned earlier, local landfill capacity will be depleted over the next twenty years. As a result, disposal costs will increase dramatically in the future as the transition from local landfills to rail haul disposal to more distant locations occurs. To account for and provide a smooth transition toward these dramatically increased waste disposal costs, the County Sanitation District is increasing the disposal costs it charges to its customers (such as Culver City) at an annual rate of approximately 8% over the next twenty years. The refuse fund expenditure projections take into account these projected disposal costs increases.
2
Comprehensive Financial Plan – Refuse Fund
PROJECTIONS AND ANALYSIS OF EXPENDITURES OVERVIEW An important focus of the Refuse Fund over the next few years has to be improving its overall fiscal health to eliminate the fund’s negative balance and develop a reserve. Additionally, the capital and operational needs of the Refuse fund that have been deferred over the last few years will have to be phased in on a priority basis as the revenue generated by fees for service allow. While increasing the fees is a necessity, we need to be cognizant of the effect it will have on Culver City residents and commercial businesses in the City. DISCUSSION OF REVENUE PROJECTIONS In order to restore the financial health of the Refuse Fund, commercial and residential waste removal fees will need to be increased over the next few years. The revenue projections assume that there will be an increase of approximately 10% per year for the next three fiscal years. If these revenue increases are realized and current expenditures stay within the anticipated growth forecast, then the Refuse Fund should have a positive fund balance by 2009-10. After 2009-10 the rate increases are planned to be lowered to 5% per fiscal year. This will be reviewed in the future to ensure that these increases are sufficient to keep pace with operating costs. It is quite likely rates may be needed to be kept at a 10% increase per year for longer than the projected three years to assist in generating revenue to cover proposed expanded operations and capital improvement needs for the Transfer Station to support on-going and expanded operations.
DISCUSSION OF EXPENDITURE PROJECTIONS Personnel expenditures are forecasted to increase 4.0% across the board, with the exception of medical premiums. Medical premiums are forecasted to increase 12.5% in fiscal 2007-08, with small adjustments downward in subsequent years. Operating and maintenance expenses are forecasted to grow 3.5% per year. The exception to this could be garage expenses and amortization charges to the Equipment Replacement Fund. Fuel prices have become a large issue for all Funds that utilize vehicles in their operations. These expenses are difficult to forecast, and for the purpose of this analysis have had the same 3.5% growth rate associated with them. A major challenge facing the Refuse Fund is identifying and receiving funding in order to cover needed upgrades and expansion of its operations. Anticipated upgrades and expanded services are discussed below:
• Commercial Routes require the addition of another Roll-off Driver and Truck as well as 10 bins. The increased demand for commercial roll-off service in the community makes this necessary. This will be implemented in 2007-08. An additional Roll-Off Truck and Laborer are required in 2010-11.
• Transfer Station through-put tonnage increase from a maximum of 500 tpd to 750 tpd and is scheduled for implementation in 2008-09. This will allow increased revenue generation through the transfer station and will require additional long hauling which is currently projected to be handled through contract. Also, an additional Heavy Equipment Operator will be required for expanded hours of operation at the Transfer Station. In 2014-15 the Transfer Station through-put will be further expanded from 750 tpd to 900 tpd. This will provide for further revenue generation through the Transfer Station and will require expanded contract operations, an additional loader, Heavy Equipment Operator, and Laborer.
3
Comprehensive Financial Plan – Refuse Fund
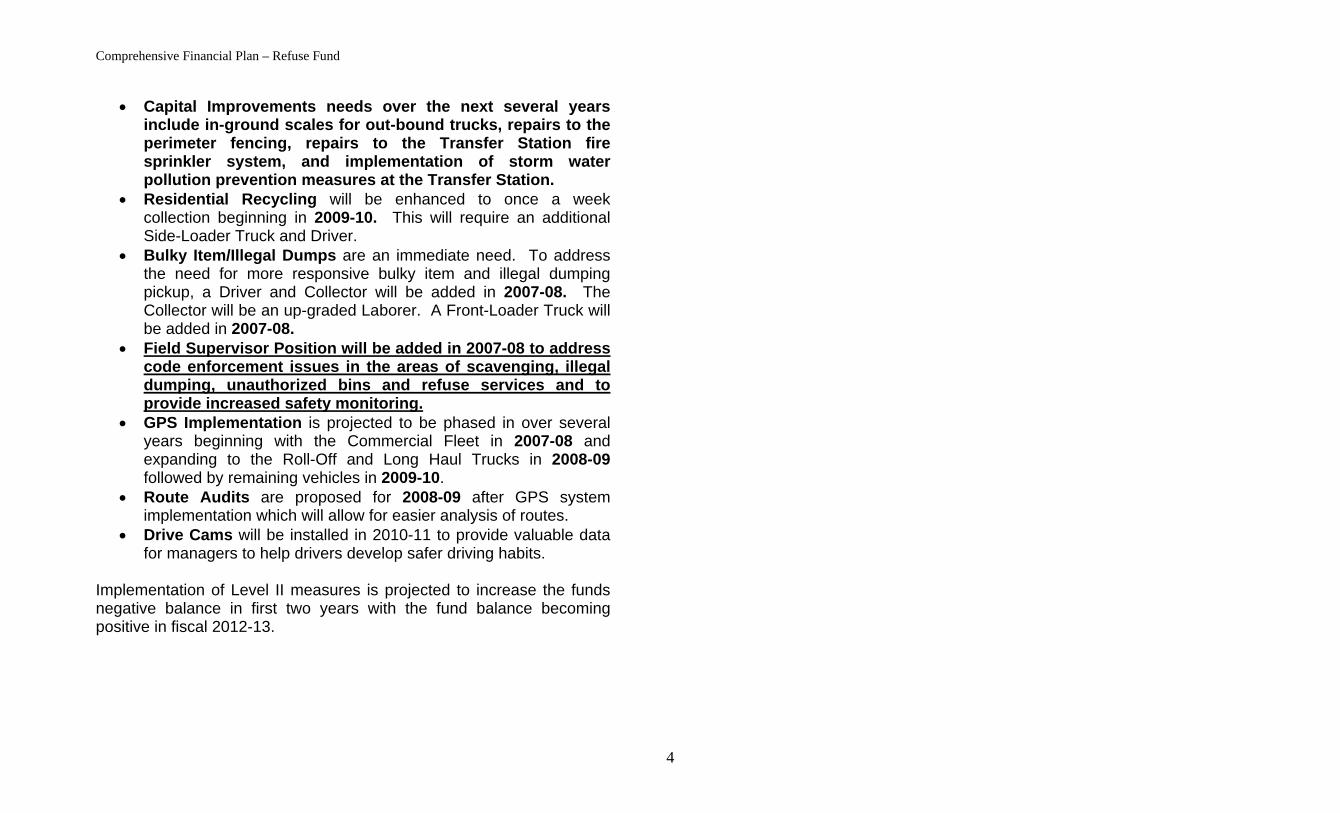
• Capital Improvements needs over the next several years include in-ground scales for out-bound trucks, repairs to the perimeter fencing, repairs to the Transfer Station fire sprinkler system, and implementation of storm water pollution prevention measures at the Transfer Station.
• Residential Recycling will be enhanced to once a week collection beginning in 2009-10. This will require an additional Side-Loader Truck and Driver.
• Bulky Item/Illegal Dumps are an immediate need. To address the need for more responsive bulky item and illegal dumping pickup, a Driver and Collector will be added in 2007-08. The Collector will be an up-graded Laborer. A Front-Loader Truck will be added in 2007-08.
• Field Supervisor Position will be added in 2007-08 to address code enforcement issues in the areas of scavenging, illegal dumping, unauthorized bins and refuse services and to provide increased safety monitoring.
• GPS Implementation is projected to be phased in over several years beginning with the Commercial Fleet in 2007-08 and expanding to the Roll-Off and Long Haul Trucks in 2008-09 followed by remaining vehicles in 2009-10.
• Route Audits are proposed for 2008-09 after GPS system implementation which will allow for easier analysis of routes.
• Drive Cams will be installed in 2010-11 to provide valuable data for managers to help drivers develop safer driving habits.
Implementation of Level II measures is projected to increase the funds negative balance in first two years with the fund balance becoming positive in fiscal 2012-13.
4
Description 2006-07 2007-08 2008-09 2009-10 2010-11 2011-12 2012-13 2013-14 2014-15 2015-16 2016-17
Culver City
February 22, 2007
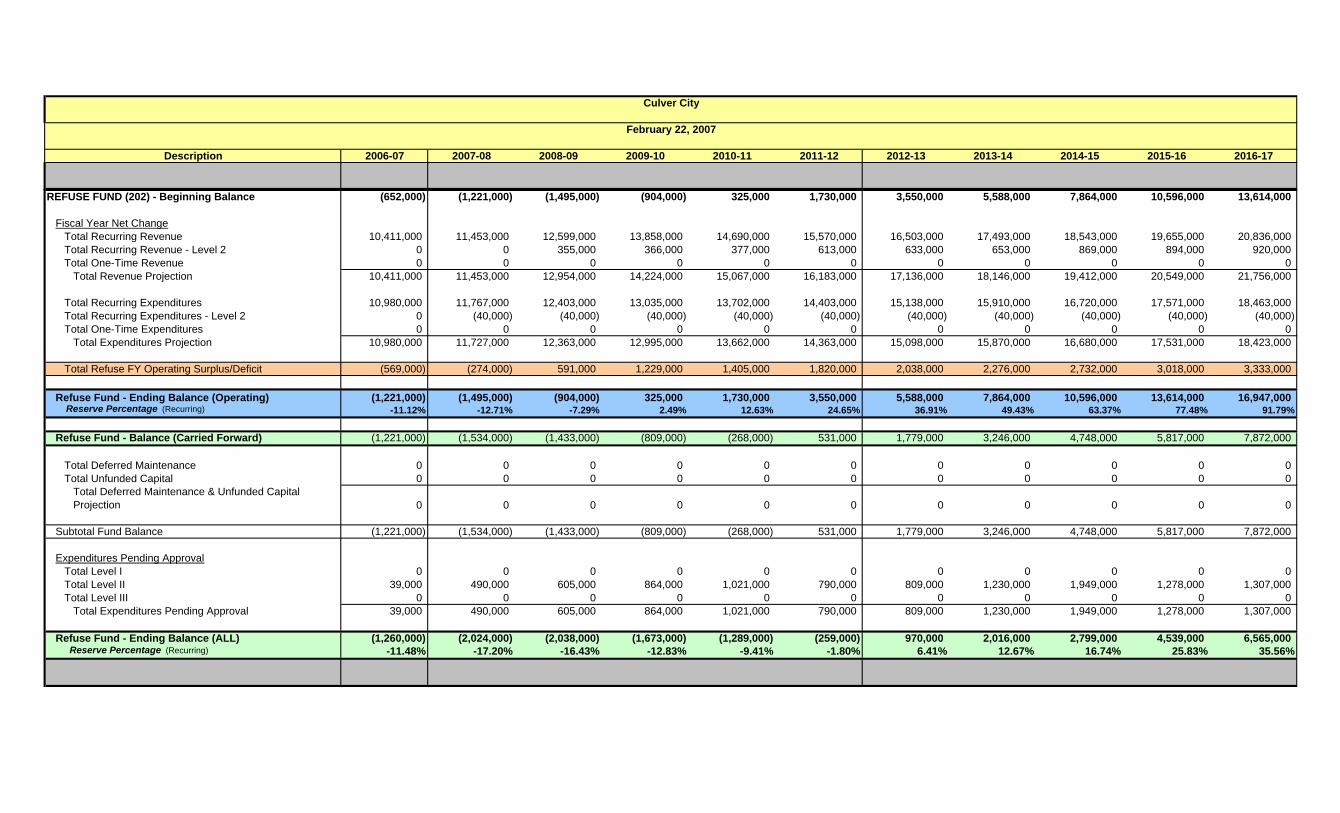
REFUSE FUND (202) - Beginning Balance (652,000) (1,221,000) (1,495,000) (904,000) 325,000 1,730,000 3,550,000 5,588,000 7,864,000 10,596,000 13,614,000
Fiscal Year Net ChangeTotal Recurring Revenue 10,411,000 11,453,000 12,599,000 13,858,000 14,690,000 15,570,000 16,503,000 17,493,000 18,543,000 19,655,000 20,836,000Total Recurring Revenue - Level 2 0 0 355,000 366,000 377,000 613,000 633,000 653,000 869,000 894,000 920,000Total One-Time Revenue 0 0 0 0 0 0 0 0 0 0 0
Total Revenue Projection 10,411,000 11,453,000 12,954,000 14,224,000 15,067,000 16,183,000 17,136,000 18,146,000 19,412,000 20,549,000 21,756,000
Total Recurring Expenditures 10,980,000 11,767,000 12,403,000 13,035,000 13,702,000 14,403,000 15,138,000 15,910,000 16,720,000 17,571,000 18,463,000Total Recurring Expenditures - Level 2 0 (40,000) (40,000) (40,000) (40,000) (40,000) (40,000) (40,000) (40,000) (40,000) (40,000)Total One-Time Expenditures 0 0 0 0 0 0 0 0 0 0 0
Total Expenditures Projection 10,980,000 11,727,000 12,363,000 12,995,000 13,662,000 14,363,000 15,098,000 15,870,000 16,680,000 17,531,000 18,423,000
Total Refuse FY Operating Surplus/Deficit (569,000) (274,000) 591,000 1,229,000 1,405,000 1,820,000 2,038,000 2,276,000 2,732,000 3,018,000 3,333,000
Refuse Fund - Ending Balance (Operating) (1,221,000) (1,495,000) (904,000) 325,000 1,730,000 3,550,000 5,588,000 7,864,000 10,596,000 13,614,000 16,947,000 Reserve Percentage (Recurring) -11.12% -12.71% -7.29% 2.49% 12.63% 24.65% 36.91% 49.43% 63.37% 77.48% 91.79%
Refuse Fund - Balance (Carried Forward) (1,221,000) (1,534,000) (1,433,000) (809,000) (268,000) 531,000 1,779,000 3,246,000 4,748,000 5,817,000 7,872,000
Total Deferred Maintenance 0 0 0 0 0 0 0 0 0 0 0Total Unfunded Capital 0 0 0 0 0 0 0 0 0 0 0
Total Deferred Maintenance & Unfunded Capital Projection 0 0 0 0 0 0 0 0 0 0 0
Subtotal Fund Balance (1,221,000) (1,534,000) (1,433,000) (809,000) (268,000) 531,000 1,779,000 3,246,000 4,748,000 5,817,000 7,872,000
Expenditures Pending ApprovalTotal Level I 0 0 0 0 0 0 0 0 0 0 0Total Level II 39,000 490,000 605,000 864,000 1,021,000 790,000 809,000 1,230,000 1,949,000 1,278,000 1,307,000Total Level III 0 0 0 0 0 0 0 0 0 0 0
Total Expenditures Pending Approval 39,000 490,000 605,000 864,000 1,021,000 790,000 809,000 1,230,000 1,949,000 1,278,000 1,307,000
Refuse Fund - Ending Balance (ALL) (1,260,000) (2,024,000) (2,038,000) (1,673,000) (1,289,000) (259,000) 970,000 2,016,000 2,799,000 4,539,000 6,565,000 Reserve Percentage (Recurring) -11.48% -17.20% -16.43% -12.83% -9.41% -1.80% 6.41% 12.67% 16.74% 25.83% 35.56%
Comprehensive Financial Plan – Transit Fund
CITY OF CULVER CITY
COMPREHENSIVE FINANCIAL STRATEGY for the
Transit Fund INTRODUCTION The Transit Fund is an Enterprise Fund that was established to provide efficient and effective public transportation services and high quality, low cost equipment maintenance services to the City of Culver City. The Culver City Municipal Bus Line, aka Culver CityBus, provides public transit services on seven regular routes throughout Culver City and the surrounding area and services a number of major employment, health, commercial, educational, and recreational centers in the area. The Transportation Department is responsible for providing administration and oversight of Transit Fund operations. The Transportation Department also oversees the City’s regional transportation planning activities and administers both the Equipment Replacement Fund and the activities of the Equipment Maintenance Division, which is responsible for equipment and vehicle maintenance. A more in-depth discussion of the Equipment Replacement Fund is included in the Equipment Replacement Fund section of this report. As an Enterprise Fund, the Transit Fund charges customers for the provision of services via bus fares. However, the majority of the Fund’s revenues are derived from other funding sources, including grants and appropriations from the state and federal governments.
Operating expenses include the cost of providing service, administrative expenses, and acquiring, replacing, and maintaining capital assets (e.g. maintaining and replacing the Bus Fleet). Since the Transit Fund is highly subsidized by other governmental agencies, their ability to increase or decrease bus fares to raise revenue is highly restricted. Currently, Transportation Department staff is working with regional transportation agencies to discuss a change in the formula for calculating bus fares. BACKGROUND Culver CityBus is the second oldest municipally-owned bus line in the state of California, with over 75 years of tradition and experience behind our service. Culver CityBus was organized in 1928 by the late Mayor Reve E. Houck, with the aid of the City Council, after a dispute with the Pacific Electric Railway over rising fares. Service was initiated on March 4, 1928 when Mayor Houck drove a bus from Washington and Rimpau Boulevards to Venice to inaugurate municipal bus service. Today, Culver CityBus proudly serves the Westside communities of Blair Hills, Century City, Culver City, Mar Vista, Marina del Rey, Palms, Venice, Venice Beach, West Los Angeles, Westchester, and Westwood. Culver CityBus is a nationally recognized operation whose fleet was recently ranked seventh of approximately five hundred North American programs in the national trade magazine, Fleet Equipment magazine. Culver CityBus is also a nationally recognized leader in transportation technology (Smart Bus) and environmental friendliness with most of the current fleet being fueled by compressed natural gas (CNG).
1

Comprehensive Financial Plan – Transit Fund
0
5,000
10,000
15,000
20,000T ho usand s
2001-02 2002-03 2003-04 2004-05 2005-06
Transit Fund Revenues and Expenditures
Revenues Expenditures
Currently, the Transit Fund has a healthy reserve and generally collects sufficient revenues to cover annual operational costs. However, the Transit Fund is highly subsidized with funds from other agencies, mostly county, state, and federal. In fact, approximately eighty percent (80%) of the Fund’s revenues are from outside agencies. The major sources of the Transit Fund are the Federal Transportation Administration (FTA), State Transit Grants, and Proposition A & C money (see Prop A & C section of this report for more information).
Consequently, depending on those agency’s priorities, funding may be highly variable from year to year. Unlike the Refuse and Sewer Enterprise Funds, the Transit Fund currently does not have the flexibility to increase fares to cover increased expenditures. $0
$2,000$4,000$6,000$8,000
$10,000$12,000$14,000$16,000$18,000
Thousands
2001-02 2002-03 2003-04 2004-05 2005-06
Transit Fund Revenue Sources
Non Operating
From Other Agencies
Passenger Fares
Nevertheless, public transportation and traffic and congestion relief have been one of California’s top priorities over the last decade. The Transit Fund’s current financial position should allow it to continue to provide a high level of service to the Westside communities for years to come.
ECONOMIC OVERVIEW With the population explosion in California over the last 10 – 15 years, dealing with the related increase in traffic and congestion has become one of the biggest challenges faced by Californians. As such, voters have approved a few funding sources that are specifically dedicated to funding transportation projects and public transportation operations. Propositions A & C are both sales taxes that have been approved by Los Angeles County voters. Since these funding sources are sales taxes, they are economically sensitive (see the Prop A & C section of this report for more information); however, they are much more stable than the alternative of relying on an annual appropriation from the state legislature. In addition to Prop A & C, there are a number of state and federal grants programs that are used for transit operations. These funds are allocated annually and are subject to the existing political and economic climate. With an increasing number of federal dollars being diverted towards homeland security and the war in Iraq, the amount of funds available for transportation related projects and programs may begin to shrink in the near future. PROJECTIONS AND ANALYSIS OF REVENUES AND EXPENDITURES OVERVIEW The Transit Fund is facing similar fiscal issues as the General Fund. Due to the ever-changing variables associated with these issues, it is difficult to realistically foresee more than two or three years into the future for certain funding sources, and even less in some cases. As was mentioned previously, the Transit Fund currently has a healthy reserve and would be able to stave off any unforeseen expenses that may occur in the very near future. Since the Transit Fund is heavily dependant on outside funding sources, it is imperative that it maintains sound oversight of its spending.
2
Comprehensive Financial Plan – Transit Fund
DISCUSSION OF REVENUE PROJECTIONS Assumptions that were made in this analysis after fiscal 2007 include a 3.8% to 4.0% growth in local revenues, and a modest 3.0% growth in fare box revenues. Currently, fare box prices cannot be increased without the reduction or loss of funding from the Metropolitan Transit Authority (MTA). State Transit Assistance (STA) spillover funds ($961,000 in fiscal 2007-08) will be eliminated after fiscal 2008-09. These funds were used for one-time expenditures and not for any ongoing expenses. There is uncertainty as to whether Municipal Operator Services Improvement Program (MOSIP) funds will continue to be funded after fiscal 2006-07 which may amount to the loss of revenue of approximately $800,000 annually. The Transit Fund is anticipating a little over $200,000 in funds relating to new bus services to Playa Vista from 2008-2018. These funds are anticipated to be ongoing at a growth rate of 3.0% per fiscal year, and will assist in covering ongoing expenditures. Infrastructure Bond 1B Funds are expected to be allocated during Fiscal 2008 through 2012. These bond monies will assist in funding capital projects and one-time expenditures. Anticipated funding will be $2.1 million per fiscal year. With the estimated forecast of revenues over the next few fiscal years, it was also taken into consideration that the Formula Allocation Procedure employed by the MTA to distribute local and state transit funding will not change during this time. Each year, though, that the MTA has rising costs and insufficient funds to cover them, new formulas are devised to redistribute funding amongst the surrounding transit agencies. Needless to say, when this happens the Transit Fund has to adjust its expenditure and revenue assumptions accordingly.
Most of the revenues received from other agencies are projected to remain growing at a fairly constant rate. However, it should be noted that some of those funds can be subject to change in the amount or eligibility at the will of those agencies. DISCUSSION OF EXPENDITURE PROJECTIONS To the extent possible, recurring operating expenditures are covered with recurring revenues. Personnel costs are estimated to grow 4.0% per current MOU negotiations, with medical premiums growing at 12.5% in fiscal 2007-08, and slightly less in subsequent years. Ongoing operating and maintenance costs are estimated to grow at approximately 3.5%. STA Funds can be used for operating expenses, and continued receipt of these funds is subject to an annual test based on expense growth versus the Consumer Price Index (CPI). Fortunately, the Transit Fund has been able to continue to receive these funds and expect to receive them in the future. (These STA Funds do not include the spillover amount that will be discontinued after 2008-09.) The Transit Fund currently reimburses the General Fund for administrative charges, which increases between 3% - 4% per year primarily due to personnel cost increases. The administrative charges, or indirect costs, are determined through the Cost Allocation Plan prepared each year, which meets the compliance of Federal and State grants reimbursement guidelines. The Cost Allocation Plan allocates costs of services and programs to using Departments and Enterprise Funds based on the level of services received. Some of these services include payroll processing, information technology, financial, and communications services.
3
Description 2006-07 2007-08 2008-09 2009-10 2010-11 2011-12 2012-13 2013-14 2014-15 2015-16 2016-17
Culver City
February 22, 2007
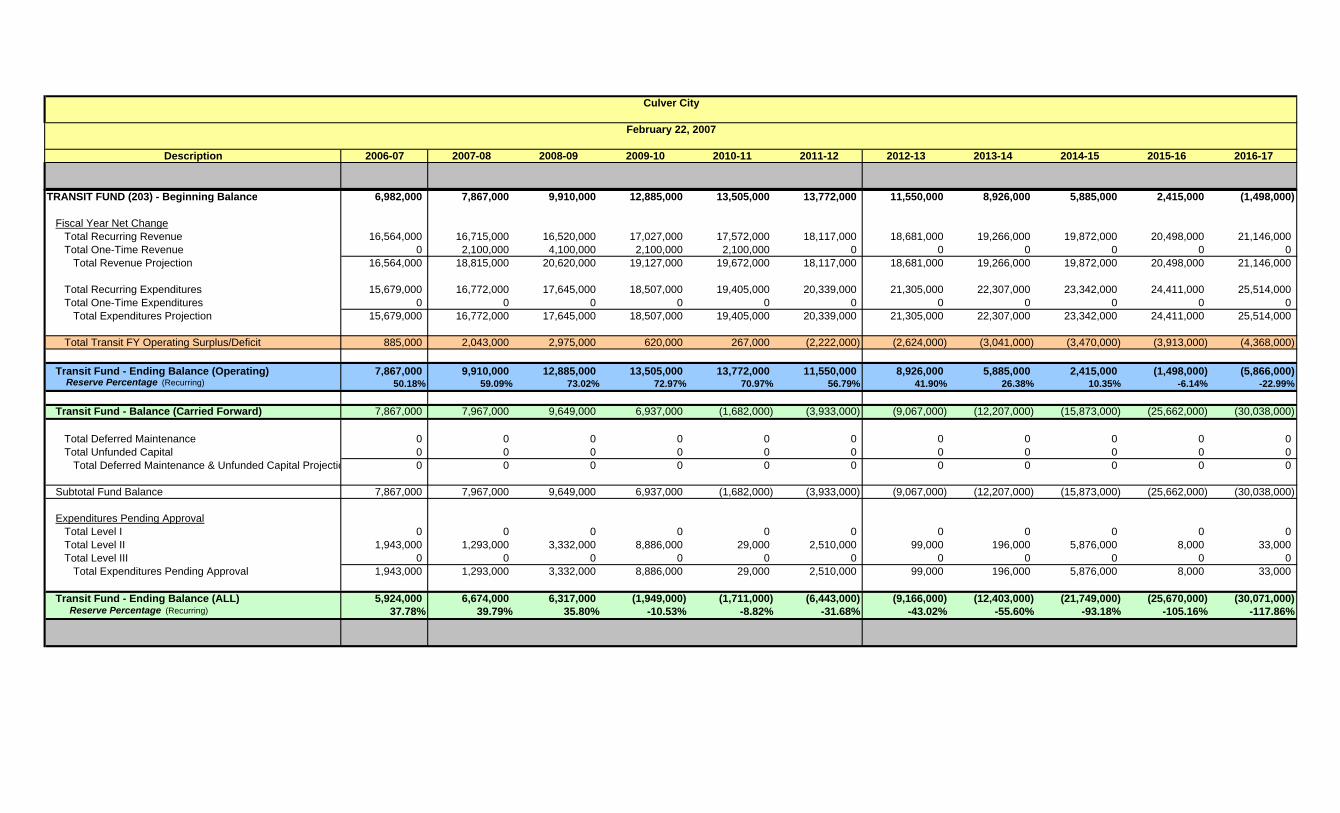
TRANSIT FUND (203) - Beginning Balance 6,982,000 7,867,000 9,910,000 12,885,000 13,505,000 13,772,000 11,550,000 8,926,000 5,885,000 2,415,000 (1,498,000)
Fiscal Year Net ChangeTotal Recurring Revenue 16,564,000 16,715,000 16,520,000 17,027,000 17,572,000 18,117,000 18,681,000 19,266,000 19,872,000 20,498,000 21,146,000Total One-Time Revenue 0 2,100,000 4,100,000 2,100,000 2,100,000 0 0 0 0 0 0
Total Revenue Projection 16,564,000 18,815,000 20,620,000 19,127,000 19,672,000 18,117,000 18,681,000 19,266,000 19,872,000 20,498,000 21,146,000
Total Recurring Expenditures 15,679,000 16,772,000 17,645,000 18,507,000 19,405,000 20,339,000 21,305,000 22,307,000 23,342,000 24,411,000 25,514,000Total One-Time Expenditures 0 0 0 0 0 0 0 0 0 0 0
Total Expenditures Projection 15,679,000 16,772,000 17,645,000 18,507,000 19,405,000 20,339,000 21,305,000 22,307,000 23,342,000 24,411,000 25,514,000
Total Transit FY Operating Surplus/Deficit 885,000 2,043,000 2,975,000 620,000 267,000 (2,222,000) (2,624,000) (3,041,000) (3,470,000) (3,913,000) (4,368,000)
Transit Fund - Ending Balance (Operating) 7,867,000 9,910,000 12,885,000 13,505,000 13,772,000 11,550,000 8,926,000 5,885,000 2,415,000 (1,498,000) (5,866,000) Reserve Percentage (Recurring) 50.18% 59.09% 73.02% 72.97% 70.97% 56.79% 41.90% 26.38% 10.35% -6.14% -22.99%
Transit Fund - Balance (Carried Forward) 7,867,000 7,967,000 9,649,000 6,937,000 (1,682,000) (3,933,000) (9,067,000) (12,207,000) (15,873,000) (25,662,000) (30,038,000)
Total Deferred Maintenance 0 0 0 0 0 0 0 0 0 0 0Total Unfunded Capital 0 0 0 0 0 0 0 0 0 0 0
Total Deferred Maintenance & Unfunded Capital Projectio 0 0 0 0 0 0 0 0 0 0 0
Subtotal Fund Balance 7,867,000 7,967,000 9,649,000 6,937,000 (1,682,000) (3,933,000) (9,067,000) (12,207,000) (15,873,000) (25,662,000) (30,038,000)
Expenditures Pending ApprovalTotal Level I 0 0 0 0 0 0 0 0 0 0 0Total Level II 1,943,000 1,293,000 3,332,000 8,886,000 29,000 2,510,000 99,000 196,000 5,876,000 8,000 33,000Total Level III 0 0 0 0 0 0 0 0 0 0 0
Total Expenditures Pending Approval 1,943,000 1,293,000 3,332,000 8,886,000 29,000 2,510,000 99,000 196,000 5,876,000 8,000 33,000
Transit Fund - Ending Balance (ALL) 5,924,000 6,674,000 6,317,000 (1,949,000) (1,711,000) (6,443,000) (9,166,000) (12,403,000) (21,749,000) (25,670,000) (30,071,000) Reserve Percentage (Recurring) 37.78% 39.79% 35.80% -10.53% -8.82% -31.68% -43.02% -55.60% -93.18% -105.16% -117.86%
Comprehensive Financial Plan – Sewer Fund
CITY OF CULVER CITY
COMPREHENSIVE FINANCIAL STRATEGY for the
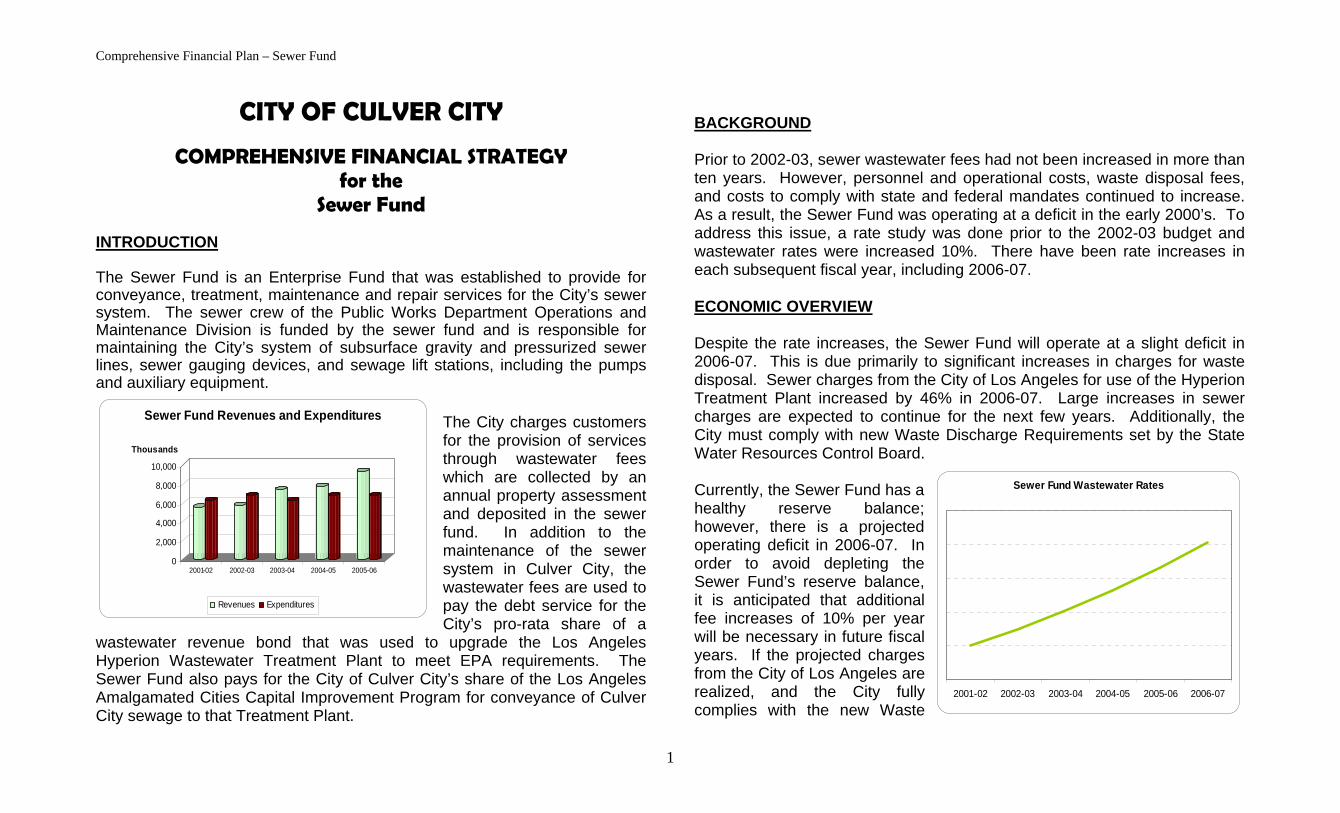
Sewer Fund INTRODUCTION The Sewer Fund is an Enterprise Fund that was established to provide for conveyance, treatment, maintenance and repair services for the City’s sewer system. The sewer crew of the Public Works Department Operations and Maintenance Division is funded by the sewer fund and is responsible for maintaining the City’s system of subsurface gravity and pressurized sewer lines, sewer gauging devices, and sewage lift stations, including the pumps and auxiliary equipment.
0
2,000
4,000
6,000
8,000
10,000
Thousands
2001-02 2002-03 2003-04 2004-05 2005-06
Sewer Fund Revenues and Expenditures
Revenues Expenditures
The City charges customers for the provision of services through wastewater fees which are collected by an annual property assessment and deposited in the sewer fund. In addition to the maintenance of the sewer system in Culver City, the wastewater fees are used to pay the debt service for the City’s pro-rata share of a
wastewater revenue bond that was used to upgrade the Los Angeles Hyperion Wastewater Treatment Plant to meet EPA requirements. The Sewer Fund also pays for the City of Culver City’s share of the Los Angeles Amalgamated Cities Capital Improvement Program for conveyance of Culver City sewage to that Treatment Plant.
BACKGROUND Prior to 2002-03, sewer wastewater fees had not been increased in more than ten years. However, personnel and operational costs, waste disposal fees, and costs to comply with state and federal mandates continued to increase. As a result, the Sewer Fund was operating at a deficit in the early 2000’s. To address this issue, a rate study was done prior to the 2002-03 budget and wastewater rates were increased 10%. There have been rate increases in each subsequent fiscal year, including 2006-07. ECONOMIC OVERVIEW Despite the rate increases, the Sewer Fund will operate at a slight deficit in 2006-07. This is due primarily to significant increases in charges for waste disposal. Sewer charges from the City of Los Angeles for use of the Hyperion Treatment Plant increased by 46% in 2006-07. Large increases in sewer charges are expected to continue for the next few years. Additionally, the City must comply with new Waste Discharge Requirements set by the State Water Resources Control Board.
Sewer Fund Wastewater Rates
2001-02 2002-03 2003-04 2004-05 2005-06 2006-07
Currently, the Sewer Fund has a healthy reserve balance; however, there is a projected operating deficit in 2006-07. In order to avoid depleting the Sewer Fund’s reserve balance, it is anticipated that additional fee increases of 10% per year will be necessary in future fiscal years. If the projected charges from the City of Los Angeles are realized, and the City fully complies with the new Waste
1
Comprehensive Financial Plan – Sewer Fund
Discharge Requirements, future deficits in the Sewer Fund may be unavoidable without a significant increase in wastewater fees. PROJECTIONS AND ANALYSIS OF EXPENDITURES OVERVIEW The Sewer Fund maintains an extremely healthy fund balance due to Wastewater Facility Bonds that were issued in 1992. These funds were used to fund the City’s share of improvements to the Hyperion Wastewater treatment plant and to fund a local sewer replacement program. DISCUSSION OF REVENUE PROJECTIONS Revenue projections for the Sewer Fund are held at a steady 10% rate of growth. This is consistent with past history, and places a steady increase in fees on users per year rather than hitting them with larger increases every few years. This increase is enough to cover ongoing operating and maintenance increases, but will not be sufficient to cover ongoing sewer capital projects. The current fund balance, of which the majority is from the Wastewater Facility Bonds, has been used to cover capital costs relating to sewer projects. If the anticipated projects are completed, this funding will be exhausted in 2011-12. The main jump in cost indicated on the worksheet is the possible application cost (estimated at $25 million and spread over five years) and other costs to join the LA County Sanitation District. In exploring this option, the City is looking at the possibility of future savings by removing itself from the Amalgamated Cities Agreement with Los Angeles. Membership in the LA County Sanitation District would also provide the City with representation that it currently lacks under the Amalgamated Cities agreement. This idea is still in the conception phase. Staff is currently studying this option and more specific cost information will be available in the future. It was placed in the Level II Expenditures section as a place marker.
If this item were taken out of the worksheet, funding would be available for a several more years to fund sewer capital projects. DISCUSSION OF EXPENDITURE PROJECTIONS Personnel costs are estimated to increase 4.0% per year, with medical insurance premiums to increase at a higher rate of 12.5% in fiscal 2007-08, with slight percentage adjustments downward in subsequent years. General operating and maintenance costs are anticipated to grow 3.5%. As mentioned previously, charges for the City’s portion of the Hyperion Wastewater Treatment Plant are increased each year according to the capital improvement needs identified by the City of Los Angeles. While it is anticipated that these increases will continue, it is difficult to determine by how much as the increases have not been consistent from year to year and longer term projections provided by the City of Los Angeles have not been reliable Locally, sewer Capital projects are planned and budgeted for each fiscal year at a normal level of between $1.875 and $2 million per year. While there are unexpected sewer projects that occur, most are planned in concurrence with street work occurring in the City. All feasible options are taken into consideration to reduce disruption to residents while work is occurring. The Sewer Fund currently reimburses the General Fund for administrative charges, which increase between 3% - 4% per year primarily due to personnel cost increases. The administrative charges, or indirect costs, are determined through the Cost Allocation Plan prepared each year. The Cost Allocation Plan allocates costs of services and programs to using Departments and Enterprise Funds based on the level of services received. Some of these services include payroll processing, information technology, financial, and communications services.
2
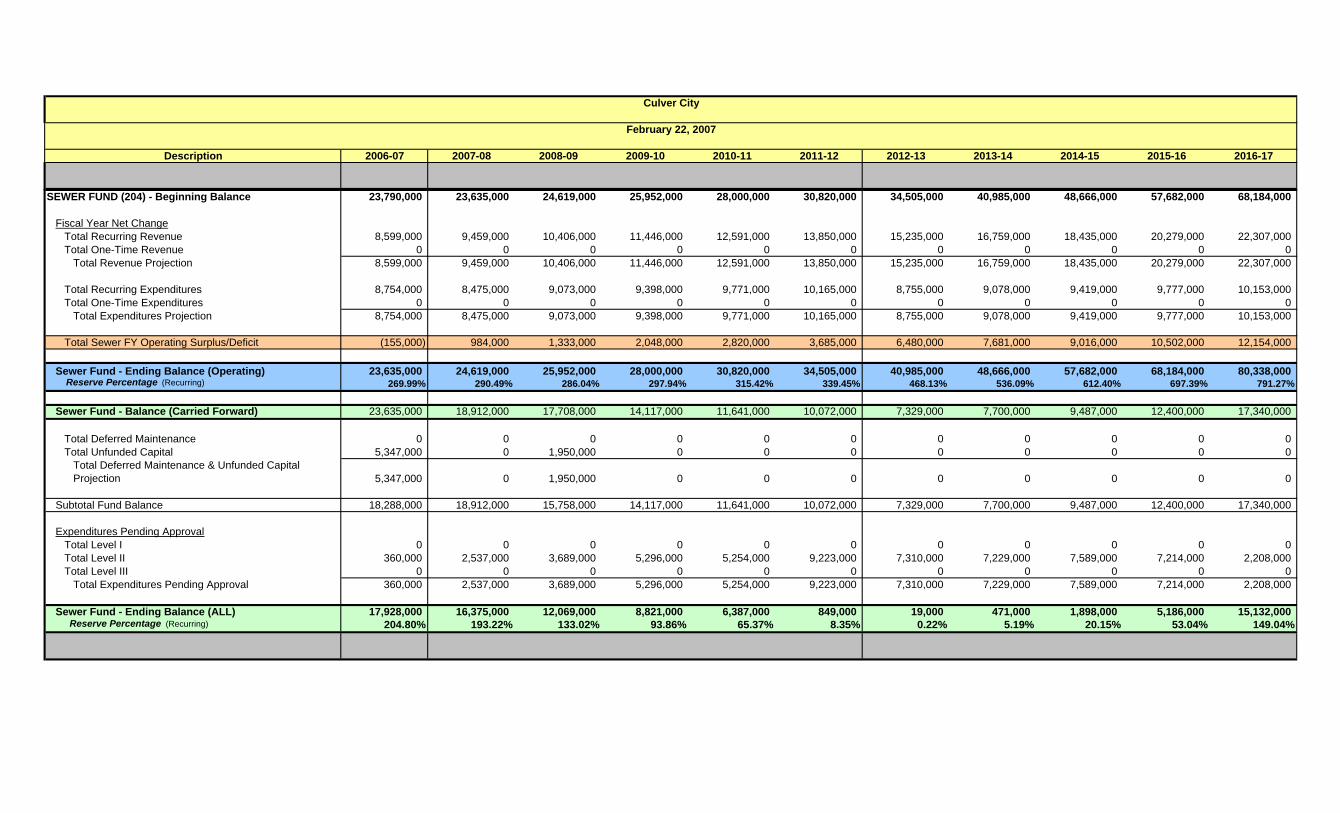
Description 2006-07 2007-08 2008-09 2009-10 2010-11 2011-12 2012-13 2013-14 2014-15 2015-16 2016-17
Culver City
February 22, 2007
SEWER FUND (204) - Beginning Balance 23,790,000 23,635,000 24,619,000 25,952,000 28,000,000 30,820,000 34,505,000 40,985,000 48,666,000 57,682,000 68,184,000
Fiscal Year Net ChangeTotal Recurring Revenue 8,599,000 9,459,000 10,406,000 11,446,000 12,591,000 13,850,000 15,235,000 16,759,000 18,435,000 20,279,000 22,307,000Total One-Time Revenue 0 0 0 0 0 0 0 0 0 0 0
Total Revenue Projection 8,599,000 9,459,000 10,406,000 11,446,000 12,591,000 13,850,000 15,235,000 16,759,000 18,435,000 20,279,000 22,307,000
Total Recurring Expenditures 8,754,000 8,475,000 9,073,000 9,398,000 9,771,000 10,165,000 8,755,000 9,078,000 9,419,000 9,777,000 10,153,000Total One-Time Expenditures 0 0 0 0 0 0 0 0 0 0 0
Total Expenditures Projection 8,754,000 8,475,000 9,073,000 9,398,000 9,771,000 10,165,000 8,755,000 9,078,000 9,419,000 9,777,000 10,153,000
Total Sewer FY Operating Surplus/Deficit (155,000) 984,000 1,333,000 2,048,000 2,820,000 3,685,000 6,480,000 7,681,000 9,016,000 10,502,000 12,154,000
Sewer Fund - Ending Balance (Operating) 23,635,000 24,619,000 25,952,000 28,000,000 30,820,000 34,505,000 40,985,000 48,666,000 57,682,000 68,184,000 80,338,000 Reserve Percentage (Recurring) 269.99% 290.49% 286.04% 297.94% 315.42% 339.45% 468.13% 536.09% 612.40% 697.39% 791.27%
Sewer Fund - Balance (Carried Forward) 23,635,000 18,912,000 17,708,000 14,117,000 11,641,000 10,072,000 7,329,000 7,700,000 9,487,000 12,400,000 17,340,000
Total Deferred Maintenance 0 0 0 0 0 0 0 0 0 0 0Total Unfunded Capital 5,347,000 0 1,950,000 0 0 0 0 0 0 0 0
Total Deferred Maintenance & Unfunded Capital Projection 5,347,000 0 1,950,000 0 0 0 0 0 0 0 0
Subtotal Fund Balance 18,288,000 18,912,000 15,758,000 14,117,000 11,641,000 10,072,000 7,329,000 7,700,000 9,487,000 12,400,000 17,340,000
Expenditures Pending ApprovalTotal Level I 0 0 0 0 0 0 0 0 0 0 0Total Level II 360,000 2,537,000 3,689,000 5,296,000 5,254,000 9,223,000 7,310,000 7,229,000 7,589,000 7,214,000 2,208,000Total Level III 0 0 0 0 0 0 0 0 0 0 0
Total Expenditures Pending Approval 360,000 2,537,000 3,689,000 5,296,000 5,254,000 9,223,000 7,310,000 7,229,000 7,589,000 7,214,000 2,208,000
Sewer Fund - Ending Balance (ALL) 17,928,000 16,375,000 12,069,000 8,821,000 6,387,000 849,000 19,000 471,000 1,898,000 5,186,000 15,132,000 Reserve Percentage (Recurring) 204.80% 193.22% 133.02% 93.86% 65.37% 8.35% 0.22% 5.19% 20.15% 53.04% 149.04%
CITY OF CULVER CITY
COMPREHENSIVE FINANCIAL STRATEGY for the
Equipment Replacement Fund INTRODUCTION The Equipment Replacement Fund (ERF) was established as a mechanism to ensure adequate funding for the replacement of the City’s fleet of vehicles. The fund is overseen by the Equipment Maintenance and Fleet Services Division (EMFS) and City Controller’s Office. BACKGROUND The Equipment Maintenance and Fleet Services Division of the Transportation Department retains ownership, and has primary responsibility (“cradle to grave”), of all City equipment and vehicle assets. They also assist in overseeing the Equipment Replacement Fund (ERF) working closely together with the City Controller’s Office. The Division works in conjunction with Purchasing when removing vehicles and equipment from permanent service in the disposal process. Usual methods for disposal are through auctions whereby the City can better use its resources in allowing an auction company to have the responsibility of shipping and selling the City’s old vehicles and equipment. The City obtains funds for the future replacement of vehicles and equipment through periodic rental rate charges (amortization) to the using departments and/or divisions over the expected life cycle of each unit. The City Treasurer
invests the funds and credits interest or dividend earnings into the fund. The City Treasurer also places the residual (disposal) value of the assets back into the fund after the sale is finalized. The ERF is self-supporting and is the main vehicle for budgeting and providing adequate funding for all vehicles and equipment for the City. The Equipment Maintenance Division establishes useful life (life cycles) for all types of vehicles and equipment that are incorporated into the technical amortization schedule managed by staff in the City Controller’s Office. This amortization schedule guides departments in their annual cost for purchase-ownership and replacement costs for vehicles and equipment at the termination of the life cycle. This also becomes the fiscal budget for all City vehicle assets, except for vehicles in the Transportation Department (i.e. buses). Using departments justify and budget for the initial procurement of all capital assets. When the City receives new equipment, the Equipment Maintenance Division and the City Controller’s Office add the vehicles and equipment into the main asset inventory systems (fleet management and accounting systems), establishes an estimated useful life, calculates the future replacement costs, that includes adjustments for CPI and inflation, then establishes the amortization schedule for the new piece of equipment. The Equipment Maintenance Division will communicate on an annual basis with all City Departments those vehicles and equipment that are eligible for replacement. This is based on the termination of life cycles, which then enables those vehicles and equipment to become replacement candidates. Life cycle analysis is the benchmark for replacing equipment. Each year during budget preparation, the Equipment Maintenance Division evaluates the vehicles and equipment that are eligible, or requested to be replaced. During this period, departments are required to submit their requests to replace or change their vehicles/equipment. Once the technical evaluations have been
1
completed, the Division then assembles a recommendation for replacement including any new estimated purchase costs. Because a particular piece of equipment is eligible for replacement (based on its useful life and amortization cycles), does not automatically guarantee the replacement. Many other factors go into the evaluation process to make certain the equipment is no longer feasible to retain, or is otherwise unusable in its originally designed capacity relative to the division’s mission. Age, mileage, repair history, current condition, forecasted repair costs, depreciation and market value are included in the evaluation process. After the vehicle evaluations have been completed, the Equipment Maintenance Division meets and discusses the eligible equipment with the affected departments to:
Review the list of equipment candidates Decide further whether to replace or retain the recommended
vehicles and equipment. Aid the departments with a budget forecast Discuss necessary operational equipment needs
The Transportation Department, through the Equipment Maintenance Division, has established a City Council ERF Sub-Committee to inform the City Council of the ERF process and those equipment and vehicles eligible for replacement. A meeting is held each year during the budget preparation process with our ERF Sub-Committee and all departments that have vehicles for replacement to review the list of candidates, evaluate the recommendations, discuss any issues about the process or equipment, and approve the recommendations. ECONOMIC OVERVIEW In fiscal 2005-06, $1 million was “loaned” from the Equipment Replacement Fund to the Self-Insurance Fund to help cover a shortfall and assist in
establishing a fund balance in this Fund. Once the Self-Insurance Fund is able to maintain a stable fund balance, this funding will be repaid to the Equipment Replacement Fund. PROJECTIONS AND ANALYSIS OF EXPENDITURES OVERVIEW The Equipment Replacement Fund has continued to maintain a healthy fund balance for several years. This is mainly attributable to close oversight by the Equipment Maintenance Division and the City Controller’s Office. The strategy already in place for this Fund will continue to be administered. The Ten (10) Year Forecast shows a continued healthy operation and is not recommended to be changed. DISCUSSION OF REVENUE PROJECTIONS The revenue projections for this fund are increased using a 3.5% inflation rate growth factor for forecasting purposes. Once the actual replacement cost of a vehicle is determined, this amount is entered into the spreadsheet. Until this time, an estimated budgeted amount is used for calculation purposes. Yearly contribution amounts are calculated based on this estimated future year replacement cost. Often vehicle replacement costs are less than the budgeted amount, thus enabling the fund to cover unanticipated or emergency replacements when authorized. This was the case with the early replacement purchase of three (3) Fire Engines, which were recently delivered to the City and will be placed in service soon.
2
DISCUSSION OF EXPENDITURE PROJECTIONS Each vehicle is entered into the amortization spreadsheet with the actual cost of the vehicle and estimated useful life. A formula is then calculated that gives the estimated replacement cost based in part on a 3.5% inflation growth rate per year. Once a vehicle has reached its useful life and is not recommended for replacement, only the 3.5% inflation rate is charged to the using Division. The amounts currently showing on the Ten (10) Year Forecast for Expenditures is based on anticipated replacements in upcoming fiscal years. There are several Refuse vehicles that are anticipated for replacement in 2007-08, and the Refuse Division and the Equipment Maintenance and Fleet Services Division will evaluate these vehicles to see if replacements are indeed necessary in 2007-08. There are also several vehicles that have been carried from prior years that were not recommended for replacement in those years. As can be seen from the main worksheet for this fund, there is ample funding to cover purchases in fiscal 2007-08 and subsequent years.
3
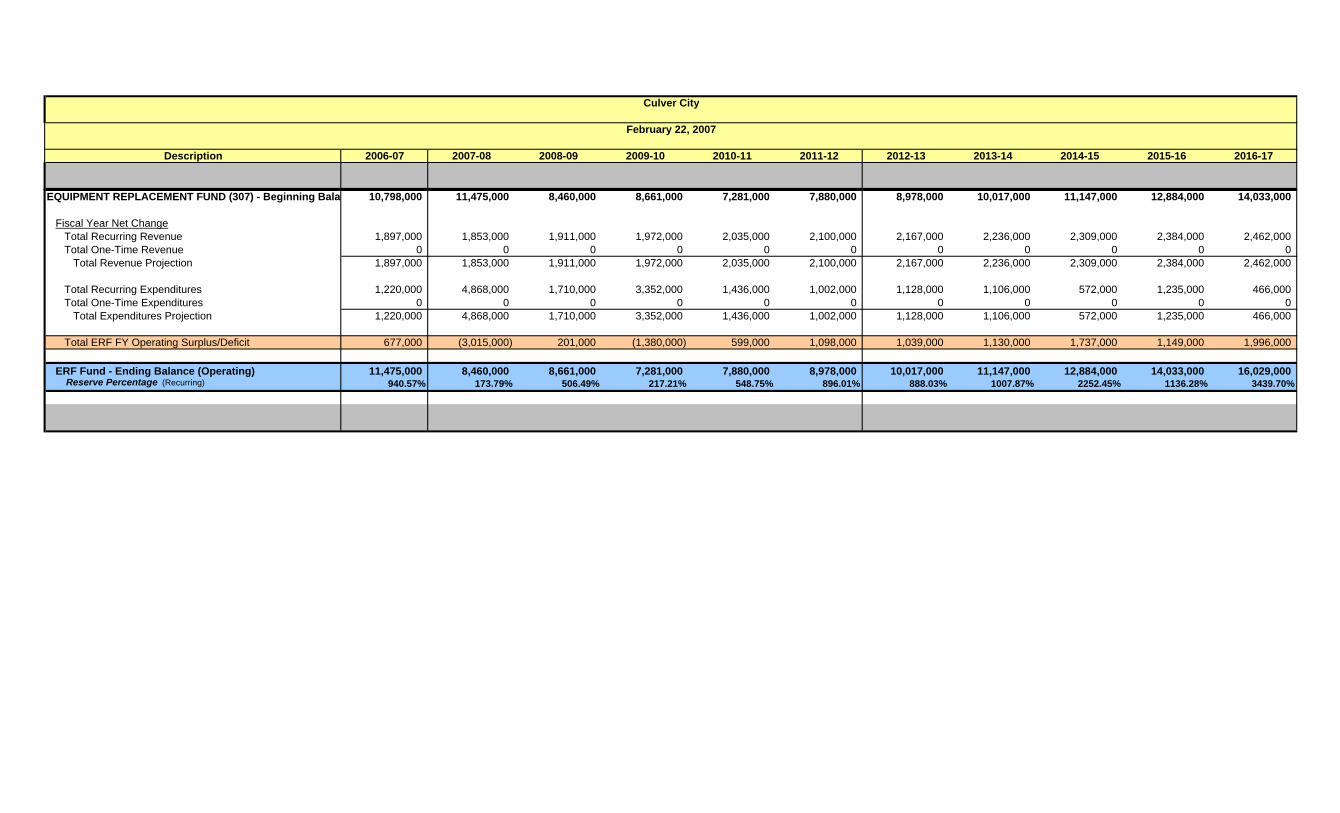
Description 2006-07 2007-08 2008-09 2009-10 2010-11 2011-12 2012-13 2013-14 2014-15 2015-16 2016-17
Culver City
February 22, 2007
EQUIPMENT REPLACEMENT FUND (307) - Beginning Bala 10,798,000 11,475,000 8,460,000 8,661,000 7,281,000 7,880,000 8,978,000 10,017,000 11,147,000 12,884,000 14,033,000
Fiscal Year Net ChangeTotal Recurring Revenue 1,897,000 1,853,000 1,911,000 1,972,000 2,035,000 2,100,000 2,167,000 2,236,000 2,309,000 2,384,000 2,462,000Total One-Time Revenue 0 0 0 0 0 0 0 0 0 0 0
Total Revenue Projection 1,897,000 1,853,000 1,911,000 1,972,000 2,035,000 2,100,000 2,167,000 2,236,000 2,309,000 2,384,000 2,462,000
Total Recurring Expenditures 1,220,000 4,868,000 1,710,000 3,352,000 1,436,000 1,002,000 1,128,000 1,106,000 572,000 1,235,000 466,000Total One-Time Expenditures 0 0 0 0 0 0 0 0 0 0 0
Total Expenditures Projection 1,220,000 4,868,000 1,710,000 3,352,000 1,436,000 1,002,000 1,128,000 1,106,000 572,000 1,235,000 466,000
Total ERF FY Operating Surplus/Deficit 677,000 (3,015,000) 201,000 (1,380,000) 599,000 1,098,000 1,039,000 1,130,000 1,737,000 1,149,000 1,996,000
ERF Fund - Ending Balance (Operating) 11,475,000 8,460,000 8,661,000 7,281,000 7,880,000 8,978,000 10,017,000 11,147,000 12,884,000 14,033,000 16,029,000 Reserve Percentage (Recurring) 940.57% 173.79% 506.49% 217.21% 548.75% 896.01% 888.03% 1007.87% 2252.45% 1136.28% 3439.70%
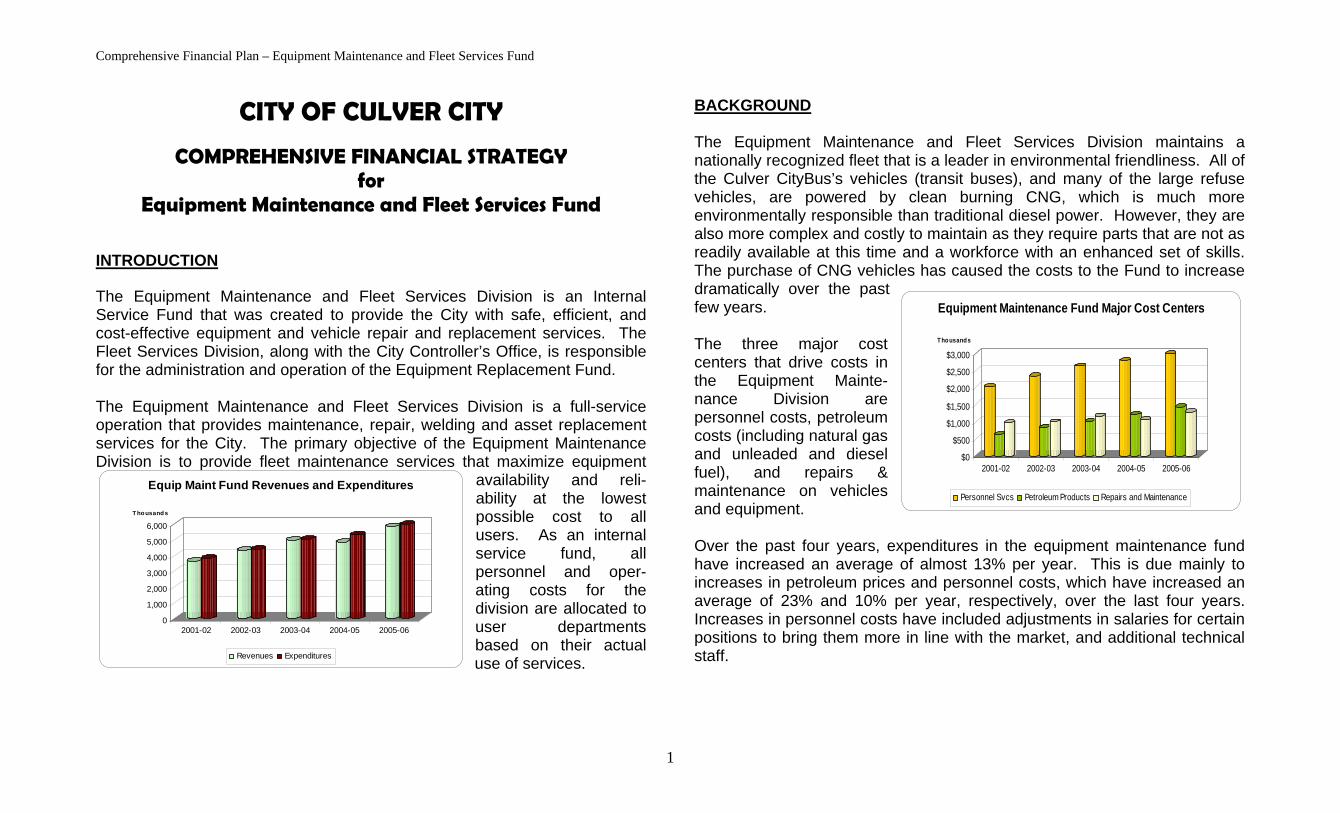
Comprehensive Financial Plan – Equipment Maintenance and Fleet Services Fund
CITY OF CULVER CITY
COMPREHENSIVE FINANCIAL STRATEGY for
Equipment Maintenance and Fleet Services Fund INTRODUCTION The Equipment Maintenance and Fleet Services Division is an Internal Service Fund that was created to provide the City with safe, efficient, and cost-effective equipment and vehicle repair and replacement services. The Fleet Services Division, along with the City Controller’s Office, is responsible for the administration and operation of the Equipment Replacement Fund.
$0
$500
$1,000
$1,500
$2,000
$2,500
$3,000
Thousands
2001-02 2002-03 2003-04 2004-05 2005-06
Equipment Maintenance Fund Major Cost Centers
Personnel Svcs Petroleum Products Repairs and Maintenance
0
1,000
2,000
3,000
4,000
5,000
6,000T housands
2001-02 2002-03 2003-04 2004-05 2005-06
Equip Maint Fund Revenues and Expenditures
Revenues Expenditures
The Equipment Maintenance and Fleet Services Division is a full-service operation that provides maintenance, repair, welding and asset replacement services for the City. The primary objective of the Equipment Maintenance Division is to provide fleet maintenance services that maximize equipment
availability and reli-ability at the lowest possible cost to all users. As an internal service fund, all personnel and oper-ating costs for the division are allocated to user departments based on their actual use of services.
BACKGROUND The Equipment Maintenance and Fleet Services Division maintains a nationally recognized fleet that is a leader in environmental friendliness. All of the Culver CityBus’s vehicles (transit buses), and many of the large refuse vehicles, are powered by clean burning CNG, which is much more environmentally responsible than traditional diesel power. However, they are also more complex and costly to maintain as they require parts that are not as readily available at this time and a workforce with an enhanced set of skills. The purchase of CNG vehicles has caused the costs to the Fund to increase dramatically over the past few years. The three major cost centers that drive costs in the Equipment Mainte-nance Division are personnel costs, petroleum costs (including natural gas and unleaded and diesel fuel), and repairs & maintenance on vehicles and equipment. Over the past four years, expenditures in the equipment maintenance fund have increased an average of almost 13% per year. This is due mainly to increases in petroleum prices and personnel costs, which have increased an average of 23% and 10% per year, respectively, over the last four years. Increases in personnel costs have included adjustments in salaries for certain positions to bring them more in line with the market, and additional technical staff.
1
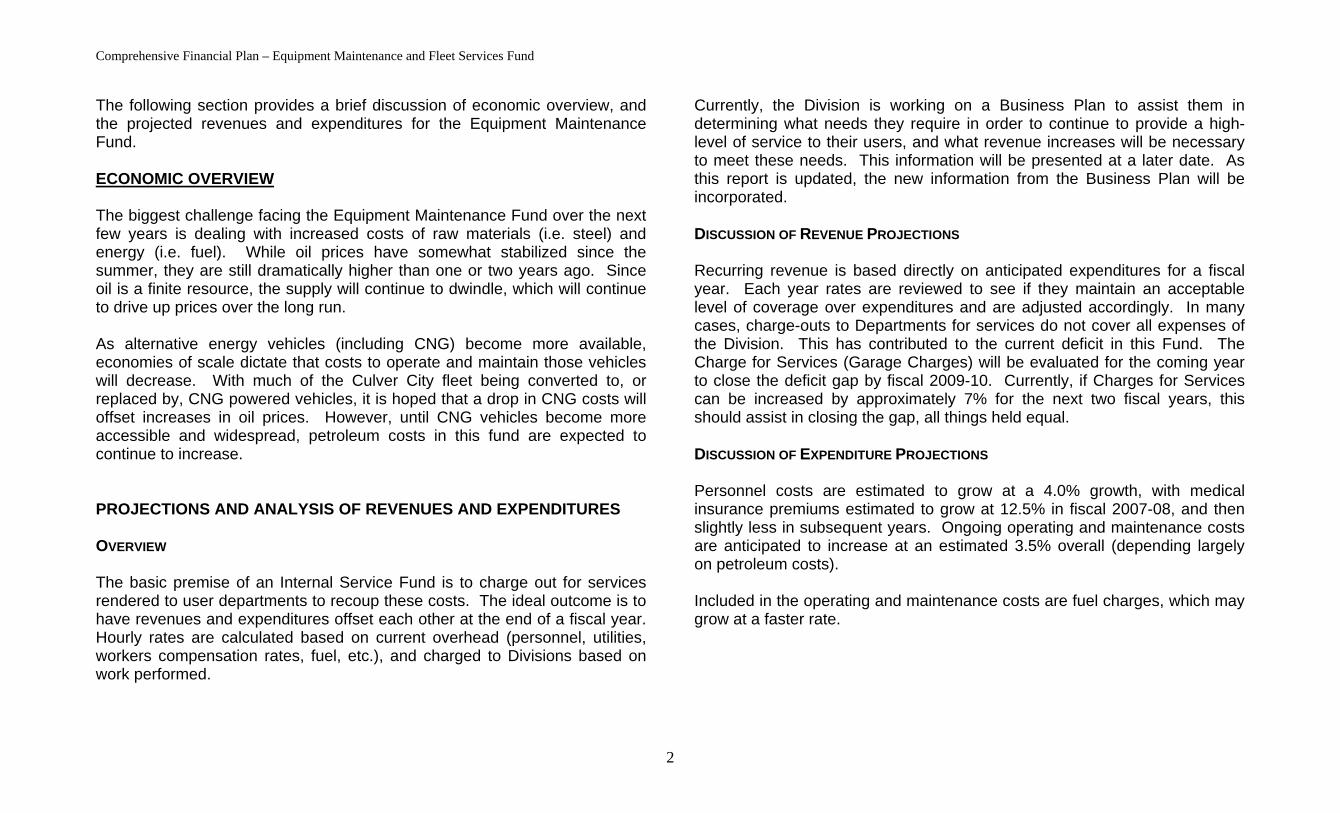
Comprehensive Financial Plan – Equipment Maintenance and Fleet Services Fund
The following section provides a brief discussion of economic overview, and the projected revenues and expenditures for the Equipment Maintenance Fund. ECONOMIC OVERVIEW The biggest challenge facing the Equipment Maintenance Fund over the next few years is dealing with increased costs of raw materials (i.e. steel) and energy (i.e. fuel). While oil prices have somewhat stabilized since the summer, they are still dramatically higher than one or two years ago. Since oil is a finite resource, the supply will continue to dwindle, which will continue to drive up prices over the long run. As alternative energy vehicles (including CNG) become more available, economies of scale dictate that costs to operate and maintain those vehicles will decrease. With much of the Culver City fleet being converted to, or replaced by, CNG powered vehicles, it is hoped that a drop in CNG costs will offset increases in oil prices. However, until CNG vehicles become more accessible and widespread, petroleum costs in this fund are expected to continue to increase. PROJECTIONS AND ANALYSIS OF REVENUES AND EXPENDITURES OVERVIEW The basic premise of an Internal Service Fund is to charge out for services rendered to user departments to recoup these costs. The ideal outcome is to have revenues and expenditures offset each other at the end of a fiscal year. Hourly rates are calculated based on current overhead (personnel, utilities, workers compensation rates, fuel, etc.), and charged to Divisions based on work performed.
Currently, the Division is working on a Business Plan to assist them in determining what needs they require in order to continue to provide a high-level of service to their users, and what revenue increases will be necessary to meet these needs. This information will be presented at a later date. As this report is updated, the new information from the Business Plan will be incorporated. DISCUSSION OF REVENUE PROJECTIONS Recurring revenue is based directly on anticipated expenditures for a fiscal year. Each year rates are reviewed to see if they maintain an acceptable level of coverage over expenditures and are adjusted accordingly. In many cases, charge-outs to Departments for services do not cover all expenses of the Division. This has contributed to the current deficit in this Fund. The Charge for Services (Garage Charges) will be evaluated for the coming year to close the deficit gap by fiscal 2009-10. Currently, if Charges for Services can be increased by approximately 7% for the next two fiscal years, this should assist in closing the gap, all things held equal. DISCUSSION OF EXPENDITURE PROJECTIONS Personnel costs are estimated to grow at a 4.0% growth, with medical insurance premiums estimated to grow at 12.5% in fiscal 2007-08, and then slightly less in subsequent years. Ongoing operating and maintenance costs are anticipated to increase at an estimated 3.5% overall (depending largely on petroleum costs). Included in the operating and maintenance costs are fuel charges, which may grow at a faster rate.
2
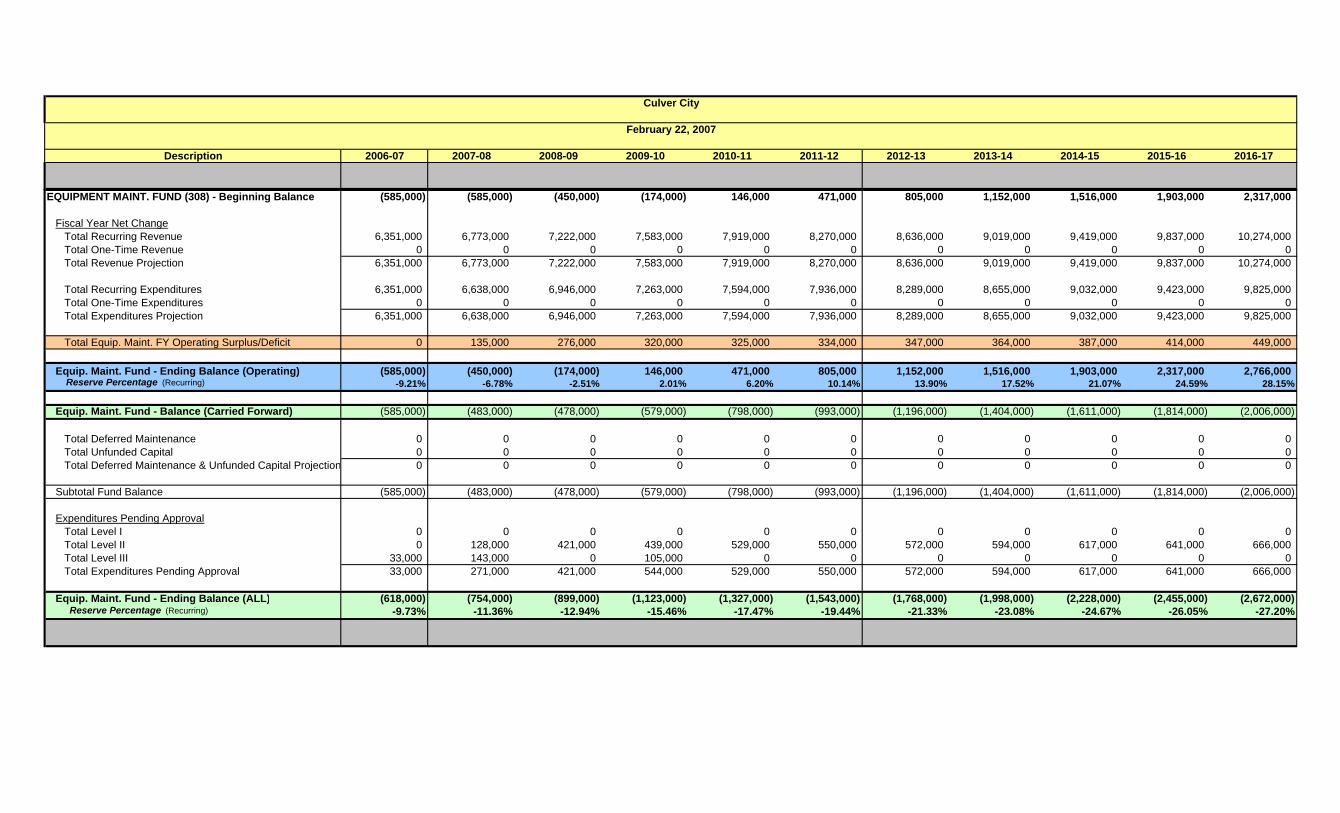
Description 2006-07 2007-08 2008-09 2009-10 2010-11 2011-12 2012-13 2013-14 2014-15 2015-16 2016-17
Culver City
February 22, 2007
EQUIPMENT MAINT. FUND (308) - Beginning Balance (585,000) (585,000) (450,000) (174,000) 146,000 471,000 805,000 1,152,000 1,516,000 1,903,000 2,317,000
Fiscal Year Net ChangeTotal Recurring Revenue 6,351,000 6,773,000 7,222,000 7,583,000 7,919,000 8,270,000 8,636,000 9,019,000 9,419,000 9,837,000 10,274,000Total One-Time Revenue 0 0 0 0 0 0 0 0 0 0 0Total Revenue Projection 6,351,000 6,773,000 7,222,000 7,583,000 7,919,000 8,270,000 8,636,000 9,019,000 9,419,000 9,837,000 10,274,000
Total Recurring Expenditures 6,351,000 6,638,000 6,946,000 7,263,000 7,594,000 7,936,000 8,289,000 8,655,000 9,032,000 9,423,000 9,825,000Total One-Time Expenditures 0 0 0 0 0 0 0 0 0 0 0Total Expenditures Projection 6,351,000 6,638,000 6,946,000 7,263,000 7,594,000 7,936,000 8,289,000 8,655,000 9,032,000 9,423,000 9,825,000
Total Equip. Maint. FY Operating Surplus/Deficit 0 135,000 276,000 320,000 325,000 334,000 347,000 364,000 387,000 414,000 449,000
Equip. Maint. Fund - Ending Balance (Operating) (585,000) (450,000) (174,000) 146,000 471,000 805,000 1,152,000 1,516,000 1,903,000 2,317,000 2,766,000 Reserve Percentage (Recurring) -9.21% -6.78% -2.51% 2.01% 6.20% 10.14% 13.90% 17.52% 21.07% 24.59% 28.15%
Equip. Maint. Fund - Balance (Carried Forward) (585,000) (483,000) (478,000) (579,000) (798,000) (993,000) (1,196,000) (1,404,000) (1,611,000) (1,814,000) (2,006,000)
Total Deferred Maintenance 0 0 0 0 0 0 0 0 0 0 0Total Unfunded Capital 0 0 0 0 0 0 0 0 0 0 0Total Deferred Maintenance & Unfunded Capital Projection 0 0 0 0 0 0 0 0 0 0 0
Subtotal Fund Balance (585,000) (483,000) (478,000) (579,000) (798,000) (993,000) (1,196,000) (1,404,000) (1,611,000) (1,814,000) (2,006,000)
Expenditures Pending ApprovalTotal Level I 0 0 0 0 0 0 0 0 0 0 0Total Level II 0 128,000 421,000 439,000 529,000 550,000 572,000 594,000 617,000 641,000 666,000Total Level III 33,000 143,000 0 105,000 0 0 0 0 0 0 0Total Expenditures Pending Approval 33,000 271,000 421,000 544,000 529,000 550,000 572,000 594,000 617,000 641,000 666,000
Equip. Maint. Fund - Ending Balance (ALL) (618,000) (754,000) (899,000) (1,123,000) (1,327,000) (1,543,000) (1,768,000) (1,998,000) (2,228,000) (2,455,000) (2,672,000) Reserve Percentage (Recurring) -9.73% -11.36% -12.94% -15.46% -17.47% -19.44% -21.33% -23.08% -24.67% -26.05% -27.20%
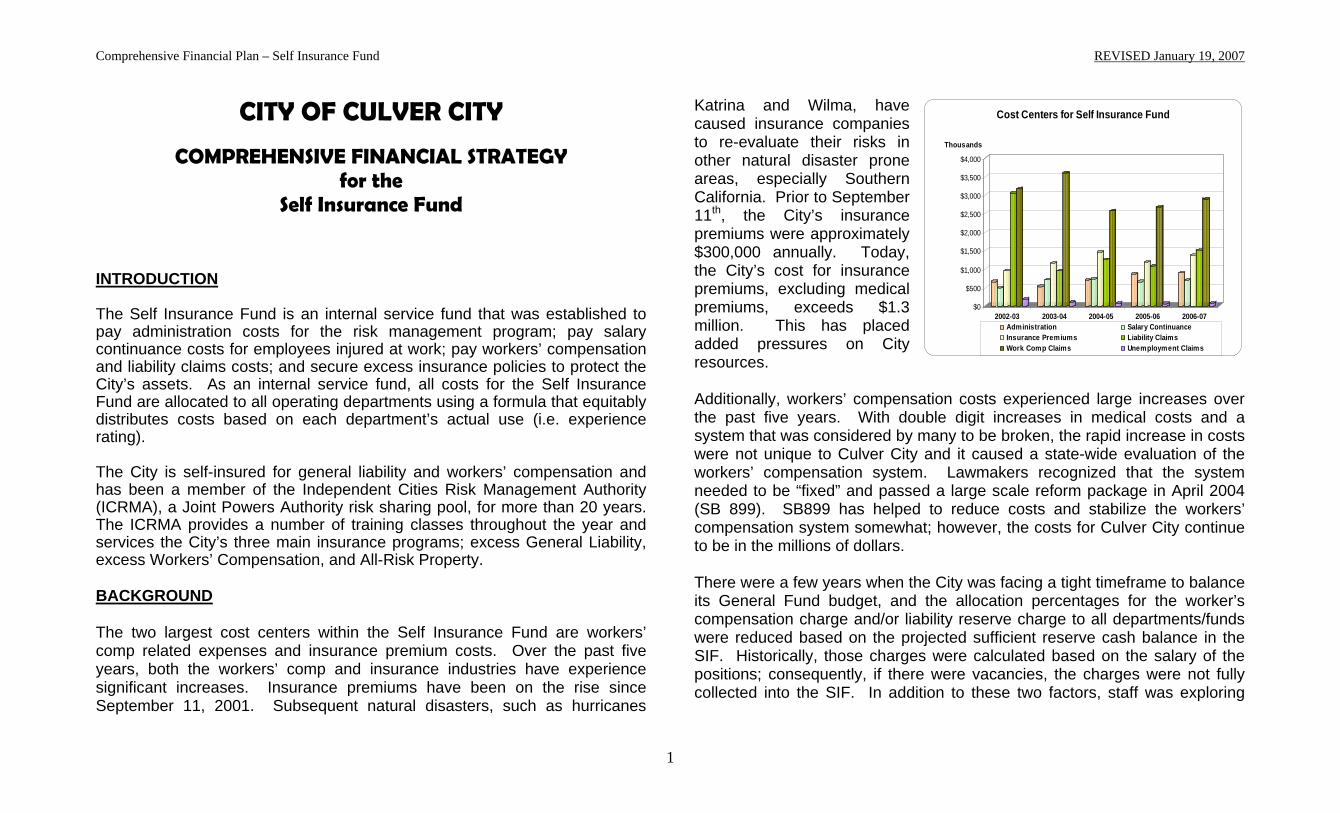
Comprehensive Financial Plan – Self Insurance Fund REVISED January 19, 2007
1
CITY OF CULVER CITY
COMPREHENSIVE FINANCIAL STRATEGY for the
Self Insurance Fund INTRODUCTION The Self Insurance Fund is an internal service fund that was established to pay administration costs for the risk management program; pay salary continuance costs for employees injured at work; pay workers’ compensation and liability claims costs; and secure excess insurance policies to protect the City’s assets. As an internal service fund, all costs for the Self Insurance Fund are allocated to all operating departments using a formula that equitably distributes costs based on each department’s actual use (i.e. experience rating). The City is self-insured for general liability and workers’ compensation and has been a member of the Independent Cities Risk Management Authority (ICRMA), a Joint Powers Authority risk sharing pool, for more than 20 years. The ICRMA provides a number of training classes throughout the year and services the City’s three main insurance programs; excess General Liability, excess Workers’ Compensation, and All-Risk Property. BACKGROUND The two largest cost centers within the Self Insurance Fund are workers’ comp related expenses and insurance premium costs. Over the past five years, both the workers’ comp and insurance industries have experience significant increases. Insurance premiums have been on the rise since September 11, 2001. Subsequent natural disasters, such as hurricanes
Katrina and Wilma, have caused insurance companies to re-evaluate their risks in other natural disaster prone areas, especially Southern California. Prior to September 11th, the City’s insurance premiums were approximately $300,000 annually. Today, the City’s cost for insurance premiums, excluding medical premiums, exceeds $1.3 million. This has placed added pressures on City resources. Additionally, workers’ compensation costs experienced large increases over the past five years. With double digit increases in medical costs and a system that was considered by many to be broken, the rapid increase in costs were not unique to Culver City and it caused a state-wide evaluation of the workers’ compensation system. Lawmakers recognized that the system needed to be “fixed” and passed a large scale reform package in April 2004 (SB 899). SB899 has helped to reduce costs and stabilize the workers’ compensation system somewhat; however, the costs for Culver City continue to be in the millions of dollars. There were a few years when the City was facing a tight timeframe to balance its General Fund budget, and the allocation percentages for the worker’s compensation charge and/or liability reserve charge to all departments/funds were reduced based on the projected sufficient reserve cash balance in the SIF. Historically, those charges were calculated based on the salary of the positions; consequently, if there were vacancies, the charges were not fully collected into the SIF. In addition to these two factors, staff was exploring
$0
$500
$1,000
$1,500
$2,000
$2,500
$3,000
$3,500
$4,000
Thousands
2002-03 2003-04 2004-05 2005-06 2006-07
Cost Centers for Self Insurance Fund
Administration Salary ContinuanceInsurance Premiums Liability ClaimsWork Comp Claims Unemployment Claims
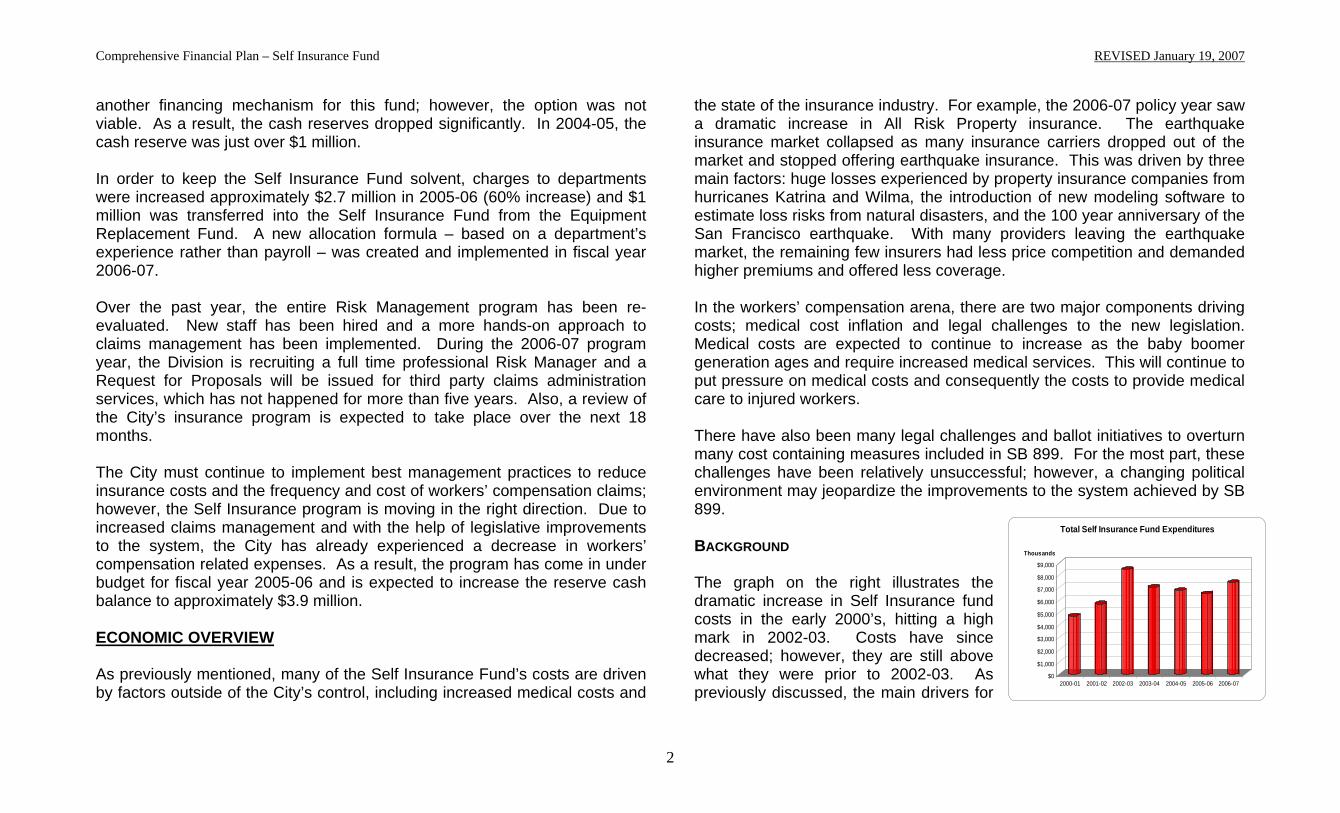
Comprehensive Financial Plan – Self Insurance Fund REVISED January 19, 2007
2
another financing mechanism for this fund; however, the option was not viable. As a result, the cash reserves dropped significantly. In 2004-05, the cash reserve was just over $1 million. In order to keep the Self Insurance Fund solvent, charges to departments were increased approximately $2.7 million in 2005-06 (60% increase) and $1 million was transferred into the Self Insurance Fund from the Equipment Replacement Fund. A new allocation formula – based on a department’s experience rather than payroll – was created and implemented in fiscal year 2006-07. Over the past year, the entire Risk Management program has been re-evaluated. New staff has been hired and a more hands-on approach to claims management has been implemented. During the 2006-07 program year, the Division is recruiting a full time professional Risk Manager and a Request for Proposals will be issued for third party claims administration services, which has not happened for more than five years. Also, a review of the City’s insurance program is expected to take place over the next 18 months. The City must continue to implement best management practices to reduce insurance costs and the frequency and cost of workers’ compensation claims; however, the Self Insurance program is moving in the right direction. Due to increased claims management and with the help of legislative improvements to the system, the City has already experienced a decrease in workers’ compensation related expenses. As a result, the program has come in under budget for fiscal year 2005-06 and is expected to increase the reserve cash balance to approximately $3.9 million. ECONOMIC OVERVIEW As previously mentioned, many of the Self Insurance Fund’s costs are driven by factors outside of the City’s control, including increased medical costs and
the state of the insurance industry. For example, the 2006-07 policy year saw a dramatic increase in All Risk Property insurance. The earthquake insurance market collapsed as many insurance carriers dropped out of the market and stopped offering earthquake insurance. This was driven by three main factors: huge losses experienced by property insurance companies from hurricanes Katrina and Wilma, the introduction of new modeling software to estimate loss risks from natural disasters, and the 100 year anniversary of the San Francisco earthquake. With many providers leaving the earthquake market, the remaining few insurers had less price competition and demanded higher premiums and offered less coverage. In the workers’ compensation arena, there are two major components driving costs; medical cost inflation and legal challenges to the new legislation. Medical costs are expected to continue to increase as the baby boomer generation ages and require increased medical services. This will continue to put pressure on medical costs and consequently the costs to provide medical care to injured workers. There have also been many legal challenges and ballot initiatives to overturn many cost containing measures included in SB 899. For the most part, these challenges have been relatively unsuccessful; however, a changing political environment may jeopardize the improvements to the system achieved by SB 899. BACKGROUND The graph on the right illustrates the dramatic increase in Self Insurance fund costs in the early 2000’s, hitting a high mark in 2002-03. Costs have since decreased; however, they are still above what they were prior to 2002-03. As previously discussed, the main drivers for
$0
$1,000
$2,000
$3,000
$4,000
$5,000
$6,000
$7,000
$8,000
$9,000
Thousands
2000-01 2001-02 2002-03 2003-04 2004-05 2005-06 2006-07
Total Self Insurance Fund Expenditures
Comprehensive Financial Plan – Self Insurance Fund REVISED January 19, 2007
3
the increased costs are industry wide increases in both insurance premiums and workers’ compensation costs. The major cost centers for the Self Insurance fund are illustrated below. During this five year period, the Self Insurance Fund’s cash reserve was used to fill the gap between revenues and expenditures. To minimize the impact of these increases, operating departments were not charged the full cost of the Self Insurance Fund. There was already a significant strain on resources that led to staff reductions in 2003-04. If the cash reserve had not been used to subsidize Self Insurance Fund’s operations, there may have been a need to reduce staff even further. Now that the City’s financial situation has somewhat stabilized, the City is focused on rebuilding the Self Insurance Fund’s cash reserve to adequate levels by equitably charging all costs to operating departments. PROJECTIONS AND ANALYSIS OF EXPENDITURES OVERVIEW Beginning in fiscal year 2006-07, staff implemented a formula to allocate all Self Insurance Fund expenses to departments based on an experience rating rather than payroll. In order to establish a relatively stable SIF charge and smooth out peaks and valleys in claims and insurance costs for each department, the allocation formula is based on a five year average of each department’s actual claims costs. This new allocation formula will ensure that each department pays their fair share of self insurance costs. DISCUSSION OF EXPENDITURE PROJECTIONS Expenditures are projected by calculating the five year average percentage change in each of the expenditure categories listed below:
1. Risk Management Administration
2. Salary Continuance for Injured Workers 3. Insurance Premiums 4. Liability Claims Costs 5. Workers’ Compensation Claims Costs
The average percentage change for each category is reviewed and adjusted based on future operational needs and program expectations. Risk Management Admin – The Risk Management Administration division comprises of staff and operations and maintenance costs. The division is currently in the midst of recruiting for the full-time Risk Manager position. Once that position is filled, the division will have a full compliment of four (4) full time staff, including a Risk Manager, Safety & Claims Coordinator, Safety Officer, and Claims Technician. Additionally, a number of positions in the City Attorney’s office are partially funded in this division due to their involvement in managing the General Liability program. It is assumed that the costs for this division will increase consistent with MOU increases, approximately 4%. Salary Continuance – When an employee is injured on duty (IOD) and must miss work as a result, the City will pay that employee’s full salary up to one year for public safety (per the Labor Code) and six months for general employees. During the period of time the employee is off work due to an injury, their salary and benefits are paid from the Self Insurance Fund rather than their respective department. This is to allow the department the option to use salary savings to hire temporary help until the injured employee returns. It is expected that, with increased claims management and preventative safety programs, salary continuance costs should decrease slightly over the next few years before leveling off and increasing consistent with MOU negotiated increases. Insurance Premiums – Insurance premiums are widely variable from year to year. It is projected that the increase in insurance premiums will be slightly more than inflation (5% per year).
Comprehensive Financial Plan – Self Insurance Fund REVISED January 19, 2007
4
Liability Claims – It is almost impossible to accurately predict liability claims costs from year to year. However, historically claims costs have remained relatively stable. Therefore, liability claims costs are projected to be consistent with the projected inflation rate (3.5%). Workers’ Compensation Claims – Similar to Liability claims, it is extremely difficult to accurately predict workers’ comp claims costs from year to year. Based on the recent evaluation of the program, it is projected that costs may be reduced further over the next few years before they stabilize. It is projected that workers’ compensation claims will decrease approximately 2% per year for the next five years before leveling off and increasing commensurate with projected inflation (3.5%).
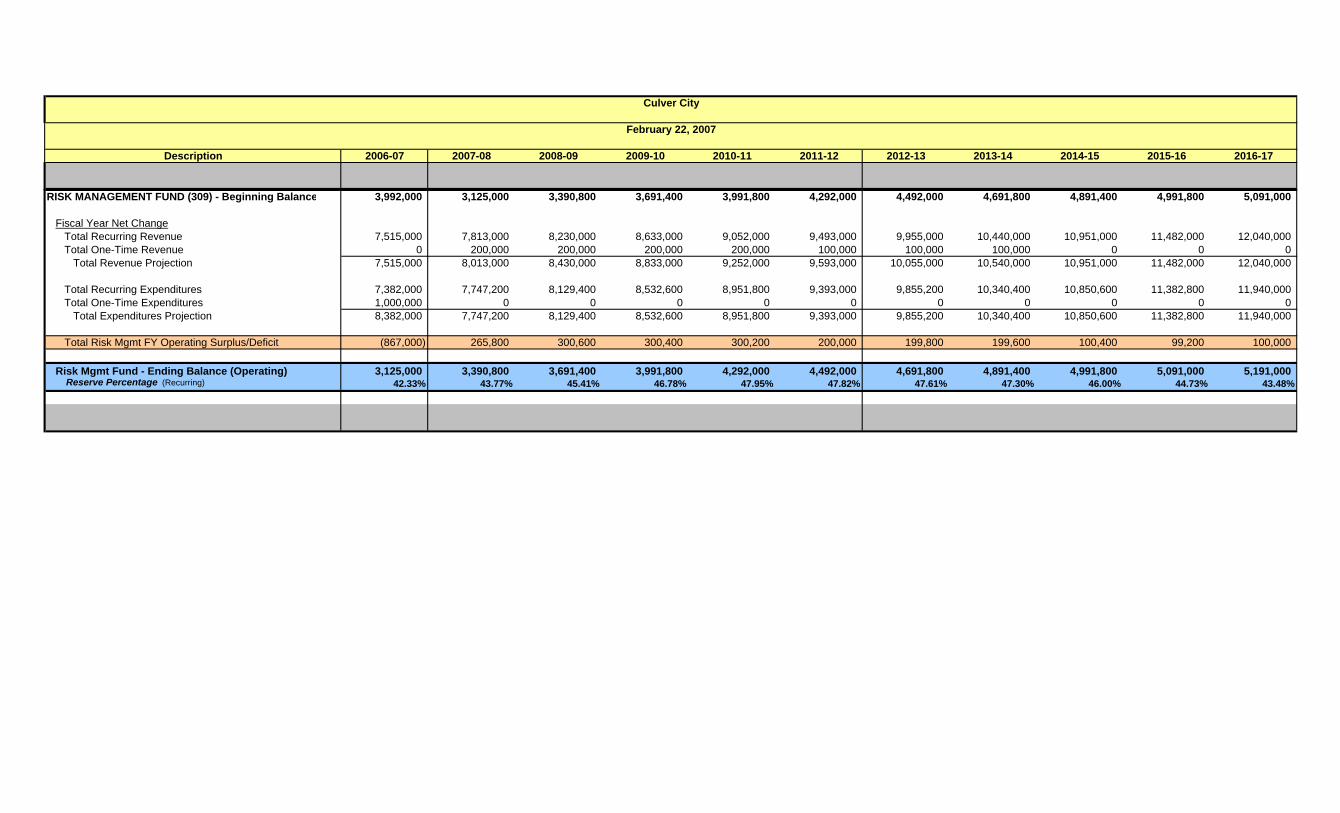
Description 2006-07 2007-08 2008-09 2009-10 2010-11 2011-12 2012-13 2013-14 2014-15 2015-16 2016-17
Culver City
February 22, 2007
RISK MANAGEMENT FUND (309) - Beginning Balance 3,992,000 3,125,000 3,390,800 3,691,400 3,991,800 4,292,000 4,492,000 4,691,800 4,891,400 4,991,800 5,091,000
Fiscal Year Net ChangeTotal Recurring Revenue 7,515,000 7,813,000 8,230,000 8,633,000 9,052,000 9,493,000 9,955,000 10,440,000 10,951,000 11,482,000 12,040,000Total One-Time Revenue 0 200,000 200,000 200,000 200,000 100,000 100,000 100,000 0 0 0
Total Revenue Projection 7,515,000 8,013,000 8,430,000 8,833,000 9,252,000 9,593,000 10,055,000 10,540,000 10,951,000 11,482,000 12,040,000
Total Recurring Expenditures 7,382,000 7,747,200 8,129,400 8,532,600 8,951,800 9,393,000 9,855,200 10,340,400 10,850,600 11,382,800 11,940,000Total One-Time Expenditures 1,000,000 0 0 0 0 0 0 0 0 0 0
Total Expenditures Projection 8,382,000 7,747,200 8,129,400 8,532,600 8,951,800 9,393,000 9,855,200 10,340,400 10,850,600 11,382,800 11,940,000
Total Risk Mgmt FY Operating Surplus/Deficit (867,000) 265,800 300,600 300,400 300,200 200,000 199,800 199,600 100,400 99,200 100,000
Risk Mgmt Fund - Ending Balance (Operating) 3,125,000 3,390,800 3,691,400 3,991,800 4,292,000 4,492,000 4,691,800 4,891,400 4,991,800 5,091,000 5,191,000 Reserve Percentage (Recurring) 42.33% 43.77% 45.41% 46.78% 47.95% 47.82% 47.61% 47.30% 46.00% 44.73% 43.48%
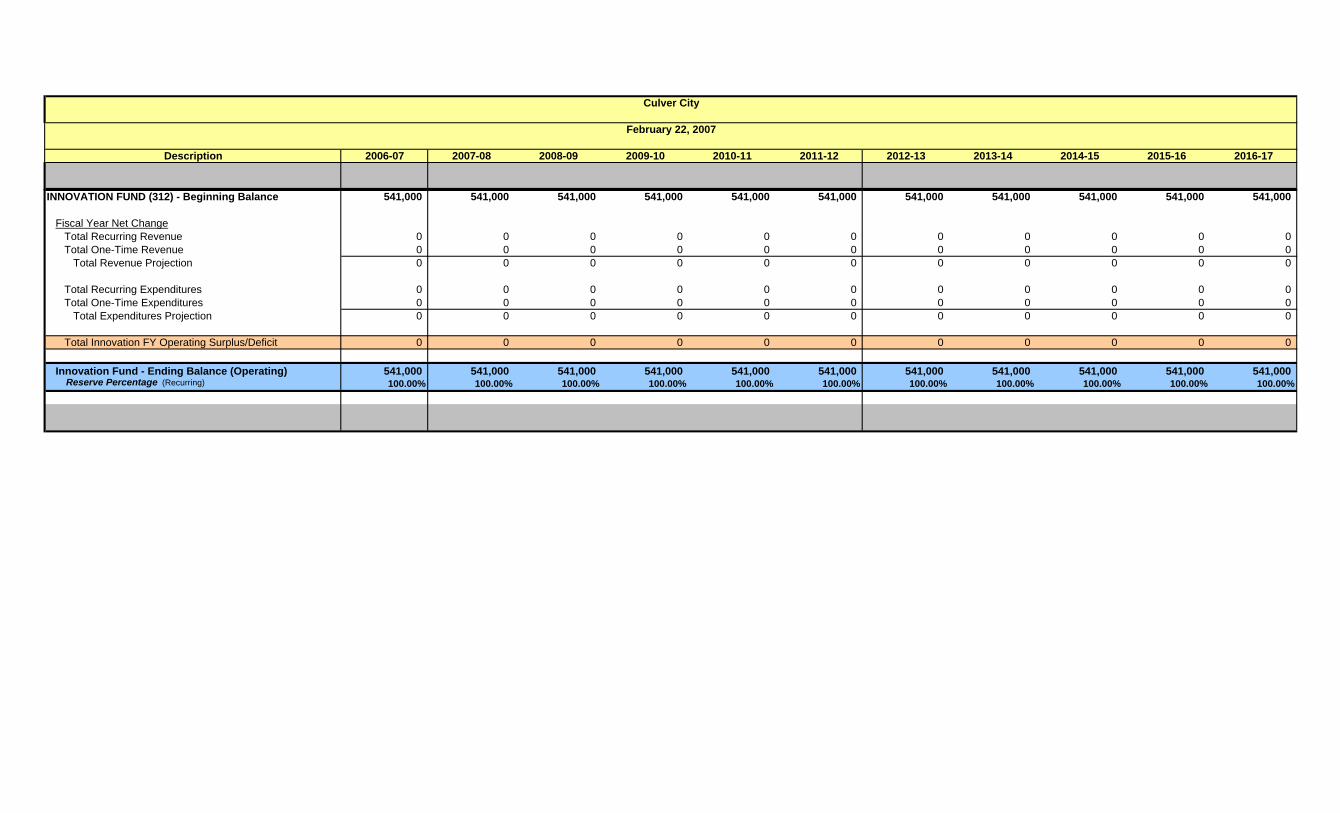
Description 2006-07 2007-08 2008-09 2009-10 2010-11 2011-12 2012-13 2013-14 2014-15 2015-16 2016-17
Culver City
February 22, 2007
INNOVATION FUND (312) - Beginning Balance 541,000 541,000 541,000 541,000 541,000 541,000 541,000 541,000 541,000 541,000 541,000
Fiscal Year Net ChangeTotal Recurring Revenue 0 0 0 0 0 0 0 0 0 0 0Total One-Time Revenue 0 0 0 0 0 0 0 0 0 0 0
Total Revenue Projection 0 0 0 0 0 0 0 0 0 0 0
Total Recurring Expenditures 0 0 0 0 0 0 0 0 0 0 0Total One-Time Expenditures 0 0 0 0 0 0 0 0 0 0 0
Total Expenditures Projection 0 0 0 0 0 0 0 0 0 0 0
Total Innovation FY Operating Surplus/Deficit 0 0 0 0 0 0 0 0 0 0 0
Innovation Fund - Ending Balance (Operating) 541,000 541,000 541,000 541,000 541,000 541,000 541,000 541,000 541,000 541,000 541,000 Reserve Percentage (Recurring) 100.00% 100.00% 100.00% 100.00% 100.00% 100.00% 100.00% 100.00% 100.00% 100.00% 100.00%

Description 2006-07 2007-08 2008-09 2009-10 2010-11 2011-12 2012-13 2013-14 2014-15 2015-16 2016-17
Culver City
February 22, 2007
Landscape Maint. District (425) - Beginning Bal 55,000 55,000 55,000 55,000 55,000 55,000 55,000 55,000 55,000 55,000 55,000
Fiscal Year Net ChangeTotal Recurring Revenue 47,000 47,000 47,000 47,000 47,000 47,000 47,000 47,000 47,000 47,000 47,000Total One-Time Revenue 0 0 0 0 0 0 0 0 0 0 0
Total Revenue Projection 47,000 47,000 47,000 47,000 47,000 47,000 47,000 47,000 47,000 47,000 47,000
Total Recurring Expenditures 47,000 47,000 47,000 47,000 47,000 47,000 47,000 47,000 47,000 47,000 47,000Total One-Time Expenditures 0 0 0 0 0 0 0 0 0 0 0
Total Expenditures Projection 47,000 47,000 47,000 47,000 47,000 47,000 47,000 47,000 47,000 47,000 47,000
Total Landscape Maint. Dist. FY Operating Surplus/Deficit 0 0 0 0 0 0 0 0 0 0 0
Landscape Maint. Dist - Ending Bal (Operating) 55,000 55,000 55,000 55,000 55,000 55,000 55,000 55,000 55,000 55,000 55,000 Reserve Percentage (Recurring) 117.02% 117.02% 117.02% 117.02% 117.02% 117.02% 117.02% 117.02% 117.02% 117.02% 117.02%
Comprehensive Financial Plan – Operating Grant Funds
CITY OF CULVER CITY
COMPREHENSIVE FINANCIAL STRATEGY for
Operating Grant Funds INTRODUCTION The City has a number of operating grants that allow the City to provide a level of service that may not otherwise be feasible, including the Community Development Block Grant (CDBG), Senior Nutrition Program, and the COPS program. Operating grants are used to fund personnel and operations costs for specific activities allowed by the grant. It is the City’s policy to apply for grants that are directed toward achieving and maximizing external financial resources while protecting the integrity of the City’s operating budget and long-term financial condition. When contemplating a grant application, the applying department must consider the fiscal impact and shall complete a financial analysis to measure the cost and benefit of the grant activity. If the cost of administering the proposed grant exceeds the grant amount or the matching requirement causes excessive burden on the City’s financial resources, or the grant funded project creates significant ongoing operating costs, the department should choose not to apply. It is the responsible department’s obligation to ensure that all requirements and timelines set forth in the grant agreement are satisfied. The department is also responsible for following the policies and procedures laid out in the City’s “Administrative Procedures for Grant Submission and Management.”
Federal and State Grants are an important source of funds that the City can use to leverage its own money and maximize the level of service provided to the community. Many operating grants have strict procedures that must be followed or the City risks not being able to collect the funds. Therefore, the City must be diligent in adhering to requirements of the grant agreement to ensure the most effective and efficient use of resources. BACKGROUND Grant fund opportunities are variable from year-to-year. Some operating grants are appropriated on a multi-year basis, but there is no guarantee that additional funds will be available once the grant expires. Currently, the City has a number of programs that are funded in whole or in part by operating grants. These programs include the Disability Services Specialist through the Community Development Block Grant (CDBG), Senior Nutrition Program, Paratransit Services, Retired Seniors Volunteer Program, and the COPS program. The grant funds are used to fund personnel and operating costs associated with the grant activity. CDBG funds are used for projects that meet the needs of the community in low-moderate income areas. CDBG funds are used to off-set personnel costs for managing the CDBG program as well as continued funding of the Disability Services Specialist and implementation of new projects that are approved by the CDBG Advisory Committee, which is a citizen participation committee. The Disability Services Specialist is a member of the Senior & Social Services Division. The Senior Nutrition Program is administered by the Senior and Social Services Division and provides seniors who are sixty years and older with hot lunches on-site, home delivered meals to Culver City residents, telephone reassurance, and nutritional education. This program is intended to be 100% funded by the grant and donations.
1
Comprehensive Financial Plan – Operating Grant Funds
The Paratransit Services program provides transportation to people who cannot use normal public transportation services. This is accomplished through deployment of City vans and contracts with cab companies licensed to operate in Culver City. This program is also intended to be 100% grant funded and is administered by the Senior and Social Services Division. The Retired Seniors Volunteer Program is also administered by the Senior and Social Services Division. The mission of the program is to meet the critical needs of the community through volunteerism and to provide citizens age 55 and above with meaningful service opportunities that utilize their experiences, knowledge, skills, and wisdom. In order to meet these goals, the program matches seniors with volunteer opportunities in Culver City and surrounding areas. ECONOMIC OVERVIEW Operating Grant funding is variable from year-to-year based on the Granting authorities (usually the Federal or State government) annual appropriation. With an increased amount of funds being appropriated for the war in Iraq, domestic funding for grants and other federally funded programs may begin to shrink. This has been made apparent as the CDBG program was nearly eliminated entirely from the Federal budget last year. In response to public opposition, the CDBG program was ultimately funded in the Federal budget; however, the funds were reduced significantly from the prior year. It is expected that, in light of current world events, many grant funds will be directed towards homeland security and defense type activities. As a result, there may be additional grant opportunities for public safety related activities in the future.
PROJECTIONS AND ANALYSIS OF EXPENDITURES OVERVIEW Because of the many variables that come into play with grant funding, it is very difficult to project any type of ongoing forecast or trend. Many of the operating grants the City receives are for one-time items and purchases of which most are special equipment. These one-time operating grants are listed on the Ten (10) Year Forecast in fiscal 2006-07, but do not show any funding in future years. Only historical on-going operating grants are shown. More often than not, operating grants are “reimbursable,” meaning the City must spend (front) the money first and then submit the paperwork to be reimbursed by the granting authority. This creates a lag between the time the expense goes out and the reimbursement comes in. In a perfect situation the operating grant balance would be zero, but because of the reimbursable status of most grants, a negative balance is created until the funding is received from the granting authority. For purposes of forecasting both ongoing operating grant revenues and expenditures, the Senior Nutrition Program, Paratransit Services, Retired Senior Volunteer Program (RSVP), Disability Services, La Ballona Creek Bikeway, and Air Quality Programs are the only Divisions showing ongoing funding. Historically, these have had dedicated grant funding sources; although, any grant funding can be discontinued or reduced from one year to another. For a few of the Divisions listed below, General Fund monies are used to offset the entire cost of the program. It has been a goal of the City that all grant-funded programs be self-sufficient, but this goal is not feasible in all cases and will likely not be met in the near future.
2
Comprehensive Financial Plan – Operating Grant Funds
DISCUSSION OF REVENUE PROJECTIONS The Senior Nutrition Division receives its funding mainly from the County of Los Angeles. This funding is approved on a three to four year basis, and will be coming up for renewal this year. There is no indication at this time that the City will receive a lower amount than it currently receives, and is lobbying to receive an increased amount due to the number of meals served. The Paratransit Services Division is mainly funded using Prop A Incentive funding, County Paratransit Reimbursement, and Prop C funding. The County Paratransit Reimbursement contract is up in 2008, and will be open to discussion with the County Department of Public Works. There is no indication at this time that funding will be reduced for this program. Funding for all except the Prop A Incentive funding was kept at a 4% growth per year for forecasting purposes. The Prop A Incentive funding is projected to grow by 2.1% per year. This may change in the future, but is not possible to predict. The Retired Senior Volunteer Program (RSVP) is only grant funded by approximately one-third. The other portion is covered by the General Fund. The Corporation for National and Community Service designates funding for senior volunteer programs, and just renewed this funding for a three-year cycle. The Disability Services Specialist is funded using Community Development Block Grant (CDBG) monies. As was discussed earlier, this funding has been reduced the last several years, and has the possibility of being eliminated in the future. Each year the funding is reduced, the General Fund has picked up the difference. Currently, the grant pays 45% of the Specialist’s position in fiscal 2006-07. Actual program expenditure including supplies and part-time personnel are supported by the General Fund.
For the four Divisions just discussed, strategies are currently being developed to address potential grant funding shortfalls and possible restructuring of the programs and were not included in this document. It is highly likely that these strategies will be introduced and presented during the upcoming budget process. AB 2766 funding, which funds our Air Quality Programs Division, is expected to continue to be received, and is projected to grow by approximately 0.5% per year. The current per-year amount of funding is approximately $40,000 and is roughly based on the City’s residential population (approximately $1 per resident [$1 x 40,000 = $40,000]). Currently, there is no legislation that is expected to change this formula. Funding for the La Ballona Creek Bikeway is received from the Transportation Development Act Article 3 – Bicycle and Pedestrian Funds. This funding is granted to municipalities on a per capita basis and varies slightly from year-to-year. This funding helps cover some of the personnel expenses of our Public Works personnel who assist in maintaining the Bikeway. For revenue projections, this funding source has been held steady at the current funding amount. There is currently no formula or calculation to determine the amount to be allocated from year-to-year. All other grant revenues shown in fiscal 2006-07 have been identified as one-time grants, and are not carried forward in projections. DISCUSSION OF EXPENDITURE PROJECTIONS Expenditures for personnel costs are forecasted to grow 4% per year, and medical insurance costs are forecasted to grow 12.5% in fiscal 2007-08, with slight reductions in percentage increases in subsequent years. Operating and maintenance costs are forecasted to grow by 3.5% per year. Ongoing personnel expenditures are found in the Senior Nutrition Division, Paratransit
3

Comprehensive Financial Plan – Operating Grant Funds
Division, Retired Senior Volunteer Program (RSVP), and Disability Services Division. Each budget year, grant-funded Divisions must be reviewed to determine the amount of funding available. Grant funding is aggressively sought, and staff constantly keeps abreast of any changes in funding that may occur from year to year. They actively seek to at least maintain the current levels of grant funding. Appropriations for expenditures are made based on identified available funding for the upcoming budget year. If there is a gap between available funding and expenditures, all avenues are explored to close the gap before General Fund money is used. Expenditures in the Air Quality Programs Division are currently projected at a steady rate. Funding in this Division is used for the City’s Rideshare program through AQMD, and to help fund the additional cost of alternative-fuel vehicles, which is the policy of the City to purchase when feasible and available. The La Ballona Creek Bikeway expenditures are set against the available revenue funding. Each year the City is contacted regarding the amount of funding it will receive per the Transportation Development Act Article 3 for this program and budgets accordingly.
4
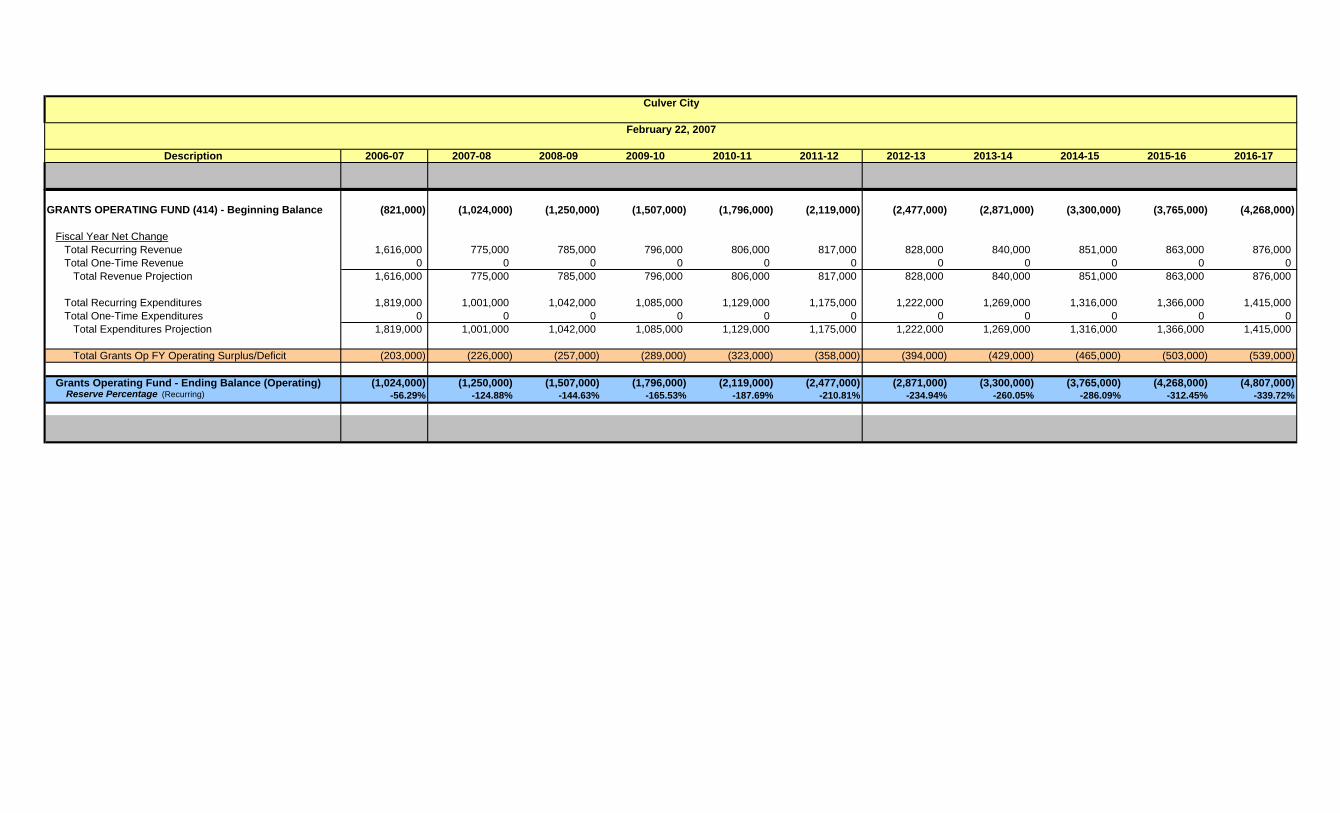
Description 2006-07 2007-08 2008-09 2009-10 2010-11 2011-12 2012-13 2013-14 2014-15 2015-16 2016-17
Culver City
February 22, 2007
GRANTS OPERATING FUND (414) - Beginning Balance (821,000) (1,024,000) (1,250,000) (1,507,000) (1,796,000) (2,119,000) (2,477,000) (2,871,000) (3,300,000) (3,765,000) (4,268,000)
Fiscal Year Net ChangeTotal Recurring Revenue 1,616,000 775,000 785,000 796,000 806,000 817,000 828,000 840,000 851,000 863,000 876,000Total One-Time Revenue 0 0 0 0 0 0 0 0 0 0 0
Total Revenue Projection 1,616,000 775,000 785,000 796,000 806,000 817,000 828,000 840,000 851,000 863,000 876,000
Total Recurring Expenditures 1,819,000 1,001,000 1,042,000 1,085,000 1,129,000 1,175,000 1,222,000 1,269,000 1,316,000 1,366,000 1,415,000Total One-Time Expenditures 0 0 0 0 0 0 0 0 0 0 0
Total Expenditures Projection 1,819,000 1,001,000 1,042,000 1,085,000 1,129,000 1,175,000 1,222,000 1,269,000 1,316,000 1,366,000 1,415,000
Total Grants Op FY Operating Surplus/Deficit (203,000) (226,000) (257,000) (289,000) (323,000) (358,000) (394,000) (429,000) (465,000) (503,000) (539,000)
Grants Operating Fund - Ending Balance (Operating) (1,024,000) (1,250,000) (1,507,000) (1,796,000) (2,119,000) (2,477,000) (2,871,000) (3,300,000) (3,765,000) (4,268,000) (4,807,000) Reserve Percentage (Recurring) -56.29% -124.88% -144.63% -165.53% -187.69% -210.81% -234.94% -260.05% -286.09% -312.45% -339.72%
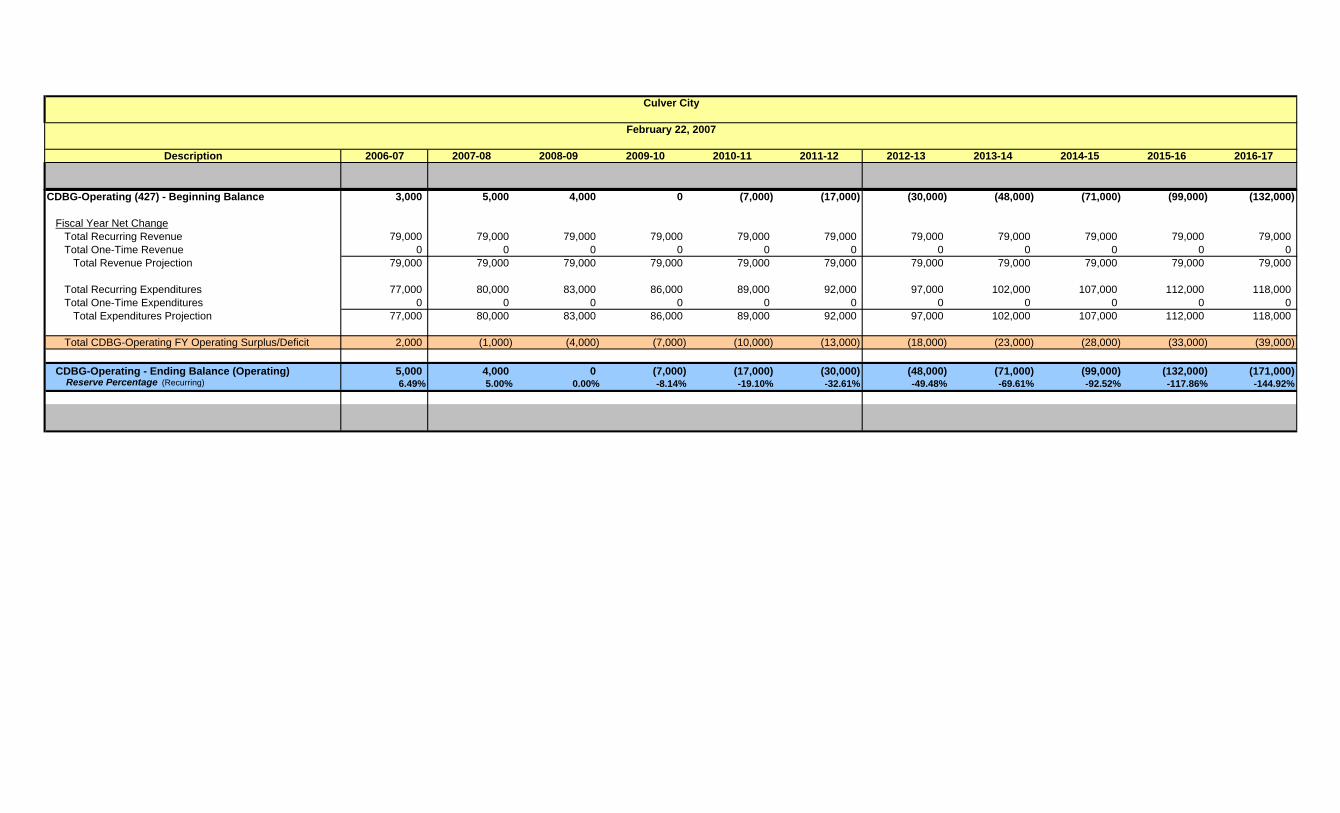
Description 2006-07 2007-08 2008-09 2009-10 2010-11 2011-12 2012-13 2013-14 2014-15 2015-16 2016-17
Culver City
February 22, 2007
CDBG-Operating (427) - Beginning Balance 3,000 5,000 4,000 0 (7,000) (17,000) (30,000) (48,000) (71,000) (99,000) (132,000)
Fiscal Year Net ChangeTotal Recurring Revenue 79,000 79,000 79,000 79,000 79,000 79,000 79,000 79,000 79,000 79,000 79,000Total One-Time Revenue 0 0 0 0 0 0 0 0 0 0 0
Total Revenue Projection 79,000 79,000 79,000 79,000 79,000 79,000 79,000 79,000 79,000 79,000 79,000
Total Recurring Expenditures 77,000 80,000 83,000 86,000 89,000 92,000 97,000 102,000 107,000 112,000 118,000Total One-Time Expenditures 0 0 0 0 0 0 0 0 0 0 0
Total Expenditures Projection 77,000 80,000 83,000 86,000 89,000 92,000 97,000 102,000 107,000 112,000 118,000
Total CDBG-Operating FY Operating Surplus/Deficit 2,000 (1,000) (4,000) (7,000) (10,000) (13,000) (18,000) (23,000) (28,000) (33,000) (39,000)
CDBG-Operating - Ending Balance (Operating) 5,000 4,000 0 (7,000) (17,000) (30,000) (48,000) (71,000) (99,000) (132,000) (171,000) Reserve Percentage (Recurring) 6.49% 5.00% 0.00% -8.14% -19.10% -32.61% -49.48% -69.61% -92.52% -117.86% -144.92%
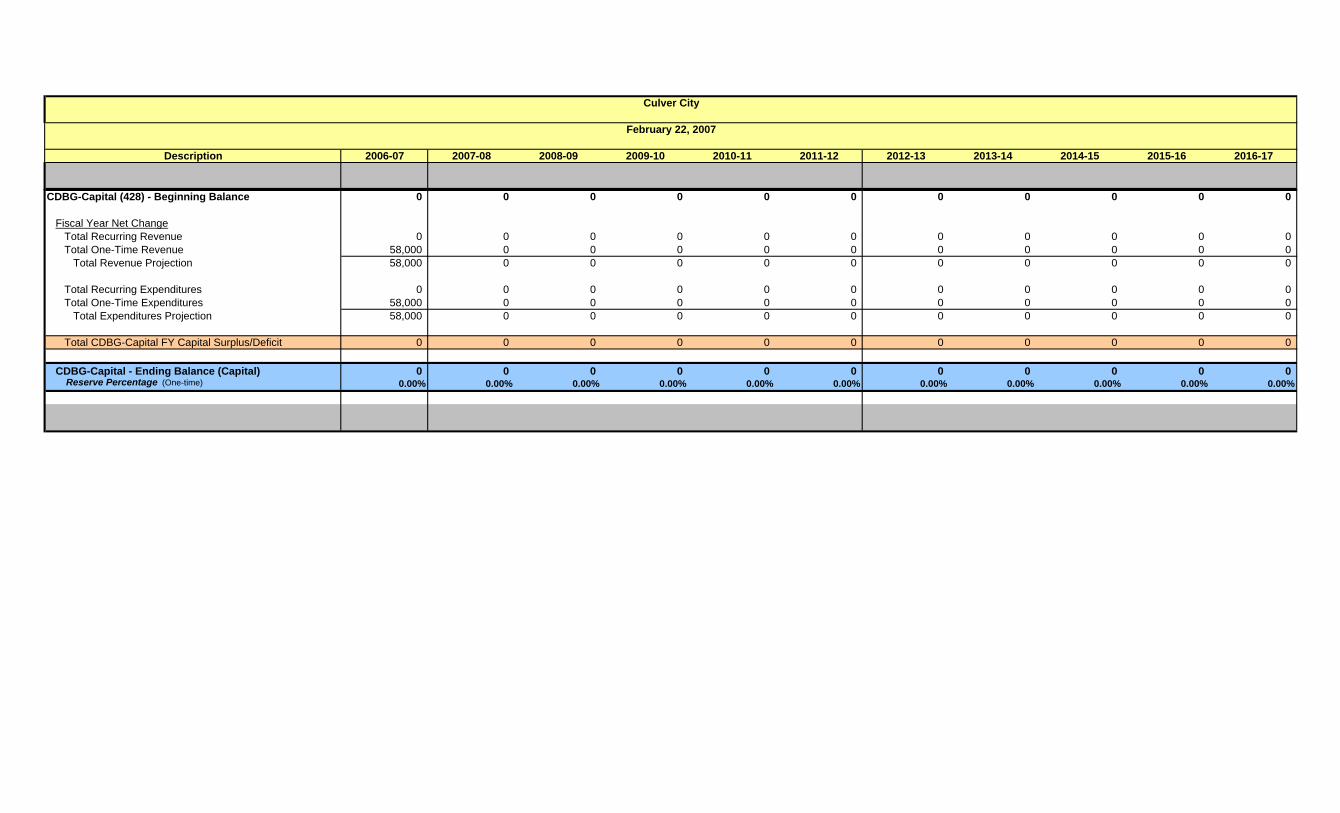
Description 2006-07 2007-08 2008-09 2009-10 2010-11 2011-12 2012-13 2013-14 2014-15 2015-16 2016-17
Culver City
February 22, 2007
CDBG-Capital (428) - Beginning Balance 0 0 0 0 0 0 0 0 0 0 0
Fiscal Year Net ChangeTotal Recurring Revenue 0 0 0 0 0 0 0 0 0 0 0Total One-Time Revenue 58,000 0 0 0 0 0 0 0 0 0 0
Total Revenue Projection 58,000 0 0 0 0 0 0 0 0 0 0
Total Recurring Expenditures 0 0 0 0 0 0 0 0 0 0 0Total One-Time Expenditures 58,000 0 0 0 0 0 0 0 0 0 0
Total Expenditures Projection 58,000 0 0 0 0 0 0 0 0 0 0
Total CDBG-Capital FY Capital Surplus/Deficit 0 0 0 0 0 0 0 0 0 0 0
CDBG-Capital - Ending Balance (Capital) 0 0 0 0 0 0 0 0 0 0 0 Reserve Percentage (One-time) 0.00% 0.00% 0.00% 0.00% 0.00% 0.00% 0.00% 0.00% 0.00% 0.00% 0.00%
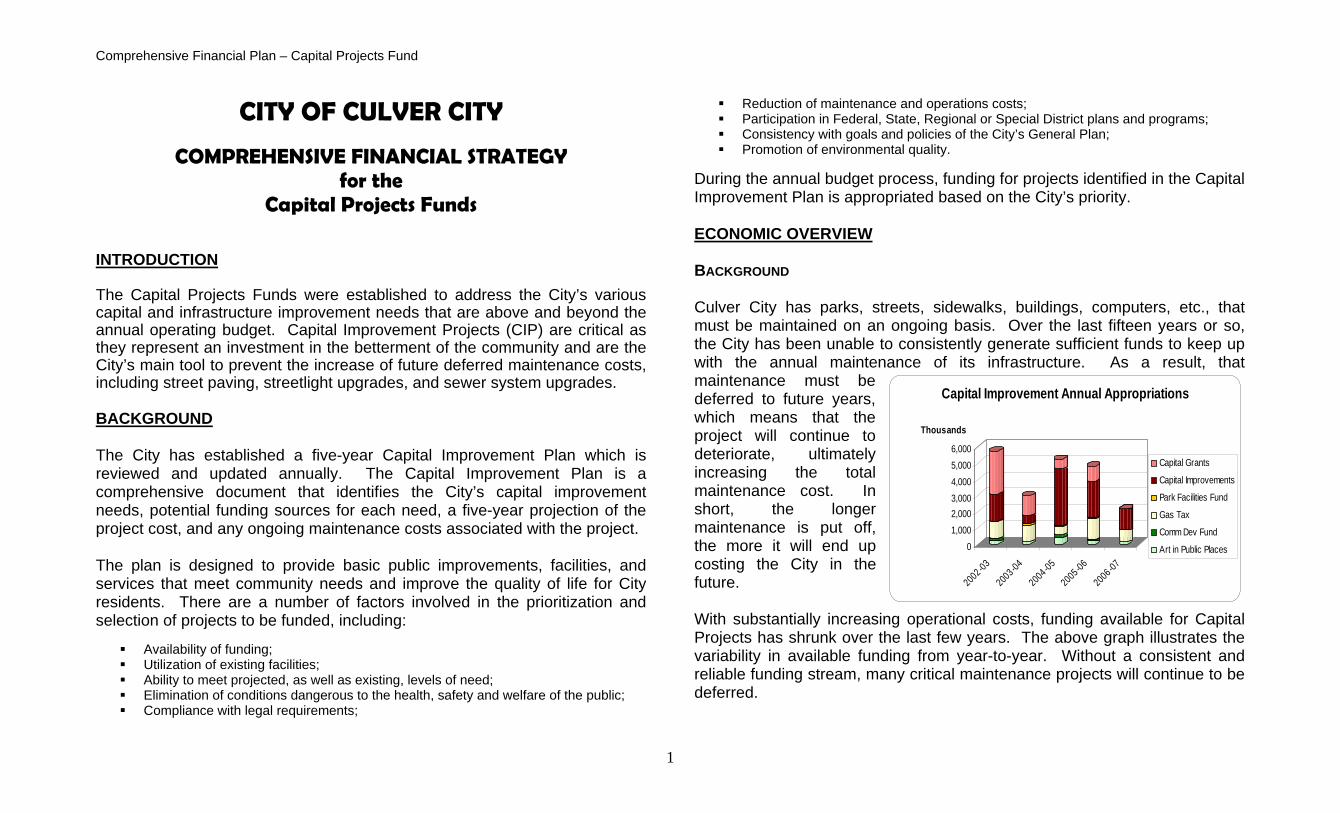
Comprehensive Financial Plan – Capital Projects Fund
1
01,0002,0003,0004,0005,0006,000
Thousands
2002 -032003 -042004 -052005 -062006 -07
Capital Improvement Annual Appropriations
Capital Grants
Capital Improvements
Park Facilities Fund
Gas Tax
Comm Dev Fund
Art in Public Places
CITY OF CULVER CITY
COMPREHENSIVE FINANCIAL STRATEGY for the
Capital Projects Funds INTRODUCTION The Capital Projects Funds were established to address the City’s various capital and infrastructure improvement needs that are above and beyond the annual operating budget. Capital Improvement Projects (CIP) are critical as they represent an investment in the betterment of the community and are the City’s main tool to prevent the increase of future deferred maintenance costs, including street paving, streetlight upgrades, and sewer system upgrades. BACKGROUND The City has established a five-year Capital Improvement Plan which is reviewed and updated annually. The Capital Improvement Plan is a comprehensive document that identifies the City’s capital improvement needs, potential funding sources for each need, a five-year projection of the project cost, and any ongoing maintenance costs associated with the project. The plan is designed to provide basic public improvements, facilities, and services that meet community needs and improve the quality of life for City residents. There are a number of factors involved in the prioritization and selection of projects to be funded, including:
Availability of funding; Utilization of existing facilities; Ability to meet projected, as well as existing, levels of need; Elimination of conditions dangerous to the health, safety and welfare of the public; Compliance with legal requirements;
Reduction of maintenance and operations costs; Participation in Federal, State, Regional or Special District plans and programs; Consistency with goals and policies of the City’s General Plan; Promotion of environmental quality.
During the annual budget process, funding for projects identified in the Capital Improvement Plan is appropriated based on the City’s priority. ECONOMIC OVERVIEW BACKGROUND Culver City has parks, streets, sidewalks, buildings, computers, etc., that must be maintained on an ongoing basis. Over the last fifteen years or so, the City has been unable to consistently generate sufficient funds to keep up with the annual maintenance of its infrastructure. As a result, that maintenance must be deferred to future years, which means that the project will continue to deteriorate, ultimately increasing the total maintenance cost. In short, the longer maintenance is put off, the more it will end up costing the City in the future. With substantially increasing operational costs, funding available for Capital Projects has shrunk over the last few years. The above graph illustrates the variability in available funding from year-to-year. Without a consistent and reliable funding stream, many critical maintenance projects will continue to be deferred.
Comprehensive Financial Plan – Capital Projects Fund
2
PROJECTIONS AND ANALYSIS OF REVENUES AND EXPENDITURES OVERVIEW Availability of funding for capital projects varies annually based on the financial condition of the General Fund. Often times, the City relies on one-time revenues received in previous fiscal years to fund capital projects. With no consistent funding stream, it is difficult to project how much funding will be available from year to year. At this time, only projects identified as high priority in the five-year Capital Improvement Plan are included. There is a facility assessment study being conducted that will identify the maintenance needs of most City building facilities over the next twelve (12) years. That study is expected to be completed over the next few months. Similarly, a park assessment study is underway and should be completed within the next year. Once the results of both of those studies have been finalized, they will be incorporated into the Comprehensive Financial Plan. Additionally, the City has identified a number of infrastructure maintenance needs and has begun to quantify those needs by developing the following:
♦ Pavement Management System ♦ Building Infrastructure Master Plan ♦ Computer Replacement Fund ♦ NPDES/TMDL – (A CIP project has been created for this program to act as a
funding source for mandated storm water cleanup issues, but the actual amount needed is still unknown at this point.
DISCUSSION OF REVENUE PROJECTIONS As mentioned above, one of the City’s greatest challenges has been to identify a steady revenue stream for capital projects. There are a number of other options for funding capital projects, including grant opportunities and issuing bonds. However, these options do not result in a stable, ongoing,
long term revenue stream for capital projects. One of the policy challenges that will need to be addressed in the upcoming years is how to establish a revenue stream that will support the large backlog of capital project needs and ensure that, in the future, the City is able to consistently fund all necessary capital projects in order to reduce the current identified maintenance and operating costs. CAPITAL GRANTS It is the City’s policy to apply for grants that are directed toward achieving and maximizing external financial resources while protecting the integrity of the City’s operating budget and long-term financial condition. When contemplating a grant application, the applying department must consider the fiscal impact and shall complete a financial analysis to measure the cost and benefit of the grant activity. If the cost of administering the proposed grant exceeds the grant amount or the matching requirement causes excessive burden on the City’s financial resources, or the grant funded project creates significant ongoing operating costs, the department should choose not to apply. Grant funds for capital projects are appropriated, in most cases, only after a signed contract with the granting agency is received and a copy is forwarded to the Budget & Finance Division. Once the money is appropriated, it is the responsible department’s obligation to ensure that all requirements and timelines set forth in the grant agreement are satisfied until the project is completed and all grant funds have been received. The department is also responsible for following the policies and procedures laid out in the City’s “Administrative Procedures for Grant Submission and Management.” The Budget & Finance Division is currently working with the City Treasurer’s Office to monitor the project activities and meet with the team quarterly for reimbursement tracking purposes.
Comprehensive Financial Plan – Capital Projects Fund
3
Federal and State Grants are an important source of funds that the City can use to leverage its own money and maximize the number of capital projects that can be funded in any given year. However, many grants have strict procedures that must be followed or the City risks not being able to collect funds once the project has been completed. Therefore, the City must be diligent in adhering to requirements of the grant agreement to ensure the most effective and efficient use of resources. The Community Development (New Development Impact) Fund receives its funding from fees collected on new non-residential development in excess of 5,000 square feet. These fees are used to finance street improvements, traffic controls and traffic management projects. Currently there is a small amount of funding available in this fund. It is difficult to forecast future funding since it depends on actual development. Appropriations for expenditures are not budgeted above available revenue. The Gas Tax Fund, also known as the Highway User’s Tax, is a dedicated funding source that is generated from the $0.18 state tax per gallon of gasoline, diesel, and use fuel. This amount was set by legislative action in the mid-1990’s, and has not changed since. Regardless of the price of a gallon of fuel, this amount stays the same. The City receives roughly about $750,000 per year in Gas Tax monies. While the City would like to receive increased funding in this category, it would take State legislative action in order to raise the tax per gallon amount. The Improvement & Acquisition (I & A) Fund is funded mainly by one-time and audited surplus monies in the General Fund. In the recent past, most of the funding has been from one-time monies. Also, developer fees or other specific one-time general CIP monies, such as monies from Playa Vista, have been used to fund specific projects related directly or in part to projects affecting or in relation to the developer or grantor.
In fiscal year 2006-07, the General Fund expects to pay for a significant amount of appropriation commitment from the prior year’s budget allocation. There were several projects that had not been completed and thus carried over to this fiscal year. There is approximately $2 million being appropriated for the development and building of the new Fire Station #3 in the Fox Hills area. One million dollars is anticipated to be received from the future sale of the three lots housing the existing Fire Station #3 on Segrell Way, and the other $1 million is a “loan” from the General Fund approved by the City Council. At the time the “loan” was approved, it was hoped that “grant” funding could be found to pay it back. Consequently, this $2 million may require General Fund funding. DISCUSSION OF EXPENDITURE PROJECTIONS As previously mentioned, funds were approved in fiscal 2005-06 to initiate an assessment of City-owned and maintained buildings as well as an assessment of parks and park facilities. The building assessment is under way and expected to be completed within the next few months. Once that assessment is completed, it will be incorporated into this financial plan. The Pavement Management Plan calculates the current backlog for street paving at approximately $19.4 million. This would bring the condition of the City’s streets up to an acceptable level. Approximately $2.5 million is needed in the coming fiscal year just to keep the backlog at the current level ($19.4 million). Currently, $1.0 million is appropriated for fiscal 2006-07. Also, per a ballot measure approved in November 2006, it is also anticipated that the City will receive approximately $1.3 million in additional funding for street purposes. This funding has not been included in the worksheets at this time. As with all deferred maintenance, the further in the future a street is repaired/repaved, the more it will cost.
Comprehensive Financial Plan – Capital Projects Fund
4
In fiscal 2005-06, the City started the process of setting aside funds for pavement, slurry seal, and computer/technology replacement. This was accomplished by using one-time funds from new development activities in the General Fund. Currently, there is no dedicated revenue stream for these activities; therefore, the City will need to rely on available one-time monies to continue funding these items. A policy is being proposed to address this issue, and is included in the list of draft policies for Council review and approval. One of the largest capital project expenses facing the City is related to State-mandated cleanup of pollutants resulting from stormwater and urban runoff, specifically those that enter Ballona Creek and empty into Santa Monica Bay. This cleanup effort is an unfunded mandate by the State. The City’s National Pollutant Discharge Elimination System (NPDES) program was established to support the implementation of the Los Angeles County Municipal Stormwater NPDES Permit, and to comply with federal and state environmental (surface water quality) laws. This program covers all stormwater (and urban runoff) pollution prevention and mitigation issues including the stormwater plan check reviews, public outreach, commercial and industrial stormwater inspections, attending meetings, providing staff training, responding to complaints, applying for and managing grants, and managing the Transportation Yard and Transfer Station’s General Industrial Stormwater NPDES Permits. In-house staff was hired at the beginning of 2005 to manage the NPDES/Stormwater Program. The stormwater program manager oversees all of the stormwater issues within the City, including the public facilities, construction sites, businesses, and residential areas. With the adoption of total maximum daily loads (TMDLs) (surface water quality limits with strict quantitative limitations), all the municipalities in Los Angeles County (and across the state) are facing a situation where they may incur millions of dollars in financial obligations to satisfy the regulations over the coming
decade. Beginning in 2005-06, the City is setting aside funds in the Capital Improvement Plan to address NPDES issues. More funds will need to be set-aside in order to meet the growing costs of this mandate. The Art Fund is a dedicated funding source, and among other things is for the design, acquisition, commission, installation, improvement, maintenance and insurance of an art work; the sponsoring and/or support of performing arts; and for the acquisition and improvement of real property for the purpose of displaying art work. The Art Fund currently has a healthy reserve and receives its funding from developers who elect to give the City 1% of their development/construction costs rather than install artwork themselves. Depending on the scope of a project, this can amount to a large sum. In the near future, anticipated expenditures are well within the level of available and expected revenues. Each year this is evaluated to ensure that funding is available for the proposed projects and administrative costs. As mentioned previously in the revenue section, Gas Tax funding can only be used for street and road related purposes. This includes street and traffic light projects. Currently the City utilizes almost the full amount of funding received each year for Capital Projects, and also transfers a portion to the General Fund to pay for street related operating expenses. This funding has also been used as a matching source of funding for grants. It is not anticipated the City will receive a larger amount of revenue from this source, which would be dependent on a State legislative action. Parks Facility Funding is received by the City from developments that do not include “green space” as part of the development. This funding source has not been a large source of revenue for the City in many years, and is used specifically on Park projects, such as park rehabilitation and improvements. When available, this funding has also been used as a matching source for grants awarded to the City. Currently, budgeted and projected expenditures do not exceed the available revenue amount.
Comprehensive Financial Plan – Capital Projects Fund
5
The Improvement and Acquisition (I & A) Fund funds projects that are general or administrative in use. The available funding has been limited in previous years, and is mainly received from audited surpluses and one-time monies from the General Fund. The Parking Fund receives its funding from meter monies and filming permits. A portion of this funding is transferred into the General Fund to cover parking and street related costs as part of General Fund operation. This funding has also been used for capital projects related to installation of parking meters.
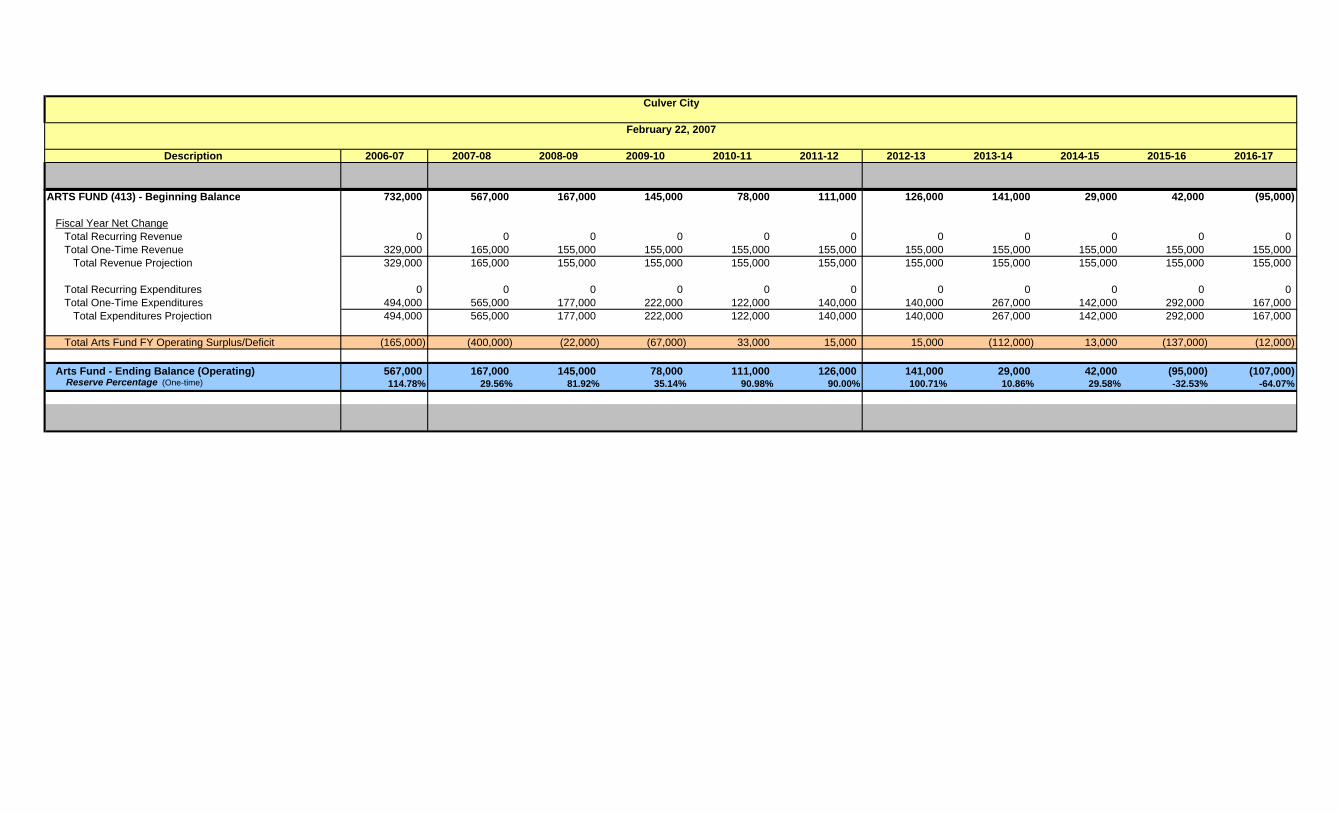
Description 2006-07 2007-08 2008-09 2009-10 2010-11 2011-12 2012-13 2013-14 2014-15 2015-16 2016-17
Culver City
February 22, 2007
ARTS FUND (413) - Beginning Balance 732,000 567,000 167,000 145,000 78,000 111,000 126,000 141,000 29,000 42,000 (95,000)
Fiscal Year Net ChangeTotal Recurring Revenue 0 0 0 0 0 0 0 0 0 0 0Total One-Time Revenue 329,000 165,000 155,000 155,000 155,000 155,000 155,000 155,000 155,000 155,000 155,000
Total Revenue Projection 329,000 165,000 155,000 155,000 155,000 155,000 155,000 155,000 155,000 155,000 155,000
Total Recurring Expenditures 0 0 0 0 0 0 0 0 0 0 0Total One-Time Expenditures 494,000 565,000 177,000 222,000 122,000 140,000 140,000 267,000 142,000 292,000 167,000
Total Expenditures Projection 494,000 565,000 177,000 222,000 122,000 140,000 140,000 267,000 142,000 292,000 167,000
Total Arts Fund FY Operating Surplus/Deficit (165,000) (400,000) (22,000) (67,000) 33,000 15,000 15,000 (112,000) 13,000 (137,000) (12,000)
Arts Fund - Ending Balance (Operating) 567,000 167,000 145,000 78,000 111,000 126,000 141,000 29,000 42,000 (95,000) (107,000) Reserve Percentage (One-time) 114.78% 29.56% 81.92% 35.14% 90.98% 90.00% 100.71% 10.86% 29.58% -32.53% -64.07%
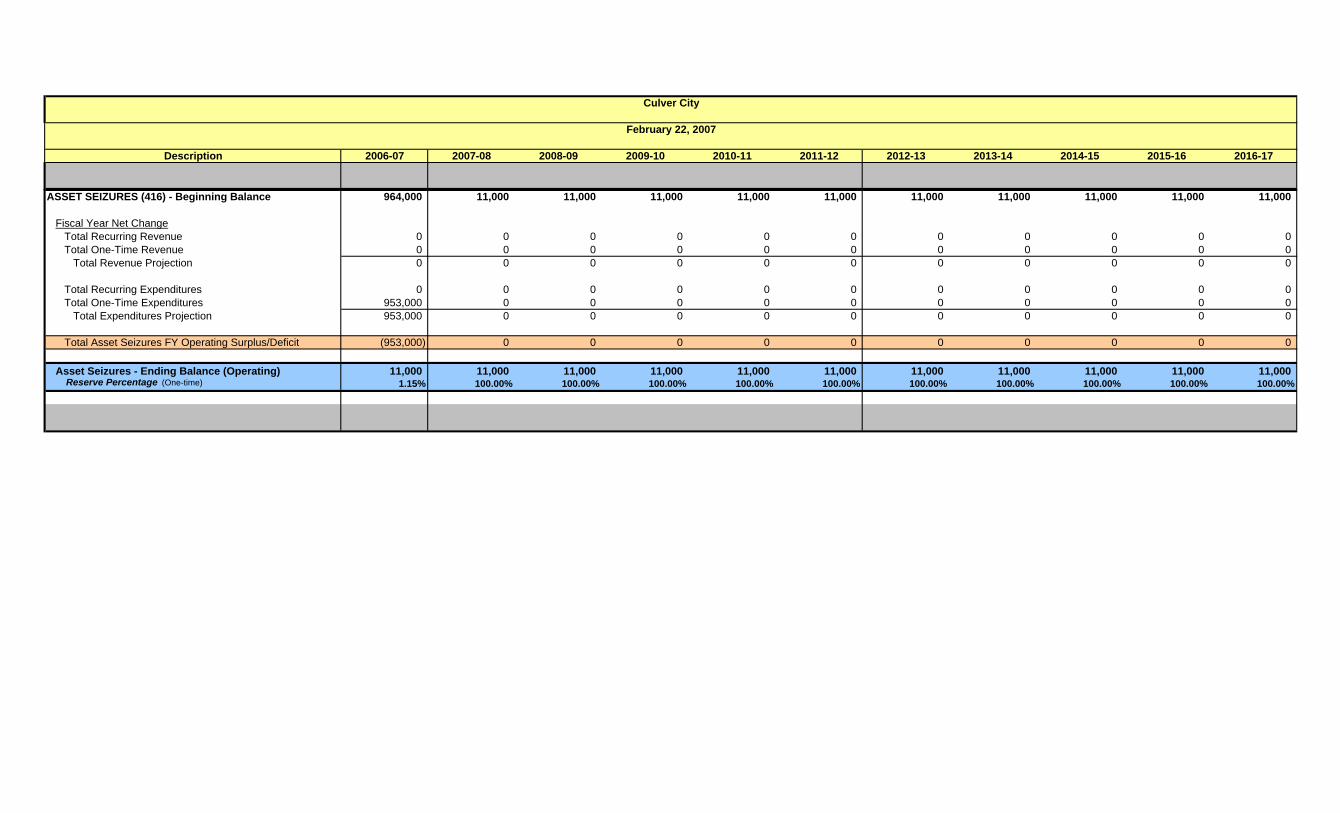
Description 2006-07 2007-08 2008-09 2009-10 2010-11 2011-12 2012-13 2013-14 2014-15 2015-16 2016-17
Culver City
February 22, 2007
ASSET SEIZURES (416) - Beginning Balance 964,000 11,000 11,000 11,000 11,000 11,000 11,000 11,000 11,000 11,000 11,000
Fiscal Year Net ChangeTotal Recurring Revenue 0 0 0 0 0 0 0 0 0 0 0Total One-Time Revenue 0 0 0 0 0 0 0 0 0 0 0
Total Revenue Projection 0 0 0 0 0 0 0 0 0 0 0
Total Recurring Expenditures 0 0 0 0 0 0 0 0 0 0 0Total One-Time Expenditures 953,000 0 0 0 0 0 0 0 0 0 0
Total Expenditures Projection 953,000 0 0 0 0 0 0 0 0 0 0
Total Asset Seizures FY Operating Surplus/Deficit (953,000) 0 0 0 0 0 0 0 0 0 0
Asset Seizures - Ending Balance (Operating) 11,000 11,000 11,000 11,000 11,000 11,000 11,000 11,000 11,000 11,000 11,000 Reserve Percentage (One-time) 1.15% 100.00% 100.00% 100.00% 100.00% 100.00% 100.00% 100.00% 100.00% 100.00% 100.00%
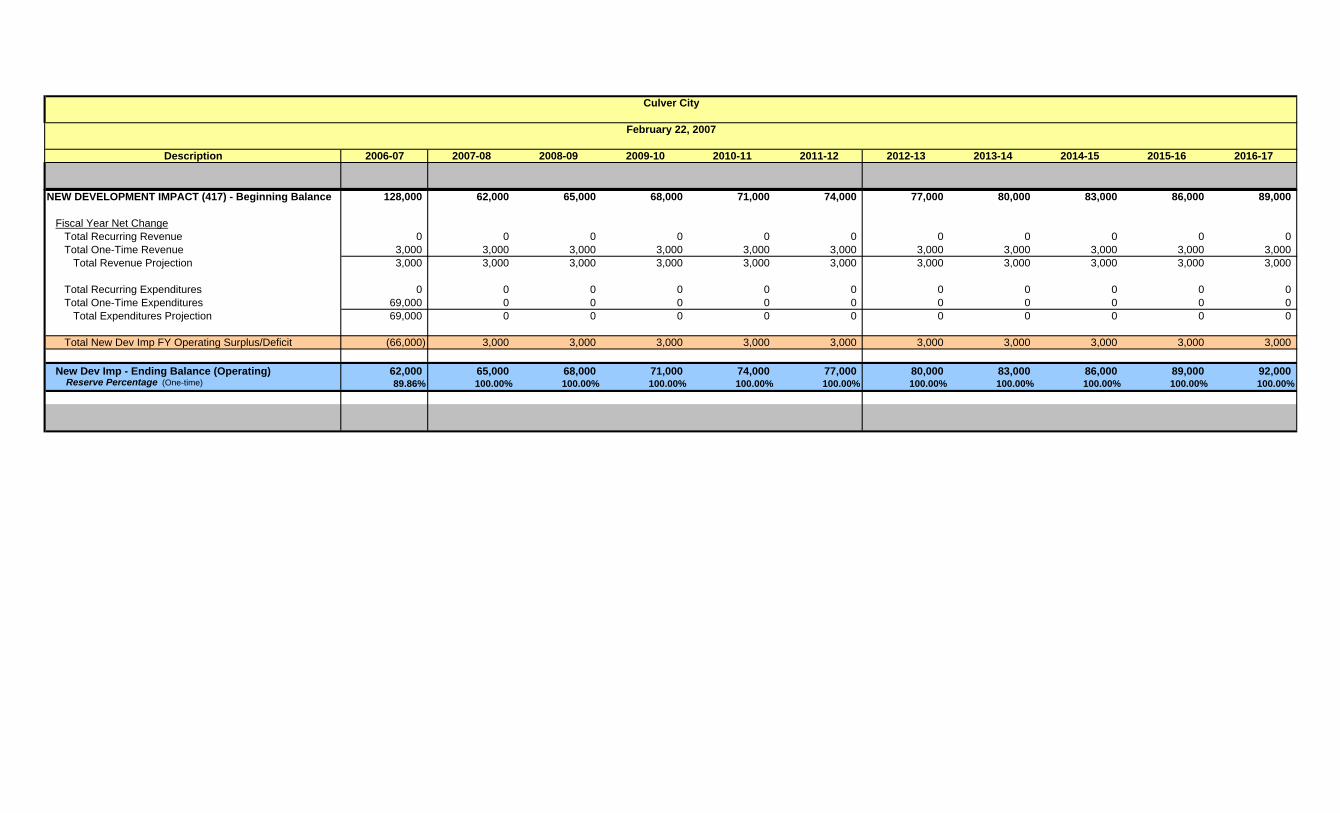
Description 2006-07 2007-08 2008-09 2009-10 2010-11 2011-12 2012-13 2013-14 2014-15 2015-16 2016-17
Culver City
February 22, 2007
NEW DEVELOPMENT IMPACT (417) - Beginning Balance 128,000 62,000 65,000 68,000 71,000 74,000 77,000 80,000 83,000 86,000 89,000
Fiscal Year Net ChangeTotal Recurring Revenue 0 0 0 0 0 0 0 0 0 0 0Total One-Time Revenue 3,000 3,000 3,000 3,000 3,000 3,000 3,000 3,000 3,000 3,000 3,000
Total Revenue Projection 3,000 3,000 3,000 3,000 3,000 3,000 3,000 3,000 3,000 3,000 3,000
Total Recurring Expenditures 0 0 0 0 0 0 0 0 0 0 0Total One-Time Expenditures 69,000 0 0 0 0 0 0 0 0 0 0
Total Expenditures Projection 69,000 0 0 0 0 0 0 0 0 0 0
Total New Dev Imp FY Operating Surplus/Deficit (66,000) 3,000 3,000 3,000 3,000 3,000 3,000 3,000 3,000 3,000 3,000
New Dev Imp - Ending Balance (Operating) 62,000 65,000 68,000 71,000 74,000 77,000 80,000 83,000 86,000 89,000 92,000 Reserve Percentage (One-time) 89.86% 100.00% 100.00% 100.00% 100.00% 100.00% 100.00% 100.00% 100.00% 100.00% 100.00%
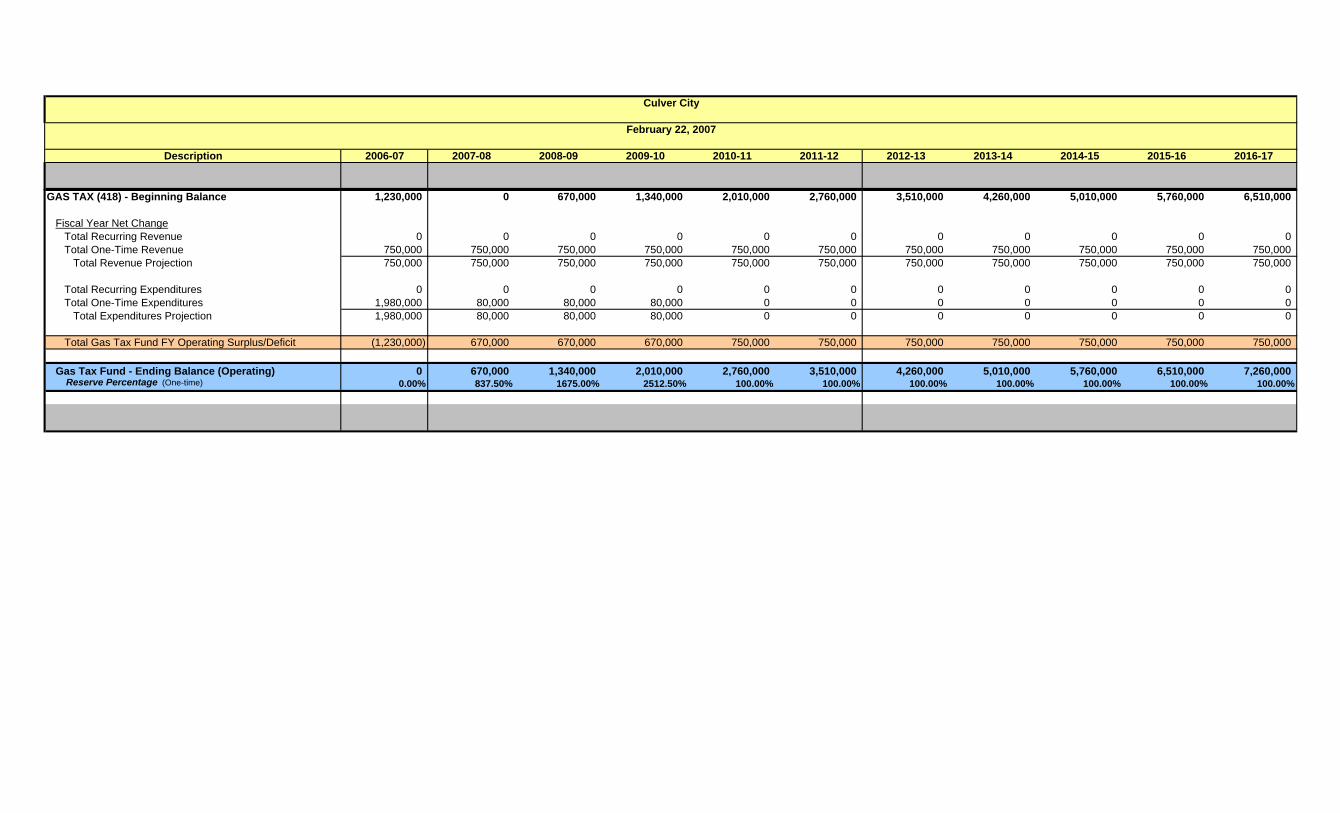
Description 2006-07 2007-08 2008-09 2009-10 2010-11 2011-12 2012-13 2013-14 2014-15 2015-16 2016-17
Culver City
February 22, 2007
GAS TAX (418) - Beginning Balance 1,230,000 0 670,000 1,340,000 2,010,000 2,760,000 3,510,000 4,260,000 5,010,000 5,760,000 6,510,000
Fiscal Year Net ChangeTotal Recurring Revenue 0 0 0 0 0 0 0 0 0 0 0Total One-Time Revenue 750,000 750,000 750,000 750,000 750,000 750,000 750,000 750,000 750,000 750,000 750,000
Total Revenue Projection 750,000 750,000 750,000 750,000 750,000 750,000 750,000 750,000 750,000 750,000 750,000
Total Recurring Expenditures 0 0 0 0 0 0 0 0 0 0 0Total One-Time Expenditures 1,980,000 80,000 80,000 80,000 0 0 0 0 0 0 0
Total Expenditures Projection 1,980,000 80,000 80,000 80,000 0 0 0 0 0 0 0
Total Gas Tax Fund FY Operating Surplus/Deficit (1,230,000) 670,000 670,000 670,000 750,000 750,000 750,000 750,000 750,000 750,000 750,000
Gas Tax Fund - Ending Balance (Operating) 0 670,000 1,340,000 2,010,000 2,760,000 3,510,000 4,260,000 5,010,000 5,760,000 6,510,000 7,260,000 Reserve Percentage (One-time) 0.00% 837.50% 1675.00% 2512.50% 100.00% 100.00% 100.00% 100.00% 100.00% 100.00% 100.00%
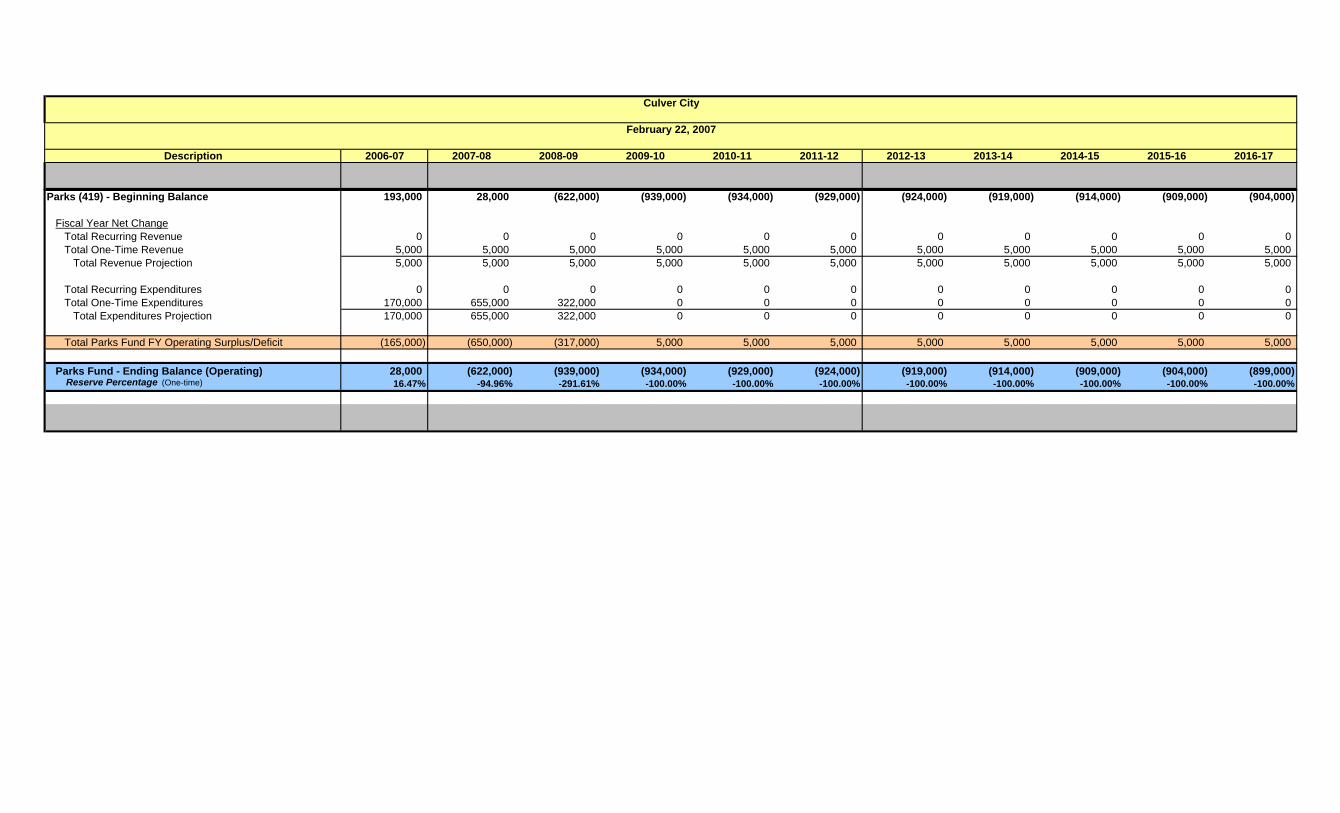
Description 2006-07 2007-08 2008-09 2009-10 2010-11 2011-12 2012-13 2013-14 2014-15 2015-16 2016-17
Culver City
February 22, 2007
Parks (419) - Beginning Balance 193,000 28,000 (622,000) (939,000) (934,000) (929,000) (924,000) (919,000) (914,000) (909,000) (904,000)
Fiscal Year Net ChangeTotal Recurring Revenue 0 0 0 0 0 0 0 0 0 0 0Total One-Time Revenue 5,000 5,000 5,000 5,000 5,000 5,000 5,000 5,000 5,000 5,000 5,000
Total Revenue Projection 5,000 5,000 5,000 5,000 5,000 5,000 5,000 5,000 5,000 5,000 5,000
Total Recurring Expenditures 0 0 0 0 0 0 0 0 0 0 0Total One-Time Expenditures 170,000 655,000 322,000 0 0 0 0 0 0 0 0
Total Expenditures Projection 170,000 655,000 322,000 0 0 0 0 0 0 0 0
Total Parks Fund FY Operating Surplus/Deficit (165,000) (650,000) (317,000) 5,000 5,000 5,000 5,000 5,000 5,000 5,000 5,000
Parks Fund - Ending Balance (Operating) 28,000 (622,000) (939,000) (934,000) (929,000) (924,000) (919,000) (914,000) (909,000) (904,000) (899,000) Reserve Percentage (One-time) 16.47% -94.96% -291.61% -100.00% -100.00% -100.00% -100.00% -100.00% -100.00% -100.00% -100.00%
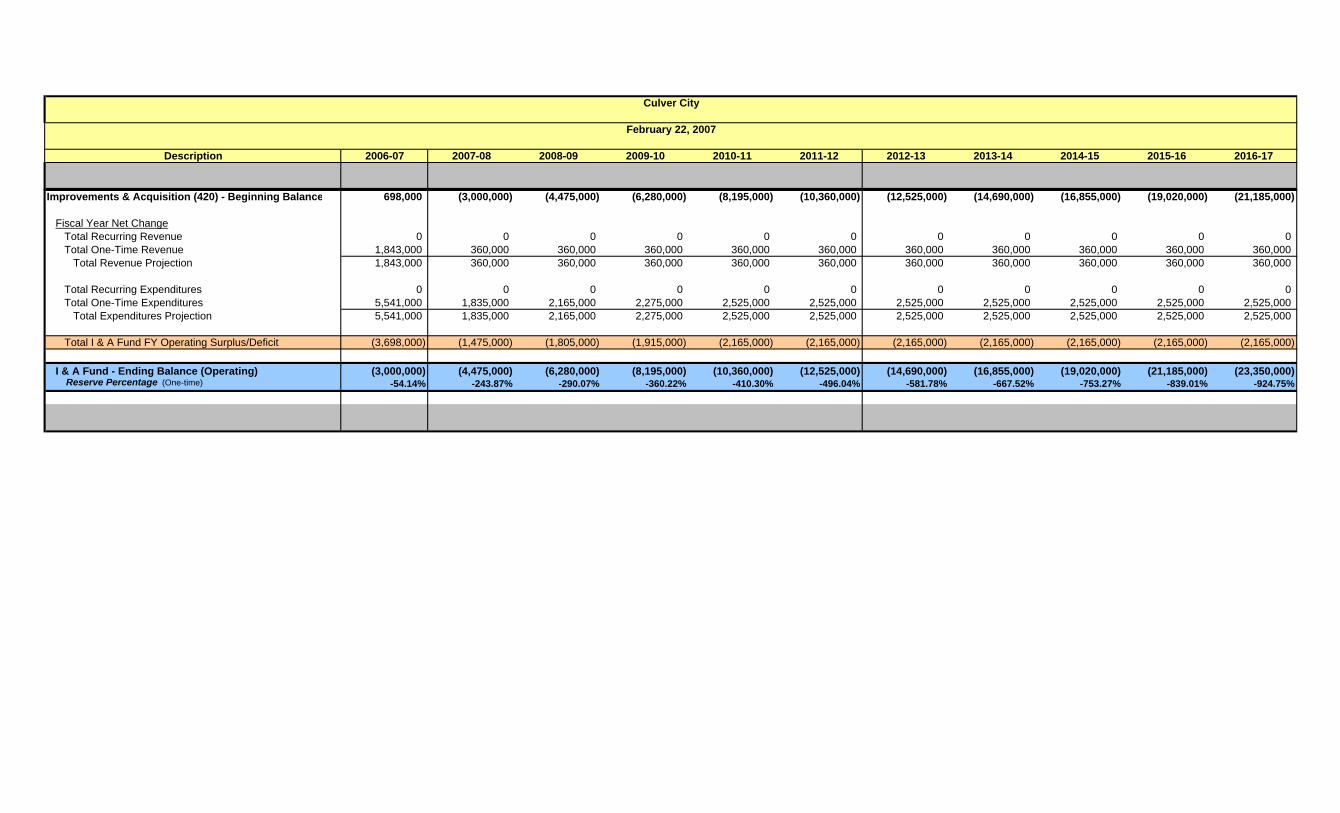
Description 2006-07 2007-08 2008-09 2009-10 2010-11 2011-12 2012-13 2013-14 2014-15 2015-16 2016-17
Culver City
February 22, 2007
Improvements & Acquisition (420) - Beginning Balance 698,000 (3,000,000) (4,475,000) (6,280,000) (8,195,000) (10,360,000) (12,525,000) (14,690,000) (16,855,000) (19,020,000) (21,185,000)
Fiscal Year Net ChangeTotal Recurring Revenue 0 0 0 0 0 0 0 0 0 0 0Total One-Time Revenue 1,843,000 360,000 360,000 360,000 360,000 360,000 360,000 360,000 360,000 360,000 360,000
Total Revenue Projection 1,843,000 360,000 360,000 360,000 360,000 360,000 360,000 360,000 360,000 360,000 360,000
Total Recurring Expenditures 0 0 0 0 0 0 0 0 0 0 0Total One-Time Expenditures 5,541,000 1,835,000 2,165,000 2,275,000 2,525,000 2,525,000 2,525,000 2,525,000 2,525,000 2,525,000 2,525,000
Total Expenditures Projection 5,541,000 1,835,000 2,165,000 2,275,000 2,525,000 2,525,000 2,525,000 2,525,000 2,525,000 2,525,000 2,525,000
Total I & A Fund FY Operating Surplus/Deficit (3,698,000) (1,475,000) (1,805,000) (1,915,000) (2,165,000) (2,165,000) (2,165,000) (2,165,000) (2,165,000) (2,165,000) (2,165,000)
I & A Fund - Ending Balance (Operating) (3,000,000) (4,475,000) (6,280,000) (8,195,000) (10,360,000) (12,525,000) (14,690,000) (16,855,000) (19,020,000) (21,185,000) (23,350,000) Reserve Percentage (One-time) -54.14% -243.87% -290.07% -360.22% -410.30% -496.04% -581.78% -667.52% -753.27% -839.01% -924.75%
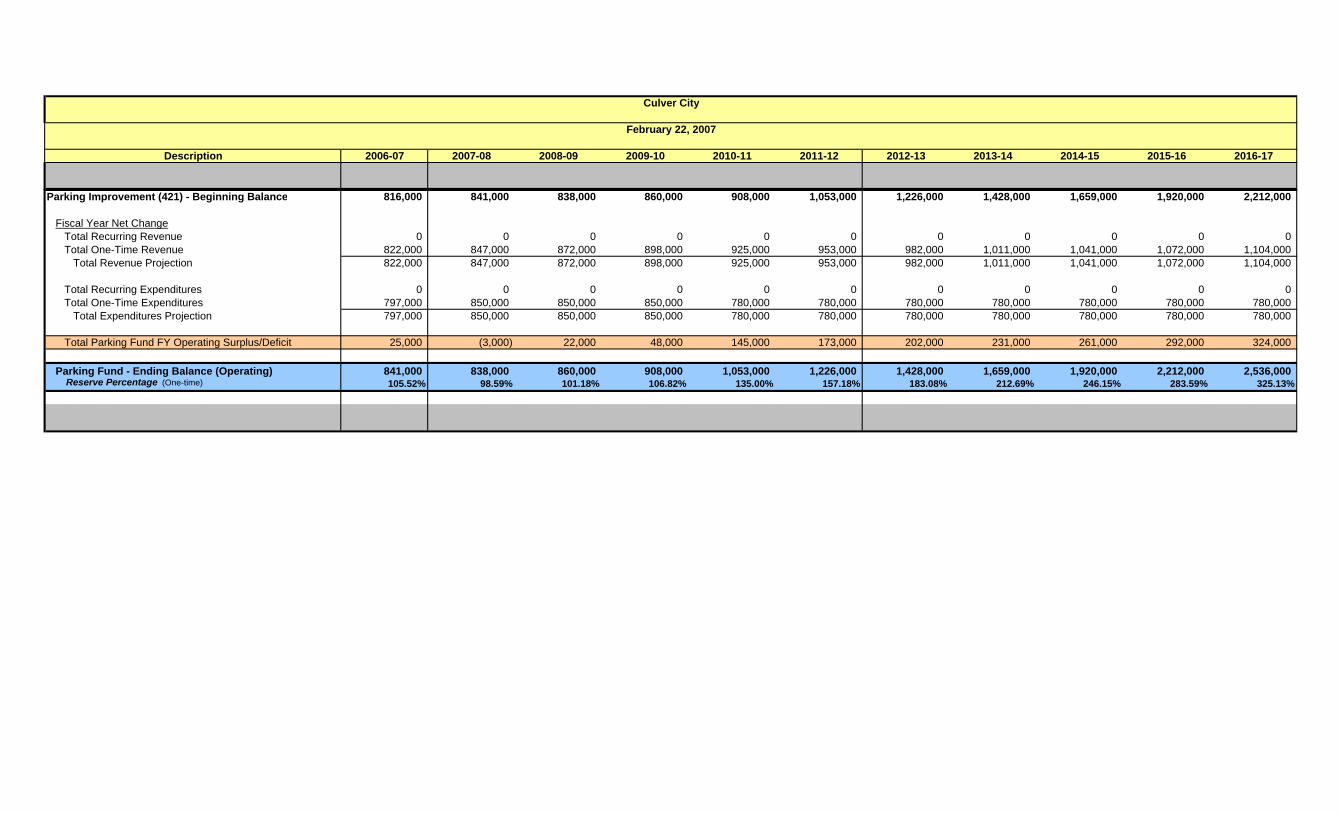
Description 2006-07 2007-08 2008-09 2009-10 2010-11 2011-12 2012-13 2013-14 2014-15 2015-16 2016-17
Culver City
February 22, 2007
Parking Improvement (421) - Beginning Balance 816,000 841,000 838,000 860,000 908,000 1,053,000 1,226,000 1,428,000 1,659,000 1,920,000 2,212,000
Fiscal Year Net ChangeTotal Recurring Revenue 0 0 0 0 0 0 0 0 0 0 0Total One-Time Revenue 822,000 847,000 872,000 898,000 925,000 953,000 982,000 1,011,000 1,041,000 1,072,000 1,104,000
Total Revenue Projection 822,000 847,000 872,000 898,000 925,000 953,000 982,000 1,011,000 1,041,000 1,072,000 1,104,000
Total Recurring Expenditures 0 0 0 0 0 0 0 0 0 0 0Total One-Time Expenditures 797,000 850,000 850,000 850,000 780,000 780,000 780,000 780,000 780,000 780,000 780,000
Total Expenditures Projection 797,000 850,000 850,000 850,000 780,000 780,000 780,000 780,000 780,000 780,000 780,000
Total Parking Fund FY Operating Surplus/Deficit 25,000 (3,000) 22,000 48,000 145,000 173,000 202,000 231,000 261,000 292,000 324,000
Parking Fund - Ending Balance (Operating) 841,000 838,000 860,000 908,000 1,053,000 1,226,000 1,428,000 1,659,000 1,920,000 2,212,000 2,536,000 Reserve Percentage (One-time) 105.52% 98.59% 101.18% 106.82% 135.00% 157.18% 183.08% 212.69% 246.15% 283.59% 325.13%
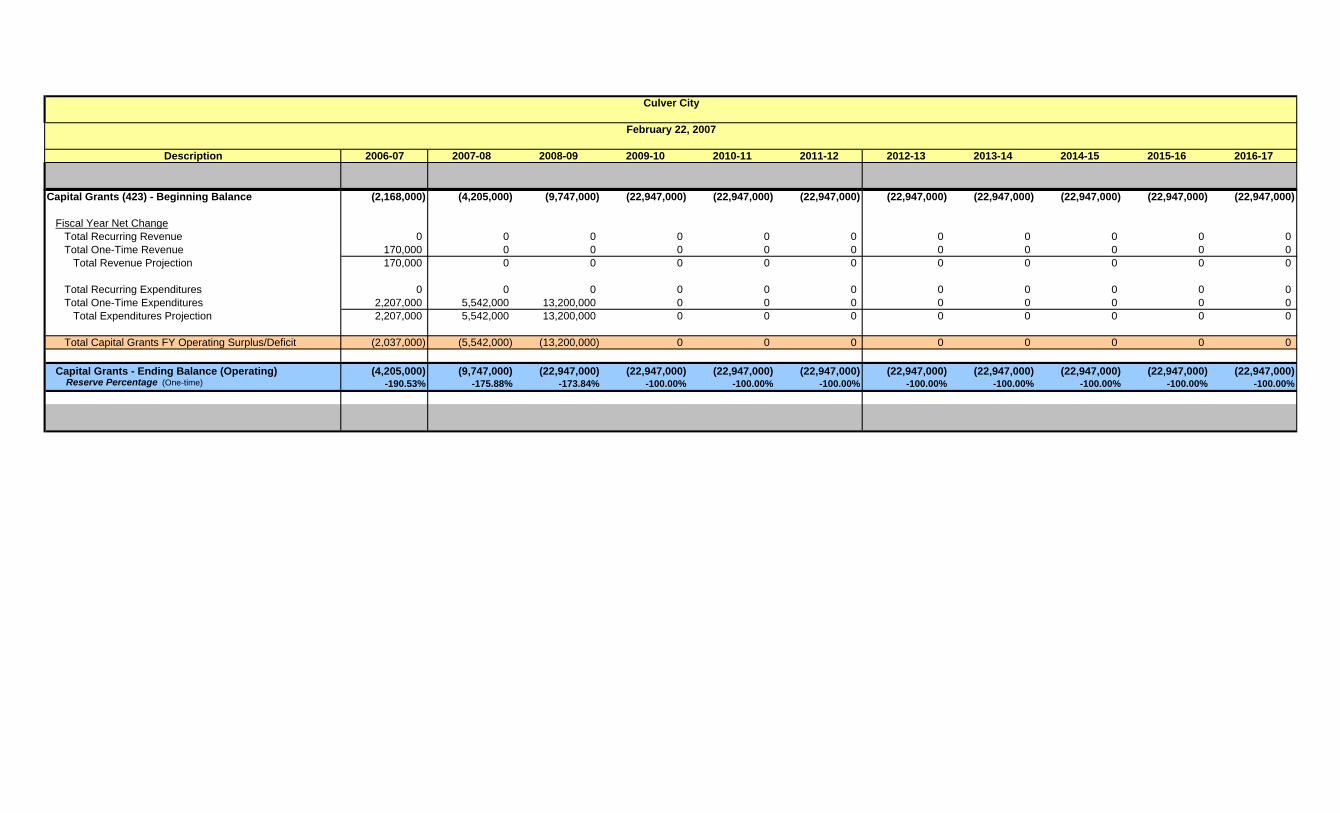
Description 2006-07 2007-08 2008-09 2009-10 2010-11 2011-12 2012-13 2013-14 2014-15 2015-16 2016-17
Culver City
February 22, 2007
Capital Grants (423) - Beginning Balance (2,168,000) (4,205,000) (9,747,000) (22,947,000) (22,947,000) (22,947,000) (22,947,000) (22,947,000) (22,947,000) (22,947,000) (22,947,000)
Fiscal Year Net ChangeTotal Recurring Revenue 0 0 0 0 0 0 0 0 0 0 0Total One-Time Revenue 170,000 0 0 0 0 0 0 0 0 0 0
Total Revenue Projection 170,000 0 0 0 0 0 0 0 0 0 0
Total Recurring Expenditures 0 0 0 0 0 0 0 0 0 0 0Total One-Time Expenditures 2,207,000 5,542,000 13,200,000 0 0 0 0 0 0 0 0
Total Expenditures Projection 2,207,000 5,542,000 13,200,000 0 0 0 0 0 0 0 0
Total Capital Grants FY Operating Surplus/Deficit (2,037,000) (5,542,000) (13,200,000) 0 0 0 0 0 0 0 0
Capital Grants - Ending Balance (Operating) (4,205,000) (9,747,000) (22,947,000) (22,947,000) (22,947,000) (22,947,000) (22,947,000) (22,947,000) (22,947,000) (22,947,000) (22,947,000) Reserve Percentage (One-time) -190.53% -175.88% -173.84% -100.00% -100.00% -100.00% -100.00% -100.00% -100.00% -100.00% -100.00%
1
0100200300400500600700
T ho usand s
2003 -04
2004 -05
2005 -06
2006 -07
Estimated Prop A & C Allocations for Culver City
Prop A Prop C
CITY OF CULVER CITY
COMPREHENSIVE FINANCIAL STRATEGY for the
Proposition A & C Funds INTRODUCTION Proposition A & C Funds are both voter approved local sales taxes for transportation-related activities. Proposition A, approved by voters in 1980, is a one-half of 1% tax on retail sales in Los Angeles County. The collection of this tax is administered by the County, which returns 25% of the collections to cities within the County. The balance of Proposition A tax funds are used for rail development (35%) and discretionary purposes (40%). Almost the entire discretionary portion is used to fund bus serviced provided by Metro and 16 other municipal bus operators within the County. Proposition C sales tax, approved by voters in 1990, is an additional one-half of 1% tax on retail sales in Los Angeles County. The balance of Prop C tax funds are allocated to the construction and operation of the bus transit and rail system (40%), expansion of rail and bus security (5%), construction of commuter rail transit centers, park and ride lots, and freeway bus stops (10%), and other transit-related improvements to freeways and state highways (25%). Each year, more than $1 billion is generated in local transportation revenue. BACKGROUND As a condition of voter approval, twenty-five percent of the Proposition A tax revenues and twenty percent of the Proposition C tax revenues are
earmarked for the Local Return Programs to be used by cities and the County of Los Angeles in developing and/or improving local public transit, paratransit and related transportation infrastructure. Local Return funds are allocated and distributed monthly to jurisdictions on a "per capita" basis by Metro. Most of these funds are expended on street improvement projects and maintenance and improvement to the Transportation facility. Additionally, Culver City is eligible to receive additional Prop A and C funds because it operates its own bus line. Most of the additional money is used for Transportation Department operations. ECONOMIC OVERVIEW Per voter approval, a portion of Prop A and C money is distributed to cities based on population; therefore, both of those funding sources are relatively stable. Any attempt to alter these funding sources would need voter approval. Given the current state of transportation in California, especially Southern California, it seems unlikely that voters would choose to reduce funding for transportation related projects in the near future. However, since Prop A and C are both sales taxes, they are economically sensitive. Although sales taxes are economically sensitive, the diversity of the Los Angeles County economy makes Prop A and C taxes less subject to large annual swings in collections. Some communities may experience a decrease

2
0200400600800
1,0001,2001,400
T ho usand s
2001
-02
2002
-03
2003
-04
2004
-05
2005
-06
Prop A & C Annual Expenditures
Prop A Prop C
in sales tax while others experience an increase. Overall, the Los Angeles County economy is relatively robust, which helps to create an environment for a relatively stable funding source in Prop A and C sales tax receipts. A more in-depth economic outlook for sales tax is included in the “Economic Overview” section of the General Fund’s Comprehensive Financial Strategy. PROJECTIONS AND ANALYSIS OF EXPENDITURES OVERVIEW Since Prop A & C are sales taxes, those funding sources are projected to be similar to the City’s sales tax projections over the next ten years (i.e. approximately 4% per year). The graph below shows the annual Prop A & Prop C expenditures for the past five years. Prop A & C funds may be carried over if the entire amount received is not expended in the same fiscal year. As a result, there are some peaks and valleys in short term expenditures. However, over the long term, these peaks and valleys average out.
The projections in the Comprehensive Financial Plan assume that all Prop A & C monies received will be spent. Consequently, over the ten year projection, revenues are equal to expenditures. As previously mentioned, Prop A & C receipts are projected to increase commensurate with
the City’s sales tax receipts (approximately 4%). Therefore, Prop A & C expenditures are projected to increase at a 4% rate as well.
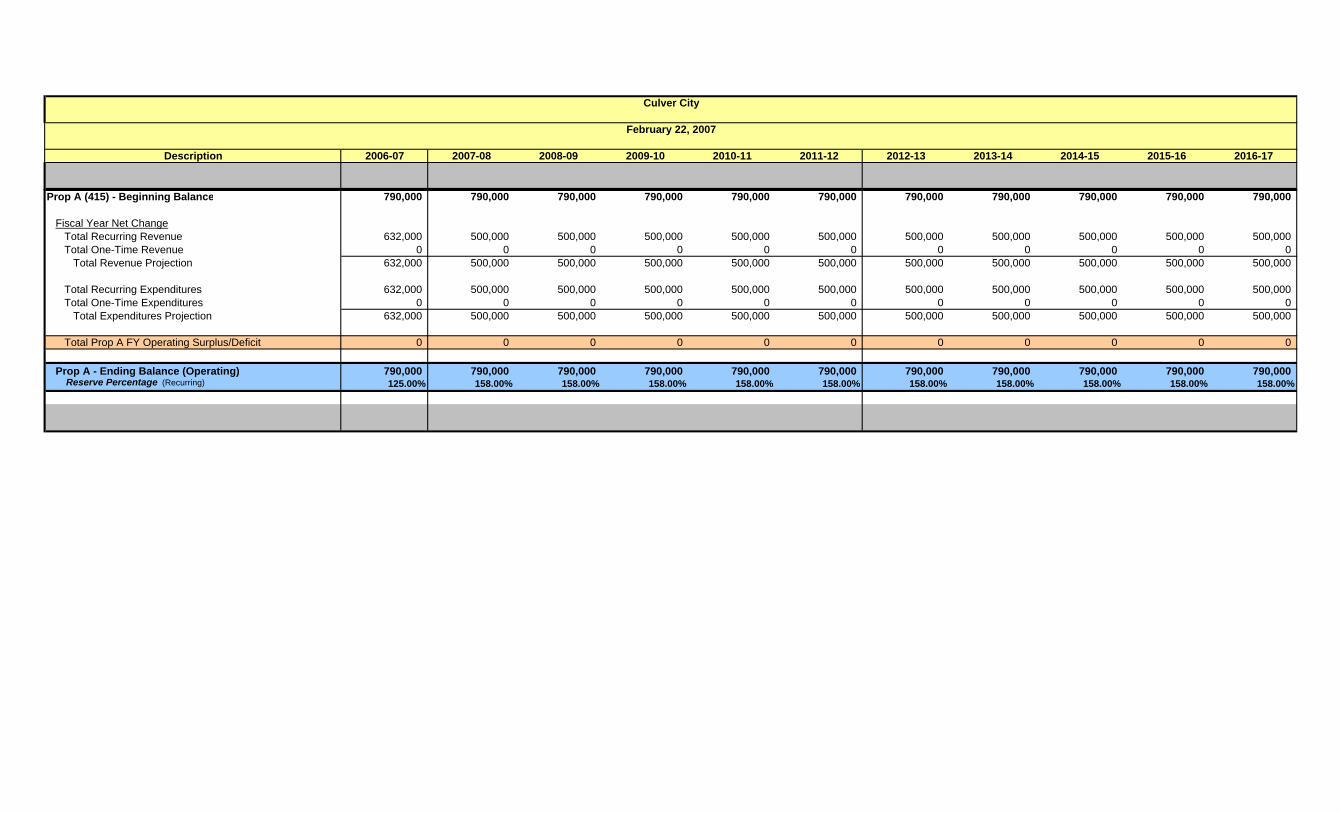
Description 2006-07 2007-08 2008-09 2009-10 2010-11 2011-12 2012-13 2013-14 2014-15 2015-16 2016-17
Culver City
February 22, 2007
Prop A (415) - Beginning Balance 790,000 790,000 790,000 790,000 790,000 790,000 790,000 790,000 790,000 790,000 790,000
Fiscal Year Net ChangeTotal Recurring Revenue 632,000 500,000 500,000 500,000 500,000 500,000 500,000 500,000 500,000 500,000 500,000Total One-Time Revenue 0 0 0 0 0 0 0 0 0 0 0
Total Revenue Projection 632,000 500,000 500,000 500,000 500,000 500,000 500,000 500,000 500,000 500,000 500,000
Total Recurring Expenditures 632,000 500,000 500,000 500,000 500,000 500,000 500,000 500,000 500,000 500,000 500,000Total One-Time Expenditures 0 0 0 0 0 0 0 0 0 0 0
Total Expenditures Projection 632,000 500,000 500,000 500,000 500,000 500,000 500,000 500,000 500,000 500,000 500,000
Total Prop A FY Operating Surplus/Deficit 0 0 0 0 0 0 0 0 0 0 0
Prop A - Ending Balance (Operating) 790,000 790,000 790,000 790,000 790,000 790,000 790,000 790,000 790,000 790,000 790,000 Reserve Percentage (Recurring) 125.00% 158.00% 158.00% 158.00% 158.00% 158.00% 158.00% 158.00% 158.00% 158.00% 158.00%
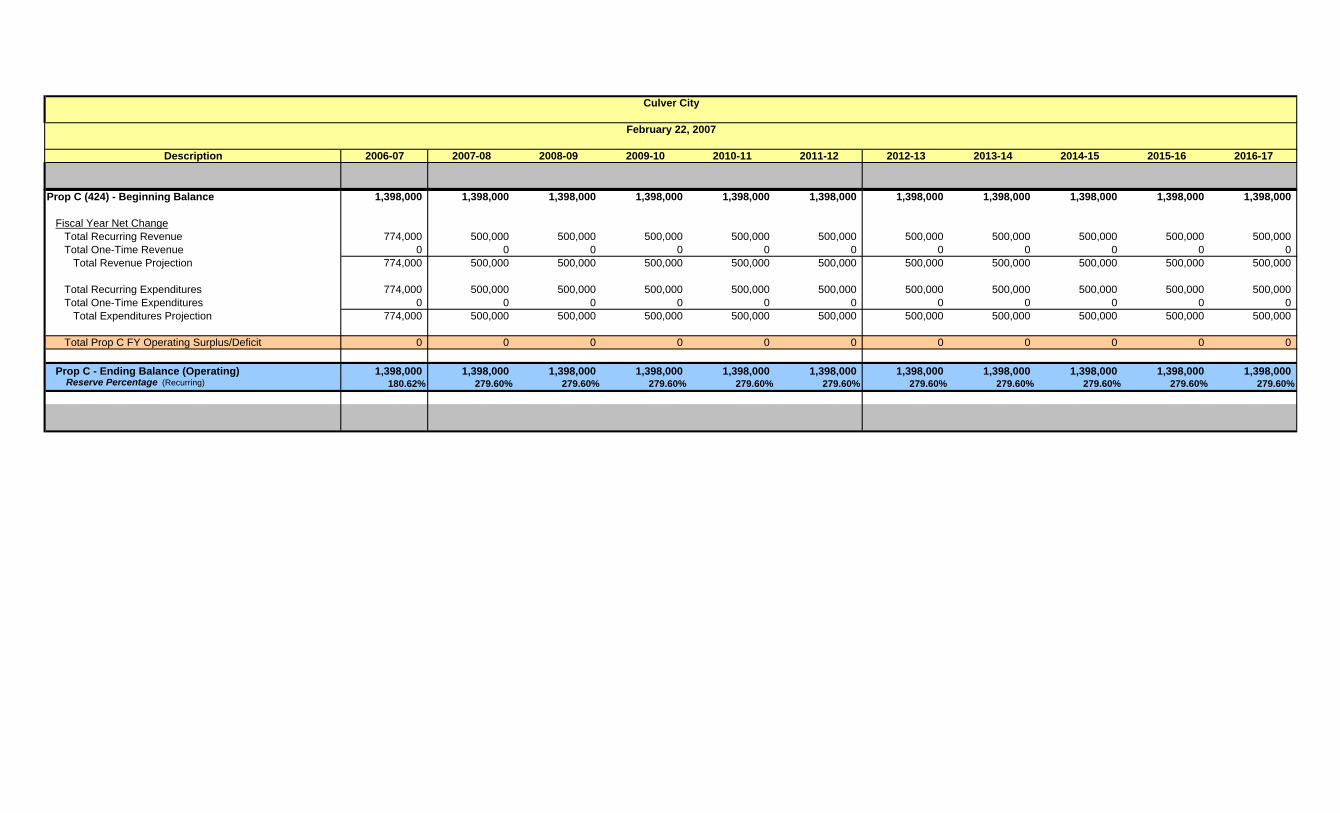
Description 2006-07 2007-08 2008-09 2009-10 2010-11 2011-12 2012-13 2013-14 2014-15 2015-16 2016-17
Culver City
February 22, 2007
Prop C (424) - Beginning Balance 1,398,000 1,398,000 1,398,000 1,398,000 1,398,000 1,398,000 1,398,000 1,398,000 1,398,000 1,398,000 1,398,000
Fiscal Year Net ChangeTotal Recurring Revenue 774,000 500,000 500,000 500,000 500,000 500,000 500,000 500,000 500,000 500,000 500,000Total One-Time Revenue 0 0 0 0 0 0 0 0 0 0 0
Total Revenue Projection 774,000 500,000 500,000 500,000 500,000 500,000 500,000 500,000 500,000 500,000 500,000
Total Recurring Expenditures 774,000 500,000 500,000 500,000 500,000 500,000 500,000 500,000 500,000 500,000 500,000Total One-Time Expenditures 0 0 0 0 0 0 0 0 0 0 0
Total Expenditures Projection 774,000 500,000 500,000 500,000 500,000 500,000 500,000 500,000 500,000 500,000 500,000
Total Prop C FY Operating Surplus/Deficit 0 0 0 0 0 0 0 0 0 0 0
Prop C - Ending Balance (Operating) 1,398,000 1,398,000 1,398,000 1,398,000 1,398,000 1,398,000 1,398,000 1,398,000 1,398,000 1,398,000 1,398,000 Reserve Percentage (Recurring) 180.62% 279.60% 279.60% 279.60% 279.60% 279.60% 279.60% 279.60% 279.60% 279.60% 279.60%
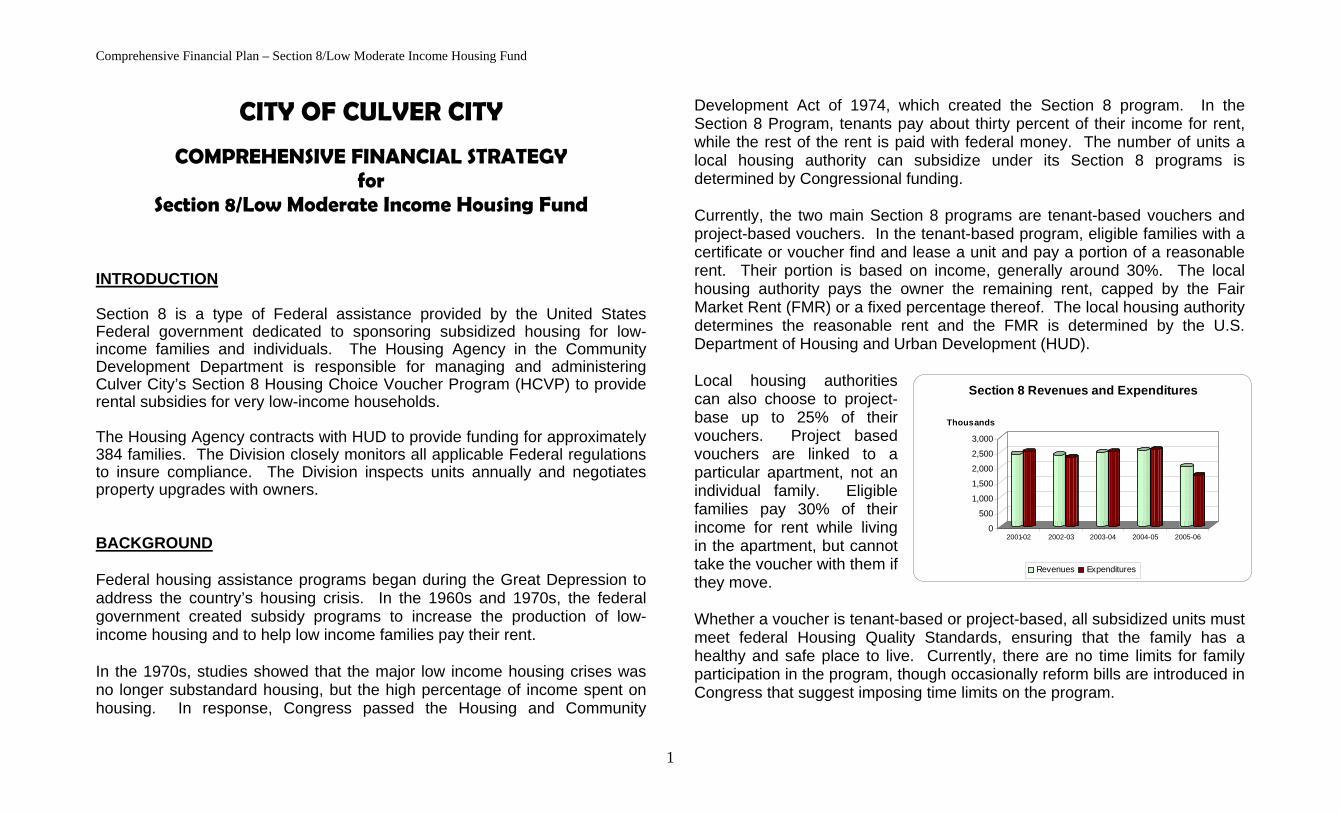
Comprehensive Financial Plan – Section 8/Low Moderate Income Housing Fund
1
CITY OF CULVER CITY
COMPREHENSIVE FINANCIAL STRATEGY for
Section 8/Low Moderate Income Housing Fund INTRODUCTION Section 8 is a type of Federal assistance provided by the United States Federal government dedicated to sponsoring subsidized housing for low-income families and individuals. The Housing Agency in the Community Development Department is responsible for managing and administering Culver City’s Section 8 Housing Choice Voucher Program (HCVP) to provide rental subsidies for very low-income households. The Housing Agency contracts with HUD to provide funding for approximately 384 families. The Division closely monitors all applicable Federal regulations to insure compliance. The Division inspects units annually and negotiates property upgrades with owners. BACKGROUND Federal housing assistance programs began during the Great Depression to address the country’s housing crisis. In the 1960s and 1970s, the federal government created subsidy programs to increase the production of low-income housing and to help low income families pay their rent. In the 1970s, studies showed that the major low income housing crises was no longer substandard housing, but the high percentage of income spent on housing. In response, Congress passed the Housing and Community
Development Act of 1974, which created the Section 8 program. In the Section 8 Program, tenants pay about thirty percent of their income for rent, while the rest of the rent is paid with federal money. The number of units a local housing authority can subsidize under its Section 8 programs is determined by Congressional funding. Currently, the two main Section 8 programs are tenant-based vouchers and project-based vouchers. In the tenant-based program, eligible families with a certificate or voucher find and lease a unit and pay a portion of a reasonable rent. Their portion is based on income, generally around 30%. The local housing authority pays the owner the remaining rent, capped by the Fair Market Rent (FMR) or a fixed percentage thereof. The local housing authority determines the reasonable rent and the FMR is determined by the U.S. Department of Housing and Urban Development (HUD). Local housing authorities can also choose to project-base up to 25% of their vouchers. Project based vouchers are linked to a particular apartment, not an individual family. Eligible families pay 30% of their income for rent while living in the apartment, but cannot take the voucher with them if they move. Whether a voucher is tenant-based or project-based, all subsidized units must meet federal Housing Quality Standards, ensuring that the family has a healthy and safe place to live. Currently, there are no time limits for family participation in the program, though occasionally reform bills are introduced in Congress that suggest imposing time limits on the program.
0
500
1,000
1,500
2,000
2,500
3,000
Thousands
2001-02 2002-03 2003-04 2004-05 2005-06
Section 8 Revenues and Expenditures
Revenues Expenditures
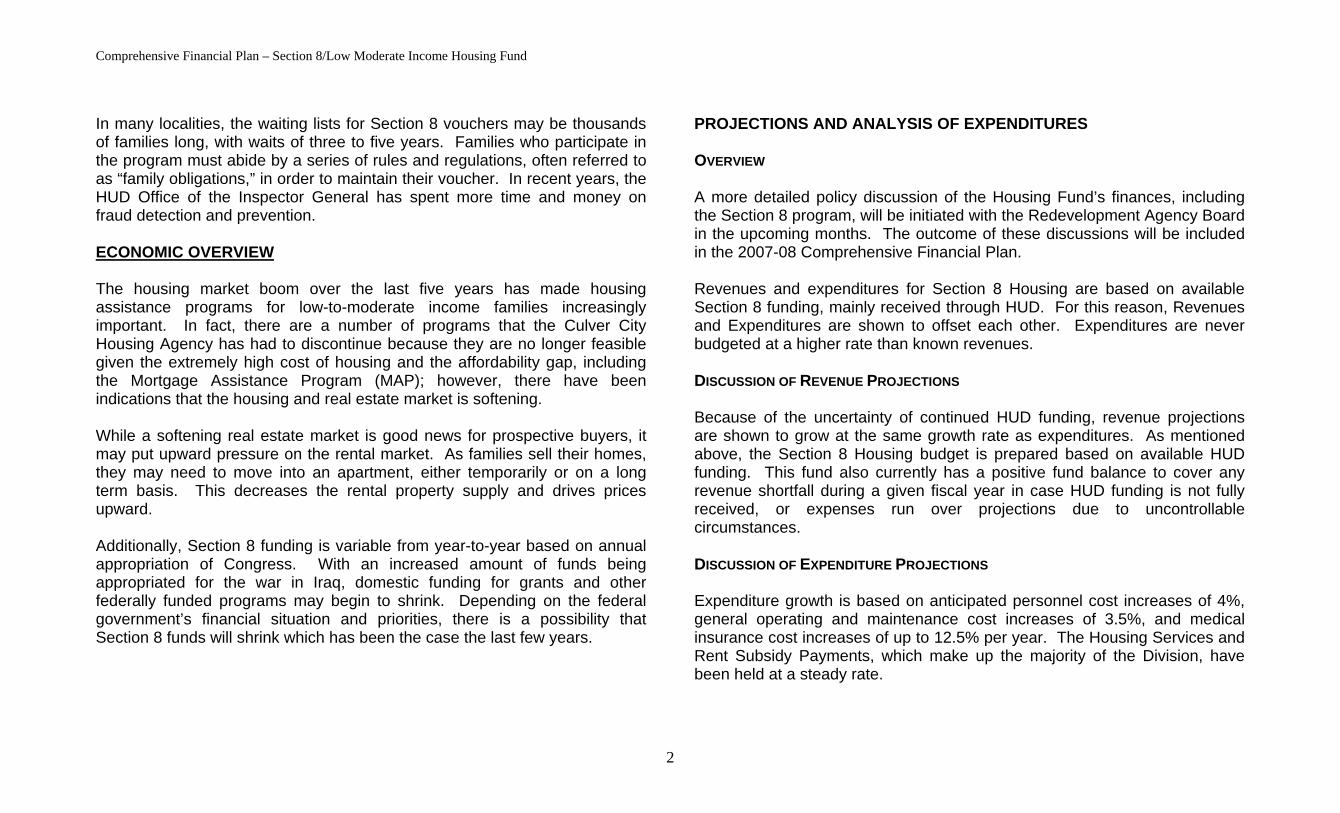
Comprehensive Financial Plan – Section 8/Low Moderate Income Housing Fund
2
In many localities, the waiting lists for Section 8 vouchers may be thousands of families long, with waits of three to five years. Families who participate in the program must abide by a series of rules and regulations, often referred to as “family obligations,” in order to maintain their voucher. In recent years, the HUD Office of the Inspector General has spent more time and money on fraud detection and prevention. ECONOMIC OVERVIEW The housing market boom over the last five years has made housing assistance programs for low-to-moderate income families increasingly important. In fact, there are a number of programs that the Culver City Housing Agency has had to discontinue because they are no longer feasible given the extremely high cost of housing and the affordability gap, including the Mortgage Assistance Program (MAP); however, there have been indications that the housing and real estate market is softening. While a softening real estate market is good news for prospective buyers, it may put upward pressure on the rental market. As families sell their homes, they may need to move into an apartment, either temporarily or on a long term basis. This decreases the rental property supply and drives prices upward. Additionally, Section 8 funding is variable from year-to-year based on annual appropriation of Congress. With an increased amount of funds being appropriated for the war in Iraq, domestic funding for grants and other federally funded programs may begin to shrink. Depending on the federal government’s financial situation and priorities, there is a possibility that Section 8 funds will shrink which has been the case the last few years.
PROJECTIONS AND ANALYSIS OF EXPENDITURES OVERVIEW A more detailed policy discussion of the Housing Fund’s finances, including the Section 8 program, will be initiated with the Redevelopment Agency Board in the upcoming months. The outcome of these discussions will be included in the 2007-08 Comprehensive Financial Plan. Revenues and expenditures for Section 8 Housing are based on available Section 8 funding, mainly received through HUD. For this reason, Revenues and Expenditures are shown to offset each other. Expenditures are never budgeted at a higher rate than known revenues. DISCUSSION OF REVENUE PROJECTIONS Because of the uncertainty of continued HUD funding, revenue projections are shown to grow at the same growth rate as expenditures. As mentioned above, the Section 8 Housing budget is prepared based on available HUD funding. This fund also currently has a positive fund balance to cover any revenue shortfall during a given fiscal year in case HUD funding is not fully received, or expenses run over projections due to uncontrollable circumstances. DISCUSSION OF EXPENDITURE PROJECTIONS Expenditure growth is based on anticipated personnel cost increases of 4%, general operating and maintenance cost increases of 3.5%, and medical insurance cost increases of up to 12.5% per year. The Housing Services and Rent Subsidy Payments, which make up the majority of the Division, have been held at a steady rate.
Description 2006-07 2007-08 2008-09 2009-10 2010-11 2011-12 2012-13 2013-14 2014-15 2015-16 2016-17
Culver City
February 22, 2007
Section 8 Housing (426) - Beginning Balance 757,000 804,000 847,000 885,000 918,000 946,000 969,000 987,000 1,000,000 1,008,000 1,010,000
Fiscal Year Net ChangeTotal Recurring Revenue 2,555,000 2,555,000 2,555,000 2,555,000 2,555,000 2,555,000 2,555,000 2,555,000 2,555,000 2,555,000 2,555,000Total One-Time Revenue 0 0 0 0 0 0 0 0 0 0 0
Total Revenue Projection 2,555,000 2,555,000 2,555,000 2,555,000 2,555,000 2,555,000 2,555,000 2,555,000 2,555,000 2,555,000 2,555,000
Total Recurring Expenditures 2,508,000 2,512,000 2,517,000 2,522,000 2,527,000 2,532,000 2,537,000 2,542,000 2,547,000 2,553,000 2,559,000Total One-Time Expenditures 0 0 0 0 0 0 0 0 0 0 0
Total Expenditures Projection 2,508,000 2,512,000 2,517,000 2,522,000 2,527,000 2,532,000 2,537,000 2,542,000 2,547,000 2,553,000 2,559,000
Total Section 8 Housing FY Operating Surplus/Deficit 47,000 43,000 38,000 33,000 28,000 23,000 18,000 13,000 8,000 2,000 (4,000)
Section 8 Housing - Ending Balance (Operating) 804,000 847,000 885,000 918,000 946,000 969,000 987,000 1,000,000 1,008,000 1,010,000 1,006,000 Reserve Percentage (Recurring) 32.06% 33.72% 35.16% 36.40% 37.44% 38.27% 38.90% 39.34% 39.58% 39.56% 39.31%
Comprehensive Financial Plan – Redevelopment Agency
1
CITY OF CULVER CITY
COMPREHENSIVE FINANCIAL STRATEGY for the
Redevelopment Agency INTRODUCTION Redevelopment is a locally driven activity that assists local governments in revitalizing their communities. Redevelopment encourages new development, creates jobs and generates tax revenues in declining urbanized areas by developing partnerships between local governments and private entities. Over 400 California cities and counties have activated Redevelopment Agencies. Redevelopment Agencies are locally created and adopted so they can respond to a community’s unique needs and vision, most often by adopting a redevelopment plan for a designated redevelopment project area. BACKGROUND The Culver City Redevelopment Agency (the “Agency”) was established on February 8, 1971, pursuant to the State of California Health and Safety Code, Section 33000, entitled Community Redevelopment Law. Its purpose is to carry out plans to improve, rehabilitate and redevelop physically and economically blighted areas and provide more affordable housing units within the City of Culver City. The State Health and Safety Code provides that upon the approval of a redevelopment plan, property taxes levied on future incremental increases in the assessed value within the designated project area will be paid to the redevelopment agency until all indebtedness incurred to finance the project area has been paid.
The Culver City City Council declared itself to be the governing body of the Agency and functions as the Agency’s Board of Directors. The Agency is staffed by employees of the City and the Agency reimburses the City for the cost of these and other services provided to the Agency. The Culver City Redevelopment Agency originally established three project areas, which were merged and expanded to create the present-day project, known as the Culver City Redevelopment Project. In 1971, Project Areas 1 and 2 were formed. These project areas generally encompass the area south of Playa Ave and the Industrial areas of Jefferson Blvd, respectively. Project Area 3 was formed in 1975 and generally consists of the Downtown area and Hayden Tract. In 1998, the three Projects were merged and various non-contiguous areas were added, including portions of Sepulveda Blvd and Washington Blvd between Sepulveda and Lincoln. The three former individual project areas and the added territory are known as Component Areas 1 through 4 respectively. The Agency has three critical objectives: eliminate blight, create jobs, and provide affordable housing. Over the last 35 years, the Agency has undertaken pivotal projects that have met these objectives and enhanced the economic health and property value in the Culver City community. Some of these projects include funding a number of infrastructure improvements, constructing three parking structures and a movie theater downtown, renovation of the Kirk Douglas Theater, and the Fox Hills Mall, the Heritage Classics Homes, and the renovation of many small businesses throughout the project area. Additionally, there are a number of exciting projects that the Agency is currently spearheading, including further expansion of the Town Plaza area downtown, revitalizing the area surrounding the future site of the Expo light rail station at Washington and National, and funding for the construction of a new Fire Station #3.
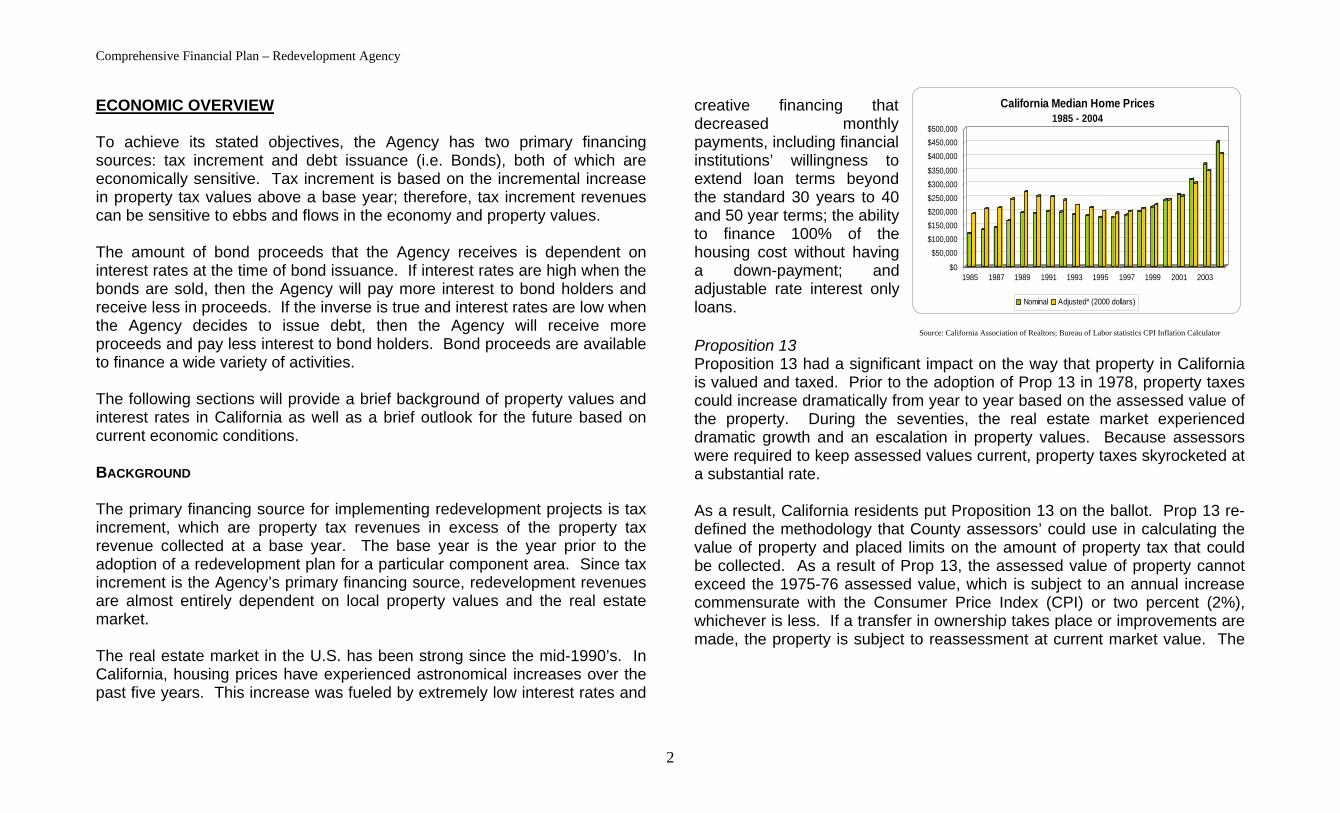
Comprehensive Financial Plan – Redevelopment Agency
2
$0
$50,000$100,000$150,000$200,000$250,000$300,000$350,000
$400,000$450,000$500,000
1985 1987 1989 1991 1993 1995 1997 1999 2001 2003
California Median Home Prices1985 - 2004
Nominal Adjusted* (2000 dollars)
ECONOMIC OVERVIEW To achieve its stated objectives, the Agency has two primary financing sources: tax increment and debt issuance (i.e. Bonds), both of which are economically sensitive. Tax increment is based on the incremental increase in property tax values above a base year; therefore, tax increment revenues can be sensitive to ebbs and flows in the economy and property values. The amount of bond proceeds that the Agency receives is dependent on interest rates at the time of bond issuance. If interest rates are high when the bonds are sold, then the Agency will pay more interest to bond holders and receive less in proceeds. If the inverse is true and interest rates are low when the Agency decides to issue debt, then the Agency will receive more proceeds and pay less interest to bond holders. Bond proceeds are available to finance a wide variety of activities. The following sections will provide a brief background of property values and interest rates in California as well as a brief outlook for the future based on current economic conditions. BACKGROUND The primary financing source for implementing redevelopment projects is tax increment, which are property tax revenues in excess of the property tax revenue collected at a base year. The base year is the year prior to the adoption of a redevelopment plan for a particular component area. Since tax increment is the Agency’s primary financing source, redevelopment revenues are almost entirely dependent on local property values and the real estate market. The real estate market in the U.S. has been strong since the mid-1990’s. In California, housing prices have experienced astronomical increases over the past five years. This increase was fueled by extremely low interest rates and
creative financing that decreased monthly payments, including financial institutions’ willingness to extend loan terms beyond the standard 30 years to 40 and 50 year terms; the ability to finance 100% of the housing cost without having a down-payment; and adjustable rate interest only loans. Proposition 13 Proposition 13 had a significant impact on the way that property in California is valued and taxed. Prior to the adoption of Prop 13 in 1978, property taxes could increase dramatically from year to year based on the assessed value of the property. During the seventies, the real estate market experienced dramatic growth and an escalation in property values. Because assessors were required to keep assessed values current, property taxes skyrocketed at a substantial rate. As a result, California residents put Proposition 13 on the ballot. Prop 13 re-defined the methodology that County assessors’ could use in calculating the value of property and placed limits on the amount of property tax that could be collected. As a result of Prop 13, the assessed value of property cannot exceed the 1975-76 assessed value, which is subject to an annual increase commensurate with the Consumer Price Index (CPI) or two percent (2%), whichever is less. If a transfer in ownership takes place or improvements are made, the property is subject to reassessment at current market value. The
Source: California Association of Realtors; Bureau of Labor statistics CPI Inflation Calculator
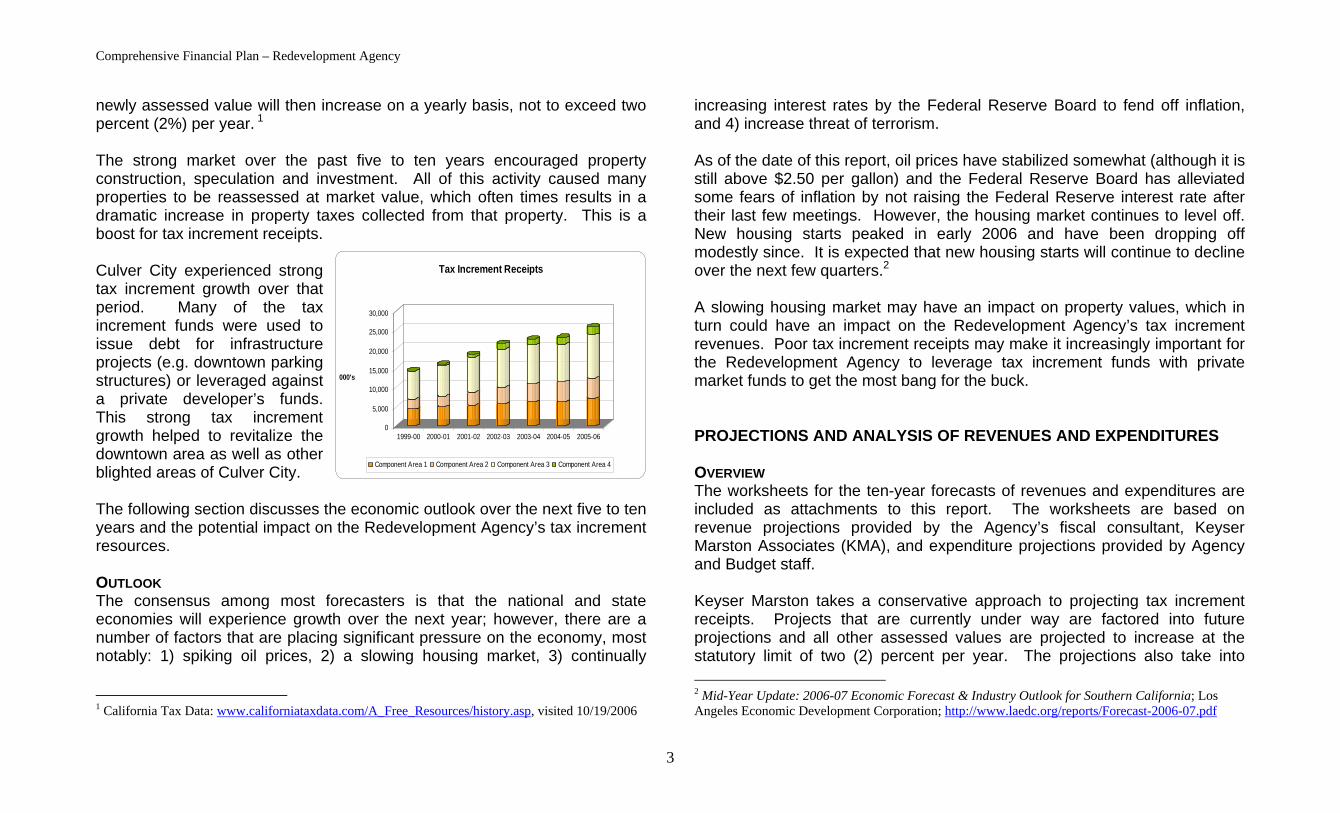
Comprehensive Financial Plan – Redevelopment Agency
3
newly assessed value will then increase on a yearly basis, not to exceed two percent (2%) per year. 1 The strong market over the past five to ten years encouraged property construction, speculation and investment. All of this activity caused many properties to be reassessed at market value, which often times results in a dramatic increase in property taxes collected from that property. This is a boost for tax increment receipts. Culver City experienced strong tax increment growth over that period. Many of the tax increment funds were used to issue debt for infrastructure projects (e.g. downtown parking structures) or leveraged against a private developer’s funds. This strong tax increment growth helped to revitalize the downtown area as well as other blighted areas of Culver City. The following section discusses the economic outlook over the next five to ten years and the potential impact on the Redevelopment Agency’s tax increment resources. OUTLOOK The consensus among most forecasters is that the national and state economies will experience growth over the next year; however, there are a number of factors that are placing significant pressure on the economy, most notably: 1) spiking oil prices, 2) a slowing housing market, 3) continually
1 California Tax Data: www.californiataxdata.com/A_Free_Resources/history.asp, visited 10/19/2006
increasing interest rates by the Federal Reserve Board to fend off inflation, and 4) increase threat of terrorism. As of the date of this report, oil prices have stabilized somewhat (although it is still above $2.50 per gallon) and the Federal Reserve Board has alleviated some fears of inflation by not raising the Federal Reserve interest rate after their last few meetings. However, the housing market continues to level off. New housing starts peaked in early 2006 and have been dropping off modestly since. It is expected that new housing starts will continue to decline over the next few quarters.2 A slowing housing market may have an impact on property values, which in turn could have an impact on the Redevelopment Agency’s tax increment revenues. Poor tax increment receipts may make it increasingly important for the Redevelopment Agency to leverage tax increment funds with private market funds to get the most bang for the buck. PROJECTIONS AND ANALYSIS OF REVENUES AND EXPENDITURES OVERVIEW The worksheets for the ten-year forecasts of revenues and expenditures are included as attachments to this report. The worksheets are based on revenue projections provided by the Agency’s fiscal consultant, Keyser Marston Associates (KMA), and expenditure projections provided by Agency and Budget staff. Keyser Marston takes a conservative approach to projecting tax increment receipts. Projects that are currently under way are factored into future projections and all other assessed values are projected to increase at the statutory limit of two (2) percent per year. The projections also take into 2 Mid-Year Update: 2006-07 Economic Forecast & Industry Outlook for Southern California; Los Angeles Economic Development Corporation; http://www.laedc.org/reports/Forecast-2006-07.pdf
0
5,000
10,000
15,000
20,000
25,000
30,000
000's
1999-00 2000-01 2001-02 2002-03 2003-04 2004-05 2005-06
Tax Increment Receipts
Component Area 1 Component Area 2 Component Area 3 Component Area 4
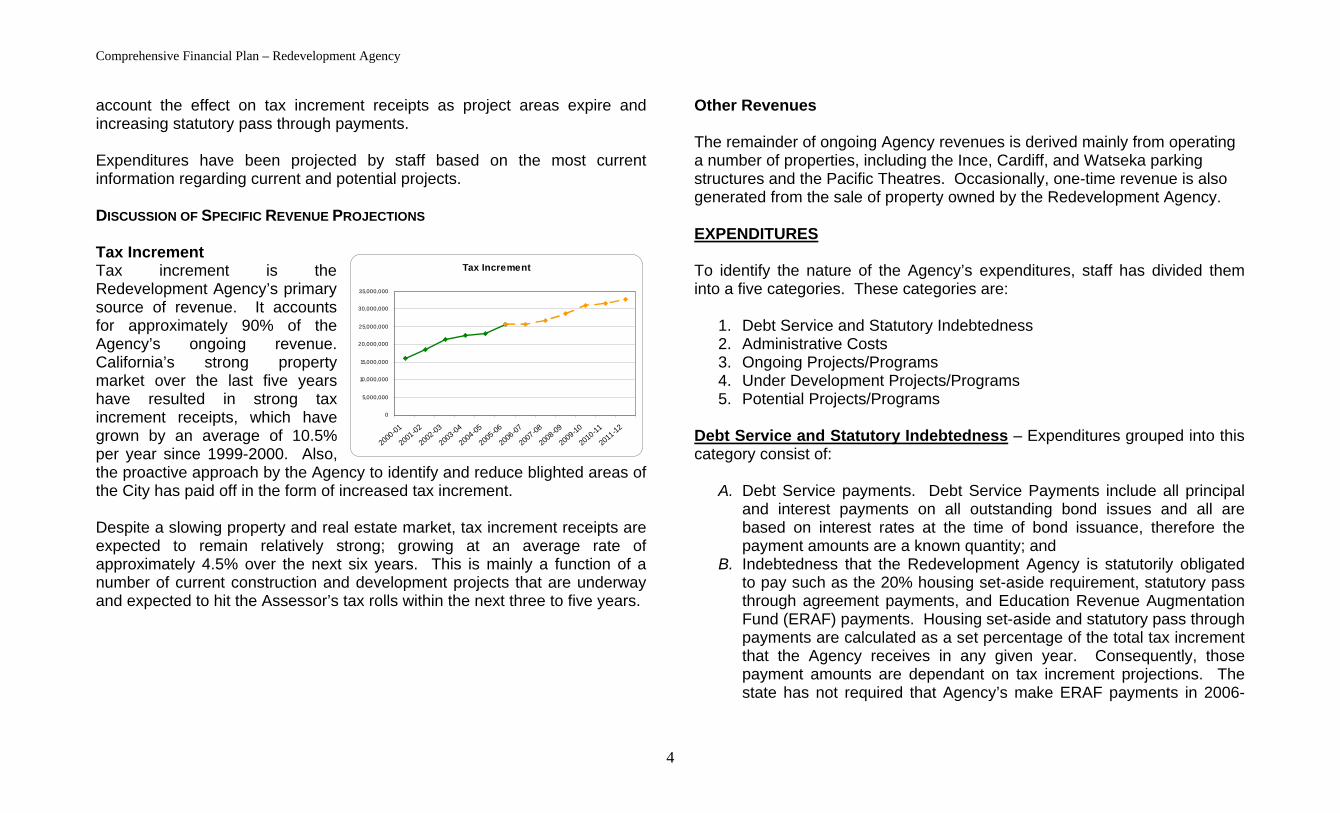
Comprehensive Financial Plan – Redevelopment Agency
4
Tax Increment
0
5,000,000
10,000,000
15,000,000
20,000,000
25,000,000
30,000,000
35,000,000
2000
-01
2001
-02
2002
-03
2003-04
2004-05
2005-06
2006
-07
2007
-08
2008-09
2009-10
2010-11
2011
-12
account the effect on tax increment receipts as project areas expire and increasing statutory pass through payments. Expenditures have been projected by staff based on the most current information regarding current and potential projects. DISCUSSION OF SPECIFIC REVENUE PROJECTIONS Tax Increment Tax increment is the Redevelopment Agency’s primary source of revenue. It accounts for approximately 90% of the Agency’s ongoing revenue. California’s strong property market over the last five years have resulted in strong tax increment receipts, which have grown by an average of 10.5% per year since 1999-2000. Also, the proactive approach by the Agency to identify and reduce blighted areas of the City has paid off in the form of increased tax increment. Despite a slowing property and real estate market, tax increment receipts are expected to remain relatively strong; growing at an average rate of approximately 4.5% over the next six years. This is mainly a function of a number of current construction and development projects that are underway and expected to hit the Assessor’s tax rolls within the next three to five years.
Other Revenues The remainder of ongoing Agency revenues is derived mainly from operating a number of properties, including the Ince, Cardiff, and Watseka parking structures and the Pacific Theatres. Occasionally, one-time revenue is also generated from the sale of property owned by the Redevelopment Agency. EXPENDITURES To identify the nature of the Agency’s expenditures, staff has divided them into a five categories. These categories are:
1. Debt Service and Statutory Indebtedness 2. Administrative Costs 3. Ongoing Projects/Programs 4. Under Development Projects/Programs 5. Potential Projects/Programs
Debt Service and Statutory Indebtedness – Expenditures grouped into this category consist of:
A. Debt Service payments. Debt Service Payments include all principal and interest payments on all outstanding bond issues and all are based on interest rates at the time of bond issuance, therefore the payment amounts are a known quantity; and
B. Indebtedness that the Redevelopment Agency is statutorily obligated to pay such as the 20% housing set-aside requirement, statutory pass through agreement payments, and Education Revenue Augmentation Fund (ERAF) payments. Housing set-aside and statutory pass through payments are calculated as a set percentage of the total tax increment that the Agency receives in any given year. Consequently, those payment amounts are dependant on tax increment projections. The state has not required that Agency’s make ERAF payments in 2006-

Comprehensive Financial Plan – Redevelopment Agency
5
07; however, ERAF payments could be re-instituted at any time depending on the condition of the State’s budget.
Administrative Costs – The Administrative costs category includes the salaries and benefits for the Redevelopment and Economic Development divisions, general supplies and operations expenses, contract services, and reimbursement costs that the Agency pays to the City for a number of positions that are impacted by redevelopment activities (e.g. planning staff, code enforcement staff, building and safety staff, etc.). Administrative costs are basically the Agency’s day to day operating costs. Ongoing Projects/Programs – This expenditure category consists of the ongoing projects and programs managed by the Agency. This includes the costs for management activities for Agency owned and/or operated properties (e.g. downtown parking structures, and the Pacific Theaters) and many cultural affairs type programs, including Music in the Chambers, “The Art of…” speaker series, Farmer’s Market, and the Culver City Music Festival. Under Development Projects/Programs – Under development projects/programs have been presented and considered by the Agency Board and are in varying stages of implementation (i.e. planning, demolition, construction, or project closeout stage). Once these projects/programs are completed, there will be no associated direct ongoing cost assumed by the Agency. Expenditures in this category are subject to change as projects progress due to a variety of project specific factors. Potential Projects/Programs – Potential projects/programs are in the exploratory stages of development, i.e. staff is researching potential projects that community investors and community members may be interested in implementing. For the most part, costs in this category are to identify projects in certain areas that may ultimately be brought before the Agency Board for consideration. Once a potential program is approved by the Agency Board, it
becomes a current project/program. This is the most dynamic and changing expenditure category.
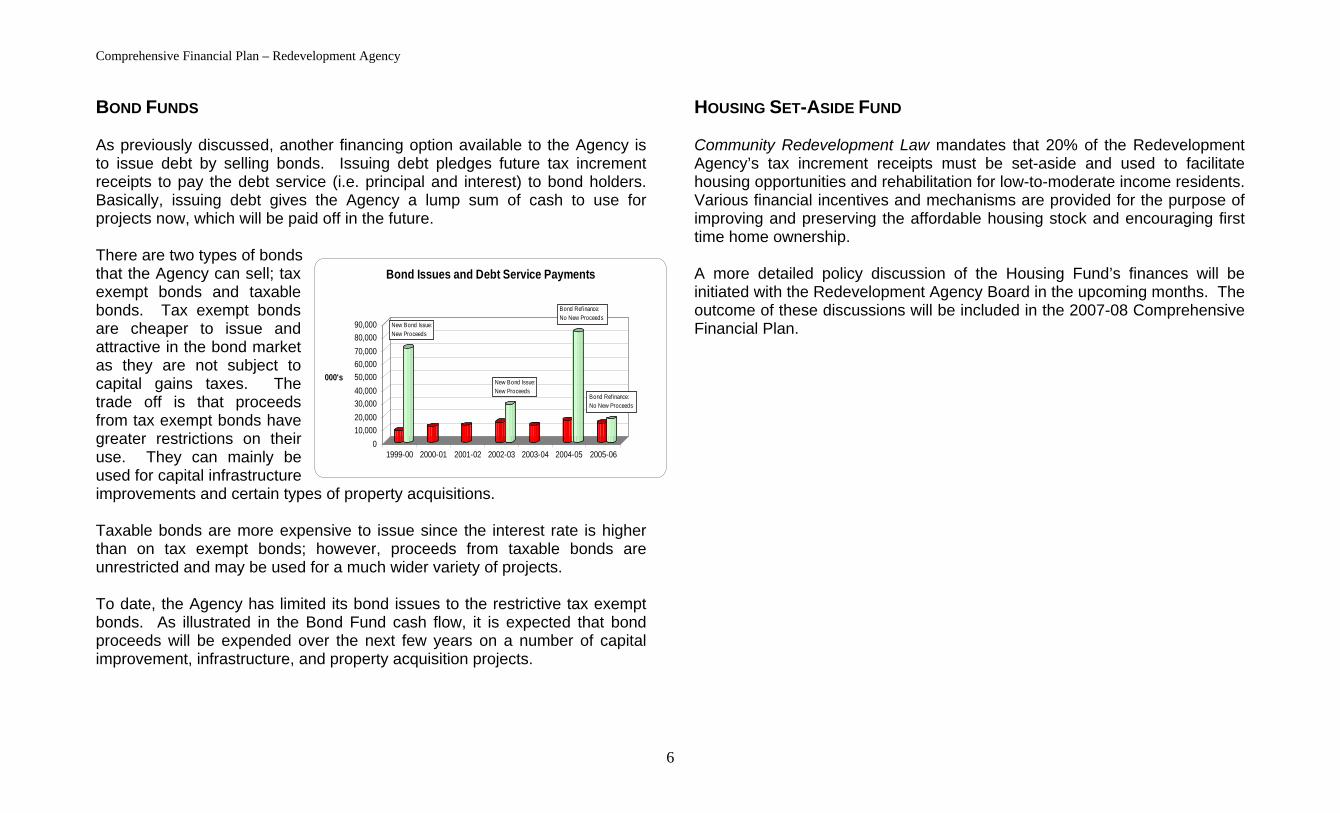
Comprehensive Financial Plan – Redevelopment Agency
6
010,00020,00030,00040,00050,00060,00070,00080,00090,000
000's
1999-00 2000-01 2001-02 2002-03 2003-04 2004-05 2005-06
Bond Issues and Debt Service Payments
New Bond Issue: New Proceeds
Bond Refinance: No New Proceeds
Bond Refinance: No New Proceeds
New Bond Issue: New Proceeds
BOND FUNDS As previously discussed, another financing option available to the Agency is to issue debt by selling bonds. Issuing debt pledges future tax increment receipts to pay the debt service (i.e. principal and interest) to bond holders. Basically, issuing debt gives the Agency a lump sum of cash to use for projects now, which will be paid off in the future. There are two types of bonds that the Agency can sell; tax exempt bonds and taxable bonds. Tax exempt bonds are cheaper to issue and attractive in the bond market as they are not subject to capital gains taxes. The trade off is that proceeds from tax exempt bonds have greater restrictions on their use. They can mainly be used for capital infrastructure improvements and certain types of property acquisitions. Taxable bonds are more expensive to issue since the interest rate is higher than on tax exempt bonds; however, proceeds from taxable bonds are unrestricted and may be used for a much wider variety of projects. To date, the Agency has limited its bond issues to the restrictive tax exempt bonds. As illustrated in the Bond Fund cash flow, it is expected that bond proceeds will be expended over the next few years on a number of capital improvement, infrastructure, and property acquisition projects.
HOUSING SET-ASIDE FUND Community Redevelopment Law mandates that 20% of the Redevelopment Agency’s tax increment receipts must be set-aside and used to facilitate housing opportunities and rehabilitation for low-to-moderate income residents. Various financial incentives and mechanisms are provided for the purpose of improving and preserving the affordable housing stock and encouraging first time home ownership. A more detailed policy discussion of the Housing Fund’s finances will be initiated with the Redevelopment Agency Board in the upcoming months. The outcome of these discussions will be included in the 2007-08 Comprehensive Financial Plan.
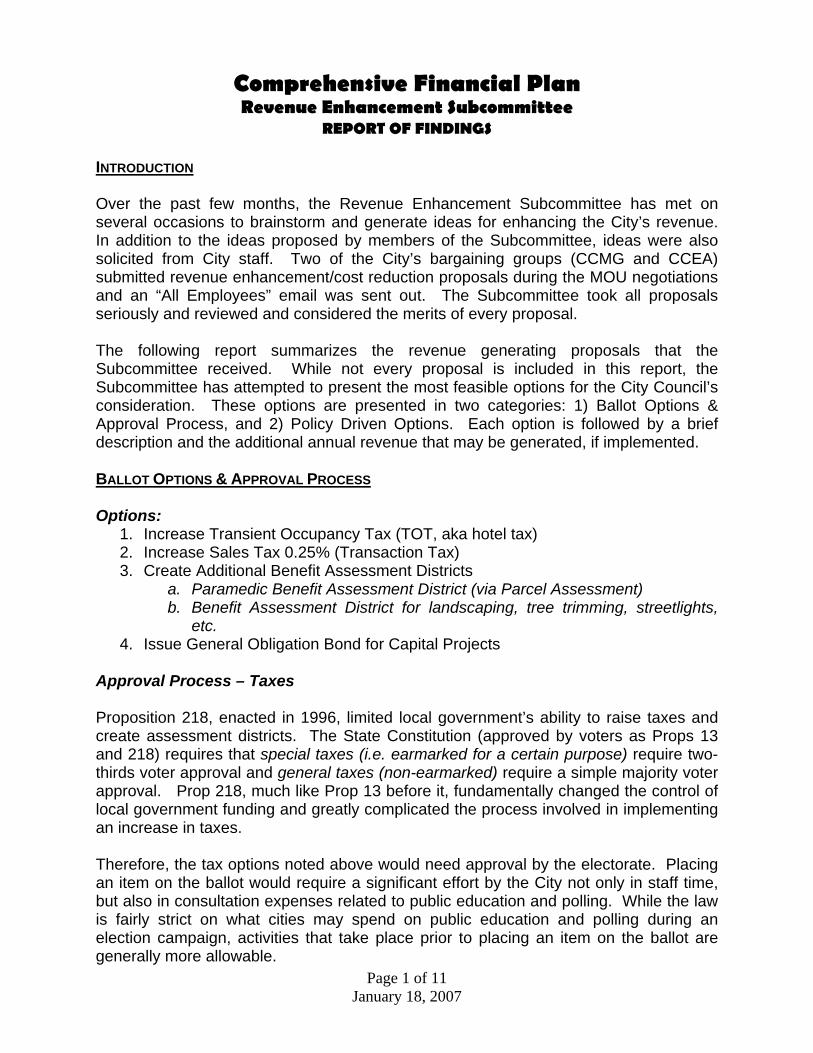
Page 1 of 11 January 18, 2007
Comprehensive Financial Plan Revenue Enhancement Subcommittee
REPORT OF FINDINGS INTRODUCTION Over the past few months, the Revenue Enhancement Subcommittee has met on several occasions to brainstorm and generate ideas for enhancing the City’s revenue. In addition to the ideas proposed by members of the Subcommittee, ideas were also solicited from City staff. Two of the City’s bargaining groups (CCMG and CCEA) submitted revenue enhancement/cost reduction proposals during the MOU negotiations and an “All Employees” email was sent out. The Subcommittee took all proposals seriously and reviewed and considered the merits of every proposal. The following report summarizes the revenue generating proposals that the Subcommittee received. While not every proposal is included in this report, the Subcommittee has attempted to present the most feasible options for the City Council’s consideration. These options are presented in two categories: 1) Ballot Options & Approval Process, and 2) Policy Driven Options. Each option is followed by a brief description and the additional annual revenue that may be generated, if implemented. BALLOT OPTIONS & APPROVAL PROCESS Options:
1. Increase Transient Occupancy Tax (TOT, aka hotel tax) 2. Increase Sales Tax 0.25% (Transaction Tax) 3. Create Additional Benefit Assessment Districts
a. Paramedic Benefit Assessment District (via Parcel Assessment) b. Benefit Assessment District for landscaping, tree trimming, streetlights,
etc. 4. Issue General Obligation Bond for Capital Projects
Approval Process – Taxes Proposition 218, enacted in 1996, limited local government’s ability to raise taxes and create assessment districts. The State Constitution (approved by voters as Props 13 and 218) requires that special taxes (i.e. earmarked for a certain purpose) require two-thirds voter approval and general taxes (non-earmarked) require a simple majority voter approval. Prop 218, much like Prop 13 before it, fundamentally changed the control of local government funding and greatly complicated the process involved in implementing an increase in taxes. Therefore, the tax options noted above would need approval by the electorate. Placing an item on the ballot would require a significant effort by the City not only in staff time, but also in consultation expenses related to public education and polling. While the law is fairly strict on what cities may spend on public education and polling during an election campaign, activities that take place prior to placing an item on the ballot are generally more allowable.
Page 2 of 11 January 18, 2007
Additionally, if the City Council selects either of the above options (1 and 2), it should be noted that, per state law, such a ballot measure must be part of the City’s general election ballot. The City’s next general election is in April 2008. Reviewing what state and county level tax issues may appear on the same ballot will be one important area of analysis. Approval Process – Assessment Districts Another result of Prop 218 was the extensive process required before a city can create an assessment district. For the assessment options listed above, the City would be required to prepare reports describing the amount of the assessments, per parcel, and the benefits to be received by those assessments. The City would be required to hold public hearings to review the possible assessments. Formal written notice of the assessments, along with ballots, must be sent to all those who would be subject to the assessments. The City could only impose the assessment if a majority of those returning ballots approve the assessment. No increase to an existing assessment can occur without going through a similar process. Public education and campaign requirements and restrictions similar to those imposed on ballot measures for tax increases would apply to the assessment process. Approval Process – General Obligation Bond General obligation bonds must be approved at a general or special election by a majority of electors voting at that election. Public education and campaign requirements and restrictions similar to those imposed on ballot measures for tax increases would apply to the election where the voters would be asked to approve the general obligation bonds. Option 1: Increase Transient Occupancy Tax (TOT) The Culver City Municipal Code authorizes the City to levy a tax for the privilege of occupying lodgings on a transient basis. The current Transient Occupancy Tax (TOT) rate is 12%. An increase in TOT would slightly increase the taxes that area hotel customers would pay to stay in Culver City. Currently, the average nightly room rate for Culver City hotels is $125, not including taxes. The current 12% TOT rates adds $15 in tax to that rate. A 2% increase to the TOT would add $2.50 in taxes. Many nearby cities have increased their TOT rates over the last three years, as noted below. Area TOT rates: Los Angeles: 14% Santa Monica: 14% Beverly Hills: 14% West Hollywood: 14% Culver City: 12%
Page 3 of 11 January 18, 2007
Option 2: Increase Sales Tax 0.25% (Transaction Tax) In 1969, the State Legislature first authorized counties to seek voter approval of special transaction and use tax districts. Shortly thereafter, the Legislature also began granting permission to specific cities to seek voter consideration of a District Tax. In January 2004, the requirement that cities first obtain permission from the state legislature was dropped and cities were authorized to go directly to their voters for transaction and use taxes in multiples of 0.25%. The combined district transactions tax rates in any county cannot exceed a total rate of 9.25%. With the exception of certain goods sold to operators of common carrier aircraft, a transaction and use tax is imposed on the same goods and merchandise as the local sales and use tax. However, the sales and use tax is generally allocated to the jurisdiction where the sale is negotiated or order taken, while the transaction and use tax is allocated to the district where the goods are delivered or placed into use. As outlined below, this is an important distinction as it relates to a Culver City resident purchasing merchandise in another jurisdiction. For “walk-in” retail stores, the Board of Equalization generally assumes that the merchandise will be used within the district where the store is located, unless the retailer is asked to ship the merchandise outside the district as part of the sale. For merchandise that is shipped, the transaction tax is levied based on the district to which the merchandise is being shipped. Therefore, Culver City residents and businesses would pay the additional transaction tax. Sellers or lessors of vehicles, vessels or licensed aircraft are required to collect the transaction tax for the district where the conveyance is to be registered. Therefore, residents cannot escape the tax by purchasing from a dealer outside Culver City as dealers statewide must collect transaction taxes based on the location of the registration, not the location of the purchase. In Los Angeles County, all cities have an 8.25% sales and use tax rate, with the exception of the City of Avalon, which has an additional .50% transaction tax for a total sales and transaction tax of 8.75%. In the entire state, only Alameda County (8.75%), San Francisco County (8.50%), and the cities of Richmond (8.75%), Clovis (8.275%), Avalon (8.75%), and Scotts Valley (8.50%) exceed a total transaction tax rate of 8.25%. Attached is a summary report of the statewide election results of local sales tax measures from November 2006 and a list of cities that had adopted transaction taxes prior to the November election. Option 3: Benefit Assessment District Benefit Assessment Districts are intended to charge those whose property is receiving a direct and measurable City service where the relative “benefit” to the property owner can be computed. One Benefit Assessment District that could be implemented city-wide would be a Paramedic Benefit Assessment (which would be administered as a parcel assessment). Other Benefit Assessment Districts could be implemented for tree-trimming, streetlights, parks, and landscaping. These may be able to be city-wide, or

Page 4 of 11 January 18, 2007
implemented on a smaller neighborhood-by-neighborhood basis depending on benefit/need. The annual cost to assess allocations on anything other than a city-wide basis is higher. The intent of a Benefit Assessment District is to recover the cost of providing a high level of service. For example, if a contract with a tree-trimming company to increase the frequency that certain types of trees are trimmed costs $800,000 per year, then the goal would be to equitably spread the cost of that contract among the businesses and residents that directly benefit from that service. Option 4: Issue General Obligation Bond Another financing option is to issue general obligation bonds. General obligation bonds are bonds that are legally backed by the full faith and credit of the issuing government. The government is legally obligated to use its full taxing power, if necessary, to repay the debt. Basically, issuing debt gives the City a lump sum of cash now to use for capital projects, which will be paid off, with interest, in the future. Because the City is legally obligated to repay the bond, which includes raising taxes if the City cannot meet its debt service payments, issuing a bond must be approved by the voters. The primary advantage to using general obligation bonds is the associated low interest costs. Since the bonds are legally backed by the full faith and credit of the issuer, they are considered very low risk for the investor; consequently, they usually sell at the lowest rates of interest. The bond issue is often less complex then other types of bonds so administrative costs are less in preparing the issue. A final advantage to general obligation bonds arises from the necessity of receiving approval through a bond referendum. The vote confirms popular support for the project(s) being financed. There are also disadvantages to issuing general obligation bonds, including the possibility that the voters will not approve the bond referendum. If a bond referendum is not approved, City Council will need to find other ways to finance needed projects. Additionally, repayment of the debt will tie up the City’s revenues for 20 or 30 years to pay the required debt service (i.e. principal and interest payments on the bonds).
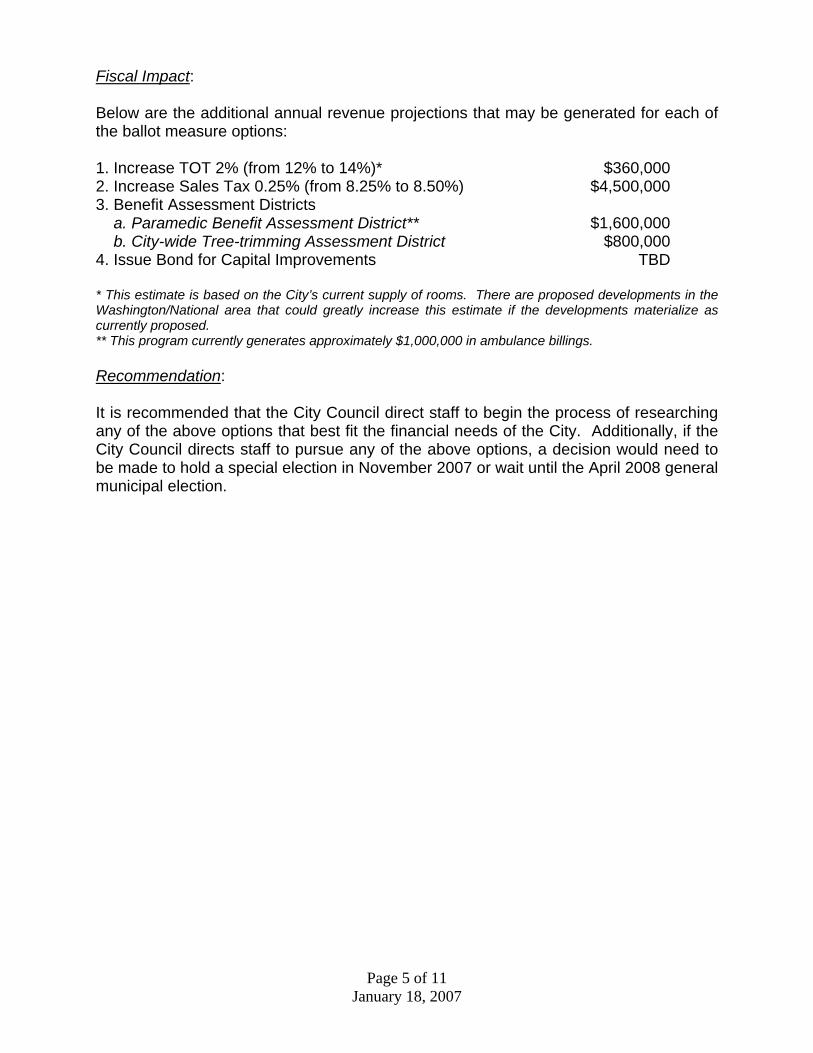
Page 5 of 11 January 18, 2007
Fiscal Impact: Below are the additional annual revenue projections that may be generated for each of the ballot measure options: 1. Increase TOT 2% (from 12% to 14%)* $360,0002. Increase Sales Tax 0.25% (from 8.25% to 8.50%) $4,500,0003. Benefit Assessment Districts a. Paramedic Benefit Assessment District** b. City-wide Tree-trimming Assessment District
$1,600,000$800,000
4. Issue Bond for Capital Improvements TBD * This estimate is based on the City’s current supply of rooms. There are proposed developments in the Washington/National area that could greatly increase this estimate if the developments materialize as currently proposed. ** This program currently generates approximately $1,000,000 in ambulance billings. Recommendation: It is recommended that the City Council direct staff to begin the process of researching any of the above options that best fit the financial needs of the City. Additionally, if the City Council directs staff to pursue any of the above options, a decision would need to be made to hold a special election in November 2007 or wait until the April 2008 general municipal election.
Page 6 of 11 January 18, 2007
POLICY DRIVEN OPTIONS Options:
1. Review and Update City Fees & Charges 2. Privatize Graphics Services 3. Increase Utilization of Vet’s Memorial Building 4. Advertise in/on City Vehicles 5. Sponsorship of City-owned Property/Programs/Events 6. Lease City Property for Special Events (e.g. weddings @ City Hall) 7. Review Parking Rates at All City Structures and Meters 8. Increase City’s Fines (e.g. Parking and Impound Citations) 9. Increase e-Commerce (online billing) 10. Create Online “Property Room” for Asset Seizure Auctions 11. Host a Regional Youth Sporting Event
The options presented in this section do not require voter approval; however, they do require a policy decision by the Council. Some of these options may be more popular or feasible than others. The following provides a brief description and analysis of each option as well as a discussion of the fiscal impact. Option 1: Review and Update City Fees & Charges There are some service fees and charges the City collects that do not fall under the restrictions set forth in Proposition 218, and the City must regularly review and update these fees and charges as applicable to cover and recoup the costs associated with the services being given. General Fund service charges, though, cannot exceed the cost of service, including overhead. A comprehensive review of the City’s fees and charges by a consultant is currently underway. This review is expected to be completed in February and presented to Council prior to fiscal year 2007-08 budget adoption. Fiscal impact is unknown at this time. The consultant will be providing a report to City Council in April 2007. At that time, staff will have a better estimate for the fiscal impact. Option 2: Privatize Graphic Services The City could lease the space currently occupied by the Graphic Services division to a private parcel/graphics service (e.g. Fed Ex, Kinko’s, UPS, Xerox, etc.). The City could also lease/reserve a certain number of spaces on P-1 for customers of that service. City Hall’s location in the downtown area and proximity to an existing U.S. Post Office may make it a desirable location for a private graphics services company. Currently, the Graphic Services division has a budget of approximately $430,000, which includes personnel costs, postage, lease payments and maintenance for the City’s multi-functional copy machines, and paper for the City’s printers and photocopy machines. Personnel costs in the Graphic Services division are approximately $137,000. If Council is interested in this option, staff needs to further research the costs of contracting out those services.
Page 7 of 11 January 18, 2007
An additional graphics/mail room related policy issue that the City may explore is to require those parties requesting information from the City via mail (e.g. old agenda reports, police reports, City Budget, etc.) include a self addressed stamped envelope for the documents to be returned. This would save staff time in preparing envelopes and mailing labels and paying for the return postage. Option 3: Increase Utilization of Vet’s Memorial Building The City has a number of rooms in the Teen Center, Vet’s Memorial Building (VMB), and the Senior Center that are available to rent for meetings and special events. Many of the rooms in the Teen Center and Senior Center are used for City programming during normal business hours. However, most of the rooms in VMB are available during normal business hours. Currently, the City does an excellent job of leasing out as many of the rooms as possible. An upgrade to VMB may make it more attractive to potential users and more competitive with surrounding rental facilities. Increasing utilization would increase revenue, but it would also increase expenditures associated with cleaning and maintaining a highly utilized facility. If the City Council is interested in this option, staff needs to further research the City’s potential return on investment. However, a significant monetary commitment to capital improvements at VMB would be necessary in order to maximize utilization and revenues derived from room rental fees, which could be funded with general obligation bonds. Option 4: Advertise In/On City Property The City and Enterprise funds may be able to realize significant revenue generation by selling advertising space in/on City property, especially the City’s rolling stock. Currently, the MTA sells advertising space on the exterior of its buses as well as in designated interior locations. MTA also offers video advertising shown on video monitors inside each bus. In addition to Culver CityBus, the City could also explore the possibility of selling exterior advertising space on other rolling stock, including public works vehicles. There are a number of vendors that coordinate and administer the ad sales for the City. If the City Council would like to further explore this option, staff can contact one of these vendors for preliminary estimates on revenue generation. Even if it is determined that Enterprise fund income must stay with that fund, the health of these funds is critical for their continued ability to pay allocated administrative costs to the General Fund. Option 5: Sponsorship of City-owned Programs/Events The City manages and staffs a number of events and programs that are offered free of charge to the public, including the Fiesta La Ballona, Farmers’ Market, Culver City Music Festival, Music in the Chambers, and “The Art of…” speaker series. Despite the
Page 8 of 11 January 18, 2007
growing popularity of many of these programs, the funds available to manage them continue to diminish. In some cases, programs are sponsored by a business or organization that contributes money in exchange for name recognition. However, the City could increase its efforts to solicit monetary or in-kind sponsorships to off-set some of the costs of running these programs. Increasing efforts to solicit sponsorship for community events is a policy decision that, if directed, staff may begin to implement immediately. Option 6: Lease City Property for Special Events (e.g. Weddings @ City Hall) The City has a number of beautiful locations that may potentially be used for special events and private functions. For example, the City Hall courtyard may provide a beautiful backdrop for a wedding reception or retirement party. Much like VMB is rented for these types of functions, the City may be able to rent other City owned property for special events. The fiscal impact is unknown. However, if there is some sort of mechanism in place when requests are received, the City may be able to generate some additional rental revenue (a few thousand dollars??). Option 7: Review Parking Rates at all City Structures and Meters Culver City owns and operates a number of parking structures to encourage better traffic flow and address some of the parking issues that most southern California communities face. As parking becomes a scarce resource, parking rates throughout the region continue to rise, as do costs associated with operating a parking structure. In an effort to create a unified parking strategy throughout the City, and especially in the downtown area, the Redevelopment Agency and Community Development Department are bringing forward a number of policy options for the City Council to consider over the next few months. The unified parking strategy includes policy options for the Ince, Watseka, Cardiff, and City Hall parking structures, pricing options for parking meters downtown, and reviewing the City’s zoning requirements as they relate to parking in the downtown area. Option 9: Increase City’s Fines (e.g. Parking and Impound Citations) The City may consider reviewing fines and forfeitures to make sure they are in line with surrounding cities. Increasing the parking and impound fees would require amending the municipal code. However, depending on how much rates were increased, it could result in a significant increase in fines and forfeitures revenues.
Page 9 of 11 January 18, 2007
Option 10: Increase e-Commerce (online billing) and e-FFiciency Increase the use of technology to generate and distribute financial reports to Department Heads, City Council, and the public, and maximize the use of e-commerce. Overall, it is expected that increased use of technology will increase efficiency and productivity. The Information Technology department is working with the City Treasurer’s Office and the City Controller’s Office to develop a suite of financial reports to be used as tools for sound financial management. The City Treasurer’s Office, the City Attorney’s Office and IT are also working on an e-commerce program, which will increase the efficiency and effectiveness of revenue collection, reduce paperwork, and expedite the application process. Option 11: Create Online “Property Room” for Asset Seizure Auctions Asset Seizure is a power afforded to government agencies which allows them to seize property that is believed to be related to criminal conduct; the tactic is commonly used in drug cases. The Culver City Police Department, as part of detecting and preventing criminal activity and apprehending criminals, has accumulated an inventory of seized property, from bicycles to computer equipment. The City currently contracts with a vendor who sells or disposes of the property on the City’s behalf. With the increase in popularity of internet consumerism and online auction sites such as e-Bay, the City may be able to reach a wider audience and, consequently, sell more inventory at a more competitive price. At this time, more research will need to be done into the legal and operational procedures involved in auctioning off seized property online. In order to determine a possible fiscal impact, staff needs to do more research into the current process and what percentage of seized property is sold versus what is discarded. Because online auctions generally reach more people, some additional revenue may be generated if there is an increase in the percentage of items that are sold. Selling property using an online auction site does have a cost and would require staff commitment. For example, the auction site generally charges a fee to list the item, which is usually a percentage of the listing price (usually about 5-6%). Staff would need to photograph the property and go through the process of listing it online, which includes posting digital pictures and writing a description of the item being auctioned. Once the item has been purchased, it must be boxed up and shipped. The buyer will typically pay for a portion of the shipping and handling costs, but not the staff time associated with shipping the item. There are small businesses that will sell items on auction sites for you (the famous “We Sell It On EBAY” stores). These businesses do all the work, from listing to shipping. However, they generally take 15-20% of the final selling price as a fee for their services.

Page 10 of 11 January 18, 2007
This policy option may not be a large revenue generator; however, it may be more advantageous from an efficiency standpoint. Option 12: Host a Regional Sports Tournament Hosting a state or regional youth sports championship (e.g. aquatics or basketball) is an economic driver that would bring people and money into the City. These events are often a full weekend, with large numbers of people coming from great distances. Staff to man the event is usually provided by the sponsoring organization and parent volunteers. The City would benefit from participants, parents, and officials that are staying in area hotels (TOT) and sales tax generated from dining out and shopping while in the area. It would also be a good marketing tool for the City to build some goodwill. Culver City had a marathon a number of years ago which had similar benefits for the City. Where the marathon was cumbersome and disruptive due to the large number of surface streets that needed to be closed, a youth sports championship would be much less disruptive. There would be some logistical challenges in dealing with the increased traffic and parking during a “championship” weekend. If the Council directs staff to pursue this option, more research will be done to check the feasibility and calculate the economic benefits and direct and indirect costs.
Page 11 of 11 January 18, 2007
Fiscal Impact: Many of the policy options would require a significant amount of research to determine their feasibility. Prior to investing a large amount of time into research every option, staff would like to get direction from the Council on those options that they feel are most feasible for implementation. 1. Review and Update City Fees & Charges 2. Privatize Graphics Services 3. Increase Utilization of Vet’s Memorial Building 4. Advertise In/On City Vehicles 5. Sponsorship of City-owned Property/Programs 6. Lease City Property for Special Events 7. Review Parking Rates at All City Structures & Meters 8. Charge for Use of Parks 9. Increase City’s Fines 10. Increase e-Commerce and Online Billing 11. Create Online “Property Room” for Asset Seizure Auctions 12. Host a Regional Sports Tournament Recommendation: It is recommended that the City Council review each of the policy driven options and direct staff to begin the process of researching any of the above options that best fit the financial goals of the City.
Page 1 of 4 January 18, 2007
Comprehensive Financial Plan Cost Reduction Subcommittee
REPORT OF FINDINGS INTRODUCTION Over the past few months, the Cost Reduction Subcommittee has met on several occasions to brainstorm and generate ideas for reducing the City’s costs and increasing operational efficiency. In addition to the ideas proposed by members of the subcommittee, cost reduction proposals submitted by two of the City’s bargaining groups (CCMG and CCEA) during MOU negotiations were reviewed. The subcommittee took all proposals seriously and reviewed and considered the merits of every proposal. The following report summarizes the cost reduction proposals that the Committee received. While not every proposal is included in this report, the subcommittee has attempted to present the most feasible options for the City Council’s consideration. Many of the cost reduction proposals contained in this report are operational efficiency issues. The City Manager plans to work diligently with each Department Head to take a long hard look at the organizational structure and operational processes in each area. COST REDUCTION OPTIONS Options:
1. Review and Evaluate the City’s Organizational Efficiency 2. Staff Certain Public Safety Positions with Civilians 3. Reduce Overtime and Shift Trades 4. Flexible Compensation & Benefit Plans
• Two tiered PERS program for new hires • Medical Insurance Outside of PERS • Cafeteria Plan for Medical Insurance
5. Explore Photovoltaic Panels (Solar Energy) at City Hall 6. Reconsider the City’s Call Back Policy 7. Reduce Subsidies to Special Events (e.g. Car Show and Fiesta La Ballona) 8. Tighten Policy for use of City Credit Cards 9. Tighten Up & Enforce Central Purchasing Policy
Page 2 of 4 January 18, 2007
Option 1: Review and Evaluate the City’s Organizational Efficiency The elimination of positions that took place as part of the budget cutbacks in fiscal years 2002-03 and 2003-04 has placed an additional burden on current staff. Consequently, it is more important than ever that all operating departments are “working smarter not harder” in order to maximize efficiency and productivity. There are a number of areas in which the City can take advantage of technological advancements to increase revenue collection and facilitate the flow of information leading to an even greater level of efficiency and productivity. Additionally, the City should evaluate its organizational efficiency and internal procedures to ensure effective work-flow and lines of communication between and within operating departments. Some efficient programs/practices that staff has already begun to develop and implement include a two year budget cycle, customer relationship management software, enhanced software for generating financial management reports, and the establishment of e-commerce capabilities. The City Managers office will continue to work with Department Heads to explore methods to further increase organizational and operational efficiency. Option 2: Staff Certain Positions in the Police and Fire Departments with Civilians With the implementation of the 2006-07 budget, the Police Department has begun the process of staffing certain positions with civilians rather than sworn personnel. The City Manager’s Office will continue to work with the public safety departments to staff positions with civilians where appropriate. Option 3: Reduce Overtime and Shift Trades Overtime costs for the General Fund are approximately $1.4 million (excluding Constant Staffing for the Fire Department, which is $1.2 million). Some overtime is unavoidable as emergencies and special situations will arise that require employees to work beyond their regular schedule. However, one possible way to manage overtime is to encourage flexible scheduling between the manager and employee. For example, with adequate advance notice, an employee who needs to attend a night meeting may agree with his/her supervisor to start work later in the morning rather than be paid overtime for the night meeting. Option 4: Flexible Benefits and Compensation Packages Prior to the next MOU negotiations, the subcommittee recommends that the City look into the following benefit related cost containment measures:
• Two tiered PERS program for new hires • Medical Insurance Outside of PERS • Cafeteria Plan for Medical Insurance
Page 3 of 4 January 18, 2007
Option 5: Explore Solar Energy at City Hall Photovoltaic (PV) energy is a solar power technology that uses solar cells or solar photovoltaic arrays to convert energy from the sun into electricity. Solar powered pocket calculators are an example of a common everyday use of this technology. Solar arrays are increasingly incorporated into new domestic and industrial buildings as a principal or ancillary source of electrical power. Typically, an array is incorporated into the roof or walls of a building, roof tiles can now even be purchased with an integrated PV cell. Arrays can also be retrofitted into existing buildings; in this case they are usually fitted on top of the existing roof structure. Alternatively, an array can be located separately from the building but connected by cable to supply power for the building. Large-scale incentive programs, offering financial incentives like the ability to sell excess electricity back to the public grid (aka feed-in or grid-tied), have greatly accelerated the pace of solar PV installations in many countries, including the US. Grid-tied systems represent the largest growth area. In the US, with incentives from state governments, power companies and the federal government, growth is expected to climb. Net metering programs are one type of incentive driving growth in solar panel use. Net metering allows electricity customers to get credit for any extra power they send back into the grid. Grid-connected systems are connected to the utility grid through a direct current to alternating current (DC-AC) inverter. When the load required in the building is more than that supplied by the PV array, electricity will be drawn from the grid. Conversely, when the PV array is generating more power than is needed in the building then electricity will be exported to the grid. The most important issue with solar panels is cost. Because of much increased demand, the price of silicon used for most panels is now experiencing upward pressure. This has caused developers to start using other materials and thinner silicon to keep cost down. Due to economies of scale, solar panels get less costly as people use and buy more — as manufacturers increase production, the cost is expected to continue to drop in the years to come. As of early 2006, the average cost per installed watt was about $6.50 to $7.50, including panels, inverters, mounts, and electrical items. In the short run, installing photovoltaic panels at City Hall would be a capital investment; However, between the decrease in energy bills and possibility of credits from a net metering program, the PV array could pay for itself in 10 to 15 years and save the City a lot of money in the long run. Option 6: Reconsider the City’s Call Back Policy The City may want to review and update its call-back policy and limit standing pay to those positions that are truly needed in emergencies (i.e. electrical) and eliminate other positions (i.e. painters) whose services may not be required on a time-critical basis. A similar analysis of the necessity for “beeper pay” may also be conducted.
Page 4 of 4 January 18, 2007
Alternately, the City may wish to allow departments to designate a certain number of call back slots, which can be filled based on expected conditions or usual problems rather than designating specific trades or positions. Option 7: Reduce Subsidies to Special Events There are a number of special community events that the City subsidizes either through a direct contribution or in-kind services. Some of these events include Fiesta La Ballona, Culver City Car Show, and Summer Sunset Music Festivals. Some of these events have grown in popularity to the point that they are revenue neutral for the organizations that operate them; therefore, the City can reduce its direct monetary contribution without having to downsize the event. For example, Fiesta La Ballona generates sufficient revenue through vendor rentals and donations that a monetary contribution from the City may no longer be necessary. Option 8: Tighten Policy for Use of City Credit Cards Staff is currently reviewing the City’s purchasing card policy to tighten up controls. Option 9: Tighten Up and Enforce Central Purchasing Policy With the increased use of purchasing cards and a desire by departments for more flexibility in choosing specific vendors and products, purchasing has become less centralized over the past few years. Having a strong central purchasing operation allows the City to take advantage of discounts for bulk purchases and bulk deliveries. However, in exchange for lower prices, procuring products through purchasing may limit the brand name products available to the departments and may take an extra day or two to receive, which requires more advanced planning by staff. Recommendation: It is recommended that the City Council review each of the cost reduction options and direct staff to begin the process of researching any of the above options that best fit the financial goals of the City.