C. Bordoy UWC Maastricht Demand & Supply (Tragakes, 2012, pp. 20-29)
23
C. Bordoy C. Bordoy UWC Maastricht UWC Maastricht Demand & Supply Demand & Supply (Tragakes, 2012, pp. 20-29) (Tragakes, 2012, pp. 20-29)
-
Upload
adela-morrison -
Category
Documents
-
view
213 -
download
0
Transcript of C. Bordoy UWC Maastricht Demand & Supply (Tragakes, 2012, pp. 20-29)

C. BordoyC. BordoyUWC MaastrichtUWC Maastricht
Demand & SupplyDemand & Supply
(Tragakes, 2012, pp. 20-29)(Tragakes, 2012, pp. 20-29)

Competitive marketsCompetitive markets MarketMarket can be defined as any kind of can be defined as any kind of
arrangement where buyers and sellers of arrangement where buyers and sellers of goods, services or resources are linked goods, services or resources are linked together to carry out an exchange.together to carry out an exchange.
Goods & services are sold in product Goods & services are sold in product markets. Resources are sold in resource markets. Resources are sold in resource markets.markets.
In microeconomics, In microeconomics, competitioncompetition refers to refers to the situation where many buyers and sellers the situation where many buyers and sellers act independently, so that no one has the act independently, so that no one has the ability to influence the price at which a ability to influence the price at which a product is sold in the market.product is sold in the market.
C. BordoyC. BordoyUWC MaastrichtUWC Maastricht

Market power: control over the price by a seller.Market power: control over the price by a seller. The greater the market power, the greater is The greater the market power, the greater is
the control over price.the control over price. The greater the degree of competition between The greater the degree of competition between
sellers, the smaller their market power and the sellers, the smaller their market power and the weaker is their control over the price.weaker is their control over the price.
A competitive market is composed of large A competitive market is composed of large numbers of sellers and buyers acting numbers of sellers and buyers acting independently, so that no one individual seller independently, so that no one individual seller has the ability to control the price of the has the ability to control the price of the product. Instead, the price is determined by the product. Instead, the price is determined by the forces of demand and supply.forces of demand and supply.
C. BordoyC. BordoyUWC MaastrichtUWC Maastricht

Demand Concerned with the behaviour of buyers
(consumers) in product markets. The demand of an individual consumer
indicates the various quantities of a good or service the consumer is willing and able to buy at different possible prices during a particular time period, ceteris paribus. Willing= consumer wants to buy the good Able= consumer can afford the good

Demand schedule
Price of chocolate bars
Quantity demanded (per week)
5 2
4 4
3 6
2 8
1 10
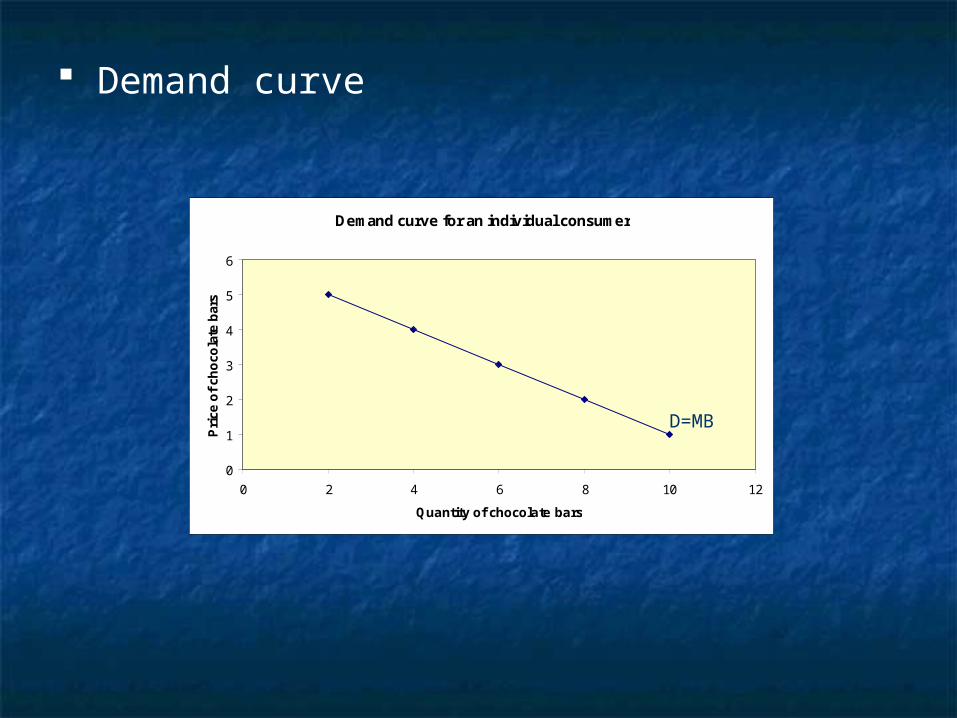
Demand curve
Demand curve for an individual consumer
0
1
2
3
4
5
6
0 2 4 6 8 10 12
Quantity of chocolate bars
Pri
ce o
f ch
oco
late
bar
s
D=MB

The Law of demand: there is a negative causal relationship between the price of a good and its quantity demanded over a particular time period, ceteris paribus.
The reason for the negative slope of the demand curve is the principle of decreasing marginal utility: since marginal benefit falls as quantity consumed increases, the consumer will be willing to buy each extra unit only if the price falls.

Different preferences → different MBs → different demand curves for different consumers.
Market demand is the sum of all individual demands for a good. It is also the sum of consumers’ marginal benefits.

Non-price determinants of demand
The variables other than price that can influence demand and are assumed to be constant by use of the ceteris paribus assumption.
When any of these variables change the entire demand curve shifts to the right or to the left.
Rightward shift (increase in demand): more is demanded for a given price.
Leftward shift (decrease in demand): less is demanded for a given price.
They include the following:

Income for normal goods. A normal good is a good such that the demand for it increases when income increases (most goods are normal). An increase in income will lead to a rightward shift of the demand curve.
Income for inferior goods. A good is inferior if the demand for it falls as income increases (examples: secon-hand clothes, used cars). As income increases, these goods are substituted by more expensive alternatives and their demand decreases, causing a shift of their demand curve.

Preferences & tastes. If preferences change in favour of the product, its demand increases and its demand curve shifts to the right.
Prices of substitute goods. Two goods are substitutes if they satisfy a similar need. For ex: Coke and Pepsi. A fall in the price of one (Coke) results in a fall in the demand for the other (Pepsi), causing a decrease in its demand and a leftward shift of its demand curve.

Prices of complementary goods. Two goods are complements if they are consumed together. For ex: DVDs and DVD players. An increase in the price of one will lead to a decrease in the demand for the other.
Demographic (population) changes (changes in the number of buyers).
Expectations about future prices. If the price of a good is expected to increase in the future, consumers may increase their demand in the present.

C. BordoyC. BordoyUWC MaastrichtUWC Maastricht
A
B
DD3 D1 D2
decrease in D
increase in D
change in quantity
demanded
Q2 Q
PP
Q1Q
P1
P2
A movement along the demand curve
A shift of a demand curve caused by a change in a determinant of demand

Supply Concerned with the behaviour of
sellers (firms in product markets). The supply of an individual firm
indicates the various quantities of a good a firm is willing and able to produce and supply to the market for sale at different possible prices, during a particular time period, ceteris paribus.

Supply schedule
Price of chocolate bars
Quantity supplied
(per week)
5 600
4 500
3 400
2 300
1 200

Supply curve

The Law of supply: there is a positive causal relationship between the quantity of a good supplied over a particular time period and its price, ceteris paribus.
Why the supply curve slopes upward? Higher prices mean higher profits and so the firm faces an incentive to produce more output.
Market supply is the sum of all individual firms’ supplies for a good. It indicates the total quantities of a good that firms are willing and able to supply in the market at different possible prices.

The vertical supply curve. The quantity supplied is fixed and is independent of price. Two reasons:
1. There is no time to produce more of the good. For instance, theatre tickets in a theatre because there is a fixed number of seats.
2. There is no possibility of ever producing more of the good. For ex, original antiques, stradivarius violins, original paintings,...
Non-price determinants of supply
Factors other than the price that can influence supply. Changes in these factors cause shifts of the supply curve.
Rightward shift (increase in supply): more is supplied for a given price.
Leftward shift (decrease in supply): less is supplied for a given price.
The number of firms. Costs of factors of production (resource
prices). If a factor price rises, production costs increase, production becomes less profitable and the firm produces less.
Technology. A new improved technology lowers costs of production, making production more profitable.
Competitive supply of two or more products. The firm can produce two goods and they compete for the use of the same resources: producing more of one means producing less of the other.
Joint supply (of two or more products). The firm cannot produce more of one without producing more of the other. Example: butter and skimmed milk. An increase in the price of one leads to an increase in its quantity supplied and an increase in the supply of the other.
Firm expectations. If the price is expected to rise, the firm may retain some of its current supply in order to sell it at a higher price in the future. This results in a fall in supply in the present (leftward shift).

Taxes (indirect taxes or taxes on profits). Taxes are treated by firms as costs of production so ↑ tax → supply decreases.
Subsidies. A subsidy is a payment made to the firm by the government. It has the opposite effect of a tax. The introduction or increase of a subsidy results in an increase in supply.
‘Shocks’ or sudden unpredictable events, such as weather conditions (for agricultural products), war, or natural/man-made catastrophes (oil spill in 2010 caused a decrease in the supply of locally produced seafood)
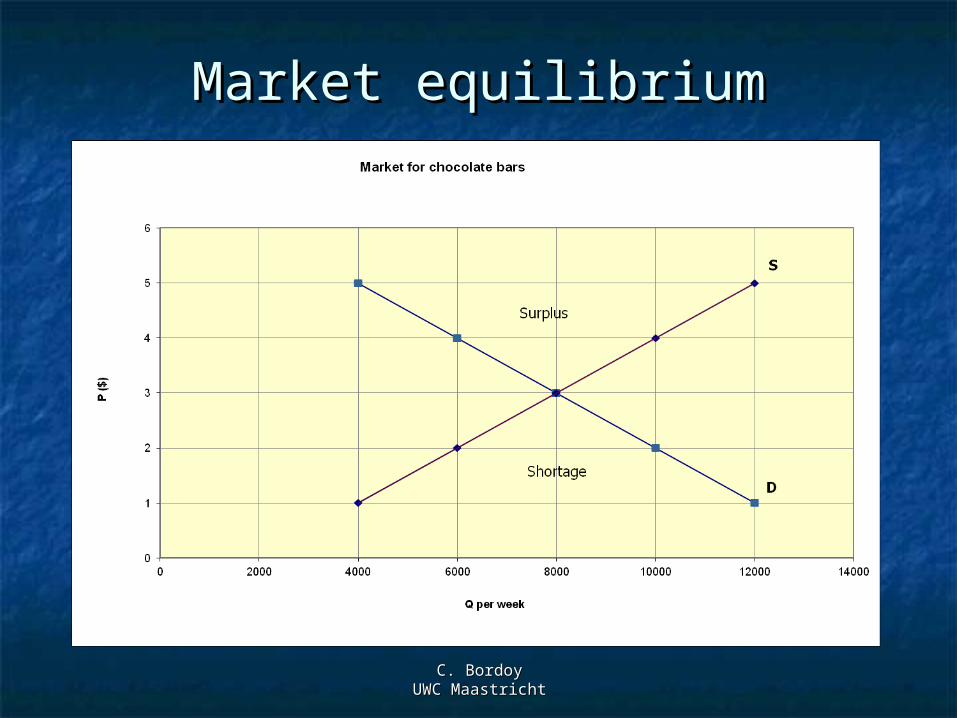
Market equilibriumMarket equilibrium
C. BordoyC. BordoyUWC MaastrichtUWC Maastricht


![PowerPoint Presentation · Tanzania WATERFORD KAMI-ILABA UWC Eswatini UWC . uWC E]NISHING HIGH scã00L IN' Wc E IN THE . uWC FOR WORLD PEACE.& uWC U'UWC IMAÇINE FINISHING SCHOOL](https://static.fdocuments.us/doc/165x107/5fa9c919cbc95373cb1f03db/powerpoint-presentation-tanzania-waterford-kami-ilaba-uwc-eswatini-uwc-uwc-enishing.jpg)