C ASSOCIATES Volatility Report 2018 · 2018 Fortune 500 and S&P 500 Companies (673 Total) –...
56
CRIST|KOLDER ASSOCIATES Volatility Report 2018
Transcript of C ASSOCIATES Volatility Report 2018 · 2018 Fortune 500 and S&P 500 Companies (673 Total) –...

CRIST KOLDER|ASSOCIATES
CRIST|KOLDER ASSOCIATESVolatility Report 2018

CRIST KOLDER|ASSOCIATES
CRIST|KOLDER Volatility Report
Table of ContentsMethodology Page 2
Report Highlights Page 5
Location Page 6
Executive Turnover Page 9
C-Suite Career Paths Page 18
Diversity Landscape Page 36
Education Background Page 44
Crist|Kolder 2018 Volatility Report1

CRIST KOLDER|ASSOCIATES
The annual Crist|Kolder Volatility Report of America’s Leading Companiesexamines the backgrounds and measures the turnover of C-Suite executives in aportfolio of 673 of America’s leading companies from the Fortune 500 and the S&P500 Indexes.
Crist|Kolder Associates examines each of the portfolio companies individually,noting personnel and organizational changes in the CEO, CFO, and COO roles. Eachexecutive’s background is explored, including the path taken to get to their currentrole: industry background, functional experience, and education. This includesdemographic information such as age, gender, and race.
This is the fifteenth year of the Crist|Kolder Volatility Report, though information forthe report goes back to 1995. This Summer 2018 release of the Crist|Kolder VolatilityReport contains data through August 1, 2018.
Methodology
2

CRIST KOLDER|ASSOCIATES
Methodology Notes• 2018 Fortune 500 and S&P 500 Companies (673 Total)
– Companies Removed from 2017: 30– Companies Added: 30– Public Companies: 644– Private Companies: 29
• Data tracked January 1, 1995 through August 1, 2018; update occurs every December
• Industries broken down by Fortune’s classification system and then grouped into designated larger categories based on SIC codes and judgment of Crist|Kolder Associates
• Resources:• Bloomberg: www.bloomberg.com• Businessweek: www.businessweek.com• Capital IQ: www.capitaliq.com• Fortune: www.fortune.com• LinkedIn: www.linkedin.com• SEC Company Filings: www.sec.gov• Yahoo Finance: www.finance.yahoo.com• Individual company websites
Color KeyBlue = CEO
Green = CFOPurple = COO
Graphs and data correspond with the color key above
Financial20.95%
Industrial15.90%
Services12.63%
Technology12.18%
Energy11.14%
Healthcare10.25%
Consumer9.51%
Retail7.43%
Company Industry Breakdown
3
CRIST KOLDER|ASSOCIATES
Turnover: The rate at which there is a new hire for a C-Suite position
Volatility: Turnover is noted when the executive starts in the new role (as opposed to the date of announcement)
Internal change: An executive is promoted to a role at the company where he/she is already employed
External change: An executive is recruited to a position at a company to which his/her previous position has no formal ties
Mergers: In a merger of equals, the combined company is considered a new entity. A change in leadership, therefore, is marked for all mergers. A change is internal if the executive was previously employed by either of the merging companies
Acquisitions: In the event an executive from the acquired company is appointed to a role in the acquiring company, it is an internal change
Partial year: Designation indicates data gathered up to August 1, 2018, not a projection
COO Role: If no individual operates under the title of COO at a given company, description of duties, executive hierarchy, and compensation are simultaneously analyzed to determine if someone with another title fulfills this role
Definitions
4

CRIST KOLDER|ASSOCIATES
Report Highlights• As the S&P 500 reaches historic price levels, C-Suite turnover is projected to reach an all-time high by year-end (Page 14)
• Companies are beginning to look at more outside talent when hiring a CEO (Page 15)
• The number of companies with a COO continues to decrease (Page 16)
• CEOs primarily transition from a President/COO chair or a Divisional President position (Page 19)
• C-Suite transitions from the CFO role to the CEO role have increased in 2018 (Page 21)
• Less than 20% of sitting CFOs have prior CFO experience at another company (Page 24)
• Technology sector CFOs usually have the least amount of company experience before taking their position (Page 28)
• The average age of hire for C-Suite positions has risen 15% since 2005 (Page 31)
• Less than 10% of CFOs are over 60 years of age (Page 35)
• The count of Female CFOs has reached an all-time high (Page 37)
• In both the CEO and CFO positions, diversity is at an all-time high (Page 40, 42)
• Within the United States, more CEOs attended schools in the Big Ten than in any other conference (Page 45)
• The Big Ten Conference has claimed the most sitting CFOs for more than five consecutive years (Page 47)
• 64% of CEOs have an advanced degree, while 50% of CFOs have an MBA (Pages 53, 54)
• The path to the C-Suite runs through eight leading MBA programs (Page 55)
5

CRIST KOLDER|ASSOCIATES
Location
6

CRIST KOLDER|ASSOCIATES
Company Headquarters by Location
2018 Fortune 500 and S&P 500 (673 Companies)
*Non-shaded (white) states have no company headquarters located within that state
7

CRIST KOLDER|ASSOCIATES
Industry Breakdown by Region
2018 Fortune 500 and S&P 500 (673 Companies)
Regions: Northeast, Midwest, South, and West as determined by the United States Census Bureau
Industrial Healthcare Services Technology Retail Energy Financial ConsumerMidwest 38.3% 20.3% 15.3% 3.7% 30.0% 16.0% 25.5% 31.3%South 25.2% 15.9% 32.9% 20.7% 40.0% 60.0% 19.1% 20.3%Northeast 22.4% 37.7% 29.4% 22.0% 14.0% 13.3% 36.2% 32.8%West 8.4% 20.3% 20.0% 48.8% 16.0% 9.3% 17.0% 12.5%Foreign 5.6% 5.8% 2.4% 4.9% 0.0% 1.3% 2.1% 3.1%
0%
10%
20%
30%
40%
50%
60%
70%
80%
90%
100%
8

CRIST KOLDER|ASSOCIATES
Executive Turnover
9

CRIST KOLDER|ASSOCIATES
1995 1996 1997 1998 1999 2000 2001 2002 2003 2004 2005 2006 2007 2008 2009 2010 2011 2012 2013 2014 2015 2016 2017 2018*CEO 8.1% 10.4%11.9%11.9%12.0%14.7%12.9%10.4% 9.3% 11.9%14.1% 9.6% 10.0%11.8% 8.8% 8.5% 11.5% 9.5% 11.8% 9.9% 11.8%12.3%10.3%13.4%CFO 13.5%12.4%16.2%15.8%17.5%17.9%15.3%13.8%12.1%14.3%16.0%17.2%17.3%18.3%13.4%12.3%11.8%11.4%17.1%15.4%14.8%17.7%15.8%16.6%COO 16.1%16.6%24.7%19.7%25.6%21.3%16.1%18.1%17.8%22.0%20.4%24.2%21.6%19.9%19.8%19.8%23.1%22.8%17.6%20.8%23.9%23.4%30.4%32.0%
0%
5%
10%
15%
20%
25%
30%
35%
Perc
ent T
urno
vers
COO turnover continues to increase in 2018
CEO/CFO/COO Volatility (1995-2018)2018 Fortune 500 and S&P 500 Companies (673 Companies; 679 Sitting CEOs; 670 Sitting CFOs; 215 Sitting
COOs)
*Projection of 2018 year endPartial year:CEO: 9.6%CFO: 10.9%COO: 21.9%
CEO Historical Average: 11.1%
COO Historical Average: 21.7%
CFO Historical Average: 15.1%
10

CRIST KOLDER|ASSOCIATES
Notable CEO changes in 2018
• Cardinal Health, Inc.• Chevron Corp.• Verizon Communications, Inc.• Lowe’s Companies, Inc. • Intel Corp. • Sysco Corp. • 3M Company• American Express Company
The Industrial and Technology sectors account for the most CEO turnover*
CEO Volatility by Industry2018 Fortune 500 and S&P 500 (673 Companies)
Retail7.7%
Healthcare7.7%
Energy7.7%
Services12.3% Consumer
13.8%
Financial13.8%
Technology18.5%
Industrial18.5%
*Year to date 11
CRIST KOLDER|ASSOCIATES
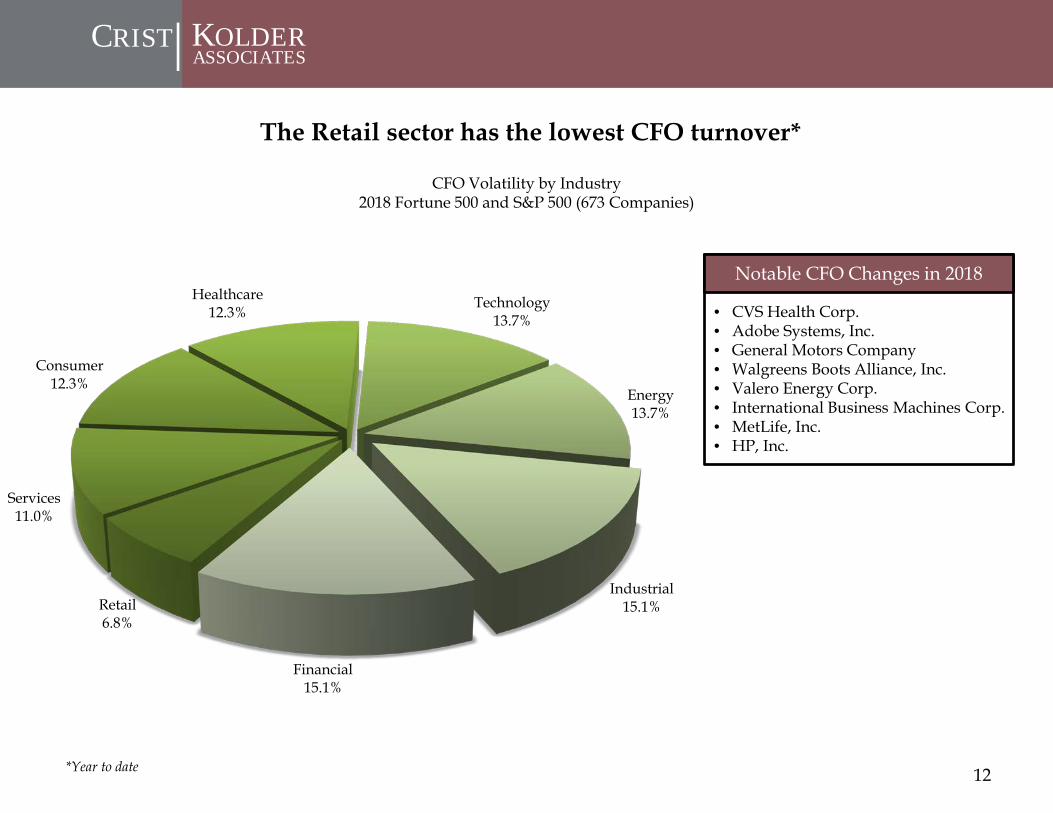
Notable CFO Changes in 2018
• CVS Health Corp.• Adobe Systems, Inc.• General Motors Company• Walgreens Boots Alliance, Inc.• Valero Energy Corp.• International Business Machines Corp.• MetLife, Inc.• HP, Inc.
The Retail sector has the lowest CFO turnover*
CFO Volatility by Industry2018 Fortune 500 and S&P 500 (673 Companies)
Retail6.8%
Services11.0%
Consumer12.3%
Healthcare12.3%
Technology13.7%
Energy13.7%
Industrial15.1%
Financial15.1%
*Year to date 12

CRIST KOLDER|ASSOCIATES
Notable COO Changes in 2018• JPMorgan Chase & Company• Express Scripts Holding Company• Valero Energy Corp.• United Parcel Service, Inc.• Pfizer, Inc.• HP, Inc.• Northrop Grumman Corp.• Philip Morris International, Inc.
COO Volatility by Industry2018 Fortune 500 and S&P 500 (673 Companies)
The Financial sector constitutes over a third of COO turnover*
Retail4.3%
Healthcare4.3%
Technology8.5%
Consumer8.5%
Energy10.6%
Industrial12.8%
Services14.9%
Financial36.2%
*Year to date 13
CRIST KOLDER|ASSOCIATES
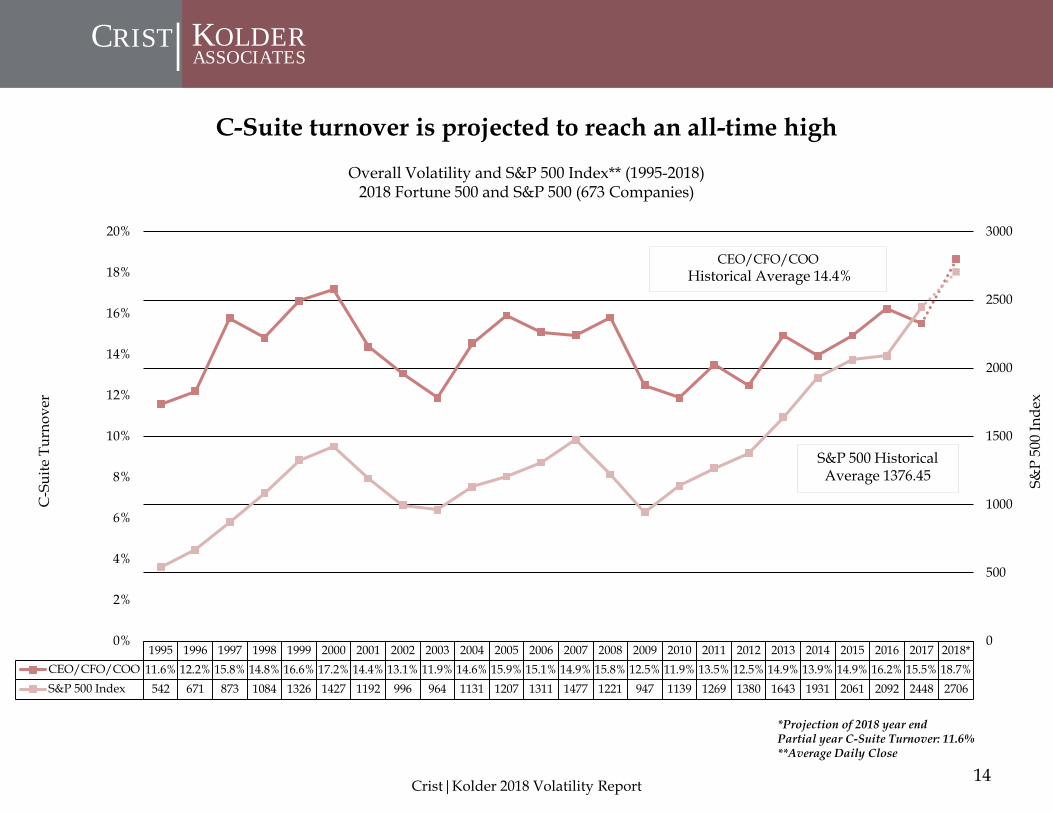
1995 1996 1997 1998 1999 2000 2001 2002 2003 2004 2005 2006 2007 2008 2009 2010 2011 2012 2013 2014 2015 2016 2017 2018*CEO/CFO/COO 11.6% 12.2% 15.8% 14.8% 16.6% 17.2% 14.4% 13.1% 11.9% 14.6% 15.9% 15.1% 14.9% 15.8% 12.5% 11.9% 13.5% 12.5% 14.9% 13.9% 14.9% 16.2% 15.5% 18.7%S&P 500 Index 542 671 873 1084 1326 1427 1192 996 964 1131 1207 1311 1477 1221 947 1139 1269 1380 1643 1931 2061 2092 2448 2706
0
500
1000
1500
2000
2500
3000
0%
2%
4%
6%
8%
10%
12%
14%
16%
18%
20%
S&P
500
Inde
x
C-S
uite
Tur
nove
r
S&P 500 Historical Average 1376.45
C-Suite turnover is projected to reach an all-time high Overall Volatility and S&P 500 Index** (1995-2018)
2018 Fortune 500 and S&P 500 (673 Companies)
*Projection of 2018 year endPartial year C-Suite Turnover: 11.6%**Average Daily Close
Crist|Kolder 2018 Volatility Report
CEO/CFO/COOHistorical Average 14.4%
14
CRIST KOLDER|ASSOCIATES
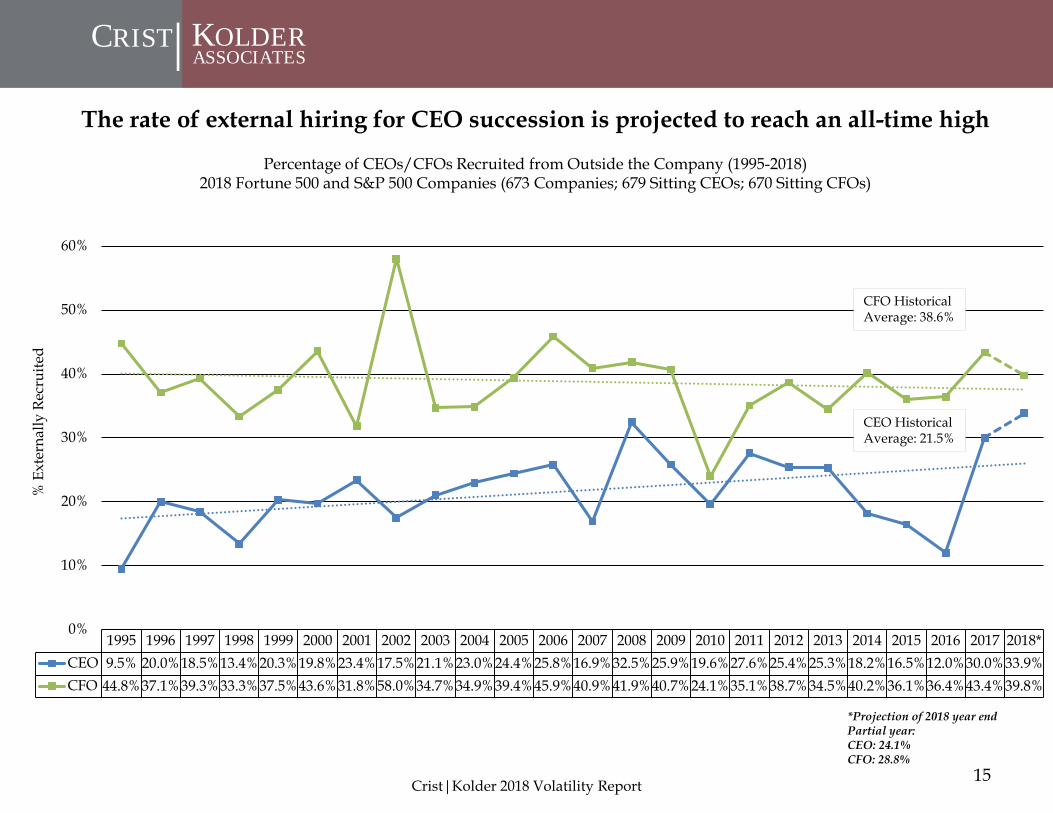
1995 1996 1997 1998 1999 2000 2001 2002 2003 2004 2005 2006 2007 2008 2009 2010 2011 2012 2013 2014 2015 2016 2017 2018*CEO 9.5% 20.0%18.5%13.4%20.3%19.8%23.4%17.5%21.1%23.0%24.4%25.8%16.9%32.5%25.9%19.6%27.6%25.4%25.3%18.2%16.5%12.0%30.0%33.9%CFO 44.8%37.1%39.3%33.3%37.5%43.6%31.8%58.0%34.7%34.9%39.4%45.9%40.9%41.9%40.7%24.1%35.1%38.7%34.5%40.2%36.1%36.4%43.4%39.8%
0%
10%
20%
30%
40%
50%
60%
% E
xter
nally
Rec
ruite
d
The rate of external hiring for CEO succession is projected to reach an all-time high
Percentage of CEOs/CFOs Recruited from Outside the Company (1995-2018)2018 Fortune 500 and S&P 500 Companies (673 Companies; 679 Sitting CEOs; 670 Sitting CFOs)
*Projection of 2018 year endPartial year:CEO: 24.1%CFO: 28.8%
Crist|Kolder 2018 Volatility Report
CEO Historical Average: 21.5%
CFO Historical Average: 38.6%
15
CRIST KOLDER|ASSOCIATES
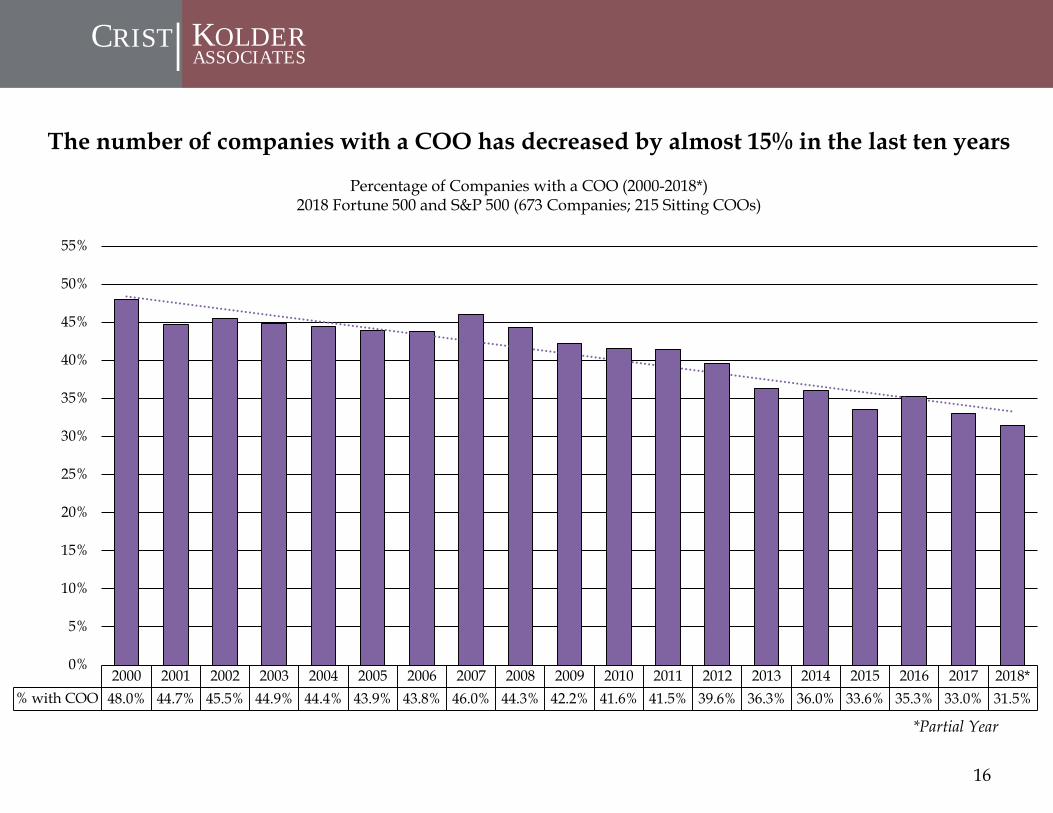
The number of companies with a COO has decreased by almost 15% in the last ten years
Percentage of Companies with a COO (2000-2018*)2018 Fortune 500 and S&P 500 (673 Companies; 215 Sitting COOs)
*Partial Year
2000 2001 2002 2003 2004 2005 2006 2007 2008 2009 2010 2011 2012 2013 2014 2015 2016 2017 2018*% with COO 48.0% 44.7% 45.5% 44.9% 44.4% 43.9% 43.8% 46.0% 44.3% 42.2% 41.6% 41.5% 39.6% 36.3% 36.0% 33.6% 35.3% 33.0% 31.5%
0%
5%
10%
15%
20%
25%
30%
35%
40%
45%
50%
55%
16

CRIST KOLDER|ASSOCIATES
The COO role is least common within the Technology sector
Percentage of Companies with a COO by Industry2018 Fortune 500 and S&P 500 Companies (673 Companies; 215 Sitting COOs)
Financial Services Retail Consumer Energy Industrial Healthcare Technology% With COO 43.0% 36.5% 34.2% 30.3% 31.1% 25.2% 24.6% 22.6%
0%
5%
10%
15%
20%
25%
30%
35%
40%
45%
50%
17

CRIST KOLDER|ASSOCIATES
C-Suite Career Paths
18

CRIST KOLDER|ASSOCIATES
Over 75% of Sitting CEOs were elevated from general management roles
Immediate Previous Position of Sitting CEOs (Internal or External)2018 Fortune 500 and S&P 500 (673 Companies; 679 Sitting CEOs)
19
• Internal Divisional President includes CEO of subsidiary company
• President/COO: Executive held both President and COO roles at the same time
• Operations Executive: VP/SVP/EVP of Operations• Other: i.e. chairman, marketing, risk, consulting,
commerce, investment officer, partner, managing director, general counsel
DivisionalPresident COO President CFO President/COO CEO Other Operaring
Executive Founder
% fromPosition 27.0% 26.5% 16.3% 6.8% 6.5% 6.3% 4.1% 3.8% 2.7%
0%
5%
10%
15%
20%
25%
30%

CRIST KOLDER|ASSOCIATES
The most common path to the CEO position is an internal promotion from the COO role
Immediate Previous Position of Sitting CEOs (Internal vs. External)2018 Fortune 500 and S&P 500 (673 Companies; 679 Sitting CEOs)
20
• Internal Divisional President includes CEO of subsidiary company
• President/COO: Executive held both President and COO roles at the same time
• Operations Executive: VP/SVP/EVP of Operations• Other: i.e. chairman, marketing, risk, consulting,
commerce, investment officer, partner, managing director, general counsel
DivisionalPresident COO President CFO President/COO CEO Other Operaring
Executive Founder
External 8.0% 1.2% 0.6% 0.3% 0.0% 6.3% 0.4% 1.0% 0.0%Internal 19.0% 25.3% 15.8% 6.5% 6.5% 0.0% 3.7% 2.8% 2.7%
0%
5%
10%
15%
20%
25%
30%

CRIST KOLDER|ASSOCIATES
C-Suite transitions from the CFO role to the CEO role have increased in 2018
Percentage of Sitting CEOs coming directly from a CFO Chair (Internal or External)2018 Fortune 500 and S&P 500 (673 Companies; 679 Sitting CEOs)
2012 2013 2014 2015 2016 2017 2018% from CFO Role 5.6% 5.8% 6.2% 6.5% 7.8% 6.2% 6.9%
0%
1%
2%
3%
4%
5%
6%
7%
8%
9%
21

CRIST KOLDER|ASSOCIATES
CFO movement to the CEO position is most prominent in the Financial sector
Percentage of Sitting CEOs coming from a CFO Chair by Industry (Internal or External)2018 Fortune 500 and S&P 500 (673 Companies; 679 Sitting CEOs; 46 CEOs Represented)
Financial Industrial Technology Services Energy Consumer Healthcare Retail% from CFO 28.3% 17.4% 17.4% 10.9% 10.9% 8.7% 4.3% 2.2%
0%
5%
10%
15%
20%
25%
30%
22

CRIST KOLDER|ASSOCIATES
CEOs in the Financial sector hold the most Chairman titles
Sitting CEOs that are also Chairman*2018 Fortune 500 and S&P 500 (673 Companies; 679 Sitting CEOs; 287 Sitting CEOs that are also Chairman)
* Sitting Chairman of their current company
Financial Industrial Services Energy Healthcare Consumer Technology RetailCEO and Chairman 63 47 42 37 32 31 22 13
0
10
20
30
40
50
60
70
Cou
nt o
f CEO
s th
at a
re a
lso
Cha
irm
an
23

CRIST KOLDER|ASSOCIATES
Less than 20% of sitting CFOs have prior CFO experience at another company
Percentage of Sitting CFOs by Immediate Previous Position (Internal or External)2018 Fortune 500 and S&P 500 (673 Companies; 670 Sitting CFOs)
CFO
CorporateController /
ChiefAccounting
Officer
CorporateFinance Treasurer Divisional
CFO
DivisionalPresident/OperationsExecutive
Strategy/M&A Other President/
COOInvestorRelations CEO
ChiefAdministrative
Officer
% from Position 18.5% 18.4% 16.9% 11.3% 10.8% 8.9% 6.8% 4.1% 2.0% 1.4% 0.6% 0.5%
0%
2%
4%
6%
8%
10%
12%
14%
16%
18%
20%
24
•Internal Divisional Finance Officer includes CFOs of subsidiary companies•External CFO recruitment means previous CFO of another company•Operations Executive: President, VP/SVP/EVP Operations•Corporate Finance Executive: VP, SVP, EVP of Finance•Strategy/M&A: Investment Banking, Development, Planning or Strategy•Other: tax, law, IT, risk, consulting, etc.

CRIST KOLDER|ASSOCIATES
Internally promoted CFOs most often transition from the Corporate Controller or Chief Accounting Officer role
•Internal Divisional Finance Officer includes CFOs of subsidiary companies•External CFO recruitment means previous CFO of another company•Operations Executive: President, VP/SVP/EVP Operations•Corporate Finance Executive: VP, SVP, EVP of Finance•Strategy/M&A: Investment Banking, Development, Planning or Strategy•Other: tax, law, IT, risk, consulting, etc.
Percentage of Sitting CFOs by Immediate Previous Position (Internal or External)2018 Fortune 500 and S&P 500 (673 Companies; 670 Sitting CFOs)
CFO
CorporateController /
ChiefAccounting
Officer
CorporateFinance Treasurer Divisional
CFO
DivisionalPresident/OperationsExecutive
Strategy/M&A Other President/
COOInvestorRelations CEO
ChiefAdministrative
Officer
External 18.5% 2.3% 1.7% 0.8% 3.0% 1.8% 1.4% 1.7% 0.9% 0.5% 0.45% 0.0%Internal 0.0% 16.1% 15.1% 10.5% 7.8% 7.1% 5.4% 2.4% 1.1% 0.9% 0.15% 0.5%
0%
2%
4%
6%
8%
10%
12%
14%
16%
18%
20%
N/A
25

CRIST KOLDER|ASSOCIATES
Only 39% of CFOs have public accounting experience
2018 CFOs with Public Accounting Backgrounds2018 Fortune 500 and S&P 500 (673 Companies; 670 Sitting CFOs; 261 CFOs Represented*)
*Multiple CFOs have worked for more than one Big Five public accounting firm
26Crist|Kolder 2018 Volatility Report
31
34
35
50
66
0 10 20 30 40 50 60 70
CFO Public Accounting StatisticsTotal Sitting CFOs: 670
Public Accounting Background: 261Percentage of Total CFOs: 39%
Big Five Firm Background: 211Percentage of Total CFOs: 31.4%
Non-Big Five Firm Background: 50Percentage of Total CFOs: 7.5%

CRIST KOLDER|ASSOCIATES
12% of CFOs have investment banking experience2018 CFOs with Investment Banking Backgrounds
2018 Fortune 500 and S&P 500 (673 Companies; 84 CFOs Represented*)
*Multiple CFOs have worked for more than one investment bank
Goldman Sachs
Merrill Lynch (Bank of America)
J.P. Morgan Chase & Co.
Morgan Stanley
Deutsche Bank
UBS 5
7
9
13
15
16
0 2 4 6 8 10 12 14 16 18
27
CFO Investment Banking Statistics
Total Sitting CFOs: 670
Investment Banking Background: 83Percentage of Total CFOs: 12.3%

CRIST KOLDER|ASSOCIATES
Technology sector CFOs have the least amount of company experience before taking their position
Average Years of Experience with Company before assuming Roles of CEO/CFO/COO at that Company*2018 Fortune 500 and S&P 500 (673 Companies; 558 Internal CEOs Hires; 450 Internal CFO Hires; 192 Internal COO Hires)
Average Retail Healthcare Energy Consumer Services Technology Financial IndustrialCEO 13.6 15.5 10.5 14.2 14.6 12.6 10.7 14.2 15.7CFO 11.2 10.4 11.6 11.2 12.7 11.6 9.4 10.4 11.8COO 14.3 15.9 11.8 15.4 13.8 14.8 14.9 13.1 16.8
0
2
4
6
8
10
12
14
16
18
Year
s
28*From start date with company to date of C-Suite appointment

CRIST KOLDER|ASSOCIATES
9.54
7.97
7.266.97 6.96
5.65 5.555.22
0
1
2
3
4
5
6
7
8
9
10
Financial Retail Technology Healthcare Services Energy Consumer Industrial
Tenu
re (Y
ears
)
Financial sector CEOs have the longest tenure
Average Tenure of CEO by Industry2018 Fortune 500 and S&P 500 (673 Companies; 679 Sitting CEOs)
Longest Tenured CEO
Leslie Wexner –L Brands, Inc. (54.6 Years)
Average CEO Tenure:6.5 years
29

CRIST KOLDER|ASSOCIATES
5.91 5.835.46
5.134.75
4.44 4.40
3.89
0
1
2
3
4
5
6
7
Retail Financial Industrial Services Consumer Technology Energy Healthcare
Tenu
re (Y
ears
)
The average tenure of a CFO is over 5 years
Average Tenure of CFO by Industry2018 Fortune 500 and S&P 500 (673 Companies; 670 Sitting CFOs)
Jeffrey Julien –Raymond James Financial, Inc. (31.3 Years)
Longest Tenured CFO
Average CFO Tenure: 5.1 years
30

CRIST KOLDER|ASSOCIATES
The C-Suite is getting olderAge of Hire for CEOs and CFOs
2018 Fortune 500 and S&P 500 (673 Companies; 674 Known CEO Ages at Hire; 660 Known CFO Ages at Hire)
2005 2006 2007 2008 2009 2010 2011 2012 2013 2014 2015 2016 2017 2018CEO 45.9 49.2 47.2 46.5 48.1 49.7 50.4 52.6 51.3 51.8 51.5 52.2 54.0 53.4CFO 44.0 43.7 42.8 43.8 46.0 46.7 46.4 47.6 48.6 47.5 48.1 49.0 49.0 49.3
38
40
42
44
46
48
50
52
54
56
Ave
rage
Age
of H
ire
31
CRIST KOLDER|ASSOCIATES
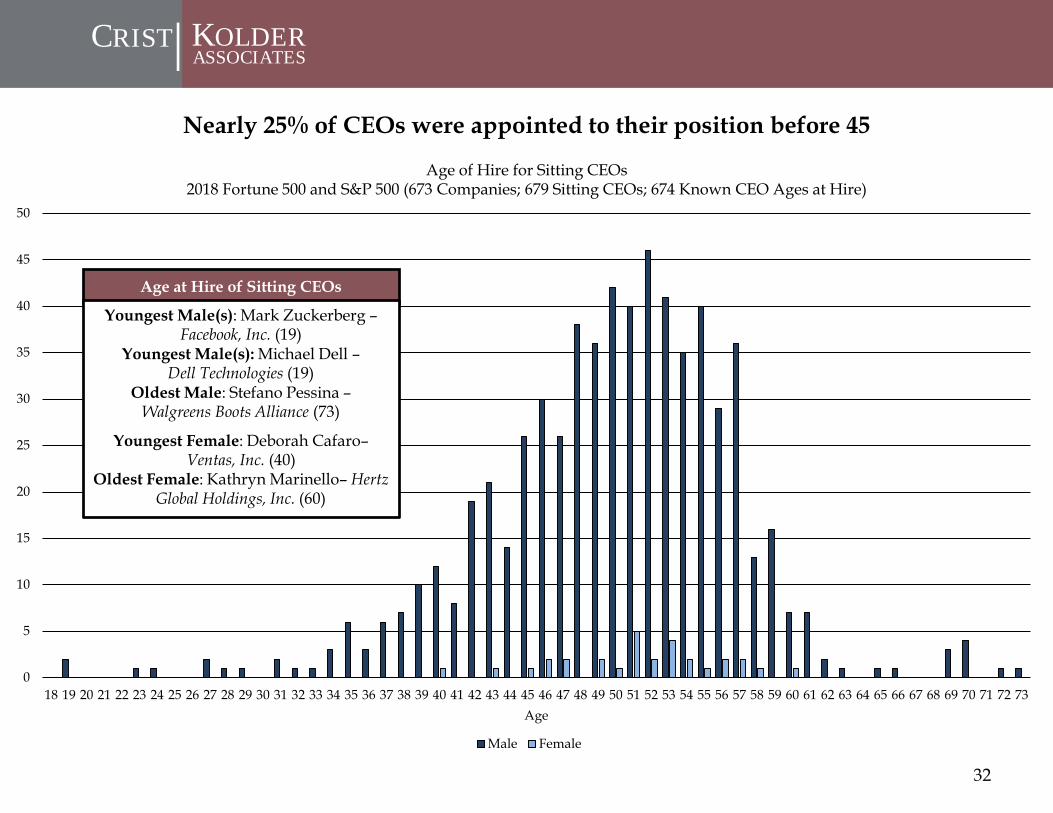
Nearly 25% of CEOs were appointed to their position before 45
Age of Hire for Sitting CEOs2018 Fortune 500 and S&P 500 (673 Companies; 679 Sitting CEOs; 674 Known CEO Ages at Hire)
0
5
10
15
20
25
30
35
40
45
50
18 19 20 21 22 23 24 25 26 27 28 29 30 31 32 33 34 35 36 37 38 39 40 41 42 43 44 45 46 47 48 49 50 51 52 53 54 55 56 57 58 59 60 61 62 63 64 65 66 67 68 69 70 71 72 73Age
Male Female
Age at Hire of Sitting CEOs
Youngest Male(s): Mark Zuckerberg –Facebook, Inc. (19)
Youngest Male(s): Michael Dell –Dell Technologies (19)
Oldest Male: Stefano Pessina –Walgreens Boots Alliance (73)
Youngest Female: Deborah Cafaro–Ventas, Inc. (40)
Oldest Female: Kathryn Marinello– Hertz Global Holdings, Inc. (60)
32

CRIST KOLDER|ASSOCIATES
Nearly 75% of Female CEOs are 55 and older
Age Distribution of Sitting CEOs2018 Fortune 500 and S&P 500 (673 Companies; 679 Sitting CEOs; 674 Known CEO Ages)
0
10
20
30
40
50
60
33 34 35 36 37 38 39 40 41 42 43 44 45 46 47 48 49 50 51 52 53 54 55 56 57 58 59 60 61 62 63 64 65 66 67 68 69 70 71 72 73 74 75 76 77 78 79 80 81 82 83 84 85 86 87Age
Male Female
Average Age of Sitting CEOs
Male: 57
Female: 56
Age Range of Sitting CEOs
Youngest Male: Mark Zuckerberg –Facebook, Inc. (34)
Oldest Male: Warren Buffett –Berkshire Hathaway, Inc. (87)
Youngest Female: Joey Wat– Yum China Holdings, Inc. (46)
Oldest Female: Marillyn Hewson–Lockheed Martin Corporation (64)
33
CRIST KOLDER|ASSOCIATES
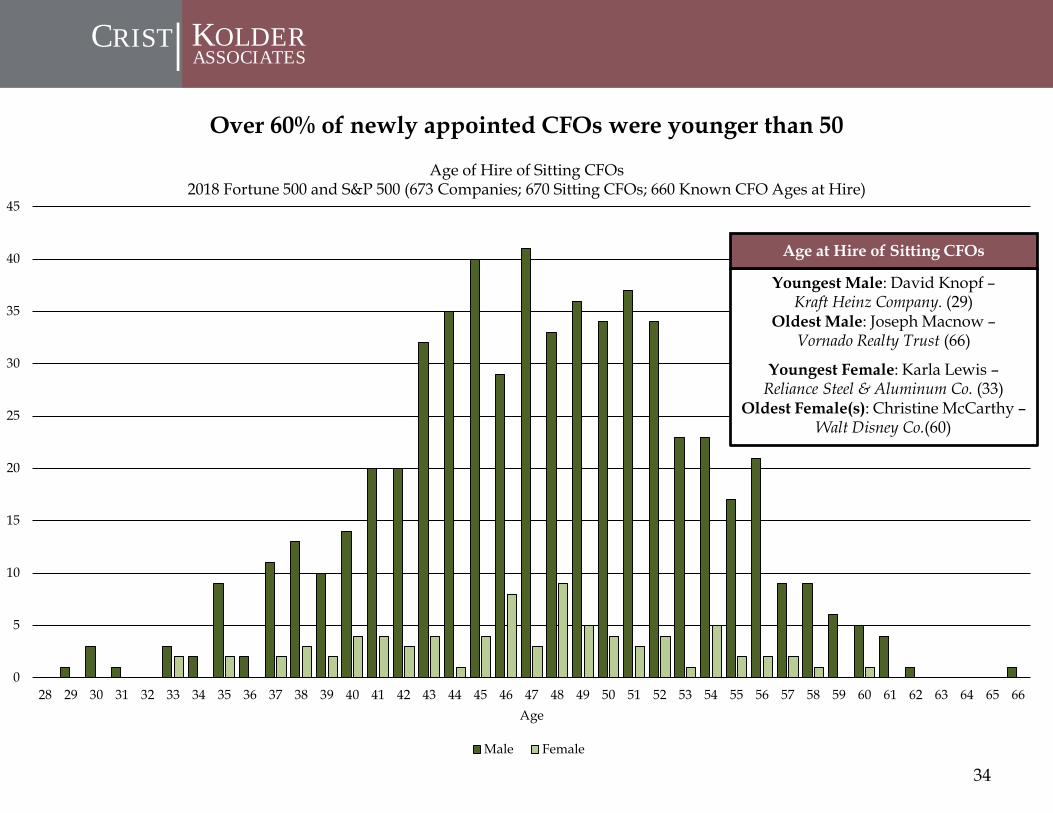
Over 60% of newly appointed CFOs were younger than 50
Age of Hire of Sitting CFOs2018 Fortune 500 and S&P 500 (673 Companies; 670 Sitting CFOs; 660 Known CFO Ages at Hire)
0
5
10
15
20
25
30
35
40
45
28 29 30 31 32 33 34 35 36 37 38 39 40 41 42 43 44 45 46 47 48 49 50 51 52 53 54 55 56 57 58 59 60 61 62 63 64 65 66Age
Male Female
Youngest Male: David Knopf –Kraft Heinz Company. (29)
Oldest Male: Joseph Macnow –Vornado Realty Trust (66)
Youngest Female: Karla Lewis –Reliance Steel & Aluminum Co. (33)
Oldest Female(s): Christine McCarthy –Walt Disney Co.(60)
Age at Hire of Sitting CFOs
34
CRIST KOLDER|ASSOCIATES
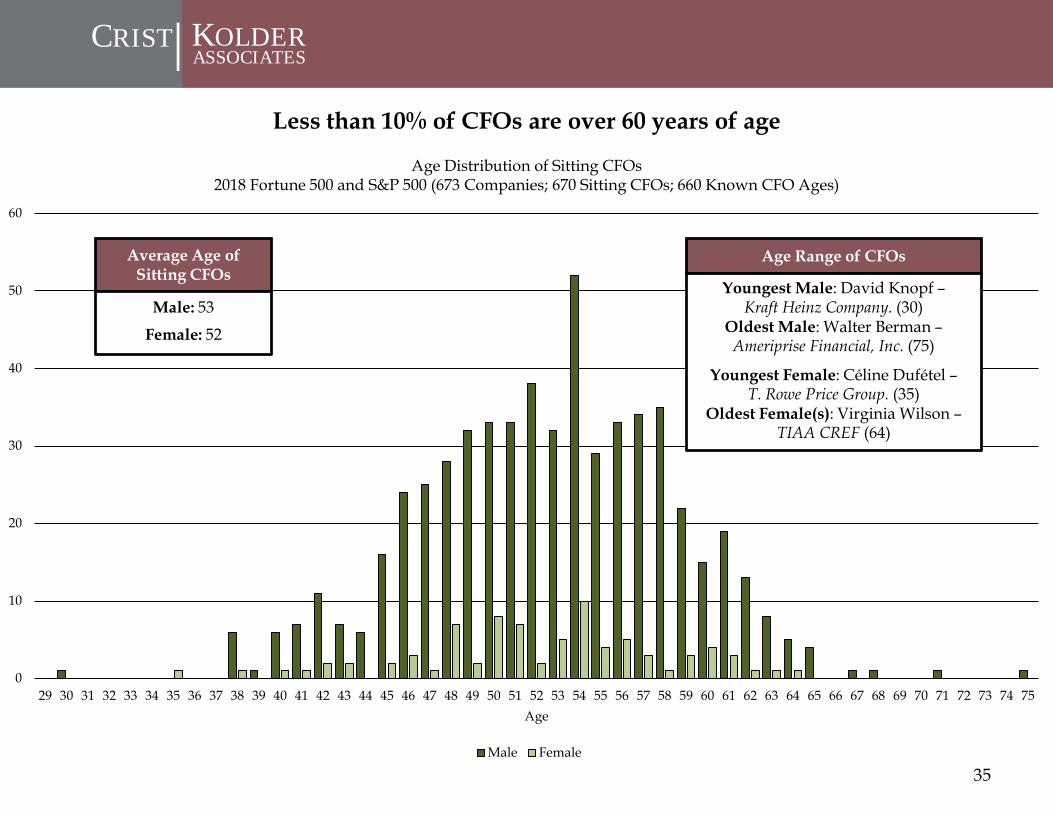
Less than 10% of CFOs are over 60 years of age
Age Distribution of Sitting CFOs2018 Fortune 500 and S&P 500 (673 Companies; 670 Sitting CFOs; 660 Known CFO Ages)
0
10
20
30
40
50
60
29 30 31 32 33 34 35 36 37 38 39 40 41 42 43 44 45 46 47 48 49 50 51 52 53 54 55 56 57 58 59 60 61 62 63 64 65 66 67 68 69 70 71 72 73 74 75Age
Male Female
Average Age of Sitting CFOs
Male: 53
Female: 52
Age Range of CFOs
Youngest Male: David Knopf –Kraft Heinz Company. (30)
Oldest Male: Walter Berman –Ameriprise Financial, Inc. (75)
Youngest Female: Céline Dufétel –T. Rowe Price Group. (35)
Oldest Female(s): Virginia Wilson –TIAA CREF (64)
35

CRIST KOLDER|ASSOCIATES
Diversity Landscape
36

CRIST KOLDER|ASSOCIATES
The number of Female CFOs has reached an all-time highPercentages of Companies with Female CEOs or CFOs (2004-2018)
2018 Fortune 500 and S&P 500 (673 Companies; 679 Sitting CEOs; 670 Sitting CFOs)
2004 2005 2006 2007 2008 2009 2010 2011 2012 2013 2014 2015 2016 2017 2018CEO 1.6% 1.4% 2.1% 2.2% 2.1% 2.2% 1.9% 3.0% 3.5% 3.8% 4.9% 4.3% 4.2% 5.2% 4.6%CFO 6.3% 6.9% 6.3% 7.2% 7.3% 8.7% 8.7% 10.0% 9.7% 10.2% 10.6% 12.2% 12.3% 11.6% 12.5%
0%
2%
4%
6%
8%
10%
12%
14%
37

CRIST KOLDER|ASSOCIATES
The population of Female CEOs has more than doubled in the last ten yearsNumber of Companies with Female CEOs by Industry (2004-2018)2018 Fortune 500 and S&P 500 (673 Companies; 679 Sitting CEOs)
38
2004 2005 2006 2007 2008 2009 2010 2011 2012 2013 2014 2015 2016 2017 2018Financial 1 1 3 3 3 3 2 4 4 4 5 5 5 7 7Energy 0 0 0 0 0 0 0 1 2 3 3 3 5 6 5Technology 4 2 2 2 2 2 2 4 5 5 7 5 5 5 4Industrial 1 1 1 1 1 2 2 3 4 5 6 5 5 5 4Services 2 2 2 1 0 0 0 0 0 1 2 2 1 2 3Retail 1 1 1 2 2 2 1 1 1 2 3 3 2 2 3Consumer 0 1 4 4 4 4 4 5 5 4 5 4 4 6 3Healthcare 0 0 0 1 1 1 1 1 2 1 1 1 1 2 2Total 9 8 13 14 13 14 12 19 23 25 32 28 28 35 31
9 8
13 14 13 1412
19
2325
32
28 28
35
31
0
5
10
15
20
25
30
35
40
Fem
ale
CEO
s

CRIST KOLDER|ASSOCIATES
The Financial sector has the most Female CFOs
Number of Companies with Female CFOs by Industry (2004-2018)2018 Fortune 500 and S&P 500 (673 Companies; 670 Sitting CFOs)
39
2004 2005 2006 2007 2008 2009 2010 2011 2012 2013 2014 2015 2016 2017 2018Financial 3 4 4 2 8 11 12 13 11 10 10 13 14 15 20Consumer 2 4 4 6 4 5 5 9 8 11 12 14 16 13 14Industrial 8 7 6 8 7 7 7 9 9 10 11 14 11 10 12Services 5 5 6 7 7 6 6 7 7 7 8 9 10 12 11Technology 8 10 9 11 9 8 8 9 10 12 11 11 9 10 9Energy 2 3 5 5 4 9 9 10 10 8 7 7 8 6 8Retail 2 3 2 2 2 3 2 2 3 4 5 6 7 7 7Healthcare 5 5 3 4 5 6 6 5 5 5 6 6 7 5 3Total 35 41 39 45 46 55 55 64 63 67 70 80 82 78 84
3541 39
45 46
55 55
64 6367
70
80 8278
84
0
10
20
30
40
50
60
70
80
90
Fem
ale
CFO
s
CRIST KOLDER|ASSOCIATES
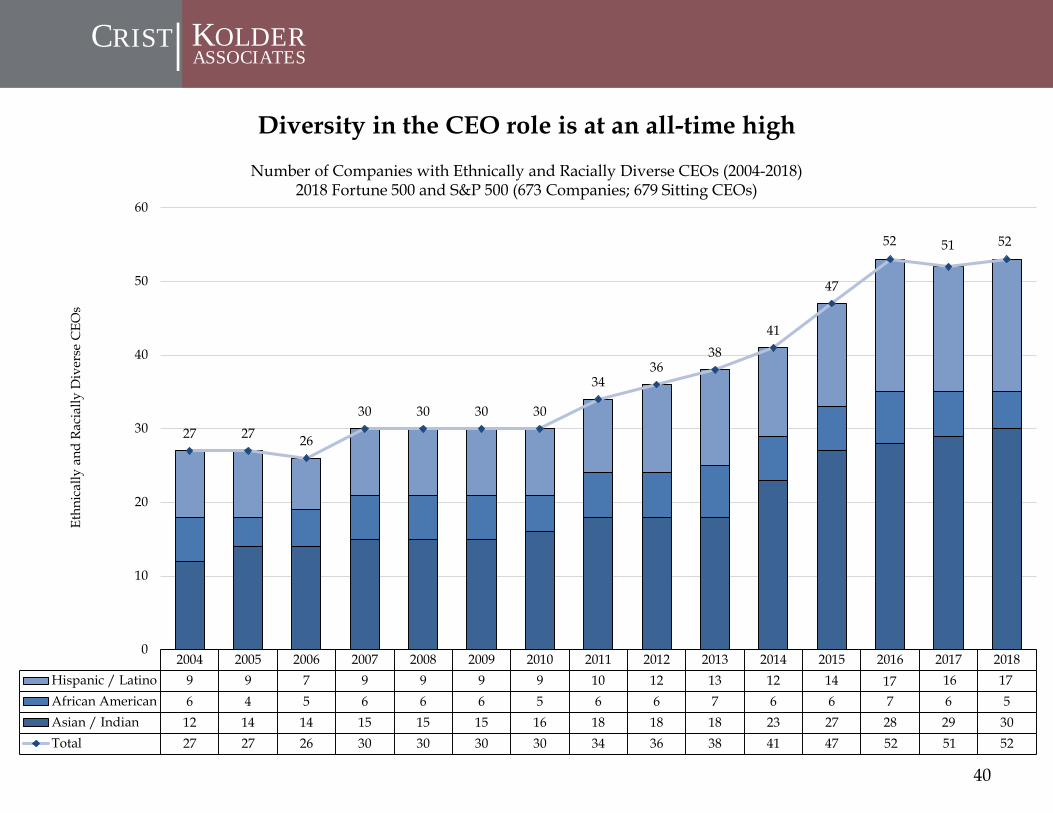
2004 2005 2006 2007 2008 2009 2010 2011 2012 2013 2014 2015 2016 2017 2018Hispanic / Latino 9 9 7 9 9 9 9 10 12 13 12 14 18 17 18African American 6 4 5 6 6 6 5 6 6 7 6 6 7 6 5Asian / Indian 12 14 14 15 15 15 16 18 18 18 23 27 28 29 30Total 27 27 26 30 30 30 30 34 36 38 41 47 53 52 53
27 27 26
30 30 30 30
3436
3841
47
53 52 53
0
10
20
30
40
50
60
Ethn
ical
ly a
nd R
acia
lly D
iver
se C
EOs
Diversity in the CEO role is at an all-time highNumber of Companies with Ethnically and Racially Diverse CEOs (2004-2018)
2018 Fortune 500 and S&P 500 (673 Companies; 679 Sitting CEOs)
40
525152
52 51 52
17 16 17

CRIST KOLDER|ASSOCIATES
2004 2005 2006 2007 2008 2009 2010 2011 2012 2013 2014 2015 2016 2017 2018Technology 8 8 8 8 7 9 9 10 11 11 13 13 14 16 17Industrial 1 1 1 2 2 2 2 2 2 3 4 5 7 7 7Services 3 5 5 6 5 5 5 5 5 5 4 6 8 6 6Financial 5 4 4 5 7 5 6 8 8 8 8 8 7 7 6Healthcare 3 3 3 3 3 3 2 4 6 6 6 6 6 6 6Consumer 5 5 4 5 5 5 5 5 4 5 5 6 7 6 6Energy 2 1 1 1 1 1 1 0 0 0 1 2 3 3 3Retail 0 0 0 0 0 0 0 0 0 0 0 1 1 1 2Total 27 27 26 30 30 30 30 34 36 38 41 47 53 52 53
27 27 2630 30 30 30
3436
3841
47
53 52 53
0
10
20
30
40
50
60
Ethn
ical
ly a
nd R
acia
lly D
iver
se C
EOs
For over 10 years, the Technology sector has led in diversity at the CEO position
Number of Companies with Ethnically and Racially Diverse CEOs by Industry (2004-2018)2018 Fortune 500 and S&P 500 (673 Companies; 679 Sitting CEOs)
4152 51 52
52 51 52
556

CRIST KOLDER|ASSOCIATES
Diversity in the CFO role is at an all-time highNumber of Companies with Ethnically and Racially Diverse CFOs (2004-2018)
2018 Fortune 500 and S&P 500 (673 Companies; 670 Sitting CFOs)
2004 2005 2006 2007 2008 2009 2010 2011 2012 2013 2014 2015 2016 2017 2018Hispanic / Latino 6 6 5 5 5 7 9 10 9 8 11 11 11 12 12African American 4 4 4 5 6 5 5 5 4 4 6 7 9 11 11Asian / Indian 8 10 7 8 11 9 9 10 11 14 17 21 23 27 30Total 18 20 16 18 22 21 23 25 24 26 34 39 43 50 53
1820
1618
22 2123
25 2426
34
39
43
5053
0
10
20
30
40
50
60
Ethn
ical
ly a
nd R
acia
lly D
iver
se C
FOs
42

CRIST KOLDER|ASSOCIATES
The Financial and Technology sectors are diversity leaders at the CFO position
Number of Companies with Ethnically and Racially Diverse CFOs by Industry (2004-2018)2018 Fortune 500 and S&P 500 (673 Companies; 670 Sitting CFOs)
2004 2005 2006 2007 2008 2009 2010 2011 2012 2013 2014 2015 2016 2017 2018Financial 5 4 4 4 4 3 3 4 3 3 5 7 9 9 10Technology 0 1 1 3 2 1 1 1 3 2 5 6 6 9 10Industrial 1 1 1 1 2 2 2 2 3 4 5 6 6 8 8Energy 0 1 1 1 2 2 3 3 2 2 4 6 5 6 6Consumer 3 4 2 2 3 5 5 5 4 4 4 4 6 6 7Services 4 4 3 3 3 2 3 4 3 5 6 5 5 5 5Healthcare 4 4 3 3 5 5 5 5 5 5 5 5 6 6 5Retail 1 1 1 1 1 1 1 1 1 1 0 0 0 1 2Total 18 20 16 18 22 21 23 25 24 26 34 39 43 50 53
1820
1618
22 2123
25 2426
34
3943
5053
0
10
20
30
40
50
60
Ethn
ical
ly a
nd R
acia
lly D
iver
se C
FOs
43

CRIST KOLDER|ASSOCIATES
Education Background
44
CRIST KOLDER|ASSOCIATES
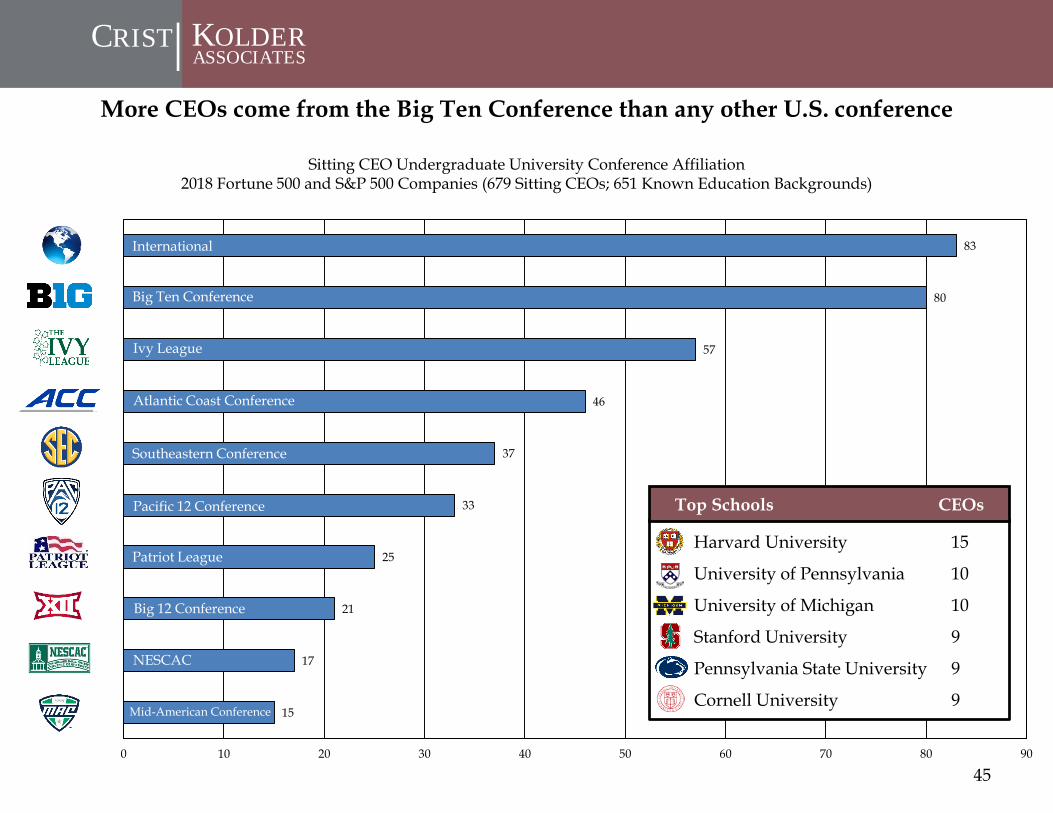
15
17
21
25
33
37
46
57
80
83
0 10 20 30 40 50 60 70 80 90
Harvard University
University of Pennsylvania
University of Michigan
Stanford University
Pennsylvania State University
Cornell University
More CEOs come from the Big Ten Conference than any other U.S. conference
Sitting CEO Undergraduate University Conference Affiliation2018 Fortune 500 and S&P 500 Companies (679 Sitting CEOs; 651 Known Education Backgrounds)
15
10
10
9
9
9
Top Schools CEOs
International
Big Ten Conference
Ivy League
Atlantic Coast Conference
Southeastern Conference
Pacific 12 Conference
Patriot League
Big 12 Conference
NESCAC
Mid-American Conference
45

CRIST KOLDER|ASSOCIATES
Canada and the United Kingdom are home to the most sitting CEOs of all foreign countries in this study
Top Five International Degree Producing Countries for Sitting CEOs2018 Fortune 500 and S&P 500 Companies (679 Sitting CEOs; 651 Known Education Backgrounds)
7
7
8
10
10
0 2 4 6 8 10 12
Canada
United Kingdom
France
Australia
India
46

CRIST KOLDER|ASSOCIATES
21
21
23
29
33
33
44
58
59
79
0 10 20 30 40 50 60 70 80 90
The Big Ten Conference has claimed the most CFOs for six consecutive years
Sitting CFO Undergraduate University Conference Affiliation2018 Fortune 500 and S&P 500 Companies (670 Sitting CFOs; 637 Known Education Backgrounds)
University of Notre Dame
University of Pennsylvania
Indiana University
University of Michigan
Stanford University
Harvard University
14
13
11
10
10
10
Top Schools CFOs
Big Ten Conference
International
Atlantic Coast Conference
Ivy League
Pacific 12 Conference
Southeastern Conference
Big 12 Conference
Mid-American Conference
American Athletic Conference
Patriot League
47

CRIST KOLDER|ASSOCIATES
3
3
5
8
9
15
0 2 4 6 8 10 12 14 16
Canada is home to the most sitting CFOs of all foreign countries in this study
Top Five International Degree Producing Countries for Sitting CFOs2018 Fortune 500 and S&P 500 Companies (670 Sitting CFOs; 637 Known Education Backgrounds)
Canada
United Kingdom
India
France
Germany
Australia
48
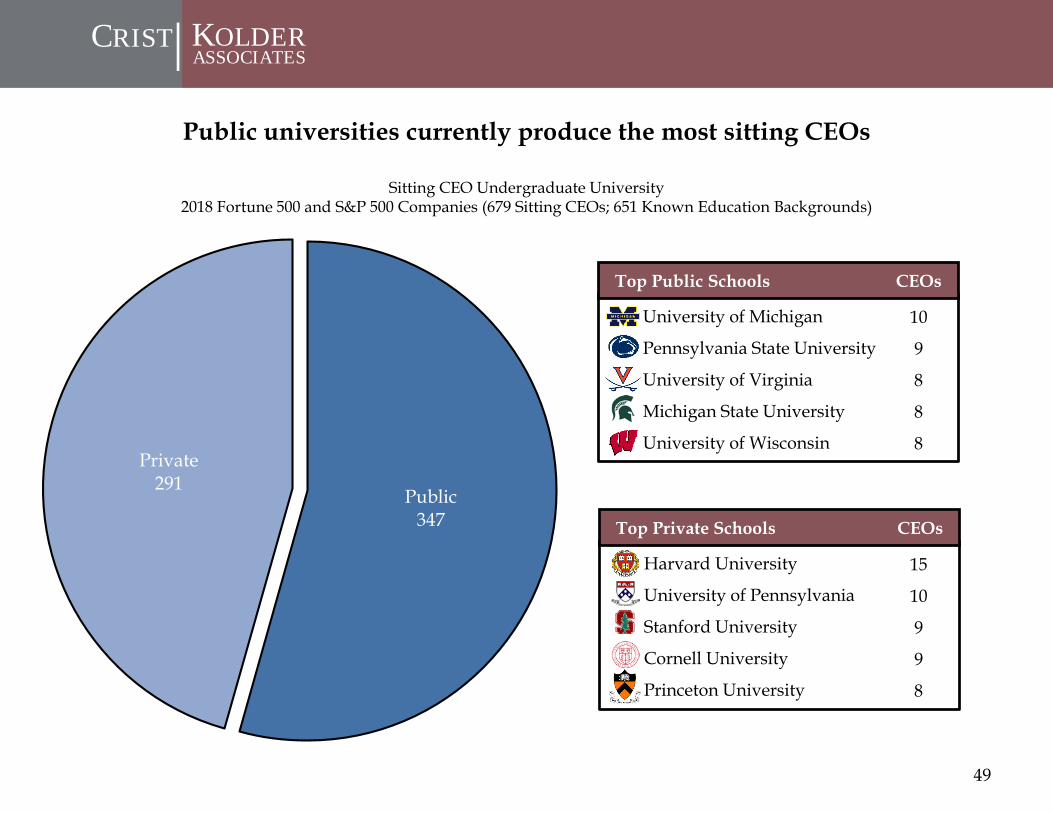
CRIST KOLDER|ASSOCIATES
University of Michigan
Pennsylvania State University
University of Virginia
Michigan State University
University of Wisconsin
Top Public Schools CEOs
Harvard University
University of Pennsylvania
Stanford University
Cornell University
Princeton University
Top Private Schools CEOs
Public universities currently produce the most sitting CEOs
Sitting CEO Undergraduate University2018 Fortune 500 and S&P 500 Companies (679 Sitting CEOs; 651 Known Education Backgrounds)
15
10
9
9
8
10
9
8
8
8
Public347
Private291
49

CRIST KOLDER|ASSOCIATES
Indiana University
University of Michigan
University of Texas – Austin
Pennsylvania State University
University of Virginia
Top Public Schools CFOs
University of Notre Dame
University of Pennsylvania
Stanford University
Harvard University
Boston College
Top Private Schools CFOs
Public universities currently produce the most sitting CFOs
Sitting CFO Undergraduate University2018 Fortune 500 and S&P 500 Companies (670 Sitting CFOs; 637 Known Education Backgrounds)
15
14
10
9
6
13
11
10
9
8
Public358
Private277
50
CRIST KOLDER|ASSOCIATES
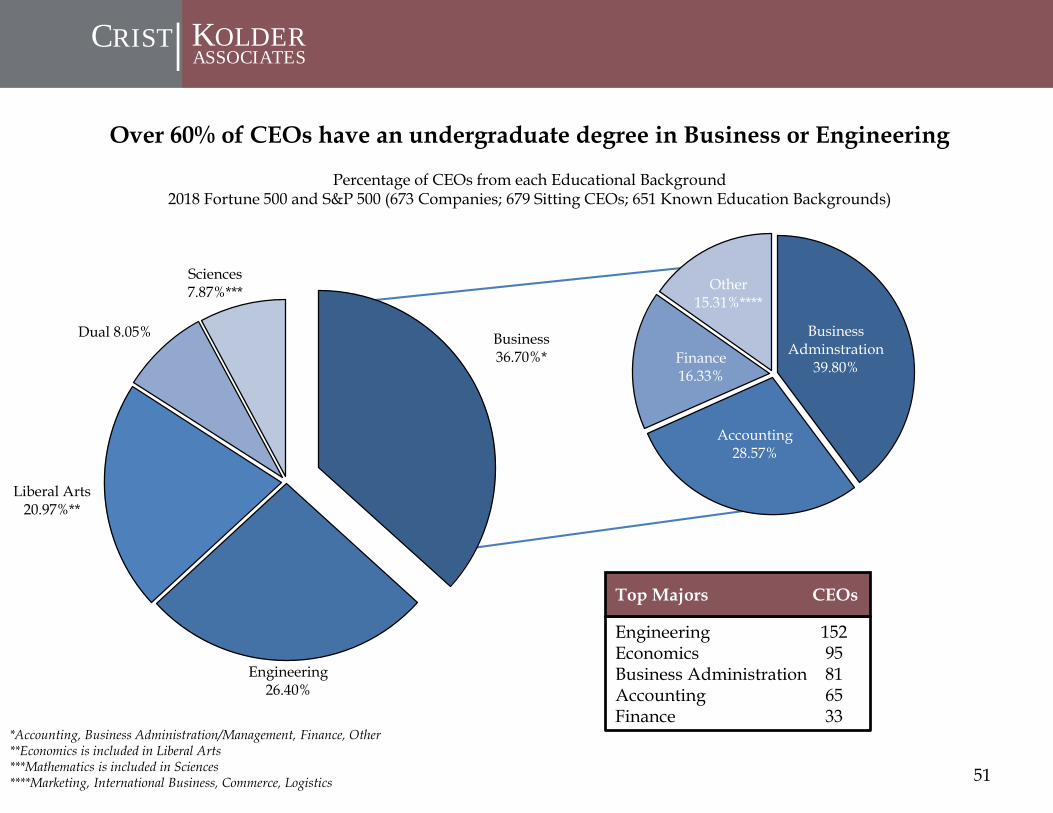
Business Adminstration
39.80%
Accounting28.57%
Finance16.33%
Other15.31%****
Over 60% of CEOs have an undergraduate degree in Business or Engineering
Percentage of CEOs from each Educational Background 2018 Fortune 500 and S&P 500 (673 Companies; 679 Sitting CEOs; 651 Known Education Backgrounds)
EngineeringEconomics Business Administration Accounting Finance
Top Majors CEOs
*Accounting, Business Administration/Management, Finance, Other**Economics is included in Liberal Arts***Mathematics is included in Sciences****Marketing, International Business, Commerce, Logistics
15295816533
Business36.70%*
Engineering26.40%
Liberal Arts20.97%**
Dual 8.05%
Sciences7.87%***
51
CRIST KOLDER|ASSOCIATES
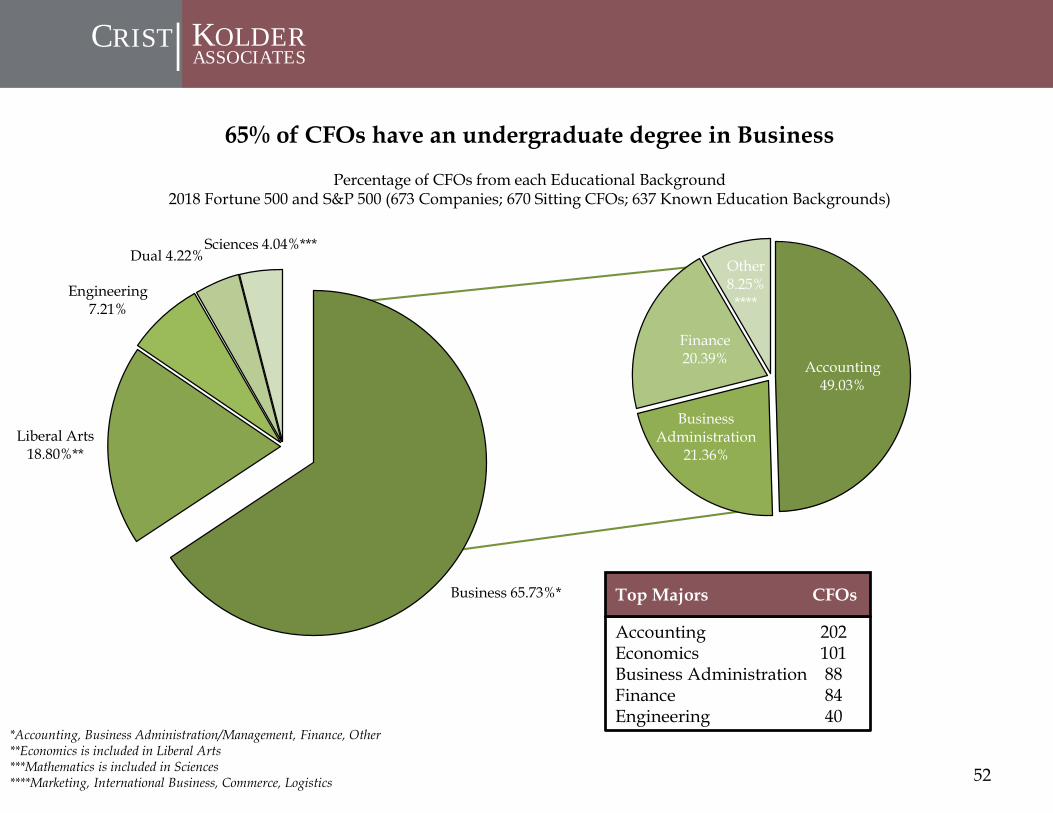
Accounting49.03%
Business Administration
21.36%
Finance20.39%
Other8.25%
****
65% of CFOs have an undergraduate degree in Business
Percentage of CFOs from each Educational Background 2018 Fortune 500 and S&P 500 (673 Companies; 670 Sitting CFOs; 637 Known Education Backgrounds)
AccountingEconomics Business Administration Finance Engineering
Top Majors CFOs
*Accounting, Business Administration/Management, Finance, Other**Economics is included in Liberal Arts***Mathematics is included in Sciences****Marketing, International Business, Commerce, Logistics
202101888440
Business 65.73%*
Liberal Arts18.80%**
Engineering7.21%
Dual 4.22%Sciences 4.04%***
52
CRIST KOLDER|ASSOCIATES
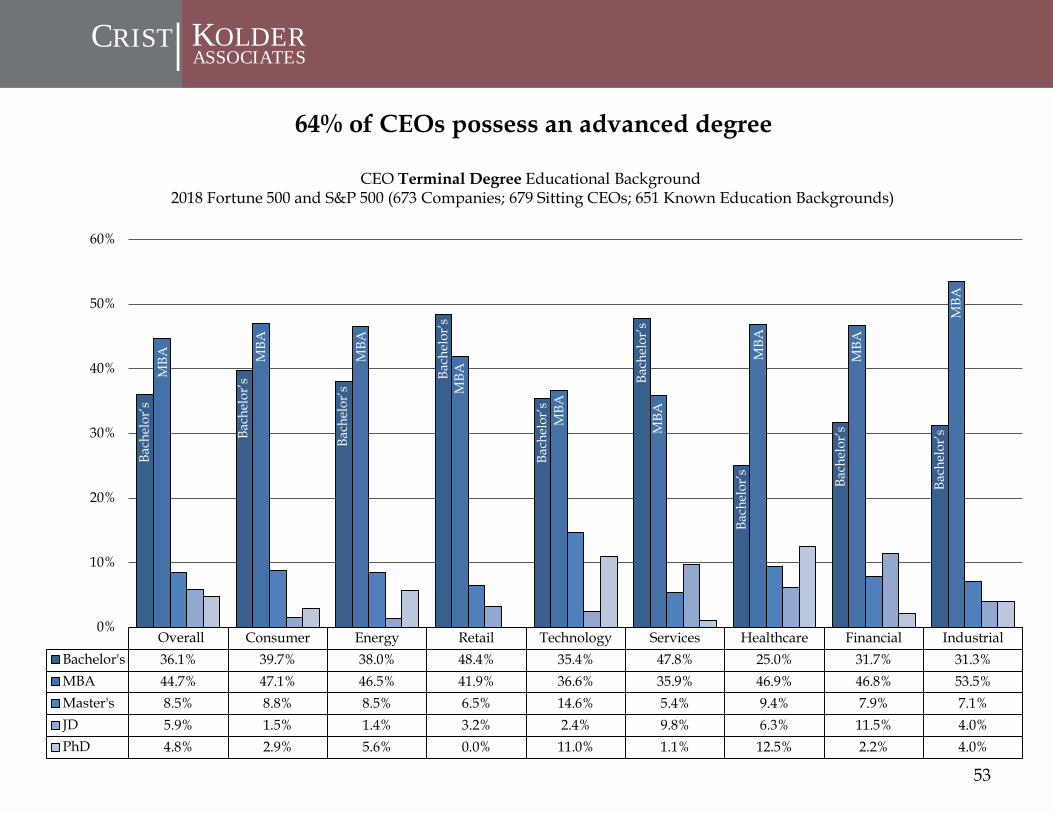
Average Consumer Energy Retail Technology Services Healthcare Financial IndustrialBachelor's 36.1% 39.7% 38.0% 48.4% 35.4% 47.8% 25.0% 31.7% 31.3%MBA 44.7% 47.1% 46.5% 41.9% 36.6% 35.9% 46.9% 46.8% 53.5%Master's 8.5% 8.8% 8.5% 6.5% 14.6% 5.4% 9.4% 7.9% 7.1%JD 5.9% 1.5% 1.4% 3.2% 2.4% 9.8% 6.3% 11.5% 4.0%PhD 4.8% 2.9% 5.6% 0.0% 11.0% 1.1% 12.5% 2.2% 4.0%
0%
10%
20%
30%
40%
50%
60%
64% of CEOs possess an advanced degree
CEO Terminal Degree Educational Background2018 Fortune 500 and S&P 500 (673 Companies; 679 Sitting CEOs; 651 Known Education Backgrounds)
53
Bach
elor
’sM
BA
Bach
elor
’s
Bach
elor
’s
Bach
elor
’s
Bach
elor
’s
Bach
elor
’s
Bach
elor
’s
Bach
elor
’s
Bach
elor
’s
MBA
MBA
MBA
MBA
MBA
MBA
MBA
MBA
Overall

CRIST KOLDER|ASSOCIATES
54
Average Consumer Energy Retail Technology Services Healthcare Financial IndustrialBachelor's 40.0% 38.9% 37.1% 39.4% 33.3% 44.6% 37.1% 42.2% 42.4%MBA 48.6% 51.4% 52.9% 57.6% 53.1% 45.7% 48.4% 40.6% 50.5%Master's 7.5% 5.6% 7.1% 3.0% 9.9% 5.4% 11.3% 9.4% 6.1%JD 3.1% 4.2% 2.9% 0.0% 2.5% 3.3% 3.2% 5.5% 1.0%PhD 0.8% 0.0% 0.0% 0.0% 1.2% 1.1% 0.0% 2.3% 0.0%
0%
10%
20%
30%
40%
50%
60%
70%
Overall
Bach
elor
’sM
BA
Bach
elor
’s
Bach
elor
’s
Bach
elor
’s
Bach
elor
’s
Bach
elor
’s
Bach
elor
’s
Bach
elor
’s
Bach
elor
’s
MBA M
BA
MBA
MBA
MBA M
BA
MBA
MBA
50% of CFOs hold an MBA degree
CFO Terminal Degree Educational Background2018 Fortune 500 and S&P 500 (673 Companies; 670 Sitting CFOs; 637 Known Education Backgrounds)

CRIST KOLDER|ASSOCIATES
8
12
16
12
15
17
35
23
6
6
10
16
14
14
12
45
Number of CEOs Number of CFOs
The path to the C-Suite runs through eight leading MBA programsTop MBA Schools
2018 Fortune 500 and S&P 500 (673 Companies; 651 CEO and 637 CFO Known Education Backgrounds)
55
Harvard University
Stanford University
Northwestern University
University of Pennsylvania
University of Chicago
Columbia University
New York University
University of Michigan