C-3 Subsidence Analysis Report · February 2006 - i - 05-1193-011 Golder Associates EXECUTIVE...
50
LJS\J:\scopes\04w018\10000\FVD reports\Final MPA\r-Mine Permit App appendix.doc C-3 Subsidence Analysis Report
Transcript of C-3 Subsidence Analysis Report · February 2006 - i - 05-1193-011 Golder Associates EXECUTIVE...

LJS\J:\scopes\04w018\10000\FVD reports\Final MPA\r-Mine Permit App appendix.doc
C-3
Subsidence Analysis Report
Golder Associates Ltd. 1010 Lorne Street Sudbury, Ontario, Canada P3C 4R9 Telephone: (705) 524-6861 Fax: (705) 524-1984
February 8, 2006 05-1193-011
OFFICES ACROSS NORTH AMERICA, SOUTH AMERICA, EUROPE, AFRICA, ASIA AND AUSTRALIA
FINAL REPORT ON
Submitted to:
Kennecott Minerals Company 1004 Harbor Hills Drive
Suite 103 Marquette, Michigan
U.S.A. 49855
DISTRIBUTION: 1 Copy (electronic) Kennecott Minerals Company, Marquette, Michigan 1 Copy (paper) Kennecott Minerals Company, Marquette, Michigan 2 Copies Golder Associates Ltd., Sudbury, Ontario
EAGLE PROJECT ADDITIONAL GEOTECHNICAL SCOPE
February 2006 - i - 05-1193-011
Golder Associates
EXECUTIVE SUMMARY
Golder Associates Ltd. (Golder) completed phase 1 of a geotechnical study of the Eagle deposit and issued a report in April 2005 (Golder Geotechnical Study). Additional geotechnical scope was completed in phase 2 and is contained in this report issued in February 2006. The objectives of the additional geotechnical scope were to refine the geologic characterization, to evaluate the effectiveness of the backfilling program and predict potential elastic and plastic deformation of the crown pillar. Phase 3 of a geotechnical study will be completed with information obtained during operations.
An updated version of the 2004 drillhole core logging database was received on September 23, 2005. This version of the database included additional borehole information entered since January 2005, as well as results from subsequent drilling completed at the Eagle site. This version of the database contained a total of approximately 66 boreholes representing approximately 17,300 m of core. This database contained additional information from approximately 17 boreholes representing 6,100 m of core. The updated data were used to refine the geologic characterization and geotechnical model as presented in Sections 2 and 3.
New information was received to update the geometry of the crown pillar. The updated top of bedrock elevation was considered to be at 415 m based on data received from KEMC (i.e., borehole intercepts and modelled bedrock topography). An updated mine plan was also received from McIntosh Engineering that considered the top of mining at the 357.5 m elevation (353 m sill elevation). The revised crown pillar geometry was used to update the two stability assessments: CPillar and Scaled Span. The CPillar results predicted that the crown pillar would be stable for rock mass classification values of 70 (modelled to be the typical value in the crown pillar) as well as 60 (modelled to be on the lower end of values to be expected in the crown pillar). The Scaled Span assessment predicted that the crown pillar would be stable for rock mass classification values of 70, but was potentially unstable with a value of 60. The conclusion of the stability assessment was that the crown pillar is predicted to be stable with typical rock mass classification values and that potentially lower values would be identified during operations by KEMC prior to establishing the crown pillar.
The KEMC mine design will start mining at the lower levels and progress upwards. Additional drill information will be collected as the mining front approaches the crown pillar area, which will allow a better characterization of the rock mass quality of the crown pillar and the top of bedrock elevation. As more information becomes available, a further refinement of this crown pillar assessment can be completed before commencing development in the upper levels of the mine. Based on this additional information, it may be possible to mine above the current proposed top of mining elevation. Several alternatives will be available to KEMC, should the rock mass classification values be lower than 70. These options will include: increasing the
February 2006 - ii - 05-1193-011
Golder Associates
thickness of the crown pillar by decreasing the top of mining elevation, decreasing the number of stopes mined in the upper level to reduce the footprint of the crown pillar, and mining the stopes in the upper level in stages and maximizing the tightness of backfill employed (i.e., minimizing the vertical void beneath the crown pillar). Details of the crown pillar stability assessment are presented in Section 4.
MAP3D and PHASE2 were used to model the vertical displacement of the crown pillar as a result of the current mine design. The vertical displacement results from the models predict the potential deflection at the top of bedrock (i.e., the interface between the bedrock and overburden). A wide range of models were created with differing geometries and input parameters as presented in Section 5. Typically, the modelling results predicted vertical displacements of up to 2 cm and typical horizontal extents of the vertical displacement occur over an area between coordinates 431405 to 431550 Easting and 5177480 to 5177620 Northing. Given that this is the vertical displacement predicted at the top of bedrock, and that the bedrock is covered by overburden (approx. 17 m), it would be expected that this displacement of the crown pillar would be imperceptible at surface.
February 2006 - iii - 05-1193-011
Golder Associates
TABLE OF CONTENTS
SECTION PAGE
1.0 INTRODUCTION......................................................................................... 1 2.0 UPDATED GEOTECHNICAL DATA........................................................... 2 3.0 GEOTECHNICAL MODEL.......................................................................... 4
3.1 GoCAD Model .........................................................................................4 3.2 RQD Summary ........................................................................................5 3.3 RMR Summary ........................................................................................6 3.4 Crown Pillar Geologic Characterization...................................................7
3.4.1 Crown Pillar Geotechnical Database Query ................................7 3.4.2 Crown Pillar Major Structural Assessment ..................................8 3.4.3 Crown Pillar Stereographic Structural Assessment .....................9
4.0 CROWN PILLAR....................................................................................... 11 4.1 Crown Pillar Geometry ..........................................................................11 4.2 Crown Pillar Stability Assessment .........................................................11
4.2.1 Eagle Crown Pillar Scaled Span Cs ...........................................12 4.2.2 CPillar Analysis..........................................................................13
4.3 Crown Pillar Discussion and Recommendations...................................14 5.0 MODELLING OF CROWN PILLAR DEFLECTION.................................. 16
5.1 Model Geometry ....................................................................................16 5.2 Modelling Material Parameters and Stress Regime ..............................16 5.3 Effect of Backfill and Plastic Displacement Assessment .......................17 5.4 Modelling Results ..................................................................................18
February 2006 - iv - 05-1193-011
Golder Associates
TABLE OF CONTENTS (CONTINUED)
LIST OF TABLES Table 1 Boreholes Used in GoCAD Model Table 2 Eagle Project RQD Table 3 Eagle Project RMR (QEquiv) Table 4 Major Structures Crown Pillar Area Table 5 Major and Minor Discontinuity Sets Crown Pillar Area Table 6 Scaled Span Crown Pillar Assessment Table 7 Eagle Crown Pillar CPillar Analysis Table 8 Crown Pillar Geometric Unravelling Potential LIST OF FIGURES Figure 1 Eagle Deposit: Isometric View of Geotechnical Drillhole Coverage Figure 2 Plan: RQD and RMR Contouring for 405 Elev. Figure 3 Plan: RQD and RMR Contouring for 383 Elev. Figure 4 Plan: RQD and RMR Contouring for 353 Elev. Figure 5 Plan: RQD and RMR Contouring for 323 Elev. Figure 6 Plan: RQD and RMR Contouring for 293 Elev. Figure 7 Plan: RQD and RMR Contouring for 263 Elev. Figure 8 Plan: RQD and RMR Contouring for 233 Elev. Figure 9 Plan: RQD and RMR Contouring for 203 Elev. Figure 10 Plan: RQD and RMR Contouring for 188 Elev. Figure 11 Plan: RQD and RMR Contouring for 173 Elev. Figure 12 Traverse Section: RQD and RMR Contouring for 431420E Facing East Figure 13 Traverse Section: RQD and RMR Contouring for 431457E Facing East Figure 14 Traverse Section: RQD and RMR Contouring for 431500E Facing East Figure 15 Traverse Section: RQD and RMR Contouring for 431545E Facing East Figure 16 Traverse Section: RQD and RMR Contouring for 431585E Facing East Figure 17 Longitudinal Section: RQD and RMR Contouring for 5177500N Facing North Figure 18 Longitudinal Section: RQD and RMR Contouring for 5177560N Facing North Figure 19 Longitudinal Section: RQD and RMR Contouring for 5177620N Facing North Figure 20 Isometric View of Drilling Inside Crown Pillars Figure 21 Review of Mapping Data Feldspathic Peridotite (Regular and with Added
Planes Figure 22 Review of Mapping Data Peridotite (Regular and with Added Planes Figure 23 Review of Mapping Data Hornfels (Regular and with Added Planes) Figure 24 Review of Mapping Data Semi Massive Sulphides (Regular and with Added
Planes) Figure 25 Review of Mapping Data Sandstone & Siltstone (Regular and with Added
Planes)
February 2006 - 1 - 05-1193-011
Golder Associates
1.0 INTRODUCTION
Golder Associates Ltd. (Golder) completed a geotechnical study of the Eagle deposit and issued a report in April 2005 (Golder Geotechnical Study). The additional geotechnical scope contained in this report is supplemental to the April 2005 report. The objectives of the additional geotechnical scope were to refine the geologic characterization, to evaluate the effectiveness of the backfilling program and predict potential elastic and plastic deformation of the crown pillar.
For the purpose of this report, ground surface subsidence has been defined as the deflection of bedrock surface due to mining activity. To evaluate elastic deflection, Map3D software was used to predict the surface deflections for both non-backfilled and backfilled cases. To evaluate plastic deflection, a level of backfill was considered. This backfill level is commonly referred to as the ‘tightness’ of the fill and was evaluated based on the average vertical distance of the backfill from the top of the mined excavation. The extent to which the crown pillar can unravel is controlled by this vertical void and the extent to which the rock bulks as it unravels. Once the available vertical void is filled by the bulking rock, the unraveling of the crown pillar will arrest. The new geometry created by the unraveling was also assessed for deflection with the same software listed above. This evaluated both the effectiveness of the backfilling program and the predicted elastic and plastic deformation in the crown pillar.
An assessment of the potential displacements in the crown pillar was also completed. Furthermore, the dimensions and geometry of the crown pillar over which these displacements are predicted were defined in the assessment. Although these numbers would allow average strain (∆L/L) to be calculated, these parameters should be considered as basic inputs for the evaluation of strain in the crown pillar. A key consideration in evaluating the strain and the response of the rock mass to the strain (i.e., the potential changes to the rock fracturing network) is the geologic characterization of the rock mass. The goal of this characterization will be to further define the lithologic zones, rock fabric, material properties and major structure to the extent possible, given the available data. Completing these items is pre-requisite to making an evaluation of strain and potential changes to the rock fracturing network. This report includes: predicted crown pillar displacements, crown geometries, and geologic characterization.
February 2006 - 2 - 05-1193-011
Golder Associates
2.0 UPDATED GEOTECHNICAL DATA
The Golder Geotechnical Study (dated April 28, 2005) was based on information contained in the KEMC geotechnical logging database dated January 3, 2005. This version of the Microsoft Access database contained a total of approximately 92 boreholes. The pre-2004 data is comprised of 43 NQ-sized boreholes representing just over 8,700 m of core, of which less than 50% is orientated. The 2004 data is comprised of 49 boreholes representing over 11,200 m of core, of which more than 75% is orientated.
An updated version of the 2004 database was received on September 23, 2005. This version of the database includes additional borehole information entered since January 2005, as well as results from subsequent drilling completed at the Eagle site. This version of the database contained a total of approximately 109 boreholes representing approximately 17,300 m of core. This is an increase of approximately 17 boreholes representing 6,100 m of core. In the review of the database, it was identified that the geotechnical logs of borehole 05EA110 were not present in the new drillhole database (but were present in the csv file with the collar coordinates). This omission is noted for completeness but does not affect the characterization of the crown pillar, as the location of this borehole is approximately 350 m east of the decline.
A QA/QC check of the data was completed. The database was then used to update the GoCAD geotechnical model. A review of the spatial distribution of the borehole data in GoCAD (Figure 1) indicated the following:
• Area 1 –38 boreholes are collared at surface in the north side of the crown pillar. The boreholes are fan drilled between 45° and 90° toward the south with a 30 m spacing between borehole set-ups. These boreholes provided coverage of the hangingwall side of the crown, centre of the orebody and the footwall at depth. The southern portion of the crown pillar could not be drilled from surface due to collar access restrictions. Collar locations could not be within 100 ft of a creek passing over the southern portion of the crown pillar;
• Area 2 – 12 boreholes are collared at surface in the footwall of the deposit. The boreholes are fan drilled between 45° and 70° toward the north with a 30 m spacing between borehole set-ups. These holes provided coverage in the footwall, hangingwall and centre of the deposit;
• Area 3 – 10 boreholes are collared at surface, north of the hangingwall. The boreholes are fan drilled between 50° and 60° toward the south with a 50 m to 250 m spacing between borehole set-ups. These holes provided coverage for the hangingwall at depth and the centre of the deposit;
• Area 4 – 20 boreholes are collared at surface along the east side of the deposit. The boreholes are fan drilled toward the south with a varying spacing between borehole set-ups. These holes provide coverage along the eastern end of the deposit; and
• Area 5 – 1 borehole in the database which is drilled near the portal area.
The remaining boreholes are located outside the five areas above.
February 2006 - 3 - 05-1193-011
Golder Associates
The updated database included 8 additional boreholes in the crown pillar area (i.e., Area 1). Based on the drill coverage currently in the database, there is limited data for the south portion of the crown pillar. In the updated database, more holes have been added to the east side of the crown pillar but due to surface restrictions, all the additional holes were collared north of the ore zone with dips of 45° or more. This results in limited geotechnical information in the southern portion of the crown pillar. Additional information in the southern portion of the crown pillar and along the length of the decline will be collected during development and operations.
It should be noted that soil and rock formations are variable to a greater or lesser extent. The data from individual borehole logs in the database indicate approximate subsurface conditions only at the individual borehole locations. Boundaries between zones on the logs are often not distinct, but rather are transitional and have been interpreted. Subsurface conditions between boreholes are inferred and may vary significantly from conditions encountered at the boreholes.
February 2006 - 4 - 05-1193-011
Golder Associates
3.0 GEOTECHNICAL MODEL
The geotechnical model created for the Eagle Project was the base for the majority of the work conducted as part of the Golder Geotechnical Study (dated April 28, 2005). The data used in the geotechnical model was based primarily on the data provided by KEMC from their two Microsoft Access databases which contain the exploration drill core information, the proposed mine geometry (provided by McIntosh) and the lithological block model data provided by KEMC.
The geotechnical model was created using GoCAD software. This model was updated using the updated geotechnical data (as described above) and used to create RQD and Rock Mass Rating (RMR) sections for the Eagle deposit as was done in the original study. Updated values for the crown pillar area were also created.
3.1 GoCAD Model
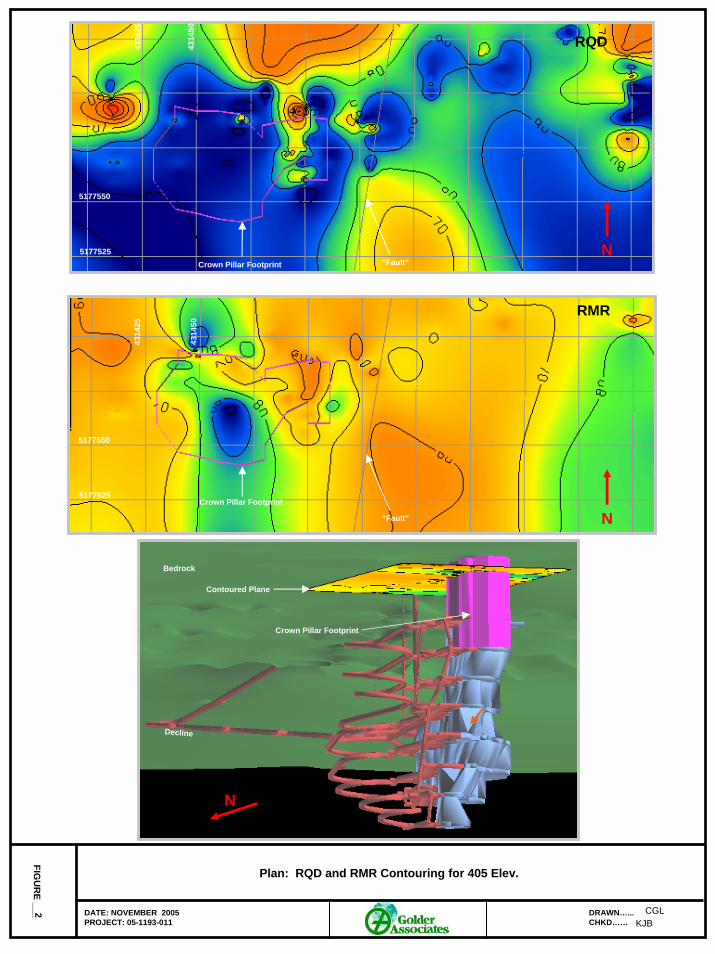
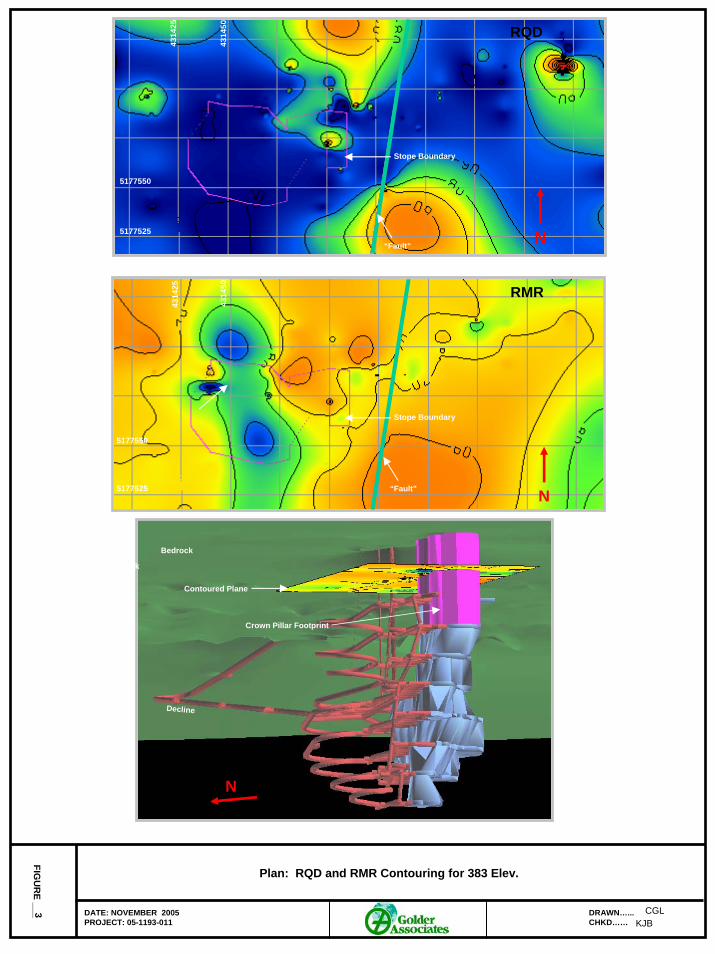
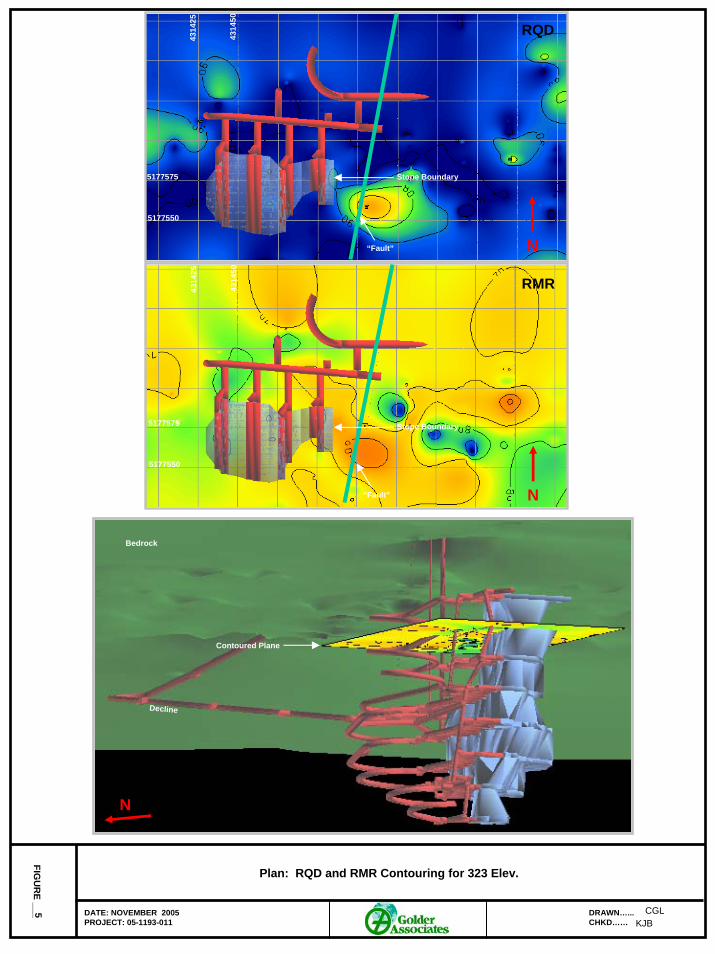
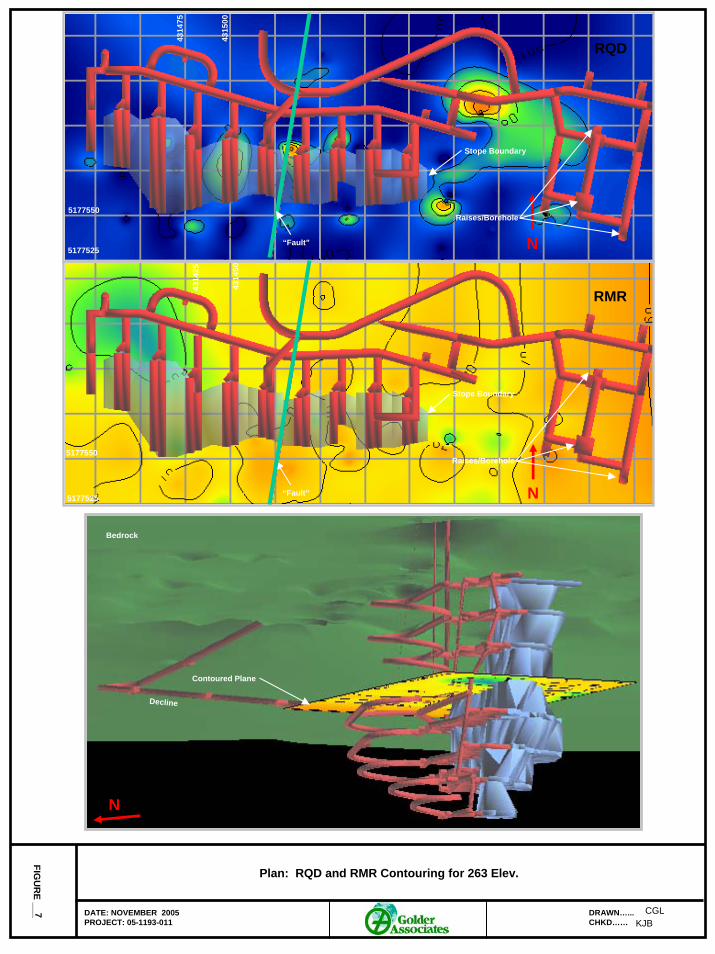
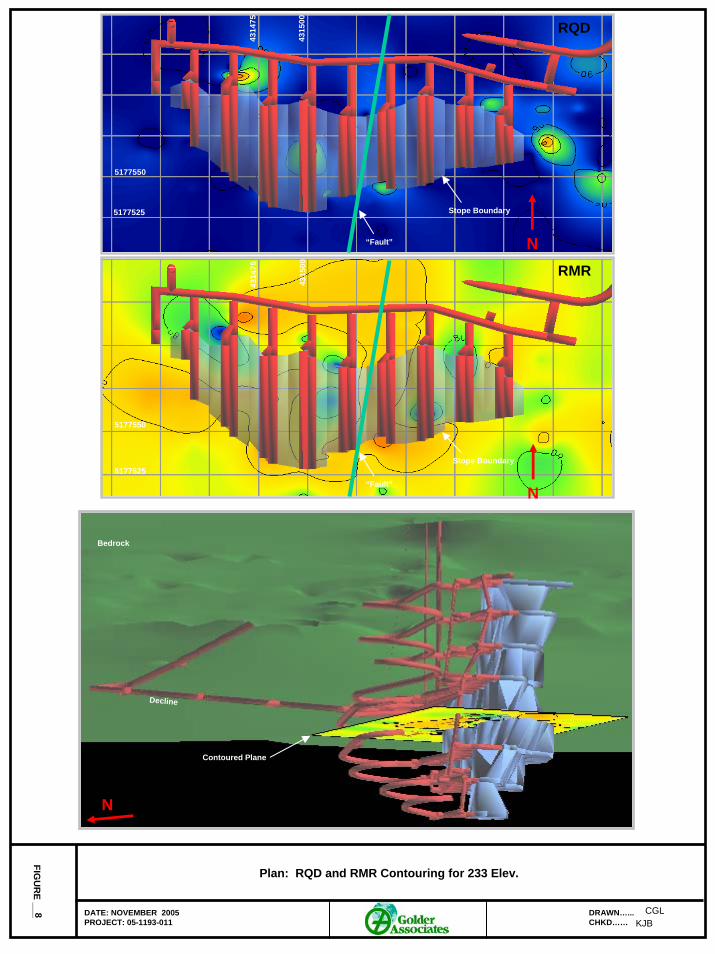
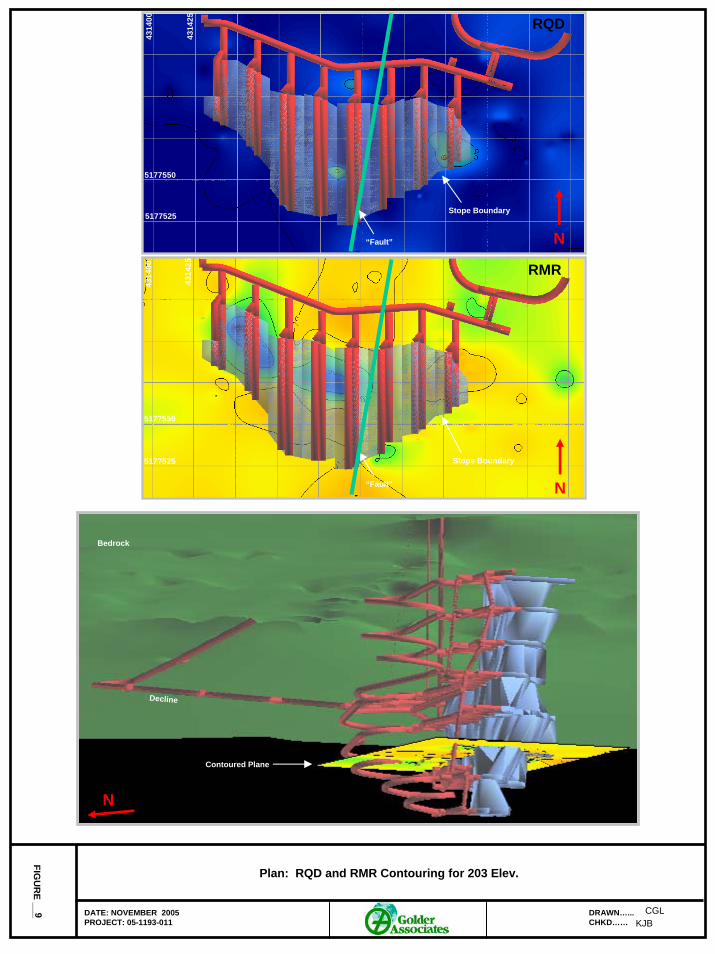
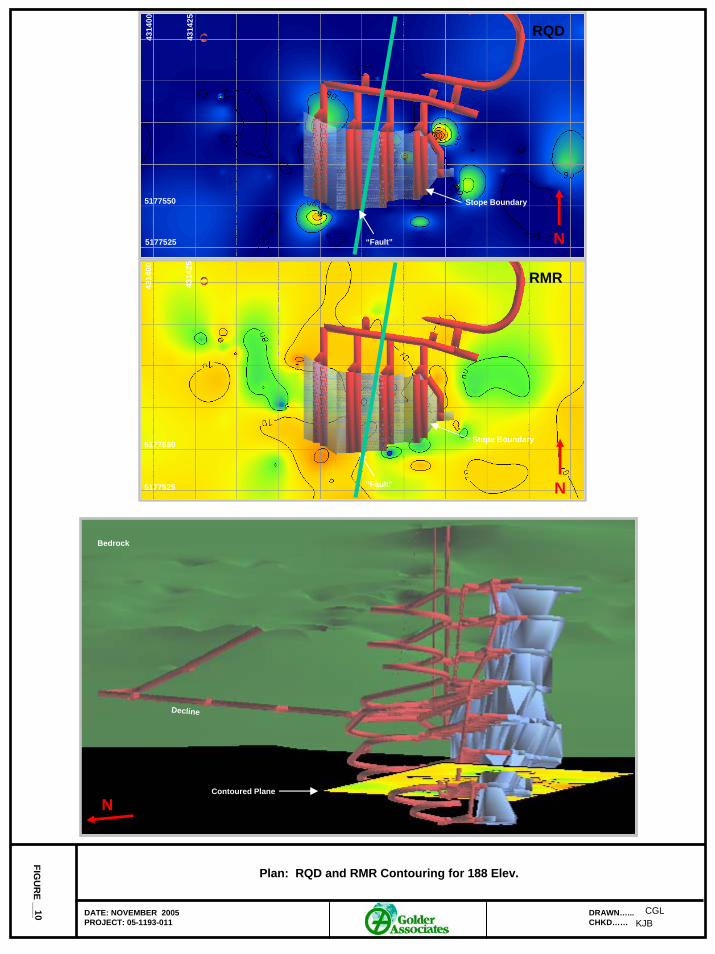
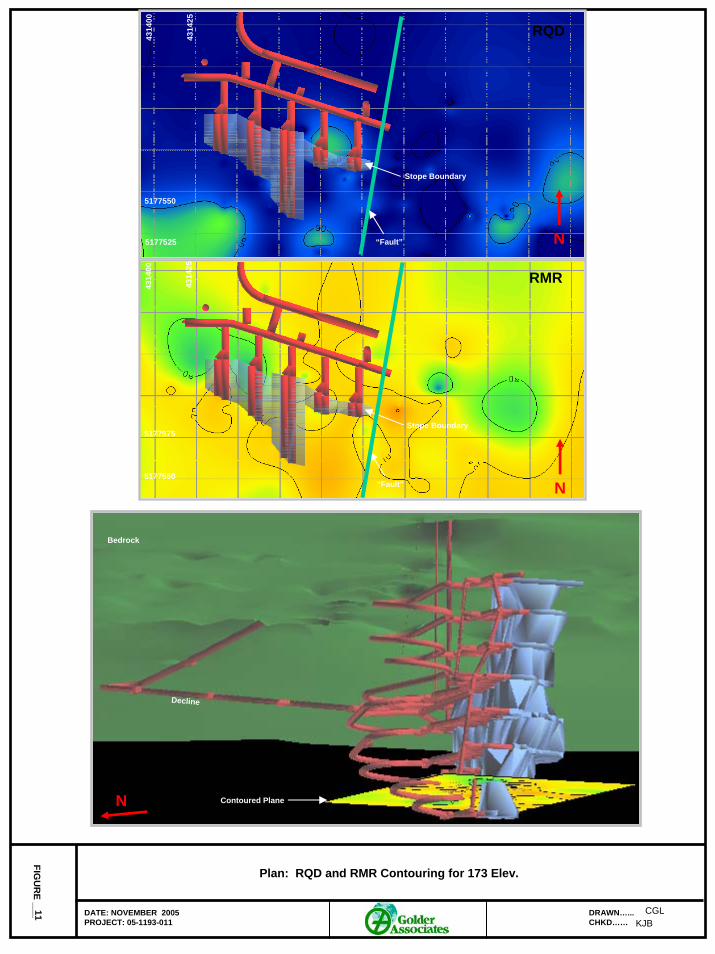
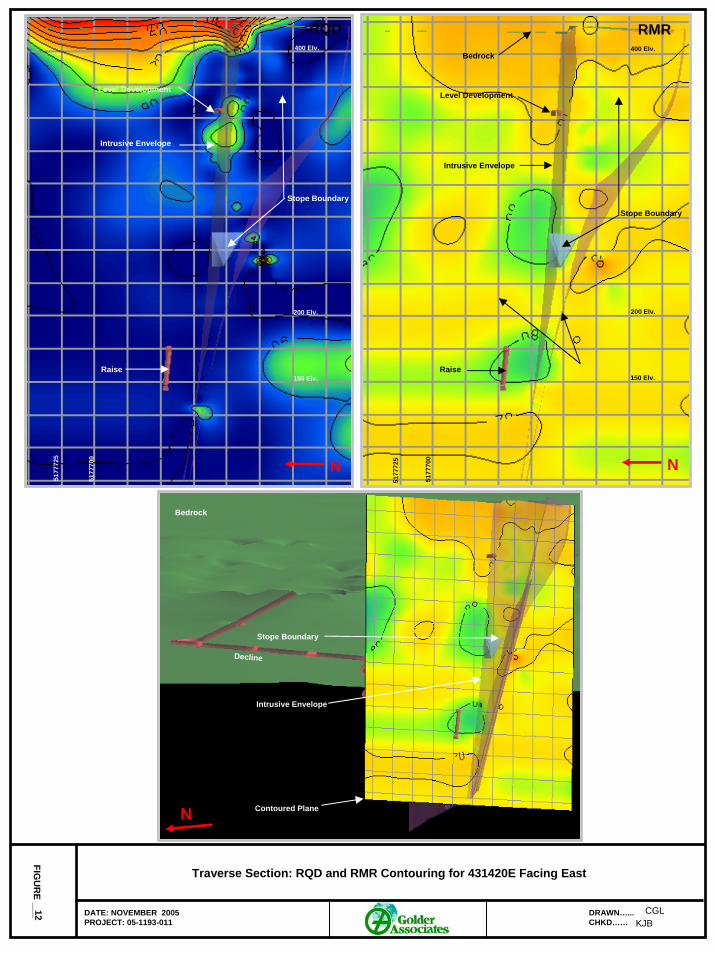
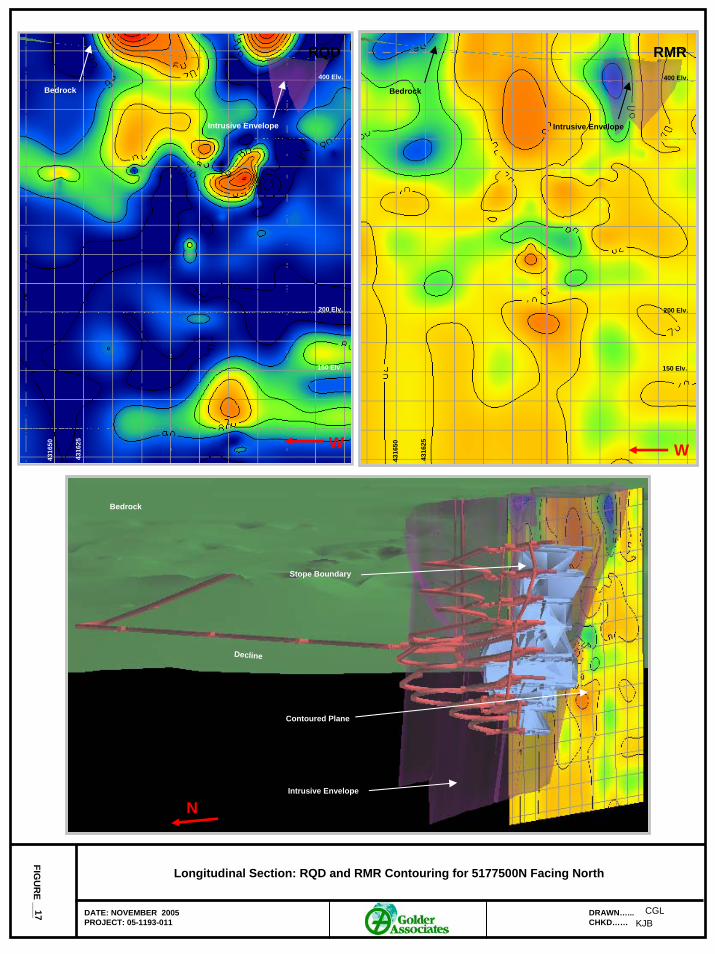
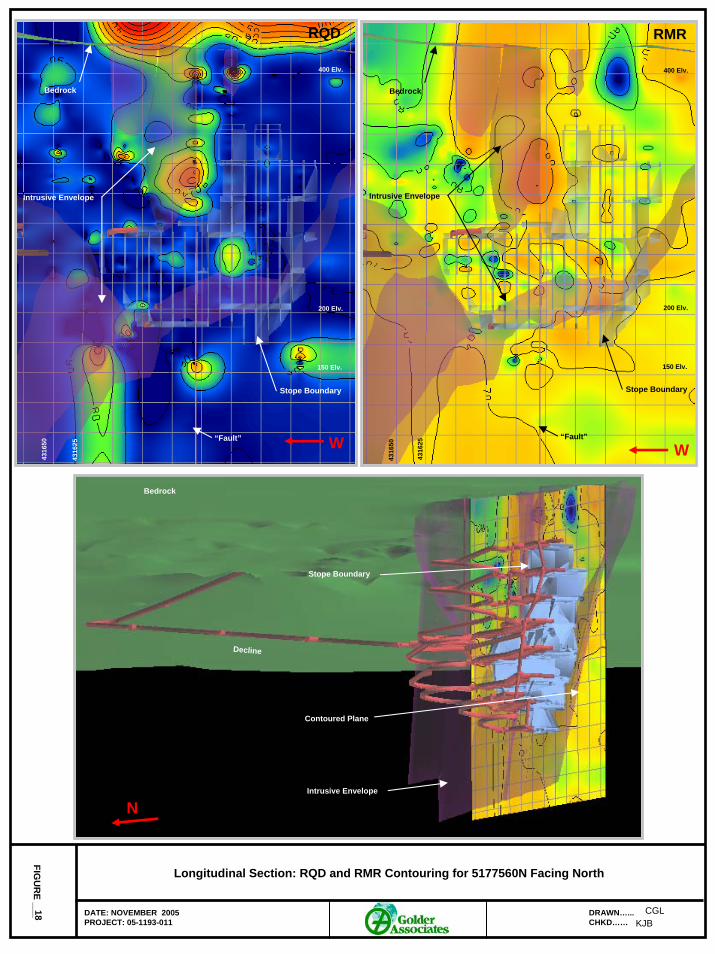
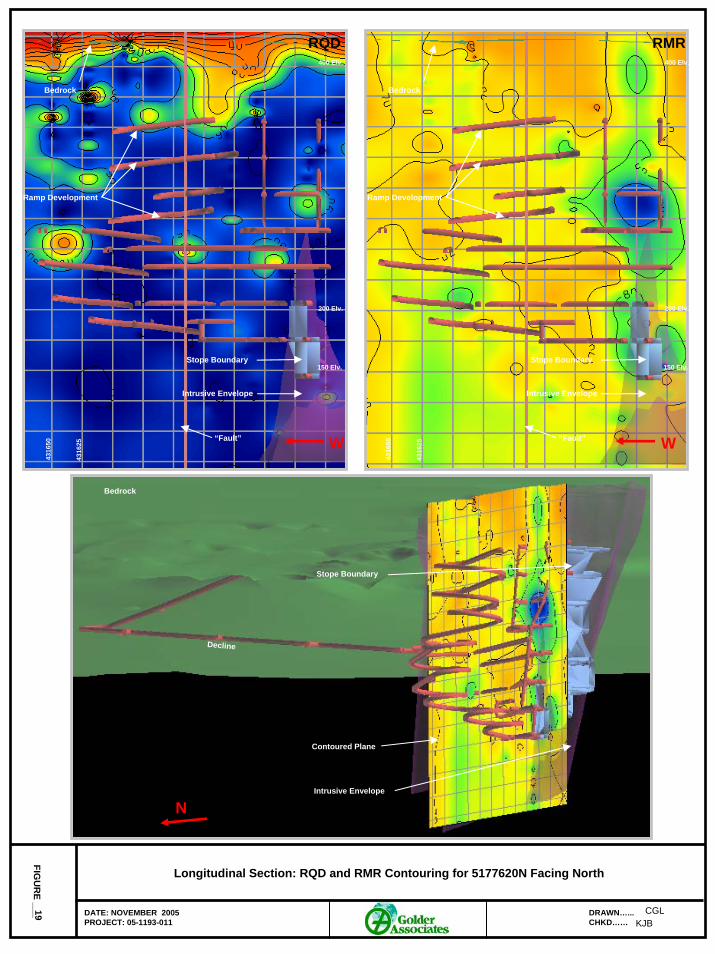
The rock mass rating portion of the geotechnical model has been completed using the GoCAD software based on the updated Microsoft Access database (September 2005). The model contains two fields, Rock Quality Designation (RQD) and Rock Mass Rating (RMR), which can be queried to produce contoured sections in GoCAD. Eighteen sections were contoured in GoCAD for RQD and RMR and are illustrated on Figures 2 to 19.
A simple algorithm to calculate RQD (on a 3 m interval) for each borehole has been written. The structure of the two databases (pre-2004 and 2005) is the same for the fields required to calculate RQD. The majority of the data (pre-2004 and 2005) contained sufficient data to calculate RQD.
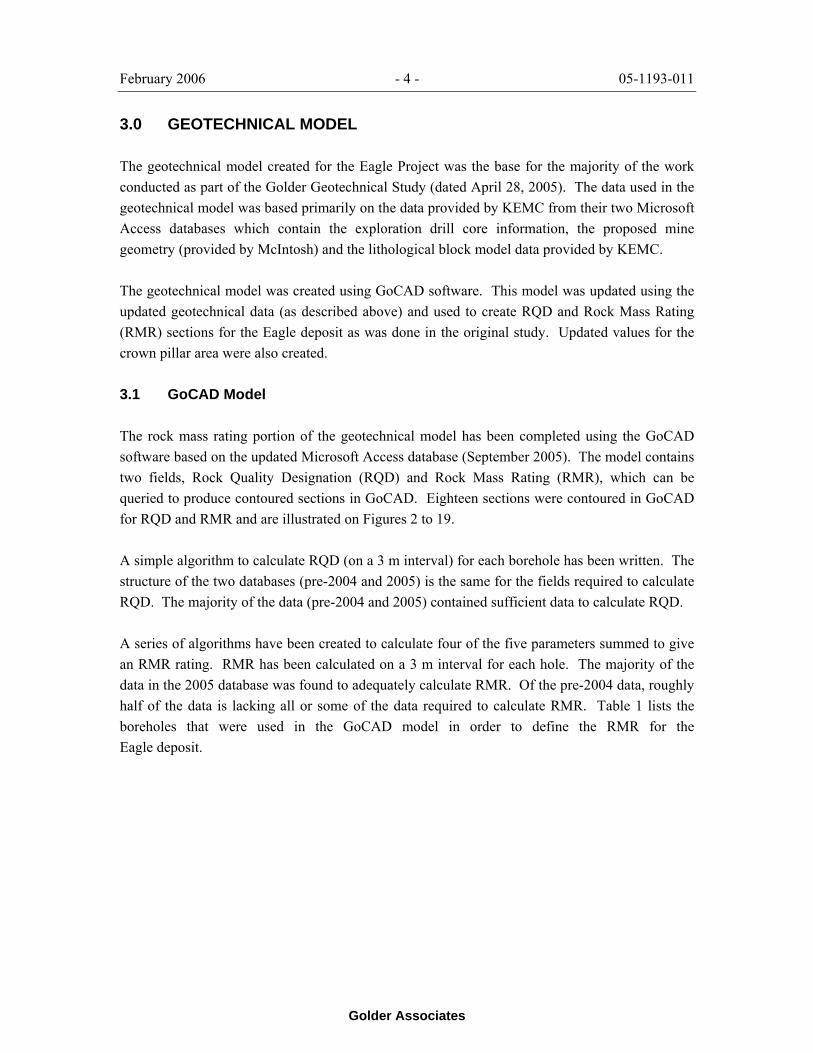
A series of algorithms have been created to calculate four of the five parameters summed to give an RMR rating. RMR has been calculated on a 3 m interval for each hole. The majority of the data in the 2005 database was found to adequately calculate RMR. Of the pre-2004 data, roughly half of the data is lacking all or some of the data required to calculate RMR. Table 1 lists the boreholes that were used in the GoCAD model in order to define the RMR for the Eagle deposit.
February 2006 - 5 - 05-1193-011
Golder Associates
TABLE 1 BOREHOLES USED IN GOCAD MODEL
RMR Calculated for Entire Hole
RMR Calculated for Part of Hole
Insufficient Data to Calculate RMR Database
03EA029 to 03EA043, YD02-24 to YD02-28,
YD02-06
YD02-02, YD02-04, YD02-09, YD02-11, YD02-13, YD02-14, YD02-16, YD02-17,
YD02-20
YD02-01, YD02-03, YD02-05, YD02-08, YD02-10, YD02-12, YD02-15, YD02-18, YD02-19, YD02-21, YD02-22, YD02-23
Pre-2004
04EA044 to 05EA109, YD02-07 - - 2005
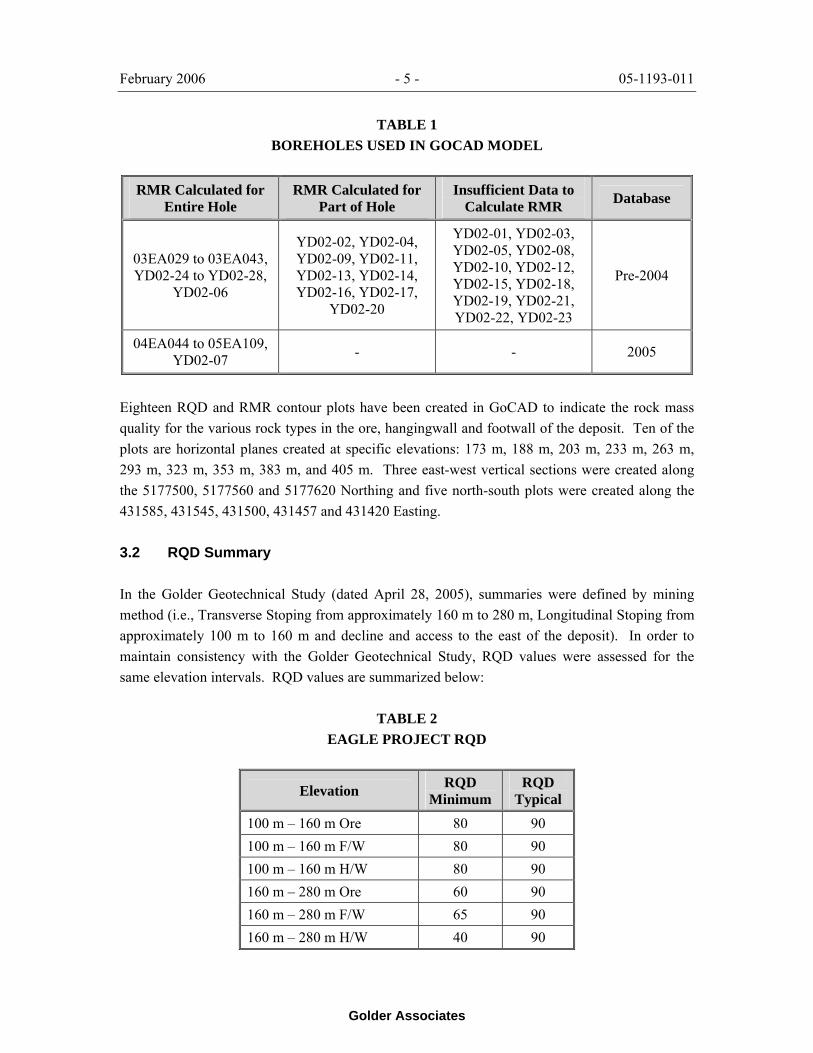
Eighteen RQD and RMR contour plots have been created in GoCAD to indicate the rock mass quality for the various rock types in the ore, hangingwall and footwall of the deposit. Ten of the plots are horizontal planes created at specific elevations: 173 m, 188 m, 203 m, 233 m, 263 m, 293 m, 323 m, 353 m, 383 m, and 405 m. Three east-west vertical sections were created along the 5177500, 5177560 and 5177620 Northing and five north-south plots were created along the 431585, 431545, 431500, 431457 and 431420 Easting.
3.2 RQD Summary
In the Golder Geotechnical Study (dated April 28, 2005), summaries were defined by mining method (i.e., Transverse Stoping from approximately 160 m to 280 m, Longitudinal Stoping from approximately 100 m to 160 m and decline and access to the east of the deposit). In order to maintain consistency with the Golder Geotechnical Study, RQD values were assessed for the same elevation intervals. RQD values are summarized below:
TABLE 2 EAGLE PROJECT RQD
Elevation RQD Minimum
RQD Typical
100 m – 160 m Ore 80 90 100 m – 160 m F/W 80 90 100 m – 160 m H/W 80 90 160 m – 280 m Ore 60 90 160 m – 280 m F/W 65 90 160 m – 280 m H/W 40 90
February 2006 - 6 - 05-1193-011
Golder Associates
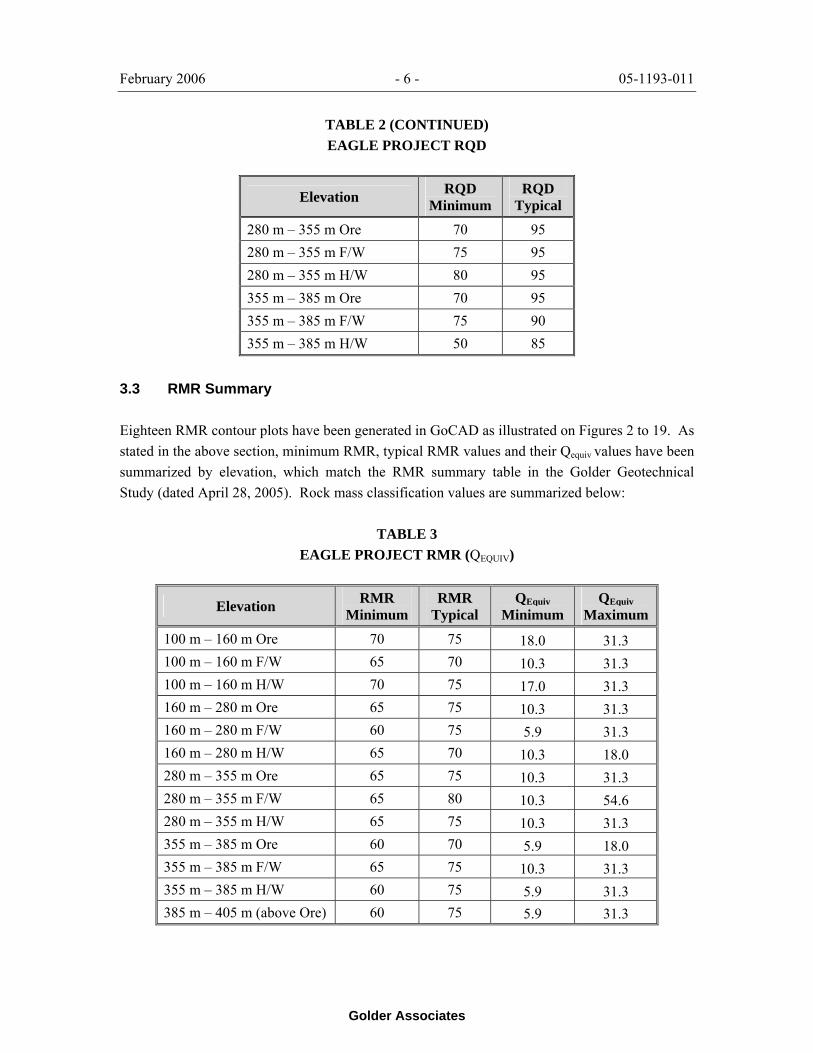
TABLE 2 (CONTINUED) EAGLE PROJECT RQD
Elevation RQD Minimum
RQD Typical
280 m – 355 m Ore 70 95 280 m – 355 m F/W 75 95 280 m – 355 m H/W 80 95 355 m – 385 m Ore 70 95 355 m – 385 m F/W 75 90 355 m – 385 m H/W 50 85
3.3 RMR Summary
Eighteen RMR contour plots have been generated in GoCAD as illustrated on Figures 2 to 19. As stated in the above section, minimum RMR, typical RMR values and their Qequiv values have been summarized by elevation, which match the RMR summary table in the Golder Geotechnical Study (dated April 28, 2005). Rock mass classification values are summarized below:
TABLE 3 EAGLE PROJECT RMR (QEQUIV)
Elevation RMR Minimum
RMR Typical
QEquiv Minimum
QEquiv Maximum
100 m – 160 m Ore 70 75 18.0 31.3 100 m – 160 m F/W 65 70 10.3 31.3 100 m – 160 m H/W 70 75 17.0 31.3 160 m – 280 m Ore 65 75 10.3 31.3 160 m – 280 m F/W 60 75 5.9 31.3 160 m – 280 m H/W 65 70 10.3 18.0 280 m – 355 m Ore 65 75 10.3 31.3 280 m – 355 m F/W 65 80 10.3 54.6 280 m – 355 m H/W 65 75 10.3 31.3 355 m – 385 m Ore 60 70 5.9 18.0 355 m – 385 m F/W 65 75 10.3 31.3 355 m – 385 m H/W 60 75 5.9 31.3 385 m – 405 m (above Ore) 60 75 5.9 31.3
February 2006 - 7 - 05-1193-011
Golder Associates
This summary of rock mass classification compares well with the one presented in the Golder Geotechnical Study (dated April 28, 2005). Rock mass classification has been calculated at specific data locations (at individual drills runs) and all information between data locations has been interpreted. The interpretation between data locations has been contoured in plans and sections in GoCAD using kriging as the interpretation method.
3.4 Crown Pillar Geologic Characterization
A review of the crown pillar geologic characteristics has been conducted in order to better define the rock mass in the crown pillar. The following items have been completed in order to meet this objective:
• Query the geotechnical database in order to identify drillholes located in the crown pillar;
• Complete a discontinuity assessment based on the information from the drillholes in the crown pillar;
• Sort the discontinuity assessment based on lithology and discontinuity type;
• Review major structure section of the geotechnical database and identify if information exists on specific structural zones that may impact the crown pillar; and
• Review the GoCAD modelled estimates of RMR defining the crown pillar.
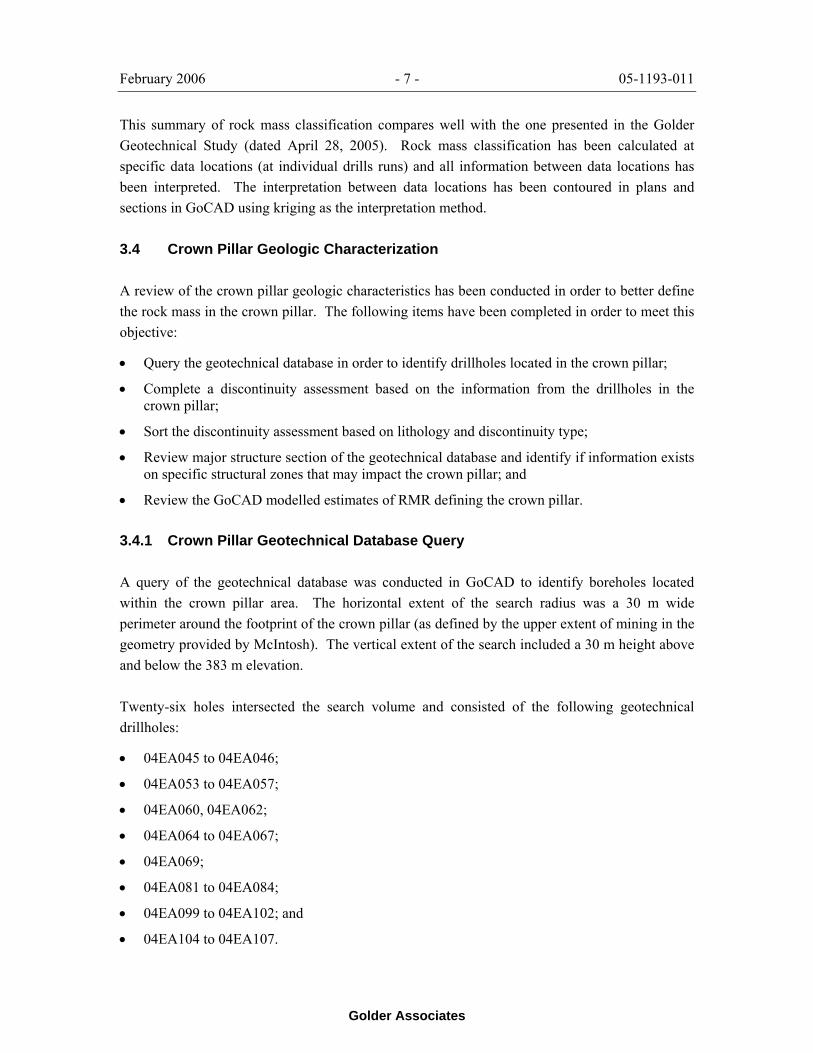
3.4.1 Crown Pillar Geotechnical Database Query
A query of the geotechnical database was conducted in GoCAD to identify boreholes located within the crown pillar area. The horizontal extent of the search radius was a 30 m wide perimeter around the footprint of the crown pillar (as defined by the upper extent of mining in the geometry provided by McIntosh). The vertical extent of the search included a 30 m height above and below the 383 m elevation.
Twenty-six holes intersected the search volume and consisted of the following geotechnical drillholes:
• 04EA045 to 04EA046;
• 04EA053 to 04EA057;
• 04EA060, 04EA062;
• 04EA064 to 04EA067;
• 04EA069;
• 04EA081 to 04EA084;
• 04EA099 to 04EA102; and
• 04EA104 to 04EA107.
February 2006 - 8 - 05-1193-011
Golder Associates
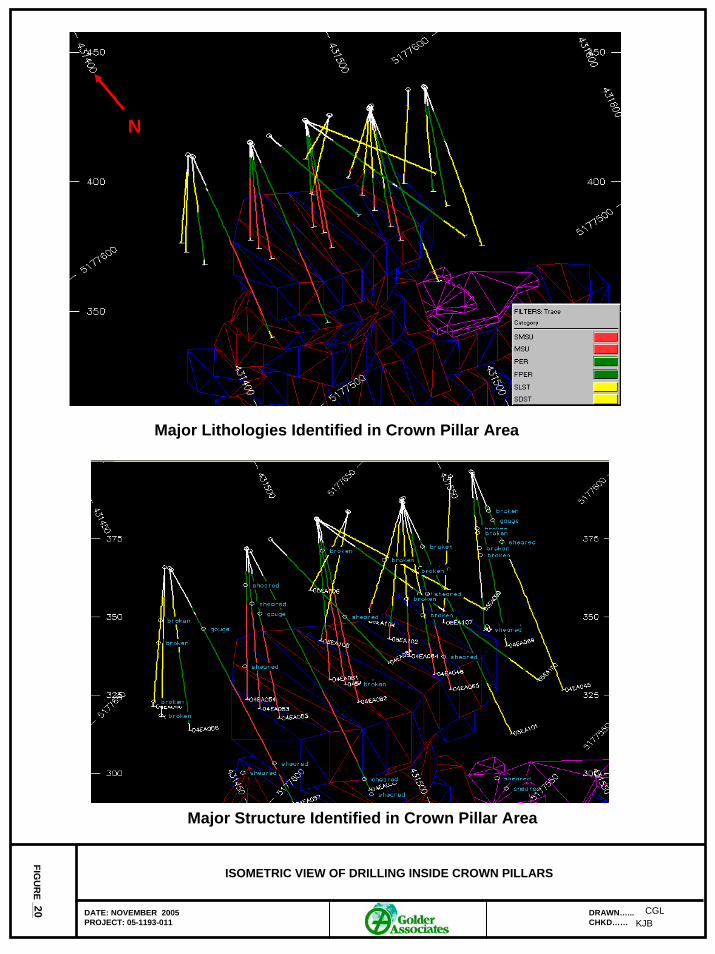
The dominant lithologies (rock types) identified in the above drillholes is illustrated on Figure 20 (upper diagram). The isometric view of the crown pillar area (Figure 20) illustrates that the dominant rock types above and directly below the crown are semi-massive (SMSU), massive sulphides (MSU), feldspathic peridotite and peridotite (FPER and PER). The bedrock surrounding the perimeter of the crown is a combination of peridotite, silt stone (SLST) and sandstone (SDST), with the bedrock adjacent the north side of the crown dominated by siltstone and sandstone and the bedrock adjacent the south side of the crown dominated by feldspathic peridotite and peridotite (FPER and PER).
3.4.2 Crown Pillar Major Structural Assessment
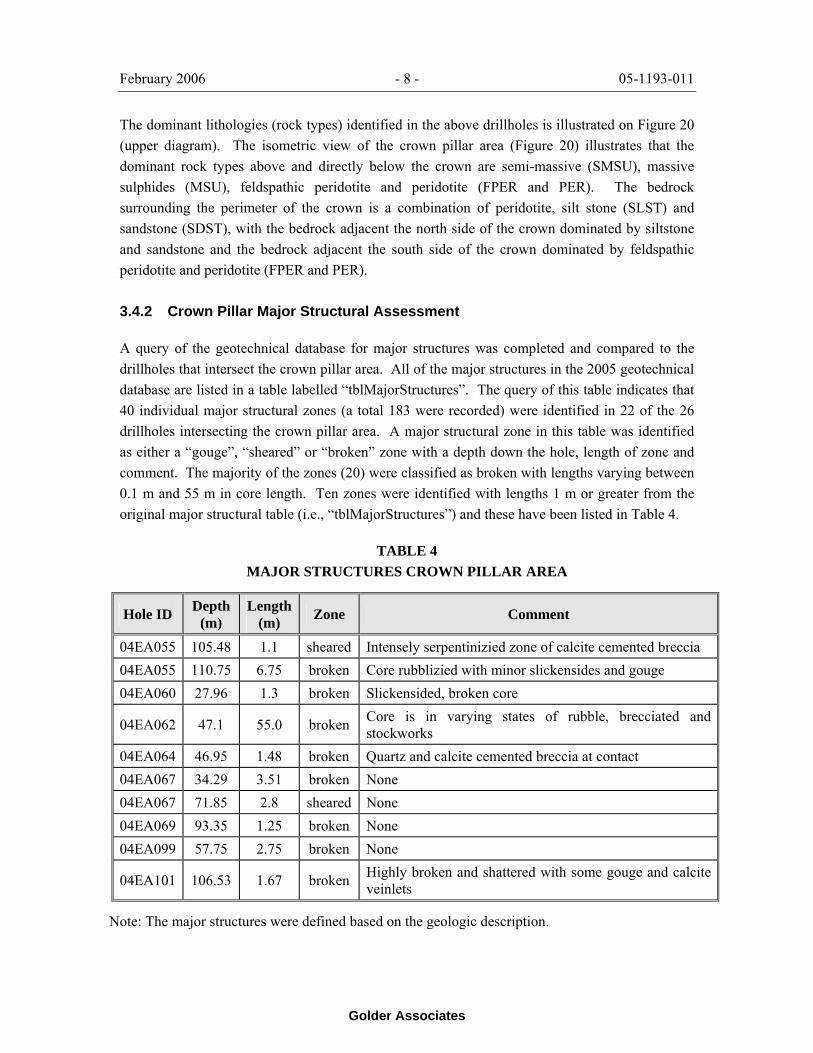
A query of the geotechnical database for major structures was completed and compared to the drillholes that intersect the crown pillar area. All of the major structures in the 2005 geotechnical database are listed in a table labelled “tblMajorStructures”. The query of this table indicates that 40 individual major structural zones (a total 183 were recorded) were identified in 22 of the 26 drillholes intersecting the crown pillar area. A major structural zone in this table was identified as either a “gouge”, “sheared” or “broken” zone with a depth down the hole, length of zone and comment. The majority of the zones (20) were classified as broken with lengths varying between 0.1 m and 55 m in core length. Ten zones were identified with lengths 1 m or greater from the original major structural table (i.e., “tblMajorStructures”) and these have been listed in Table 4.
TABLE 4 MAJOR STRUCTURES CROWN PILLAR AREA
Hole ID Depth (m)
Length (m) Zone Comment
04EA055 105.48 1.1 sheared Intensely serpentinizied zone of calcite cemented breccia 04EA055 110.75 6.75 broken Core rubblizied with minor slickensides and gouge 04EA060 27.96 1.3 broken Slickensided, broken core
04EA062 47.1 55.0 broken Core is in varying states of rubble, brecciated and stockworks
04EA064 46.95 1.48 broken Quartz and calcite cemented breccia at contact 04EA067 34.29 3.51 broken None 04EA067 71.85 2.8 sheared None 04EA069 93.35 1.25 broken None 04EA099 57.75 2.75 broken None
04EA101 106.53 1.67 broken Highly broken and shattered with some gouge and calcite veinlets
Note: The major structures were defined based on the geologic description.
February 2006 - 9 - 05-1193-011
Golder Associates
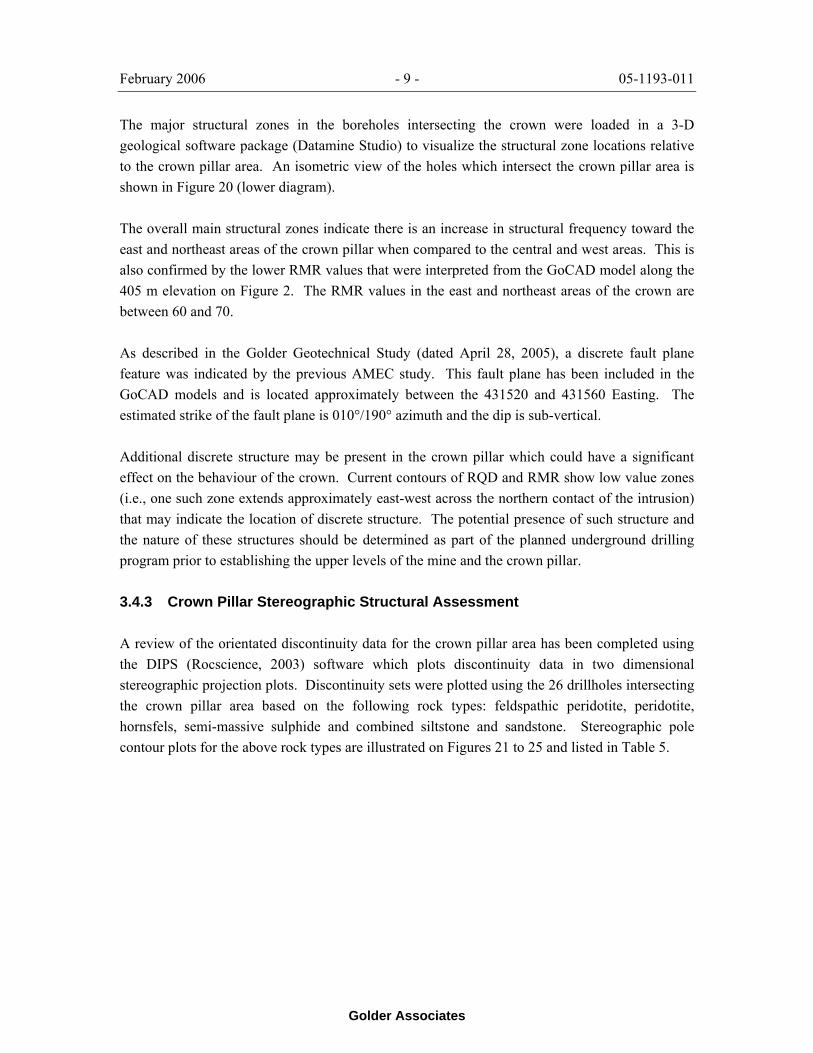
The major structural zones in the boreholes intersecting the crown were loaded in a 3-D geological software package (Datamine Studio) to visualize the structural zone locations relative to the crown pillar area. An isometric view of the holes which intersect the crown pillar area is shown in Figure 20 (lower diagram).
The overall main structural zones indicate there is an increase in structural frequency toward the east and northeast areas of the crown pillar when compared to the central and west areas. This is also confirmed by the lower RMR values that were interpreted from the GoCAD model along the 405 m elevation on Figure 2. The RMR values in the east and northeast areas of the crown are between 60 and 70.
As described in the Golder Geotechnical Study (dated April 28, 2005), a discrete fault plane feature was indicated by the previous AMEC study. This fault plane has been included in the GoCAD models and is located approximately between the 431520 and 431560 Easting. The estimated strike of the fault plane is 010°/190° azimuth and the dip is sub-vertical.
Additional discrete structure may be present in the crown pillar which could have a significant effect on the behaviour of the crown. Current contours of RQD and RMR show low value zones (i.e., one such zone extends approximately east-west across the northern contact of the intrusion) that may indicate the location of discrete structure. The potential presence of such structure and the nature of these structures should be determined as part of the planned underground drilling program prior to establishing the upper levels of the mine and the crown pillar.
3.4.3 Crown Pillar Stereographic Structural Assessment
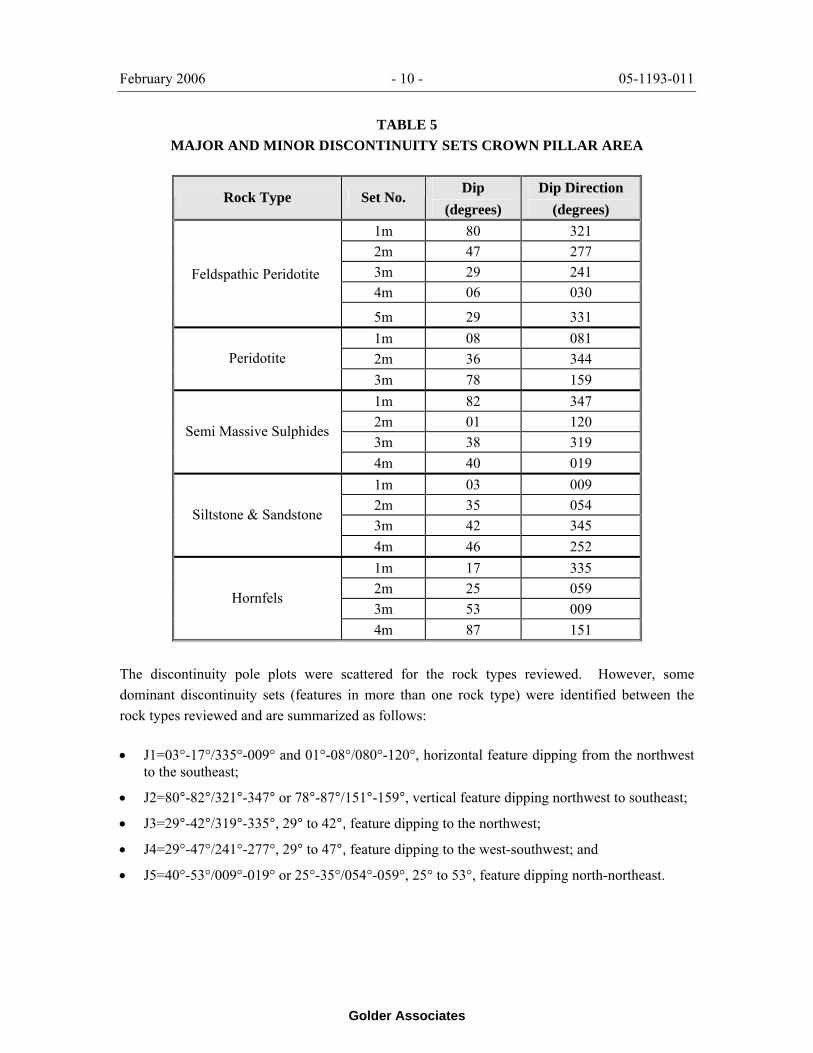
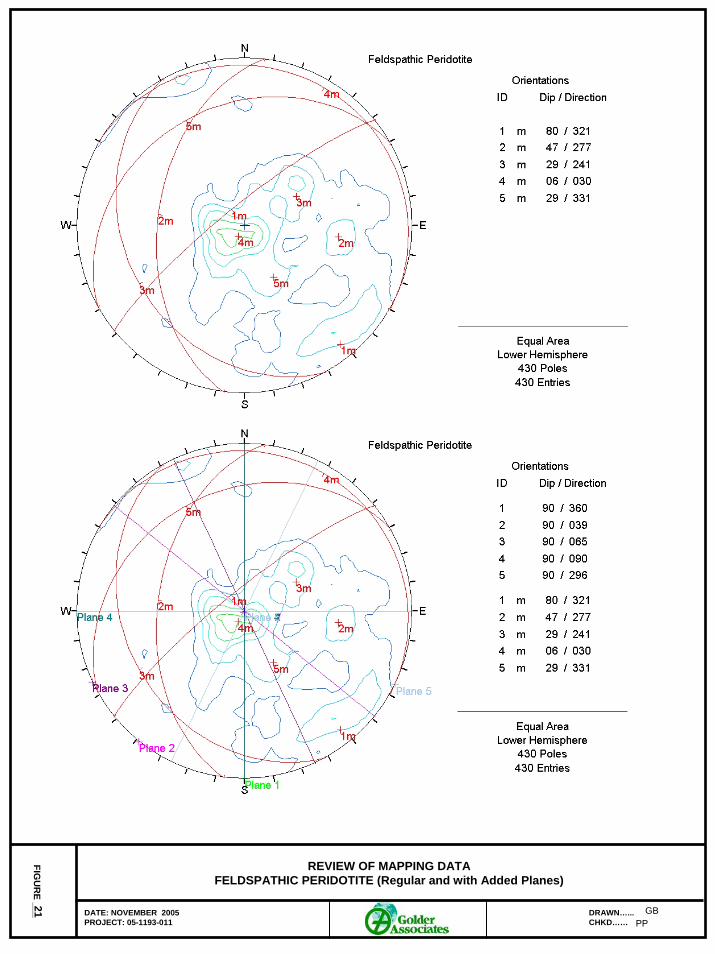
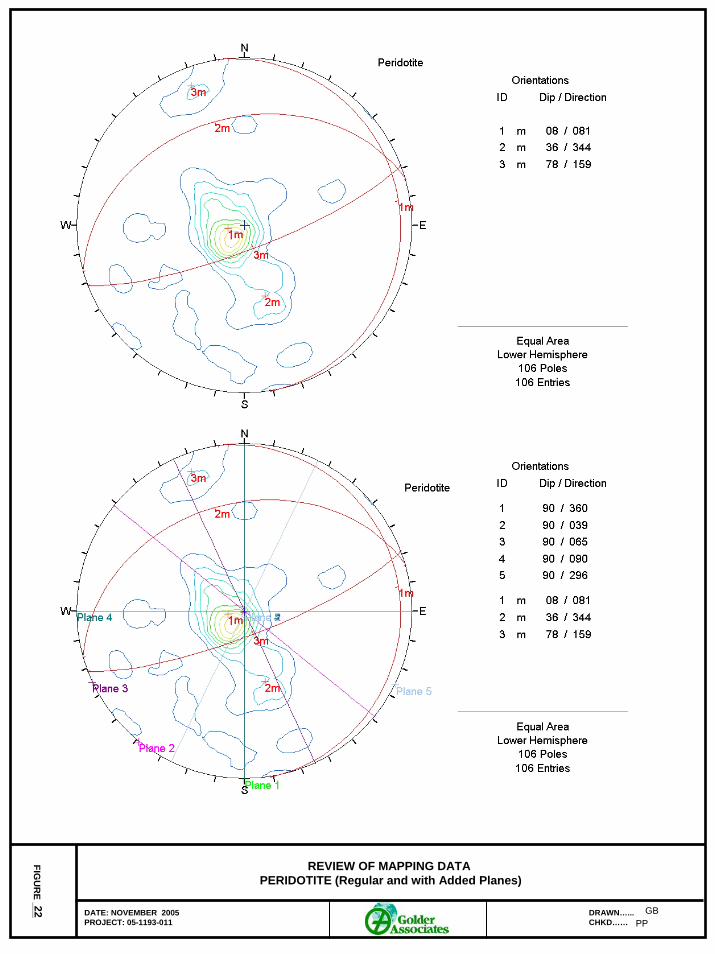
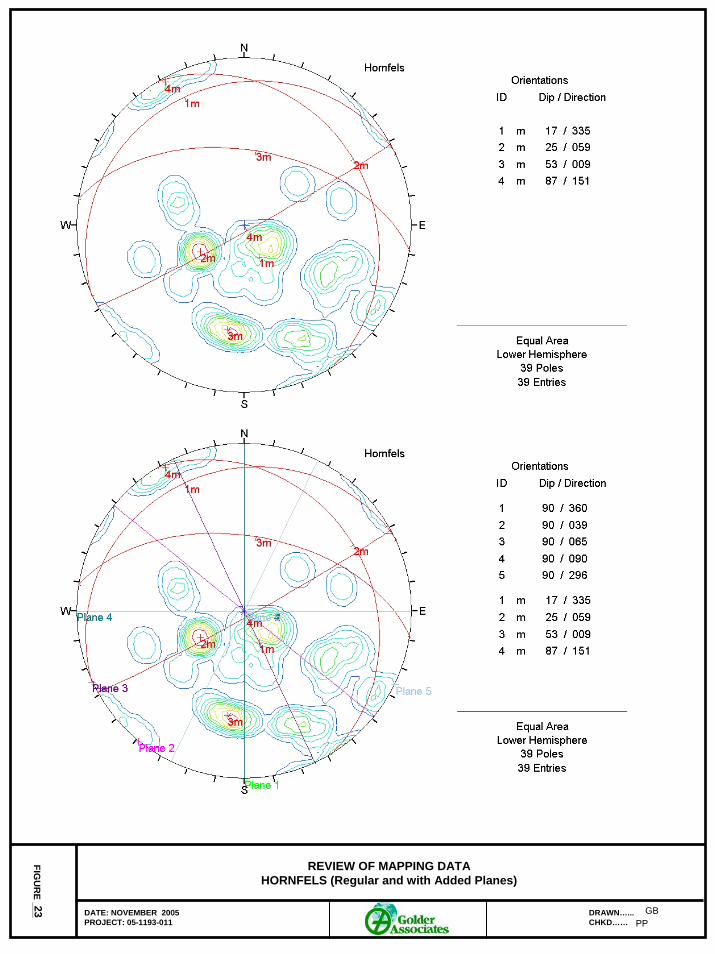
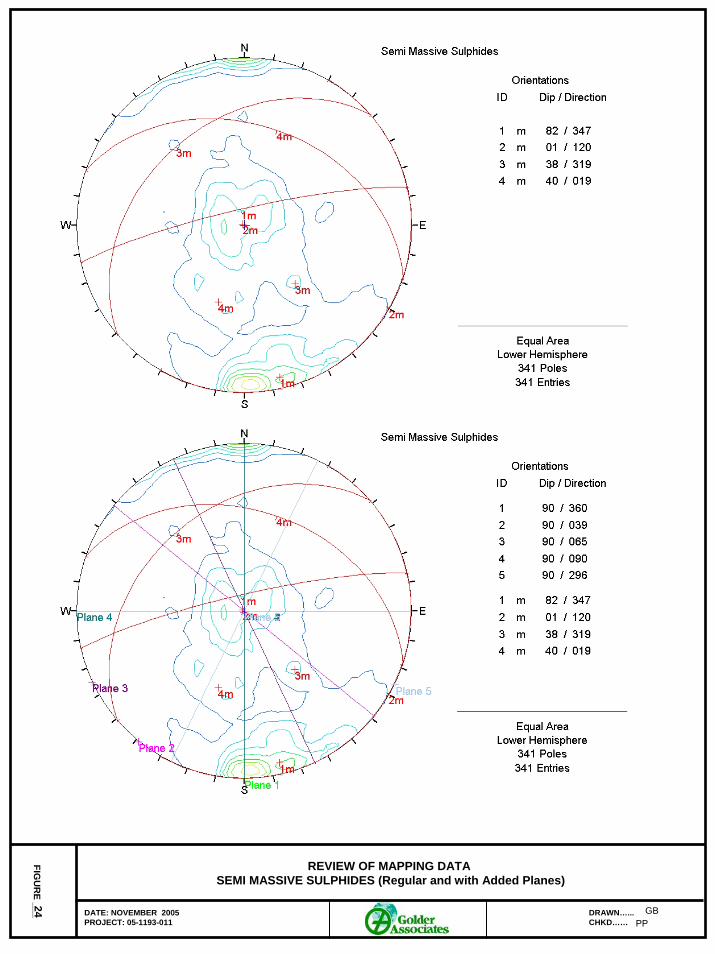
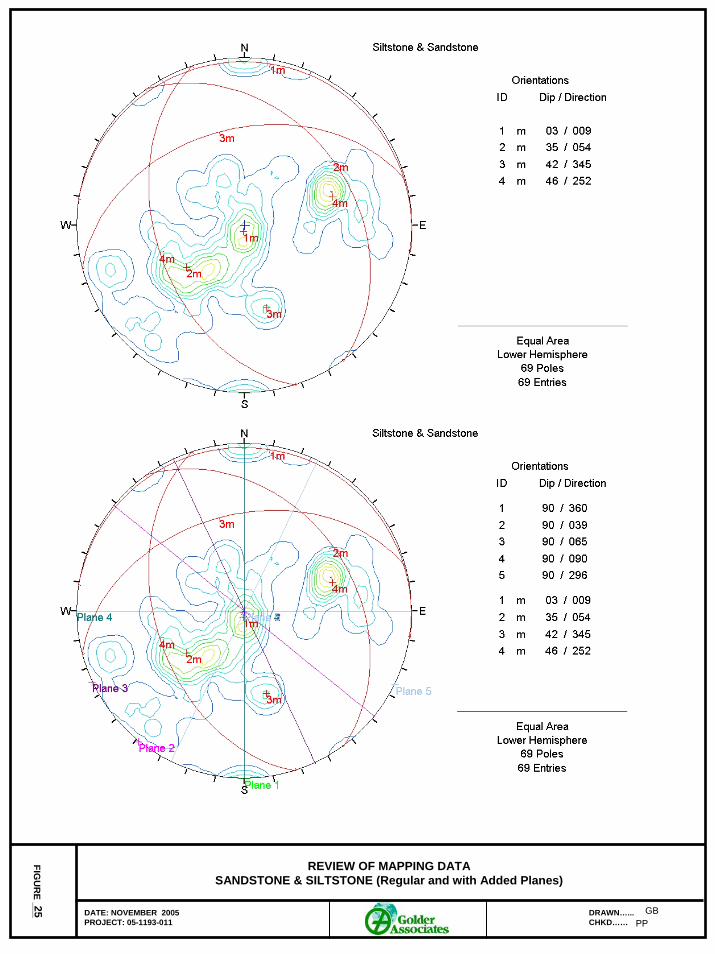
A review of the orientated discontinuity data for the crown pillar area has been completed using the DIPS (Rocscience, 2003) software which plots discontinuity data in two dimensional stereographic projection plots. Discontinuity sets were plotted using the 26 drillholes intersecting the crown pillar area based on the following rock types: feldspathic peridotite, peridotite, hornsfels, semi-massive sulphide and combined siltstone and sandstone. Stereographic pole contour plots for the above rock types are illustrated on Figures 21 to 25 and listed in Table 5.
February 2006 - 10 - 05-1193-011
Golder Associates
TABLE 5 MAJOR AND MINOR DISCONTINUITY SETS CROWN PILLAR AREA
Dip Dip Direction Rock Type Set No.
(degrees) (degrees) 1m 80 321 2m 47 277 3m 29 241 4m 06 030
Feldspathic Peridotite
5m 29 331 1m 08 081 2m 36 344 Peridotite 3m 78 159 1m 82 347 2m 01 120 3m 38 319
Semi Massive Sulphides
4m 40 019 1m 03 009 2m 35 054 3m 42 345
Siltstone & Sandstone
4m 46 252 1m 17 335 2m 25 059 3m 53 009
Hornfels
4m 87 151 The discontinuity pole plots were scattered for the rock types reviewed. However, some dominant discontinuity sets (features in more than one rock type) were identified between the rock types reviewed and are summarized as follows:
• J1=03°-17°/335°-009° and 01°-08°/080°-120°, horizontal feature dipping from the northwest to the southeast;
• J2=80°-82°/321°-347° or 78°-87°/151°-159°, vertical feature dipping northwest to southeast;
• J3=29°-42°/319°-335°, 29° to 42°, feature dipping to the northwest;
• J4=29°-47°/241°-277°, 29° to 47°, feature dipping to the west-southwest; and
• J5=40°-53°/009°-019° or 25°-35°/054°-059°, 25° to 53°, feature dipping north-northeast.
February 2006 - 11 - 05-1193-011
Golder Associates
4.0 CROWN PILLAR
4.1 Crown Pillar Geometry
The bedrock surface elevation has been considered to be located at 415 m. This elevation was based on two sources: 1) bedrock intercepts of drillholes found to penetrate the crown pillar and 2) from the current interpretation of bedrock topography. This data was supplied by KEMC in the form of Excel spreadsheets containing drillhole collar information and the current bedrock topographic contour.
Mine design was obtained from McIntosh (Dec. 5, 2005). In the previous mine design, the top of mining was located at the 387.5 m elevation. The new design has removed the upper level of stopes (Level 1) and now has the top of mining at Level 2 (357.5 m elevation). These design modifications resulted in a new crown pillar geometry.
4.2 Crown Pillar Stability Assessment
Previous crown pillar assessments have been completed for the Eagle Project using the Scaled Span Concept Method (empirical) and the CPillar (Rocscience, 2001) limit equilibrium program. AutoCAD drawings have been provided by McIntosh Engineering illustrating the updated mining geometries. The crown pillar configuration is as follows:
• Crown bottom elevation (back of last mining panel) = 357.5 m.;
• Crown pillar span (S) = 68 m;
• Crown pillar strike length (L) = 50 m;
• Bedrock surface elevation = 415 m; and
• Crown pillar thickness (t) = 57.5 m (415 m – 357.5 m).
The rock mass quality (i.e., RMR and Qequiv) of the crown pillar has also been updated based on the 2005 GoCAD model. The RMR in the eastern and western areas of the crown pillar has been estimated to be between 60 and 70 and the RMR in the central area of the crown pillar between 80 and 90 based on the 415 m and 383 m elevation contours illustrated on Figures 2 and 3. The following rock mass quality values have been considered for the crown pillar assessment:
• Minimum RMR = 60 (Qequiv=5.9); and
• Typical RMR = 70 (Qequiv=17.97).
February 2006 - 12 - 05-1193-011
Golder Associates
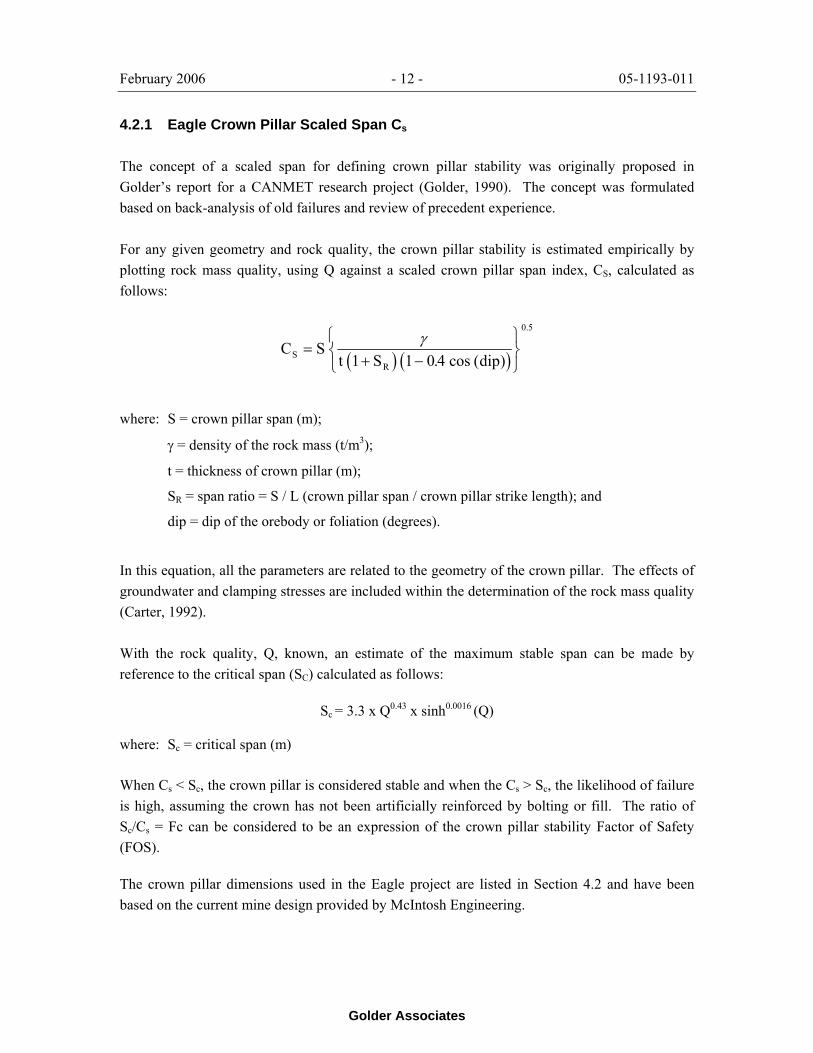
4.2.1 Eagle Crown Pillar Scaled Span Cs
The concept of a scaled span for defining crown pillar stability was originally proposed in Golder’s report for a CANMET research project (Golder, 1990). The concept was formulated based on back-analysis of old failures and review of precedent experience.
For any given geometry and rock quality, the crown pillar stability is estimated empirically by plotting rock mass quality, using Q against a scaled crown pillar span index, CS, calculated as follows:
( ) ( )C S
t S cos dipSR
=+ −
⎧⎨⎩
⎫⎬⎭
γ1 1 0 4
0 5
. ( )
.
where: S = crown pillar span (m);
γ = density of the rock mass (t/m3);
t = thickness of crown pillar (m);
SR = span ratio = S / L (crown pillar span / crown pillar strike length); and
dip = dip of the orebody or foliation (degrees).
In this equation, all the parameters are related to the geometry of the crown pillar. The effects of groundwater and clamping stresses are included within the determination of the rock mass quality (Carter, 1992).
With the rock quality, Q, known, an estimate of the maximum stable span can be made by reference to the critical span (SC) calculated as follows:
Sc = 3.3 x Q0.43 x sinh0.0016 (Q)
where: Sc = critical span (m)
When Cs < Sc, the crown pillar is considered stable and when the Cs > Sc, the likelihood of failure is high, assuming the crown has not been artificially reinforced by bolting or fill. The ratio of Sc/Cs = Fc can be considered to be an expression of the crown pillar stability Factor of Safety (FOS).
The crown pillar dimensions used in the Eagle project are listed in Section 4.2 and have been based on the current mine design provided by McIntosh Engineering.

February 2006 - 13 - 05-1193-011
Golder Associates
The dip of the orebody in the upper level of the mine is vertical to sub-vertical. For this assessment, the worst case of vertical (-90o) was used. The rock mass quality of the crown pillar was based on the minimum (RMR=60 or Qequiv = 5.9) and typical (RMR = 70 or Qequiv = 17.97) estimates in Table 3. Summarized in Table 6 is the scaled span assessment based on the current crown pillar dimensions.
TABLE 6 SCALED SPAN CROWN PILLAR ASSESSMENT
Bottom of Crown Pillar
H/W Dip (°)
t (m)
S (m)
L (m) CS RMR QEQUIV Sc Fc
(FOS)
357.5 m 90 57.5 68.0 50.0 9.77 70.00 17.97 11.75 1.20 357.5 m 90 57.5 68.0 50.0 9.77 66.40 12.05 9.80 1.0 357.5 m 90 57.5 68.0 50.0 9.77 60.00 5.92 7.15 0.73
The crown pillar is predicted to be stable when considering the typical RMR value of 70 (FOS 1.20). The FOS for the crown pillar is above 1.0 for RMR values >66.4 (Qequiv = 12.05). The crown pillar is predicted to be potentially unstable when considering the minimum RMR values of 60 (FOS = 0.73).
4.2.2 CPillar Analysis
The program CPillar (Rocscience, 2001) was used for checking the empirical scaled span procedure assessment of stability state. This program uses limit equilibrium techniques to compute an FOS and probability of failure (POF) against several modes of failure, including various cracking modes and vertical downward sliding of a rectangular, horizontal crown pillar (assuming a rigid block model). Input, in the form of geometry, rock mass strength, in situ stresses and groundwater conditions are entered (with the option to input standard deviations of controlling parameters, if known) and, based on these values, a mean FOS and POF is calculated.
A number of basic assumptions were made for the CPillar analyses performed to evaluate the stability of the Eagle Mine crown pillar. These assumptions are as summarized below:
(i) To be conservative, the water levels were estimated to be coincident with the ground surface;
(ii) The extent of the in situ horizontal stresses, which affect the crown pillar, have not been determined. The analyses were conducted with horizontal and vertical stress ratios K = 1;
(iii) The dip of the orebody in the region of the crown pillar was estimated to be 90°;
(iv) To be conservative, all the stopes are assumed to not have the benefit of active pressure from backfill below;
February 2006 - 14 - 05-1193-011
Golder Associates
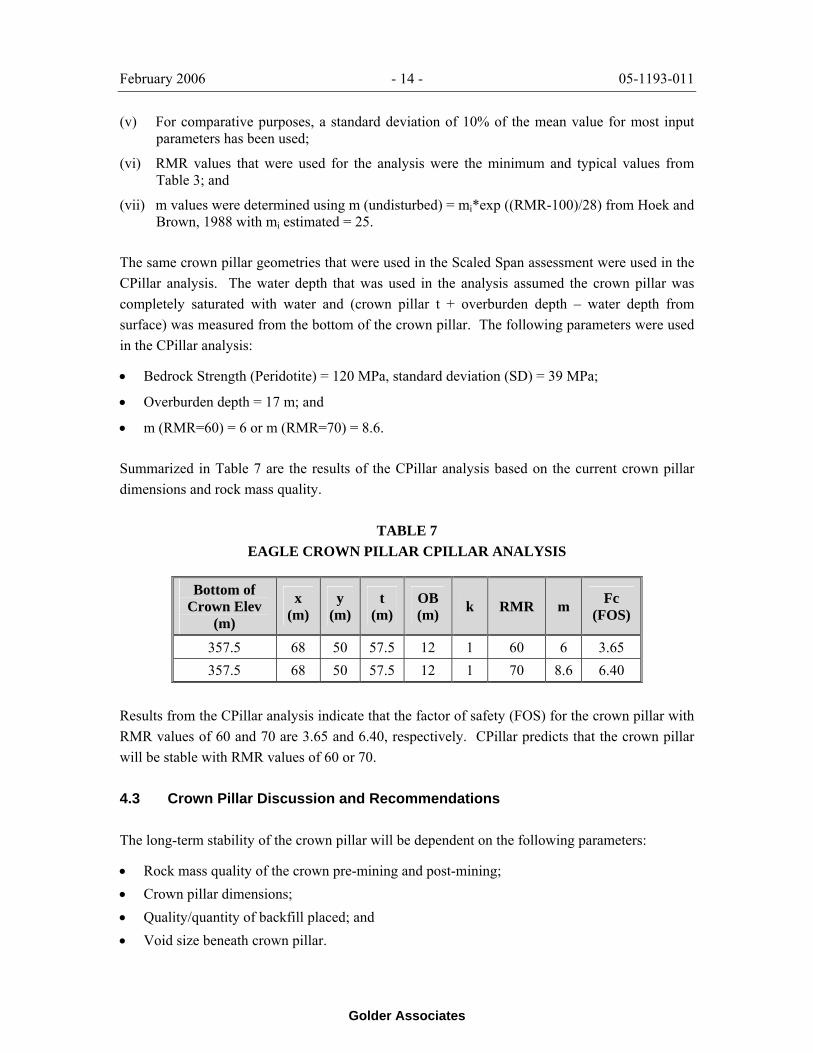
(v) For comparative purposes, a standard deviation of 10% of the mean value for most input parameters has been used;
(vi) RMR values that were used for the analysis were the minimum and typical values from Table 3; and
(vii) m values were determined using m (undisturbed) = mi*exp ((RMR-100)/28) from Hoek and Brown, 1988 with mi estimated = 25.
The same crown pillar geometries that were used in the Scaled Span assessment were used in the CPillar analysis. The water depth that was used in the analysis assumed the crown pillar was completely saturated with water and (crown pillar t + overburden depth – water depth from surface) was measured from the bottom of the crown pillar. The following parameters were used in the CPillar analysis:
• Bedrock Strength (Peridotite) = 120 MPa, standard deviation (SD) = 39 MPa;
• Overburden depth = 17 m; and
• m (RMR=60) = 6 or m (RMR=70) = 8.6.
Summarized in Table 7 are the results of the CPillar analysis based on the current crown pillar dimensions and rock mass quality.
TABLE 7 EAGLE CROWN PILLAR CPILLAR ANALYSIS
Bottom of Crown Elev
(m)
x (m)
y (m)
t (m)
OB (m) k RMR m Fc
(FOS)
357.5 68 50 57.5 12 1 60 6 3.65 357.5 68 50 57.5 12 1 70 8.6 6.40
Results from the CPillar analysis indicate that the factor of safety (FOS) for the crown pillar with RMR values of 60 and 70 are 3.65 and 6.40, respectively. CPillar predicts that the crown pillar will be stable with RMR values of 60 or 70.
4.3 Crown Pillar Discussion and Recommendations
The long-term stability of the crown pillar will be dependent on the following parameters:
• Rock mass quality of the crown pre-mining and post-mining; • Crown pillar dimensions; • Quality/quantity of backfill placed; and • Void size beneath crown pillar.

February 2006 - 15 - 05-1193-011
Golder Associates
The CPillar results predicted that the crown pillar would be stable for rock mass classification values of 70 (modelled to be the typical value in the crown pillar) as well as 60 (modelled to be on the lower end of values to be expected in the crown pillar). The Scaled Span assessment predicted that the crown pillar would be stable for rock mass classification values of 70 but was potentially unstable with a value of 60. The above two stability assessments were completed to consider different potential failure mechanisms for the crown pillar. The Scaled Span assessment is considered the industry accepted method of assessing overall crown pillar stability. The conclusion of the stability assessment was that the crown pillar is predicted to be stable with typical rock mass classification values and that potentially lower values (i.e., <70) would be identified by KEMC prior to establishing the crown pillar.
The KEMC mine design will start mining at the lower levels and progress upwards. Additional drill information will be collected as the mining front approaches the crown pillar area which will allow a better characterization of the rock mass quality of the crown pillar and the top of bedrock elevation. As more information becomes available, a further refinement of this crown pillar assessment can be completed before commencing development in the upper levels of the mine. Based on this additional information, it may be possible to mine above the current proposed top of mining elevation. Several alternatives will be available to KEMC, should the rock mass classification values be lower than 70. These options will include: adjusting the thickness of the crown pillar, decreasing the number of stopes mined in the upper level to reduce the footprint of the crown pillar, and mining the stopes in the upper level in stages and maximizing the tightness of backfill employed (i.e., minimizing the vertical void beneath the crown pillar).
February 2006 - 16 - 05-1193-011
Golder Associates
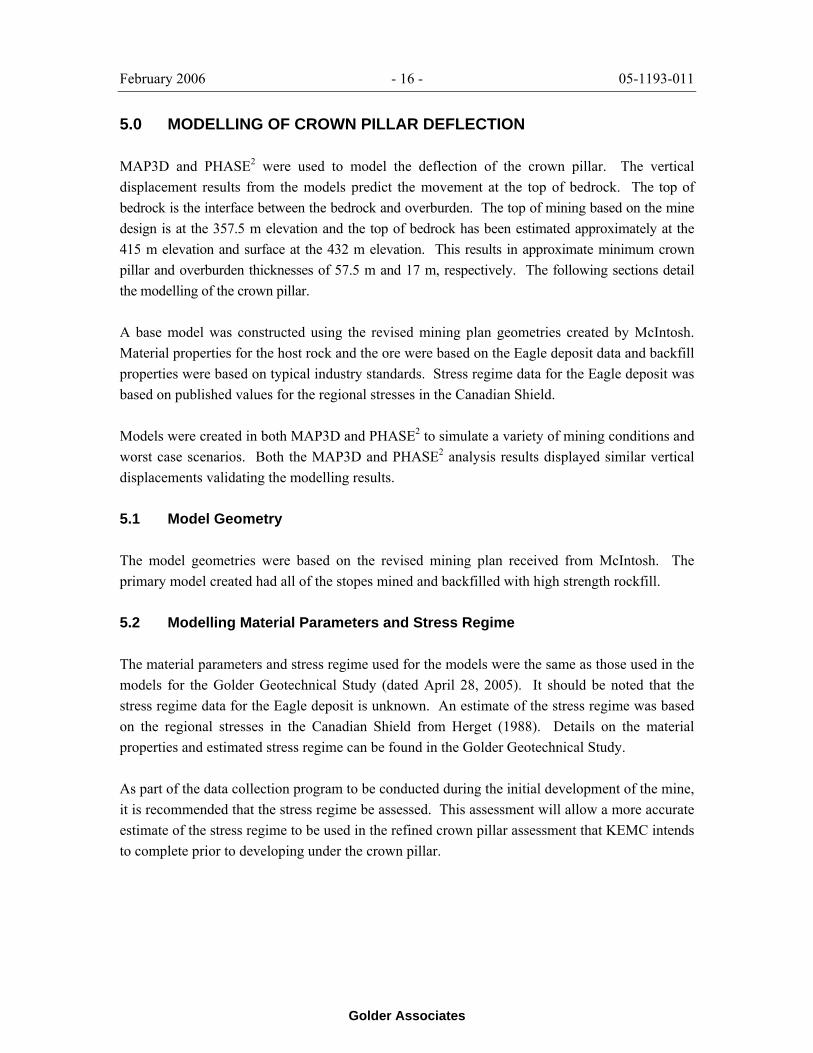
5.0 MODELLING OF CROWN PILLAR DEFLECTION
MAP3D and PHASE2 were used to model the deflection of the crown pillar. The vertical displacement results from the models predict the movement at the top of bedrock. The top of bedrock is the interface between the bedrock and overburden. The top of mining based on the mine design is at the 357.5 m elevation and the top of bedrock has been estimated approximately at the 415 m elevation and surface at the 432 m elevation. This results in approximate minimum crown pillar and overburden thicknesses of 57.5 m and 17 m, respectively. The following sections detail the modelling of the crown pillar.
A base model was constructed using the revised mining plan geometries created by McIntosh. Material properties for the host rock and the ore were based on the Eagle deposit data and backfill properties were based on typical industry standards. Stress regime data for the Eagle deposit was based on published values for the regional stresses in the Canadian Shield.
Models were created in both MAP3D and PHASE2 to simulate a variety of mining conditions and worst case scenarios. Both the MAP3D and PHASE2 analysis results displayed similar vertical displacements validating the modelling results.
5.1 Model Geometry
The model geometries were based on the revised mining plan received from McIntosh. The primary model created had all of the stopes mined and backfilled with high strength rockfill.
5.2 Modelling Material Parameters and Stress Regime
The material parameters and stress regime used for the models were the same as those used in the models for the Golder Geotechnical Study (dated April 28, 2005). It should be noted that the stress regime data for the Eagle deposit is unknown. An estimate of the stress regime was based on the regional stresses in the Canadian Shield from Herget (1988). Details on the material properties and estimated stress regime can be found in the Golder Geotechnical Study.
As part of the data collection program to be conducted during the initial development of the mine, it is recommended that the stress regime be assessed. This assessment will allow a more accurate estimate of the stress regime to be used in the refined crown pillar assessment that KEMC intends to complete prior to developing under the crown pillar.
February 2006 - 17 - 05-1193-011
Golder Associates
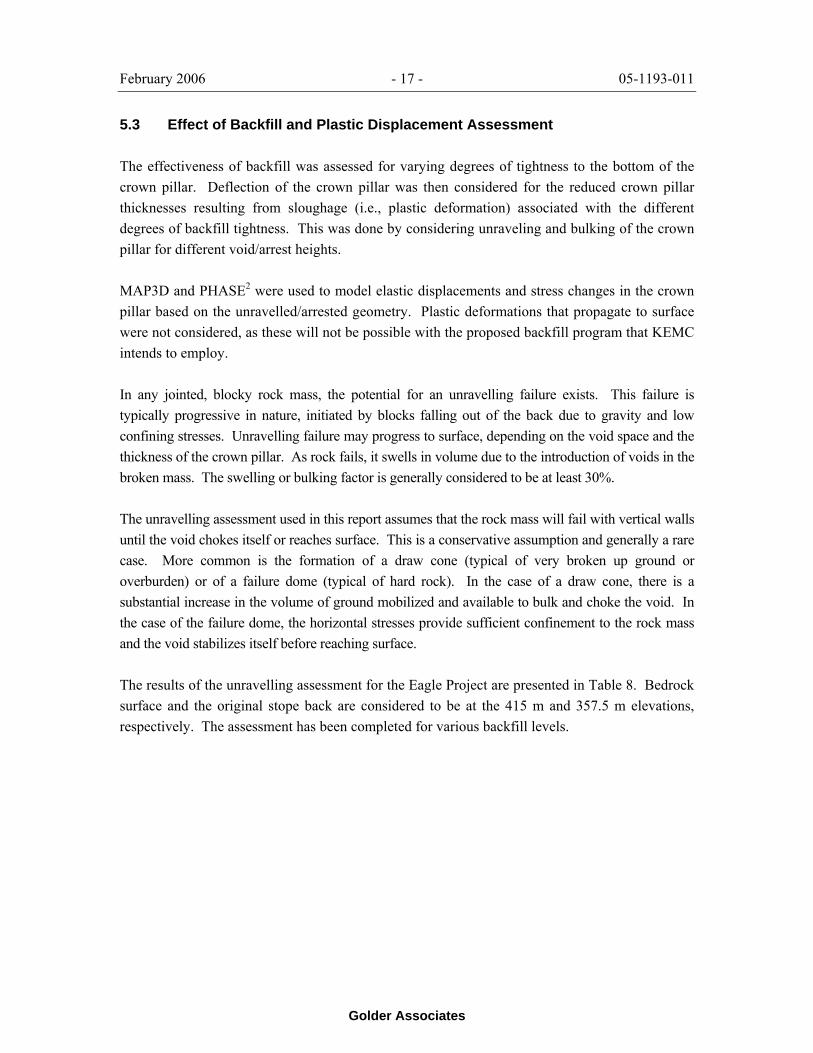
5.3 Effect of Backfill and Plastic Displacement Assessment
The effectiveness of backfill was assessed for varying degrees of tightness to the bottom of the crown pillar. Deflection of the crown pillar was then considered for the reduced crown pillar thicknesses resulting from sloughage (i.e., plastic deformation) associated with the different degrees of backfill tightness. This was done by considering unraveling and bulking of the crown pillar for different void/arrest heights.
MAP3D and PHASE2 were used to model elastic displacements and stress changes in the crown pillar based on the unravelled/arrested geometry. Plastic deformations that propagate to surface were not considered, as these will not be possible with the proposed backfill program that KEMC intends to employ.
In any jointed, blocky rock mass, the potential for an unravelling failure exists. This failure is typically progressive in nature, initiated by blocks falling out of the back due to gravity and low confining stresses. Unravelling failure may progress to surface, depending on the void space and the thickness of the crown pillar. As rock fails, it swells in volume due to the introduction of voids in the broken mass. The swelling or bulking factor is generally considered to be at least 30%.
The unravelling assessment used in this report assumes that the rock mass will fail with vertical walls until the void chokes itself or reaches surface. This is a conservative assumption and generally a rare case. More common is the formation of a draw cone (typical of very broken up ground or overburden) or of a failure dome (typical of hard rock). In the case of a draw cone, there is a substantial increase in the volume of ground mobilized and available to bulk and choke the void. In the case of the failure dome, the horizontal stresses provide sufficient confinement to the rock mass and the void stabilizes itself before reaching surface.
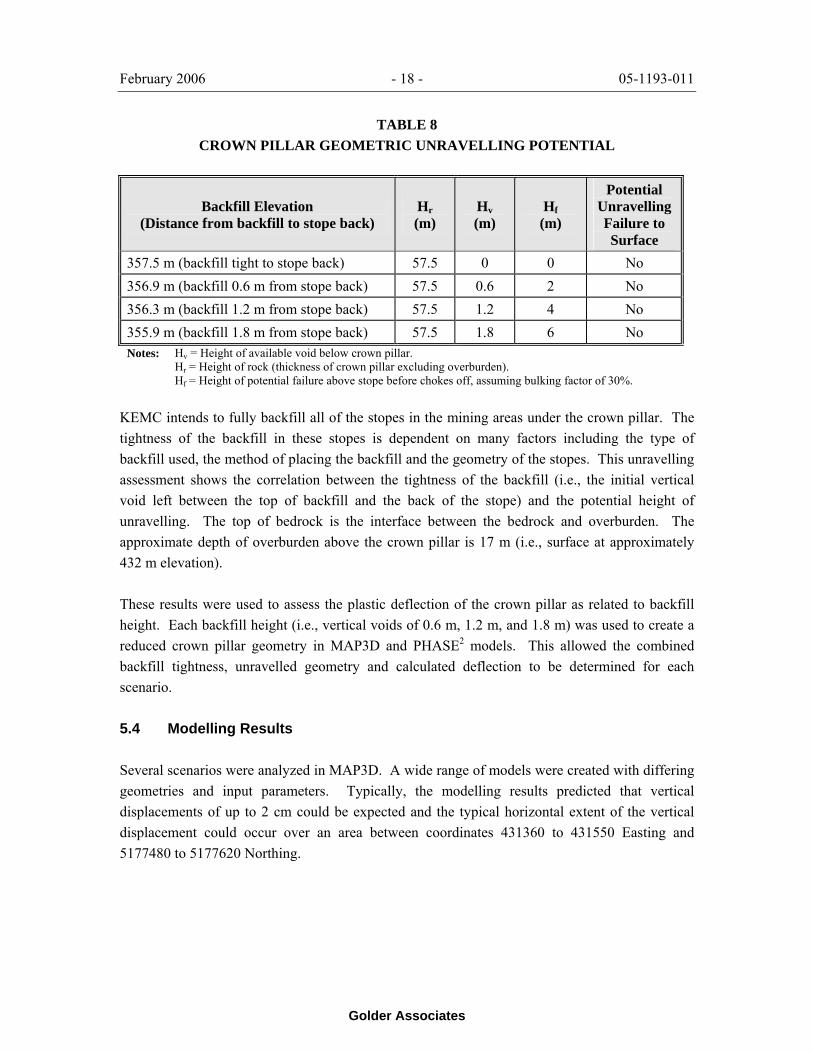
The results of the unravelling assessment for the Eagle Project are presented in Table 8. Bedrock surface and the original stope back are considered to be at the 415 m and 357.5 m elevations, respectively. The assessment has been completed for various backfill levels.
February 2006 - 18 - 05-1193-011
Golder Associates
TABLE 8 CROWN PILLAR GEOMETRIC UNRAVELLING POTENTIAL
Backfill Elevation (Distance from backfill to stope back)
Hr (m)
Hv (m)
Hf (m)
Potential Unravelling Failure to Surface
357.5 m (backfill tight to stope back) 57.5 0 0 No 356.9 m (backfill 0.6 m from stope back) 57.5 0.6 2 No 356.3 m (backfill 1.2 m from stope back) 57.5 1.2 4 No 355.9 m (backfill 1.8 m from stope back) 57.5 1.8 6 No Notes: Hv = Height of available void below crown pillar.
Hr = Height of rock (thickness of crown pillar excluding overburden). Hf = Height of potential failure above stope before chokes off, assuming bulking factor of 30%.
KEMC intends to fully backfill all of the stopes in the mining areas under the crown pillar. The tightness of the backfill in these stopes is dependent on many factors including the type of backfill used, the method of placing the backfill and the geometry of the stopes. This unravelling assessment shows the correlation between the tightness of the backfill (i.e., the initial vertical void left between the top of backfill and the back of the stope) and the potential height of unravelling. The top of bedrock is the interface between the bedrock and overburden. The approximate depth of overburden above the crown pillar is 17 m (i.e., surface at approximately 432 m elevation).
These results were used to assess the plastic deflection of the crown pillar as related to backfill height. Each backfill height (i.e., vertical voids of 0.6 m, 1.2 m, and 1.8 m) was used to create a reduced crown pillar geometry in MAP3D and PHASE2 models. This allowed the combined backfill tightness, unravelled geometry and calculated deflection to be determined for each scenario.
5.4 Modelling Results
Several scenarios were analyzed in MAP3D. A wide range of models were created with differing geometries and input parameters. Typically, the modelling results predicted that vertical displacements of up to 2 cm could be expected and the typical horizontal extent of the vertical displacement could occur over an area between coordinates 431360 to 431550 Easting and 5177480 to 5177620 Northing.
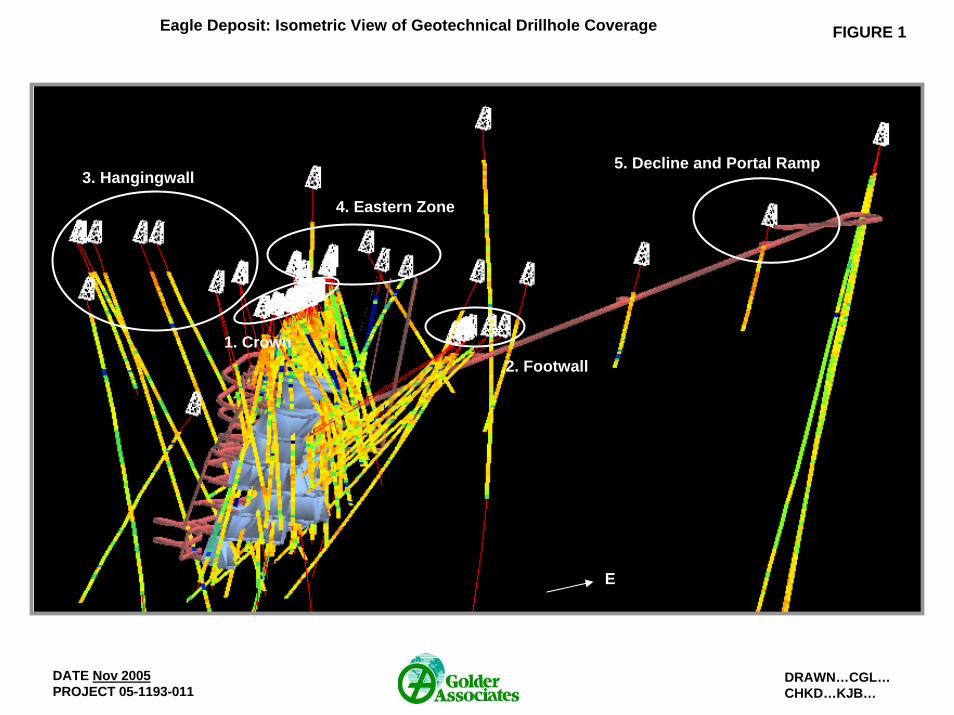
FIGURE 1
DATE Nov 2005PROJECT 05-1193-011
DRAWN…CGL…CHKD…KJB…
Eagle Deposit: Isometric View of Geotechnical Drillhole Coverage
E
3. Hangingwall
1. Crown
4. Eastern Zone
2. Footwall
5. Decline and Portal Ramp
FIGU
RE ___ DATE: NOVEMBER 2005
PROJECT: 05-1193-011DRAWN…...CHKD……
CGLKJB
4314
25
RQD4314
50
4314
25
4314
50
5177525
5177550
5177525
5177550
Crown Pillar Footprint
Crown Pillar Footprint “Fault”
“Fault” N
N
RMR
4314
00
N
Crown Pillar Footprint
Bedrock
Contoured Plane
Decline
Plan: RQD and RMR Contouring for 405 Elev.
2
FIGU
RE ___ DATE: NOVEMBER 2005
PROJECT: 05-1193-011DRAWN…...CHKD……
CGLKJB
Plan: RQD and RMR Contouring for 383 Elev.
3
5177410
5177430
RMR
“Fault”
4314
25
4314
50
5177525
5177550
4314
25
4314
505177525
5177550
“Fault”
Stope Boundary
Stope Boundary
RQD
4314
20
4314
00
N
N
Contoured Plane
Bedrock
Crown Pillar Footprint
Bedrock
Decline
N

FIGU
RE ___ DATE: NOVEMBER 2005
PROJECT: 05-1193-011DRAWN…...CHKD……
CGLKJB
Plan: RQD and RMR Contouring for 353 Elev.
4
5177410
5177430
RMR
“Fault”
4314
25
4314
50
5177525
5177550
4314
25
4314
505177525
5177550
“Fault”
Stope Boundary
RQD
4314
20
4314
00
N
N
Level 1
Stope Boundary
Level 1
Contoured Plane
Bedrock
Crown Pillar Footprint
Decline
N
FIGU
RE ___ DATE: NOVEMBER 2005
PROJECT: 05-1193-011DRAWN…...CHKD……
CGLKJB
Plan: RQD and RMR Contouring for 323 Elev.
5
5177410
5177430
RMR
“Fault”
4314
25
4314
50
5177550
5177575
4314
25
4314
50
5177550
5177575
“Fault”
Stope Boundary
Stope Boundary
RQD
4314
20
4314
00
N
N
Contoured Plane
Bedrock
Decline
N

FIGU
RE ___ DATE: NOVEMBER 2005
PROJECT: 05-1193-011DRAWN…...CHKD……
CGLKJB
5177430
5177410
RMR
Contoured Plane
Bedrock
4314
20
4314
00
“Fault”
4314
25
4314
50
5177575
5177550
4314
25
4314
50
5177575
5177550
“Fault”
Stope Boundary
Stope Boundary
RQD
Decline
N
N
N
Plan: RQD and RMR Contouring for 293 Elev.
6
FIGU
RE ___ DATE: NOVEMBER 2005
PROJECT: 05-1193-011DRAWN…...CHKD……
CGLKJB
RMR
Plan: RQD and RMR Contouring for 263 Elev.
7
5177410
5177430
4314
00
“Fault”
4314
25
4314
50
5177525
5177550
4314
75
4315
00
5177525
5177550
“Fault”
Stope Boundary
Stope Boundary
RQD
N
N
Raises/Borehole
Raises/Borehole
Contoured Plane
Bedrock
Decline
N
FIGU
RE ___ DATE: NOVEMBER 2005
PROJECT: 05-1193-011DRAWN…...CHKD……
CGLKJB
5177525
RMR
5177430
Contoured Plane
Bedrock
4314
00
“Fault”
4314
75
4315
00
5177525
5177550
4314
75
4315
00
5177525
5177550
“Fault”
Stope Boundary
Stope Boundary
RQD
Decline
N
N
N
Plan: RQD and RMR Contouring for 233 Elev.
8
FIGU
RE ___ DATE: NOVEMBER 2005
PROJECT: 05-1193-011DRAWN…...CHKD……
CGLKJB
Plan: RQD and RMR Contouring for 203 Elev.
9
5177525
RMR
“Fault”
4314
00
4314
25
5177550
5177525
5177550
“Fault”
Stope Boundary
Stope Boundary
RQD
N
N
4314
00
4314
25
4314
00
Contoured Plane
Bedrock
Decline
N
FIGU
RE ___ DATE: NOVEMBER 2005
PROJECT: 05-1193-011DRAWN…...CHKD……
CGLKJB
Plan: RQD and RMR Contouring for 188 Elev.
10
5177525
RMR
“Fault”
4314
00
4314
25
5177550
4314
00
4314
25
5177525
5177550
“Fault”
Stope Boundary
Stope Boundary
RQD43
1400
N
N
Contoured Plane
Bedrock
Decline
N
FIGU
RE ___ DATE: NOVEMBER 2005
PROJECT: 05-1193-011DRAWN…...CHKD……
CGLKJB
Plan: RQD and RMR Contouring for 173 Elev.
11
5177550
RMR
“Fault”
4314
00
4314
25
5177575
4314
00
4314
25
5177525
5177550
“Fault”
Stope Boundary
Stope Boundary
RQD43
1400
N
N
Contoured Plane
Bedrock
Decline
N
FIGU
RE ___ DATE: NOVEMBER 2005
PROJECT: 05-1193-011DRAWN…...CHKD……
CGLKJB
RQD
Intrusive Envelope
400 Elv.
200 Elv.
150 Elv.
5177
700
Raise
5177
725
Intrusive Envelope
Decline
RMR
Level Development
400 Elv.
200 Elv.
150 Elv.
5177
700
5177
725
Raise
Stope Boundary
Bedrock
Level Development
N
Stope Boundary
N
Contoured Plane
Bedrock
Decline
N
Intrusive Envelope
Stope Boundary
Traverse Section: RQD and RMR Contouring for 431420E Facing East
12
FIGU
RE ___ DATE: NOVEMBER 2005
PROJECT: 05-1193-011DRAWN…...CHKD……
CGLKJB
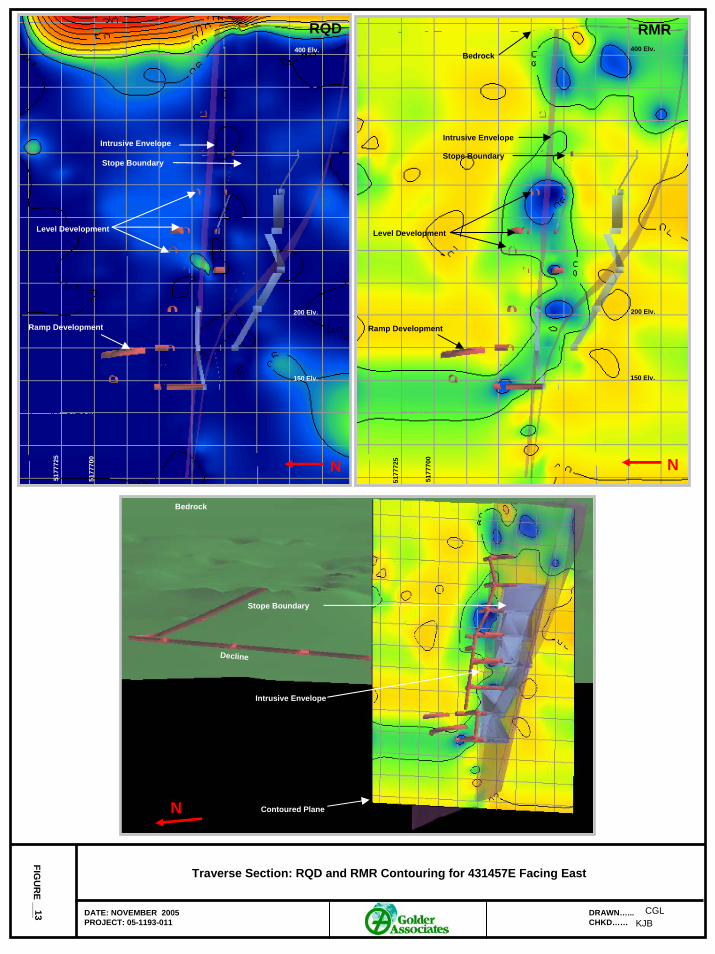
RQD
Intrusive Envelope
400 Elv.
200 Elv.
150 Elv.
5177
700
Ramp Development
5177
725
Intrusive Envelope
Decline
RMR
Level Development
400 Elv.
200 Elv.
150 Elv.
5177
700
5177
725
Ramp Development
Stope Boundary
Bedrock
Level Development
N
Stope Boundary
N
Contoured Plane
Bedrock
Decline
N
Intrusive Envelope
Stope Boundary
Traverse Section: RQD and RMR Contouring for 431457E Facing East
13
FIGU
RE ___ DATE: NOVEMBER 2005
PROJECT: 05-1193-011DRAWN…...CHKD……
CGLKJB
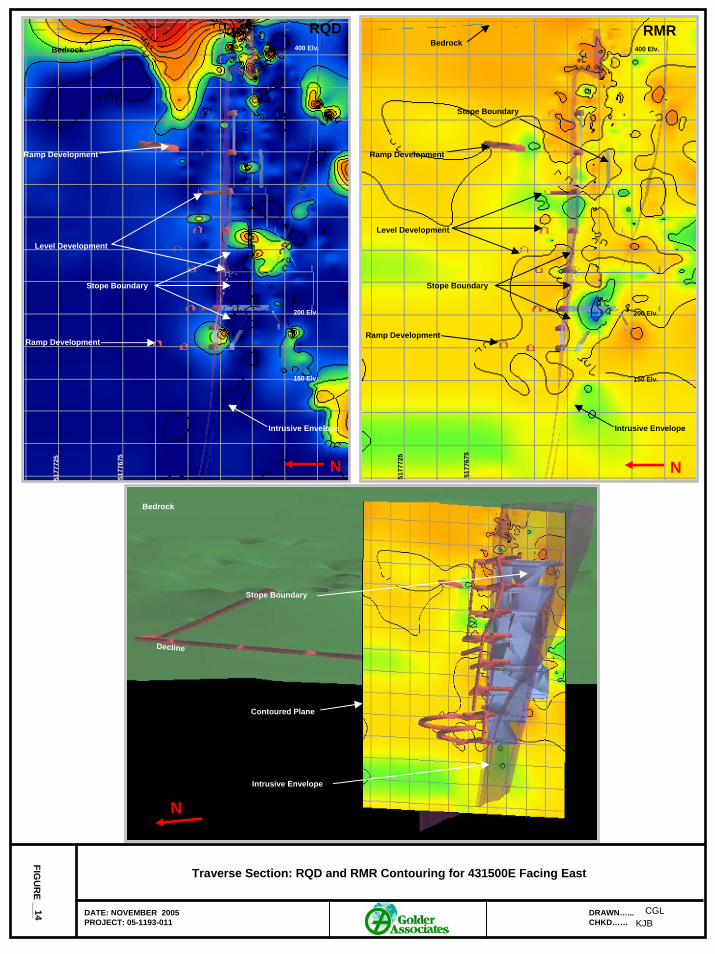
RQD
Intrusive Envelope
400 Elv.
200 Elv.
150 Elv.
5177
675
Ramp Development
5177
725
Intrusive Envelope
Stope Boundary
Level Development
N
Contoured Plane
Bedrock
Decline
N
Stope Boundary
Ramp Development
400 Elv.
200 Elv.
150 Elv.
Ramp Development
5177
725
Stope Boundary
Level Development
N
BedrockRMR
Intrusive Envelope
5177
675
Stope Boundary
Ramp Development
Bedrock
Traverse Section: RQD and RMR Contouring for 431500E Facing East
14
FIGU
RE ___ DATE: NOVEMBER 2005
PROJECT: 05-1193-011DRAWN…...CHKD……
CGLKJB
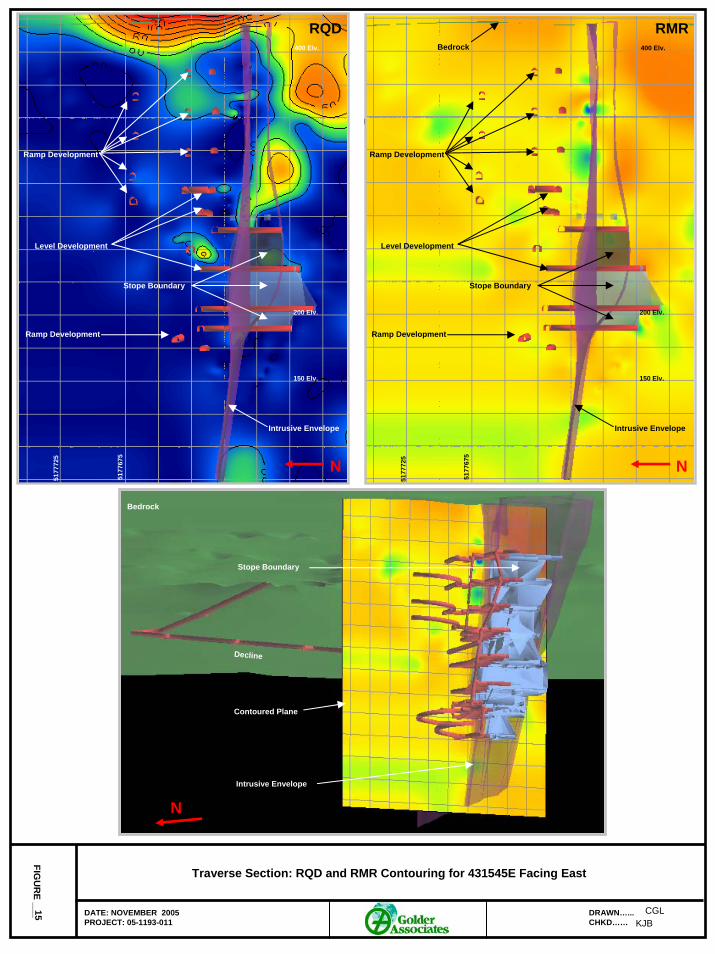
RQD
Intrusive Envelope
400 Elv.
200 Elv.
150 Elv.
5177
675
Ramp Development
5177
725
Intrusive Envelope
RMR
Stope Boundary
Level Development
N
Contoured Plane
Bedrock
Decline
N
Stope Boundary
Ramp Development
Intrusive Envelope
400 Elv.
200 Elv.
150 Elv.
5177
700
Ramp Development
5177
725
Stope Boundary
Level Development
N
Ramp Development
BedrockRMR
Intrusive Envelope
400 Elv.
200 Elv.
150 Elv.
5177
675
Ramp Development
Stope Boundary
Level Development
N
Ramp Development
5177
725
Bedrock
Traverse Section: RQD and RMR Contouring for 431545E Facing East
15
FIGU
RE ___ DATE: NOVEMBER 2005
PROJECT: 05-1193-011DRAWN…...CHKD……
CGLKJB
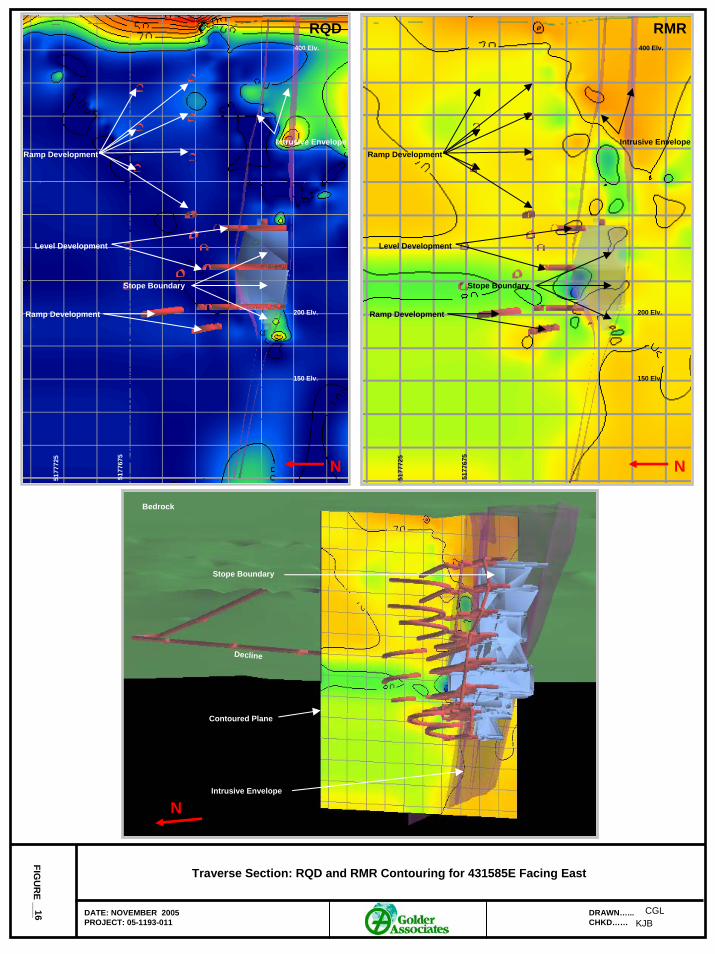
RQD
Intrusive Envelope
400 Elv.
200 Elv.
150 Elv.
5177
675
Ramp Development
5177
725
Intrusive Envelope
Stope Boundary
Level Development
N
Contoured Plane
Bedrock
Decline
N
Stope Boundary
Ramp Development
RMR
Intrusive Envelope
400 Elv.
200 Elv.
150 Elv.
5177
675
Ramp Development
5177
725
Stope Boundary
Level Development
N
Ramp Development
Traverse Section: RQD and RMR Contouring for 431585E Facing East
16
FIGU
RE ___ DATE: NOVEMBER 2005
PROJECT: 05-1193-011DRAWN…...CHKD……
CGLKJB
RQD
W
RMR
W
400 Elv.
200 Elv.
150 Elv.
4316
25
4316
50
Intrusive Envelope
Bedrock 400 Elv.
200 Elv.
150 Elv.
4316
25
4316
50
Intrusive Envelope
Bedrock
Intrusive Envelope
Contoured Plane
Bedrock
Decline
N
Stope Boundary
Longitudinal Section: RQD and RMR Contouring for 5177500N Facing North
17
FIGU
RE ___ DATE: NOVEMBER 2005
PROJECT: 05-1193-011DRAWN…...CHKD……
CGLKJB
RQD
W
RMR
W
400 Elv.
200 Elv.
150 Elv.
4316
25
4316
50
Intrusive Envelope
Bedrock
400 Elv.
200 Elv.
150 Elv.
4316
25
4316
50
Bedrock
Stope Boundary
“Fault”
Intrusive Envelope
Stope Boundary
“Fault”
Intrusive Envelope
Contoured Plane
Bedrock
Decline
N
Stope Boundary
Longitudinal Section: RQD and RMR Contouring for 5177560N Facing North
18
FIGU
RE ___ DATE: NOVEMBER 2005
PROJECT: 05-1193-011DRAWN…...CHKD……
CGLKJB
RQD
Longitudinal Section: RQD and RMR Contouring for 5177620N Facing North
19
Intrusive Envelope
W
Contoured Plane
Bedrock
Decline
N
Stope Boundary
W
RMR400 Elv.
200 Elv.
150 Elv.
4316
25
4316
50
Ramp Development
Bedrock
Stope Boundary
“Fault”
Intrusive Envelope
4316
25
4316
50
Ramp Development
Bedrock
400 Elv.
200 Elv.
150 Elv.Stope Boundary
“Fault”
Intrusive Envelope
FIGU
RE ___ DATE: NOVEMBER 2005
PROJECT: 05-1193-011DRAWN…...CHKD……
CGLKJB
4314
00
4314
25
4314
50
5177525
5177550
Crown Pillar Footprint“Fault”
4314
25N
Major Lithologies Identified in Crown Pillar Area
Crown Pillar FootprintBedrock
5177525
5177550
Contoured Plane
Decline
Major Structure Identified in Crown Pillar Area
ISOMETRIC VIEW OF DRILLING INSIDE CROWN PILLARS
20
FIGU
RE ___ DATE: NOVEMBER 2005
PROJECT: 05-1193-011DRAWN…...CHKD……
GBPP
4314
00
4314
25
REVIEW OF MAPPING DATA FELDSPATHIC PERIDOTITE (Regular and with Added Planes)
21
FIGU
RE ___ DATE: NOVEMBER 2005
PROJECT: 05-1193-011DRAWN…...CHKD……
GBPP
4314
00
4314
25
REVIEW OF MAPPING DATA PERIDOTITE (Regular and with Added Planes)
22
FIGU
RE ___ DATE: NOVEMBER 2005
PROJECT: 05-1193-011DRAWN…...CHKD……
GBPP
4314
00
4314
25
REVIEW OF MAPPING DATA HORNFELS (Regular and with Added Planes)
23
FIGU
RE ___ DATE: NOVEMBER 2005
PROJECT: 05-1193-011DRAWN…...CHKD……
GBPP
4314
00
4314
25
REVIEW OF MAPPING DATA SEMI MASSIVE SULPHIDES (Regular and with Added Planes)
24
FIGU
RE ___ DATE: NOVEMBER 2005
PROJECT: 05-1193-011DRAWN…...CHKD……
GBPP
4314
00
4314
25
REVIEW OF MAPPING DATA SANDSTONE & SILTSTONE (Regular and with Added Planes)
25