C:UsersNorma.AckersonDesktopCoon 2012Changing …ageconsearch.umn.edu/bitstream/120258/2/AAE...
21
AAE12001 February 2012 Changing Land Ownership Patterns In the Northern Great Plains Nancy M. Hodur, Dean A. Bangsund, Randal C. Coon, and F. Larry Leistritz Department of Agribusiness and Applied Economics North Dakota State University Fargo, North Dakota 58108
-
Upload
hoangthuan -
Category
Documents
-
view
214 -
download
0
Transcript of C:UsersNorma.AckersonDesktopCoon 2012Changing …ageconsearch.umn.edu/bitstream/120258/2/AAE...

AAE12001 February 2012
Changing Land Ownership Patterns Inthe Northern Great Plains
Nancy M. Hodur, Dean A. Bangsund, Randal C. Coon, and F. Larry Leistritz
Department of Agribusiness and Applied EconomicsNorth Dakota State University
Fargo, North Dakota 58108

Abstract
Production agriculture in the 4-state area of southwestern North Dakota, southeasternMontana, northeastern Wyoming and northwestern South Dakota has faced serious economicchallenges. In the mid-1990's, a growing number of recreational land buyers purchased land forwildlife habitat and hunting, rather than for farm derived income. A survey of the area was doneto determine land ownership characteristics, information about land that was rented and leasedout, and attitudes toward key issues facing landowners and farm and ranch operators. Theaverage landowner owned 3,089.4 acres comprised mainly of pastureland/rangeland (2,242.6acres) and cropland (473.3 acres). Ownership of farmland was primarily from purchases (70.6percent) and inheritance (26.1 percent). The most popular types of ownership were soleproprietorships (52.1 percent) and family partnerships (31.7 percent). Pastureland/rangelandrented in larger tracts, with 46.8 percent over 640 acres. These contracts were most common inone-year lengths, but the lease tenure was more than 10 years for two-thirds of the respondents.Cropland was generally rented in smaller acreages, and the most common lease length was the 2-3 year category. Rented cropland had the highest rate (66.7 percent) of absentee landowners.Renters strongly agree that absentee landowners are inclined to develop long-term relationshipswith tenants, and developing these relationships is critical to securing long-term agreements.Absentee landowners indicated that having a good relationship with their tenant (84.6 percent)was very important, as were the tenant conservation practices (61.3 percent) and tenant land-useintentions (51.1 percent).
Key Words: Land ownership patterns, lease/rental agreements, absentee ownership, productionagriculture
Please address your inquiries regarding this publication to: Department of Agribusiness& Applied Economics, P.O. Box 6050, Fargo, ND, 58108-6050, Phone: 701-231-7441, Fax:701-231-7400, Email: [email protected]. This publication is also availableelectronically at this web site: http://agecon.lib.umn.edu/.
NDSU is an equal opportunity institution.
Copyright © 2012 by Dean A. Bangsund, Nancy M. Hodur, Randy Coon and F. LarryLeistritz. All rights reserved. Readers may make verbatim copies of this document for non-commercial purposes by any means, provided this copyright notice appears on all such copies.
Changing Land Ownership Patterns in the Northern Great Plains
Nancy M. Hodur, Dean A. Bangsund, Randal C. Coon, and F. Larry Leistritz*
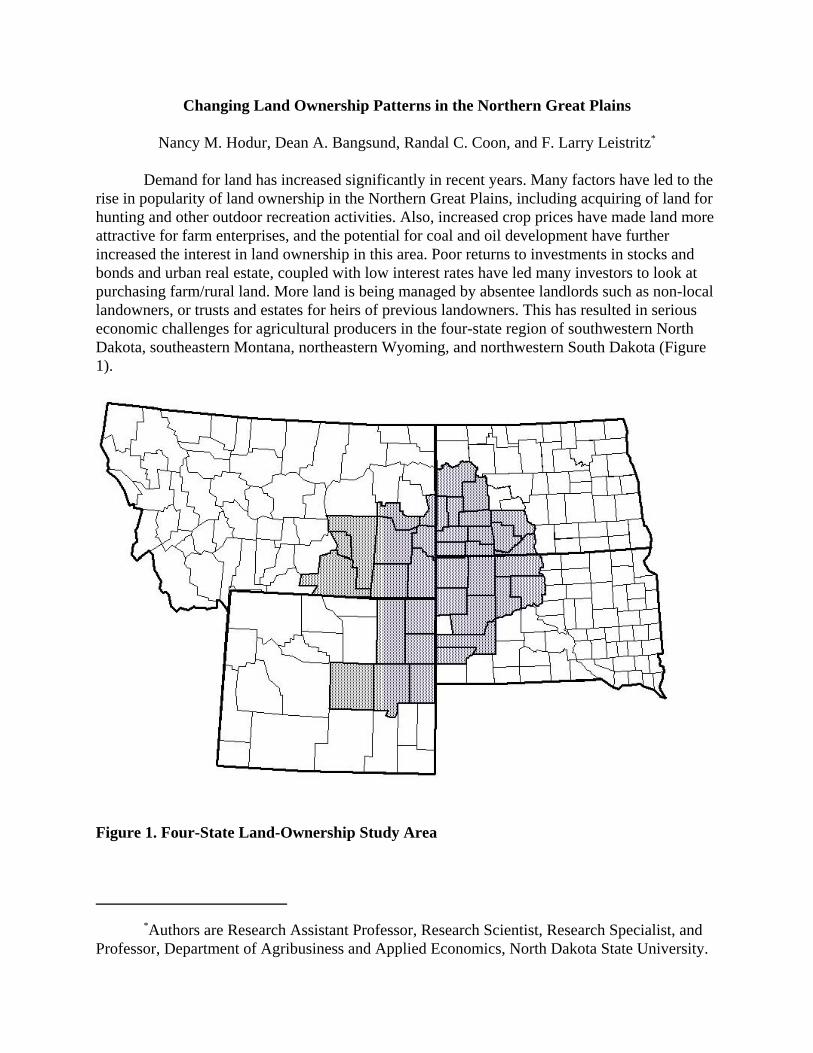
Demand for land has increased significantly in recent years. Many factors have led to therise in popularity of land ownership in the Northern Great Plains, including acquiring of land forhunting and other outdoor recreation activities. Also, increased crop prices have made land moreattractive for farm enterprises, and the potential for coal and oil development have furtherincreased the interest in land ownership in this area. Poor returns to investments in stocks andbonds and urban real estate, coupled with low interest rates have led many investors to look atpurchasing farm/rural land. More land is being managed by absentee landlords such as non-locallandowners, or trusts and estates for heirs of previous landowners. This has resulted in seriouseconomic challenges for agricultural producers in the four-state region of southwestern NorthDakota, southeastern Montana, northeastern Wyoming, and northwestern South Dakota (Figure1).
Figure 1. Four-State Land-Ownership Study Area
*Authors are Research Assistant Professor, Research Scientist, Research Specialist, andProfessor, Department of Agribusiness and Applied Economics, North Dakota State University.
This study was conducted in cooperation with the Hettinger Research and ExtensionCenter and sponsored by the 4-State Ruminant Animal Consortium. The goal of the Consortiumis to enhance economic development in the target region by strengthening and capturing valuefrom the ruminant livestock industry. Animal agriculture has been a key component of the four-state area economy, and a key area of research has been how to best allocate resources tomaximize income from livestock and crop sales combined. Average net cash income for the 36-county study area rose from $19,714 in 2002 to $47,779 in 2007 (USDA 2009). Increased netcash income provides the farmers with more money to purchase land, but the increasedprofitability also adds to the increased demand for land. All of these factors have created a largerpool of investors wanting to buy land, with many of those being non-locals. Sustainability andgrowth in production agriculture with this type of demand for land will require creative solutionsto bring together land owners and tenants. This study will address land ownership andmanagement for multi-county area in the four-state Northern Great Plains Region.
Methods
The study area was the 4-state Value Added Ruminant Animal Consortium 36-countyregion in southwest North Dakota, southeast Montana, northeast Wyoming, and northwest SouthDakota (Figure 1). This region has relatively similar climate, natural resources, agriculturalpotential, and socio-economic conditions. Approximately 50 percent of the land in the area isnative rangeland used for livestock grazing, with the remaining land used to produce annualcrops (Lauenroth, et al. 1994). For a complete discussion of each individual county included inthe study, see Nudell et al. (2007). These 37 counties cover 87,683 square miles, and had a 2000population of 393,056, which grew to 436,158 by 2010 (U.S. Bureau of the Census 2011).
A questionnaire was developed and administered to absentee landowners to gauge landmanagement objectives and strategies. A similar questionnaire was developed for locallandowners to identify and contrast similarities and differences between the two groups.Priorities and objectives for the two groups can provide insights into land management and landuse which may result in farm-level management changes.
Survey and Respondent Characteristics
A questionnaire was developed with the focus on identifying the factors that newproducers believe are most important in developing a relationship with an absentee landlord. Thegoal was to obtain 100 useable questionnaires. A mail-out method was selected foradministrating the survey. Two mailings with an additional postcard reminder were used for thisstudy because in recent surveys it has produced response rates of 30 to 50 percent (Hodur et al.2000 a, b, c). The sample of landowners was developed from information received from the Farm Service Agency. A total of 750 questionnaires were mailed out with 128 usablequestionnaires returned.
A few basic demographic characteristics provide a description of the landowners thatparticipated in this study. Respondent’s mean age was 60.6 years old. Respondents ranged in agefrom 26 to 96 years old, with only 7.1 percent under age 40, and 58.7 percent being 60 years ofage or older. With over half of the respondents at or near retirement age, it appears that few young people are starting farming or ranching, or if they are they may not have the resources to
2

purchase land. Only 8.5 percent of the respondents had incomes below $25,000, while 19.5percent had incomes exceeding $150,000 (Table 1).
Table 1. Personal Income for the Four-State Land Ownership Survey Respondents, byIncome Category, 2010
IncomeNumber of
RespondentsPercent of
Respondents
less than $25,000$25,001 - $50,000$50,001 - $75,000$75,001 - $100,000$100,001 - $125,000$125,001 - $150,000more than $150,000
1021262210623
8.517.822.018.6 8.55.119.5
Total Respondents 118 100.0
No response 10
TOTAL 128
Generally, survey respondents were a group of older landowners that were doing wellfinancially, with 51.7 percent having incomes over $75,000. Full or part-time farming and/orranching provided employment for 60.7 percent of the respondents (Table 2). Professionalworkers made up 19.7 percent of the survey respondents, and business owners/self-employedworkers accounted for 8.5 percent. Only 8.2 percent of full-time farmers and/or ranchers hadspouses who worked off-farm, and even less (6.6 percent) of the part-time farmers and/orranchers had spouses who worked off-farm.
3
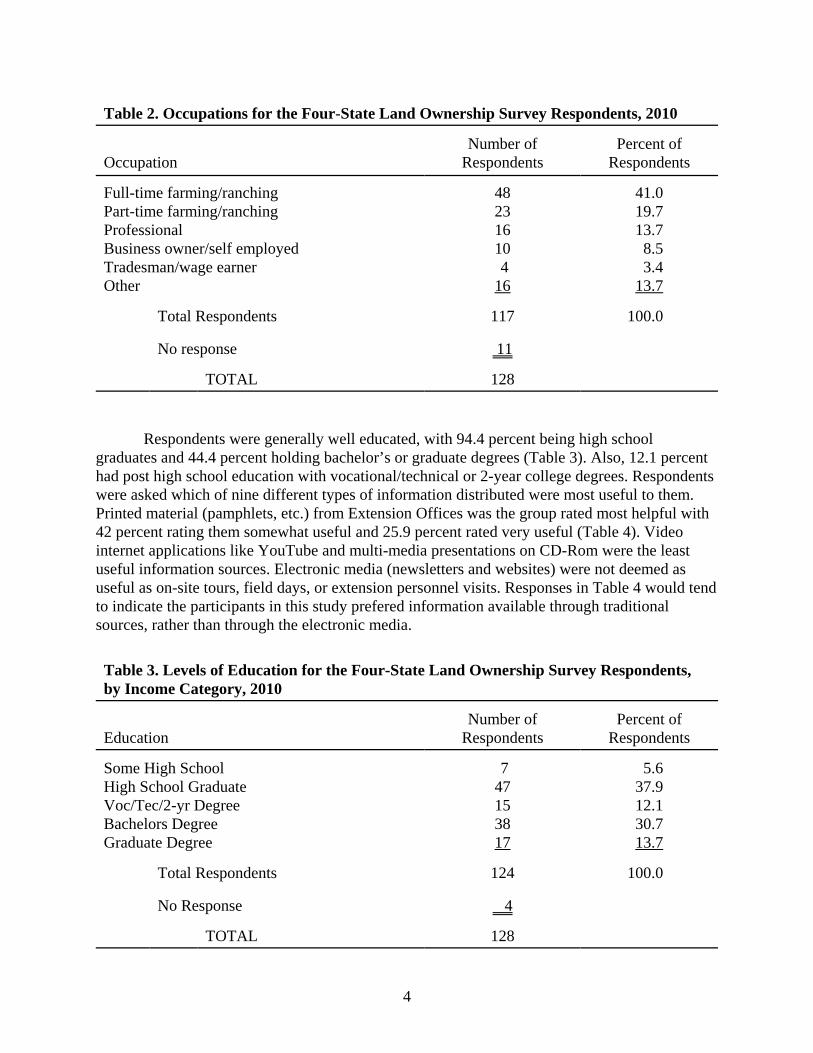
Table 2. Occupations for the Four-State Land Ownership Survey Respondents, 2010
OccupationNumber of
RespondentsPercent of
Respondents
Full-time farming/ranchingPart-time farming/ranchingProfessionalBusiness owner/self employedTradesman/wage earnerOther
48231610 416
41.019.713.7 8.5 3.413.7
Total Respondents 117 100.0
No response 11
TOTAL 128
Respondents were generally well educated, with 94.4 percent being high schoolgraduates and 44.4 percent holding bachelor’s or graduate degrees (Table 3). Also, 12.1 percenthad post high school education with vocational/technical or 2-year college degrees. Respondentswere asked which of nine different types of information distributed were most useful to them.Printed material (pamphlets, etc.) from Extension Offices was the group rated most helpful with42 percent rating them somewhat useful and 25.9 percent rated very useful (Table 4). Videointernet applications like YouTube and multi-media presentations on CD-Rom were the leastuseful information sources. Electronic media (newsletters and websites) were not deemed asuseful as on-site tours, field days, or extension personnel visits. Responses in Table 4 would tendto indicate the participants in this study prefered information available through traditionalsources, rather than through the electronic media.
Table 3. Levels of Education for the Four-State Land Ownership Survey Respondents,by Income Category, 2010
EducationNumber of
RespondentsPercent of
Respondents
Some High SchoolHigh School GraduateVoc/Tec/2-yr DegreeBachelors DegreeGraduate Degree
747153817
5.637.912.130.713.7
Total Respondents 124 100.0
No Response 4
TOTAL 128
4

Table 4. Respondents Perception As to the Value of Information Sources RegardingLand Management, Wildlife Production, and Conservation Practices, Four-State LandOwnership Survey, 2010
Value of Information Source
notuseful
somewhatunuseful
neutral somewhatuseful
veryuseful
Total
Information Source ------------------------------------percent------------------------------------
Pamphlet from Extension OfficeVideo internet/YouTubeMulti-media on CD-RomElectronic newsletterExtension websiteOn-site demonstration/toursFull-day conference/field daysHalf-day conference/field daysOn-site extension personnel visits
9.837.731.825.721.517.122.719.618.3
9.818.919.6
6.47.5
15.213.212.212.5
12.525.529.927.529.918.131.122.431.7
42.012.315.930.330.839.128.334.626.9
25.95.62.8
10.110.310.5
4.711.210.6
100.0100.0100.0100.0100.0100.0100.0100.0100.0
Results
Land in the study was divided into several land-use categories. Survey respondents wereasked the number of acres owned in each of these categories with the pastureland/rangelandcategory having the greatest number of acres owned (Table 5). Mean acreage forpastureland/rangeland was 2,242.6 acres, followed by 473.2 acres for the cropland category.These categories were followed by 201.9 acres for the cutgrass/hay/alfalfa category, with rathersmall acreage in the remaining land-use groups. Mean total acreage owned was 3,089.4 acres forthe survey respondents. Of the total mean acreage owned, 2,444.5 acres (79.1 percent) were inthe land-use categories associated with livestock feed production. Total acreage ownershipranged from 13 acres to 45,000 acres for this group. Table 5 presents the distribution ofownership of land by acreage classes for each land-use category. For all landowners, 27.5percent owned no cropland, 24.2 percent owned up to 160 acres, 27.5 percent owned between160 and 640 acres, and 20.8 percent owned more than a 640 acres.
Pastureland/rangeland ownership was distributed with 22.5 percent owning none, butfairly evenly distributed with acreage up to 160 acres (17.5 percent), 160 to 640 acres (14.2percent), a 640 to 2,000 acres (25.0 percent) and more than 2,000 acres (20.8 percent). Over 48percent of landowners had no cutgrass/hay/alfalfa with most of the remaining land owned insmaller tracts less than 160 acres (22.5 percent) and between 160 and 640 acres (19.2 percent).High percentages of the land owners had no land for housing development (98.3 percent), landwith a second home (96.7 percent), or miscellaneous land uses (93.2 percent). For all landownersresponding to the survey, 34.4 percent owned more than 2,000 acres, and 32.0 percent ownedbetween 641 to 2,000 acres.
5

Table 5. Land Owned and Distribution of Acreage, for Survey Respondents, Four-StateLand Ownership Study, 2010
Distribution of Acreage
Land-UseMeanAcres None
Up to 160Acres
161 to640 Acres
641 to2,000Acres
MoreThan2,000Acres Total
---------------------------------percent-------------------------------------
Cropland
CRP
Pastureland/Rangeland
Cutgrass/Hay/Alfalfa
Wooded draws/Wetland
HousingDevelopment
Land with secondhome
Other
473.3
41.3
2,242.6
201.9
78.9
0.3
1.6
57.3
27.5
84.0
22.5
48.3
71.4
98.3
96.7
93.2
24.2
7.6
17.5
22.5
20.2
1.7
2.5
3.4
27.5
7.6
14.2
19.2
5.1
- -
0.8
1.8
16.7
0.8
25.0
9.2
2.5
- -
- -
0.8
4.1
- -
20.8
0.8
0.8
- -
- -
0.8
100.0
100.0
100.0
100.0
100.0
100.0
100.0
100.0
TOTAL ACRES 3,089.4 - - 14.7 18.9 32.0 34.4 100.0
Total Respondents = 120
The most recent year landowners acquired land in the study area has predominately beensince 2000 (Table 6). Over 40 percent of the people buying land in the region for agriculturepurposes had done so since 2000, whereas, those who had purchased agricultural land before1970 represented 12.8 percent or less of all respondents. Most of the land owned by the surveyrespondents was purchased (70.6 percent), followed by inherited (26.1 percent), gift (2.2percent), and other (1.1 percent) (Table 7). For landowners in the study, 57.9 percent purchasedall the land they own, 21.4 percent purchased some, and 20.7 percent purchased none. For thepeople who inherited land, 18.2 percent received all their land by this means, 19.0 percentreceived some, and 62.8 percent none. Purchased and inherited land accounted for 96.7 percentof the land in the study area was acquired. Most of the land was held in sole proprietorship (32.1percent) or family partnership (31.7 percent) (Table 8). Of the landowners that had some land ina sole proprietorship, 47.2 percent had all of it in that type of business structure, 11.3 percent hadsome, and 41.5 percent had none. Owners with family partnerships had 28.5 percent of the landin that type of arrangement only, 7.3 percent had some, and 64.2 percent had none.
6

Table 6. Year Land in the Study was Most Recently Acquired, by Land-Use Category,For Survey Respondents, Four-State Land Ownership Study, 2010
Year Land was Acquired
Land-UseBefore1970
1970-1979
1980-1989
1990-1999
2000 andlater Total
-------------------------------------percent----------------------------------
Cropland 11.4 11.4 13.9 21.5 41.8 100.0
CRP 10.0 5.0 25.0 20.0 40.0 100.0
Pastureland/rangeland 9.5 7.2 21.4 21.4 40.5 100.0
Cut grass/hay/alfalfa 12.8 10.6 10.6 25.5 40.5 100.0
Wooded draws/wetland 18.5 - - 18.5 25.9 37.1 100.0
Land for Development 50.0 - - - - - - 50.0 100.0
Second Home 66.7 - - - - - - 33.3 100.0
Other 33.3 - - - - 33.3 33.3 100.0
Total Respondents = 108
Table 7. Method By Which Land Owned in the Study Area was Acquired andAcquisition Distribution for Survey Respondents, Four-State Land Ownership Survey,2010
Acquisition Distribution
Land Aquired Mean 0% 1-99% 100% Total
---------------------percent of acres---------------------
Purchase 70.6 20.7 21.4 57.9 100.0
Inherit 26.1 62.8 19.0 18.2 100.0
Gift 2.2 95.0 3.3 1.7 100.0
Other 1.1 97.5 1.7 0.8 100.0
100.0
Total Respondents = 121
7

Table 8. Business Organization and Arrangement Distribution for Survey RespondentsOwning or Managing Land in the Study Area, Four-State Land Ownership Survey, 2010
Arrangement Distribution
Business Organization Mean 0% 1-99% 100% Total
------------------------percent---------------------------
Sole Ownership 32.1 41.5 11.3 47.2 100.0
Partnership with Family 31.7 64.2 7.3 28.5 100.0
Trust with Family 7.4 91.1 2.4 6.5 100.0
Partnership with Non-family - - - - - - - - 100.0
LLC, LLP, etc. 4.9 94.3 1.7 4.0 100.0
Other 3.9 94.3 4.1 1.6 100.0
100.0
Total Respondents = 123
Renter Results
Survey respondents also rented land in the study area. Nearly half (42.1 percent) rentedland with a slightly larger number (57.9 percent) not renting land in the study region. The rangeof rented acres varied from 0 to 3,306 for cropland, 0 to 1,280 for CRP, 0 to 30,000 forpastureland/rangeland, and 0 to 1,000 for cutgrass/hay/alfalfa (Table 9). For people who rentedland, cropland was equally distributed (14.9 percent) between up to 160 acres, between 160 and640 acres, and more than 640 acres, with 55.3 percent renting none. Pastureland/rangeland wasrented in larger tracts with 46.8 percent of land owners renting more than 640 acres of this typeof land, followed by 19.1 percent renting between 160 and 640 acres, and 12.8 percent renting upto 160 acres. Over 21 percent of this group rented no pastureland/rangeland. Nearly 75 percentof land renters leased no acres of cutgrass/hay/alfalfa, and those who did had smaller tracts with10.6 percent renting less than 160 acres, and 12.8 percent between 160 and 640 acres. Acres ofrented land for pastureland/rangeland was up to 30,000 acres in the study area.
The length of land leases in the study area varied by land-use category. Cropland leaseterms included 1 year (35.0 percent), 2-3 years (50.0 percent), and 4 or more years (30.0 percent(Table 10). Pastureland/rangeland leases for 1 year accounted for 44.1 percent of the total,followed by 4 or more years (35.3 percent) and 2-3 years (20.3 percent). Cutgrass/hay/alfalfaland leases had 53.9 percent being for 2-3 years, followed by 23.1 percent for one year, and 23.0percent for 4 or more years. Data were not sufficient to determine any pattern for rented land inthe other land-use categories.
8

Table 9. Land Rented by Survey Respondents, by Land-Use Category and Acreage,Four-State Land Ownership Survey, 2010
Acres Rented
Land-UseObservations
Range ofRentedAcres None
up to160 acres
160 to640
acres
Morethan 640
acres TOTAL
- - number- - - -acres - - ---------------------------percent-----------------------
Cropland 47 0-3,306 55.3 14.9 14.9 14.9 100.0
CRP 47 0-1,280 91.5 - - 6.4 2.1 100.0
Pastureland/rangeland 47 0-30,000 21.3 12.8 19.1 46.8 100.0
Cutgrass/Hay/Alfalfa 47 0-1,000 74.5 10.6 12.8 2.1 100.0
Wooded draws/Wetland 47 0-40 95.7 4.3 - - - - 100.0
Land with out-buildings 47 0-4 97.9 2.1 - - - - 100.0
Land withVacation/RecreationHousing
47 0 100.0 - - - - - - 100.0
Other 45 0-2,110 95.6 2.2 - - 2.2 100.0
Total 47 0-30,000
Table 10 presents data on how long the renter has had the lease agreement. Many of therenters have had long-term relationships with the land owners. For example, 52.6 percent ofcropland leases have been for 10 or more years and 36.9 percent have existed for 4-10 years.Cutgrass/hay/alfalfa land has been rented for similar periods; 52.9 percent of the leases are morethan 10 years in duration, 30.8 percent were 4-10 years, and 15.3 percent were 1-3 years.Pastureland/rangeland leases tended to be longer with 66.6 percent of them being more than 10years in length, followed by 27.8 percent for 4-10 years. Only 5.6 percent of this type of leasewas 1-3 years old. The long-term tenure of the rental leases for the agriculture and livestockproduction land would tend to indicate stable relationships between land owner and tenant.
9

Table 10. Current Lease Term and Langth of On-going Lease, by Land-Use Category,For Land Rented by Survey Respondents, Four-State Land Ownership Survey, 2010
Current Lease Term Total Years of Lease
Land-Use1
Year2-3
Years
4 orMoreYears Total
1-3 Years
4-10Years
MoreThan 10Years Total
--------------percent------------- --------------percent-------------
Cropland 35.0 50.0 30.0 100.0 10.5 36.9 52.6 100.0
CRP - - - - - - - - - - - - - - - -
Pastureland/Rangeland 44.1 20.3 35.3 100.0 5.6 27.8 66.6 100.0
Cutgrass/Hay/Alfalfa 23.1 53.9 23.0 100.0 15.3 30.8 53.9 100.0
Wooded draws/Wetland 33.3 - - 66.7 100.0 - - - - 100.0 100.0
Land withoutBuildings - - - - 100.0 100.0 - - - - 100.0 100.0
Land withVacation/RecreationHousing
- - - - - - - - - - - - - - - -
Other - - - - 100.0 100.0 - - - - 100.0 - -
Total Respondents = 51
According to the survey respondents, 38 percent rent land from an absentee landowner.Table 11 presents the portion of land rented from absentee landowners by land-use category.Two-thirds of the respondents who rented cropland indicated that land rented from absenteelandlords comprised 76 percent or more of their total rented acres. Over 58 percent of therespondents who rented pastureland/rangeland from absentee landowners, had it comprise 76percent or more of their rented acres for that land-use type. Survey respondents were givenseveral statements regarding absentee landowners and allowed to indicate how strongly theyagree or disagree with each one. Those results are presented in Table 12.
10

Table 11. Percentage of Total Acres Rented from an Absentee Landowner by Land-useCategory, Four-State Land Ownership Survey, 2010
Percentage of Total Acres Rented from Absentee Landowner
Land-Use Up to 25% 26-50% 51-75%Greater
than 75% Total
------------------------------------------percent-----------------------------------
Cropland 11.1 11.1 11.1 66.7 100.0
CRP - - - - - - - - - -
Pasttureland/Rangeland 16.7 16.7 8.3 58.3 100.0
Cutgrass/Hay/Alfalfa 66.7 - - - - 33.3 100.0
Wooded draws/Wetland 100.0 - - - - - - 100.0
Other - - - - - - - - - -
Total Respondents = 50
Salient observations from the respondents agreement to the statements in this table include:
• neutral on whether lease terms are shorter for absentee or local landowners
• absentee landowners want to develop long-term relationships
• do not feel that most land for rent in their local area is owned by absenteelandowners
• it is critical to develop long-term relationship with absentee landowners
• evenly divided on whether absentee landowners are more interested in maximizingreturns
11

12
Table 12. Respondents that Rented Land from Absentee Landowners Level of Agreement Regarding Statements ConcerningAbsentee Landowners, Four-State Land Ownership Survey, 2010
Level of Agreement
StatementStrongly
AgreeSomewhat
Agree NeutralSomewhatDisagree
StronglyDisagree Total
---------------------------------------percent------------------------------------------
Lease terms with absentee landowners are shorterthan with local landowners 5.3 - - 78.9 5.3 10.5 100.0
Absentee landowners prefer to develop long-termrelationship with tenants 55.0 20.0 20.0 5.0 - - 100.0
There is less certainty regarding long-termavailability of land for rent with absentee/non-local landowners 5.3 5.3 31.6 36.8 21.0 100.0
Most of the land for rent in my local area isowned by absentee/non-local landowners 5.2 10.5 42.1 21.1 21.1 100.0
Developing a long-term relationship withabsentee/non-local landowners is critical tosecuring long-term lease agreements 57.9 26.3 15.8 - - - - 100.0
Absentee/non-local landowners are moreinterested in maximizing returns than developinga long-term relationship with a tenant 10.5 31.6 - - 47.4 10.5 100.0
Total Respondents = 50

Landlord Results
Forty percent of the respondents to the survey indicated they leased out land. Croplandacres leased out by landowners ranged up to 2,000 acres, pastureland/rangeland up to 2,800acres, and cutgrass/hay/alfalfa up to 820 acres (Table 13). Also, wooded draws/wetlands had 683acres rented and the other category had 2,400 acres rented. For leased land the cropland categoryhad 27.5 percent renting up to 160 acres, 29.4 percent between 160 and 640 acres, and 15.6percent more than 640 acres. For respondents having land to rent, 27.5 percent had none in thiscategory. Pastureland/rangeland rentals were 17.6 percent up to 160 acres, 21.6 percent from 160to 640 acres, and 19.6 percent greater than 640 acres. Again, 41.2 percent of landowners havingland to rent had none in this category. Cutgrass/hay/alfalfa land rentals were 15.7 percent in theup to 160 acres category, 7.8 percent from 160 to 640 acres, and 2.0 percent more than 640 acres.The largest acreage of rangeland rented was greater than any other individuals land-use category.This would indicate that landowners had land in multiple land-use categories.
Table 13. Landowners Property Leased, by Land-Use Category and Acreage, Four-StateLand Ownership Survey, 2010
Acres Leased
Land-UseObservations
Range ofLeasedAcres None
up to160 acres
160 to640
acres
Morethan 640
acres TOTAL
- - number- - - -acres - - ---------------------------percent-----------------------
Cropland 51 0-2,000 27.5 27.5 29.4 15.6 100.0
CRP 51 0-332 88.2 9.8 2.0 - - 100.0
Pastureland/rangeland 51 0-2,800 41.2 17.6 21.6 19.6 100.0
Cutgrass/Hay/Alfalfa 51 0-820 74.5 15.7 7.8 2.0 100.0
Wooded draws/Wetland 51 0-683 94.1 3.9 - - 2.0 100.0
Other 51 0-2,400 98.0 - - - - 2.0 100.0
Total Acres 51 20-4,470
Table 14 presents the land leased locally by use category. If landlords leased croplandlocally, 64.6 percent rented all of it locally and 4.1 percent rented part of it locally.Pastureland/rangeland rented locally was 54.1 percent totally rented locally, and 2.1 percentpartially local. Cutgrass/hay/alfalfa rented locally was 20.8 percent all local and 2.1 percentpartially local. The cropland land-use category had the highest rate of locally rented land,followed by pastureland/rangeland. This could be explained by the fact that cattle could bemoved some distance for grazing.
13

Table 14. Percentage of Land Leased Locally by Land-Use Category, for Landowners inFour-State Land Ownership Survey, 2010
Amount of Land Leased Locally
Land-Use None Partial Totally Total
------------------------Percent-----------------------
Cropland 31.3 4.1 64.6 100.0
CRP 97.9 - - 2.1 100.0
Pastureland/Rangeland 43.8 2.1 54.1 100.0
Cutgrass/Hay/Alfalfa 77.1 2.1 20.8 100.0
Wooded draws/Wetlands 95.8 - - 4.2 100.0
Other 100.0 - - - - 100.0
Total Respondents = 51
Lease length for cropland rented locally was mostly for 1 year (48.5 percent), but longerleases like 2-3 years (27.3 percent) and 4 or more years (24.2 percent) were almost evenly split(Table 15). Pastureland/rangeland lease terms were 46.1 percent for 1 year, 23.1 percent for 2-3years, and 30.8 percent for 4 or more years. Leases for cutgrass/hay/alfalfa were 50.0 percent for4 or more years, 30.0 percent for 1 year, and 20.0 percent for 2-3 years. The total length of leasefor cropland was fairly evenly distributed between 1-3 years (32.3 percent), 4-10 years (38.7percent) and more than 10 years (29.0 percent). Pastureland/rangeland and cutgrass/hay/alfalfaland use categories were very similar with the majority being a 4-10 year tenure, followed by themore than 10 years, and 1-3 year tenure.
14

Table 15. Current Lease Term and Length of On-going Lease, by Land-Use Category,for Land Rented by Survey Respondents, Four-State Land Ownership Survey, 2010
Current Lease Term Total Years of Lease
Land-Use1
Year2-3
Years
4 orMoreYears Total
1-3 Years
4-10Years
MoreThan 10Years Total
--------------percent------------- --------------percent-------------
Cropland 48.5 27.3 24.2 100.0 32.3 38.7 29.0 100.0
CRP 50.0 - - 50.0 100.0 - - 75.0 25.0 - -
Pastureland/Rangeland 46.1 23.1 30.8 100.0 17.4 56.5 26.1 100.0
Cutgrass/Hay/Alfalfa 30.0 20.0 50.0 100.0 11.1 66.7 22.2 100.0
Wooded draws/Wetland - - 100.0 - - 100.0 100.0 - - - - 100.0
Other - - - - 100.0 100.0 - - 100.0 - - 100.0
Total Respondents = 51
Landowners who rented out land were provided a question allowing them to indicate howimportant certain criteria were to them when making leasing decisions. Results from thisquestion are summarized in Table 16. Forty-eight percent of respondents felt that receiving themaximum rent was either somewhat important or very important, while 30 percent were neutralon that topic. Having a good relationship with the tenant was very important to 84.6 percent ofthe survey respondents. Also, a long-term lease with the tenant was very important for 48.1percent, and somewhat important for 17.3 percent of respondents. A short-term lease to captureincreasing rental rates was not important for 33.3 percent, while 31.3 percent of the respondentswere neutral to this topic. Landowners were fairly evenly distributed on the subject of helpingyoung farmers get started with 20.8 percent indicating it was not important. A majority oflandowners indicated that both tenant land-use intentions and tenant conservation practices werevery important, 51.1 percent and 61.3 percent, respectively.
Key Issues
Five key issues facing farmers and ranchers were identified and respondents were askedto rate the relative importance of each. Results of this question are presented in Table 17.Highlights from this table include:
• Over thirty-two percent of respondents strongly agree that it is difficult to rent orpurchase land to make a viable farm enterprise, and 18.2 percent agree. However,41.3 percent were neutral on this topic.
15

• Over 36 percent of the survey respondents were neutral on whether land used forwildlife production and recreation reduced land for rent for agriculture production.But, 27.0 percent agreed and 18.8 percent strongly agreed that land for agricultureproduction had been effected.
• Respondents agreed (23.8 percent) and strongly agreed (40.1 percent) that wildlifeproduction and recreation have caused land prices to appreciate beyond the value foragriculture.
• Thirty-two percent of respondents agreed and 21.3 percent strongly agreed thatfarming and ranching operations more frequently were renting land than in the past.However, over 39 percent of the respondents were neutral on this topic.
• Over 25 percent of respondents agreed and 37.7 percent strongly agreed that it is toorisky to base a farm or ranch only on rented land with short-term leases. On thistopic, 27.9 percent were neutral.
•
Table 16. Relative Importance of Leasing Criteria for Landlords, Four-State LandOwnership Survey, 2010
Level of Importance
Leasing criterianot
importantsomewhat
unimportant neutralsomewhatimportant
veryimportant
Receive maximum rent 10.0 12.0 30.0 26.0 22.0
Good relationship with tenant 1.9 1.9 - - 11.6 84.6
Long-term lease with tenant 11.5 9.6 13.5 17.3 48.1
Short-term lease to captureincreasing rental rates 33.3 16.7 31.3 10.4 8.3
Help young farmer get started 20.8 12.5 25.0 16.7 25.0
Tenants land-use intentions 4.2 - - 14.9 29.8 51.1
Tenants conservation practices 2.0 2.0 14.3 20.4 61.3
Total Respondents = 50
16

Table 17. Respondents Level of Agreement with Land-Use Issues Facing Farmers andRanchers, Four-State Land Ownership Survey, 2010
Agreement with Issue
Issuestronglydisagree disagree neutral agree
stronglyagree
----------------------------percent-------------------------------
It is difficult to find land to rent orpurchase to make a viable farmenterprise 5.0 3.3 41.3 18.2 32.2
Land used for wildlife productionand recreation has reduced landfor rent for agriculture production 11.5 6.6 36.1 27.0 18.8
Land used for wildlife productionand recreation has caused landprices to appreciate beyond thevalue for agriculture 8.2 7.4 20.5 23.8 40.1
Farming and ranching operationsmore frequently use rented landthan in the past 1.6 5.8 39.3 32.0 21.3
It is too risky to base a farm orranch operation on rented landwith short-term leases 2.5 6.5 27.9 25.4 37.7
Total Respondents = 122
17

Conclusions
Alternate land uses currently competing for farmland with farmers and ranchers includewildlife and recreation and energy development. A four-state study area including southwestNorth Dakota, southeast Montana, northeast Wyoming and northwest South Dakota, wasselected for an analysis of land ownership. A survey of landowners in that area was conducted todetermine land ownership characteristics, information about rented and leased land, and attitudestoward key issues facing landowners and farm and ranch operators.
Survey respondents owned and average 3,089.4 acres, comprised primarily ofpastureland/rangeland (2,242.6 acres), followed by cropland (473.3 acres) andcutgrass/hay/alfalfa (201.9 acres). Over 40 percent of all pastureland/rangeland, cropland, andcutgrass/hay/alfalfa had been purchased since 2000. Ownership of land has been primarily theresult of purchases (70.6 percent), followed by inheritance (26.1 percent). The majority of land isheld in a sole proprietorship (52.1 percent) arrangement and 31.7 percent is held in a partnershipwith family members.
Farmers and ranchers who leased land rented larger tracts of pastureland/rangeland thanother land-use types. Tracts over 640 acres made up 46.8 percent of that type of rented land, butcropland tract size rentals were equally distributed between up to 160 acres, 160 to 640 acres,and more than 640 acres (14.9 percent for each). Most current pastureland/rangeland rentalcontracts were for 1 year (44.1 percent), but the tenure of the majority (66.6 percent) of leaseshad been for more than 10 years. Half of the cropland was rented for 2-3 years, and these leasesalso have had a long tenure with 52.6 percent exceeding 10 years. Rental terms forcutgrass/hay/alfalfa were similar to cropland, with 53.9 percent with 2-3 year contracts and 53.9percent of these contracts had a tenure greater than 10 years. Cropland was most frequentlyrented (66.7 percent) from an absentee landowner for all land-use types. Renters strongly agreedthat absentee landowners want to develop long-term relationships with tenants, and thatrelationships are critical to securing long-term lease agreements. Absentee landowners rented64.6 percent of their cropland and 54.1 percent of their pastureland/rangeland locally. Absenteelandowners rented most of their cropland (48.5 percent) and rangeland/pastureland (46.1percent) on 1 year leases. Half of the cutgrass/hay/alfalfa land was leased for 4 or more years.These three land-use types had the largest share of their land rented for a 4-10 year tenure.Absentee landowners felt that having a good relationship with their tenant (84.6 percent) wasvery important, as were the tenants conservation practices (61.3 percent) and tenants land-useintentions (51.1 percent).
This study was initiated at a time when land use for wildlife and recreation waspotentially becoming a substantial competitor for land for production agriculture. Absenteelandowners were on the rise and some land was purchased for recreational activities. Farmersand ranchers believe this has caused the cost of buying or renting land to increase beyond what itwould have been had those lands remained in agricultural production. A high portion of theabsentee owner’s land has been rented locally. Many of the renters have been able to developgood relationships with the landowners, and even though they are renting for short-term periods,they have been able to maintain the lease over long periods of time. Since this study was initiatedhigher crop prices and widespread enthusiasm for energy development have again affected landownership pattern in the region. How all of these external factors affect production agriculture inthis region remains yet to be seen.
18

References
U.S. Department of Agriculture. 2009. 2007 Census of Agriculture, Volume I, Chapter 2, Table4. National Agricultural Statistics Service, Internet Web Site. Washington, D.C.
Lauenroth, W.K., D.G. Milchunas, L.L. Dod, R.H. Hart, R.K. Heitschmidt, and L.R.Rittenhouse. 1994, “Grazing in the Great Plains,” pp. 60-100 in Ecological Implicationsof Livestock Herbivory in the West, M. Vavra, W.A. Laycock, and R.D. Pieper, (eds).Society for Range Management, Denver, CO.
Nudell, Daniel, Nancy Hodur, F. Larry Leistritz, Clint Clark, Duane Griffith, and TammieJensen. 2007. A Guide To The Value Added Ruminant Animal Consortium StudyCounties. North Dakota Agricultural Experiment Station, Hettinger Research andExtension Center.
U.S. Bureau of the Census. 2011. Census of Population and Intercensel County Estimates ofPopulation. U.S. Department of Commerce, Bureau of the Census, Internet Web site.Washington, D.C.
Hodur, Nancy M., F. Larry Leistritz, and Dean A. Bangsund. 2002a. Local SocioeconomicImpacts of the Conservation Reserve Program. Agr. & Applied Econ. Rpt. No. 476.Fargo: NDSU, Dept. of Agr. & Applied Economics.
Hodur, Nancy M., F. Larry Leistritz, and Dean A. Bangsund. 2002b. Ranch Operators’Perceptions of Leafy Spurge Management and Evaluation of the TEAM Leafy SpurgeProject. Agr. & Applied Econ. Rpt. No. 493. Fargo: NDSU, Dept. of Agr. & AppliedEconomics.
Hodur, Nancy M., F. Larry Leistritz, and Dean A. Bangsund. 2002c. Perceptions of LeafySpurge and Evaluation of the TEAM Leafy Spurge Project by Public Land Managers,Local Decision Makers, and Ranch Operators. Agr. & Applied Econ. Rpt. No. 499.Fargo: NDSU, Dept. of Agr. & Applied Economics.
19