C-14 - Seattle heaton insurance (1)
44
Tom Heaton All Things Related To Earthquakes PhD from Caltech in Geophysics 16 years with USGS Joint Prof. in Geophysics and Civil Engineering since 1995 Director of the Earthquake Engineering Research Laboratory
Transcript of C-14 - Seattle heaton insurance (1)

Tom HeatonAll Things Related To EarthquakesPhD from Caltech in Geophysics
16 years with USGSJoint Prof. in Geophysics and Civil Engineering since 1995
Director of the Earthquake Engineering Research Laboratory
Caltech asked me to be a “bridge” between Engineering and Science

But maybe I can be a Ferry Boat instead

Statistical Characteristics of Earthquake Ground Motion;
Has PBEE Broken the Power Law?
Tom Heaton (Caltech)Brad Aagaard (USGS)
Georgia CuaAnna Olsen (USGS)
Masumi Yamada (Kyoto Univ.)

Performance Based Earthquake Engineering (PBEE)
• Most building codes have evolved over time following observations made after damaging earthquakes
• Have limited number of earthquakes to learn from• PBEE says build according to a statistical model of
earthquake hazard.• Current practice is to build so that the expected time
between collapse of a structure is 2,500 years (except in San Francisco, where it’s 1,500 years).
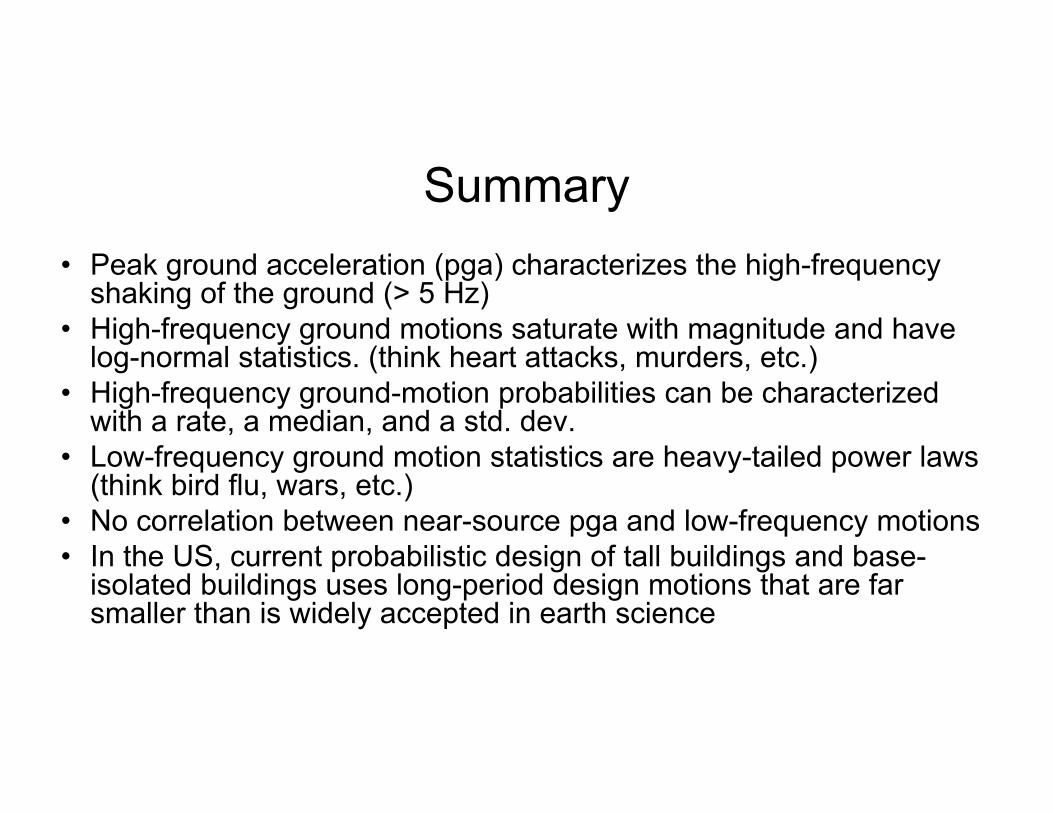
Summary• Peak ground acceleration (pga) characterizes the high-frequency
shaking of the ground (> 5 Hz)• High-frequency ground motions saturate with magnitude and have
log-normal statistics. (think heart attacks, murders, etc.)• High-frequency ground-motion probabilities can be characterized
with a rate, a median, and a std. dev.• Low-frequency ground motion statistics are heavy-tailed power laws
(think bird flu, wars, etc.) • No correlation between near-source pga and low-frequency motions• In the US, current probabilistic design of tall buildings and base-
isolated buildings uses long-period design motions that are far smaller than is widely accepted in earth science

Key Issues• I will concentrate on near-source (less than 10 km from rupture)
motions since they are simpler to think about• Modern high-rise buildings and base-isolated buildings have not yet
experienced large long-period ground motions (pgd > 1 m).• But they will• Is statistical prediction of long period ground motions technically
feasible?• Maybe … but it will look very different from psha for short periods• Will the design of long-period buildings change dramatically in the
next 100 years?
8
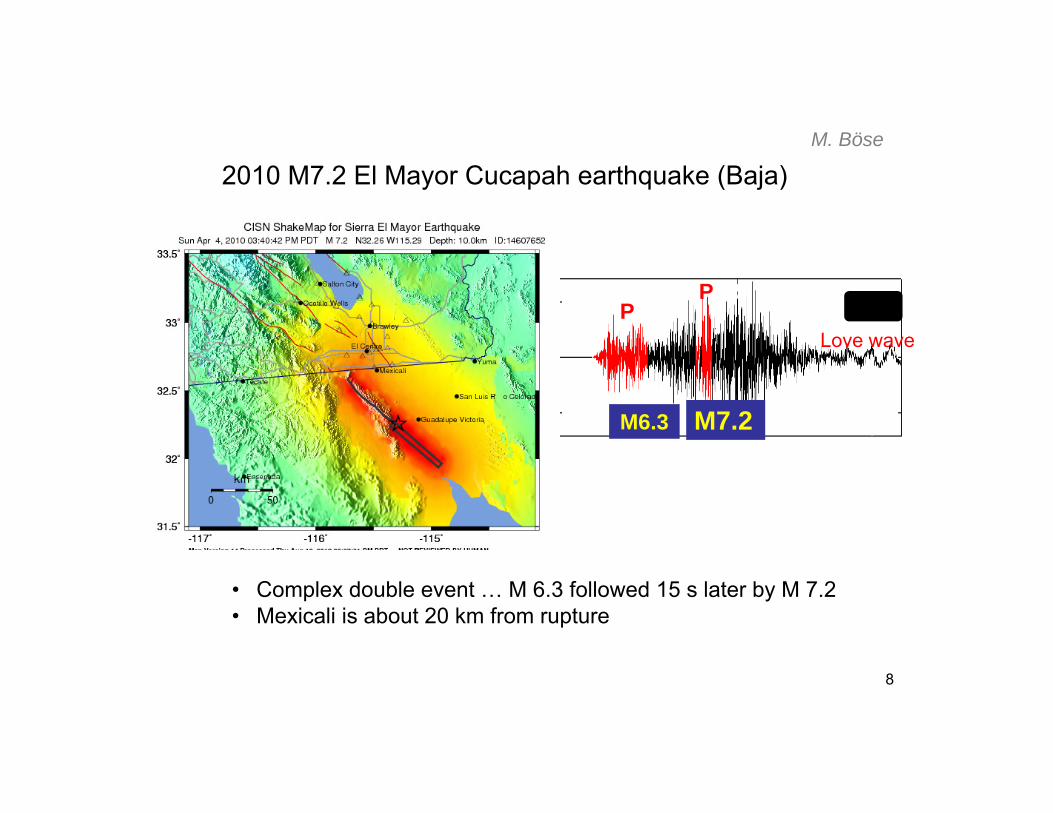
2010 M7.2 El Mayor Cucapah earthquake (Baja)M. Böse
El Mayor
P SSP
M7.2M6.3
• Complex double event … M 6.3 followed 15 s later by M 7.2• Mexicali is about 20 km from rupture
Love wave

Cucapah, El Major M 7.2Real Inn, Mexicali, 8 stories, 24 km

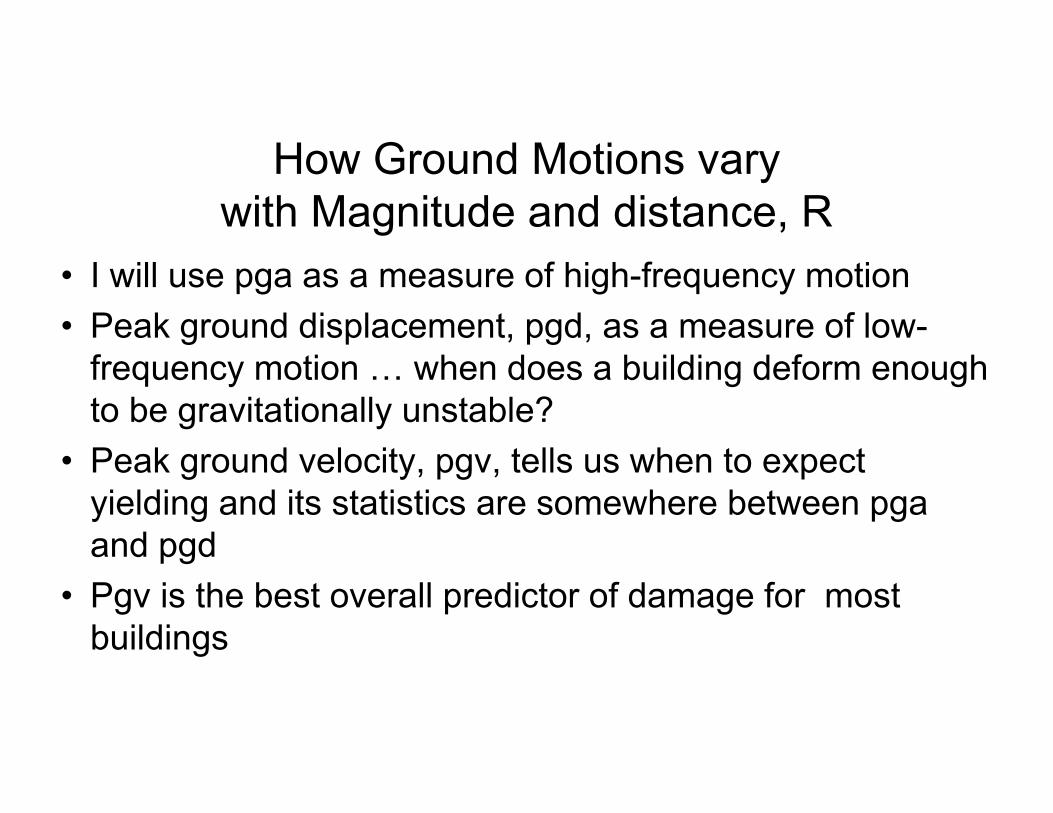
How Ground Motions vary with Magnitude and distance, R
• I will use pga as a measure of high-frequency motion• Peak ground displacement, pgd, as a measure of low-
frequency motion … when does a building deform enough to be gravitationally unstable?
• Peak ground velocity, pgv, tells us when to expect yielding and its statistics are somewhere between pgaand pgd
• Pgv is the best overall predictor of damage for most buildings
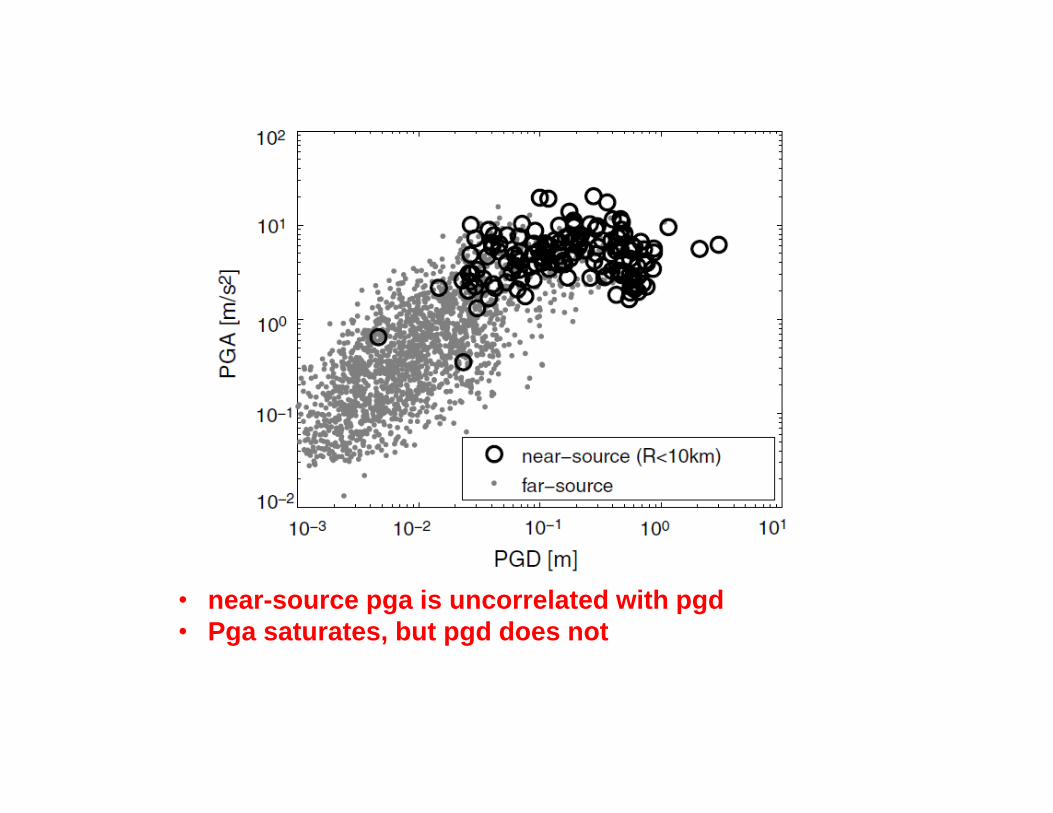
• near-source pga is uncorrelated with pgd• Pga saturates, but pgd does not

Magnitude-dependent saturation of rock and soil sites (S-waves)
horizontal S-wave acceleration horizontal S-wave velocity
horizontal S-wave displacement
•Ground motion attenuation derived by Cua and Heaton from TriNet and Cosmos data•For near source motions, high frequencies are log-normally distributed about 0.52 g, regardless of the magnitude and soil type•Long-period motions do not saturate and the frequency versus size obeys a power law (variation of Gutenberg Richter)•Log-normal statistics (high frequency hazard) is dominated by the median, whereas power law statistics (long-period hazard) is dominated by the tail

•Near-source pga’s are log-normal•Same distribution will apply 100 years from now
All Pga’s recorded at less than 10 km from M>6

Short periods are Gaussian statistics
• Can reliably determine the mean and standard deviation from only a few dozen observations
• How many people will die in auto accidents?• How many people will suffer a heart attack?• How many buildings will experience some level of pga?• Although we can predict short-period ground motion
statistics, no one really uses them for the design of short buildings … rule based codes function well here.

•Long-period ground motions are not log normal•A few large earthquakes can completely change the distribution•Cannot predict what the shape of this distribution will look like 100 years from now•Area(M)~10M10-bM=constant, if b=1•i.e., given that a fault slips, all values of slip are equally likely•The small pgd’s will come in a few at a time as smaller but numerous eq’s occur•The large pgd’s will arrive in a large clump when infrequent large eq’s occur

Long Periods are power law statisticsaka. a Pareto Distribution
• Probabilities are difficult to estimate for power law. What is the total wealth in California?
• How many people will die in• A war?• A pandemic?• What will your stock market investments look like in 20
years?

Why are pgd’s and pgv’s important to tall structures?
• In order to collapse, a tall building must deform enough to become gravitationally unstable; that is, there must be large enough displacement
• And the displacement must happen fast enough to cause yielding … pgv

John Hall’s design of a 20-story steel MRF building
•Building U20 1994 UBC zone4Stiff soil, 3.5 sec. period
•Building J201992 Japan code3.05 sec periodSimilar to current IBC with
highest near-source factor
•Both designs considerPerfect weldsBrittle weldsJapanese typically exceed code


Intended yielding is plastic hinges in the beams … avoid yielding in the columns
From Chia-Ming Uang


Pushover Analysis•Special attention to P-delta instability•Story mechanism collapse•Frame 2-D fiber-element code of Hall (1997)•2 m roof displacement is near the capacity of any of these designs•Most US buildings built before 1995 have brittle welds
0 50 100 150 200 250 3000
5
10
15
20
25
30
35
40Pushover Curves
Bas
e S
hear
(fra
c of
bui
ldin
g w
eigh
t) %
Lateral Roof Displacement cm
U20BU20PU6BU6PJ20BJ20PJ6BJ6P

20-story steel-frame building (UBC 94) subjected to a 2-meter near-source displacement pulse (from Hall)
• triangles on the frame indicate the failures of welded column-beam connections (loss of stiffness).
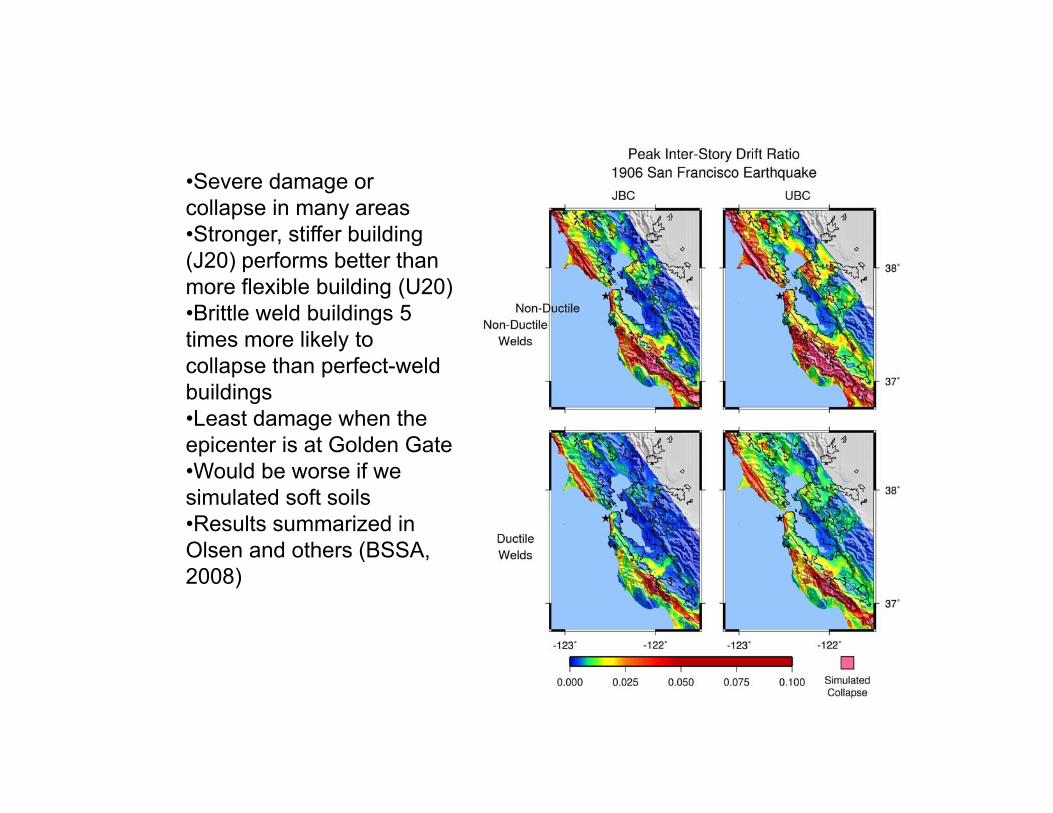
•Severe damage or collapse in many areas•Stronger, stiffer building (J20) performs better than more flexible building (U20)•Brittle weld buildings 5 times more likely to collapse than perfect-weld buildings•Least damage when the epicenter is at Golden Gate•Would be worse if we simulated soft soils•Results summarized in Olsen and others (BSSA, 2008)

20-story US with Sound
Welds
Olsen, Heaton, and Hall (in press) show that (pgv,pgd) is a better predictor of collapse than response spectral acceleration and ε
64,000 synthetic records From SCEC• Repairable
• Not Repairable• Collapse

10% probabilitycontours
• Range of motionsbetween unrepairableand collapse is muchsmaller for 20-storythan for 6-story• In a sense, the taller building is morebrittle because of P-∆ effect

-30 -20 -10 0 10 20 300.2
0.3
0.4
0.5
0.6
0.7
0.8
0.9
1
Distance from the fault (km)
Slip
(m)
Y=0.7/(1+(0.13X)1.6)0.5modeldip=45dip=60dip=75dip=90
PGD per unit fault slip
(Aagaard et al. 2001)
Near-Source PGD’s are roughly 2/3 of the fault slip in nearby segments.
But what will the fault slip be?
For strike-slip fault,Dis
plac
emen
t (m
)
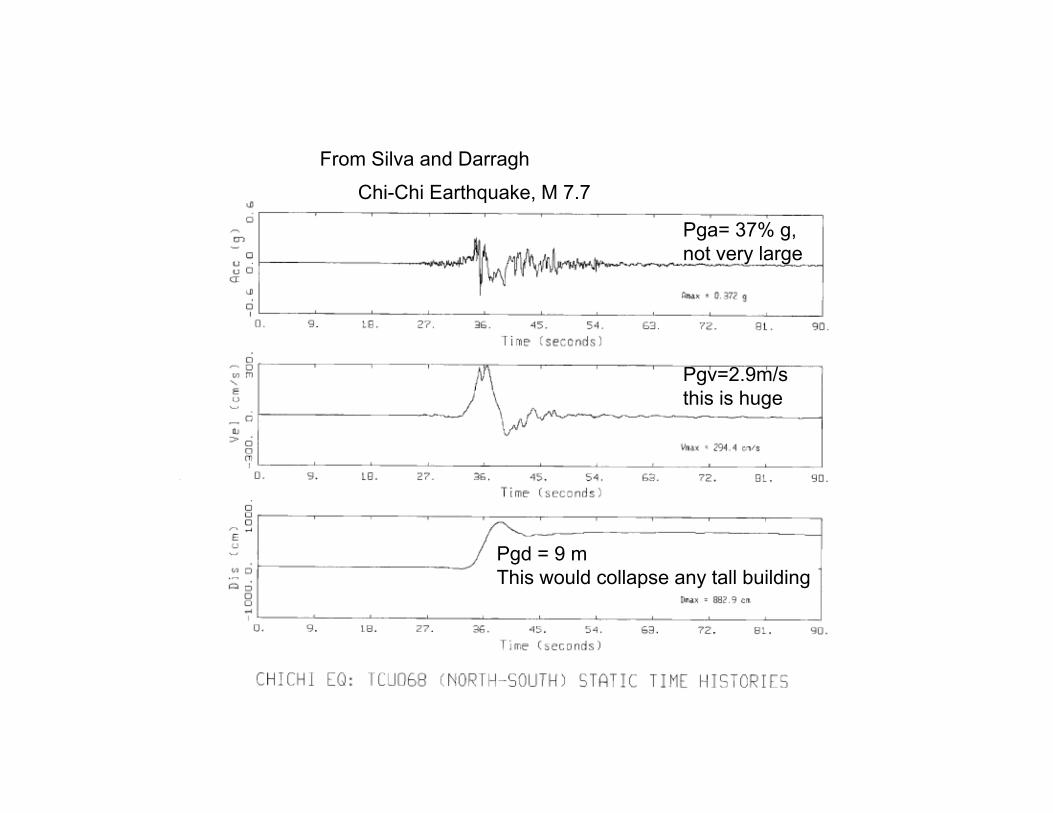
From Silva and Darragh
Pga= 37% g, not very large
Chi-Chi Earthquake, M 7.7
Pgv=2.9m/s this is huge
Pgd = 9 m This would collapse any tall building

M 7.3 on Puente HillsBlind Thrust Fault
Motions simulated by Graves
Simulations in Olsen thesis
Inter-story drift > 0.8 is collapse

Abel Dizon’s 2015 PhD thesis
Brittle Weld

• PEER Tall Building Initiative to conduct performance based analysis of three 40-story buildings in downtown LA (5 ½ to 6 s fundamental periods).
• “Working with engineering consultants and experts at SCEC, we selected records to represent frequent (25-yr) and extremely rare (4975-yr) shaking. The latter is well beyond the shaking level commonly considered.”
• “the code-designed cases (2006 IBC, 2008 LATBDC) have acceptable performance under the 475-yr motions, and survive the 2475-yr motions. Under the 4975-yr event, however, some elements may fail.”
• Similar study of One Rincon Hill in downtown San Francisco for similar building design.

Spe
ctra
l acc
eler
atio
n, g
• 15 realizations of spectrum compatible motions used by PEER Tall Building Initiative for 40-story (6 second) building analysis in downtown LA
• These are the Maximum Considered Earthquake Spectra (MCE) for a 2,476-year repeat (life safety level
• This project is considered as a PEER/SCEC collaboration

1.0 m/s
-1.0 m/s
PEER Spectrum Compatible 2,500-yr Ground Velocities for 40-story 6-second Building in Los Angeles

PEER Spectrum Compatible 2,500-yr Ground Displacements for 40-story 6-second Building in Los Angeles
1.0 m
-1.0 m

PEER Spectrum Compatible 2,500-yr Ground Displacements for 40-story 6-second Building in Los Angeles
1.0 m
-1.0 m
LA Basin will shorten 30 meters,but 1 meter pgdis considered as extreme ground motion

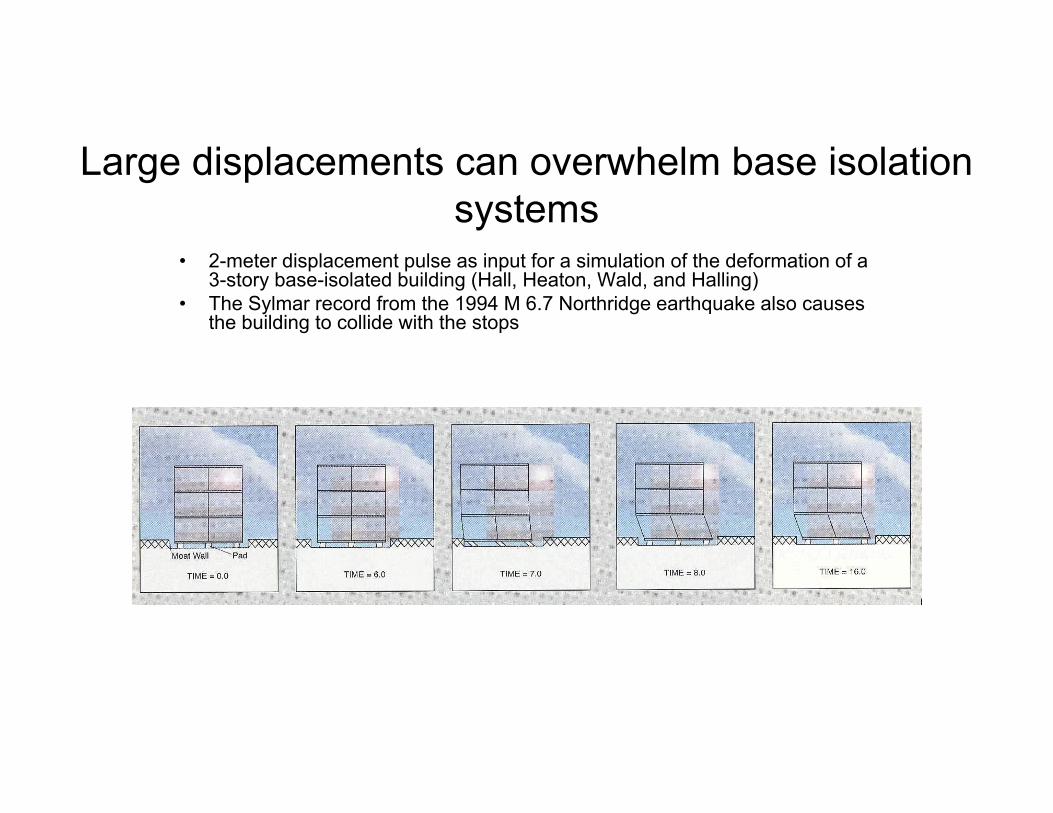
Large displacements can overwhelm base isolation systems
• 2-meter displacement pulse as input for a simulation of the deformation of a 3-story base-isolated building (Hall, Heaton, Wald, and Halling)
• The Sylmar record from the 1994 M 6.7 Northridge earthquake also causes the building to collide with the stops

3-sec spectral displacement• Typical US base
isolator is 3 sec with a maximum allowed displacement of 40 cm
• Nonlinear isolator displacements exceed linear by 20% to 40% (Ryan and Chopra)
• Described in Olsen and others (BSSA, 2008)
• Anything in yellow or red would exceed current typical base isolation system
meters
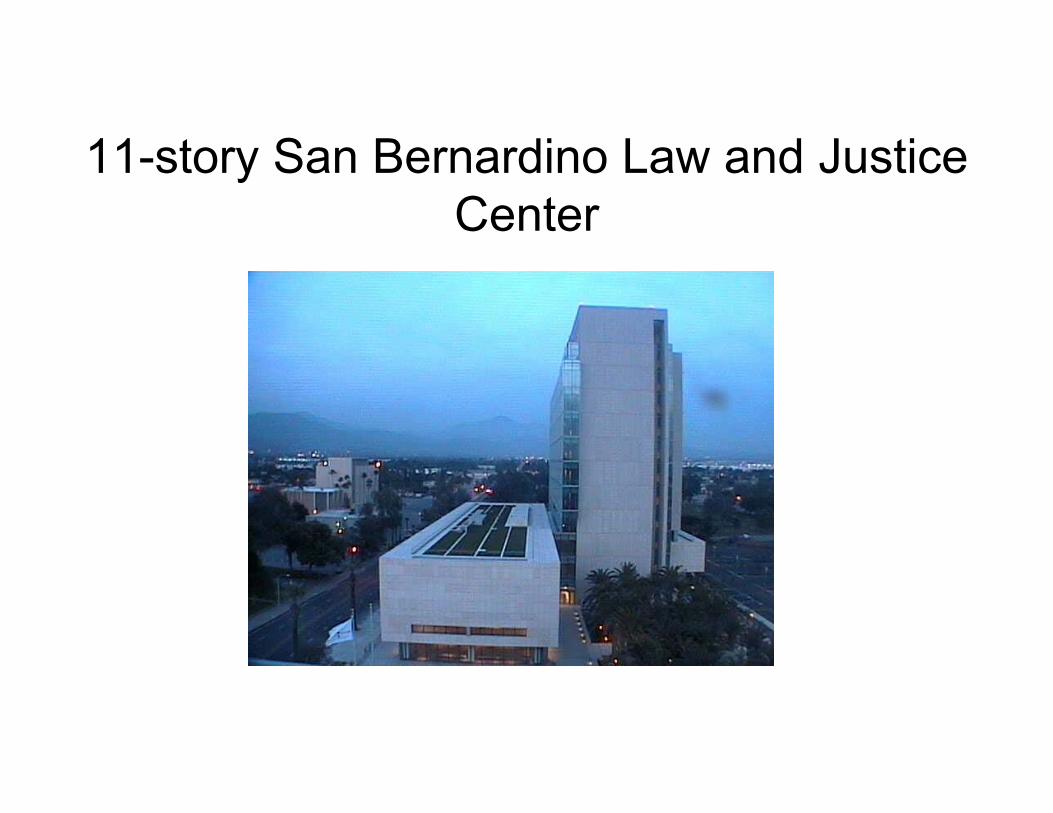
11-story San Bernardino Law and Justice Center
Designing for the Known
• Architect chooses the geometry of a design• Define probability of forces that design will be subjected to• Determine the size of elements that will satisfy statistical
limits• This is “performance based design”
Designing for the Unknown• Determine the functional requirements of a structure• Consider several geometries of the structure (different
architectures)• Determine the cost of different designs• Assess the strengths and weaknesses of different designs …
make sure the earth scientist knows what the designer assumes won’t happen
• Choose the design that is most robust• Our real job is to find the flaws in current practice and fix them• Better is ALWAYS better