by Rational Design of a pH-activatable Fluorescent Probe ... · Engineering a Nanolab for...
17
Engineering a Nanolab for Determination of Lysosomal Nitric Oxide by Rational Design of a pH-activatable Fluorescent Probe Yinhui Li,* ,a Wei Wu, a Jinfeng Yang, c Lin Yuan, a Changhui Liu, a Jing Zheng, a and Ronghua Yang,* ,a, b a State Key Laboratory of Chemo/Biosensing and Chemometrics, College of Chemistry and Chemical Engineering, Hunan University, Changsha, 410082, China. b School of Chemistry and Biological Engineering, Changsha University of Science and Technology, Changsha, 410004, China. c Tumor Hospital, Xiangya School of Medicine, Central South University, Changsha, 410013, China. To whom correspondence should be addressed: E-mail: [email protected]; [email protected] Fax: +86-731-8882 2523 Electronic Supplementary Material (ESI) for Chemical Science. This journal is © The Royal Society of Chemistry 2015
Transcript of by Rational Design of a pH-activatable Fluorescent Probe ... · Engineering a Nanolab for...

Engineering a Nanolab for Determination of Lysosomal Nitric Oxide
by Rational Design of a pH-activatable Fluorescent Probe
Yinhui Li,*,a Wei Wu,a Jinfeng Yang,c Lin Yuan,a Changhui Liu,a Jing Zheng,a
and Ronghua Yang,*,a, b
a State Key Laboratory of Chemo/Biosensing and Chemometrics, College of Chemistry and
Chemical Engineering, Hunan University, Changsha, 410082, China. b School of Chemistry and
Biological Engineering, Changsha University of Science and Technology, Changsha, 410004,
China. c Tumor Hospital, Xiangya School of Medicine, Central South University, Changsha,
410013, China.
To whom correspondence should be addressed:
E-mail: [email protected]; [email protected]
Fax: +86-731-8882 2523
Electronic Supplementary Material (ESI) for Chemical Science.This journal is © The Royal Society of Chemistry 2015
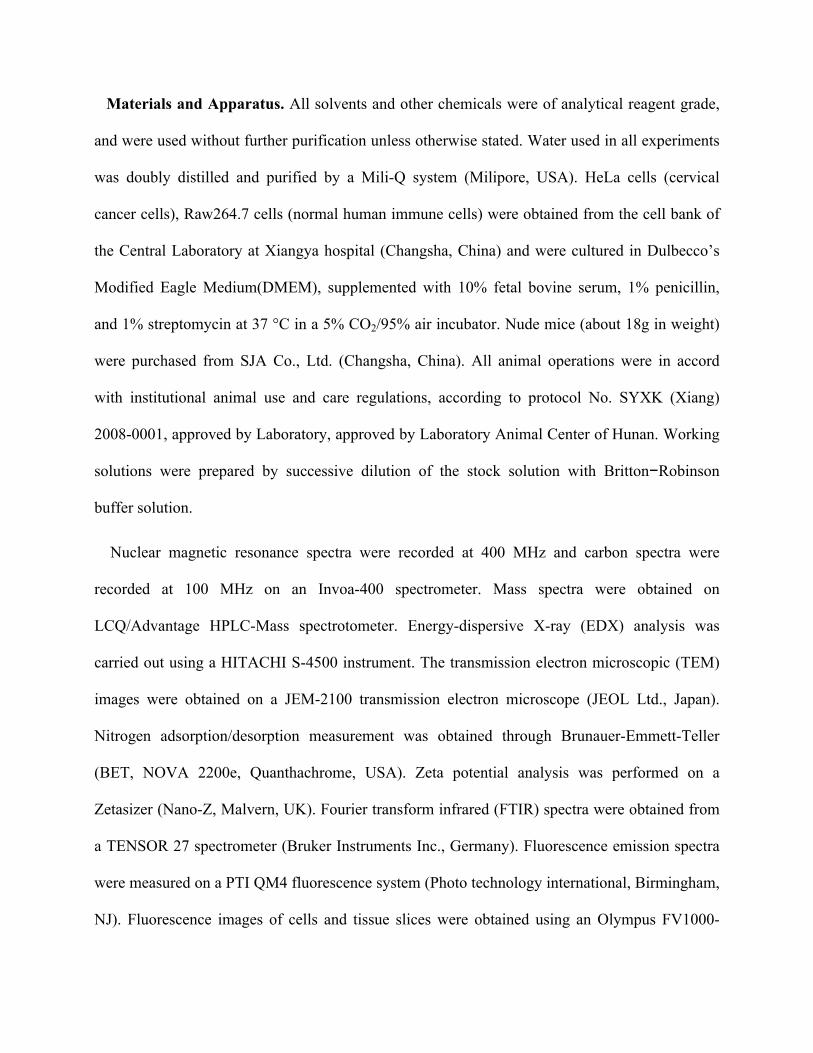
Materials and Apparatus. All solvents and other chemicals were of analytical reagent grade,
and were used without further purification unless otherwise stated. Water used in all experiments
was doubly distilled and purified by a Mili-Q system (Milipore, USA). HeLa cells (cervical
cancer cells), Raw264.7 cells (normal human immune cells) were obtained from the cell bank of
the Central Laboratory at Xiangya hospital (Changsha, China) and were cultured in Dulbecco’s
Modified Eagle Medium(DMEM), supplemented with 10% fetal bovine serum, 1% penicillin,
and 1% streptomycin at 37 °C in a 5% CO2/95% air incubator. Nude mice (about 18g in weight)
were purchased from SJA Co., Ltd. (Changsha, China). All animal operations were in accord
with institutional animal use and care regulations, according to protocol No. SYXK (Xiang)
2008-0001, approved by Laboratory, approved by Laboratory Animal Center of Hunan. Working
solutions were prepared by successive dilution of the stock solution with Britton−Robinson
buffer solution.
Nuclear magnetic resonance spectra were recorded at 400 MHz and carbon spectra were
recorded at 100 MHz on an Invoa-400 spectrometer. Mass spectra were obtained on
LCQ/Advantage HPLC-Mass spectrotometer. Energy-dispersive X-ray (EDX) analysis was
carried out using a HITACHI S-4500 instrument. The transmission electron microscopic (TEM)
images were obtained on a JEM-2100 transmission electron microscope (JEOL Ltd., Japan).
Nitrogen adsorption/desorption measurement was obtained through Brunauer-Emmett-Teller
(BET, NOVA 2200e, Quanthachrome, USA). Zeta potential analysis was performed on a
Zetasizer (Nano-Z, Malvern, UK). Fourier transform infrared (FTIR) spectra were obtained from
a TENSOR 27 spectrometer (Bruker Instruments Inc., Germany). Fluorescence emission spectra
were measured on a PTI QM4 fluorescence system (Photo technology international, Birmingham,
NJ). Fluorescence images of cells and tissue slices were obtained using an Olympus FV1000-

MPE multiphoton laser scanning microscope (Japan). Fluorescent images of mice were taken by
a Caliper VIS Lumina XR small animal optical in vivo imaging system (USA). UV-Vis
absorption spectra were recorded in 1.0 cm path length quartz cuvettes on a Hitachi U-4100
UV/Vis spectrometer (Kyoto, Japan). pH was measured by model 868 pH meter (Orion).
Synthesis of Rhod-NO.1 Rhodamine B (500 mg, 0.76 mmol) was dissolved in CH2Cl2 (5.0 ml)
at room temperature, and then 1-hydroxypyrrolidine-2, 5-dione (262.2 mg, 2.28 mmol) and DCC
(313.2 mg, 1.52 mmol) were added. The mixture was allowed to react for 10 h, and subsequently
triethylamine (0.7 mL) and o-diaminobenzene (240 mg, 2.22 mmol) were added. After stirring
for 3 h, the mixture was concentrated under vacuum and the crude product was purified by silica
column chromatography (CH2Cl2:CH3OH = 100:1) to give Rhod-NO as a white powder (170 mg,
46.4% yield).
Synthesis of Rhod-H-NO. Rhod-NO (120mg, 0.225 mmol) and propionaldehyde (170μL)
was dissolved in CH3OH (5.0 mL) in room temperature, and then several drops of HOAc was
added. The mixture was refluxed overnight under N2 atomsphere. The solvent was removed by
evaporation under reduced pressure. The crude residue was purified by silica gel column
chromatography using CH2Cl2 to give Rhod-H-NO as a white powder (78mg, 65.2% yield). 1H
NMR (400 MHz, CDCl3) δ 8.02 (d, J = 8.0 Hz, 1H), 7.55 (t, J = 6.0 Hz, 2H), 7.25 (s, 1H), 6.94 (t,
J = 8.0 Hz, 1H), 6.63 (d, J = 8.0 Hz, 2H), 6.54 (d, J = 4.0 Hz, 1H), 6.41 (t, J = 8.0, 1H), 6.31 (d, J
= 8.0 Hz, 2H), 6.08 (d, J = 8.0 Hz, 1H), 4.30 (t, J = 6.0 Hz, 2H), 3.31 (dd, J = 8.0 Hz, J = 8.0 Hz,
8H), 1.91 (dd, J = 4.0 Hz, J = 4.0 Hz, 2H), 1.13 (t, J = 6.0 Hz, 12H), 0.87 (t, J = 8.0 Hz, 3H); 13C
NMR (100 MHz, CDCl3) δ 12.5, 14.1, 24.9, 25.6, 29.7, 34.0, 44.3, 49.1, 77.3, 98.0, 108.0, 116.9,
118.2, 122.1, 123.4, 124.3, 129.3, 130.0, 131.9, 132.6, 144.5, 149.0, 152.3, 154.0, 156.9, 166.4.
MS (ESI) m/z calcd for C37H40N4O2 572.3, found 573.1.
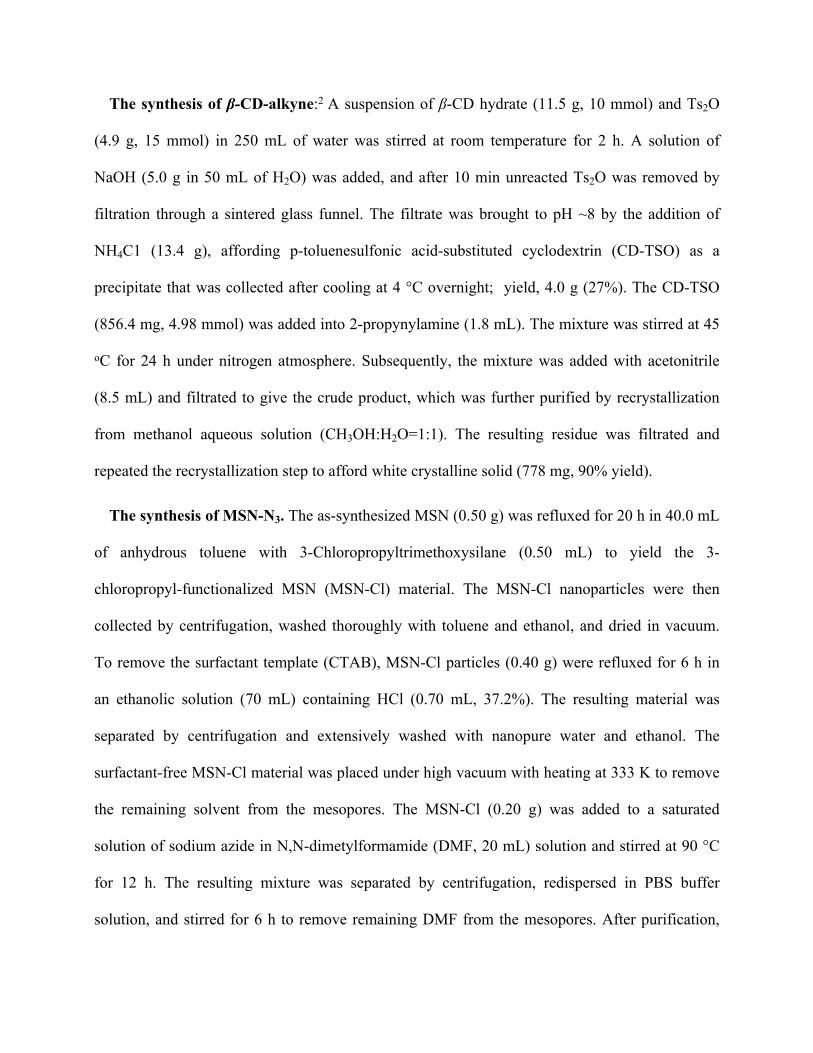
The synthesis of β-CD-alkyne:2 A suspension of β-CD hydrate (11.5 g, 10 mmol) and Ts2O
(4.9 g, 15 mmol) in 250 mL of water was stirred at room temperature for 2 h. A solution of
NaOH (5.0 g in 50 mL of H2O) was added, and after 10 min unreacted Ts2O was removed by
filtration through a sintered glass funnel. The filtrate was brought to pH ~8 by the addition of
NH4C1 (13.4 g), affording p-toluenesulfonic acid-substituted cyclodextrin (CD-TSO) as a
precipitate that was collected after cooling at 4 °C overnight; yield, 4.0 g (27%). The CD-TSO
(856.4 mg, 4.98 mmol) was added into 2-propynylamine (1.8 mL). The mixture was stirred at 45
oC for 24 h under nitrogen atmosphere. Subsequently, the mixture was added with acetonitrile
(8.5 mL) and filtrated to give the crude product, which was further purified by recrystallization
from methanol aqueous solution (CH3OH:H2O=1:1). The resulting residue was filtrated and
repeated the recrystallization step to afford white crystalline solid (778 mg, 90% yield).
The synthesis of MSN-N3. The as-synthesized MSN (0.50 g) was refluxed for 20 h in 40.0 mL
of anhydrous toluene with 3-Chloropropyltrimethoxysilane (0.50 mL) to yield the 3-
chloropropyl-functionalized MSN (MSN-Cl) material. The MSN-Cl nanoparticles were then
collected by centrifugation, washed thoroughly with toluene and ethanol, and dried in vacuum.
To remove the surfactant template (CTAB), MSN-Cl particles (0.40 g) were refluxed for 6 h in
an ethanolic solution (70 mL) containing HCl (0.70 mL, 37.2%). The resulting material was
separated by centrifugation and extensively washed with nanopure water and ethanol. The
surfactant-free MSN-Cl material was placed under high vacuum with heating at 333 K to remove
the remaining solvent from the mesopores. The MSN-Cl (0.20 g) was added to a saturated
solution of sodium azide in N,N-dimetylformamide (DMF, 20 mL) solution and stirred at 90 °C
for 12 h. The resulting mixture was separated by centrifugation, redispersed in PBS buffer
solution, and stirred for 6 h to remove remaining DMF from the mesopores. After purification,

the azide-functionalized nanoparticles (MSN-N3) were washed with water and ethanol before
being dried in vacuum.
Preparation of Rhod-H-NO@MSN-CD: MSN-N3 (10 mg) and Rhod-H-NO (53.4 mg) were
placed in a round-bottom flask containing MeOH (5 mL). The solution mixture was stirred at
room temperature for 24 h to allow the Rhod-H-NO to be encapsulated by the MSN-N3. The
resulting particles were then separated by centrifugation and dispersed in H2O (1 mL) with CD-
alkyne (35 mg), CuSO4·5H2O (2.75 mg, 11 mmol), TBAB (10mg) and sodium ascorbate (10.9
mg, 55mmol). The mixture was stirred at room temperature for 3 days. The resulting particles
were then filtered and purified by centrifugation and washing with H2O/EtOH.
Spectrophotometric Measurements. Nitric oxide (NO) was generated from DEA/NONOate.
A stock solution of DEA/NONOate (1 mM) was prepared in 0.01M NaOH solution. Both the
UV/vis absorption and fluorescence measurements of Rhod-H-NO were conducted in
Britton−Robinson buffer solution. 1.0 mL buffer solution (pH 5.0) containing 1.0 μM Rhod-H-
NO was first introduced to a quartz cell. Following the additions of different concentration of
DEA/NONOate solution, the fluorescence intensities were recorded at excitation wavelength of
550 nm with an emission wavelength range from 560 to 750 nm.
To measure leakage of Rhod-H-NO from MSNs, Rhod-H-NO@MSN and Rhod-H-
NO@MSN-CD were suspended in 500 μL of buffer solution, respectively, sealed in a home-
made dialysis tube with a molecular weight cutoff of 8000-14000 Da, and then immersed in 1.5
mL of buffer solution containing 50.0 μM NO. The system was moderately shaken. The
fluorescence intensity of dialysis fluid was measured at certain time points.
Cell Cytotoxic Assays and Flow Cytometry (FCM). First, the cytotoxic effect of Rhod-H-
NO@MSN-CD were assessed using the MTT assay. Raw 264.7 cells were seeded into 96-well

plates and grown for 48 hours. These cells were then incubated with Rhod-H-NO@MSN-CD at
different concentrations for 24 h. Afterwards, cells were incubated in media containing 0.5 mg
mL−1 of MTT for 2 h. The precipitated formazan violet crystals were dissolved in 150 μL of
dimethyl sulfoxide (DMSO) at 37 °C. The absorbance was measured at 490 nm by a
multidetection microplate reader.
For FCM studies, macrophages cells RAW 264.7 were divided into four groups, group one
were treated with Rhod-H-NO@MSNs-CD (50μg/mL) in 200 μL of cell culture medium for 12 h,
group two were treated with Rhod-H-NO@MSN-CD and NONOate (50 μM) for 12 h, group
three were treated with Rhod-H-NO@MSN-CD, L-Arg (5 mg/mL), IFN-γ (400 U/mL) and LPS
(20 μg/mL) for 12 h, group four were pretreated with PTIO, then loaded with Rhod-H-
NO@MSN-CD, L-Arg (5 mg/mL), IFN-γ (400 U/mL) and LPS (20 μg/mL) for 12 h. All the
cells were washed with three times with PBS, suspended in 200 μL of binding buffer, and
subjected to flow cytometry analysis using a BD FACSCalibur cytometer by counting 10 000
events.
Cell Imaging. Before detection of the intracellular NO, the co-localization experiments were
performed firstly. The HeLa cells were incubated with Rhod-H-NO@MSN-CD (50 μg/mL) and
DEA/NONOate (50 μM) for 2 hour at 37 ℃ with 5% CO2, and then Lysosome-tracker Lyso
Tracker Green (1 μM) were further incubated for 30 min at the same condition. Finally, the cells were
washed three times with phosphate buffered saline (PBS) before imaging. (Rhod-H-NO@MSN-
CD channel: λex=559 nm, λem=570–600 nm bandpass. LysoTracker Green channel: λex=488 nm,
λem=505–530 nm bandpass. Yellow: colocalization of red and green fluorescence).
For cells imaging of exogenous NO in lysosome, the cells were pretreated with Rhod-H-
NO@MSN-CD (50 μg/mL) for 2h before being washed three times with PBS, then incubated
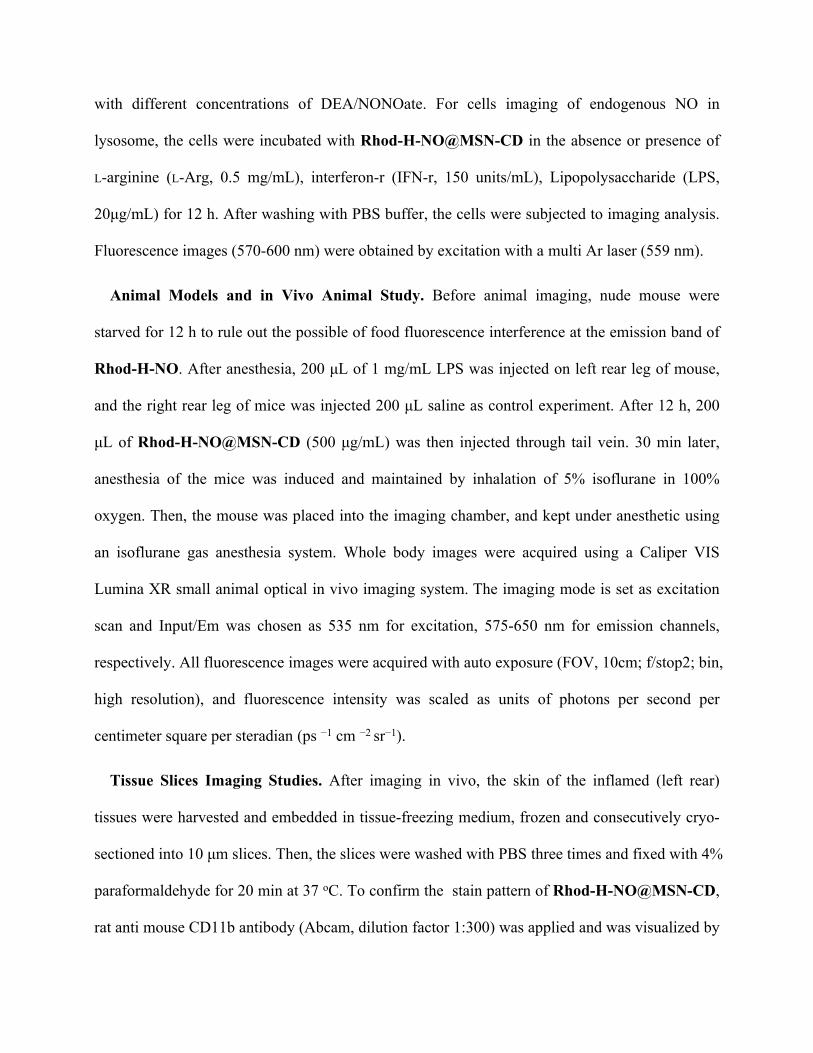
with different concentrations of DEA/NONOate. For cells imaging of endogenous NO in
lysosome, the cells were incubated with Rhod-H-NO@MSN-CD in the absence or presence of
L-arginine (L-Arg, 0.5 mg/mL), interferon-r (IFN-r, 150 units/mL), Lipopolysaccharide (LPS,
20μg/mL) for 12 h. After washing with PBS buffer, the cells were subjected to imaging analysis.
Fluorescence images (570-600 nm) were obtained by excitation with a multi Ar laser (559 nm).
Animal Models and in Vivo Animal Study. Before animal imaging, nude mouse were
starved for 12 h to rule out the possible of food fluorescence interference at the emission band of
Rhod-H-NO. After anesthesia, 200 μL of 1 mg/mL LPS was injected on left rear leg of mouse,
and the right rear leg of mice was injected 200 μL saline as control experiment. After 12 h, 200
μL of Rhod-H-NO@MSN-CD (500 μg/mL) was then injected through tail vein. 30 min later,
anesthesia of the mice was induced and maintained by inhalation of 5% isoflurane in 100%
oxygen. Then, the mouse was placed into the imaging chamber, and kept under anesthetic using
an isoflurane gas anesthesia system. Whole body images were acquired using a Caliper VIS
Lumina XR small animal optical in vivo imaging system. The imaging mode is set as excitation
scan and Input/Em was chosen as 535 nm for excitation, 575-650 nm for emission channels,
respectively. All fluorescence images were acquired with auto exposure (FOV, 10cm; f/stop2; bin,
high resolution), and fluorescence intensity was scaled as units of photons per second per
centimeter square per steradian (ps −1 cm −2 sr−1).
Tissue Slices Imaging Studies. After imaging in vivo, the skin of the inflamed (left rear)
tissues were harvested and embedded in tissue-freezing medium, frozen and consecutively cryo-
sectioned into 10 μm slices. Then, the slices were washed with PBS three times and fixed with 4%
paraformaldehyde for 20 min at 37 oC. To confirm the stain pattern of Rhod-H-NO@MSN-CD,
rat anti mouse CD11b antibody (Abcam, dilution factor 1:300) was applied and was visualized by

cy5-conjugated goat anti rat secondary antibody (Life TechnologiesTM, dilution factor 1:300).
Fluorescence images were obtained by Olympus FV1000-MPE multiphoton laser scanning
microscope. Fluorescence images were collected in two channels (green: 570-600 nm; red: 640-
680 nm) upon excitation with a multi Ar laser (559 nm and 630nm).
Transmission Electron Microscopy Analysis. HeLa cells were treated with Rhod-H-
NO@MSN-CD in media for 3.0 h at 37 °C. After washing with PBS, the cells were detached and
centrifuged. The cell pellets were fixed with 2.5% glutaraldehyde in 0.1 M phosphate buffer for
2.5 h, dehydrated using an ascending alcohol series (20, 40, 60, 80 and 100% twice) for 20 min
for each change, and then embedded in Araldite resin at 65 °C overnight. A 70 nm section was
placed on a TEM grid and stained with saturated uranyl acetate and 0.2% Reynolds lead citrate
before TEM imaging. Images were collected using a JEOL 1200 EXII scanning and transmission
electron microscope (Japan Electron Optics Laboratory, Peabody, MA).
References:
1. L. Yuan, W. Lin, Y. Xie, B. Chen, S. Zhu, J. Am. Chem. Soc. 2012, 134, 1305-1315.
2. Z. Guo, Y. Jin, T. Liang, Y. Liu, Q. Xu, X. Liang, A. Lei, J. Chromatogr. A 2009, 1216, 257-
263.

Fig. S1. 1H NMR of Rhod-H-NO.
Fig. S2. 13C NMR of Rhod-H-NO.

Fig. S3. ESI-MS of Rhod-H-NO.
Fig. S4. Fluorescence emission spectra of Rhod-H-NO in the absence (black line) and presence
(red line) of NO in buffer solution containing 10% CH3CN. (A) pH 7.0, (B) pH 5.0. The inset is
the absorption spectra corresponding to the fluorescence emission spectra.
Wavelength/nm560 600 640 680
Fluo
resc
ence
Inte
nsity
0
30
60
90
120
480 540 600 660
Abs
orba
nce
0.0
.3
.6
.9
Wavelength/nm
A
Wavelength/nm560 600 640 680
Fluo
resc
ence
Inte
nsity
0
30
60
90
120
480 540 600 660
Abs
orba
nce
0.0
.3
.6
.9
Wavelength/nm
B

Fig. S5. HPLC analysis of probe Rhod-H-NO, compound Rhod B and the reaction product of
Rhod-H-NO with NO in buffer solution (pH 5.0).
Fig. S6. ESI-MS of β-CD-alkyne.
Rhod-H-NO
12 14 16 18 20
Rhod-H-NO + NO
t / min12 14 16 18 20
Rhod B
12 14 16 18 20

Fig. S7. Zeta potentials of MSN-Cl (blue bar), MSN-N3 (green bar) and MSN-CD (red bar).
Fig. S8. Small-angle powder XRD patterns of MSN-Cl (black line), MSN-CD (pink line) and
Rhod-H-NO@MSN-CD (blue line).
Zeta
Pot
entia
l / m
V
-30
-15
0
15
30
45
2Degree2.5 5.0 7.5 10.0
Inte
nsity
100
110 200
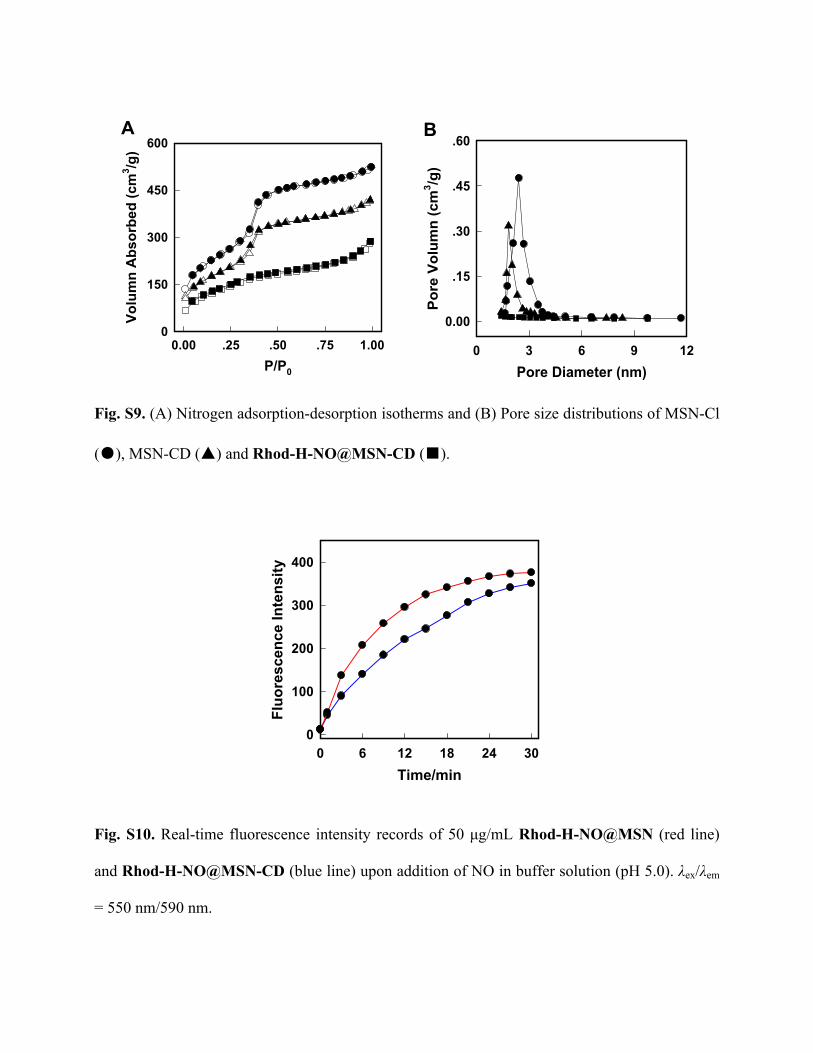
Fig. S9. (A) Nitrogen adsorption-desorption isotherms and (B) Pore size distributions of MSN-Cl
(●), MSN-CD (▲) and Rhod-H-NO@MSN-CD (■).
Fig. S10. Real-time fluorescence intensity records of 50 μg/mL Rhod-H-NO@MSN (red line)
and Rhod-H-NO@MSN-CD (blue line) upon addition of NO in buffer solution (pH 5.0). λex/λem
= 550 nm/590 nm.
Time/min0 6 12 18 24 30
Fluo
resc
ence
Inte
nsity
0
100
200
300
400
P/P0
0.00 .25 .50 .75 1.00
Volu
mn
Abs
orbe
d (c
m3 /g
)
0
150
300
450
600A
Pore Diameter (nm)0 3 6 9 12
Pore
Vol
umn
(cm
3 /g)
0.00
.15
.30
.45
.60B

Fig. S11. Real-time fluorescence records of Rhod-H-NO@MSN-CD buffer solution (pH 7.0),
then addition of 20 µM NO to the solution, finally, treated the solution with HCl solution. λex/λem
= 550 nm/ 590nm.
Fig. S12. Effect of pH on the fluorescence emission of Rhod-H-NO@MSN-CD (A) and Rhod-
NO@MSN-CD (B) in the absence (blue line) and presence of 50.0 M NO (red line). Inset: F/F0
of Rhod-H-NO@MSN-CD and Rhod-NO@MSN-CD as a function of pH.
pH2.5 5.0 7.5 10.0
Fluo
resc
ence
Inte
nsity
0
50
100
150
200
2D Graph 1
pH4 6 8 10
F/F 0
0
8
16
24
32A
pH2.5 5.0 7.5 10.0
Fluo
resc
ence
Inte
nsity
0
50
100
150
200
pH4 6 8 10
F/F 0
0
10
20
30
40
B
Time/s0 1000 2000 3000 4000
Fluo
resc
ence
Inte
nsity
0
50
100
150
200
H+NO

Fig. S13. Fluorescence responses of Rhod-H-NO (1 μM) towards various analytes. K+, Na+, Ca2+,
Mg2+, Zn2+, Fe2+, Cu2+ /5 mM, SO32−, Cys, Hcy, GSH /5 mM, H2O2, OH, O2
, 1O2, ClO, NO2,
NO3, ONOO/100 M.
Fig. S14. Cell viability values (%) estimated by MTT proliferation. HeLa cells were incubated
with 0−150 μgmL-1 Rhod-H-NO@MSN-CD (black bars) and 0-20 μΜ Rhod-H-NO (grey bars)
F/F 0
0
6
12
18
24
Blan
kK
+
Ca
2+M
g2+
Zn2+
Cu
2+
Fe2+
SO3
2-
Cys
Hcy
GSH H 2O 2
OH
. O 2-
1 O2
ClO
-N
O 2-
NO 3
-O
NO
O-
NO
Na
+
0
Cell
viab
ility
/%
0
30
60
90
120
10 20 50 100 150
0 1 5 10 15 20
[Rhod-H-NO@MSN-CD] /g/mL
[Rhod-H-NO] /M

at 37 oC for 24 h, respectively. Cells without addition of Rhod-H-NO@MSN-CD and Rhod-H-
NO were taken as the control experiment, and the viability was set as 100%.
Fig. S15. Rhod-H-NO@MSN-CD colocalizes to the lysosome in HeLa cells. (a) Bright filed. (b)
Cells were stained with 50 μg/mL Rhod-H-NO@MSN-CD with exogenous NO (100.0 μM) for
3.0 h at 37 °C. (c) Cells were stained with 2.0 μM mitochondria Tracker for 0.5 h at 37 °C, and
(d) Overlay of parts b and c. Scale bar: 20 m.
Fig. S16. Rhod-H-NO@MSN-CD colocalizes to the lysosome in HeLa cells. These images
correspond to Figure 3 in main text. (a) Bright filed. (b) Intensity profile of region of interest
(ROI) across the HeLa cell. (c) Intensity scatter plot of LysoTracker Green and Rhod-H-
NO@MSN-CD. (d) Simulated image (the white pixels, as represented by the scatter plot (c),
were highlighted by selecting the points with a red rectangular selection.). Scale bar: 20 m.
b c da
a b c d

Fig. S17. Confocal microscopy images of HeLa cells using Rhod-H-NO@MSN-CD under
different conditions. (a,b), Cells incubated with Rhod-H-NO@MSN-CD (50 μg/mL) for 3.0 h.
(c,d) Cells were first treated with with proton sponge of DMAN for 2.0 h, then incubated with
Rhod-H-NO@MSN-CD for 3.0 h. λex = 559 nm; λem = 570-600 nm. Scale bar: 20 m.
Fig. S18. Time based fluorescence images. RAW264.7 macrophages were pretreated with 50
µg/mL Rhod-H-NO@MSN-CD for 3 hours, after washing with PBS for three times, the cells
were further incubated with 50 µM NONOate for real-time imaging analysis. λex = 559 nm; λem =
570-600 nm. Scale bar: 20 m.
a b
c d
Bright Filed Fluorescence
Bright Filed 5 min 10 min 15 min 20 min 30 min