By - prr.hec.gov.pkprr.hec.gov.pk/jspui/.../9478/1/...UAF_07.08.2018.docx · Web viewPotassium...
331
In the Name of Allah, the Most Beneficent And The Most Merciful! Oh, Allah Almighty open our eyes, To see what is beautiful, Our minds to know what is true, Our heart to love what is Allah. I
Transcript of By - prr.hec.gov.pkprr.hec.gov.pk/jspui/.../9478/1/...UAF_07.08.2018.docx · Web viewPotassium...

In the Name of Allah, the Most Beneficent
And The Most Merciful!
Oh, Allah Almighty open our eyes,To see what is beautiful,
Our minds to know what is true,Our heart to love what is Allah.
I

Alleviation of Terminal Heat Stress in Wheat (Triticum aestivum L.)
Through Potassium and Selenium Nutrition
BY
MUHAMMAD SHAHIDM.Sc. (Hons.) Agriculture
2008-ag-2268
By
A thesis submitted in partial fulfillment of the requirement for the
degree
of
DOCTOR OF PHILOSOPHY
in
AGRONOMY
DEPARTMENT OF AGRONOMY,FACULTY OF AGRICULTURE,
UNIVERSITY OF AGRICULTURE, FAISALABAD-
PAKISTAN
2018
II

III

IV

V

VI

The Sublime
LoveOf
My Beloved and Kind ParentsWho taught me,
The first step to take,The first word to speak,
VII
Dedicated To

The first alphabet to write,Inspired me to higher ideas of life,
Whose hands always raise in prayer for me,
Who are with me to feel the bud of their wishes and prayers blooming into a flower
andUnder whose feet my heaven lies.
AND My Beloved BROTHER and
SISTERSAcknowledgements
Bounteous praise for ALMIGHTY ALLAH, the magnificent, the merciful, the propitious, the supreme, the omnipotent, the omnipresent, the omniscient and sovereign whose blessing and glories flourish my cogitation and all the eulogies for the HOLY PROPHET MUHAMMAD (SAW) for edifying our conscience of faith in ALLAH, converging all his kindness and mercy upon him.
I feel much honor to express my deepest sense of gratitude, philanthropy and magnanimity to my honorable supervisor, Dr. Muhammad Farrukh Saleem, Associate Professor, Department of Agronomy, University of Agriculture Faisalabad from the core of my heart for his dynamic supervision, marvelous guidance, keen interest and encouraging behavior. With humble, profound and deepest sense of devotion I wish to record my sincere appreciation to Dr. Shakeel Ahmad Anjum, Assistant Professor, Department of Agronomy, University of Agriculture Faisalabad and Dr. Irfan Afzal, Associate Professor, Department of Agronomy, University of Agriculture, Faisalabad for their sincere help, dynamic supervision and inspiring guidance throughout the course of this research work. I am genially thankful to Dr. Muhamad Shahid, Associate Professor, Department of Biochemistry, University of Agriculture Faisalabad for abetting in the conduct of biochemical analysis during the whole research work.
I feel inordinate appreciativeness for Higher Education Commission of Pakistan for economic backing to conduct this research work. I cordially applaud the
VIII

facilities provided by Analytical Laboratory, Department of Agronomy, University of Agriculture Faisalabad and Medicinal Plants Biochemistry Laboratory, Department of Biochemistry, University of Agriculture Faisalabad for assistance in conduct of biochemical analysis.
I want to express my great appreciation and sincerest gratitude to my friends and juniors; Abdul Shakoor, Ubaid-Ur-Rehman and Siraj Ahmed for their dexterous, dynamic, untiring help, friendly behavior and moral support during my whole study.
Round out the picture, no acknowledgement could ever adequately express my obligation to my affectionate Parents whose endless efforts and best wishes sustained me at all stages of my life and encouraged me for achieving higher ideas of life. Just as importantly, I want to express my everlasting love for my loving brother Muhammad Faisal and caring Sisters they offered irreplaceable endorsement and my Nephews and Nieces whom countenances have bestowed me the blisses of life.
May ALLAH bless all these people with long, happy and peaceful lives (Aameen)!
Muhammad Shahid
IX

X

LIST OF TABLESTable Title Page
3.1 Physio-chemical analysis of experimental site during 2014-15, 2015-16 and 2016-17 15
3.2 Monthly averages of weather elements during growing season of crop in 2014-15, 2015-16 and 2016-17 16
3.3 Varying mean temperatures (°C) 2014-15 for experiment 1 17
3.4 Varying mean temperatures (°C) during heat imposition for experiment 2, 2015-16 and 2016-17 17
3.5 Varying mean temperatures (°C) during heat imposition for experiment 3, 2015-16 and 2016-17 18
4.1.1 Effect of heat stress on fertile tillers of wheat varieties 31
4.1.2 Effect of heat stress on grains per spike and 1000-grain weight of wheat varieties 32
4.1.3 Effect of heat stress on grain yield of wheat varieties 34
4.1.4 Effect of heat stress on grain filling rate (GFR) and grain filling duration (GFD) of wheat varieties 38
4.1.5 Effect of heat stress on chlorophyll a (Chl a) and chlorophyll b (Chl b) contents of wheat varieties 41
4.1.6 Effect of heat stress on superoxide dismutase (SOD) and peroxidase (POD) of wheat varieties 42
4.1.7 Effect of heat stress on catalase (CAT) and total phenolic contents (TPC) of wheat varieties 43
4.1.8 Effect of heat stress on leaf proline and glycine betaine of wheat varieties 47
4.1.9 Effect of heat stress on total soluble proteins of wheat varieties 484.1.10 Effect of heat stress on malondialdehyde of wheat varieties 50
4.1.11 Correlation analyses showing strength of association among recorded attributes of different wheat varieties under no heat stress (H0)
52
4.1.12Correlation analyses showing strength of association among recorded attributes of different wheat varieties under heat from spike to grain filling (H1)
53
4.2.1 Effect of foliar applied potassium on fertile tillers and grains per spike of heat stressed wheat 57
4.2.2 Effect of foliar applied potassium on 1000-grain weight and grain yield of heat stressed wheat 59
4.2.3 Effect of foliar applied potassium on biological yield and harvest index of heat stressed wheat 64
4.2.4 Effect of foliar applied potassium on straw yield and plant height of heat stressed wheat 66
4.2.5 Effect of foliar applied potassium on spike length and spikelets per spike of heat stressed wheat 71
4.2.6 Effect of foliar applied potassium on grain filling rate (GFR) and grain filling duration (GFD) of heat stressed wheat 73
4.2.7 Effect of foliar applied potassium on chlorophyll a (Chl a) and chlorophyll b (Chl b) contents of heat stressed wheat 79
Table Title Page
XI

4.2.8 Effect of foliar applied potassium on superoxide dismutase (SOD) and peroxidase (POD) of heat stressed wheat 81
4.2.9 Effect of foliar applied potassium on catalase (CAT) and total phenolic contents (TPC) of heat stressed wheat 83
4.2.10 Effect of foliar applied potassium on leaf proline and glycine betaine of heat stressed wheat 89
4.2.11 Effect of foliar applied potassium on total soluble proteins (TSP) and malondialdehyde (MDA) of heat stressed wheat 91
4.2.12 Effect of foliar applied potassium on osmotic (ΨS) and water potential (ΨW) of heat stressed wheat 96
4.2.13 Effect of foliar applied potassium on turgor potential (ΨP) and shoot potassium (K) contents of heat stressed wheat 98
4.2.14 Effect of foliar applied potassium on grain crude proteins of heat stressed wheat 100
4.2.15 (a)
Correlation analyses showing strength of association among recorded attributes of wheat under no heat stress (H0) and foliar applied potassium during 2015-16
106
4.2.15 (b)
Correlation analyses showing strength of association among recorded attributes of wheat under no heat stress (H0) and foliar applied potassium during 2015-16
107
4.2.15 (c)
Correlation analyses showing strength of association among recorded attributes of wheat under no heat stress (H0) and foliar applied potassium during 2016-17
108
4.2.15 (d)
Correlation analyses showing strength of association among recorded attributes of wheat under no heat stress (H0) and foliar applied potassium during 2016-17
109
4.2.16 (a)
Correlation analyses showing strength of association among recorded attributes of wheat under heat from spike to grain filling (H1) and foliar applied potassium during 2015-16
110
4.2.16 (b)
Correlation analyses showing strength of association among recorded attributes of wheat under heat from spike to grain filling (H1) and foliar applied potassium during 2015-16
111
4.2.16 (c)
Correlation analyses showing strength of association among recorded attributes of wheat under heat from spike to grain filling (H1) and foliar applied potassium during 2016-17
112
4.2.16 (d)
Correlation analyses showing strength of association among recorded attributes of wheat under heat from spike to grain filling (H1) and foliar applied potassium during 2016-17
113
4.2.17 (a)
Correlation analyses showing strength of association among recorded attributes of wheat under heat from flowering to grain filling (H2) and foliar applied potassium during 2015-16
114
4.2.17 (b)
Correlation analyses showing strength of association among recorded attributes of wheat under heat from flowering to grain filling (H2) and foliar applied potassium during 2015-16
115
4.2.17 (c)
Correlation analyses showing strength of association among recorded attributes of wheat under heat from flowering to grain filling (H2) and foliar applied potassium during 2016-17
116
Table Title Page
XII

4.2.17 (d)
Correlation analyses showing strength of association among recorded attributes of wheat under heat from flowering to grain filling (H2) and foliar applied potassium during 2016-17
117
4.3.1 Effect of foliar applied selenium on fertile tillers and grains per spike of heat stressed wheat 120
4.3.2 Effect of foliar applied selenium on 1000-grain weight and grain yield of heat stressed wheat 122
4.3.3 Effect of foliar applied selenium on biological yield and harvest index of heat stressed wheat 128
4.3.4 Effect of foliar applied selenium on straw yield and plant height of heat stressed wheat 130
4.3.5 Effect of foliar applied selenium on spike length and spikelets per spike of heat stressed wheat 135
4.3.6 Effect of foliar applied selenium on grain filling rate (GFR) and grain filling duration (GFD) of heat stressed wheat 137
4.3.7 Effect of foliar applied selenium on chlorophyll a (Chl a) and on chlorophyll b (Chl b) contents of heat stressed wheat 143
4.3.8 Effect of foliar applied selenium on superoxide dismutase (SOD) and peroxidase (POD) contents of heat stressed wheat 145
4.3.9 Effect of foliar applied selenium on catalase (CAT) and total phenolic contents (TPC) of heat stressed wheat 147
4.3.10 Effect of foliar applied selenium on leaf proline and glycine betaine contents of heat stressed wheat 154
4.3.11 Effect of foliar applied selenium on total soluble proteins (TSP) and malondialdehyde (MDA) contents of heat stressed wheat 156
4.3.12 Effect of foliar applied selenium on osmotic (ΨS) and water potential (ΨW) of heat stressed wheat 162
4.3.13 Effect of foliar applied selenium on turgor potential (ΨP) and grain crude protein contents of heat stressed wheat 164
4.3.14 (a)
Correlation analyses showing strength of association among recorded attributes of wheat under no heat stress (H0) and foliar applied selenium during 2015-16
168
4.3.14 (b)
Correlation analyses showing strength of association among recorded attributes of wheat under no heat stress (H0) and foliar applied selenium during 2015-16
169
4.3.14 (c)
Correlation analyses showing strength of association among recorded attributes of wheat under no heat stress (H0) and foliar applied selenium during 2016-17
170
4.3.14 (d)
Correlation analyses showing strength of association among recorded attributes of wheat under no heat stress (H0) and foliar applied selenium during 2016-17
171
4.3.15 (a)
Correlation analyses showing strength of association among recorded attributes of wheat under heat from spike to grain filling (H1) and foliar applied selenium during 2015-16
172
4.3.15 (b)
Correlation analyses showing strength of association among recorded attributes of wheat under heat from spike to grain filling (H1) and foliar applied selenium during 2015-16
173
Table Title Page4.3.15 Correlation analyses showing strength of association among 174
XIII

(c) recorded attributes of wheat under heat from spike to grain filling (H1) and foliar applied selenium during 2016-17
4.3.15 (d)
Correlation analyses showing strength of association among recorded attributes of wheat under heat from spike to grain filling (H1) and foliar applied selenium during 2016-17
175
4.3.16 (a)
Correlation analyses showing strength of association among recorded attributes of wheat under heat from flowering to grain filling (H2) and foliar applied selenium during 2015-16
176
4.3.16 (b)
Correlation analyses showing strength of association among recorded attributes of wheat under heat from flowering to grain filling (H2) and foliar applied selenium during 2015-16
177
4.3.16 (c)
Correlation analyses showing strength of association among recorded attributes of wheat under heat from flowering to grain filling (H2) and foliar applied selenium during 2016-17
178
4.3.16 (d)
Correlation analyses showing strength of association among recorded attributes of wheat under heat from flowering to grain filling (H2) and foliar applied selenium during 2016-17
179
LIST OF FIGURES
XIV

Figure Title Page
4.2.1 Regression analysis for effect of foliar applied potassium on grains per spike of heat stressed wheat 58
4.2.2 Regression analysis for effect of foliar applied potassium on 1000-grain weight and grain yield of heat stressed wheat 60
4.2.3 Regression analysis for effect of foliar applied potassium on biological yield and harvest index of heat stressed wheat 65
4.2.4 Regression analysis for effect of foliar applied potassium on straw yield and plant height of heat stressed wheat 67
4.2.5 Regression analysis for effect of foliar applied potassium on spike length and spikelets per spike of heat stressed wheat 72
4.2.6 Regression analysis for effect of foliar applied potassium on grain filling rate and grain filling duration of heat stressed wheat 74
4.2.7 Regression analysis for effect of foliar applied potassium on chlorophyll a and chlorophyll b contents of heat stressed wheat 80
4.2.8 Regression analysis for effect of foliar applied potassium on superoxide dismutase and peroxidase contents of heat stressed wheat 82
4.2.9 Regression analysis for effect of foliar applied potassium on catalase and total phenolic contents of heat stressed wheat 84
4.2.10 Regression analysis for effect of foliar applied potassium on leaf proline and glycine betaine of heat stressed wheat 90
4.2.11 Regression analysis for effect of foliar applied potassium on total soluble proteins and malondialdehyde of heat stressed wheat 92
4.2.12 Regression analysis for effect of foliar applied potassium on osmotic and water potential of heat stressed wheat 97
4.2.13 Regression analysis for effect of foliar applied potassium on turgor potential and shoot potassium contents of heat stressed wheat 99
4.2.14 Regression analysis for effect of foliar applied potassium on grain crude proteins of heat stressed wheat 101
4.3.1 Regression analysis for effect of foliar applied selenium on grains per spike of heat stressed wheat 121
4.3.2 Regression analysis for effect of foliar applied selenium on 1000-grain weight and grain yield of heat stressed wheat 123
4.3.3 Regression analysis for effect of foliar applied selenium on biological yield and harvest index of heat stressed wheat 129
4.3.4 Regression analysis for effect of foliar applied selenium on straw yield and plant height of heat stressed wheat 131
4.3.5 Regression analysis for effect of foliar applied selenium on spike length and spikelets per spike of heat stressed wheat 136
4.3.6 Regression analysis for effect of foliar applied selenium on grain filling rate and grain filling duration of heat stressed wheat 138
4.3.7 Regression analysis for effect of foliar applied selenium on chlorophyll a and on chlorophyll b contents of heat stressed wheat 144
4.3.8 Regression analysis for effect of foliar applied selenium on superoxide dismutase and peroxidase contents of heat stressed wheat 146
4.3.9 Regression analysis for effect of foliar applied selenium on catalase and total phenolic contents of heat stressed wheat 148
Figure Title Page
XV

4.3.10 Regression analysis for effect of foliar applied selenium on leaf proline and glycine betaine contents of heat stressed wheat 155
4.3.11Regression analysis for effect of foliar applied selenium on total soluble proteins and malondialdehyde contents of heat stressed wheat
157
4.3.12 Regression analysis for effect of foliar applied selenium on osmotic and water potential of heat stressed wheat 163
4.3.13 Regression analysis for effect of foliar applied selenium on turgor potential and grain crude protein contents of heat stressed wheat 165
XVI

ABSTRACTCoincidence of high temperature at the terminal phenological stages of the wheat crop is a prime constraint to reach full yield potential in Pakistan. The present research work was conducted to determine the thermo-sensitivity of Pakistani wheat genotypes and alleviation of negative implications of heat through exogenous application of potassium and selenium. All research work was performed at the Agronomic Research Area, University of Agriculture Faisalabad, Pakistan from November 2014 to May 2017. In the first year, wheat genotypes were screened for terminal heat tolerance under field conditions. The experiment was laid out in a Randomized Complete Block Design (RCBD) in a split plot arrangement and was replicated 4 times. Treatments were comprised of heat stress in main plots viz. H0 = no heat imposition; H1 = Heat imposition from complete emergence of spike to grain filling initiation (Feekes Scale = 10.50 to 11.00) and wheat genotypes in sub plots viz. Punjab-2011, AARI-2011, Galaxy-2013, Millat-2011, Aas-2011, Fareed-2006, Chakwal-50, Mairaj-2008, Pakistan-2013, NIBGE-NIAB-1 and Kohistan-97. Imposition of heat stress deleteriously impacted the metabolism of all genotypes. The synthesis of antioxidants and osmo-protectants were enhanced in genotypes ‘AAS-2011, Chakwal-50 and Mairaj-2008’ under the high temperature environment compared to ‘no heat stress’. While, in all other genotypes biosynthesis of antioxidants and osmo-protectants was suppressed under heat compared to control. Likewise, adverse impacts of heat on spike growth, stay green trait, grain yield and yield components were relatively lesser in genotypes ‘AAS-2011, Chakwal-50 and Mairaj-2008’ than other genotypes. Statistically similar and relatively more grain yields compared to other genotypes were recorded for ‘Aas-2011’ (3.71 t ha-1), ‘Chakwal-50 (3.36 t ha-1) and ‘Mairaj-2008 (3.04 t ha-1) under heat stress. In the second year, two independent field experiments were conducted with the objective of mitigating heat stress using potassium and selenium as beneficial nutrients. The experimental design for both experiments was randomized complete block design (RCBD) with split plot arrangement having three replications. In both experiments, the main plot factor was comprised of three heat stress treatments viz. H0 = No heat imposition; H1 = Heat stress imposition from complete emergence of spike to grain filling initiation (Feekes scale = 10.50 to 11.0); H2 = Heat stress imposition from flowering initiation to grain filling initiation (Feekes scale = 10.5.1 to 11.0). In the second experiment, potassium was supplied via foliar application in sub plots at K0 = Control/ water spray; K15 = 15 g L-1; K30 = 30 g L-1; K45 = 45 g L-1 and K60
= 60 g L-1 to mitigate heat stress. In the third experiment, selenium was foliar applied at Se0 = Control/ water spray; Se25 = 25 mg L-1; Se50 = 50 mg L-1; Se75 = 75 mg L-1 and Se100 = 100 mg L-1 to alleviate heat stress. During the third year, heat stress mitigating experiments were repeated as described in the second year. Negative implications of heat were more pronounced under ‘heat from spike to grain filling’ compared to ‘heat from flowering to grain filling’. Grain yield in second experiment was decreased by 42-45% under ‘heat from spike to grain filling’ and 25-31% under ‘heat from flowering to grain filling’ compared to ‘no heat stress’. While, in third experiment, ‘heat from spike to grain filling’ and ‘heat from flowering to grain filling’ caused decrease in grain yield compared to ‘no heat stress’ by 43-44% and 33-36%, respectively. Whereas, varying concentrations of foliar potassium and selenium differed significantly from each other and remarkably improved response variables compared to control/water spray. Application of potassium at 45 and 60 g L-1 and selenium at 75 and 100 mg L-1 depicted statistically similar and relatively more grain yield, yield components, spike growth attributes, chlorophyll content and quality attributes compared to other concentrations under all treatments of heat stress. Likewise, statistically alike and comparatively more

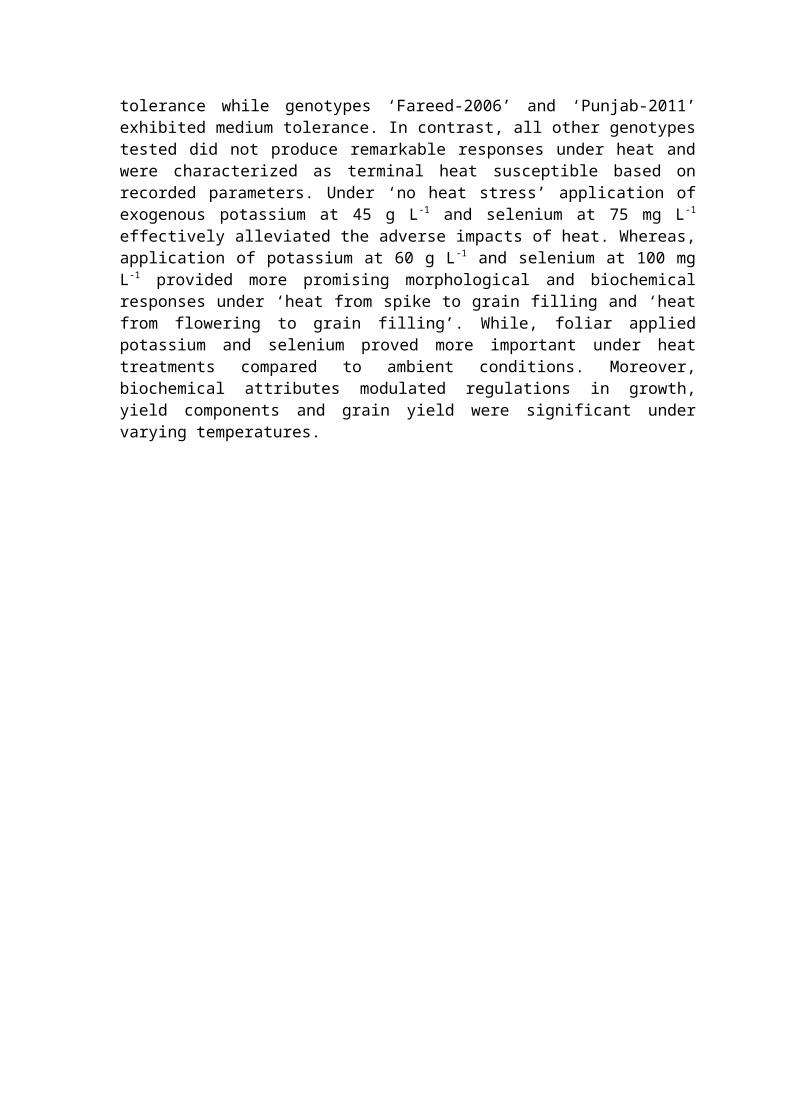
antioxidants, osmo-protectants and water relations attributes and statistically similar and relatively lesser malondialdehyde were observed with 45 and 60 g L -1 foliar potassium and 75 and 100 mg L-1 foliar selenium under ‘no heat stress’. However, application of 60 g L-1 potassium and 100 mg L-1 selenium showed significantly more antioxidants, osmo-protectants and water relations attributes and significantly lesser malondialdehyde under ‘heat from spike to grain filling’ and ‘heat from flowering to grain filling’. Conclusively, genotypes ‘AAS-2011, Chakwal-50 and Mairaj-2008’ displayed terminal heat tolerance while genotypes ‘Fareed-2006’ and ‘Punjab-2011’ exhibited medium tolerance. In contrast, all other genotypes tested did not produce remarkable responses under heat and were characterized as terminal heat susceptible based on recorded parameters. Under ‘no heat stress’ application of exogenous potassium at 45 g L-1 and selenium at 75 mg L-1
effectively alleviated the adverse impacts of heat. Whereas, application of potassium at 60 g L-1 and selenium at 100 mg L-1 provided more promising morphological and biochemical responses under ‘heat from spike to grain filling and ‘heat from flowering to grain filling’. While, foliar applied potassium and selenium proved more important under heat treatments compared to ambient conditions. Moreover, biochemical attributes modulated regulations in growth, yield components and grain yield were significant under varying temperatures.
INTRODUCTION CHAPTER-1
Wheat is extensively grown all over the world and is an important source of starch
and protein for humans (Ang and Fredriksson, 2017). Wheat is cultivated on more than
218 million hectares with 743 million tons annual production around the globe (FAO,
2017). The share of wheat in value addition in agriculture is 9.6% while it supplements
1.9% in gross domestic product of Pakistan. Its area of cultivation is 9. 052 million
hectares and production is 25.75 million tons (Govt. of Pakistan, 2017). Each 100 g
serving of wheat provides 247 calories, 58-62 g bioavailable carbohydrates, 12-13 g
proteins, 1.8 g lipids, 13-14 g fiber and 1.7 g minerals (400 mg sodium, 248 mg
potassium). Besides, 1 kg wheat of grains also provide 4.6-5.0 mg vitamin-B1 (thiamine),
0.9-1.2 mg vitamin-B2 (riboflavin), 51-55 mg nicotinamide, 12-13 mg pantothenic acid,
2.7-3.0 mg vitamin-B6 and 41 mg tocopherols (Koehler and Wieser, 2013).
Productivity of wheat in Pakistan is lagging far behind than the potential owing to
numerous factors. Different factors that are responsible for low productivity of wheat in
Pakistan are delayed soil preparation after rice and cotton, late sowing, low input use
efficiency, unavailability of quality seed, fertilizers, irrigation water and terminal heat
stress (Rehman et al., 2015).
Heat stress at reproductive stages (terminal heat stress) of wheat is one of the chief
constraints hampering the full attainment of yield potential. The upper threshold
temperature above which terminal stages of wheat are deleteriously impacted is 26°C
(Shahid et al., 2017). Terminal heat stress might be a consequence of rapid
industrialization, deforestation, burning of fossil fuels, emission of chloro flouro carbons,
rapid changes in land utilization and injudicious use of synthetic fertilizers in agriculture
(Szymańska, 2017). In addition, the decline in rainfall over sub tropics including
Pakistan has further intensified extreme temperature events (Rahut and Ali, 2017).
Moreover, the rate of increase of temperature in the last decade (2000-2010) had been
2.2% higher than the rate of increase of temperature in previous 30 years (1970-2000)
(IPCC, 2014). While, late sowing of wheat in rice-wheat, cotton-wheat and hybrid
maize-wheat cropping systems leads to high temperature stress at reproductive stages of
wheat (Mumtaz et al., 2015).
Wheat is a C3 and temperate plant and therefore is very susceptible to high
temperature stress. High temperature stress at reproductive and grain filling stages of
1
wheat is called terminal heat stress (Alghabari et al., 2016). It is usually 10-15°C higher
temperature than ambient temperature (Dwivedi et al., 2017). It is anticipated to increase
in the near future due to global warming. Temperature will rise by 2.6-4.8°C during the
period of 2016-2035 (IPCC, 2014) while optimum temperature for reproductive stages of
wheat is 12-22°C (Dwivedi et al., 2017).
Damages due to high temperature stress depends on the duration of high
temperature, the magnitude of rise of temperature and the rate of increase in temperature
(Prasad et al., 2017). Temperature may rise slowly, rapidly or in cyclic pattern (increases
during day while decreases during night). Cyclic increase is the most damaging while
slow rise of temperature is the least damaging for wheat productivity (Rezaei et al.,
2015).
The temperature optima for spikelet, anthesis and grain filling for wheat are 12, 23
and 21ºC, respectively (Innes et al., 2015). According to a previous assessment, an
increase of 1ºC during the growing season declines grain yield by 3-17% in Pakistan and
India (Mondal et al., 2013).
High temperature stress reduces wheat productivity by dehydration, pollen
sterility, shortening of phenology, decreased CO2 assimilation, increased photorespiration
and decreased growth rate (Altenbach, 2012). Under heat stress, photosynthesis is the
most sensitive process. High temperature dissociates oxygen evolving complex of PS-II
and initiates photorespiration (Mathur et al., 2014).
Chlorophyll enzymatic activity is also disturbed at higher temperature. Activity of
adenosine diphosphate glucose pyro phosphatase (ADPG-PPase) is particularly reduced.
It downregulates the synthesis of starch (Dwivedi et al., 2017). Diurnal fluctuations of
temperature are more damaging to promote senescence (Laza et al., 2015).
Grain growth and development is also affected at higher temperature. Spike
initiation stage is the most sensitive stage to high temperature as at this stage ridges
development on spike rachis takes place. The number of ridges determines the number of
spikelets in the spike (Iqbal et al., 2017).
Under heat stress excessive generation of reactive oxygen species (ROS)
overcome scavenging mechanisms. Excessive ROS results in increased membrane
damages, lipid peroxidation, protein carbonylation and damage to DNA by insertion,
deletion, mutation and affecting nitrogen bases of DNA. High temperature stress
increases superoxide radical (O2●-) while hydrogen peroxide (H2O2) generation also rises
above normal level. Other ROS that are excessively produced and aggravate lipid
2

peroxidation at sub cellular level are singlet oxygen (1O2*) and hydroxyl radical (OH●-)
(Czégény et al., 2016).
To manage heat stress different strategies are available. These are breeding for
heat stress tolerance and selection of tolerant genotypes (Mondal et al., 2016). While,
agronomic management comprises of reduced tillage and stubble management, pre-
sowing heat treatment, manipulation of sowing time and foliar sprays of various
substances (Gouache et al., 2012).
Different types of compounds that can be foliar applied to mitigate heat stress
include osmo-protectants, osmolytes, inorganic salts, compatible solutes, signaling
molecules, plant growth regulators and oxidants (Farooq et al., 2011; Hu et al., 2016).
Foliar application of mineral nutrients is one of solutions to the problem. Exogenous
application of mineral nutrients augments tolerance against extreme temperature stresses
(Waraich et al., 2012).
Potassium (K) is the most important osmoticum in the plant cell cytosol. The
availability of K improves heat stress tolerance in plant. Potassium also helps the plant to
make osmotic adjustments as it is the safest osmoticum (Zahoor et al., 2017a). It is an
osmolyte and thus depresses the cellular water potential more than the apoplast. Net
movement of water takes place into cell that helping them to maintain turgor and creating
a favorable environment to maintain cellular enzymatic activities under heat stress (Jan
et al., 2017; Xiaokang et al., 2017).
Potassium maintains the electrical charge balance at site of ATP synthesis and
photophosphorylation remains continuous under stress conditions (Kanai et al., 2011).
Potassium activates ATP for utilization by H+-ATPase pumps. Hydrogen pump ATPases
exclude H+ out of the cell and create a favorable electrochemical gradient known as
proton motive force (Ahmad and Maathuis, 2014). Most nutrient uptake utilizes proton
motive force. Thus, K also helps in maintaining nutrient uptake under stressed conditions
(Anschütz et al., 2014).
Potassium enhances dry matter accumulation by maintaining activities of different
enzymes involved in starch and protein deposition. Exogenously applied potassium
enhances activation of RuBisCO, sucrose phosphate synthase, sucrose synthase and
soluble acid invertase under stressed environments. Increase in activities of these
enzymes escalates the sucrose and starch accumulation in reproductive and vegetative
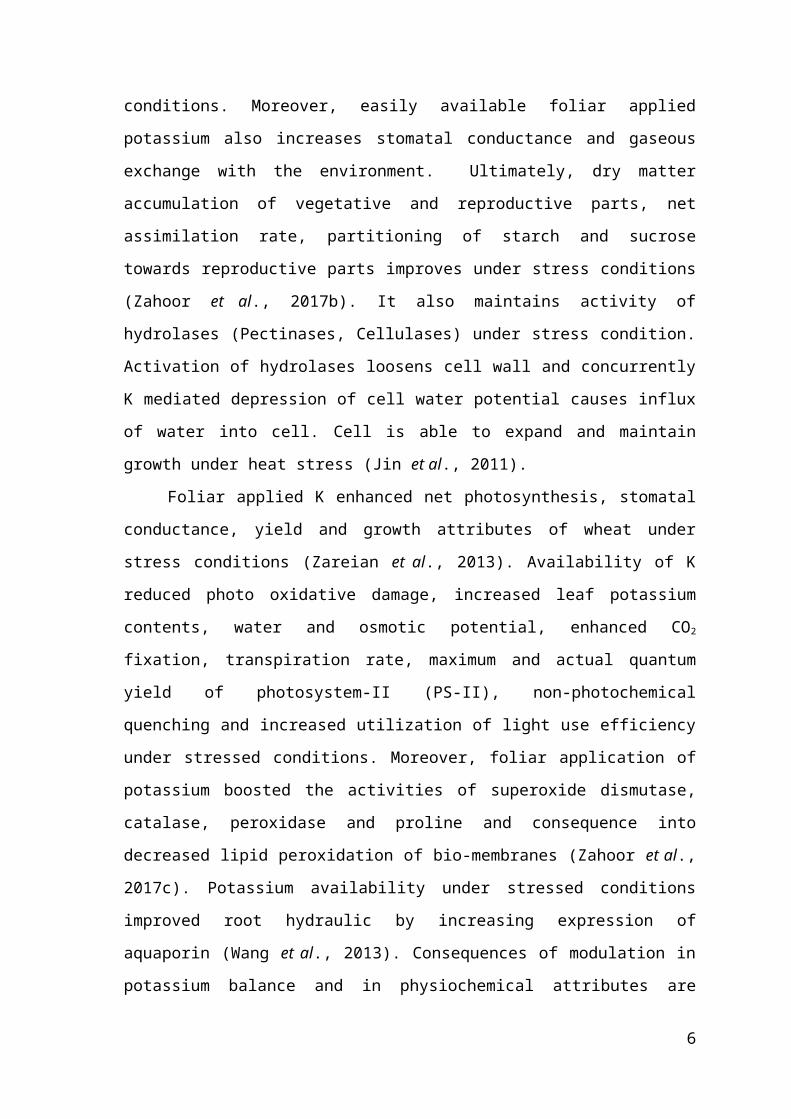
organs under abiotic stress conditions. Moreover, easily available foliar applied
potassium also increases stomatal conductance and gaseous exchange with the
3

environment. Ultimately, dry matter accumulation of vegetative and reproductive parts,
net assimilation rate, partitioning of starch and sucrose towards reproductive parts
improves under stress conditions (Zahoor et al., 2017b). It also maintains activity of
hydrolases (Pectinases, Cellulases) under stress condition. Activation of hydrolases
loosens cell wall and concurrently K mediated depression of cell water potential causes
influx of water into cell. Cell is able to expand and maintain growth under heat stress (Jin
et al., 2011).
Foliar applied K enhanced net photosynthesis, stomatal conductance, yield and
growth attributes of wheat under stress conditions (Zareian et al., 2013). Availability of
K reduced photo oxidative damage, increased leaf potassium contents, water and osmotic
potential, enhanced CO2 fixation, transpiration rate, maximum and actual quantum yield
of photosystem-II (PS-II), non-photochemical quenching and increased utilization of
light use efficiency under stressed conditions. Moreover, foliar application of potassium
boosted the activities of superoxide dismutase, catalase, peroxidase and proline and
consequence into decreased lipid peroxidation of bio-membranes (Zahoor et al., 2017c).
Potassium availability under stressed conditions improved root hydraulic by increasing
expression of aquaporin (Wang et al., 2013). Consequences of modulation in potassium
balance and in physiochemical attributes are improved growth and yield under stress
conditions. Availability of K reduced oxidative stress by reducing NADH oxidase
activity, K deficiency augmented O2●- generation and thus aggravated oxidative stress
(Jiménez-Quesada et al., 2016).
Selenium (Se) down regulates ROS production under stress by upregulating the
activity of antioxidants. It increases the activity of ascorbate peroxidase that is a key
enzyme in detoxification of H2O2. It upregulates activity of catalase and glutathione
peroxidase under heat stress (Cheng et al., 2016). Selenium compounds under heat stress
quench 1O2* and OH●-. It promotes stability of membranes as OH●- is most damaging for
lipid peroxidation and 1O2* causes mutation by reacting with nitrogen bases of DNA
(Feng et al., 2013). It accelerates the non-enzymatic detoxification of O2●- to H2O2 and
protects cellular membranes. Selenium also acts as an activator of glutathione
peroxidase, which detoxifies H2O2 (Huang et al., 2017).
In photosynthesis, elemental Se replaces sulfur from Fe-S cluster and reduces
ROS synthesis through regulation of electron flow. Selenium enhances PS-I ability to
produce reductants at the end of light reactions and promotes CO2 reduction under high
temperature stress (Gupta and Gupta, 2017). Selenium reduces damage to PS-II light
4

harvesting complex by excessive UV and high light intensity under heat stress (Feng et
al., 2013).
Exogenous application of Se augmented synthesis of catalase, superoxide
dismutase, peroxidase, glutathione and ascorbate reductase in wheat. Moreover, water
retention capability of tissues was also enhanced with foliar applied selenium under
stressed conditions over control in wheat (Nawaz et al., 2015). Improvement in
accumulation of proline under exogenous selenium resulted in detoxification of reactive
oxygen species and upregulated the biosynthesis of chlorophyll, total soluble sugars and
phenyl ammonia lyase contents under stressed conditions (Manaf, 2016). Exogenous Se
enhanced accumulation of ascorbate, carotenoids, anthocyanin, ascorbate peroxidase,
chlorophyll a, b and reduced malondialdehyde (MDA) in wheat under high temperature
stress (Iqbal et al., 2015). Selenium augmented antioxidant defense system under high
temperature by increasing synthesis of glutathione reductase, dehydro ascorbate
reductase and by maintaining high reducing power of NADH (Sieprawska et al., 2015).
Selenium at low concentration acts as reductant for ROS. At higher concentration, it
functions as pro antioxidant that improves signaling for upregulation of the antioxidant
defense system (Ahmad et al., 2016). Moreover, application of selenium increased
accumulation of anthocyanin, ascorbic acid, antioxidants and nutrients. Alleviation of
stress under Se application can be attributed to selenium mediated improvements in
redox buffering capacity of plant, phyto hormone regulations, antioxidant regeneration,
ROS scavenging and enhanced cell division (Shekari et al., 2015).
Selenium reduced protochlorophyllide oxidoreductase contents, enhanced
activities of starch biosynthesis enzymes and maintained normal function and shape of
chloroplast (Kaur et al., 2014). Selenium improved the staygreen trait and maintained
carbohydrates supply for longer duration of time (Haghighi et al., 2015). Selenium
mediated synthesis of chlorophyll a and b, increased stomatal conductance, transpiration
rate and exchange of gases with atmosphere under heat stress (Mora et al., 2015).
Different wheat cultivars depict assortment and heterogeneity in response to high
temperature (Siebert and Ewert, 2014). Furthermore, numerous quantitative trait loci
exist for a single targeted trait having complex inheritance pattern (Mwadzingeni et al.,
2016). Therefore, selection of polygenic target traits can be accomplished indirectly
employing biochemical markers closely related to heat tolerance (Sadat et al., 2013).
Likewise, diversity among wheat cultivars combined with polyploidy and genes
profusion makes it challenge to select a suitable genotype using morphological traits
5
under high-temperature environment (Dube et al., 2016). Selection of wheat genotypes
merely on the basis of morphological traits often leads to faulty inferences (Reynolds and
Langridge, 2016). While, physiochemical markers assisted screening of genotypes
depicts higher efficacy of selection than mere morphological markers-based selection for
polygenic traits (Sadat et al., 2013).
Previous experiments were mainly comprised of heat imposition under controlled
environments of glasshouse. Although, studies regarding manipulation of sowing dates
are abundantly available to observe adverse effects of high temperature. Relatively little
information is available regarding the imposition of heat stress under field conditions.
Moreover, studying potassium and selenium mediated transformations in biochemical
attributes in correlation with morphological traits might prove advantageous for
agronomic management of heat stress. Information regarding the correlation of
biochemical attributes with growth and yield parameters at terminal stages predisposed to
heat are also scarce. Moreover, most of previous studies quantified biochemical attributes
only at seedling stages without considering yield and other phenotypic traits at terminal
stages.
In this context, a compendious understanding and boost of biochemical
mechanisms using exogenous potassium and selenium is indispensable to induce heat
tolerance. Moreover, distinctive biochemical response of varying heat stressed terminal
pheno-stages leads us to a closer inspection of the problem and its management through
exogenous potassium and selenium. Since, improvements in physiochemical traits might
prove a potent tool to alleviate adversities on morphological attributes of wheat crop.
Hence, elucidation of biochemical attributes in correlation with grain growth and yield
will improve the efficacy of agronomic management of terminal heat.
It can be inferred that terminal heat stress in wheat badly impacts various growth,
yield, biochemical and physiological attributes. As a consequence of negative
implications of high temperature stress grain shriveling takes place under agro-
climatological conditions of Pakistan. It reduces yield of wheat each year by sudden rises
in temperature and increases the costs of wheat production. It is the hour of need to
manage heat stress by devising strategies that are economical, everlasting and alleviate
heat stress effectively. Foliar applied K and Se may have potential to regulate various
physiological, biochemical, growth and yield related processes under high temperature
stress.
Objectives
6

The study was conducted with the following objectives
1- Screening of Pakistani wheat genotypes for tolerance to terminal heat
2- Studying the comparative vulnerability of terminal phenological stages of wheat to
high temperature
3- Exploring the morphological responses of wheat in relation to physiochemical
perturbations under varying temperatures
4- Optimizing foliar potassium (K) and selenium (Se) to alleviate negative impacts of
terminal heat in wheat
7

REVIEW OF LITERATURE CHAPTER-2
Wheat is among the widest grown cereals around the globe. Wheat chip in 21% to
the world’s calorie intake and is grown on an area of 221 million-hectare worlds widely
(Tao et al., 2015). Food security in Pakistan is affiliated with wheat production and
consumption. Increasing prevalence of extreme temperatures is becoming a limiting
factor for crop production specifically for cereals (Wang et al., 2015). Wheat production
under changing climate has been an arduous task (Trnka et al., 2014).
The increasing accumulation of greenhouse gases will further intensify warm
temperature together with the disturbance in water resources (Harris et al., 2015).
Excessive emission of carbon dioxide from burning of fuels has increased the frequency
of heat waves on wheat (Fernando et al., 2014). Carbon dioxide and other greenhouse
gases are expected to increase by 50% of the current concentrations in atmosphere by
2050 due to incessant increasing demands for energy (OECD, 2012). Late sowing of
wheat is one of the major reasons leading to grain shriveling in wheat by the abrupt rise
of temperature during grain filling (Ihsan et al., 2016).
Heat stress negatively influences innumerable plant processes. High temperature
increased catalytic activity of RuBisCO while its affinity for CO2 was decreased. Oxygen
solubility into mesophyll cells of wheat was little affected while CO2 solubility decreased
at higher temperature (Mathur et al., 2014). RuBisCO started to act as an oxygenase
enzyme and photo respiration decreased yield. During photorespiration consumption of
ATPs using assimilated carbohydrates promoted grain shriveling. RuBisCO sensitivity to
higher temperature was more than any other enzyme in photosynthesis (Perez et al.,
2011). RuBisCO activase (RCA) enzyme removes inhibitory sugar phosphates from
active site of RuBisCO and makes it to react with CO2. At higher temperature, the
activity of RCA was also reduced as well as photosynthesis (Carmo-Silva et al., 2012).
Photosystem-II (PS-II) is more labile to higher temperature than Photosystem-I
(PS-I). Increase of temperature above 40°C disrupted light harvesting complex of PS-II
by separation of manganese (Mn) from the D1D2 complex (Ashraf and Harris, 2013). It
inhibited the photolysis of water at start of photosynthesis, so electron flow was
8

disturbed and generation of reductants at the end of light reaction for CO2 reduction were
also reduced. Rise of temperature further disrupted the plastoquinone in electron pool in
the transport chain of light reactions (Mathur et al., 2014).
High temperature stress reduced water potential and relative water content of
leaves (Hasanuzzaman et al., 2013). Heat stress promoted respiration and water loss from
leaves (Duan et al., 2017). Most species tend to close stomata and conserve water rather
than regulation of temperature by transpiration. It impaired gaseous exchange with the
atmosphere, thus photosynthesis was negatively affected (Marias et al., 2017).
The rise in temperature caused a rapid grain filling rate and reduced the duration
of grain filling. The increased rate of grain filling could not compensate for the decreased
duration of grain filling as assimilate partitioning towards the grain was less leading to
the consequence of grain shriveling (Barlow et al., 2015).
Temperature above 30°C caused completely infertile pollen grains and reduced
the size of ovaries. Reduced size of ovaries was due to reduced activity of the acid
invertase enzyme and partitioning of carbohydrates towards reproductive organs. Acid
invertase governs the upper limit of sink size, so small sized grains were produced at
high temperature stress (Dwivedi et al., 2017). Grain size was reduced due to shortening
of phenology between anthesis and physiological maturity of grains (Hatfield and
Prueger, 2015). Changes in the aleuron layer around the endosperm of wheat grains
decreased starch deposition due to different enzymes involved in starch assimilation in
endosperm (Iqbal et al., 2017).
Temperatures greater than 25°C at grain filling stages reduced activity of starch
synthase, granule bound starch synthase, sucrose fructosyltransferase, fructan
fructosyltransferase and sucrose synthase. Reduced sucrose synthase activity dwindled
phloem sucrose loading (Dwivedi et al., 2017). Diminished translocation of
carbohydrates towards grain caused assimilate accumulation in the phloem that
introduced a feedback mechanism to down regulate photosynthesis (Wang et al., 2012).
Different wheat cultivars display an assortment and heterogeneity in response
towards high temperature (Siebert and Ewert, 2014). Diversity among wheat cultivars
combined with polyploidy and genes profusion makes it challenging to select suitable
genotypes under high temperature environment. Therefore, phenological and
biochemical markers assisted screening of wheat cultivars increases cultivar selection
efficacy (Sharma et al., 2014a).
9

Moreover, different management strategies are available to alleviate the adversity
of heat stress in wheat. Soil application of minerals is an energy consuming process
regarding plant metabolism. Most nutrients are taken up through secondary active
transport that requires ATP. Plants under stress conditions with activated defense
mechanisms are not able to extract nutrients from soil solution (Ma et al., 2017). Foliar
application can resolve this problem under these hostile conditions of heat stress. Foliar
applied nutrients are taken through diffusion that is driven by concentration gradient of
nutrient across leaf epicuticular waxes (Wasaya et al., 2017).
Different agronomic strategies that can alleviate heat stress are water
conservation, conservation tillage practices and timely sowing of crops (Farooq et al.,
2011). Early sowing of wheat in different cropping systems may allow the wheat to
escape from terminal heat stress (Suryavanshi and Buttar, 2016). Different foliar sprays
i.e. compatible solutes, signaling molecules, plant growth substances and osmolytes
enhance tolerance against heat stress. Application of mineral nutrients helps to mitigate
high temperature stress in wheat. Nitrogen, phosphorous, potassium, zinc and boron are
important in this regard (Hemantaranjan et al., 2014).
Foliar application of potassium (K) and selenium (Se) assists the plant to
acclimatize under heat stress by regulation of various biochemical processes. Potassium
regulates stomatal opening and closing under heat stress and aids the plant in gas
exchange with the atmosphere. Thus, plants are able to uphold sufficient CO2 for
RubisCO to act as carboxylase enzyme under heat stress (Wang et al., 2013; Nawaz et
al., 2015).
Potassium mediated activation of ATP proved helpful for phloem sucrose loading
and unloading. It sustained assimilate partitioning towards grain under heat stress
(Marschner, 2012). Potassium diminished diffusible resistance of CO2 into leaf
mesophyll by stomatal regulation that made RuBisCO to act as carboxylase enzyme and
photorespiration was reduced (Jan et al., 2017).
Potassium enabled plants to make osmotic adjustments under heat stress by
promoting accumulation of proline and glycine betaine. Proline acts as an
osmoprotectant and alternate electron donor to PS-I and PS-II activity when photolysis of
water was lessened at higher temperature (Hayat et al., 2012). Potassium declined
malondialdehyde production under stressed conditions, which is an indication of
membrane stability (Oosterhuis et al., 2013). Potassium enhanced activity of catalase that
is involved in detoxification of excessive H2O2 produced under heat stress (Ahmad et al.,
10

2016). Glycine betaine is a quaternary nitrogen compound, its accumulation was
enhanced in presence of K as K is involved in activation of nitrate reductase and
glutamine synthase. Glycine betaine also protects membranes from ROS damage under
heat stress. Application of potassium improved glycine betaine accumulation,
chlorophyll contents and yield related attributes of wheat under stress (Raza et al., 2014).
Potassium improved growth and photosynthetic rate by regulating stomatal movement
under stress conditions (Ahmad et al., 2014). Potassium application under stressed
conditions enhanced dry matter content and relative leaf water content over control
(Zahoor et al., 2017b).
Potassium enhanced grain quality by improving protein contents as well as protein
quality (Zorb et al., 2014). Potassium is involved in each step of protein synthesis from
nitrogen uptake by secondary active transport, activation of nitrate reductase, glutamine
synthase, reading of genetic codes and binding of tRNA to ribosomes at ribosomal site of
protein synthesis (Sharma et al., 2013).
Exogenous application of Se is more effective for improving plant selenium
contents than soil application (Nawaz et al., 2014). Selenium is a beneficial element, but
non-essential for growth. It improved relative water contents and water potential of cell
under stress condition. Starch deposition in grain was increased under selenium
application in high temperature environment (Malik et al., 2012). Selenium delayed the
senescence and improved stay green trait under high UV light stress. Application of
selenium improved δ- aminolevulinic acid dehydratase and porphobilinogin deaminase.
These enzymes promoted chlorophyll biosynthesis under heat stress. Selenium
application reduced protochlorophyllide oxidoreductase activity. Protochlorophyllide
oxidoreductase converts protochlorophyllide (precursor of chlorophyll biosynthesis) to
chlorophyllide (inactive chlorophyll), thus hindered chlorophyll deprivation in wheat
(Yao et al., 2011). Selenium enhanced chlorophyll biosynthesis and reduced degradation.
Maintenance of high chlorophyll content under high intensity of UV improved the
staygreen trait. In addition, it maintained carbohydrate synthesis in high temperature
environment (Yildiztugay et al., 2017).
Selenium assimilation boosted synthesis of glutathione reductase (GSH). It
detoxified H2O2 and upgraded antioxidant defense mechanism of plant (Mehdi et al.,
2013). Application of Se reduced oxidative stress by slowing down the synthesis of O2●-
and enhancing detoxification of H2O2 (Feng et al., 2013). Selenium improved superoxide
dismutase activity in heat stressed wheat and alleviated oxidative stress significantly as
11
compared to controls (Tedeschini et al., 2015). Selenium declined the reduction of
tocopherol under stress conditions that improved glutathione peroxidase activity
(Klusonova et al., 2015). Foliar application of Se improved uptake of Na, Fe, Ca and Zn.
Increased antioxidant activity under heat stress might be due to enhanced uptake of
micronutrients that act as cofactor for activation of enzymatic antioxidants (Nawaz et al.,
2015).
Selenium enhanced non-enzymatic dismutation of O2●- to H2O2. Selenium
mediated synthesis of proteins act as reductants, which promoted non-enzymatic
dismutation of O2●- (Kaur et al., 2014). Together with non-enzymatic dismutation of O2
●-,
Se also enhanced activity of superoxide dismutase. Different enzymes that are involved
in detoxification of ROS are dehydro-ascorbate reductase, mono-dehydro-ascorbate
reductase and glutathione reductase. For activation of these enzymes reductants are
required. Selenium compounds-maintained reductants for activity of these enzymes
(Nawaz et al., 2015).
Selenium improved PS-II stability of heat stressed wheat crop by regulating
multiple processes. These processes include decreased excitation energy of PS-II, light
absorption by antenna molecules, electron flux, energy quanta of PS-II and impairment
of oxygen evolving complex (Labanowska et al., 2012). Selenium augmented cell
membrane stability by increasing lipid to protein ratio and degree of unsaturation of
lipids under stressed conditions (Feng et al., 2014). Selenium is useful to reduce lipid
peroxidation of membranes as it reduces malondialdehyde production under stress
conditions (Jiang et al., 2017). Selenium promoted lipid unsaturation and breaks ROS
chain to reduce oxidative stress (Malik et al., 2012).
Application of Se improved starch accumulation and the stay green trait under UV
light stress (Mostafa and Hassan, 2015). Selenium enhanced water uptake by roots under
stressed conditions (Nawaz et al., 2014). Application of Se enhanced total soluble sugars,
antioxidant activities, chlorophyll contents and yield in wheat under stressed conditions
(Nawaz et al., 2015). Application of Se enhanced biosynthesis of chlorophyll,
carotenoids and improved yield (Dong et al., 2013). Selenium alleviated oxidative stress
by enhancing super oxide dismutase, catalase, glutathione peroxidase, ascorbate and
tocopherol activities under stressed conditions (Lin et al., 2012). Selenium improved
phenolic contents in stressed wheat by boosting phenylalanine ammonia lyase activity
(Iqbal et al., 2015).
12
Furthermore, existence of numerous quantitative trait loci for a single targeted
trait depicted complex inheritance pattern (Mwadzingeni et al., 2016). Hence, selection
of wheat genotypes merely based on response of morphological traits often leads to
faulty inferences (Reynolds and Langridge, 2016). While, biochemical markers assisted
selection of genotypes exhibited more efficacy of selection than mere morphological
markers-based selection for polygenic traits. Selection of genotypes using morphological
attributes leads to poor selection efficacy studies (Jacoby et al., 2016). Selection of
genotypes on basis of biochemical attributes in association to morphological attributes is
lacking in previous experimentation.
The crux of the issues is that, high temperature negatively affects innumerable
physiological, growth and yield attributes of wheat. Minor variations in ambient
temperature affect physiochemical attributes of wheat crop. While, availability of
potassium and selenium improves biochemical attributes that ultimately confer heat
tolerance at morphological level. However, heat mediated changes and potassium and
selenium triggered regulations in physiochemical attributes are not disclosed copiously
so far. Moreover, data regarding potassium and selenium instigated regulations in
physiochemical attributes of terminal heat stressed wheat are scarce. Hence, elucidation
of thermo-tolerance at biochemical level is crucial for food security since improvements
in biochemical attributes confer tolerance in growth and yield components. In addition,
better understanding of the relation between biochemical attributes and yield components
of heat stressed wheat provides sound basis for agronomic management of heat stress.
Likewise, knowledge about heat caused deteriorations and potassium and selenium
trigged improvements in in grain quality is also scarce.
It can be hypothesized that different genotypes and terminal growth stages will
perform distinctly under high heat stress. While, varying concentrations of exogenous
potassium and selenium might prove a potent tool to alleviate adversities of heat at
biochemical and morphological level. Besides, foliar potassium and selenium instigated
biochemical regulations will confer tolerance in growth and yield components of heat
stressed wheat crop.
13

MATERIALS AND METHODS CHAPTER-3
The present research wok was carried out to alleviate deleterious impacts of
terminal heat stress on wheat. Three years of field-based experiments were performed to
accomplish this objective. For the 1st year (2014-15), wheat varieties were characterized
for heat tolerance and a medium heat tolerant wheat genotype was selected for further
experimentation. In the 2nd year (2015-16), two independent field experiments were
performed whereby heat stress was alleviated through exogenous spray of potassium in
one and selenium in other experiment. During the 3rd year (2016-17), the same
experiments were repeated as in 2015-16. Variables such as grain yield, yield
components, biomass accumulation, the stay green trait, antioxidants activities, osmo-
protectants water relations and quality attributes were used as potential indicators of
thermo-tolerance.
3.1. Experimental site
All research activities were carried out at Agronomic Research Area, University
of Agriculture Faisalabad Pakistan during the period of November 2014 to May 2017.
The site is located at latitude of 31°-26’N, longitude 73°-06’E and altitude of 184.4 m.
3.2. Physio-chemical analyses of soil
Soil samples were randomly taken from various points of the field at depths of 15
and 30 cm. Soil samples were mixed separately for the depths of 15 and 30 cm to record
electrical conductivity (Rhoades, 1996), pH (Thomas, 1996), organic matter (Moodie et
al., 1959), total nitrogen (Jackson, 1962), available phosphorous using 0.5 M sodium
bicarbonate (NaHCO3) as extraction solution (Kuo, 1996) and available potassium using
1 N ammonium acetate (NH4OAc) as extraction solution (Helmke and Sparks, 1996).
Textural class of experimental soil was loam (Table 3.1).
3.3. Weather elements
14

Data of different weather elements were collected from Meteorological
Observatory, University of Agriculture Faisalabad Pakistan during the growing season of
wheat. Data on average temperature, relative humidity, rainfall, pan evaporation, sunshine
duration, evapotranspiration and wind speed were recorded on daily basis and averaged
each month (Table 3.2).
3.4. Plant material
Numerous genotypes were collected from different institutes to determine thermo-
tolerance and sensitivity for ‘Experiment 1’.
15
Table 3.1: Physio-chemical analyses of experimental site during 2014-15, 2015-16 and 2016-17
Soil characteristics Depth of sample (cm)
Experiment I Experiment II Experiment III2014-15 2015-16 2016-17 2015-16 2016-17
Sand (%) 0-15 45 45 44 43 4615-30 43 44 43 45 44
Silt (%) 0-15 23 25 26 24 2215-30 24 26 28 25 24
Clay (%) 0-15 29 27 29 31 3315-30 28 26 28 29 31
Textural class 0-15 Loam Loam Loam Loam Loam15-30
EC (dS m-1) 0-15 2.06 2.10 1.99 2.01 1.9615-30 1.98 1.96 1.97 2.03 1.98
pH 0-15 7.7 7.5 7.6 7.8 7.915-30 7.6 7.8 7.9 7.7 7.8
Organic matter (g kg-1) 0-15 9.2 5.9 5.3 5.8 5.115-30 9.4 5.8 5.5 5.8 5.2
Total nitrogen (g kg-1) 0-15 0.44 0.46 0.45 0.46 0.4415-30 0.41 0.45 0.43 0.45 0.42
Available phosphorous (mg kg-1) 0-15 7.7 8.02 7.7 7.8 7.315-30 8.04 7.9 7.4 7.7 7.1
Available potassium (mg kg-1) 0-15 177 179 162 177 15915-30 165 176 159 177 155
Latitude = 31° - 26’N; Longitude = 73°- 06’E; Altitude = 184.4 m
16
Table 3.2: Monthly averages of weather elements during growing season of crop in 2014-15, 2015-16 and 2016-17
Weather elements Years November December January February March April MayAverage temperature (°C)
2014-15
18.9 12.2 11.7 16.5 19.1 27.0 31.8Relative humidity (%) 61.7 75.0 75.3 66.0 64.0 43.9 27.5Rainfall (mm) 10.0 0.0 12.2 20.5 67.9 32.8 17.0Pan evaporation (mm) 1.8 1.5 1.0 2.1 13.0 5.3 7.6Sunshine duration (hours) 7.6 4.7 5.0 5.6 4.9 9.1 10.4Evapotranspiration (mm) 1.5 1.3 0.7 1.8 2.8 3.7 5.3Wind speed (km h-1) 3.1 2.0 3.6 5.3 5.6 6.2 5.7Average temperature (°C)
2015-16
19.6 14.5 12.5 16.3 21.2 27.2 32.8Relative humidity (%) 61.5 62.6 74.4 58.1 59.7 34.2 28.8Rainfall (mm) 8.8 0.0 13.1 7.8 66.7 5.6 25.0Pan evaporation (mm) 2.4 1.9 3.5 2.3 2.7 6.1 9.5Sunshine duration (hours) 6.6 7.0 1.2 8.5 6.6 8.3 10.4Evapotranspiration (mm) 2.1 1.6 0.8 1.6 1.9 4.3 6.4Wind speed (km h-1) 2.6 2.3 27.6 3.8 4.7 5.2 5.4Average temperature (°C)
2016-17
20.1 16.4 12.9 16.8 23.7 29.3 33.5Relative humidity (%) 60.1 68.7 72.0 53.0 49.5 30.6 29.8Rainfall (mm) 0.0 0.0 11.5 4.1 16.2 28.3 10.1Pan evaporation (mm) 2.4 2.1 3.6 2.7 3.9 7.5 9.2Sunshine duration (hours) 6.4 6.7 1.3 6.6 7.2 9.2 10.4Evapotranspiration (mm) 1.8 1.7 0.9 1.9 2.7 5.2 5.7Wind speed (km h-1) 2.6 2.8 3.5 4.0 3.9 5.8 5.4
Latitude = 31° - 26’N; Longitude = 73°- 06’E; Altitude = 184.4 m
17

Table 3.3: Varying mean temperatures (°C) 2014-15 for experiment 1
Heat stress YearMarch
21
March
22
March
23
March
24
March
25
March
26
March
27
March
28
March
29
March
30
March
31
No heat stress (H0)2014-15
30.02 30.20 31.90 32.60 32.15 31.55 31.40 33.40 31.30 30.50 32.40
Heat from spike to grain filling (H1) 39.37 39.77 38.76 38.82 38.23 40.40 41.60 40.80 41.20 39.30 39.70
Latitude = 31° - 26’N; Longitude = 73°- 06’E; Altitude = 184.4 m
Table 3.4: Varying mean temperatures (°C) during heat imposition for experiment 2, 2015-16 and 2016-17
Heat stress YearMarc
h 1
March
2
Marc
h 3
Marc
h 4
Marc
h 5
Marc
h 6
Marc
h 7
March
8
Marc
h 9
March
10
Marc
h 11
Marc
h 12
March
13
Marc
h 14
No heat stress (H0)
2015-16
26.0 27.0 29.0 27.0 26.5 26.0 27.0 25.0 26.0 25.0 25.5 25.5 26.0 26.5
Heat from spike to grain filling (H1) 33.3 34.1 34.6 33.9 33.0 33.4 34.0 32.0 32.5 32.0 31.7 31.0 31.4 32.8
Heat from flowering to grain filling (H2) - - - - - - - 32.2 32.4 32.3 31.5 31.0 31.5 32.5
No heat stress (H0) 29.0 28.0 30.5 29.0 28.5 28.0 29.0 28.0 28.5 28.0 28.5 27.5 28.0 27.5
Heat from spike to grain filling (H1) 2016-17 35.1 34.0 36.8 35.2 34.3 34.0 36.2 35.4 36.0 35.9 34.2 34.0 35.3 34.6
Heat from flowering to grain filling (H2) - - - - - - - 35.1 36.3 36.0 34.5 34.3 35.2 34.5
Latitude = 31° - 26’N; Longitude = 73°- 06’E; Altitude = 184.4 m
18

Table 3.5: Varying mean temperatures (°C) during heat imposition for experiment 3, 2015-16 and 2016-17
Heat stress YearMarc
h 1
March
2
Marc
h 3
Marc
h 4
Marc
h 5
Marc
h 6
Marc
h 7
March
8
Marc
h 9
March
10
Marc
h 11
Marc
h 12
March
13
Marc
h 14
No heat stress (H0)
2015-16
26.0 27.0 29.0 27.0 26.5 26.0 27.0 25.0 26.0 25.0 25.5 25.5 26.0 26.5
Heat from spike to grain filling (H1) 32.9 34.3 34.2 33.3 32.8 33.1 34.6 32.6 32.1 32.3 31.3 31.4 31.8 33.0
Heat from flowering to grain filling (H2) - - - - - - - 32.6 32.7 32.1 31.8 31.3 31.4 32.7
No heat stress (H0) 29.0 28.0 30.5 29.0 28.5 28.0 29.0 28.0 28.5 28.0 28.5 27.5 28.0 27.5
Heat from spike to grain filling (H1) 2016-17 34.8 34.2 36.1 35.9 34.8 34.4 36.7 34.6 35.7 35.5 33.0 33.7 34.8 34.1
Heat from flowering to grain filling (H2) - - - - - - - 35.4 36.1 35.9 34.7 34.6 35.4 34.7
Latitude = 31° - 26’N; Longitude = 73°- 06’E; Altitude = 184.4 m
19

Plant material of genotypes ‘Aas-2011’ and ‘Fareed-2006’ was procured from
‘Regional Agriculture Research Institute Bahawalpur, Pakistan’. While, seeds of
genotypes ‘Mairaj-2008’, ‘AARI-2011’, ‘Punjab-2011’, ‘Millat-2011’ and ‘Galaxy-2013’
were obtained from ‘Ayub Agriculture Research Institute (AARI) Faisalabad, Pakistan’.
Whereas, seeds of genotype ‘Pakistan-2013’ were obtained from ‘National Agriculture
Research Center Islamabad, Pakistan’. Seeds of genotypes ‘Chakwal-50’ and ‘Kohistan-
97’ were procured from ‘University of Agriculture Faisalabad (UAF), Pakistan’. Plant
material of genotype ‘NIBGE-NIAB-1’ was procured from ‘Nuclear Institute for
Agriculture and Biology (NIAB) Faisalabad, Pakistan’.
3.5. Agronomic practices
Wheat was sown with the help of single row hand drill with R × R of 22.5 cm.
Seed was sown at the rate of 100 kg ha-1. During the 1st, 2nd and 3rd year, sowing was done
on 17th November 2014-15, 25th November 2015-16 and 29th November 2016-17,
respectively. Fertilizer was applied at the rate of 120:75:60 kg NPK ha-1 in ‘Experiment
1’. While, in ‘Experiment 2’ and ‘Experiment 3’ 120:75 kg NP ha -1 was applied. Half of
nitrogen fertilizer (urea) and all the phosphorus (SSP) and potash fertilizers (SOP) were
applied as basal dose. While, remaining half nitrogen fertilizer was applied with first
irrigation at crown root initiation. Fertilizers were band placed in inter row spaces with
the help of single row hand drill. Irrigations were applied at four critical growth stages
viz. crown root initiation, tillering, spike initiation and flowering. Two manual hoeings
were performed in all treatments to maintain weeds population below economic threshold
level; first after 40 days of sowing and second after 60 days of sowing.
3.6. 1st year (2014-15) trial
Experiment I: Biochemical markers assisted screening of wheat cultivars for
terminal heat stress tolerance
Treatments:
Factor A: Heat stress (Main plot)
H0 = No heat stress imposition (Plots without polythene sheet)
H1 = Heat stress imposition from complete emergence of spike to grain filling initiation
(early milk stage) (Feekes scale = 10.50 to 11.0)
Factor B: Varieties (Sub plot)
V1 = Punjab-2011
V2 = AARI-2011
V3 = Galaxy- 2013
20

V4 = Millat-2011
V5 = Aas-2011
V6 = Fareed-2006
V7 = Chakwal-50
V8 = Mairaj-2008
V9 = Pakistan-2013
V10 = NIBGE-NIAB-1
V11 = Kohistan-97
(a) Experimental design
Experiment was conducted using a Randomized Complete Block Design (RCBD)
with split plot arrangement having 4 replications. Heat stress was imposed in main plots
and genotypes were randomized in sub plots. Gross plot size of each experimental unit
was 3.0 m × 1.35 m.
(b) Imposition of heat stress
Five plants were randomly selected and tagged in each plot to notice for 50%
‘complete emergence of spike’ and ‘grain filling initiation’. Heat stress was imposed
when 50% of plants reached the ‘complete emergence of spike’ and removed when 50%
of plants had achieved ‘grain filling initiation’ growth stage. The heat stressed main plot
was covered with transparent polythene sheet from complete emergence of spike to grain
filling initiation (Feekes Scale= 10.50 to 11.0) (Javed et al., 2014; Kamal et al., 2017;
Shahid et al., 2017). Whereas, control (no heat stress) plots were left in ambient
environment. Relative humidity under polythene sheet was maintained as in ambient
conditions by making large number of small sized holes in the polythene sheet.
Temperature of heat stress and control/no heat stress main plots was recorded three times
a day (morning, noon and evening) and averaged. Temperature was recorded with the
help of digital temperature and humidity probe (Digital Multimeter-50302). Comparative
temperatures under ‘no heat stress’ and ‘heat from spike to grain filling’ are given as
tabulated form (Table 3.3). Leaves were collected randomly from each experimental unit
1 day after removing stress, stored in liquid nitrogen and processed to record various
biochemical response variables.
(c) Parameters recorded
Yield components and grain yield
1. Number of fertile tillers per m2
2. Number of grains per spike
21
3. 1000-grain weight (g)
4. Grain yield (t ha-1)
Growth of spike
1. Grain filling rate (g per day) (Hunt, 1978)
2. Grain filling duration (days) (Hunt, 1978)
Stay green and antioxidants
1. Chlorophyll a contents (mg g-1 FW) (Arnon, 1949)
2. Chlorophyll b contents (mg g-1 FW) (Arnon, 1949)
3. Superoxide dismutase (U mg-1 protein) (Giannopolitis and Ries, 1977)
4. Peroxidase (U mg-1 protein) (Liu et al., 2009)
5. Catalase (U mg-1 protein) (Liu et al., 2009)
6. Total phenolic contents (mg GAE g-1) (Ainsworth and Gillespie, 2007)
Osmo-protectants and lipid peroxidation
1. Proline (µmol g-1) (Bate et al., 1973)
2. Glycine betaine (µmol g-1) (Grieve and Grattan, 1983)
3. Total soluble proteins (mg g-1) (Bradford, 1976)
4. Malondialdehyde contents (µmol g-1) (Cakmak and Horst, 1991)
(d) Statistical analysis
Data of recorded attributes were analyzed statistically (p ≤ 0.05) using the Fisher’s
analysis of variance technique (Steel et al., 1997) and Tukey’s Honestly Significant
Difference (Tukey’s HSD) test was employed to compare the means of different
genotypes at 5% probability level. While type and strength of relationship among the
recorded parameters was determined calculating correlation among these parameters
using STATISTIX 8.1 software (Gomez and Gomez, 1984).
A medium heat tolerant genotype (Punjab-2011) was selected on the basis of
recorded parameters and used in further experimentation (Van Esbroeck et al., 1998; Van
Deynze et al., 2009; Conaty et al., 2012).
3.7. 2nd year (2015-16) trials
Experiment II: Exploring role of foliar applied potassium to induce terminal heat
stress tolerance in wheat
Treatments:
Factor A: Heat stress (Main plot)
H0 = No heat imposition (Plots without polythene sheet)
22
H1 = Heat stress imposition from complete emergence of spike to grain filling initiation
(early milk stage) (Feekes scale = 10.50 to 11.0)
H2 = Heat stress imposition from flowering initiation to grain filling initiation (early milk
stage) (Feekes scale = 10.5.1 to 11.0)
Heat stress was imposed by covering the plots with perforated, transparent polythene
sheet (Javed et al., 2014; Kamal et al., 2014; Shahid et al., 2017).
Factor B: Potassium foliar application (subplot)
K0 = Control (0 kg K ha-1)
K15 = 15 g L-1 (4.5 kg K ha-1)
K30 = 30 g L-1 (9 kg K ha-1)
K45 = 45 g L-1 (13.5 kg K ha-1)
K60 = 60 g L-1 (18 kg K ha-1)
Experiment III: Alleviation of terminal heat stress in wheat through foliar
application of selenium
Treatments:
Factor A: Heat stress (Main plot)
H0 = No heat imposition (Plots without polythene sheet)
H1 = Heat stress imposition from complete emergence of spike to grain filling initiation
(early milk stage) (Feekes scale = 10.50 to 11.0)
H2 = Heat stress imposition from flowering initiation to grain filling initiation (early milk
stage) (Feekes scale = 10.5.1 to 11.0)
Heat stress was imposed by covering the plots with perforated, transparent polythene
sheet (Javed et al., 2014; Kamal et al., 2017; Shahid et al., 2017).
Factor B: Selenium foliar application (subplot)
Se0 = Control (0 g Se ha-1)
Se25 = 25 mg L-1 (7.5 g Se ha-1)
Se50 = 50 mg L-1 (15 g Se ha-1)
Se75 = 75 mg L-1 (22.5 g Se ha-1)
Se100 = 100 mg L-1 (30 g Se ha-1)
3.8. 3rd year (2016-17) trials
Experiment II and experiment III were repeated as in 2015-16.
(a) Experimental design
Both the experiments were laid out in Randomized Complete Block Design
(RCBD) with split plot treatments arrangement in 3 blocks. Heat was imposed in main
23

plots whereas exogenous potassium was applied in split plots. Each experimental unit was
comprised of 3.0 m × 1.35 m gross area.
(b) Imposition of heat stress and foliar application of potassium and selenium
Five plants were randomly selected in each experimental unit and were observed
for 50% ‘complete emergence of spike’, ‘flowering initiation’ and ‘grain filling
initiation’. When 50% plant reached the complete emergence of spike, heat stress was
imposed by covering the plots with perforated polythene sheet (Javed et al., 2014; Kamal
et al., 2017; Shahid et al., 2017). While, in the other main plot, heat was imposed in the
same way on the 50% completion ‘initiation of flowering’. Polythene sheets (heat stress)
in both main plots were removed at the same time i.e. on 50% ‘initiation of grain filling’.
One main plot was also left in open environment as ‘control/no heat stress’. Recorded
temperatures are given in tabulated form (Table 3.4 and Table 3.5).
Different concentrations of potassium and selenium as per treatments were applied
after the imposition of heat stress on ‘flowering initiation’. Potassium and selenium were
foliar applied with the help of a hand sprayer at the rate of 300 liter per hectare.
Potassium was foliar applied using source ‘potassium nitrate (KNO3) (K = 36.52%, K2O
= 44%) and selenium was applied using ‘sodium selenate (Na2SeO4) (Se= 41.79%). Leaf
samples were collected 1 day after removing of heat stress, stored in liquid nitrogen and
processed to record various attributes.
(c) Parameters recorded
Yield components and grain yield
1. Number of fertile tillers per m2
2. Number of grains per spike
3. 1000-grain weight (g)
4. Grain yield (t ha-1)
Biomass accumulation
1. Biological yield (t ha-1)
2. Harvest index (%)
3. Straw yield (t ha-1)
4. Plant height (cm)
Growth of spike
1. Spike length (cm)
2.Spikelets per spike
3. Grain filling rate (g per day) (Hunt, 1978)
24

4. Grain filling duration (days) (Hunt, 1978)
Stay green and antioxidants
1. Chlorophyll a contents (mg g-1 FW) (Arnon, 1949)
2. Chlorophyll b contents (mg g-1 FW) (Arnon, 1949)
3. Superoxide dismutase (U mg-1 protein) (Giannopolitis and Ries, 1977)
4. Peroxidase (U mg-1 protein) (Liu et al., 2009)
5. Catalase (U mg-1 protein) (Liu et al., 2009)
6. Total phenolic contents (mg GAE g-1) (Ainsworth and Gillespie, 2007)
Osmo-protectants and lipid peroxidation
1. Proline (µmol g-1) (Bate et al., 1973)
2. Glycine betaine (µmol g-1) (Grieve and Grattan, 1983)
3. Total soluble proteins (mg g-1) (Bradford, 1976)
4. Malondialdehyde contents (µmol g-1) (Cakmak and Horst, 1991)
Water relations and quality attributes
1. Osmotic potential (-MPa) (Scholander et al., 1964)
2. Water potential (-MPa)
3. Turgor potential (MPa)
4. Shoot potassium contents (µg g-1) (Chapman and Pratt, 1961; Gupta, 1999) (Only for
Experiment II)
5. Grain crude protein contents (%) (Bremner and Mulvaney, 1982; Ryan et al., 2001)
(d) Statistical analysis
Data of recorded attributes were analyzed statistically (p ≤ 0.05) using the Fisher’s
analysis of variance technique (Steel et al., 1997) and Tukey’s Honestly Significant
Difference (Tukey’s HSD) test was employed to compare the means of different
genotypes at 5% probability level. While, type and strength of relationship among the
recorded parameters was determined by calculating correlation among these parameters
using STATISTIX 8.1 software (Gomez and Gomez, 1984). Moreover, regression
analysis was performed to determine trends of response variables and improvements in
different attributes towards different concentrations of foliar spray under varying
treatments of heat stress. Years means were determined for each studied response variable
without pooling of data for two years study period. Microsoft Excel-2016 was used for
graphical work.
(e) Methodologies to record parameters
25
Yield components and grain yield
Number of fertile tillers was counted in 30 cm row length at five different places
of each experimental unit and converted into fertile tillers for 1 m2 area through unitary
method. Ten spikes were manually harvested, threshed and average number of grains per
spike was calculated. Five samples of 1000 seeds were randomly taken from the seed lot
of each experimental unit and averaged to calculate thousand seed weight. The crop in
each experimental unit was harvested, threshed and grain yield was weighed and
converted into tons per hectare.
Biomass accumulation
Ten plants in each experimental unit were randomly selected and plant height was
measured from the base of plant to tip of spike with the help of meter rod at maturity. The
biological yield of each experimental plot was weighed using a weighing balance and
converted into tons per hectare. Harvest index was calculated by dividing the grain yield
of each plot by respective biological yield (Gardner et al., 1985).
Harvest index (% )= Grain yieldBiological yield × 100
Straw yield of each treatment was computed by subtracting grain yield from the
respective biological yield.
Growth of spike
Ten spikes were randomly selected in each plot, their length was measured and
averaged. Similarly, spikelets per spike were counted and averaged for ten spikes. To
determine grain filling rate, five spikes were randomly harvested from each plot on
initiation of grain filling at interval of 5 days and their dry weight was recorded. Grain
filling rate was calculated using formula described by Hunt (1978).
Grain filling rate(g per day )=W 2−W 1
t2−t 1
Whereas, ‘W1’ and ‘W2’ represent ‘dry weight’ of spike at the time of ‘first
harvest (t1) and second harvest (t2). Grain filling duration was determined by tagging five
plants in each plot and days taken from grain filling initiation to physiological maturity
were counted (Hunt, 1978).
Stay green and antioxidants
Green leaf samples were collected randomly from each experimental plot, 0.5 g
sub sample was taken and soaked overnight in 80% acetone. Leaves extracts of 1.5 µL
26
were taken in ELISA plate and absorbance was recorded at 663 and 645 nm. Final
readings of chlorophyll a and b were computed using formulae given by Arnon (1949)
Chla (mg g−1 FW )=[ 12.7 × A 663−2.69× A 645 ] × V1000
×W
Chlb (mg g−1 FW )=[ 22.9 × A 645−4.68 × A 663 ] × V1000
×W
Where ‘A’ indicates ‘absorbance’, ‘V’ ‘volume of extract (mL)’ and ‘W’ ‘weight of
fresh leaves tissue’.
Superoxide dismutase (SOD) contents were quantified as enzyme units that
inhibited photochemical reduction of nitro blue tetrazolium (NBT). Leaf tissues were
extracted using potassium phosphate buffer (pH 4) prepared by dissolving KH2PO4 (7.45
g) + K2HPO4 (1.74 g) + KCl (7.45 g) + EDTA (0.58 g) in 1000 mL DI water. The
reaction mixture was comprised of potassium phosphate buffer (pH 5) + 200 µL
methionine + 200 µL triton X + 100 µL NBT + 800 µL distilled water. Enzyme extracts
of 100 µL volume was mixed with reaction mixture in Eppendorf tubes, placed under
ultraviolet light for 15 minutes and added 100 µL riboflavin and took 100 µL in ELISA
plate and recorded absorbance at 560 nm. Absorbance for blanks (standards) was also
recorded using reaction mixture and riboflavin without adding enzyme extract
(Giannopolitis and Ries, 1977). Regression equation was formed plotting blanks on x-axis
and respective absorbance on y-axis and thus, finalized readings of SOD were computed
from a calibration curve
Y=aX+b
Where, ‘Y’ specifies ‘absorbance of blanks solutions’, ‘X’ ‘final concentration of
SOD of unknown sample, ‘a’ ‘slope between blank and ‘unknown (SOD) sample’ and ‘b’
‘intercept’.
Peroxidase (POD) contents were estimated as enzyme units that oxidize guaiacol.
The same enzyme extracts as used for SOD contents was also used to quantify POD
contents. Reaction mixture for determination of POD was comprised of 800 µL potassium
phosphate buffer (pH 5) + 100 µL H2O2 (40 mM) + 100 µL guaiacol (20 mM). Added
100 µL enzyme extract + 100 µL reaction mixture in Eppendorf tubes, took 150 µL in
ELISA plate and recorded absorbance at 470 nm (Liu et al., 2009).
Catalase (CAT) contents were measured as enzyme units that detoxified H2O2 to
H2O and O2. Same enzyme extracts as prepared to quantify SOD were also used for
determination of CAT contents. Enzyme extract of volume 100 µL + 100 µL H2O2 (5.9
27
mM) were mixed in cuvettes, took 150 µL of mixture in ELISA plate and recorded
absorbance at 240 nm (Liu et al., 2009).
Total phenolic contents were measured by extracting 0.5 g leaf tissues in 10 mL
80% acetone using Folin-Ciocalteu reagent method. Supernatant of 20 µL volume was
shifted in cuvettes. Then added 1.50 mL DI water + 100 µL Folin-Ciocalteu (Rover and
Brown, 2013) reagent, vortexed the cuvettes. Then added 300 µL Na2CO3 (700 mM)
solution in cuvettes and incubated for 2 hours at room temperature (25°C), 150 µL from
cuvettes was shifted to ELISA plate and recorded the absorbance at 760 nm. Gallic acid
(10-100 ppm) was used as standard to develop calibration curve for determination of TPC
and results were reported as gallic acid equivalent (GAE) (Ainsworth and Gillespie,
2007).
Osmo-protectants and lipid peroxidation
Proline was determined by extracting 0.5 g leaf tissues with 3% 5 mL of
sulfosalicylic acid. Obtained leaf extract was centrifuged for 15 minutes. Ninhydrin
solution of concentration 3% was prepared in equal volumes of glacial acetic acid and 6
M orthophosphoric acid. Added 1 mL centrifuged leaf extract + 1 mL glacial acetic acid +
1mL 3% ninhydrin solution prepared in glacial acetic acid and orthophosphoric acid in
cuvettes. The mixture was mixed and incubated at 100°C for 1 hour. Afterwards, the
mixture was cooled in an ice bath, added 1 mL toluene in mixture and vortexed it for 5
minutes. The upper aqueous layer was discarded after vortex and organic layer was
retained. Volume of 150 µL was placed in an ELISA plate and recorded absorbance at
520 nm using toluene as blank for standard curve (Bate et al., 1973).
Glycine betaine was measured homogenizing leaf tissues weighing 0.5 g with 5
mL distilled water and centrifuged the extracts for 5 minutes. Potassium tri-iodide
solution was prepared dissolving 7.5 g iodine + 10 g potassium iodide in 10 mL, 1 M HCl
solvent. Then 1 mL leaf tissue extract + 1 mL HCl (2 M) + 0.1 mL potassium tri-iodide
solution were thoroughly mixed and incubated at 4°C for 1 hour. After it, 5 mL chilled DI
water + 10 mL 1,2- di-di-chloroethane was added and vortexed for 5 minutes. Upper
aqueous layer was discarded, and absorbance was recorded at 365 nm using organic layer
(Grieve and Grattan, 1983).
Total soluble proteins were analyzed by using same enzyme extract of leaves as
was used for SOD determination. Enzyme extract of volume 40 µL + 160 µL Bradford
Reagent was added in ELISA plate and recorded absorbance at 595 nm (Bradford, 1976).
28

To quantify malondialdehyde (MDA), leaf samples of weight 0.5 g were
homogenized with 3 mL 0.1% (w/v) trichloroacetic acid (TCA). Then the samples were
centrifuged for 15 minutes and the supernatant of 0.5 mL volume was transferred in a test
tube. Then 3 mL 20% TCA solution containing 0.5% thiobarbituric acid was added to the
supernatant. Afterwards, the mixture was incubated at a temperature of 70°C for30
minutes and cooled with an ice water bath. Mixture containing leaf extracts and blanks
were added in ELIZA plate taking volume of 150 µL each and recorded absorbance at
532 nm and 600 nm (Cakmak and Horst, 1991).
Water relations and quality attributes
Leaves were collected early in the morning between 6-8 am randomly from each
plot. Leaves were placed in Scholandar pressure gauge (ARIMAD-2, ELE, International)
and pressure was applied until drop of sap appeared on midrib. Pressure applied from
pressure gauge was considered equal to water potential (ΨW) of leaf organs. Leaves used
in water potential determination were frozen at -4°C and ground to obtain cell sap which
was taken to osmometer (Wescor 5520) and recorded osmotic potential (ΨS). Turgor
potential was determined by subtracting osmotic potential from water potential
(Scholander et al., 1964).
Ψ P=Ψ W−Ψ S
Wheat shoots were collected at physiological maturity, sun dried, oven dried and
ground to powder form. Ground powder weighing 0.5 was digested with nitric acid per-
chloric acid (HNO3: HCLO4 in 2:1 ratio). The mixture was heated at 60°C to complete
reaction until synthesis of fumes from reaction mixture was stopped. Then the mixture
was heated in a digestion chamber at temperature of 120°C until clear aliquot was
obtained. DI water was added to make volume of a 100 mL. Stock solution of
concentration 1000 ppm was diluted to make concentrations of 0, 25, 50, 75 and 100
ppm. A regression (calibration) curve was developed plotting different concentrations on
x-axis and respective absorbances on y-axis. Leaf samples were also loaded in a Flame
photometer and recorded absorbances for different samples. Final readings of shoot
potassium contents (µg g-1) were computed from the regression equation (Chapman and
Pratt, 1961; Gupta, 1999).
Grain crude proteins were quantified by using the method of Gunning and
Hibbard. Sulphuric acid was used for digestion of wheat flour and it was followed by
distillation of NH3 in boric acid with the help of Kjeldhal apparatus. Grains were milled to
29

form flour and 1 g flour was taken in digestion tubes. Together with it, 25 mL
concentrated H2SO4 + 5 g digestion mixture (K2SO4 + FeSO4 + CuSO4 in 85: 10: 5 ratio)
were added. Digestion tubes were heated on digestion block at 400°C until clear liquid
was obtained. Then DI water added to make total volume 250 mL and 10 mL from
digested and clear aliquot was taken to distillation unit. In the receiver flask of distillation
unit, 10 mL 4% boric acid was taken and added a few drops of methyl red indicator.
Upon distillation, the colour of boric acid in receiver flask was changed from purple to
golden yellow. After it, boric acid was titrated against 0.1 N H2SO4 to get purple endpoint
from golden yellow colour of boric acid and computed grain crude proteins (Jackson,
1962).
Nitrogen (%) =
0.0014 ×Titrant for sample (mL )−Titrant for blank (mL ) 0.1N H2 SO4 ×250 (DF)Sample weight (g )× Aliquot volume used∈distillation
Whereas DF represents dilution factor if there is any.
Graincrude proteins contents ( %)=%N ×5.83
Whereas 5.83 is constant for wheat (Bremner and Mulvaney, 1982; Buresh et al.,
1982; FAO, 2003).
30

RESULTS AND DISCUSSION CHAPTER-4
Experiment I: Biochemical markers assisted screening of wheat cultivars for
terminal heat stress tolerance
Heat stress had an overall deleterious effect at reproductive stages of wheat.
However, cultivars specific response was evident on different growth, yield, and
biochemical attributes. However, heat stress, genotypes and their interaction unveiled
distinctive response under controlled and stressed conditions and resulted in significant
heat × genotypes effect for various parameters.
4.1.1. Yield components and grain yield
(a) Results
Number of fertile tillers did not differ significantly in control and heat stress main
plots. However, cultivars significantly varied from each other. All cultivars showed
undistinguishable trend in both main plots to record non-significant interaction. The
highest number of fertile tillers was observed for ‘Punjab-2011’ (377.13 m-2) and it was
statistically alike to genotypes ‘AARI-2011’, ‘Galaxy-2013’, ‘AAS-2011’ and ‘Pakistan-
2013’. Genotype ‘Kohistan-97’ produced minimum number of fertile tillers (278.88 m -2)
(Table 4.1.1).
Heat stress and genotypes manifested significant distinction for number of grains
per spike. The heat × variety interaction was significant as varieties revealed unlike
response in ambient and heat imposed conditions. Negative implications of high
temperature were apparent for number of grains per spike. Different cultivars exhibited
diverse performance when assayed for number of grains per spike. Maximum decrease in
the number of grains per spike under high temperature over control was obtained for
31
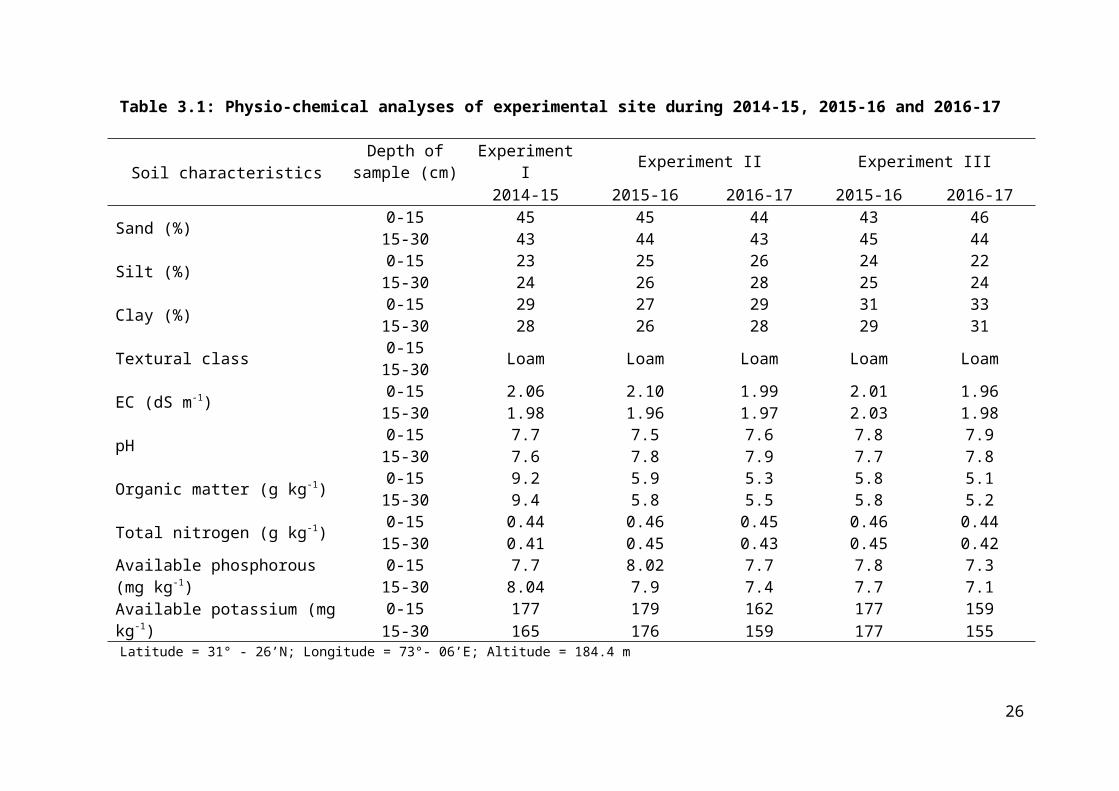
‘Kohistan-97’ (21%). Minimum decline in number of grains per spike in stressed
conditions was revealed by genotypes ‘Aas-2011’ and ‘Chakwal-50’ (10% for both)
(Table 4.1.2).
Weight of thousand grains was significantly diminished owing to adverse
consequences of high temperature while varied response of cultivars was also evident.
Nonetheless, all genotypes depicted incompatibility in control and heat stress to cause
significant interaction of heat and varieties. Highest decline in 1000-grain weight under
heat stress over ambient conditions was recorded for genotype ‘AARI-2011’ (35%) and
‘Pakistan-2013’ (33%) (Table 4.1.2).
Table 4.1.1: Effect of heat stress on fertile tillers of wheat varieties
A. Mean sum of square
Source of variation DF Fertile tillers
Blocks 3 10854.7
Heat (H) 1 4756.9NS
Error I 3 588.6
Genotypes (V) 10 10817.4**
H × V 10 125.5NS
Error II 60 570.4** = Significant (p ≤ 0.01); NS = Non-significant
B. Comparison of treatments’ means
Treatments Fertile tillers per m2
Heat stress (H)
No heat stress (H0) 334
Heat from spike to grain filling (H1) 320
Tukey’s HSD (p ≤ 0.05) NS
Genotypes (V)
Punjab-2011 377 A
AARI-2011 343 AB
Galaxy-2013 367 AB
Millat-2011 301 CD
32

Aas-2011 367 AB
Fareed-2006 286 D
Chakwal-50 288 D
Mairaj-2008 335 BC
Pakistan-2013 353 AB
NIBGE-NIAB-1 300 CD
Kohistan-97 279 D
Tukey’s HSD (p ≤ 0.05) 39.95Any two means not sharing a letter in common differ significantly at p ≤ 0.05; NS = Non-significant
Table 4.1.2: Effect of heat stress on grains per spike and 1000-grain weight of wheat varieties
A. Mean sum of square
Source of variation DF Grains per spike 1000-grain weight
Blocks 3 483.10 2074.75Heat (H) 1 1071.01** 1902.78*Error I 3 8.28 76.55**Genotypes (V) 10 247.07** 96.25H × V 10 9.51* 9.49**Error II 60 4.45 3.42
* = Significant (p ≤ 0.05); ** = Significant (p ≤ 0.01)
B. Comparison of treatments’ means
Treatments Grains per spike 1000-grain weight (g)
No heat stress (H0)Punjab-2011 55.7 a 31.3 eAARI-2011 41.7 cde 35.3 cdeGalaxy-2013 42.5 cde 33.2 deMillat-2011 43.5 cd 39.8 abAas-2011 53.5 ab 33.9 cdeFareed-2006 44.0 c 40.8 abChakwal-50 49.2 b 41.9 aMairaj-2008 52.2 ab 33.7 cdePakistan-2013 39.0 de 37.8 abcNIBGE-NIAB-1 38.5 e 37.0 bcdKohistan-97 44.2 c 37.4 bcdHeat from spike to grain filling (H1)Punjab-2011 45.0 ab 22.1 f
33

AARI-2011 37.0 d 23.1 efGalaxy-2013 37.0 d 23.8 defMillat-2011 38.2 cd 29.0 bcAas-2011 48.0 a 27.2 cdeFareed-2006 38.0 cd 32.0 abChakwal-50 44.2 ab 34.9 aMairaj-2008 42.0 bc 27.5 cdPakistan-2013 32.0 e 25.1 cdefNIBGE-NIAB-1 31.0 e 26.1 cdefKohistan-97 35.0 de 28.9 bcTukey’s HSD (p ≤ 0.05) 4.99 4.37
Any two means not sharing a letter in common within a column differ significantly at p ≤ 0.05
Lowest diminishment in 1000-grain weight under heat compared to control was
observed for ‘Chakwal-50’ (14%). Genotypes ‘Millat-2011’, ‘Fareed-2006’ and ‘Pakistan
2013’ were statistically alike to ‘Chakwal-50’ in non-stressed environment. Contrarily,
cultivars ‘Millat-2011’ and ‘Pakistan 2013’ produced significantly lesser 1000-grain
weight than ‘Fareed-2006’ and ‘Chakwal-50’ under high temperature stress (Table 4.1.2).
Grain yield (GY) was significantly decreased in heat treatment relative to control.
Distinctive genetic makeup of genotypes was statistically obvious denoting their different
capability to produce yield in ambient and high temperature environment. Among the
cultivars, ‘Aas-2011’ exhibited highest GY (3.71 t ha-1) under high temperature
environment. ‘Aas-2011’ was statistically identical to ‘Mairaj-2008’ and ‘Chakwal-50’
under heat stressed conditions. Cultivars ‘Pakistan 2013’, ‘NIBGE-NIAB-1’ and
‘Kohistan-97’ manifested 2.21, 2.03 and 2.24 t ha-1 GY, respectively under heat
representing heat vulnerability of these cultivars. All other cultivars produced GY
midway between described cultivars signifying medium tolerance to heat (Table 4.1.3).
(b) Discussion
Diverse response regarding number of fertile tillers can be attributed to distinct
genetic makeup of genotypes. Different genotypes depicted diverse genetic pattern of
nodal roots (Gulnaz et al., 2011). Varying number of productive tillers among genotypes
can be ascribed to different carbohydrates partitioning capability of genotypes towards
nodal roots (Albokari et al., 2016).
Diminution in number of grains per spike under heat stress can be elucidated in
context of rapid development of ridges of wheat spike under aggravated membrane
damage. Increment in growth rate might have reduced proline and glycine betaine
contents. Subsequently, aggravated malondialdehyde might decline number of grains per
34

spike. While, highest decrement in number of grains per spike for ‘Kohistan-97’ under
heat over control can be ascribed to adverse implications of heat on accumulation of
proline, glycine betaine and total phenolic contents. Declined proline contents might
reduce pollen viability and germination. Reduced accumulation of proline and glycine
betaine might aggravate membrane damage in Kohistan-97 that adversely affected
number of grains per spike. Likewise, lower accumulation of total phenolic contents
might have aggravated malondialdehyde (MDA) accumulation resulting into
diminishment in number of grains. It can be attributed to capability of these genotypes to
accumulate higher glycine betaine, proline and total phenolic contents under heat over
control.
Table 4.1.3: Effect of heat stress on grain yield of wheat varieties
A. Mean sum of square
Source of variation DF Grain yield
Blocks 3 21.31Heat (H) 1 60.40**Error I 3 0.17Genotypes (V) 10 2.49**H × V 10 0.26**Error II 60 0.09
** = Significant (p ≤ 0.01)
B. Comparison of treatments’ means
Treatments Grain yield (t ha-1)
No heat stress (H0)Punjab-2011 5.09 abAARI-2011 4.22 cGalaxy-2013 4.15 cMillat-2011 4.06 cAas-2011 5.22 aFareed-2006 4.19 cChakwal-50 4.95 abMairaj-2008 4.46 bcPakistan-2013 4.10 cNIBGE-NIAB-1 3.35 dKohistan-97 3.31 d
35

Heat from spike to grain filling (H1)Punjab-2011 2.71 bcdAARI-2011 2.20 dGalaxy-2013 2.26 dMillat-2011 2.40 cdAas-2011 3.71 aFareed-2006 2.73 bcdChakwal-50 3.36 abMairaj-2008 3.04 abcPakistan-2013 2.21 dNIBGE-NIAB-1 2.03 dKohistan-97 2.24 dTukey’s HSD (p ≤ 0.05) 0.709
Any two means not sharing a letter in common within a column differ significantly at p ≤ 0.05
Moreover, a strong positive association of leaf proline, glycine betaine and total
phenolic contents was observed with number of grains per spike. Whereas, more negative
correlation of malondialdehyde was observed under heat compared to control. Hence,
malondialdehyde induced a decrease in the number of grains per spike under heat was
also confirmed (Table 4.1.11 and Table 4.1.12). Enhanced accumulation of
malondialdehyde declined biosynthesis of proline and other osmo-protectants.
Subsequently, diminution in pollen fertility diminished number of grains (Paupière et al.,
2014). Enhanced proline biosynthesis eased pollen germination and micro-sporogenesis
(Mattioli et al., 2012). Our results are comparable to those of Ghaffari et al. (2015) that
high temperature impaired photosystem-II, enhanced photorespiration, lipid peroxidation,
chlorophyll degradation and eventually resulted in reduced number of grains per spike.
High temperature stress might have promoted pollen sterility and thus reduced the
number of grains per spike (Ghaffari et al., 2015). Furthermore, dissimilar response of
genotypes can be ascribed to genetic differences. According to Nawaz et al. (2015),
different genotypes depicted varied response for number of grains per spike.
The capability of ‘Chakwal-50’ to sustain 1000-grain weight can be ascribed to
lower malondialdehyde synthesis. Lower malondialdehyde might decrease lipid
peroxidation. Consequently, partitioning of carbohydrates was sustained for longer time
and hence 1000-grain weight was improved. Genotypes with capability to hamper
malondialdehyde depicted higher 1000-grain weight, water potential and membrane
integrity (Jain, 2013). Likewise, capability to accumulate GB enhanced tolerance for
stressed environments and it differed among genotypes (Raza et al., 2015). Highest
diminishment in 1000-grain weight of cultivars ‘AARI-2011’ and ‘Pakistan-2013’ under
36

high temperature environment can be elucidated in the context of reduced accumulation
of glycine betaine and other secondary metabolites. The decline in glycine betaine might
be a consequence of impaired photosynthesis and enhanced lipid peroxidation under heat
stress (Reguera et al., 2012). Enhanced phenolic might have contributed to sustain
temperature, thus alleviated heat mediated denaturation of starch accumulating enzymes.
Declined accumulation of proline and glycine betaine may disturb water relations of
plants and consequently cause a decrease in grain weight (Almeselmani, 2009).
‘Chakwal-50’ showed the smallest decline in grain weight under heat stress, which may
be ascribed to reduced peroxidation of membrane lipids and augmented proline, glycine
betaine and total phenolic contents. Diminished malondialdehyde synthesis confirmed
boosted membrane stability for ‘Chakwal-50’. Genotype ‘Chakwal-50’ might have
established tolerance against heat interceded disintegration of mesophyll membranes. It
eventually augmented carbohydrates availability for grain filling (Ghaffari et al., 2015).
Moreover, significant negative association of malondialdehyde with 1000-grain weight
under heat established enhanced lipid peroxidation and associated adversities. Similarly,
strong negative association of leaf proline and glycine betaine with malondialdehyde
further accomplished proline and glycine betaine role in maintaining 1000-grain weight
under heat stress (Table 4.1.11 and Table 4.1.12).
Degradation of chlorophyll under high-temperature environment might reduce
yield by decreasing assimilate availability for grain filling. The decrement in antioxidant
activity under heat stress might be related to enhanced oxidative stress causing more
reduction in yield in cultivars AARI-2011, Galaxy-2013 and Punjab-2011 than tolerant
genotypes Aas-2011, Chakwal-50 and Mairaj-2008. Less heat mediated reduction in yield
for cultivars Aas-2011, Chakwal-50, and Mairaj-2008 might be due to their capability to
maintain higher CHL a and b contents under heat than other cultivars. Moreover, strong
positive and significant association of antioxidants and chlorophyll contents further
confirmed the role of these attributes in grain yield in different genotypes (Table 4.1.11
and Table 4.1.12). Our results correspond to those of Innes et al. (2015), where they
recorded a 15% reduction in grain yield (GY) per annum due to the higher temperature.
Every 1ºC rise in temperature declined GY by 5.3%. The decrement in GY is also alike to
findings of Tao et al. (2015); a three-decade long experiment was conducted. Wheat
varieties were exposed to the temperatures above 34ºC from booting to maturity. High
temperature decreased GY and reduced the growing period in all wheat genotypes.
37

High grain yields of genotypes ‘Aas-2011’, ‘Mairaj-2008’ and ‘Chakwal-50’ can
be attributed to higher number of grains per spike. The role of grains number per spike in
enhancing yield under heat and control was confirmed from their strong positive
correlation of grain yield with grains per spike (Table 4.1.11 and Table 4.1.12).
Significantly lower malondialdehyde synthesis was manifested by genotypes ‘Aas-2011’,
‘Mairaj-2008’ and ‘Chakwal-50’. A strong negative association of malondialdehyde with
grain yield further established malondialdehyde triggered decline in grain yield (Table
4.1.11 and Table 4.1.12). Reduced lipid peroxidation and oxidative stress might
contribute to enhanced yield (Wormuth et al., 2007). Membrane integrity under stressed
environment is a direct indicator of heat tolerance. Wheat seedlings with lower
malondialdehyde were less prone to oxidative stress and ultimately produced higher yield
(Savicka and Skute, 2010). Higher yield of genotypes ‘Aas-2011’, ‘Mairaj-2008’ and
‘Chakwal-50’ can be attributed to capability of these genotypes to manifest increment in
proline, glycine betaine and total phenolic contents under high temperature. Enhanced
phenolic contents in genotypes ‘Aas-2011’, ‘Mairaj-2008’ and ‘Chakwal-50’ might
increase heat tolerance. Cultivars ‘Pakistan-2013’, ‘NIBGE-NIAB-1’ and ‘Kohistan-97’
manifested comparatively more decrement in proline and total phenolic contents under
heat over the control. It could be another reason for heat susceptibility of these cultivars.
Moreover, strong positive correlation of total phenolic contents, glycine betaine and
proline with grain yield under ambient and heat stress conditions confirmed role of these
metabolites in sustaining grain yield (Table 4.1.11 and Table 4.1.12). Genotypes capable
to accumulate proline, glycine betaine and diminish malondialdehyde under stress
compared to no stress were heat tolerant (Fardus et al., 2014).
4.1.2. Growth of spike
(a) Results
Heat stress (H) and varied performance of genotypes (V) significantly affected
grain filling rate (GFR) and grain filling duration (GFD). Whereas, the same trend
amongst all cultivars was observed in both main plots resulting in non-significant
interactions (H × V) for GFR and GFD. Heat stress accelerated GFR by 33% while
diminished GFD by 27%. Concerning GFR, Galaxy-2013 recorded the highest GFR (0.16
g per day) and it was statistically similar to Punjab-2011, AARI-2011, Pakistan-2013,
NIBGE-NIAB-1 and Kohistan-97. Significantly lower GFR was noted for cultivars Aas-
2011 and Chakwal-50. Regarding GFD, the cultivar Aas-2011 recorded highest value
(37.59 days). Aas-2011 was statistically comparable to Chakwal-50 and Mairaj-2008. The
38

genotype NIBGE-NIAB-1 recorded the lowest GFD (24.72 days) and it was statistically
alike to Millat-2011, Pakistan-2013 and Kohistan-97. The high-temperature environment
caused rapid grain filling rate (GFR) and diminished grain filling duration (GFD). Even
though, genotypes Aas-2011 and Chakwal-50 maintained significantly lower GFR than
all other cultivars. Genotypes Aas-2011 and Chakwal-50 manifested significantly lowest
decline in GFD against maximum in cultivars Punjab-2011 and AARI-2011 (Table 4.1.4).
(b) Discussion
Minimum GFR and maximum GFD in Aas-2011 and Chakwal-50 can be
explained in the context of high chlorophyll content and enhancement of antioxidant
defense system under heat. Higher chlorophyll contents might maintain assimilate
partitioning for the longer duration of time. Declined chlorophyll degradation might be a
consequence of detoxification of ROS in cultivars AAS-2011 and Chakwal-50.
Table 4.1.4: Effect of heat stress on grain filling rate (GFR) and grain filling duration (GFD) of wheat varieties
A. Mean sum of square
Source of variation DF Grain filling rate Grain filling duration
Blocks 3 0.00038 7.14
Heat (H) 1 0.05600** 2132.53**
Error I 3 0.00038 7.99
Genotypes (V) 10 0.00519** 178.51**
H × V 10 0.00035NS 4.34NS
Error II 60 0.00030 4.60** = Significant (p ≤ 0.01); NS = Non-significant
B. Comparison of treatments’ means
Treatments GFR (g per day) GFD (days)
Heat stress (H)
No heat stress (H0) 0.10 B 35.86 A
Heat from spike to grain filling (H1) 0.15 A 26.01 B
Tukey’s HSD (p ≤ 0.05) 0.013 1.918
Genotypes (V)
Punjab-2011 0.14 AB 32.29 CD
AARI-2011 0.14 AB 29.10 DE
39
Galaxy-2013 0.16 A 31.67 CD
Millat-2011 0.12 B 27.36 EF
Aas-2011 0.08 C 37.59 A
Fareed-2006 0.12 B 32.89 BC
Chakwal-50 0.08 C 36.69 A
Mairaj-2008 0.12 B 36.46 AB
Pakistan-2013 0.14 AB 25.22 F
NIBGE-NIAB-1 0.14 AB 24.71 F
Kohistan-97 0.14 AB 26.29 EF
Tukey’s HSD (p ≤ 0.05) 0.029 3.586Any two means not sharing a letter in common differ significantly at p ≤ 0.05
The highest grain yields obtained in AAS-2011 and Chakwal-50 further confirmed
the contribution of chlorophyll contents in maintaining GFR and GFD. A strong positive
correlation (0.93) between GFD and grain yield under heat established contribution of
longer GFD in grain yield (Table 4.1.11 and Table 4.1.12). Furthermore, enhanced
antioxidants and TSPs were observed for AAS-2011 and Chakwal-50 under heat over
control. Thus, improved defense might have maintained growth rate of grains and
consequence in higher grain yield. Under heat stress, higher flux intensity and greater
difference in maximum day temperature and minimum night temperature caused rapid
morphogenesis. The increment in GFR can also be considered an adaptive behavior to
complete growing cycle rapidly and produce seed for the upcoming generation. Each 5ºC
rise of temperature above 20ºC resulted in increased GFR and reduced GFD by 12 days in
wheat. Moreover, every 1ºC increase in temperature declined GFD by 2.8 days, enhanced
ROS, lipid peroxidation and decreased chlorophyll contents (Talukder et al., 2014).
Enhanced GFR and diminished GFD might lead to a decline grain yield in
susceptible varieties. Thus, enhanced GFR could not compensate for diminished
phenology. Rapid GFR and declined GFD might have adversely affected grain yield.
Negative correlation of grain yield with GFR (- 0.82) under high temperature
environment further accomplished the adverse effects of rapid grain filling (Table 4.1.12).
Reduction in phenology might have reduced assimilates partitioning towards grains.
Pollen grains in wheat were not able to produce heat shock proteins and thus are highly
sensitive to rise in temperature. Consequently, decreased grain setting negatively affected
grain yield under high temperature environments (Hasanuzzaman et al., 2013).
40

4.1.3. Stay green and antioxidants
(a) Results
Different wheat genotypes manifested significant difference for chlorophyll
(CHL) contents. High-temperature stress had the negative impact on chlorophyll pigment.
Heat stress mediated diminishment compared to control in CHL a and CHL b contents
was 33% and 38% (averaged across 11 genotypes), respectively. All cultivars showed a
similar trend under heat and no heat-induced conditions to depict a non-significant
interaction. Cultivars varied response was apparent as Aas-2011 recorded maximum CHL
contents (2.08 mg g-1) and it was statistically alike the cultivars Chakwal-50 and Mairaj-
2008. Similarly, the wheat cultivar Aas-2011 recorded highest CHL b contents (0.58 mg
g-1) and was statistically like Chakwal-50. Conversely, minimum CHL contents was
observed for cultivar NIBGE-NIAB-1 (CHL a 1.01 mg g-1) (CHL b 0.15 mg g-1). Wheat
cultivar NIBGE-NIAB-1 depicted greater reduction than other genotypes in CHL a (52%)
and CHL b (53%) contents. Contrarily, genotypes Chakwal-50, Mairaj-2008, Aas-2011,
and Fareed-2006 recorded almost similar response and lesser decline in CHL a (15-22%)
and CHL b (27-35%) content than other genotypes were observed (Table 4.1.5).
Dissimilar performance of different wheat genotypes for antioxidant activities was
observed in main plots and resulted in significant interaction of genotypes and heat stress.
Superoxide dismutase (SOD), peroxidase (POD), catalase (CAT) and total phenolic
contents (TPC) activities of Aas-2011, Chakwal-50 and Mairaj-2008 was enhanced under
heat over ambient conditions. Whereas, all other cultivars recorded diminishing trend in
enzymatic activity under stressed environment over control (Table 4.1.6 and Table 4.1.7).
Regarding SOD activity, Aas-2011, Chakwal-50 and Mairaj-2008 depicted an
increase of 12, 14 and 14%, respectively under heat stress over control. In control Aas-
2011 and Chakwal-50 were statistically alike while in heat stress Aas-2011, Chakwal-50
and Mairaj-2008 remained at par. Galaxy-2013 and Millat-2011 depicted maximum
decline (38 and 40%, respectively) in SOD activity under heat compared to no heat
environment. The cultivars Aas-2011, Chakwal-50 and Mairaj-2008 exhibited 17, 15 and
24% enhancement in POD activity, respectively under heat-induced conditions over no
heat imposition. Under high-temperature maximum diminishment (52%) in POD activity
was observed for Punjab-2011 and Galaxy-2013. Under high-temperature stress, Aas-
2011, Chakwal-50 and Mairaj-2008 recorded significantly higher POD activity than all
other genotypes (Table 4.1.6).
41

Cultivars Aas-2011, Chakwal-50, and Mairaj-2008 depicted an increase of 19, 15
and 16% respectively in CAT activity under high-temperature stress environment over
control. The highest reduction in CAT activity was recorded for genotypes Punjab-2011
(50%) and Galaxy-2013 (46%). Aas-2011, Chakwal-50, and Miaraj-2008 manifested
significantly higher SOD, POD and CAT activity than all other cultivars in heat stressed
main plots. Likewise, almost similar trend was observed in control. Regarding total
phenolic contents (TPC), a boost of 22, 20 and 24% was manifested by genotypes ‘Aas-
2011’, ‘Chakwal-50’ and ‘Mairaj-2008’ respectively. Under ‘no heat stress’, ‘Aas-2011’
and ‘Chakwal-50’ depicted significantly higher TPC and were statistically alike to one
another. Under stressed conditions, ‘Aas-2011’ and ‘Chakwal-50’ were statistically
similar whereas ‘Mairaj-2008’ was statistically analogous to ‘Chakwal-50’. Maximum
decline in TPC in stressed environment over control was depicted by ‘Kohistan-97’
(67%) and ‘Pakistan-2013’ (65%) (Table 4.1.7).
Table 4.1.5: Effect of heat stress on chlorophyll a (Chl a) and chlorophyll b (Chl b) contents of wheat varieties
A. Mean sum of square
Source of variation DF Chlorophyll a Chlorophyll b
Blocks 3 7.76 0.117
Heat (H) 1 7.35** 0.482**
Error I 3 0.19 0.009
Genotypes (V) 10 1.10** 0.212**
H × V 10 0.04NS 0.002NS
Error II 60 0.04 0.002** = Significant (p ≤ 0.01); NS = Non-significant
B. Comparison of treatments’ means
Treatments Chl a (mg g-1 FW) Chl b (mg g-1 FW)
Heat stress (H)
No heat stress (H0) 1.75 A 0.39 A
Heat from spike to grain filling (H1) 1.18 B 0.24 B
Tukey’s HSD (p ≤ 0.05) 0.298 0.064
Genotypes (V)
Punjab-2011 1.53 CDE 0.32 C
42

AARI-2011 1.28 EFG 0.24 DE
Galaxy-2013 1.40 DEF 0.28 CD
Millat-2011 1.18 FG 0.19 EF
Aas-2011 2.08 A 0.58 A
Fareed-2006 1.71 BCD 0.40 B
Chakwal-50 1.92 AB 0.57 A
Mairaj-2008 1.82 ABC 0.46 B
Pakistan-2013 1.15 FG 0.15 F
NIBGE-NIAB-1 1.01 G 0.15 F
Kohistan-97 1.07 G 0.16 F
Tukey’s HSD (p ≤ 0.05) 0.320 0.072Any two means not sharing a letter in common differ significantly at p ≤ 0.05
Table 4.1.6: Effect of heat stress on superoxide dismutase (SOD) and peroxidase (POD) of wheat varieties
A. Mean sum of square
Source of variation DF Superoxide dismutase Peroxidase
Blocks 3 15226.7 55.72Heat (H) 1 7103** 128.87**Error I 3 142.3 3.74Genotypes (V) 10 15882.3** 342.18**H × V 10 1673.9** 47.09**Error II 60 35.9 1.13
** = Significant (p ≤ 0.01)
B. Comparison of treatments’ means
Treatments SOD (U mg-1 protein) POD (U mg-1 protein)
No heat stress (H0)Punjab-2011 143.8 b 17.0 cAARI-2011 108.5 d 11.5 efGalaxy-2013 124.4 c 13.9 deMillat-2011 95.5 de 10.2 fgAas-2011 168.9 a 21.3 aFareed-2006 144.4 b 15.5 cdChakwal-50 166.0 a 19.8 ab
43

Mairaj-2008 155.4 ab 17.8 bcPakistan-2013 84.0 ef 8.0 ghNIBGE-NIAB-1 79.2 f 7.0 hKohistan-97 81.4 ef 8.1 ghHeat from spike to grain filling (H1)Punjab-2011 96.5 c 8.1 bcAARI-2011 69.1 de 6.7 cdGalaxy-2013 76.8 d 6.7 cdMillat-2011 57.3 ef 5.3 dAas-2011 192.1 a 25.8 aFareed-2006 112.9 b 10.1 bChakwal-50 192.8 a 23.3 aMairaj-2008 179.9 a 23.5 aPakistan-2013 62.2 ef 4.6 dNIBGE-NIAB-1 54.3 f 4.2 dKohistan-97 59.8 ef 5.3 dTukey’s HSD (p ≤ 0.05) 14.17 2.51
Any two means not sharing a letter in common within a column differ significantly at p ≤ 0.05
Table 4.1.7: Effect of heat stress on catalase (CAT) and total phenolic contents (TPC) of wheat varieties
A. Mean sum of square
Source of variation DF Catalase Total phenolics
Blocks 3 224.34 87.14Heat (H) 1 375.8* 93.26**Error I 3 23.27 0.78Genotypes (V) 10 1170.58** 488.87**H × V 10 143.30** 51.09**Error II 60 2.55 0.74
* = Significant (p ≤ 0.05); ** = Significant (p ≤ 0.01)
B. Comparison of treatments’ means
Treatments CAT (U mg-1 protein) TPC (mg GAE g-1)
No heat stress (H0)Punjab-2011 34.4 c 13.4 cdAARI-2011 24.6 e 8.8 efGalaxy-2013 29.7 d 12.6 dMillat-2011 20.6 f 11.1 deAas-2011 38.6 ab 21.4 aFareed-2006 35.1 bc 16.0 bChakwal-50 39.0 a 20.8 a
44

Mairaj-2008 37.7 abc 18.0 bPakistan-2013 15.9 g 7.5 fgNIBGE-NIAB-1 14.1 g 4.6 hKohistan-97 15.6 g 5.9 ghHeat from spike to grain filling (H1)Punjab-2011 18.9 c 7.8 dAARI-2011 15.6 cd 3.9 efgGalaxy-2013 16.1 c 6.3 deMillat-2011 11.9 de 4.8 efAas-2011 47.1 a 27.3 aFareed-2006 26.0 b 11.0 cChakwal-50 46.4 a 26.1 abMairaj-2008 45.1 a 23.8 bPakistan-2013 11.3 e 2.6 fghNIBGE-NIAB-1 10.3 e 1.9 hKohistan-97 11.0 e 2.0 ghTukey’s HSD (p ≤ 0.05) 3.78 2.03
Any two means not sharing a letter in common within a column differ significantly at p ≤ 0.05
(b) Discussion
The reduction in chlorophyll contents under the elevated temperature can be
explained in the context of increased rate of chlorophyll degradation over its biosynthesis.
High-temperature stress-induced chlorophyll degradation might be an outcome of
impaired biosynthesis of total soluble proteins and antioxidants. Similar performance of
cultivars Chakwal-50, Aas-2011 and Mairaj-2008 might be related to the stay green trait
under heat. Higher chlorophyll a and b established the stay green trait. Capability to
maintain chlorophyll structure and function might improve the heat tolerance of cultivars.
A strong positive correlation of chlorophyll a and b contents with number of grains per
spike, grain yield and other biochemical attributes further accomplished role of stay green
in enhancing heat tolerance (Table 4.1.11 and Table 4.1.12). Declining
protochlorophyllide reduced the rate of chlorophyll biosynthesis over degradation
because of depressed total soluble proteins (TSP) and antioxidant under heat
(Hemantaranjan et al., 2014). Decline in chlorophyll contents under stress might be due to
the accelerated production of reactive oxygen species (ROS) that increased thylakoid
membrane leakiness of photosystem-II and disrupted chlorophyll structure (Raza et al.,
2015). Prolonged high temperature suppressed chloroplast enzymatic activity and
restricted rate of de novo chlorophyll synthesis (Wang et al., 2015).
Antioxidant defense system of varieties Aas-2011, Chakwal-50, and Mairaj-2008
manifested improvement against decline for other cultivars. Heat stress might have
45

aggravated oxidative stress and thus antioxidants activities were improved in Aas-2011,
Chakwal-50, and Mairaj-2008 as an adaptation to detoxify excessive reactive oxygen
species (ROS). Contrarily, antioxidant activities were not strong enough to scavenge
excessive ROS in all other cultivars. Consequently, increased biosynthesis of ROS
overcame defensive mechanism and thus heat impacts were more pronounced. High
temperature might increase production of superoxide (1O2●-) radical. Superoxide radical
might act as the substrate for SOD. Moreover, strong association of SOD and POD (0.99)
under high temperature environment confirmed accelerated synthesis of 1O2●- (Table
4.1.11 and Table 4.1.12). The increment in SOD activity in tolerant cultivars might be an
adaptive response to high temperature. For susceptible cultivars, decrement in SOD
activity under high temperature can be attributed to lower efficacy of scavenging
mechanism of susceptible wheat cultivars. Decline in SOD activity might be due to
declined chlorophyll a and b contents. Thus, diminished chlorophyll a and b contents
confirmed the diminished SOD activity. While, Aas-2011, Chakwal-50, and Mairaj-2008
still maintained higher chlorophyll contents than other cultivars.
Enhancement in POD and CAT activity under high temperature over control was
recorded for genotypes Aas-2011, Chakwal-50 and Mairaj-2008. It can be attributed to
enhanced SOD activities of genotypes Aas-2011, Chakwal-50 and Mairaj-2008.
Enhanced generation of 1O2●- might have enhanced H2O2 levels in leaves under high-
temperature environment. Subsequently, detoxification of H2O2 to H2O and O2 in plants
was mediated by POD and CAT. Greater H2O2 production in heat stress might have
resulted in the increment of POD and CAT activity as the defensive mechanism against
stress in tolerant cultivars. Strong positive and highly significant association (0.99)
between POD and CAT under stressed conditions confirmed the escalated generation of 1O2
●- and H2O2 (Table 4.1.11 and Table 4.1.12). The varied response of susceptible
genotypes under high-temperature stress might be due to the dissimilar genetic capability
for heat tolerance. Decline in SOD, POD and CAT activity in cultivars Punjab-2011,
AARI-2011, Galaxy-2013, Millat-2011, Fareed-2006, Pakistan-2013, NIBGE-NIAB-1,
and Kohistan-97 can be defined in the context of poor antioxidant defense system due to
excessive generation of reactive oxygen species (ROS). Cultivars Galaxy-2013, Punjab-
2011, and Millat-2011 depicted the highest decline in antioxidant activities under stressed
environment over non-stressed environment. It can be interrelated to the inability of these
cultivars to counteract production of superoxide (1O2●-), hydroxyl (OH●-), singlet oxygen
(1O2٭) and hydrogen peroxide (H2O2) under high-temperature environment.
46

Moreover, higher SOD activity for Aas-2011, Chakwal-50, and Mairaj-2008 and
decreased SOD for other cultivars confirmed excessive generation of 1O2●-. It can also be
elucidated in terms of autocatalytic peroxidation of membrane lipid and degradation of
chlorophyll together with other pigments resulting into significant cell damage. Declined
CHL a and b contents under heat have confirmed enhanced lipid peroxidation.
Furthermore, chlorophyll mediated boost in SOD activity under heat was further
confirmed from strong association of CHL a (0.96) and b (0.97) with SOD activities
(Table 4.1.11 and Table 4.1.12). Naderi et al. (2014) observed that heat tolerant cultivars
recorded enhancement while susceptible cultivars depicted decline in SOD activity.
Tolerant spring wheat genotypes depicted increasing while susceptible recorded
diminishing trends in antioxidant activities under heat over ambient conditions (Iqbal et
al., 2015). These results are also analogous to Khaliq et al. (2015), they observed increase
in POD and CAT activity in salt stress environment for tolerant cultivars of wheat.
However, decline or no change in CAT activity was also recorded for stress tolerant
cultivars (Wang et al., 2014).
Higher TPC in ‘Chakwal-50’, Mairaj-2008 and ‘Aas-2011’ can be ascribed to
more proline, glycine betaine and lesser malondialdehyde accumulation under heat over
control. Higher proline and glycine betaine might have promoted assimilate partitioning
to grains and hence yield decline was lesser under heat for these varieties. Furthermore,
strong positive correlation of TPC with proline and glycine betaine accomplished role of
TPC in sustaining proline and glycine betaine contents (Table 4.1.11 and Table 4.1.12).
Increment in phenolic contents enhanced stress tolerance. Improved stress tolerance was
consequence of escalated proline and glycine betaine accumulation (Saleem et al., 2016).
4.1.4. Osmo-protectants and lipid peroxidation
(a) Results
‘Cultivars Aas-2011’, ‘Chakwal-50’ and ‘Mairaj-2008’ manifested increment of
21% in leaf proline contents under high temperature environment over control. Inclined
proline contents characterized heat tolerance of these cultivars. Highest decrement (51%)
in stressed conditions over control was revealed for genotypes ‘NIBGE-NIAB-1’ and
‘Kohistan-97’. Decline in proline content under stressed conditions represented heat
susceptibility of these genotypes. The genotypes ‘Aas-2011’, ‘Chakwal-50’ and ‘Mairaj-
2008’ exhibited 17, 12 and 13% boost in glycine betaine contents, respectively under heat
stress over control. While, statistically alike and more glycine betaine contents were
quantified for ‘Aas-2011’, ‘Fareed-2006’, ‘Chakwal-50’, ‘Punjab-2011’, ‘AARI-2011’,
47

‘Galaxy-2013’, ‘Millat-2011’ and ‘Mairaj-2008’ under ambient conditions. Whereas,
under high temperature environment genotypes ‘Aas-2011’, ‘Chakwal-50’ and ‘Mairaj-
2008’ exhibited significantly higher GB contents than other cultivars (Table 4.1.8).
Differential response of wheat genotypes resulted in significant heat × variety
effect for total soluble proteins (TSP). Higher temperature enhanced accumulation of TSP
in cultivars Aas-2011 (16%) and Chakwal-50 (17%) and both cultivars were statistically
similar. In controls, Aas-2011 and Chakwal-50 were also statistically similar to Mairaj-
2008 for TSP. The highest diminishment in TSP under heat over control was observed for
cultivars AARI-2011 (40%) and Millat-2011 (64%) (Table 4.1.9). Different wheat
genotypes significantly varied for Malondialdehyde (MDA) biosynthesis. High
temperature environments significantly augmented MDA contents symbolizing boosted
lipid peroxidation under stressed conditions. Indistinguishable response of genotypes in
stressed and non-stressed environment resulted in non-significant interaction.
Table 4.1.8: Effect of heat stress on leaf proline and glycine betaine of wheat varieties
A. Mean sum of square
Source of variation DF Proline Glycine betaine
Blocks 3 2.189 29574.2Heat (H) 1 3.656** 37756.8*Error I 3 0.059 1860.4Genotypes (V) 10 2.345** 15420.1**H × V 10 0.756** 4987.7**Error II 60 0.038 512.9
* = Significant (p ≤ 0.05); ** = Significant (p ≤ 0.01)
B. Comparison of treatments’ means
Treatments Proline (µmol g-1) Glycine betaine (µmol g-1)
No heat stress (H0)Punjab-2011 2.19 abcd 225.7 abAARI-2011 2.02 abcd 205.9 abGalaxy-2013 2.05 abcd 217.1 abMillat-2011 1.99 bcd 197.8 abAas-2011 2.48 a 243.2 aFareed-2006 2.30 abc 233.7 abChakwal-50 2.44 ab 245.2 aMairaj-2008 2.35 abc 239.5 ab
48

Pakistan-2013 1.89 cd 188.0 bNIBGE-NIAB-1 1.82 d 188.8 bKohistan-97 1.78 d 187.6 bHeat from spike to grain filling (H1)Punjab-2011 1.50 bc 143.5 bcAARI-2011 1.26 cd 134.8 cGalaxy-2013 1.47 bc 138.4 cMillat-2011 1.14 cd 130.1 cAas-2011 3.02 a 285.8 aFareed-2006 1.91 b 160.0 bChakwal-50 2.96 a 276.8 aMairaj-2008 2.84 a 272.1 aPakistan-2013 0.99 d 126.4 cNIBGE-NIAB-1 0.89 d 123.4 cKohistan-97 0.86 d 125.8 cTukey’s HSD (p ≤ 0.05) 0.461 53.56
Any two means not sharing a letter in common within a column differ significantly at p ≤ 0.05
Table 4.1.9: Effect of heat stress on total soluble proteins of wheat varieties
A. Mean sum of square
Source of variation DF Total soluble proteins
Blocks 3 0.027Heat (H) 1 0.130*Error I 3 0.004Genotypes (V) 10 0.304**H × V 10 0.026**Error II 60 0.003
* = Significant (p ≤ 0.05); ** = Significant (p ≤ 0.01)
B. Comparison of treatments’ means
Treatments Total soluble proteins (mg g-1)
No heat stress (H0)Punjab-2011 0.57 cdAARI-2011 0.47 deGalaxy-2013 0.39 eMillat-2011 0.41 eAas-2011 0.75 aFareed-2006 0.62 bcChakwal-50 0.74 abMairaj-2008 0.69 abcPakistan-2013 0.38 e
49

NIBGE-NIAB-1 0.37 eKohistan-97 0.37 eHeat from spike to grain filling (H1)Punjab-2011 0.42 cdAARI-2011 0.31 deGalaxy-2013 0.33 deMillat-2011 0.27 eAas-2011 0.89 aFareed-2006 0.49 bcChakwal-50 0.89 aMairaj-2008 0.55 bPakistan-2013 0.26 eNIBGE-NIAB-1 0.23 eKohistan-97 0.25 eTukey’s HSD (p ≤ 0.05) 0.129
Any two means not sharing a letter in common within a column differ significantly at p ≤ 0.05
Significantly lesser MDA was recorded for genotypes ‘AAS-2011’ (0.91 µmol g-1)
and ‘Chakwal-50’ (0.96 µmol g-1). Highest MDA biosynthesis was observed for
‘Pakistan-2013’ (1.24 µmol g-1). Genotype ‘Pakistan-2013’ was statistically comparable
to ‘Punjab-2011’, ‘AARI-2011’, ‘Galaxy-2013’, ‘Millat-2011’, ‘Fareed-2006’, ‘NIBGE-
NIAB-1’ and ‘Kohistan-97’ (Table 4.1.10).
(b) Discussion
Increment in proline and glycine betaine in genotypes ‘Aas-2011’, ‘Chakwal-50’
and ‘Mairaj-2008’ can be defined in context of higher TPC of these genotypes over
control. Accumulation of TPC enhanced thermotolerance in sensitive genotypes also.
Furthermore, a strong association of glycine betaine and proline with TPC confirmed
positive influence of proline and glycine betaine on TPC (Table 4.1.11 and Table 4.1.12).
A positive correlation was observed between TPC and thermotolerance (Mahmood et al.,
2014). Increment in GB and proline is also alike to findings of Raza et al. (2015); they
showed accumulation of proline and glycine betaine improved stress tolerance. Tolerant
genotypes manifested increase while susceptible genotypes depicted decrease in proline
and glycine betaine under stressed conditions. Further proline and glycine betaine reduced
MDA and consequence in high yield under stress.
The interactive effect of heat and varieties was significant for total soluble
proteins (TSP). Cultivars Aas-2011 and Chakwal-50 manifested increment while other
cultivars recorded decrement in TSP under heat stress over control. Augmented
production of TSP for genotypes Aas-2011 and Chakwal-50 might be due to enhancement
50

of antioxidant enzymes. Stronger correlation between TSP and antioxidants under heat
and control further accomplished antioxidant-mediated augmentation in TSP (Table
4.1.11 and Table 4.1.12). Higher TSP might be a consequence of chlorophyll mediated
carbohydrate biosynthesis. Higher grain yield under heat stress for Aas-2011 and
Chakwal-50 was observed. Therefore, contribution of TSP and chlorophyll for
maintaining assimilate partitioning towards grains under heat stress was confirmed in
form of higher grain yield. The decrease in TSP in cultivars Punjab-2011, AARI-2011,
Galaxy-2013, Millat-2011, Fareed-2006, Mairaj-2008, Pakistan-2013, NIBGE-NIAB-1,
and Kohistan-97 might be due to denaturation of proteins and inability of these cultivars
to enhance heat shock proteins (HSPs) under heat stress. Declined chlorophyll contents
and antioxidant activities established escalation in protein denaturation. Our results are
like those of Li et al. (2013), under high-temperature environment, glutenin biosynthesis
declined, gliadin remained stable resulting in deteriorated grain proteins and quality.
Table 4.1.10: Effect of heat stress on malondialdehyde of wheat varieties
A. Mean sum of square
Source of variation DF Malondialdehyde
Blocks 3 8.540
Heat (H) 1 2.940*
Error I 3 0.207
Genotypes (V) 10 0.092**
H × V 10 0.015NS
Error II 60 0.009* = Significant (p ≤ 0.05); ** = Significant (p ≤ 0.01); NS = Non-significant
B. Comparison of treatments’ means
Treatments Malondialdehyde (µmol g-1)
Heat stress (H)
No heat stress (H0) 0.94 B
Heat from spike to grain filling (H1) 1.31 A
Tukey’s HSD (p ≤ 0.05) 0.308
Genotypes (V)
Punjab-2011 1.13 AB
51

AARI-2011 1.20 AB
Galaxy-2013 1.16 AB
Millat-2011 1.20 AB
Aas-2011 0.91 C
Fareed-2006 1.12 AB
Chakwal-50 0.96 C
Mairaj-2008 1.06 BC
Pakistan-2013 1.24 A
NIBGE-NIAB-1 1.19 AB
Kohistan-97 1.21 AB
Tukey’s HSD (p ≤ 0.05) 0.158Any two means not sharing a letter in common differ significantly at p ≤ 0.05
52

Wheat genotypes with higher antioxidants depicted heat tolerance at physiological
maturity that consequently enhanced TSPs (Sharma et al., 2014a). Low MDA for ‘Aas-
2011’, ‘Chakwal-50’ and ‘Mairaj-2008’ can be attributed to higher proline, TPC and
glycine betaine accumulating capability of these genotypes under high temperature
environment. Highest lipid peroxidation in ‘Pakistan-2013’ and ‘Kohistan-97’ genotypes
might have decreased capability of these genotypes to accumulate proline, TPC and
glycine betaine. A strong negative association of glycine betaine, proline and phenolic
contents with MDA under heat stress confirmed negative impacts of MDA on proline and
glycine betaine accumulation (Table 4.1.11 and Table 4.1.12). Wheat genotypes with
lower MDA were better able to survive under stress conditions (Khaliq et al., 2015).
53

Table 4.1.11: Correlation analyses showing strength of association among recorded attributes of different wheat varieties under no heat stress (H0)
Parameters GPS TGW GY GFR GFD Chl a Chl b SOD POD CAT TPC LP GB TSPTGW - 0.42NS
GY 0.80** - 0.27NS
GFR - 0.54NS - 0.35NS - 0.54NS
GFD 0.80** - 0.25NS 0.85** - 0.50NS
Chl a 0.77** - 0.14NS 0.86** - 0.67* 0.96**Chl b 0.74** - 0.007NS 0.81** - 0.73* 0.94** 0.98**SOD 0.80** - 0.16NS 0.86** - 0.58NS 0.98** 0.97** 0.97**POD 0.83** - 0.19NS 0.89** - 0.62NS 0.98** 0.98** 0.97** 0.99**CAT 0.79** - 0.17NS 0.84** - 0.51NS 0.98** 0.95** 0.94** 0.99** 0.98**TPC 0.74** - 0.002NS 0.84** - 0.70* 0.94** 0.98** 0.97** 0.96** 0.97** 0.95**LP 0.75** - 0.03NS 0.86** - 0.68* 0.95** 0.98** 0.98** 0.98** 0.97** 0.96** 0.98**GB 0.76** - 0.10NS 0.81** - 0.58NS 0.98** 0.96** 0.97** 0.99** 0.98** 0.99** 0.96** 0.98**TSP 0.76** - 0.08NS 0.82** - 0.66* 0.97** 0.98** 0.99** 0.99** 0.98** 0.97** 0.97** 0.98** 0.99**MDA - 0.77** 0.09NS - 0.79** 0.67* - 0.95** - 0.95** - 0.97** - 0.96** - 0.97** - 0.95** - 0.95** - 0.95** - 0.96** - 0.97**
* = Significant (p ≤ 0.05); ** = Significant (p ≤ 0.01); NS = Non-significant; GPS = Grains per spike; TGW = 1000-grain weight; GY = Grain yield; GFR = Grain filling rate; GFD = Grain filling duration; Chl a = Chlorophyll a; Chl b = Chlorophyll b; SOD = Superoxide dismutase; POD = Peroxidase; CAT = Catalase; TPC = Total phenolic contents; LP = Leaf proline; GB = Glycine betaine; TSP = Total soluble proteins; MDA = Malondialdehyden (number of pairs of observations) = 88
54
Table 4.1.12: Correlation analyses showing strength of association among recorded attributes of different wheat varieties under heat from spike to grain filling (H1)
Parameters GPS TGW GY GFR GFD Chl a Chl b SOD POD CAT TPC LP GB TSPTGW 0.17NS
GY 0.89** 0.44NS
GFR - 0.60NS - 0.67* - 0.82**GFD 0.86** 0.42NS 0.93** - 0.71*Chl a 0.85** 0.44NS 0.95** - 0.76** 0.98**Chl b 0.83** 0.46NS 0.96** - 0.82** 0.98** 0.98**SOD 0.81** 0.46NS 0.95** - 0.80** 0.96** 0.96** 0.98**POD 0.79** 0.43NS 0.94** - 0.80** 0.93** 0.92** 0.96** 0.99**CAT 0.79** 0.47NS 0.94** - 0.81** 0.96** 0.95** 0.98** 0.99** 0.99**TPC 0.81** 0.47NS 0.96** - 0.82** 0.95** 0.95** 0.97** 0.99** 0.99** 0.99**LP 0.81** 0.45NS 0.94** - 0.80** 0.97** 0.97** 0.99** 0.99** 0.98** 0.99** 0.99**GB 0.76** 0.46NS 0.93** - 0.82** 0.92** 0.91** 0.95** 0.98** 0.99** 0.99** 0.99** 0.98**TSP 0.83** 0.51NS 0.97** - 0.90** 0.91** 0.94** 0.97** 0.95** 0.93** 0.94** 0.95** 0.94** 0.93**MDA - 0.78** - 0.45NS - 0.95** 0.87** - 0.87** - 0.89** - 0.94** - 0.93** - 0.94** - 0.93** - 0.94** - 0.92** - 0.94** - 0.98**
* = Significant (p ≤ 0.05); ** = Significant (p ≤ 0.01); NS = Non-significant; GPS = Grains per spike; TGW = 1000-grain weight; GY = Grain yield; GFR = Grain filling rate; GFD = Grain filling duration; Chl a = Chlorophyll a; Chl b = Chlorophyll b; SOD = Superoxide dismutase; POD = Peroxidase; CAT = Catalase; TPC = Total phenolic contents; LP = Leaf proline; GB = Glycine betaine; TSP = Total soluble proteins; MDA = Malondialdehyden (number of pairs of observations) = 88
55
Experiment II: Exploring role of foliar applied potassium to induce terminal heat
stress tolerance in wheat
Generally, high temperature environments deleteriously impacted grain yield,
yield components, biomass accumulation and spike growth compared to no heat stress
(H0). Moreover, antioxidants enzymes, the stay green trait, osmo-protectants, water
relations and grain quality were also disturbed under both treatments of heat stress over
the normal environment. However, ‘heat from spike to grain filling (H1)’ proved more
detrimental than ‘heat from flowering to grain filling (H2)’ for all the recorded
parameters. Whereas, exogenously applied potassium (K) and selenium (Se) remarkably
improved biochemical attributes which ultimately modulated agronomic and other
morphological regulations under control and heat.
4.2.1. Soil physio-chemical attributes
(a) Results
Temporal and soil variations were pronounced for various parameters and more
promising response was observed during the year 2015-16 than 2016-17 for most of
instances. Relatively more organic matter, total nitrogen, available phosphorous and
potassium were recorded during 2015-16 than 2016-17 (Table 3.1).
(b) Discussion
Better soil nutrient status during 2015-16 might have improved activation of
antioxidant enzymes, accumulation of osmo-protectants, which ultimately improved the
expression of morphological attributes. The increased availability of nitrogen,
phosphorous and potassium triggered the biosynthesis of leaf proteins, alleviated the
negative implications of oxidative stress and improved the utilization of light in
biosynthesis of carbohydrates and ultimately biomass and grain yield were more
promising (Waraich et al., 2012; Vimal et al., 2017). Likewise, more organic matter in
soil enhanced the water holding capacity of soil and thereby improved nutrient and water
availability in the soil profile (Bastida et al., 2017).
4.2.2. Weather elements
(a) Results
Comparatively more rainfall in 2015-16 than 2016-17 was recorded during
months of November, January, February and March. Whereas, higher rainfall in April
2016-17 (28.3 mm) was observed than in April 2015-16 (5.6 mm). Average temperature
was higher throughout growing season in year 2016-17 than 2015-16 (Table 3.1).
56

(b) Discussion
More rainfall during vegetative growth stages and lesser temperature during 2015-
16 than 2016-17 might have favorably enhanced biomass accumulation, grain yield, yield
components and biochemical response variables of the wheat crop. While, more rainfall
during April 2016-17 after grain filling stage aggravated lodging which eventually
decreased the grain yield and yield components. Moreover, overall rise of temperature
during growing period in 2016-17 might have negatively influenced all the studied
attributes. Coincidence of rainfall with vegetative stages was highly associated with the
yield and yield components. Contrarily, prolongation of rainy seasons up to reproductive
growth either depicted moderate or negative correlation with yield and yield components
of wheat crop (Bekele et al., 2017). While, slight rise of temperature during growing
season accelerated the progression of pheno-stages, adversely affecting pollination and
grain quality (Hatfield and Prueger, 2015).
4.2.3. Yield components and grain yield
(a) Results
High temperature either from ‘spike to grain filling’ or ‘flowering to grain filling’
significantly reduced grain yield and components. Although, ‘heat from spike to grain
filling’ depicted more negative effects than ‘‘heat from flowering to grain filling’.
Conversely, exogenous potassium effectively alleviated negative perturbations of heat
and significant effect of varying potassium concentrations was apparent. While, similar
trend was observed for foliar applied potassium in all main plots that resulted into non-
significant heat × potassium effect. However, number of fertile tillers did not vary
significantly under varying temperatures as well as exogenously applied potassium.
Significantly lower number of grains per spike and 1000-grain weight was
observed under ‘heat from spike to grain filling’ and ‘heat from flowering to grain filling’
as compared to control over the years. Whereas, ‘heat from spike to grain filling’
produced significantly lesser yield compared to ‘heat from flowering to grain filling’ and
non-stressed conditions over the years. Moreover, the number of grains per spike was
diminished by 35-37% and 25-26% under ‘heat from spike to grain filling’ and ‘heat from
flowering to grain filling’, respectively over the years. Whereas, ‘heat from spike to grain
filling’ and ‘heat from flowering to grain filling’ induced decrease in grain yield was 42-
45% and 25-31%, respectively compared to ambient conditions over the temporal
variability.
57

The number of grains per spike, 1000-grain weight and grain yield were enhanced
with increasing concentration of potassium. However, statistically similar number of
grains per spike was recorded for 30, 45 and 60 g L-1 potassium over the years. While,
statistically alike 1000-grain weight and grain yield were recorded for 45 and 60 g L-1
foliar potassium. Whereas, comparatively lesser and statistically similar number of grains
per spike, 1000-grain weight and grain yield were observed for control, 15 and 30 g L -1
exogenous potassium for both the studied years (Table 4.2.1 and Table 4.2.2).
Moreover, number of grains per spike was enhanced by 0.19-0.20 under control,
0.11-0.16 under ‘heat from spike to grain filling’ and 0.10-0.13 under ‘heat from
flowering to grain filling’ with each addition of 15 g L-1 potassium, over the two years.
While each 15 g L-1 increase of foliar potassium enhanced 1000-grain weight by 0.08-0.11
g under ‘no heat stress’, 0.15 g under ‘heat from spike to grain filling’ and 0.12-0.15 g
under ‘heat from flowering to grain filling’ over the years. Likewise, the increase of
potassium by each 15 g L-1 enhanced grain yield by 0.011-0.014 t ha-1 under the no ‘heat
stress’, 0.009-0.011 t ha-1 under ‘heat from spike to grain filling’ and 0.010 t ha-1 under
‘heat from flowering to grain filling’. Moreover, potassium modulated enhancement in
1000-grain weight and grain yield was higher under both treatments of heat as compared
to control over the years. Therefore, dependence of 1000-grain weight and grain yield (R2
values) on availability of potassium was enhanced under stress conditions over the control
(Figure 4.2.1 and Figure 4.2.2).
(b) Discussion
Heat was imposed from ‘spike to grain filling’ and ‘flowering to grain filling’
hence number of spike bearing tillers, that had already been determined, and therefore did
not vary significantly afterwards with heat and foliar potassium. Heat stress might have
escalated the degradation of chlorophyll and rate of biosynthesis of chlorophyll was lesser
as compared to degradation. Hence, aggravated senescence under heat over control might
have deleteriously affected yield components and yield. Moreover, senescence might
have downregulated the carbohydrates partitioning towards grains and resulted in
diminishment of number of grains, 1000-grain weight and eventually grain yield under
heat compared to control. Moreover, significant positive associations of chlorophyll a and
b contents with grains per spike, 1000-grain weight and grain yield further accomplished
the adverse impacts of chlorophyll degradation on grain yield and components under the
‘no heat stress’ (Table 4.2.15 a, c), ‘heat from spike to gain filling’ (Table 4.2.16 a, c) and
58

‘heat from flowering to grain filling’ (Table 4.2.17 a, c) over the years 2015-16 and 2016-
17.
Table 4.2.1: Effect of foliar applied potassium on fertile tillers and grains per spike of heat stressed wheat
A. Mean sum of squares
Source of
variationDF
Fertile tillers Grains per spike
2015-16 2016-17 2015-16 2016-17
Blocks 2 152179 141942 4367.64 3622.50
Heat (H) 2 1398NS 1949NS 1225.21** 1071.67**
Error I 4 10367 4296 31.50 34.49
Potassium (K) 4 3299NS 939NS 151.76** 113.42**
H × K 8 769NS 205NS 7.98NS 5.03NS
Error II 24 1299 669 22.36 16.51
** = Significant (p ≤ 0.01); NS = Non-significant
B. Comparison of treatments’ means
TreatmentsFertile tillers per m2 Grains per spike
2015-16 2016-17 2015-16 2016-17
Heat stress (H)
No heat stress (H0) 280 281 48.5 A 46.7 A
Heat from spike to grain filling (H1) 300 300 31.1 B 30.3 B
Heat from flowering to grain filling (H2) 280 301 35.8 B 35.1 B
Tukey’s HSD (p ≤ 0.05) NS NS 7.30 7.65
Potassium foliar spray (K)
Control/ water spray (K0) 303 301 35.6 BC 33.8 B
15 g L-1 potassium (K15) 312 303 34.1 C 34.5 B
30 g L-1 potassium (K30) 295 299 37.1 ABC 36.4 AB
45 g L-1 potassium (K45) 267 289 43.5 A 40.5 A
60 g L-1 potassium (K60) 274 278 42.1 AB 41.7 A
Tukey’s HSD (p ≤ 0.05) NS NS 6.57 5.64
Year mean 290 294 38.5 37.4
Tukey’s HSD (p ≤ 0.05) NS NSAny two means not sharing a letter in common differ significantly at p ≤ 0.05; NS = Non-significant
59
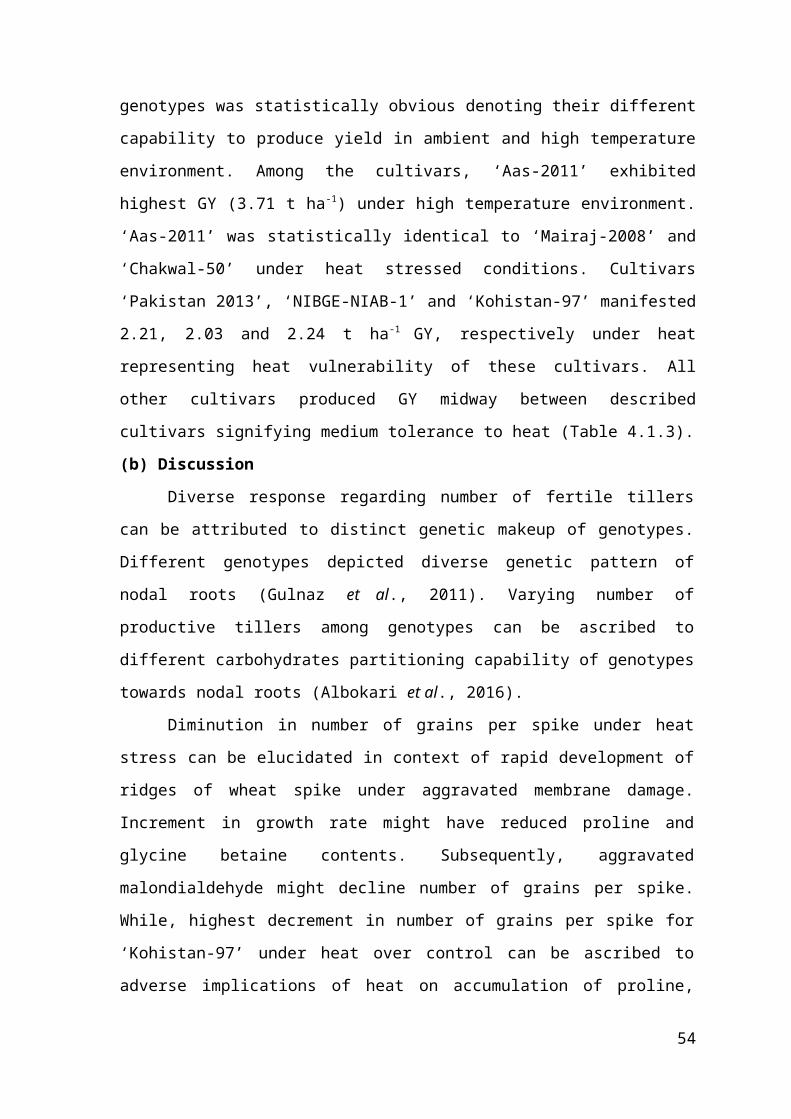
Figure 4.2.1: Regression analysis for effect of foliar applied potassium on grains per spike of heat stressed wheat
H0 = No heat stress; H1 = Heat from spike to grain filling; H2 = Heat from flowering to grain filling
60
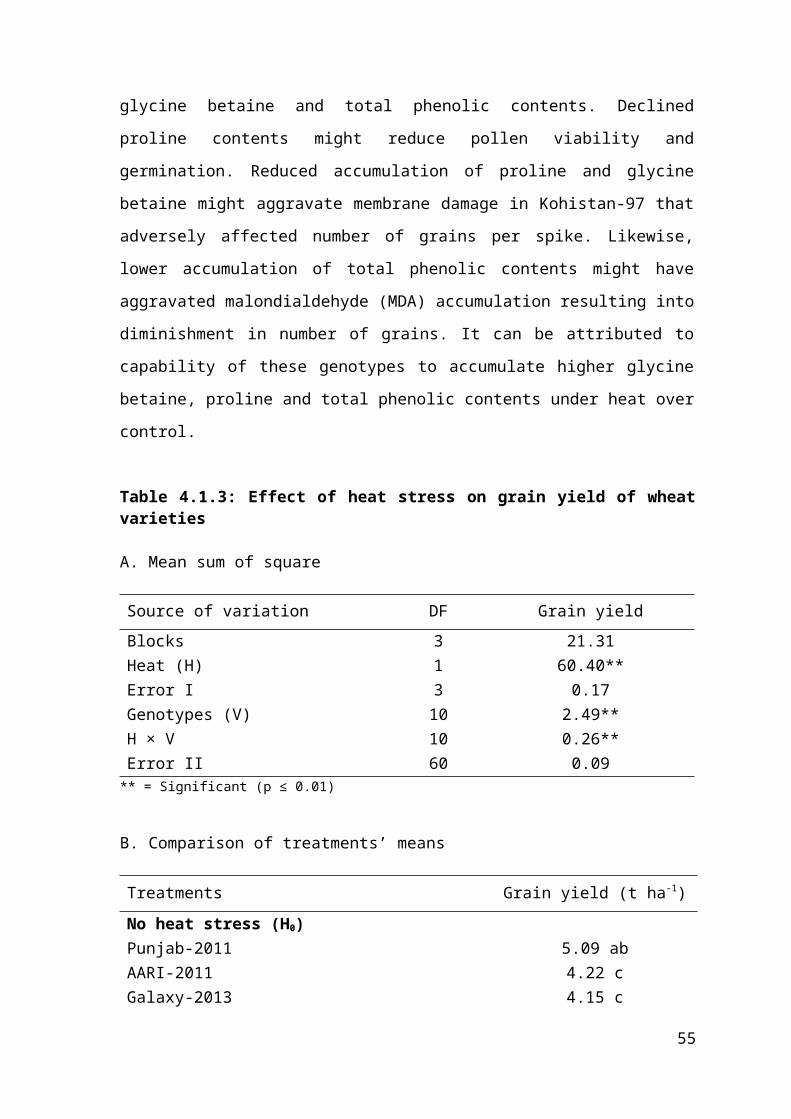
Table 4.2.2: Effect of foliar applied potassium on 1000-grain weight and grain yield of heat stressed wheat
A. Mean sum of square
Source of
variationDF
1000-grain weight Grain yield
2015-16 2016-17 2015-16 2016-17
Blocks 2 1713.29 998.30 3.389 4.660
Heat (H) 2 1217.21** 961.59** 28.918** 18.553**
Error I 4 25.12 34.75 0.191 0.219
Potassium (K) 4 77.20** 99.59** 0.654** 0.641**
H × K 8 4.16NS 2.02NS 0.041NS 0.015NS
Error II 24 7.21 7.54 0.064 0.059** = Significant (p ≤ 0.01); NS = Non-significant
B. Comparison of treatments’ means
Treatments1000-grain weight (g) Grains yield (t ha-1)
2015-16 2016-17 2015-16 2016-17
Heat stress (H)
No heat stress (H0) 56.7 A 54.3 A 6.01 A 5.25 A
Heat from spike to grain filling (H1) 38.9 B 39.3 B 3.29 C 3.04 C
Heat from flowering to grain filling (H2) 45.0 B 42.0 B 4.17 B 3.96 B
Tukey’s HSD (p ≤ 0.05) 6.53 7.676 0.569 0.609
Potassium foliar spray (K)
Control/ water spray (K0) 43.8 C 41.8 B 4.20 C 3.78 B
15 g L-1 potassium (K15) 44.9 C 42.6 B 4.28 C 3.87 B
30 g L-1 potassium (K30) 45.8 BC 44.2 B 4.42 BC 4.05 AB
45 g L-1 potassium (K45) 49.2 AB 48.4 A 4.72 AB 4.34 A
60 g L-1 potassium (K60) 50.6 A 49.1 A 4.82 A 4.37 A
Tukey’s HSD (p ≤ 0.05) 3.73 3.81 0.352 0.337
Year mean 46.8 45.2 4.49 4.08
Tukey’s HSD (p ≤ 0.05) NS NSAny two means not sharing a letter in common differ significantly at p ≤ 0.05; NS = Non-significant
61

Figure 4.2.2: Regression analysis for effect of foliar applied potassium on 1000-grain weight and grain yield of heat stressed wheat
H0 = No heat stress; H1 = Heat from spike to grain filling; H2 = Heat from flowering to grain filling
62
Imposition of heat stress at reproductive stages decreased the number of grains per
spike by 39%, 1000-grain weight by 27% and grain yield by 79% compared to no heat
stress conditions (Pimentel et al., 2015).
The heat induced decrease in yield and yield components can also be ascribed to
lipid peroxidation of bio-membranes at cellular level. Heat stress might have accelerated
the synthesis of reactive oxygen species (ROS) and thus caused oxidative stress.
Oxidative stress down regulated the biosynthesis of superoxide dismutase, which
ultimately slowed down the conversion of superoxide radicals to hydrogen peroxide and
water. While, diminished activities of catalase and peroxidase enzymes under heat further
accomplished the accelerated production of superoxide radicals and worsening of
oxidative stress under heat. Faster production of ROS might have lessened the plant
capability to make osmotic adjustments under high temperature environment. So, a
significant positive association of antioxidants and phenolics with yield and yield
components for most of instances accomplished the negative impacts of lesser
biosynthesis of antioxidants on yield and components (Table 4.2.15-4.2.17 a, c).
Similarly, positive and significant correlation of antioxidants with osmo-protectants
further established the perturbations in water relations owing to lesser synthesis of
antioxidants and phenolics (Table 4.2.15-4.2.17 b, d). Negative impacts of heat caused the
grain yield reduction by 6-11% in different genotypes (Feng et al., 2014). Similarly,
imposition of heat decreased the activities of superoxide dismutase, peroxidase, catalase
and glutathione reductase in heat sensitive and moderately sensitive genotypes (Wang et
al., 2014).
Potassium availability under heat might have sustained the allocation of
carbohydrates to spike development for longer duration, protracted grain filling duration
and ultimately enhanced number of grains per spike. Availability of potassium might
have improved the capacity of cells to retain water leading to activation of hydrolases and
growth. Therefore, grain filling rate was enhanced which resulted in increase of 1000-
grain weight and grain yield under ambient and heat stress conditions. Enhancement of
grain filling rate and duration owing to potassium was also confirmed from the
significant, strong and positive association of shoot potassium contents with grain filling
rate and duration for most of times over the temporal variability (Table 4.2.15-4.2.17 a,
c). Availability of potassium enhanced grain filling rate by 0.8% and duration by 1.6% in
maize crop. Prolongation of grain filling time ultimately enhanced grain yield (Liu et al.,
2011). Imposition of stress after the anthesis adversely affected the activities of catalase,
63

superoxide dismutase and glutathione reductase while application of potassium alleviated
adverse impacts of stress (Xiaokang et al., 2017).
Increase in superoxide dismutase under higher doses of potassium over control
might have enhanced the detoxification superoxide to hydrogen peroxide, which acts as a
substrate for catalase and peroxidase. Besides, higher shoot potassium contents under
potassium conferred heat tolerance through regulations in antioxidants, phenolics, lipid
peroxidation and water relations of wheat and the same was confirmed from positive and
strong association of shoot potassium contents with these attributes over the years (Table
4.2.15-4.2.17 b, d). Foliar application of potassium enhanced photosynthetic pigments,
gaseous exchange, accumulation of proline, superoxide dismutase, glutathione reductase
and peroxidase. While, improvements in biochemical attributes depicted strong and
positive correlation with morphological attributes (Jan et al., 2017). Similarly, availability
of potassium under stress environment enhanced photosynthetic carbohydrates, regulated
stomatal conductance, improved the antioxidants activities and accumulation of osmo-
protectants (Zahoor et al., 2017b).
4.2.4. Biomass accumulation
(a) Results
Heat stress significantly decreased biological, straw yield, harvest index and plant
height compared to ‘no heat stress’. Whereas, foliar application of potassium remarkably
improved biomass accumulating attributes over water spray (control). While, similar
potassium mediated improvements were observed under ‘no heat stress’, ‘heat from spike
to grain filling’ and ‘heat from flowering to grain filling’. Therefore, interaction of heat
stress and foliar applied potassium was non-significant for biological, straw yield, harvest
index, and plant height.
Significantly higher biological, straw yield, harvest index and plant height were
recorded under ‘no heat stress’ compared to ‘heat from spike to grain filling’ and ‘heat
from flowering to grain filling’ over the years. Moreover, ‘heat from spike to grain
filling’ and ‘heat from flowering to grain filling’ induced diminution in biological yield
was 34% and 19-22% respectively compared to ‘no heat stress’ over the 2015-16 and
2016-17. While, harvest index was diminished by 12-17% under ‘heat from spike to grain
filling’ and 6-10% under ‘heat from flowering to grain filling’ compared to ‘no heat
stress’ over the years. Likewise, ‘heat from spike to grain filling’ and ‘heat from
flowering to grain filing’ caused decline in straw yield was 26-18% and 16% respectively,
compared to non-stressed conditions. Similarly, plant height was decreased by 20-21%
64

under ‘heat from spike to grain filling’ and 11-13% under ‘heat from flowering to grain
filling’ over the temporal variability.
Biological, straw yield, harvest index and plant height response was linear with
enhancing foliar concentration of potassium. Though, foliar potassium modulated
improvements were dissimilar for different biomass accumulating attributes of heat
stressed wheat crop. Relatively more and statistically comparable biological yield and
plant height were recorded with 45 and 60 g L-1 foliar potassium over the years. Whereas,
15, 30, 45 and 60 g L-1 exogenous potassium depicted statistically alike harvest indices
during 2015-16 and straw yield during 2016-17. While, statistically similar harvest index
and straw yield during 2016-17 and 2015-16 respectively were recorded with 30, 45 and
60 g L-1 foliar potassium. Moreover, relatively lesser and statistically alike response of
biomass accumulating variables was observed with exogenous application of water spray
(control), 15 and 30 g L-1 potassium over the two years study period (Table 4.2.3 and
Table 4.2.4).
Foliar potassium modulated improvements in biological yield were 0.021-0.022,
0.014-0.015 and 0.017-0.018 t ha-1 with each increment of 15 g L-1 exogenous potassium
under ‘no heat stress’, ‘heat from spike to grain filling’ and ‘heat from flowering to grain
filling, respectively over the two years. While, each unit application of potassium
enhanced harvest index by 0.02-0.03, 0.05-0.07 and 0.03% under ‘no heat stress’, ‘heat
from spike to grain filling’ and ‘heat from flowering to grain filling’ respectively over the
two years period. Likewise, potassium modulated enhancement in straw yield with the
increments in exogenous potassium rates was 0.007-0.010 t ha-1 under ‘no heat stress’,
0.004-0.005 t ha-1 under ‘heat from spike to grain filling’ and 0.007-0.008 t ha-1 under
‘heat from flowering to grain filling’ over the years. While, plant height was boosted by
0.13, 0.14-0.15 and 0.12-0.16 cm under ambient conditions, ‘heat from spike to grain
filling’ and ‘heat from ‘flowering to grain filling’ respectively with each one-unit
application of exogenous potassium. Moreover, improvements were generally more
dependent on potassium under the stress conditions than in non-stressed environments
since R2 was enhanced under heat compared to control (Figure 4.2.3 and Figure 4.2.4).
(b) Discussion
Heat stress might have enhanced the degradation while enhanced the biosynthesis
of photosynthetic pigments owing to disruption in activities of biosynthesizing enzymes.
Thus, decreased photosynthetic capability caused decreased accumulation of
carbohydrates and thus reduced biological yield, straw yield and plant height.
65
Table 4.2.3: Effect of foliar applied potassium on biological yield and harvest index of heat stressed wheat
A. Mean sum of square
Source of
variationDF
Biological yield Harvest index
2015-16 2016-17 2015-16 2016-17
Blocks 2 0.270 6.365 173.19 131.19
Heat (H) 2 91.14** 67.015** 191.62* 101.02**
Error I 4 0.250 0.958 13.78 1.63
Potassium (K) 4 1.629** 1.777** 7.97** 8.49**
H × K 8 0.086NS 0.076NS 0.84NS 1.56NS
Error II 24 0.207 0.132 1.51 1.00* = Significant (p ≤ 0.05); ** = Significant (p ≤ 0.01); NS = Non-significant
B. Comparison of treatments’ means
TreatmentsBiological yield (t ha-1) Harvest index (%)
2015-16 2016-17 2015-16 2016-17
Heat stress (H)
No heat stress (H0) 14.11 A 12.31 A 42.59 A 42.65 A
Heat from spike to grain filling (H1) 9.26 C 8.10 C 35.53 B 37.53 C
Heat from flowering to grain filling (H2) 10.94 B 9.91 B 38.12 AB 39.96 B
Tukey’s HSD (p ≤ 0.05) 0.651 1.274 4.834 1.664
Potassium foliar spray (K)
Control/ water spray (K0) 11.02 C 9.57 C 38.11 B 39.50 B
15 g L-1 potassium (K15) 11.12 BC 9.81 C 38.48 AB 39.45 B
30 g L-1 potassium (K30) 11.30 BC 10.05 BC 39.11 AB 40.30 AB
45 g L-1 potassium (K45) 11.70 AB 10.53 AB 40.34 A 41.22 A
60 g L-1 potassium (K60) 12.04 A 10.59 A 40.03 A 41.26 A
Tukey’s HSD (p ≤ 0.05) 0.632 0.505 1.706 1.386
Year mean 11.43 A 10.11 B 39.28 40.36
Tukey’s HSD (p ≤ 0.05) 0.844 NSAny two means not sharing a letter in common differ significantly at p ≤ 0.05; NS = Non-significant
66

Figure 4.2.3: Regression analysis for effect of foliar applied potassium on biological yield and harvest index of heat stressed wheat
H0 = No heat stress; H1 = Heat from spike to grain filling; H2 = Heat from flowering to grain filling
67

Table 4.2.4: Effect of foliar applied potassium on straw yield and plant height of heat stressed wheat
A. Mean sum of square
Source of
variationDF
Straw yield Plant height
2015-16 2016-17 2015-16 2016-17
Blocks 2 49.443 1.902 465.56 2515.94
Heat (H) 2 17.370** 14.544** 1665.10** 1712.40**
Error I 4 0.091 0.060 47.25 32.91
Potassium (K) 4 0.244* 0.280** 122.24** 98.80**
H × K 8 0.026NS 0.039NS 1.64NS 1.91NS
Error II 24 0.076 0.055 10.90 11.18* = Significant (p ≤ 0.05); ** = Significant (p ≤ 0.01); NS = Non-significant
B. Comparison of treatments’ means
TreatmentsStraw yield (t ha-1) Plant height (cm)
2015-16 2016-17 2015-16 2016-17
Heat stress (H)
No heat stress (H0) 8.10 A 7.06 A 106.1 A 101.4 A
Heat from spike to grain filling (H1) 5.97 C 5.06 C 85.1 C 80.2 C
Heat from flowering to grain filling (H2) 6.77 B 5.95 B 94.2 B 88.3 B
Tukey’s HSD (p ≤ 0.05) 0.393 0.319 8.95 7.47
Potassium foliar spray (K)
Control/ water spray (K0) 6.82 B 5.79 B 92.7 BC 87.0 C
15 g L-1 potassium (K15) 6.84 B 5.94 AB 91.9 C 87.4 BC
30 g L-1 potassium (K30) 6.88 AB 6.00 AB 93.5 BC 88.7 BC
45 g L-1 potassium (K45) 6.98 AB 6.19 A 96.8 AB 91.9 AB
60 g L-1 potassium (K60) 7.22 A 6.22 A 100.8 A 94.8 A
Tukey’s HSD (p ≤ 0.05) 0.382 0.326 4.58 4.64
Year mean 6.94 A 6.03 B 95.1 90.0
Tukey’s HSD (p ≤ 0.05) 0.587 NSAny two means not sharing a letter in common differ significantly at p ≤ 0.05; NS = Non-significant
Figure 4.2.4: Regression analysis for effect of foliar applied potassium on straw yield and plant height of heat stressed wheat
68
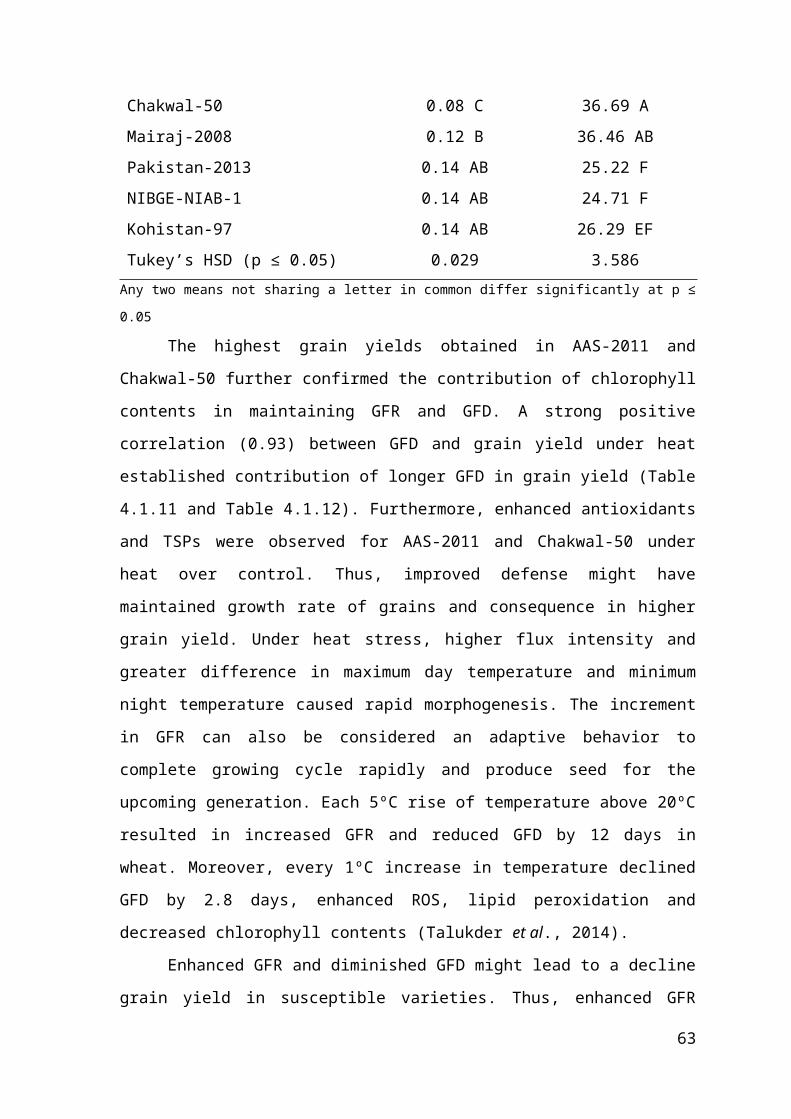
H0 = No heat stress; H1 = Heat from spike to grain filling; H2 = Heat from flowering to grain filling
Moreover, strong, positive and significant association of these parameters with
chlorophyll pigments was observed for most of instances under ‘no heat stress’ (Table
69
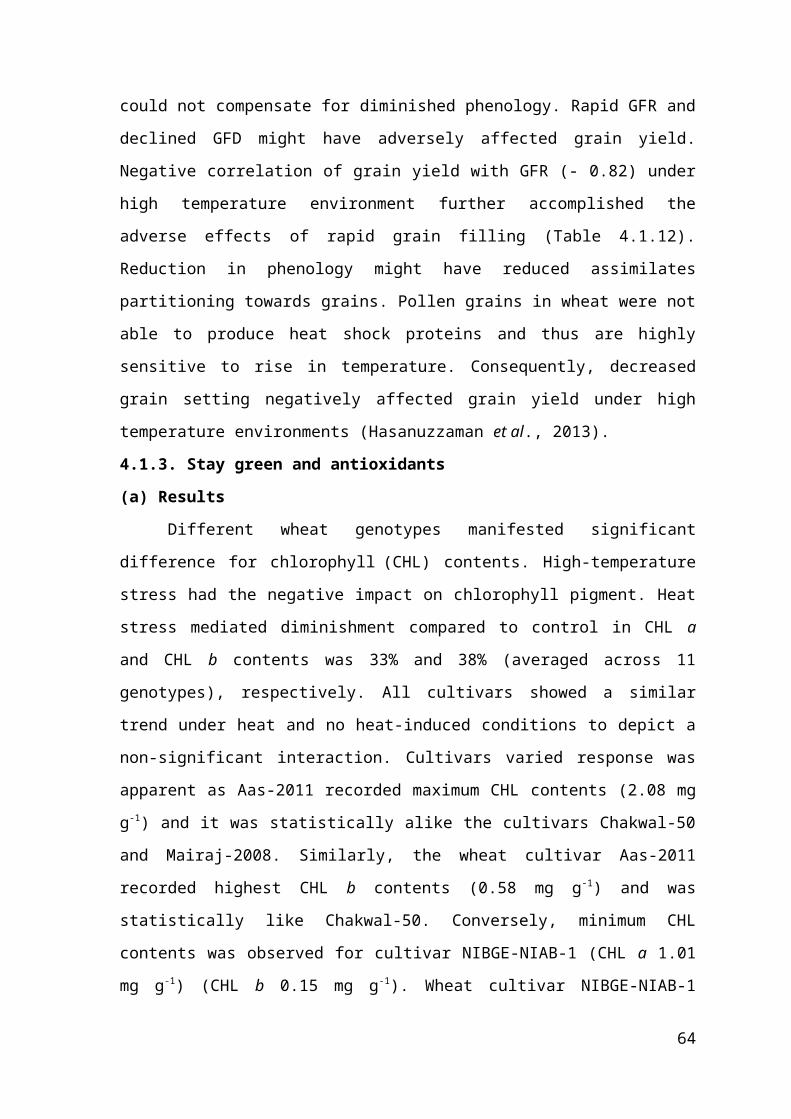
4.2.15 a, c), ‘heat from spike to grain filling’ (Table 4.2.16 a, c) and ‘heat from flowering
to grain filling’ over years (Table 4.2.17 a, c). High temperature impaired activities of
amino-levulinic acid dehydratase and porphobilinogen deaminase which eventually
downregulated the biosynthesis of chlorophyll and assimilates availability for vegetative
growth (Hemantaranjan et al., 2014).
In this regard, lesser vegetative growth might have reduced the light interception
and photosynthesis under heat. Thereafter, decrease in carbohydrates availability for grain
filling caused lesser harvest index under heat over control. Eventually, the number of
grains per spike and 1000-grain weight were decreased as outcome of poor biological
yield and lesser plant height. Moreover, heat induced decline in grain yield was more than
decrease in biological yield leading to decreased harvest index. Decrease of harvest index
because of poor biomass accumulation was also established from strong, positive and
highly significant correlation of biological yield and plant height with number of grains
per spike and 1000-grain weight for most of instances under varying heat stressed pheno-
stages over the years (Table 4.2.15-4.2.17 a, c). Heat stress during flowering stage of
wheat escalated grain filling rate, reduced grain filling duration and assimilate
partitioning towards grains. Ultimately, adverse impacts of heats instigated a significant
reduction in grain yield and components (Stratonovitch and Semenov, 2015).
Decrease in biological and straw yield under heat can also be elucidated in context
of adverse impacts of heat on plant height. Heat stress might have deprived the capability
of plant to make osmotic adjustments and thus water relation attributes were disturbed.
Therefore, cell elongation was impaired due to depressed water potential and growth was
affected. This explanation was also confirmed from strong, positive and pronouncing
association of these parameters with leaf proline, glycine betaine and total soluble
proteins under varying temperatures over the two studied years (Table 4.2.15-4.2.17 a, c).
Coincidence of heat stress during flowering and grain filling stages decreased the plant
height growth and dry matter accumulation in wheat (Liu et al., 2016a).
Exogenous potassium mediated improvements in biological yield, straw yield,
harvest index and plant height can be explained in terms of potassium mediated
improvements in accumulation of osmo-protectants. Availability of potassium under heat
increased the plant capability to accumulate proline, glycine betaine and total soluble
proteins. Availability of potassium further improved the biosynthesis of proline and
proline quenches singlet oxygen and hydroxyl radicals. Therefore, the most devastating
ROS (singlet oxygen and hydroxyl radical) regarding lipid peroxidation of bio-
70

membranes might have been detoxified through potassium mediated accumulation of
proline. Thereby, catalase and peroxidase activities were increased. Consequently,
membrane stability and water retaining capacity at cellular level might have improved
which decreased the sensitivity to heat. Proline mediated detoxification of hydroxyl
radical and singlet oxygen was also established from the strong positive and highly
significant correlation of proline with the catalase and peroxidase activity under different
heat stressed growth stages of wheat over the years (Table 4.2.15-4.2.17 b, d). Whereas,
strong, negative and significant association of biomass accumulating attributes with
malondialdehyde for most of cases was recorded. Hence, potassium mediated
improvement in membrane stability was accomplished (Table 4.2.15-4.2.17 a, c).
Availability of potassium under the stressed conditions enhanced water potential,
membrane stability and gaseous exchange of rice but decrease of malondialdehyde was
negatively associated with accumulation of proline. Hence, improved proline contents
under stress resulted into improved growth of rice (Zain and Ismail, 2016). Likewise,
enhancing potassium concentration in flag leaf in barley caused more activation of
hydrolases, which ultimately improved vegetative growth (Hosseini et al., 2016).
Moreover, potassium modulated enhancements in accumulation of total soluble
proteins and glycine betaine might have conferred heat tolerance by preserving water
under heat. The role of osmo-protectants in enhancing water potential and membrane
integrity was established from strong positive correlation of biological yield, harvest
index and plant height with total soluble proteins, proline and glycine betaine under
different growth stages and temperature over the years (Table 4.2.15-4.2.17 a, c).
Exogenous application of potassium enhanced the glycine betaine accumulation and
water potential in wheat under stressed conditions and thus imparted tolerance (Raza et
al., 2014).
4.2.5. Growth of spike
(a) Results
Wheat spike length, spikelets per spike, grain filling rate and duration were
seriously affected by heat. Moreover, longer heat duration proved more deleterious over
the two years study period. Whereas, exogenous potassium effectively alleviated negative
impacts of high temperature and significantly improved spike traits and growth. Yet,
interaction of heat and foliar potassium had a non-significant impact on spike growth
related parameters.
71

Significantly smaller spikes were observed under ‘heat from spike to grain filling’
compared to ‘no heat stress’ and ‘heat from flowering to grain filling’ over years. While,
statistically similar and significantly fewer spikelets per spike and statistically prolonged
and alike grain filling rate were recorded under both heat treatments compared to ‘no heat
stress’ over the years. Whereas, grain filling duration was reduced with the increasing
duration of heat imposition.
Furthermore, ‘heat from spike to grain filling’ and ‘heat from flowering to grain
filling’ triggered decline in spike length was 45-53% and 25-29% and in spikelets per
spike was 29-36% and 20-27% respectively compared to no heat stress over the two years
study duration. An acceleration of grain filling rate by 50-57% under ‘heat from spike to
grain filling’ and 42-43% under ‘heat from flowering to grain filling’ was quantified over
years. Whereas, heat induced diminishment in grain filling duration was 36% (2015-16)
and 45% (2016-17) under ‘heat from spike to grain filling’. Whereas, ‘heat from
flowering to grain filling’ triggered shortening in grain filling duration was 21% (2015-
16) and 27% (2016-17). Application of foliar applied potassium remarkably reduced the
negative impacts of heat. Concerning this, significantly more and statistically alike spike
length, spikelets per spike, grain filling rate and duration were observed with 45 and 60 g
L-1 exogenous potassium compared to other potassium concentrations over the years
(Table 4.2.5 and Table 4.2.6).
A linear response was obvious with the enhancing concentrations of foliar
potassium for all spike related attributes. An increase of 0.09-0.14, 0.05-0.07 and 0.05 cm
in spike length was recorded with each unit enhancement of foliar potassium under ‘no
heat stress’, ‘heat from spike to grain filling’ and ‘heat from flowering to grain filling’,
respectively over two years. Whereas, each 15 g L-1 mediated improvements in spikelets
per spike were 0.06-0.07 cm under ‘no heat’, 0.04-0.06 cm under ‘heat from spike to
grain filling and 0.04 cm under ‘heat from flowering to grain filling’ over temporal
variability. While, exogenous potassium triggered improvements in grain filling rate were
almost negligible over the years but 45 and 60 g L-1 were still high enough to produce
significant enhancement in grain filling rate. Whereas, prolongation of 0.8-0.9 days under
‘no heat stress’, 0.09 days under ‘heat from spike to grain filling’ and 0.06-0.07 days
under ‘heat from flowering to grain filling’ with each 15 g L-1 addition of foliar potassium
was observed over the 2015-16 and 2016-17 (Figure 4.2.5 and Figure 4.2.6).
72

Table 4.2.5: Effect of foliar applied potassium on spike length and spikelets per spike of heat stressed wheat
A. Mean sum of square
Source of
variationDF
Spike length Spikelets per spike
2015-16 2016-17 2015-16 2016-17
Blocks 2 124.64 152.63 200.13 209.27
Heat (H) 2 334.88** 427.81** 110.58** 150.93**
Error I 4 3.77 3.20 3.96 3.81
Potassium (K) 4 27.75** 32.64** 15.68** 13.10**
H × K 8 1.79NS 5.11NS 0.48NS 0.77NS
Error II 24 0.88 2.46 1.53 1.15** = Significant (p ≤ 0.01); NS = Non-significant
B. Comparison of treatments’ means
TreatmentsSpike length (cm) Spikelets per spike
2015-16 2016-17 2015-16 2016-17
Heat stress (H)
No heat stress (H0) 20.9 A 20.1 A 18.2 A 16.9 A
Heat from spike to grain filling (H1) 11.5 C 9.4 C 12.9 B 10.9 B
Heat from flowering to grain filling (H2) 15.7 B 14.2 B 14.5 B 12.3 B
Tukey’s HSD (p ≤ 0.05) 2.53 2.33 2.59 2.54
Potassium foliar spray (K)
Control/ water spray (K0) 14.6 BC 12.8 C 14.0 C 12.0 C
15 g L-1 potassium (K15) 14.1 C 13.0 C 13.8 C 12.5 C
30 g L-1 potassium (K30) 15.8 B 14.1 BC 14.9 BC 13.1 BC
45 g L-1 potassium (K45) 17.6 A 15.8 AB 16.4 AB 14.5 AB
60 g L-1 potassium (K60) 18.0 A 17.2 A 16.7 A 14.7 A
Tukey’s HSD (p ≤ 0.05) 1.30 2.18 1.72 1.49
Year mean 16.0 14.6 15.1 13.4
Tukey’s HSD (p ≤ 0.05) NS NSAny two means not sharing a letter in common differ significantly at p ≤ 0.05; NS = Non-significant
Figure 4.2.5: Regression analysis for effect of foliar applied potassium on spike length and spikelets per spike of heat stressed wheat
73

H0 = No heat stress; H1 = Heat from spike to grain filling; H2 = Heat from flowering to grain filling
Table 4.2.6: Effect of foliar applied potassium on grain filling rate (GFR) and grain filling duration (GFD) of heat stressed wheat
74

A. Mean sum of square
Source of
variationDF
Grain filling rate Grain filling duration
2015-16 2016-17 2015-16 2016-17
Blocks 2 0.00200 0.00645 177.76 200.94
Heat (H) 2 0.02614** 0.01463** 659.09* 956.28**
Error I 4 0.00057 0.00040 44.69 37.98
Potassium (K) 4 0.00402** 0.00233** 45.74** 34.56**
H × K 8 0.00020NS 0.00006NS 1.98NS 2.10NS
Error II 24 0.00022 0.00016 2.02 1.97* = Significant (p ≤ 0.05); ** = Significant (p ≤ 0.01); NS = Non-significant
B. Comparison of treatments’ means
TreatmentsGFR (g per day) GFD (days)
2015-16 2016-17 2015-16 2016-17
Heat stress (H)
No heat stress (H0) 0.14 B 0.12 B 36.27 A 34.87 A
Heat from spike to grain filling (H1) 0.22 A 0.18 A 23.07 B 19.00 B
Heat from flowering to grain filling (H2) 0.20 A 0.17 A 28.60 AB 25.43 B
Tukey’s HSD (p ≤ 0.05) 0.031 0.026 8.704 8.024
Potassium foliar spray (K)
Control/ water spray (K0) 0.17 C 0.14 B 28.11 B 24.10 D
15 g L-1 potassium (K15) 0.16 C 0.14 B 26.67 B 24.99 CD
30 g L-1 potassium (K30) 0.19 B 0.15 B 28.56 B 26.33 BC
45 g L-1 potassium (K45) 0.20 AB 0.17 A 31.00 A 27.96 AB
60 g L-1 potassium (K60) 0.21 A 0.18 A 32.22 A 28.78 A
Tukey’s HSD (p ≤ 0.05) 0.020 0.017 1.972 1.949
Year mean 0.19 A 0.16 B 29.31 26.43
Tukey’s HSD (p ≤ 0.05) 0.017 NSAny two means not sharing a letter in common differ significantly at p ≤ 0.05; NS = Non-significant
Figure 4.2.6: Regression analysis for effect of foliar applied potassium on grain filling rate and grain filling duration of heat stressed wheat
75

H0 = No heat stress; H1 = Heat from spike to grain filling; H2 = Heat from flowering to grain filling
(b) Discussion
76

Heat stress might have impaired the capability of plant to utilize excessive solar
radiations for biosynthesizing of carbohydrates. Consequently, biological yield was
decreased which eventually downregulated the assimilate partitioning towards
reproductive parts. Hence, carbohydrates availability for development of rachis might
have declined. This, decrease in number of ridges on rachis of spike ultimately lead to
consequence of decreased spike length and spikelets per spike. Decrease of spike length
and spikelets per spike were attributable to biological yield was also accomplished from
their strong, positive and significant association under varying heat stress treatments over
the years (Table 4.2.15-4.2.17 a, c) Improvement in plant height increases the
photosynthetically active area for partitioning of assimilates to reproductive parts of
wheat. Ultimately, the number of ridges on the rachis, number of grains and spikelets per
spike enhance (Slafer et al., 2015). Increase of biological yield was highly correlated to
spike length, spikelets per spike, grain filling period and grain yield (Wolde et al., 2016).
In addition to biological yield, disruption in water, osmotic and turgor potential
under heat stress might be another reason for decreased spike length and spikelets per
spike. Heat stress depressed the capability of plant to accumulate osmo-protectants and
thus diminished water potential. It caused lesser extension of cells and spike growth was
not up to the mark. The aggravated damage to membranes because of lipid peroxidation
might have promoted sterility of pollens and development of ovules. Consequently, the
number of spikelets per spike were decreased. Moreover, water potential mediated
decrease in spike length and spikelets per spike was accomplished from their strong,
positive and significant correlation over the temporal variability. A positive and
reasonably strong correlation of osmo-protectants with spike traits was also recorded over
the years. This also provided the evidence for negative impacts of depressed
accumulation of osmo-protectants on spike length and spikelets per spike (Table 4.2.15-
4.2.17 a, c). High temperature stress (2.7-5.2°C more temperature than ambient
conditions) decreased the spike length and spikelets per spike and ultimately grain yield
was decreased by 21% in heat tolerant genotype and 36% in heat susceptible genotype
(Dwivedi et al., 2016). Imposition of heat stress at anthesis for 7 days decreased spike
productivity, length and spiklets per spike of wheat (Hlaváčová et al., 2017). Decreased
spikelets and spike length was due to impaired pollen variability under heat stress
(Paupière et al., 2014).
Acceleration of grain filling rate and shortening of duration might be an adaptive
response to produce seeds for the next generation under heat stress environment.
77

However, rapid senescence under heat might have decreased capability of source organs
to satiate carbohydrate needs of rapidly growing spikes. Hence, it resulted in decreased
number of grains per spike and 1000-grain weight under heat stress. Such relationship
was also established from strong, positive and significant correlation of these attributes
with chlorophyll a and b. Shortening of phenology and rapid grain filling rate can also be
a consequence of aggravated oxidative stress. Excessive synthesis of superoxide radicals
might have initiated a cascade of reactions for even more burst of ROS and thus
destabilized photosystem and biosynthesis of chlorophyll. Ultimately, senescence was
rapid relative to carbohydrates supply. Whereas, strong, significant and positive
association of antioxidants with grain filling rate and duration further accomplished the
oxidative stress mediated damages for grain filling rate and duration (Table 4.2.15-4.2.17
a, c). Stress conditions aggravated oxidative stress, downregulated biosynthesis of
glutathione reductase and other antioxidants and significantly reduced grain filling
duration in wheat. Accelerated senescence of the flag leaf was highly associated with
shortening of phenology of wheat under stressed environments (Gallé et al., 2013).
Potassium mediated improvements in grain filling rate and extension of duration
of filling can be attributed to improvements in membrane stability. Enhancing potassium
enhanced accumulation of osmo-protectants and osmotic potential and thereby retained
cellular water under heat. Ultimately, sensitivity of photosynthesis to heat might have
decreased and partitioning of carbohydrates to grains was sustained for relatively longer
duration compared to water spray. Improvement in biological yield due to potassium
application also provided indication of extension of grain filling duration and acceleration
of grain filling rate with photosynthesis. Such type of explanation was also supported by
correlation analyses indicating a positive and strong correlation of these attributes with
shoot potassium contents over the years (Table 4.2.15-4.2.17 a, c). Application of
potassium enhanced grain filling rate, duration and ultimately yield (Liu et al., 2011).
Foliar application of potassium improved quality traits of terminal heat stressed wheat,
spike length and spikelets per spike (Rahman et al., 2014).
Exogenous potassium induced improvements in water relations might also have
alleviated oxidative stress enhanced biosynthesis of chlorophyll and wheat remained
green for longer duration. Hence, availability of source might have sustained
carbohydrates partitioning for a longer duration. Additionally, enhancement of 1000-grain
weight and grains per spike under heat stress because of potassium confirmed the
potassium modulation in transport of sucrose to grains. Besides, significant and strong
78
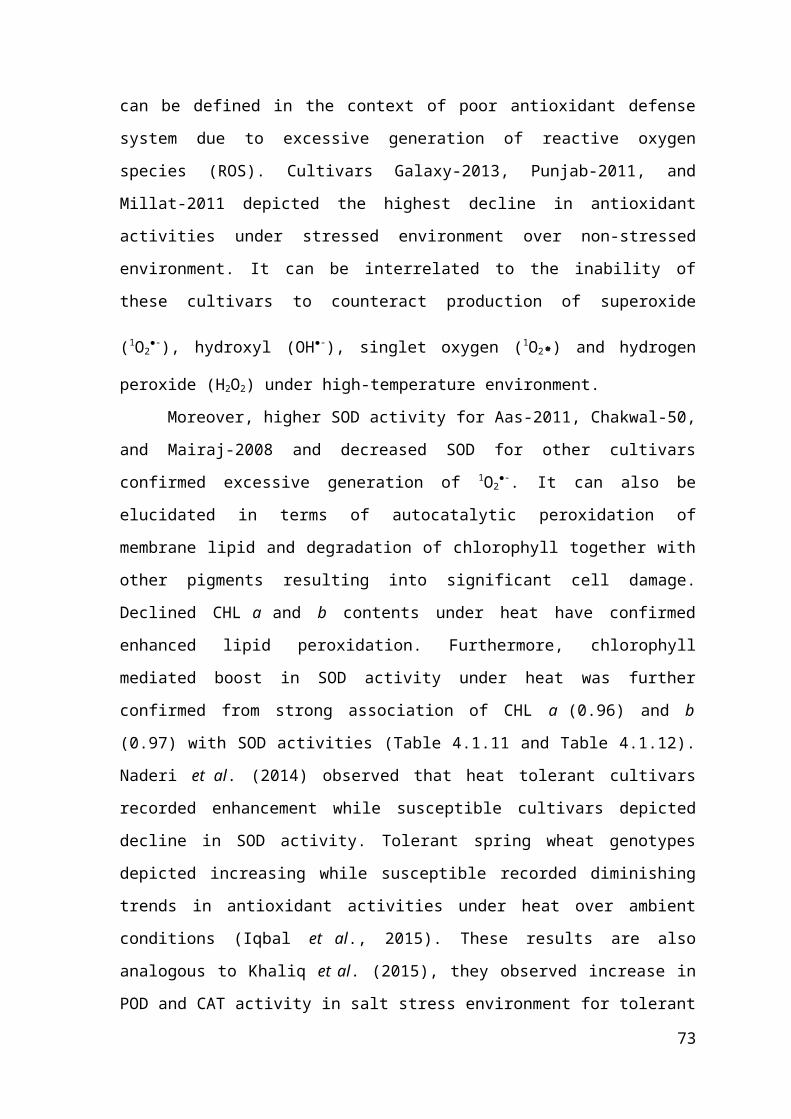
positive association of shoot potassium contents with chlorophyll a and b under ‘no heat
stress’ (Table 4.2.15 a, c), ‘heat from spike to grain filling’ (Table 4.2.16 a, c) and ‘heat
from flowering to grain filling’ (Table 4.2.17 a, c) established the potassium role in
enhancing the staying green trait. Supplementation of potassium enhanced the
accumulation of proline, soluble sugars, free amino acids and biosynthesis of chlorophyll
a and b under the stressed environment (Ahanger and Agarwal, 2017). The improved
cellular water status of wheat under the potassium availability improved the antioxidant
defense system which ultimately enhanced grain filling rate and duration (Xiaokang et al.,
2017).
4.2.6. Stay green and antioxidants
(a) Results
Heats stress adversely affected the biosynthesis of chlorophyll and antioxidants
compared to the control. Yet, relatively more degradation of chlorophyll and inhibition in
biosynthesis of antioxidants was observed under ‘heat from spike to grain filling’
compared to ‘heat from flowering to grain filling’. Increasing concentrations of
exogenous potassium significantly improved chlorophyll content and antioxidant
activities compared to water spray (control). However, similar responses under different
heat imposition treatments were recorded regarding potassium modulated improvements
in chlorophyll biosynthesis to result a non-significant ‘heat × foliar potassium’ effect.
Whereas, a significant interaction of heat stress and foliar applied potassium was
observed for antioxidants activities.
‘Heat from spike to grain filling’ and ‘heat from flowering to grain filling’ caused
degradation by 43-44% and 28-30% compared to ‘no heat stress’ in chlorophyll a
contents over the 2015-16 and 2016-17. While, chlorophyll b content was reduced by 51-
54% under ‘heat from spike to grain filling’ and 41-45% under ‘heat from flowering to
grain filling’ relative to ‘no heat stress’ over the temporal variability.
Foliar applied potassium significantly enhanced the biosynthesis of chlorophyll a
and b contents compared to water spray (control). Statistically similar and significantly
more chlorophyll a and b contents were quantified with 45 and 60 g L-1 foliar potassium
compared to other application rates over the two years study period. While, statistically
similar and significantly lesser chlorophyll a and b contents were measured for water
spray, 15 and 30 g L-1 exogenous potassium with the slight inconsistencies over the years
(Table 4.2.7). Moreover, each 15 g L-1 foliar potassium modulated improvements in
chlorophyll a contents were 0.0094-0.012 mg g-1 FW under ‘no heat stress’, 0.007 mg g-1
79

FW under ‘heat from spike to grain filling’ and 0.0068-0.0082 mg g-1 FW under ‘heat
from flowering to grain filling’ over 2015-16 and 2016-17. While, chlorophyll b contents
were improved by 0.0022-0.0035, 0.0019-0.0024 and 0.0019-0.0028 mg g-1 FW under ‘no
heat stress’, ‘heat from spike grain filling’ and ‘heat from flowering to grain filling’,
respectively over the years. Moreover, increase in chlorophyll contents with each unit
foliar application of potassium were generally more under stressed environment (with
little discrepancies) compared to ‘no heat stress’ over the years (Figure 4.2.7).
Heat stress, foliar potassium as well as interaction of heat and foliar potassium
significantly affected the activities of superoxide dismutase (SOD), peroxidase (POD),
catalase (CAT) and total phenolics (TPC). Under ambient conditions, significantly more
and statistically similar activities of SOD and CAT activities were recorded for 45 and 60
g L-1 foliar potassium over the years. Likewise, application of potassium at 45 and 60 g L -
1 during 2015-16 and 30, 45 and 60 g L-1 during 2016-17 depicted statistically alike and
significantly higher activities of POD and TPC under ‘no heat stress’ conditions.
Whereas, significantly higher activities of SOD, CAT, POD and TPC were recorded with
60 g L-1 foliar potassium under the heat stressed conditions over the two study years
(Table 4.2.8 and Table 4.2.9).
Upregulation in SOD activity due to per unit application of potassium were 1.13-
1.28 U per mg protein under ‘no heat stress’, 0.49-0.54 U per mg protein under ‘heat from
spike to grain filling’ and 0.51-0.55 U per mg protein under ‘heat from flowering to grain
filling’ was recorded over the years. While, improvements in POD activities with the per
unit application of potassium were 0.13-0.16 U per mg protein under ‘no heat stress’,
0.09-0.10 U per mg protein under ‘heat from spike to grain filling’ and 0.07-0.12 U per
mg protein under ‘heat from flowering to grain filling’ over the two years study period
(Figure 4.2.8).
Application of exogenous potassium enhanced CAT activity by 0.26-0.32 U per
mg protein under ‘no heat stress’, 0.12-0.16 U per mg protein under ‘heat from spike to
grain filling’ and 0.15-0.18 U per mg protein under ‘heat from flowering to grain filling’
over the years. Potassium triggered improvements in catalase activity were higher under
‘heat from flowering to grain filling’ during 2015-16 and under ‘no heat stress’ during
2016-17 compared to other treatments. Whereas, per unit enhancement in foliar
potassium improved TPC by 0.16-0.21 mg GAE g-1 under ‘no heat stress’, 0.08-0.10 mg
GAE per g-1 under ‘heat from spike to grain filling’ and ‘heat from flowering to grain
filling’ (Figure 4.2.9).
80

(b) Discussion
Degradation of chlorophyll contents in response to heat can be attributed to
damaged permeability of membranes under heat stress.
Table 4.2.7: Effect of foliar applied potassium on chlorophyll a (Chl a) and chlorophyll b (Chl b) contents of heat stressed wheat
A. Mean sum of square
Source of
variationDF
Chlorophyll a Chlorophyll b
2015-16 2016-17 2015-16 2016-17
Blocks 2 0.953 0.349 0.0255 0.0289
Heat (H) 2 2.819** 1.708** 0.3939** 0.3829**
Error I 4 0.024 0.017 0.0021 0.0014
Potassium (K) 4 0.341** 0.443** 0.0482** 0.0213**
H × K 8 0.006NS 0.013NS 0.0007NS 0.0002NS
Error II 24 0.013 0.010 0.0010 0.0009** = Significant (p ≤ 0.01); NS = Non-significant
B. Comparison of treatments’ means
TreatmentsChl a (mg g-1 FW) Chl b (mg g-1 FW)
2015-16 2016-17 2015-16 2016-17
Heat stress (H)
No heat stress (H0) 1.95 A 1.52 A 0.61 A 0.56 A
Heat from spike to grain filling (H1) 1.10 C 0.86 C 0.30 C 0.26 C
Heat from flowering to grain filling (H2) 1.40 B 1.07 B 0.36 B 0.31 B
Tukey’s HSD (p ≤ 0.05) 0.202 0.171 0.059 0.048
Potassium foliar spray (K)
Control/ water spray (K0) 1.33 B 0.92 C 0.36 BC 0.33 B
15 g L-1 potassium (K15) 1.29 B 0.96 C 0.35 C 0.34 B
30 g L-1 potassium (K30) 1.44 B 1.11 B 0.40 B 0.36 B
45 g L-1 potassium (K45) 1.61 A 1.35 A 0.49 A 0.41 A
60 g L-1 potassium (K60) 1.75 A 1.41 A 0.51 A 0.44 A
Tukey’s HSD (p ≤ 0.05) 0.161 0.143 0.045 0.042
Year mean 1.48 A 1.15 B 0.42 0.38
Tukey’s HSD (p ≤ 0.05) 0.177 NSAny two means not sharing a letter in common differ significantly at p ≤ 0.05; NS = Non-significant
81

Figure 4.2.7: Regression analysis for effect of foliar applied potassium on chlorophyll a and chlorophyll b contents of heat stressed wheat
H0 = No heat stress; H1 = Heat from spike to grain filling; H2 = Heat from flowering to grain filling
82

Table 4.2.8: Effect of foliar applied potassium on superoxide dismutase (SOD) and peroxidase (POD) contents of heat stressed wheat
A. Mean sum of square
Source of variation
DFSuperoxide dismutase Peroxidase
2015-16 2016-17 2015-16 2016-17Blocks 2 3987.8 1000.7 27.13 16.00Heat (H) 2 24951.8** 39494.5** 843.32** 622.95**Error I 4 225.4 76.1 2.58 0.91Potassium (K) 4 3263.4** 2723.8** 92.31** 48.15**H × K 8 481.2** 341.9** 5.31** 4.63**Error II 24 47.1 23.8 0.66 0.78
** = Significant (p ≤ 0.01)
B. Comparison of treatments’ means
TreatmentsSOD
(Unit per mg protein)POD
(Unit per mg protein)2015-16 2016-17 2015-16 2016-17
No heat stress (H0)Control/ water spray (K0) 135.0 c 134.0 d 26.0 d 20.0 c15 g L-1 potassium (K15) 133.7 c 138.0 cd 25.0 cd 23.0 b30 g L-1 potassium (K30) 157.7 b 147.3 bc 27.8 bc 25.8 a45 g L-1 potassium (K45) 196.0 a 190.0 a 33.0 a 27.0 a60 g L-1 potassium (K60) 200.0 a 192.7 a 34.4 a 27.5 aHeat from spike to grain filling (H1)Control/ water spray (K0) 70.3 c 48.7 c 13.0 d 11.2 c15 g L-1 potassium (K15) 82.7 bc 52.0 bc 14.1 cd 11.9 bc30 g L-1 potassium (K30) 85.7 bc 59.0 bc 15.3 bc 12.1 bc45 g L-1 potassium (K45) 88.3 b 63.7 b 16.1 b 13.7 b60 g L-1 potassium (K60) 108.3 a 79.3 a 19.7 a 17.0 aHeat from flowering to grain filling (H2)Control/ water spray (K0) 88.7 c 78.7 c 14.3 c 12.4 b15 g L-1 potassium (K15) 97.0 bc 81.0 c 14.6 c 12.5 b30 g L-1 potassium (K30) 100.0 bc 86.0 bc 16.6 b 13.2 b45 g L-1 potassium (K45) 106.3 b 93.3 b 17.0 b 14.0 b60 g L-1 potassium (K60) 125.3 a 111.0 a 22.2 a 17.2 aTukey’s HSD (p ≤ 0.05) 16.48 11.72 1.95 2.12Year mean 118.3 103.6 20.6 A 17.2 BTukey’s HSD (p ≤ 0.05) NS 2.72
Any two means not sharing a letter in common within a column differ significantly at p ≤ 0.05; NS = Non-
significant
83
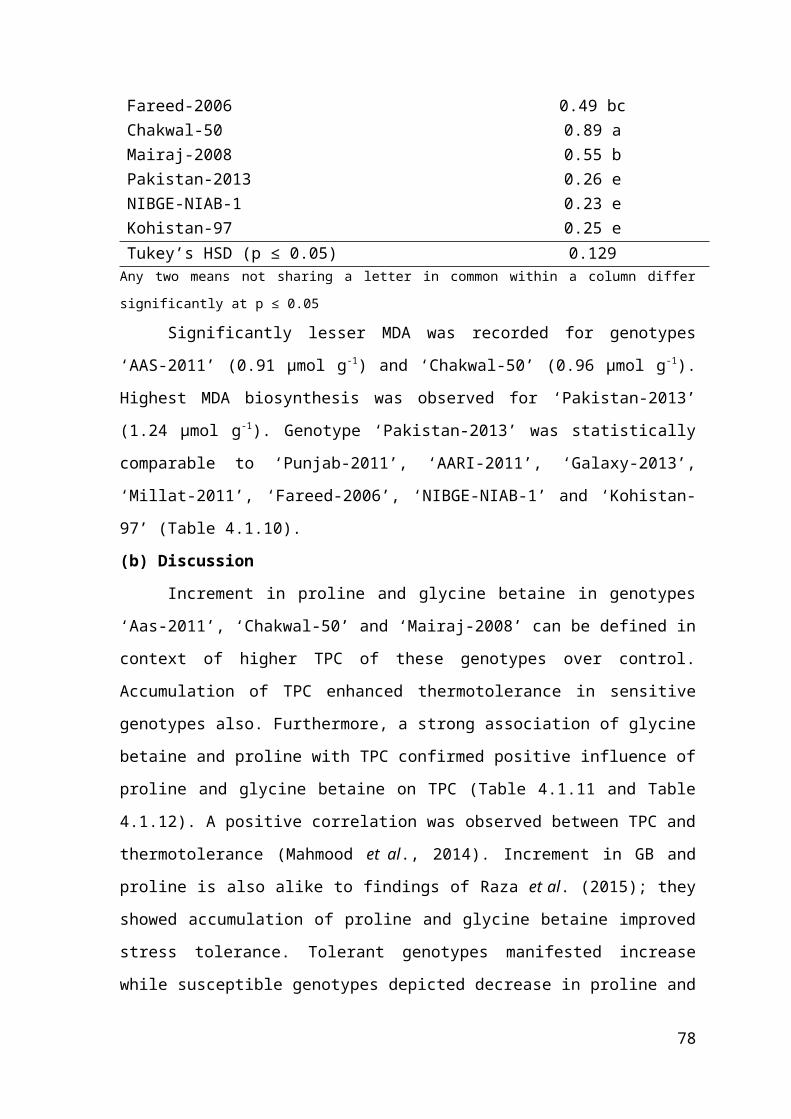
Figure 4.2.8: Regression analysis for effect of foliar applied potassium on superoxide dismutase and peroxidase contents of heat stressed wheat
H0 = No heat stress; H1 = Heat from spike to grain filling; H2 = Heat from flowering to grain filling
84

Table 4.2.9: Effect of foliar applied potassium on catalase (CAT) and total phenolic contents (TPC) of heat stressed wheat
A. Mean sum of square
Source of variation
DFCatalase Total phenolics
2015-16 2016-17 2015-16 2016-17Blocks 2 858.76 427.09 84.12 14.18Heat (H) 2 2443.59* 2537.71** 717.93** 709.25**Error I 4 161.95 6.25 15.98 2.04Potassium (K) 4 270.77** 160.68** 111.98** 62.34**H × K 8 20.00** 15.78** 14.80** 9.41**Error II 24 3.76 1.19 0.61 0.56
* = Significant (p ≤ 0.05); ** = Significant (p ≤ 0.01)
B. Comparison of treatments’ means
TreatmentsCAT (Unit per mg protein) TPC (mg GAE g-1)
2015-16 2016-17 2015-16 2016-17No heat stress (H0)Control/ water spray (K0) 41.0 b 33.7 c 22.7 c 18.9 b15 g L-1 potassium (K15) 40.6 b 34.7 c 21.5 c 19.4 b30 g L-1 potassium (K30) 44.7 b 41.0 b 25.3 b 25.7 a45 g L-1 potassium (K45) 55.4 a 46.7 a 32.9 a 27.1 a60 g L-1 potassium (K60) 57.3 a 47.3 a 33.1 a 27.2 aHeat from spike to grain filling (H1)Control/ water spray (K0) 19.7 b 12.3 c 12.3 c 8.6 b15 g L-1 potassium (K15) 20.0 b 13.7 bc 12.9 bc 8.9 b30 g L-1 potassium (K30) 22.0 b 15.0 b 13.2 bc 9.5 b45 g L-1 potassium (K45) 23.4 b 15.3 b 14.7 b 10.0 b60 g L-1 potassium (K60) 30.3 a 20.7 a 19.2 a 14.0 aHeat from flowering to grain filling (H2)Control/ water spray (K0) 25.7 c 19.0 d 14.0 b 12.8 b15 g L-1 potassium (K15) 26.8 c 20.4 cd 14.2 b 13.0 b30 g L-1 potassium (K30) 28.5 bc 22.0 bc 14.9 b 14.2 b45 g L-1 potassium (K45) 31.7 b 23.7 b 15.3 b 14.5 b60 g L-1 potassium (K60) 37.0 a 28.3 a 21.0 a 18.3 aTukey’s HSD (p ≤ 0.05) 4.66 2.62 1.87 1.80Year mean 33.6 A 26.2 B 19.1 A 16.2 BTukey’s HSD (p ≤ 0.05) 5.53 2.84
Any two means not sharing a letter in common within a column differ significantly at p ≤ 0.05; NS = Non-
significant
85

Figure 4.2.9: Regression analysis for effect of foliar applied potassium on catalase and total phenolic contents of heat stressed wheat
H0 = No heat stress; H1 = Heat from spike to grain filling; H2 = Heat from flowering to grain filling
86

High temperature has aggravated generation of ROS and lipid peroxidation. The
same was confirmed from strong negative and significant correlation of chlorophyll a and
b contents with malondialdehyde under ‘no heat stress’ (Table 4.2.15 a, c), under ‘heat
from spike to grain filling’ (Table 4.2.16 a, c) and under ‘heat from flowering to grain
filling’ (Table 4.2.17 a, c) over the 2015-16 and 2016-17. Excessive ROS might have
impaired the activities of aminolevulinic acid dehydratase and porphobilinogen
deaminase. Moreover, heat stress induced boost in activities of protochlorophyllide
oxidoreductase might have accelerated the conversion of protochlorophyllide to
chlorophyllide and thus reduced chlorophyll contents under heat stress (Hemantaranjan et
al., 2014).
High temperature stress caused lesser translocation of sucrose towards grains from
source organs (leaves) leading to negative feedback for photosynthesis and chlorophyll
pigments. Since, grain filling duration was decreased so 1000-grain weight was also
decreased under heat. Whereas, lesser time availability for grain filling might have
transduced signal to leaves to downregulate the synthesis of carbohydrates and ultimately
biosynthesis of chlorophyll pigments was also slow under heat owing to disturbed
enzymes that regulated chlorophyll biosynthesis. Moreover, positive and significant
association of chlorophyll a and b contents with 1000-grain weight and grain filling
duration was recorded under ‘no heat stress’ (Table 4.2.15 a, c), ‘heat from spike to grain
filling’ (Table 4.2.16 a, c) and ‘heat from flowering to grain filling’ (Table 4.2.17 a, c)
over the years.
Improvement of chlorophyll a and b contents under foliar applied potassium
might be a consequence of potassium mediated enhancement in grain filling rate and
prolongation of grain filling duration. Concurrent enhancement of grain filling rate and
duration might have enhanced the time availability to accumulate sucrose in grains and
thus improved sink (grains) capacity. Improved sink capacity might have transduced
signal to vegetative parts to partition carbohydrates for longer duration. Improvement in
sink capacity was also confirmed from increasing 100-grain weight and number of grains
per spike under potassium compared to control (water spray). Moreover, strong positive
and significant association of chlorophyll a and b with grain filling rate and duration
established the grain filling rate and duration mediated delaying of senescence and
staying green for longer duration (Table 4.2.15-4.2.17 a, c). Under terminal stress,
application of potassium enhanced the stay green trait and carbohydrates partitioning to
grains (Hosseini et al., 2016).
87

Increase in chlorophyll a and b contents can also be explained in context of lesser
peroxidation of lipids under potassium availability. Potassium itself acts as an osmolyte
and enhances membrane integrity. Availability of potassium increases the accumulation
of osmo-protectants and thereby improves water potential. Thereafter, enhancement of
cellular water may inhibit the activities of chlorophyll degrading enzymes. Furthermore,
strong positive and significant relationship of shoot potassium contents with chlorophyll
a and b accomplished the potassium triggered regulations of chlorophyll biosynthesis
(Table 4.2.15-4.2.17 a, c). Application of foliar potassium enhanced the biosynthesis of
phenolics and chlorophyll under stress conditions. While, accumulation of osmolytes
enhanced the water potential under stress and ultimately improved growth (Jan et al.,
2017).
Diminishment of activities of SOD, POD, CAT and TPC under heat can be
attributed to excessive generation of ROS under heat stress. Heat stress might have
destabilized reaction center of photosystem-II whereby excessive light triggered
photolysis of water generated plethora of free electrons. These free electrons might react
with triplet oxygen (atmospheric oxygen) (1O2) at reaction center of photosystem-II and
reduce it to superoxide radical (1O2●-). Moreover, chlorophyll in excited state after
accepting electron from reaction center might react with triplet oxygen and release singlet
oxygen (1O2*) under heat stressed environments. Therefore, excessive generation of 1O2
●-
might have initiated a cascade of reactions for generation of other ROS as well. Excessive
generation of 1O2●- might have augmented substrate concentration for SOD. Hence, more
hydrogen peroxide (H2O2) was produced by POD and CAT mediated reduction of 1O2●-.
Concurrently, heat mediated generation of 1O2●- and H2O2 was high enough to impair the
activities of SOD, POD, CAT and TPC since potassium modulated improvement in
enzyme activities was lesser compared to heat triggered decrease in activities. Therefore,
inhibition of SOD, POD, CAT and TPC activities under heat might be a consequence
saturation of enzymes by excessive substrate concentration. Moreover, strong positive
and remarkable association of SOD, POD, CAT and TPC was observed under ‘no heat
stress’ (Table 4.2.15 b, d), under ‘heat from spike to grain filling’ (Table 4.2.16 b, d) and
under ‘heat from flowering to grain filling’ (Table 4.2.17 b, d) over the years. Association
of these attributes accomplished the enhancement/diminishment with each other based on
substrates availability. Enzymes activities generally enhance with enhancing
concentrations of substrates up to a point where enzymes are saturated by substrates and
activities start to diminish afterwards due to substrate saturation (Das and Roychoudhury,
88
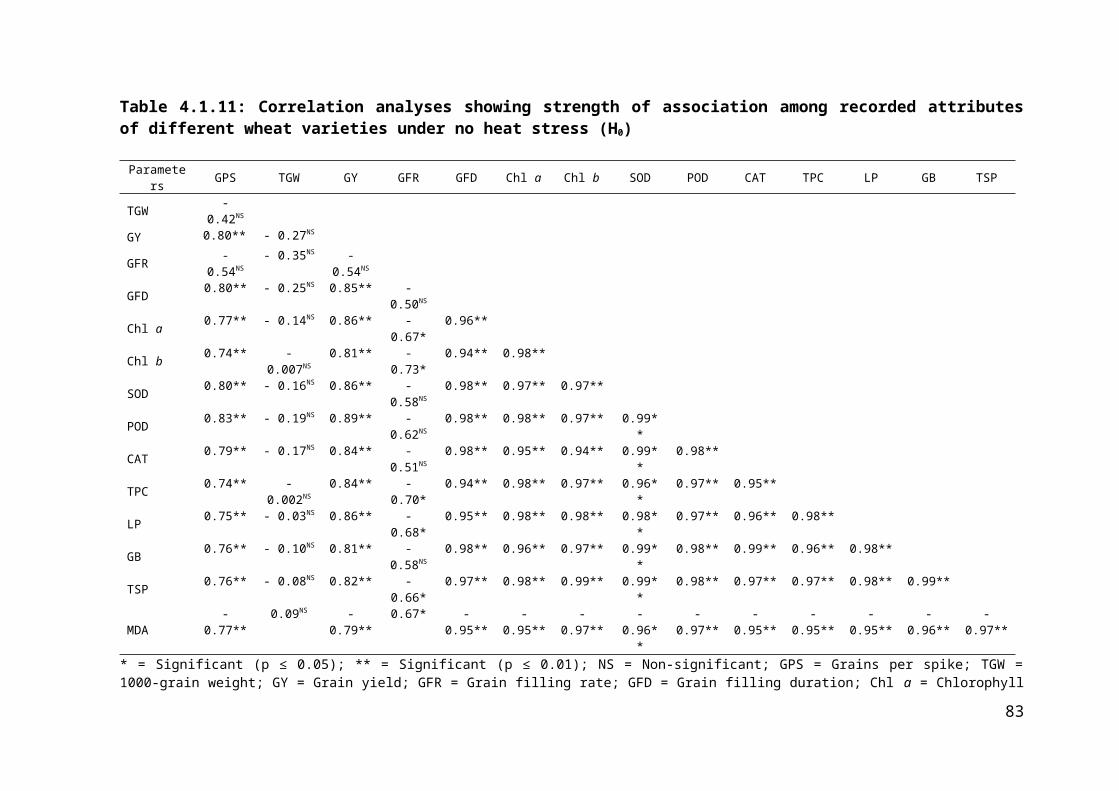
2014). Furthermore, excessive hydroxyl radical (OH●-) under heat might have reacted
with hydroxyl group of phenolics and thus aggravated the degradation of phenolics under
heat (Yamauchi, 2015).
Upregulations in SOD, POD, CAT and TPC might be an outcome of potassium
mediated improvements in water relations at the cellular level due to enhanced capability
of plant to accumulate proline, glycine betaine and total soluble proteins which led to
increased detoxification of ROS. Hence, antioxidant activities were enhanced because of
substrates concentration that remained lower than the enzyme-saturation point under
availability of potassium. Moreover, strong positive and significant correlations of SOD,
POD, CAT and TPC with shoot potassium contents and proline were recorded under ‘no
heat stress’ (Table 4.1.15 b, d), ‘heat from spike to grain filling’ (Table 4.1.16 b, d) and
‘heat from flowering to grain filling’ for most of instances (Table 4.1.15 b, d) Likewise,
correlation of SOD, POD, CAT and TPC with proline and glycine betaine was also strong
positive and significant under varying temperatures over the two years (Table 4.2.15-
4.2.17 b, d). Proline biosynthesis under stress environments not only enhanced precursors
availability for biosynthesis of proteins but also enhanced stress tolerance by improving
signal transduction, regulation of turgor and water potential and scavenging of ROS
(Hayat et al., 2012). While, foliar applied potassium under stress conditions improved the
accumulation of glycine betaine and proline in wheat (Raza et al., 2014).
4.2.7. Osmo-protectants and lipid peroxidation
(a) Results
Heat stress, foliar applied potassium and their interaction negatively impacted leaf
proline, glycine betaine, total soluble proteins and malondialdehyde. Comparatively
higher proline, glycine betaine, total soluble proteins and lesser malondialdehyde were
recorded under ‘no heat stress’ than heat stress environment. Moreover, ‘heat from spike
to grain filling was more destructive than ‘heat from flowering to grain filling’ regarding
the biosynthesis of osmo-protectants and lipid peroxidation of bio-membranes. Under ‘no
heat stress’, statistically similar and significantly more proline, glycine betaine and total
soluble proteins and were recorded with 45 and 60 g L-1 foliar potassium than water
spray/control, 15 and 30 g L-1 foliar potassium over the years. Whereas, in heat stressed
wheat 60 g potassium L-1 resulted in higher concentrations of proline, glycine betaine and
total soluble proteins than lower concentrations. Comparatively more malondialdehyde
contents were computed with ‘control/water spray’ and 15 g L-1 exogenous potassium
than 30, 45 and 60 g L-1 potassium over 2015-16 and 2016-17 under ‘no heat stress’, ‘heat
89

from spike to grain filling’ and ‘heat from flowering to grain filling’ (Table 4.2.10 and
Table 4.2.11).
Moreover, an increment of 0.02 µmol g-1 under ‘no heat stress’, 0.009-0.01 µmol
g-1 under ‘heat from spike to grain filling’ and 0.009-0.01 µmol g-1 in proline contents was
recorded with each 15 g L-1 application of foliar potassium over the two years. Whereas,
each 15 g L-1 application of exogenous potassium enhanced the leaf glycine betaine
contents by 1.45-1.47, 0.90-0.93 and 0.77-0.89 µmol g-1 under ‘no heat stress’, ‘heat from
spike to grain filling and ‘heat from flowering to grain filling’, respectively over the two
years of study. Likewise, per unit foliar potassium modulated improvements in total
soluble proteins were 0.0041-0.0051 mg g-1 under ‘no heat stress’, 0.0013-0.0025 mg g-1
under ‘heat from spike to grain filling’ and 0.0020-0.0029 mg g-1 under ‘heat from
flowering to grain filling’ over the years. Whereas, each per unit potassium mediated
decrease in malondialdehyde was 0.0025-0.0029 µmol g-1 under ‘no heat stress’, 0.008
µmol g-1 under ‘heat from spike to grain filling’ and 0.005-0.007 µmol g-1 under ‘heat
from flowering to grain filling’ over the years. Moreover, potassium mediated
improvements in osmo-protectants and decrease in malondialdehyde were generally more
under stressed environments compared to ‘no heat stress’ over the years, however some
discrepancies were observed during 2016-17. (Figure 4.2.10 and Figure 4.2.11).
(b) Discussion
Heat stress triggered the degradation of chlorophyll and thus decreased the
sucrose availability for biosynthesis of osmo-protectants. Consequently, availability of
carbon chain might have decreased which ultimately downregulated the biosynthesis of
osmo-protectants. Furthermore, strong positive and significant association of leaf proline,
glycine betaine and total soluble proteins was recorded under varying temperatures which
accomplished the dependence of osmo-protectants on chlorophyll (Table 4.2.15-4.2.17 a,
c). High temperature negatively impacted the accumulation of osmo-protestants and
photosynthetic pigments while, the ability of plant to accumulate osmo-protectants was
enhanced with enhancing chlorophyll pigments under the high temperature stress
(Awasthi et al., 2015). Decrease of photosynthetic pigments under the stressed
environment decreased the water potential of cells since plant accumulated lesser osmo-
protectants (Moharramnejad et al., 2015).
Heat stress might have accelerated the production of ROS and excessive ROS
might have overcome defensive mechanism of plant. Thereafter, plethora of 1O2●-, 1O2
*
and H2O2 might have dominated the activities of SOD, POD and CAT. While, excessive
90

generation of OH●- might have reacted with hydrogen of carbon chain and convert carbon
chain itself into carbon centered radical (another ROS). Thereafter carbon centered
radicals might have initiated a cascade of reaction to synthesize alkoxyl radicals (RO●-)
and peroxyl radical (ROO●-).
Table 4.2.10: Effect of foliar applied potassium on leaf proline and glycine betaine of heat stressed wheat
A. Mean sum of square
Source of variation
DFLeaf proline Leaf glycine betaine
2015-16 2016-17 2015-16 2016-17Blocks 2 0.077 1.859 1128.3 8796.9Heat (H) 2 14.318** 14.011** 66632.7** 60535.2**Error I 4 0.014 0.047 67.7 765.7Potassium (K) 4 0.811** 0.859** 5893.6** 6166.0**H × K 8 0.069** 0.064** 383.1** 367.1**Error II 24 0.008 0.016 30.5 56.5
** = Significant (p ≤ 0.01)
B. Comparison of treatments’ means
TreatmentsProline (µmol g-1) Glycine betaine (µmol g-1)
2015-16 2016-17 2015-16 2016-17No heat stress (H0)Control/ water spray (K0) 3.02 c 2.65 c 223.5 c 201.7 c15 g L-1 potassium (K15) 2.98 c 2.68 c 218.8 c 210.0 c30 g L-1 potassium (K30) 3.47 b 3.13 b 248.5 b 231.7 b45 g L-1 potassium (K45) 3.87 a 3.52 a 291.7 a 275.0 a60 g L-1 potassium (K60) 3.90 a 3.57 a 296.0 a 279.3 aHeat from spike to grain filling (H1)Control/ water spray (K0) 1.28 c 1.04 b 111.7 d 105.0 c15 g L-1 potassium (K15) 1.33 c 1.10 b 118.7 cd 109.3 c30 g L-1 potassium (K30) 1.57 b 1.23 b 128.2 c 120.7 bc45 g L-1 potassium (K45) 1.63 b 1.27 b 145.0 b 128.3 b60 g L-1 potassium (K60) 1.97 a 1.63 a 168.0 a 163.0 aHeat from flowering to grain filling (H2)Control/ water spray (K0) 1.80 c 1.47 c 128.3 d 111.7 d15 g L-1 potassium (K15) 1.98 bc 1.48 c 133.5 cd 118.2 cd30 g L-1 potassium (K30) 2.08 b 1.66 bc 144.3 bc 133.3 bc45 g L-1 potassium (K45) 2.12 b 1.79 b 153.1 b 141.5 b60 g L-1 potassium (K60) 2.39 a 2.17 a 176.7 a 166.7 aTukey’s HSD (p ≤ 0.05) 0.215 0.304 13.26 18.05Year mean 2.36 2.03 179.0 166.4
91

Tukey’s HSD (p ≤ 0.05) NS NSAny two means not sharing a letter in common within a column differ significantly at p ≤ 0.05; NS = Non-
significant
Figure 4.2.10: Regression analysis for effect of foliar applied potassium on leaf proline and glycine betaine of heat stressed wheat
92

H0 = No heat stress; H1 = Heat from spike to grain filling; H2 = Heat from flowering to grain filling
Table 4.2.11: Effect of foliar applied potassium on total soluble proteins (TSP) and malondialdehyde (MDA) of heat stressed wheat
A. Mean sum of square
Source of variation
DFTotal soluble proteins Malondialdehyde
2015-16 2016-17 2015-16 2016-17Blocks 2 0.0247 0.0389 0.2247 0.3304Heat (H) 2 0.3799** 0.5468** 1.5399** 1.7099**Error I 4 0.0060 0.0007 0.0071 0.0067Potassium (K) 4 0.0692** 0.0334** 0.1766** 0.1464**H × K 8 0.0063** 0.0049** 0.0148** 0.0197**Error II 24 0.0007 0.0003 0.0014 0.0020
** = Significant (p ≤ 0.01)
B. Comparison of treatments’ means
TreatmentsTSP (mg g-1) MDA (µmol g-1)
2015-16 2016-17 2015-16 2016-17No heat stress (H0)Control/ water spray (K0) 0.52 b 0.45 c 0.83 a 0.87 a15 g L-1 potassium (K15) 0.49 b 0.47 c 0.84 a 0.86 a30 g L-1 potassium (K30) 0.55 b 0.53 b 0.72 b 0.79 ab45 g L-1 potassium (K45) 0.75 a 0.64 a 0.70 b 0.74 b60 g L-1 potassium (K60) 0.77 a 0.67 a 0.68 b 0.73 bHeat from spike to grain filling (H1)Control/ water spray (K0) 0.27 b 0.16 b 1.55 a 1.60 a15 g L-1 potassium (K15) 0.27 b 0.16 b 1.52 a 1.57 ab30 g L-1 potassium (K30) 0.32 b 0.17 b 1.33 b 1.48 bc45 g L-1 potassium (K45) 0.33 b 0.17 b 1.32 b 1.44 c60 g L-1 potassium (K60) 0.42 a 0.25 a 1.06 c 1.10 dHeat from flowering to grain filling (H2)Control/ water spray (K0) 0.31 c 0.25 b 1.42 a 1.47 a 15 g L-1 potassium (K15) 0.31 c 0.26 b 1.35 a 1.40 ab30 g L-1 potassium (K30) 0.34 bc 0.28 b 1.25 b 1.30 bc45 g L-1 potassium (K45) 0.40 b 0.29 b 1.17 b 1.28 c60 g L-1 potassium (K60) 0.49 a 0.39 a 1.02 c 1.12 dTukey’s HSD (p ≤ 0.05) 0.065 0.042 0.090 0.107Year mean 0.44 A 0.34 B 1.11 1.18
93

Tukey’s HSD (p ≤ 0.05) 0.071 NSAny two means not sharing a letter in common within a column differ significantly at p ≤ 0.05; NS = Non-
significant
Figure 4.2.11: Regression analysis for effect of foliar applied potassium on total soluble proteins and malondialdehyde of heat stressed wheat
94

H0 = No heat stress; H1 = Heat from spike to grain filling; H2 = Heat from flowering to grain filling
Thus, burst of ROS might have degenerated lipids (ground structure) of bio-
membranes and thus decreased the capability of plant to synthesize osmo-protectants.
Furthermore, strong negative and significant correlation of proline, glycine betaine and
95

total soluble proteins with malondialdehyde both under no heat and heat-imposed
conditions established the aggravated lipid peroxidation caused negative impacts on
osmo-protectants (Table 4.2.15-4.2.17 a, c). High temperature stress enhanced ROS,
which overcame the antioxidant defense mechanism of plant and aggravated lipid
peroxidation. Moreover, the capability of plants to accumulate total soluble sugars,
trehalose, free amino acids, soluble proteins and proline was decreased under heat stress
(Asthir, 2015).
Availability of potassium from exogenous application might have improved the
activation of ATPs and synthesis of reductants at the end of light reactions of
photosynthesis. Henceforth, sucrose loading from leaves and unloading from phloem and
subsequent translocation towards grains might have enhanced under potassium
availability. This not only enhanced carbohydrates availability to develop grains but also
enhanced carbon chain availability for biosynthesis of amino acids (proline, glycine
betaine) and succeeding soluble proteins. The availability of potassium under stress
conditions enhanced the synthesis of osmo-protectants, antioxidants, carbohydrates
translocation to reproductive parts and reduced lipid peroxidation (Zahoor et al., 2017b).
Foliar application of potassium under heat stress in wheat enhanced carbohydrates
partitioning to grains, photosynthetic efficiency, regulated stomatal opening and closing
and ultimately enhanced grain yield (Kajla et al., 2015).
Potassium-mediated improvements in carbohydrate availability and osmo-
protectants might have enhanced water potential of cell and alleviated adversities of
oxidative stress. Biosynthesis of ROS under potassium availability might have diminished
to a concentration lower enough to not impair enzyme activities because of substrate
saturation. Therefore, comparatively lesser 1O2●-, 1O2
*, H2O2 and OH●- concentrations
under foliar potassium might have elicited activities of SOD, POD and CAT which
ultimately alleviated oxidative stress and enhanced capability of plant to synthesize osmo-
protectants. Furthermore, antioxidant triggered improvements in synthesis of osmo-
protectants was established from strong positive and significant association of
antioxidants and osmo-protectants under varying temperature regimes and over the
temporal variations (Table 4.2.15-4.2.17 b, d). Exogenous potassium enhanced
biosynthesis of proline, total soluble proteins, antioxidants and photosynthetic pigments
in wheat under stress environment (Wei et al., 2013). Deficiency of potassium enhanced
vulnerability to stress in tolerant and susceptible genotypes of wheat (Ruan et al., 2015).
96

Wheat might have compartmentalized excessive potassium in vacuole under ‘no
heat stress’ conditions. While, under heat stress, vacuolar potassium might have
mobilized from vacuole and re-translocated to the cytosol at sub-cellular level.
Henceforth, potassium presence in cytosol might have acted as osmolyte, maintained
water potential, activated antioxidants and eventually regulated morphological responses
of wheat under heat. Excessive application of potassium did not show negative impacts,
yet plant accumulated excessive potassium in vacuoles where it mostly regulated
homeostasis and water relations (Andrés et al., 2014; Shin, 2017). Whereas, plants
remobilized and redistributed vacuolar compartmentalized potassium under stress
conditions into the cell cytosol where it activated enzymes and improved photosynthesis
(Wang and Wu, 2017).
4.2.8. Water relations and quality attributes
(a) Results
Imposition of heat depressed water, osmotic and turgor potential compared to ‘no
heat stress’. ‘Heat from spike to grain filling’ was more deleterious than ‘heat from
flowering to grain filling’ in this regard. Moreover, exogenous potassium significantly
enhanced osmotic, water and turgor potential compared to control/ water spray. Varying
concentrations of foliar potassium exhibited dissimilar response to produce a significant
‘heat × foliar potassium’ effect for water relation attributes and shoot potassium contents.
However, the interaction was non-significant for grain crude protein contents.
Significantly more osmotic, water, turgor potential and shoot potassium contents
was observed with 60 g L-1 exogenous potassium compared to control/ water spray, 15, 30
and 45 g L-1 foliar potassium under ‘heat from spike to grain filling’ and ‘heat from
flowering to grain filling’ over years. However, under no heat stress both 45 and 60 g L -1
potassium performed equally well in improving water relations and shoot potassium
contents (Table 4.2.12 and Table 4.2.13).
Heat imposition caused a notable decrease in grain crude protein contents, so a
decrease of 22-27% and 14-19% in grain crude protein contents was recorded under heat
from ‘spike to grain filling’ and ‘heat from flowering to grain filling’, respectively over
the years. Furthermore, statistically similar and comparatively more grain crude protein
contents were quantified with 45 and 60 g L-1 foliar potassium compared to other
concentrations of potassium in 2015-16. Whereas, statistically alike and relatively higher
grain crude protein contents were observed with 30, 45 and 60 g L-1 foliar potassium
97
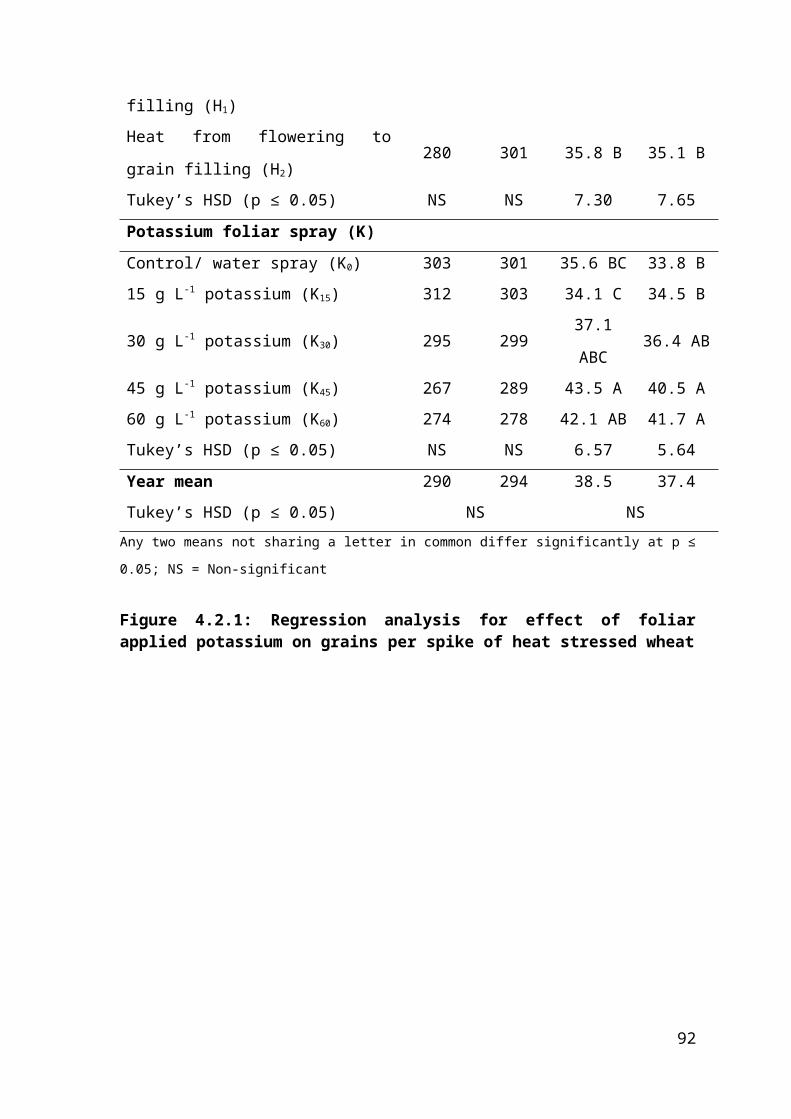
during 2016-17. Conversely, control/water spray and 15 g L-1 exogenous potassium
exhibited comparatively lesser grain crude protein contents (Table 4.2.14).
Each 15 g L-1 application of exogenous potassium improved osmotic potential by
0.004-0.006 MPa under ‘no heat stress’, 0.007-0.008 MPa under ‘heat from spike to grain
filling’ and 0.006 MPa under ‘heat from flowering to grain filling’ over the two study
years. Likewise, each unit application of foliar potassium enhanced water potential by
0.005-0.008, 0.008-0.009 and 0.007-0.008 MPa under ‘no heat stress’, ‘heat from spike to
grain filling’ and’ heat from flowering to grain filling’, respectively over the temporal
variability. While, each unit application of potassium improved the turgor potential by
0.001-0.002 MPa under ‘no heat stress’, 0.0007-0.0010 under ‘heat from spike to grain
filling’ and 0.0007-0.002 MPa under ‘heat from flowering to grain filling’ over the years.
Similarly, shoot potassium contents was improved by 11.7-11.9 µg g -1 under ‘no heat
stress’, 8.45-10.6 µg g-1 under ‘heat from spike to grain filling’ and 7.5-7.9 µg g -1 under
‘heat from flowering to grain filling’ with each 15 g L-1 of foliar potassium over the years.
Moreover, potassium modulated improvements in osmotic, water potential and shoot
potassium contents were generally more under stress environment than ‘no heat stress’
over the years. However, some anomalies were also observed during 2016-17 where
dependence on foliar potassium was decreased under stress compared to ‘no heat stress’.
Whereas, dependence of turgor potential on potassium was lesser under stress compared
to ‘no heat stress’ over the years (Figure 4.2.12 and Figure 4.2.13).
Grain crude protein contents were enhanced by 0.028-0.029% under ‘no heat
stress’ and 0.024% under both heat imposition treatments with each unit (15 g L-1)
enhancement in foliar potassium over the 2015-16 and 2016-17. Moreover, the
importance of foliar applied potassium in improving grain crude protein contents was
more under heat than no heat over the years (Figure 4.2.14).
(b) Discussion
Decrease of osmotic, water and turgor potential under heat can be attributed to
degradation of chlorophyll. Heat stress might have aggravated degradation of chlorophyll
and ultimately carbohydrate biosynthesis was also impaired. Decrease in carbohydrates
availability might have negatively impacted carbon chain availability for the synthesis of
amino acids such as soluble proteins, glycine betaine and proline contents. Henceforth,
diminished capability to synthesize osmo-protectants not only decreased the capability of
plant to withhold water under stress but also reduced potent antioxidative characteristics
of proline and glycine betaine.
98

Table 4.2.12: Effect of foliar applied potassium on osmotic (ΨS) and water potential (ΨW) of heat stressed wheat
A. Mean sum of square
Source of variation
DFOsmotic potential Water potential
2015-16 2016-17 2015-16 2016-17Blocks 2 0.0727 0.1434 0.1091 0.1117Heat (H) 2 0.9054** 1.2661** 1.8181** 1.8637**Error I 4 0.0020 0.0230 0.0080 0.0040Potassium (K) 4 0.2250** 0.1956** 0.3561** 0.2498**H × K 8 0.0106** 0.0085* 0.0129** 0.0089*Error II 24 0.0017 0.0035 0.0029 0.0034
* = Significant (p ≤ 0.05); ** = Significant (p ≤ 0.01)
B. Comparison of treatments’ means
TreatmentsΨS (-MPa) ΨW (-MPa)
2015-16 2016-17 2015-16 2016-17No heat stress (H0)Control/ water spray (K0) 1.22 b 1.24 b 0.93 c 1.04 d15 g L-1 potassium (K15) 1.22 b 1.24 b 0.92 c 1.01 cd30 g L-1 potassium (K30) 0.98 a 1.19 b 0.67 b 0.93 bc45 g L-1 potassium (K45) 0.93 a 1.15 ab 0.54 a 0.88 a60 g L-1 potassium (K60) 0.93 a 1.01 a 0.52 a 0.74 aHeat from spike to grain filling (H1)Control/ water spray (K0) 1.73 d 1.93 c 1.60 d 1.81 c15 g L-1 potassium (K15) 1.60 c 1.79 bc 1.46 c 1.67 bc30 g L-1 potassium (K30) 1.57 c 1.76 b 1.43 c 1.63 b45 g L-1 potassium (K45) 1.42 b 1.71 b 1.28 b 1.58 b60 g L-1 potassium (K60) 1.25 a 1.44 a 1.04 a 1.28 aHeat from flowering to grain filling (H2)Control/ water spray (K0) 1.58 c 1.71 b 1.45 c 1.58 b 15 g L-1 potassium (K15) 1.57 c 1.67 b 1.42 c 1.53 b30 g L-1 potassium (K30) 1.45 b 1.65 b 1.29 b 1.50 b45 g L-1 potassium (K45) 1.39 b 1.61 b 1.22 b 1.47 b60 g L-1 potassium (K60) 1.19 a 1.28 a 0.94 a 1.10 aTukey’s HSD (p ≤ 0.05) 0.099 0.142 0.129 0.140Year mean 1.33 A 1.49 B 1.11 A 1.32 BTukey’s HSD (p ≤ 0.05) 0.117 0.144
Any two means not sharing a letter in common within a column differ significantly at p ≤ 0.05
99

Figure 4.2.12: Regression analysis for effect of foliar applied potassium on osmotic and water potential of heat stressed wheat
H0 = No heat stress; H1 = Heat from spike to grain filling; H2 = Heat from flowering to grain filling
100

Table 4.2.13: Effect of foliar applied potassium on turgor potential (ΨP) and shoot potassium (K) contents of heat stressed wheat
A. Mean sum of square
Source of variation
DFTurgor potential Shoot potassium contents
2015-16 2016-17 2015-16 2016-17Blocks 2 0.00240 0.00138 99473 1138381Heat (H) 2 0.15788** 0.05928** 7600945** 8374906**Error I 4 0.00012 0.00011 8639 35174Potassium (K) 4 0.01595** 0.00381** 563187** 476563**H × K 8 0.00145** 0.00046** 25319** 18697*Error II 24 0.00011 0.00009 6706 7529
* = Significant (p ≤ 0.05); ** = Significant (p ≤ 0.01)
B. Comparison of treatments’ means
TreatmentsΨP (MPa) Shoot K (µg g-1)
2015-16 2016-17 2015-16 2016-17No heat stress (H0)Control/ water spray (K0) 0.29 b 0.20 c 2326 b 2225 c15 g L-1 potassium (K15) 0.30 b 0.23 b 2320 b 2229 c30 g L-1 potassium (K30) 0.31 b 0.26 a 2473 b 2473 b45 g L-1 potassium (K45) 0.39 a 0.27 a 2910 a 2793 a60 g L-1 potassium (K60) 0.41 a 0.27 a 2923 a 2823 aHeat from spike to grain filling (H1)Control/ water spray (K0) 0.13 b 0.12 b 1000 c 933 c15 g L-1 potassium (K15) 0.14 b 0.12 b 1026 c 936 c30 g L-1 potassium (K30) 0.14 b 0.13 b 1085 c 1001 c45 g L-1 potassium (K45) 0.14 b 0.13 b 1358 b 1213 b60 g L-1 potassium (K60) 0.21 a 0.16 a 1628 a 1428 aHeat from flowering to grain filling (H2)Control/ water spray (K0) 0.13 c 0.13 b 1389 c 1228 c 15 g L-1 potassium (K15) 0.15 bc 0.14 b 1408 c 1232 c30 g L-1 potassium (K30) 0.16 b 0.15 b 1577 bc 1239 c45 g L-1 potassium (K45) 0.17 b 0.14 b 1608 b 1464 b60 g L-1 potassium (K60) 0.25 a 0.18 a 1883 a 1678 aTukey’s HSD (p ≤ 0.05) 0.025 0.023 196.7 208.4Year mean 0.22 A 0.17 B 1794 1660Tukey’s HSD (p ≤ 0.05) 0.033 NS
Any two means not sharing a letter in common within a column differ significantly at p ≤ 0.05; NS = Non-
significant
101

Figure 4.2.13: Regression analysis for effect of foliar applied potassium on turgor potential and shoot potassium contents of heat stressed wheat
H0 = No heat stress; H1 = Heat from spike to grain filling; H2 = Heat from flowering to grain filling
102
Table 4.2.14: Effect of foliar applied potassium on grain crude proteins of heat stressed wheat
A. Mean sum of square
Source of variation DFGrain crude proteins
2015-16 2016-17
Blocks 2 25.84 26.46
Heat (H) 2 25.99* 42.52*
Error I 4 1.92 2.71
Potassium (K) 4 3.45** 3.49**
H × K 8 0.08NS 0.07NS
Error II 24 0.27 0.48* = Significant (p ≤ 0.05); ** = Significant (p ≤ 0.01); NS = Non-significant
B. Comparison of treatments’ means
TreatmentsGrain crude proteins (%)
2015-16 2016-17
Heat stress (H)
No heat stress (H0) 11.69 A 12.20 A
Heat from spike to grain filling (H1) 9.10 B 8.93 B
Heat from flowering to grain filling (H2) 10.02 AB 9.85 B
Tukey’s HSD (p ≤ 0.05) 1.802 2.144
Potassium foliar spray (K)
Control/ water spray (K0) 9.67 C 9.67 B
15 g L-1 potassium (K15) 9.73 C 9.84 B
30 g L-1 potassium (K30) 10.12 BC 10.17 AB
45 g L-1 potassium (K45) 10.81 AB 10.87 A
60 g L-1 potassium (K60) 11.02 A 11.08 A
Tukey’s HSD (p ≤ 0.05) 0.726 0.967
Year mean 10.27 10.33
Tukey’s HSD (p ≤ 0.05) NSAny two means not sharing a letter in common differ significantly at p ≤ 0.05; NS = Non-significant
Figure 4.2.14: Regression analysis for effect of foliar applied potassium on grain crude proteins of heat stressed wheat
103
H0 = No heat stress; H1 = Heat from spike to grain filling; H2 = Heat from flowering to grain filling
These disturbances might have worsened oxidative stress and aggravated
membrane leakage and ultimately disturbed water relations of wheat. Moreover, strong
104

positive and pronouncing relationship of osmotic, water and turgor potential with
chlorophyll a and b accomplished the chlorophyll triggered decrease in synthesis of
osmo-protectants. Accumulation of lesser osmo-protectants and antioxidants enhanced
lipid peroxidation, which ultimately overwhelmed the antioxidant defense system in heat
and drought tolerant and susceptible genotypes (Rehman et al., 2016). Enhancement in
biosynthesis of osmo-protectants improved dry matter accumulation, chlorophyll
contents, photosynthesis and decreased lipid peroxidation in terminal heat stressed wheat
(Suryavanshi et al., 2016).
Depressed osmotic, water and turgor potential under heat might be a consequence
of lesser shoot potassium content. According to Jan et al. (2017) deficiency of potassium
stress reduced photosynthetic efficiency and capability of plant to make osmotic
adjustments. While according to Zahoor et al. (2017a) diminished capability of plant to
synthesize osmo-protectants impaired the photosynthesis and decreased soluble sugars.
Henceforward, decreased shoot potassium might have adversely influenced osmo-
protectants (proline, glycine betaine and total soluble proteins) by affecting carbon chain
availability for synthesis of amino acid on one side. On the other side, decrease of
potassium itself might have reduced osmolyte concentration of cytosol and thus disturbed
the homeostasis. Resultantly, capability of cells to retain water was decreased and hence
water, osmotic and turgor potentials were also depressed accordingly. Decreased
availability of potassium under stress conditions reduced the capability of plant to
synthesize osmo-protectants and sustain water and turgor and ultimately growth and yield
was deleteriously impacted (Hassan et al., 2017).
Likewise, heat stress. Heat stress might have accelerated the generation of 1O2●-,
1O2*, OH●- and H2O2 react with hydroxyl group of carbon chain of fatty acids (ground
structure of membranes) of bio-membranes. It augments the synthesis of carboxyl and
lipid peroxyl radical and thus enhanced membrane leakage. Hence, wheat under heat
might have lost its capability to withheld cellular constituents along with water owing to
aggravated lipid peroxidation of bio-membranes at sub-cellular level. Besides, strong
negative and significant association of malondialdehyde with water relations attributes
was calculated under ‘no heat stress’ (Table 4.2.15 b, d), under ‘heat from spike to grain
filling’ (Table 4.2.16 b, d) and under ‘heat from flowering to grain filling’ (Table 4.2.17
b, d) over the years. This negative correlation further confirmed lipid peroxidation
triggered depressions in water relations. High temperature and light intensity aggravated
lipid peroxidation and downregulated the activities of ascorbate peroxidase, glutathione
105

peroxidase, SOD, POD and CAT under heat. Decrease in biosynthesis of antioxidants
depressed water potential and relative leaf water contents under (Chen et al., 2017).
Improvements in water relations (osmotic, water and turgor potential) under foliar
applied potassium can be attributed to enhanced synthesis of osmo-protectants (total
soluble proteins, proline and glycine betaine contents). These enhanced solutes
concentration of cells improved the capability of cells to withheld water under stress.
Moreover, strong positive and pronouncing association of water, osmotic and turgor
potentials was recorded with proline, glycine betaine and total soluble proteins (Table
4.2.15- 4.2.17 b, d). Improvements in water relations of plant was a consequence of
improved accumulation of osmo-protectants (Zahoor et al., 2017a).
Likewise, foliar applied potassium boosted the SOD, POD, CAT and TPC
activities, which ultimately accelerated the detoxification of ROS and thus decreased the
lipid peroxidation. Improvement in stability of membranes might have enhanced the
capability of cells to retain water and turgor under high temperature stress. Strong
negative and significant correlation of water relations with malondialdehyde. It
established the negative impacts of water relations with lipid peroxidation of bio-
membranes (Table 4.2.15-4.2.17 b, d). Foliar application of potassium improved
antioxidant defense system and water relations while decreased the biosynthesis of
malondialdehyde (Xiaokang et al., 2017).
Lesser shoot potassium contents under heat stress over ‘no heat stress’ were
ascribed to heat induced changes in antioxidants activity. Decreases of antioxidants
activities might have exposed the plant to water loss and oxidative stress. Deteriorated
defensive system of plant led to decreased shoot potassium and it was confirmed from
strong, positive and significant association of shoot potassium contents with SOD, POD,
CAT and TPC over two years of study under varying temperatures (Table 4.2.15-4.2.17 b,
d). Slightly high temperature decreased the accumulation of potassium in root, shoot and
leaves (Benlloch-González et al., 2016). Potassium contents of wheat were decreased
under stressed environment due to oxidative stress and diminished activities of
antioxidant enzymes compared to control (Krishnasamy et al., 2014).
Enhancement of shoot potassium with the enhancing potassium application might
be consequence of lesser lipid peroxidation. Application of potassium improved
antioxidant defense system of plant, which triggered the scavenging of ROS and
ultimately enhanced capacity of cells to retain osmolytes (potassium) and osmo-
protectants (soluble proteins, glycine betaine and proline). Moreover, strong negative and
106
significant association of shoot potassium contents with malondialdehyde was recorded
under all the heat stress treatments (Table 4.2.15-4.2.17 b, d). Foliar application of
potassium under stress condition in wheat enhanced the shoot potassium contents of
wheat while lesser shoot potassium contents were recorded under stressed environments
(Shabbir et al., 2015).
Significantly more shoot potassium content and water relation attributes under
stress compared to ‘no heat stress’ were recorded with higher level (60 g L -1) of foliar
potassium. It can be attributed to the capability of plant to accumulate excessive
potassium in the vacuole. While, under the stress plant might have triggered
transportation of potassium from vacuole to cell cytosol where it might have enhanced
osmo-protectants and osmolytes and thus improved water relations of plant under stress
(Andrés et al., 2014; Shin, 2017).
Decrease in grain crude protein contents under heat might be a consequence of
lesser potassium availability under heat. Decreases of shoot potassium might have
negatively affected photosynthesis and translocation of carbohydrates to grains decreased
under heat. Lesser partitioning of carbohydrates might be consequence of impaired
sucrose loading and unloading in phloem sieve tube complex. Hence, sucrose might have
accumulated in phloem and thus induced a negative feedback for photosynthesis.
Eventually, carbon chain availability for biosynthesis of amino acids and thus grain
proteins were lesser under heat compared to ‘no heat stress’. While, strong positive and
significant association of shoot potassium contents with grain crude proteins under
different conditions of heat stress over the years was recorded (Table 4.2.15-4.2.17 b, d).
It established the role of shoot potassium in enhancing carbon chain availability for
synthesis of amino acids. Potassium was required to activate ATP at site of loading of
sucrose in phloem, to maintain high pH in phloem-sieve complex regulating homeostasis
to continue sucrose movements from source to sink organs, to main maintain water
potential of phloem necessary for flow of sucrose in phloem and unloading of sucrose to
translocate it towards sink organs (Geiger, 2011; Lemoine et al., 2013).
The heat induced decrease in proline and glycine betaine decreased disturbed
water relations of plant and aggravated oxidative stress. Excessive synthesis of ROS
impaired activities of antioxidants and thus degraded proteins. Moreover, strong positive
and significant association of grain crude protein contents with proline and glycine
betaine was observed under ‘no heat stress (Table 4.2.15 b, d), under ‘heat from spike to
grain filling’ (Table 4.2.16 b, d) and under ‘heat from ‘flowering to grain filling’ (Table
107
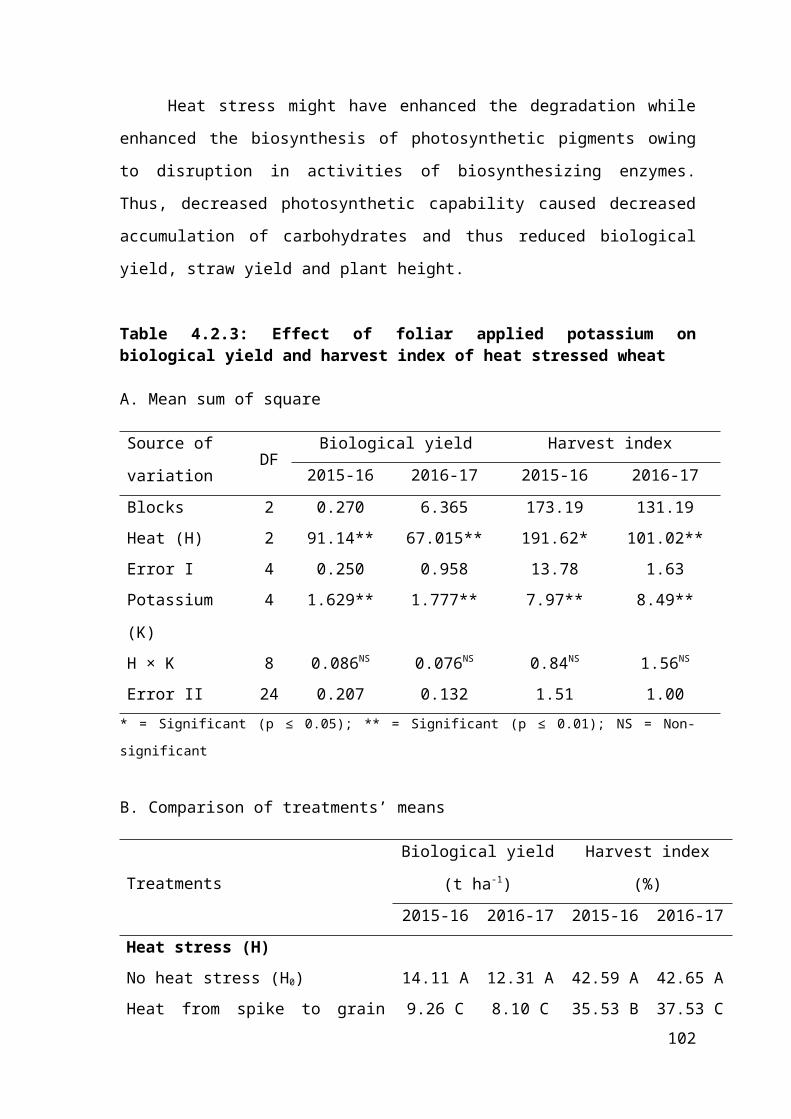
4.2.17 b, d) over the years. It accomplished the role of decreased amino acids in reducing
the grain crude protein contents. While, strong positive and significant association of
grain crude protein contents with SOD, POD, CAT and TPC under varying temperature
regimes over the temporal variations also accomplished aggravated oxidative stress
induced degradation of grain crude proteins (Table 4.2.15-4.2.17 b, d).
Improvement of grain crude proteins owing to potassium application might be
consequence of improved carbohydrates translocation. Availability of potassium might
have triggered the translocation of carbohydrates from phloem to reproductive organs,
ultimately carbon chain availability for synthesis of amino acids was enhanced.
Consequently, grain crude protein contents were enhanced. Moreover, strong positive and
significant association of shoot potassium with grain crude proteins was observed under
varying temperatures over the years (Table 4.2.15-4.2.17 b, d). It further accomplished
the shoot potassium mediated regulations in biosynthesis of grain proteins. Application of
potassium reduced degradation if grain crude protein contents under the stress conditions,
improved antioxidants and decreased the biosynthesis of malondialdehyde (Jan et al.,
2017).
Likewise, foliar applied potassium might have triggered the activities of
antioxidants, which ultimately detoxified ROS and enhanced membrane stability. All
these regulations enhance the synthesis of carbohydrates in photosynthesis and
chlorophyll contents. Therefore, it not only enhanced carbohydrates availability for
synthesis of amino acids but also decreased the degradation of protein due to excessive
generation of ROS. Moreover, strong positive and remarkable association of grain crude
proteins with antioxidants (SOD, POD, CAT and TPC), osmo-protectants (soluble
proteins, proline and glycine betaine) and strong negative and pronouncing association
with malondialdehyde was observed under varying temperatures over the two years of
study (Table 4.2.15-4.2.17 b, d). Availability of potassium under stress conditions
improved quality of protein, protein contents and antioxidant activities in wheat
(Anschütz et al, 2014).
108

Table 4.2.15 (a): Correlation analyses showing strength of association among recorded attributes of wheat under no heat stress (H0) and foliar applied potassium during 2015-16
Parameters GPS TGW GY BY HI SY PH SL SPS GFR GFD Chl a Chl b
TGW 0.71NS
GY 0.98** 0.76NS
BY 0.96** 0.87NS 0.97**HI 0.91* 0.51NS 0.93* 0.82NS
SY 0.78NS 0.95* 0.77NS 0.90* 0.50NS
PH 0.72NS 0.90* 0.70NS 0.85NS 0.41NS 0.99**SL 0.98** 0.68NS 0.97** 0.95* 0.90* 0.77NS 0.74NS
SPS 0.98** 0.85NS 0.98** 0.99** 0.85NS 0.88* 0.82NS 0.95*GFR 0.98** 0.60NS 0.94* 0.91* 0.90* 0.71NS 0.67NS 0.98** 0.93*GFD 0.92* 0.67NS 0.87NS 0.90* 0.73NS 0.83NS 0.83NS 0.95* 0.91* 0.94*Chl a 0.88* 0.90* 0.87NS 0.96** 0.64NS 0.98** 0.96** 0.88* 0.94* 0.83NS 0.92*Chl b 0.96** 0.88* 0.95* 0.99** 0.79NS 0.92* 0.87NS 0.93* 0.99** 0.91* 0.91* 0.97**SOD 0.97** 0.86NS 0.97** 0.99** 0.83NS 0.90* 0.84NS 0.95* 0.99** 0.92* 0.91* 0.96* 0.99**POD 0.95* 0.89* 0.94* 0.99** 0.76NS 0.93* 0.89* 0.92* 0.99** 0.90* 0.91* 0.97** 0.99**CAT 0.94* 0.91* 0.95* 0.99** 0.77NS 0.93* 0.88* 0.91* 0.99** 0.88* 0.88* 0.97** 0.99**TPC 0.97** 0.87NS 0.96** 0.99** 0.81NS 0.90* 0.84NS 0.93* 0.99** 0.91* 0.89* 0.95* 0.99**LP 0.99** 0.79NS 0.98** 0.99** 0.87NS 0.84NS 0.80NS 0.99** 0.99** 0.96** 0.94* 0.93* 0.98**GB 0.97** 0.85NS 0.97** 0.99** 0.83NS 0.89* 0.84NS 0.95* 0.99** 0.93* 0.92* 0.95* 0.99**TSP 0.94* 0.91* 0.94* 0.98** 0.76NS 0.92* 0.86NS 0.89* 0.98** 0.87NS 0.86NS 0.95* 0.99**
MDA - 0.95* - 0.65NS - 0.94* - 0.92* - 0.87NS - 0.76NS - 0.74NS - 0.99** - 0.92* -0.96* - 0.95* - 0.88* - 0.90*ΨS 0.96** 0.63NS 0.95* 0.92* 0.90* 0.72NS 0.69NS 0.99** 0.93* 0.97** 0.94* 0.85NS 0.90*ΨW 0.98** 0.73NS 0.98** 0.97** 0.90* 0.80NS 0.76NS 0.99** 0.97** 0.97** 0.94* 0.90* 0.95*ΨP 0.93* 0.92* 0.95* 0.99** 0.79NS 0.92* 0.86NS 0.91* 0.99** 0.86NS 0.85NS 0.96* 0.99**
SKC 0.95* 0.90* 0.96** 0.99** 0.81NS 0.90* 0.84NS 0.92* 0.99** 0.88* 0.87NS 0.95* 0.99**GCPC 0.94* 0.90* 0.94* 0.98** 0.77NS 0.91* 0.85NS 0.89* 0.98** 0.87* 0.86NS 0.94* 0.99**
* = Significant (p ≤ 0.05); ** = Significant (p ≤ 0.01); NS = Non-significant (p ≤ 0.05); GPS = Grains per spike; TGW = 1000-grain weight; GY = Grain yield; BY = Biological yield; HI = Harvest index; SY = Straw yield; PH= Plant height; SL = Spike length; SPS = Spikelets per spike; GFR = Grain filling rate; GFD = Grain filling duration; Chl a = Chlorophyll a; Chl b = Chlorophyll b; SOD = Superoxide dismutase; POD = Peroxidase; CAT = Catalase; TPC = Total phenolic contents; LP = Leaf proline; GB = Glycine betaine; TSP = Total soluble proteins; MDA = Malondialdehyde; ΨS = Osmotic potential; ΨW = Water potential; ΨP = Pressure potential; SKC = Shoot potassium contents; GCPC = Grain crude protein contentsn (number of pairs of observations) = 45
109

Table 4.2.15 (b): Correlation analyses showing strength of association among recorded attributes of wheat under no heat stress (H0) and foliar applied potassium during 2015-16
Parameters SOD POD CAT TPC LP GB TSP MDA ΨS ΨW ΨP SKCPOD 0.99**CAT 0.99** 0.99**TPC 0.99** 0.99** 0.99**LP 0.99** 0.97** 0.97** 0.98**GB 0.99** 0.99** 0.99** 0.99** 0.99**TSP 0.99** 0.99** 0.99** 0.99** 0.96* 0.99**
MDA - 0.92* - 0.89* - 0.88* - 0.89* - 0.97** - 0.92* - 0.85NS
ΨS 0.92* 0.89* 0.88* 0.90* 0.97** 0.93* 0.85NS - 0.99**ΨW 0.97** 0.94* 0.93* 0.94* 0.99** 0.97** 0.91* - 0.99** 0.99**ΨP 0.99** 0.98** 0.99** 0.98** 0.96** 0.98** 0.99** - 0.88* 0.88* 0.93*
SKC 0.99** 0.99** 0.99** 0.99** 0.97** 0.99** 0.99** - 0.88* 0.88* 0.94* 0.99**GCPC 0.98** 0.99** 0.99** 0.99** 0.99** 0.98** 0.99** - 0.85NS 0.85NS 0.91* 0.98** 0.99**
* = Significant (p ≤ 0.05); ** = Significant (p ≤ 0.01); NS = Non-significant (p ≤ 0.05); SOD = Superoxide dismutase; POD = Peroxidase; CAT = Catalase; TPC = Total phenolic contents; LP = Leaf proline; GB = Glycine betaine; TSP = Total soluble proteins; MDA = Malondialdehyde; Ψ S = Osmotic potential; ΨW = Water potential; ΨP = Pressure potential; SKC = Shoot potassium contents; GCPC = Grain crude protein contentsn (number of pairs of observations) = 45
110

Table 4.2.15 (c): Correlation analyses showing strength of association among recorded attributes of wheat under no heat stress (H0) and foliar applied potassium during 2016-17
Parameters GPS TGW GY BY HI SY PH SL SPS GFR GFD Chl a Chl b
TGW 0.95*GY 0.97** 0.98**BY 0.97** 0.98** 0.99**HI 0.96** 0.98** 0.99** 0.99**SY 0.92* 0.99** 0.98** 0.98** 0.98**PH 0.89* 0.89* 0.88* 0.88* 0.89* 0.89*SL 0.96* 0.94* 0.94* 0.94* 0.94* 0.93* 0.98**SPS 0.99** 0.91* 0.93* 0.93* 0.93* 0.86NS 0.85NS 0.93*GFR 0.99** 0.91* 0.92* 0.92* 0.92* 0.87NS 0.92* 0.97** 0.98**GFD 0.99** 0.90* 0.88* 0.89* 0.87NS 0.84NS 0.89* 0.95* 0.97** 0.99**Chl a 0.99** 0.97** 0.98** 0.99** 0.99** 0.95* 0.88* 0.95* 0.97** 0.96** 0.93*Chl b 0.94* 0.96** 0.96* 0.96** 0.95* 0.96** 0.98** 0.99** 0.91* 0.95* 0.92* 0.95*SOD 0.97** 0.98** 0.99** 0.99** 0.99** 0.98** 0.88* 0.94* 0.94* 0.93* 0.89* 0.99** 0.96*POD 0.94* 0.85NS 0.84NS 0.84NS 0.82NS 0.77NS 0.75NS 0.84NS 0.96** 0.94* 0.96** 0.91* 0.82NS
CAT 0.99** 0.92* 0.95* 0.95* 0.95* 0.89* 0.87NS 0.94* 0.99** 0.98** 0.95* 0.99** 0.92*TPC 0.95* 0.80NS 0.85NS 0.85NS 0.85NS 0.75NS 0.78NS 0.87NS 0.98** 0.96** 0.94* 0.92* 0.83NS
LP 0.99** 0.92* 0.95* 0.95* 0.95* 0.89* 0.87NS 0.94* 0.99** 0.98** 0.95* 0.99** 0.92*GB 0.99** 0.97** 0.99** 0.99** 0.98** 0.95* 0.89* 0.95* 0.98** 0.97** 0.94* 0.99** 0.95*TSP 0.99** 0.97** 0.99** 0.99** 0.98** 0.95* 0.91* 0.97** 0.97** 0.97** 0.94* 0.99** 0.97**
MDA -0.99** - 0.89* - 0.93* - 0.93* - 0.93* - 0.85NS - 0.83NS - 0.91* - 0.99** - 0.97** - 0.94* - 0.97** - 0.89*ΨS 0.88* 0.88* 0.87NS 0.87NS 0.86NS 0.88* 0.99** 0.98** 0.85NS 0.92* 0.91* 0.87NS 0.97**ΨW 0.94* 0.91* 0.90* 0.90* 0.89* 0.89* 0.98** 0.99** 0.92* 0.97** 0.97** 0.92* 0.98**ΨP 0.92* 0.82NS 0.81NS 0.81NS 0.79NS 0.73NS 0.70NS 0.82NS 0.95* 0.92* 0.94* 0.88* 0.78NS
SKC 0.99** 0.94* 0.98** 0.98** 0.98** 0.93* 0.89* 0.95* 0.98** 0.97** 0.93* 0.99** 0.94*GCPC 0.97** 0.98** 0.99** 0.99** 0.99** 0.98** 0.87NS 0.93* 0.93* 0.91* 0.88* 0.99** 0.95*
* = Significant (p ≤ 0.05); ** = Significant (p ≤ 0.01); NS = Non-significant (p ≤ 0.05); GPS = Grains per spike; TGW = 1000-grain weight; GY = Grain yield; BY = Biological yield; HI = Harvest index; SY = Straw yield; PH= Plant height; SL = Spike length; SPS = Spikelets per spike; GFR = Grain filling rate; GFD = Grain filling duration; Chl a = Chlorophyll a; Chl b = Chlorophyll b; SOD = Superoxide dismutase; POD = Peroxidase; CAT = Catalase; TPC = Total phenolic contents; LP = Leaf proline; GB = Glycine betaine; TSP = Total soluble proteins; MDA = Malondialdehyde; ΨS = Osmotic potential; ΨW = Water potential; ΨP = Pressure potential; SKC = Shoot potassium contents; GCPC = Grain crude protein contentsn (number of pairs of observations) = 45
111

Table 4.2.15 (d): Correlation analyses showing strength of association among recorded attributes of wheat under no heat stress (H0) and foliar applied potassium during 2016-17
Parameters SOD POD CAT TPC LP GB TSP MDA ΨS ΨW ΨP SKCPOD 0.85NS
CAT 0.96** 0.94*TPC 0.86NS 0.95* 0.97**LP 0.96** 0.93* 0.99** 0.97**GB 0.99** 0.91* 0.99** 0.92* 0.99**TSP 0.99** 0.90* 0.98** 0.91* 0.98** 0.99**
MDA - 0.94* - 0.94* - 0.99** - 0.98** - 0.99** - 0.97** - 0.97**ΨS 0.87NS 0.77NS 0.86NS 0.77NS 0.86NS 0.88* 0.90* - 0.82NS
ΨW 0.90* 0.87NS 0.92* 0.86NS 0.92* 0.92* 0.94* - 0.89* 0.99**ΨP 0.82NS 0.99** 0.92* 0.94* 0.91* 0.89* 0.87NS - 0.93* 0.73NS 0.83NS
SKC 0.98** 0.90* 0.99** 0.94* 0.99** 0.99** 0.99** - 0.98** 0.87NS 0.92* 0.88*GCPC 0.99** 0.85NS 0.95* 0.84NS 0.95* 0.99** 0.98** - 0.93* 0.85NS 0.89* 0.82NS 0.97**
* = Significant (p ≤ 0.05); ** = Significant (p ≤ 0.01); NS = Non-significant (p ≤ 0.05); SOD = Superoxide dismutase; POD = Peroxidase; CAT = Catalase; TPC = Total phenolic contents; LP = Leaf proline; GB = Glycine betaine; TSP = Total soluble proteins; MDA = Malondialdehyde; Ψ S = Osmotic potential; ΨW = Water potential; ΨP = Pressure potential; SKC = Shoot potassium contents; GCPC = Grain crude protein contentsn (number of pairs of observations) = 45
112

Table 4.2.16 (a): Correlation analyses showing strength of association among recorded attributes of wheat under heat from spike to grain filling (H1) and foliar applied potassium during 2015-16
Parameters GPS TGW GY BY HI SY PH SL SPS GFR GFD Chl a Chl b
TGW 0.84NS
GY 0.75NS 0.92*BY 0.69NS 0.92* 0.99**HI 0.80NS 0.91* 0.99** 0.96**SY 0.55NS 0.87NS 0.92* 0.97** 0.87NS
PH 0.92* 0.88* 0.90* 0.84NS 0.95* 0.68NS
SL 0.95* 0.88* 0.87NS 0.81NS 0.92* 0.65NS 0.99**SPS 0.88* 0.96* 0.87NS 0.84NS 0.90* 0.73NS 0.94* 0.94*GFR 0.86NS 0.97** 0.90* 0.87NS 0.91* 0.78NS 0.93* 0.93* 0.99**GFD 0.95* 0.83NS 0.82NS 0.75NS 0.89* 0.58NS 0.98** 0.99** 0.92* 0.91*Chl a 0.90* 0.91* 0.93* 0.88* 0.97** 0.74NS 0.99** 0.99** 0.95* 0.95* 0.97**Chl b 0.92* 0.95* 0.89* 0.85NS 0.92* 0.73NS 0.97** 0.98** 0.99** 0.99** 0.96** 0.98**SOD 0.61NS 0.85NS 0.98** 0.98** 0.96* 0.94* 0.82NS 0.77NS 0.79NS 0.82NS 0.72NS 0.86NS 0.80NS
POD 0.69NS 0.88* 0.98** 0.97** 0.98** 0.88* 0.89* 0.85NS 0.86NS 0.88* 0.82NS 0.93* 0.88*CAT 0.69NS 0.81NS 0.95* 0.92* 0.97** 0.80NS 0.91* 0.87NS 0.83NS 0.85NS 0.85NS 0.93* 0.86NS
TPC 0.69NS 0.79NS 0.95* 0.91* 0.97** 0.80NS 0.90* 0.86NS 0.79NS 0.81NS 0.84NS 0.92* 0.83NS
LP 0.72NS 0.90* 0.97** 0.95* 0.97** 0.86NS 0.91* 0.88* 0.91* 0.93* 0.85NS 0.94* 0.92*GB 0.81NS 0.92* 0.99** 0.96** 0.99** 0.87NS 0.95* 0.92* 0.91* 0.93* 0.89* 0.97** 0.94*TSP 0.72NS 0.87NS 0.96** 0.93* 0.98** 0.82NS 0.92* 0.89* 0.89* 0.91* 0.86NS 0.95* 0.90*
MDA - 0.68NS - 0.89* - 0.96* - 0.94* - 0.96** - 0.85NS - 0.89* - 0.86NS - 0.90* - 0.92* - 0.83NS - 0.93* - 0.90*ΨS 0.78NS 0.94* 0.99** 0.99** 0.99** 0.92* 0.91* 0.88* 0.88* 0.90* 0.84NS 0.94* 0.91*ΨW 0.76NS 0.91* 0.99** 0.98** 0.99** 0.91* 0.91* 0.88* 0.87NS 0.89* 0.84NS 0.94* 0.89*ΨP 0.51NS 0.62NS 0.86NS 0.82NS 0.88* 0.70NS 0.79* 0.74NS 0.65NS 0.67NS 0.72NS 0.81NS 0.69NS
SKC 0.85NS 0.89* 0.97** 0.92* 0.99** 0.80NS 0.97** 0.95* 0.89* 0.90* 0.93* 0.98** 0.93*GCPC 0.84NS 0.97** 0.95* 0.93* 0.96** 0.84NS 0.95* 0.94* 0.98** 0.99** 0.91* 0.97** 0.98**
* = Significant (p ≤ 0.05); ** = Significant (p ≤ 0.01); NS = Non-significant (p ≤ 0.05); GPS = Grains per spike; TGW = 1000-grain weight; GY = Grain yield; BY = Biological yield; HI = Harvest index; SY = Straw yield; PH= Plant height; SL = Spike length; SPS = Spikelets per spike; GFR = Grain filling rate; GFD = Grain filling duration; Chl a = Chlorophyll a; Chl b = Chlorophyll b; SOD = Superoxide dismutase; POD = Peroxidase; CAT = Catalase; TPC = Total phenolic contents; LP = Leaf proline; GB = Glycine betaine; TSP = Total soluble proteins; MDA = Malondialdehyde; ΨS = Osmotic potential; ΨW = Water potential; ΨP = Pressure potential; SKC = Shoot potassium contents; GCPC = Grain crude protein contentsn (number of pairs of observations) = 45
113

Table 4.2.16 (b): Correlation analyses showing strength of association among recorded attributes of wheat under heat from spike to grain filling (H1) and foliar applied potassium during 2015-16
Parameters SOD POD CAT TPC LP GB TSP MDA ΨS ΨW ΨP SKCPOD 0.98**CAT 0.95* 0.99**TPC 0.95* 0.97** 0.99**LP 0.96* 0.99** 0.97** 0.95*GB 0.95* 0.98** 0.97** 0.96** 0.98**TSP 0.95* 0.99** 0.99** 0.97** 0.99** 0.98**
MDA - 0.95* - 0.99** - 0.97** - 0.94* - 0.99** - 0.97** - 0.99**ΨS 0.97** 0.97** 0.94* 0.94* 0.96* 0.99** 0.95* - 0.94*ΨW 0.98** 0.99** 0.96** 0.96** 0.97** 0.99** 0.97** - 0.96* 0.99**ΨP 0.90* 0.92* 0.96* 0.97** 0.88* 0.87NS 0.92* - 0.88* 0.83NS 0.88*
SKC 0.92* 0.96** 0.96** 0.97** 0.95* 0.99** 0.96** - 0.94* 0.97** 0.97** 0.88*GCPC 0.89* 0.94* 0.91* 0.88* 0.97** 0.97** 0.95* - 0.96* 0.96* 0.95* 0.76NS 0.95*
* = Significant (p ≤ 0.05); ** = Significant (p ≤ 0.01); NS = Non-significant (p ≤ 0.05); SOD = Superoxide dismutase; POD = Peroxidase; CAT = Catalase; TPC = Total phenolic contents; LP = Leaf proline; GB = Glycine betaine; TSP = Total soluble proteins; MDA = Malondialdehyde; Ψ S = Osmotic potential; ΨW = Water potential; ΨP = Pressure potential; SKC = Shoot potassium contents; GCPC = Grain crude protein contentsn (number of pairs of observations) = 45
114

Table 4.2.16 (c): Correlation analyses showing strength of association among recorded attributes of wheat under heat from spike to grain filling (H1) and foliar applied potassium during 2016-17
Parameters GPS TGW GY BY HI SY PH SL SPS GFR GFD Chl a Chl b
TGW 0.94*GY 0.90* 0.99**BY 0.88* 0.99** 0.99**HI 0.91* 0.99** 0.99** 0.98**SY 0.74NS 0.88* 0.89* 0.94* 0.85NS
PH 0.99** 0.93* 0.89* 0.88* 0.89* 0.77NS
SL 0.99** 0.97** 0.95* 0.93* 0.96* 0.78NS 0.97**SPS 0.99** 0.93* 0.90* 0.87* 0.91* 0.70NS 0.97** 0.99**GFR 0.99** 0.97** 0.95* 0.94* 0.94* 0.83NS 0.98** 0.99** 0.98**GFD 0.90* 0.96** 0.96** 0.96** 0.96* 0.87NS 0.87NS 0.95* 0.91* 0.95*Chl a 0.94* 0.99** 0.99** 0.98** 0.98** 0.89* 0.94* 0.97** 0.93* 0.97** 0.95*Chl b 0.97** 0.98** 0.96** 0.96* 0.95* 0.87* 0.98** 0.98** 0.96* 0.99** 0.94* 0.99**SOD 0.91* 0.90* 0.89* 0.88* 0.86NS 0.81NS 0.95* 0.89* 0.87NS 0.90* 0.78NS 0.93* 0.95*POD 0.91* 0.84NS 0.80NS 0.79NS 0.79NS 0.70NS 0.96** 0.88* 0.88* 0.88* 0.72NS 0.87NS 0.92*CAT 0.84NS 0.82NS 0.79NS 0.80NS 0.77NS 0.76NS 0.91* 0.81NS 0.78NS 0.82NS 0.67NS 0.86NS 0.88*TPC 0.83NS 0.76NS 0.72NS 0.72NS 0.72NS 0.65NS 0.89* 0.79NS 0.78NS 0.79NS 0.61NS 0.81NS 0.84NS
LP 0.86NS 0.85NS 0.83NS 0.83NS 0.81NS 0.77NS 0.92* 0.84NS 0.81NS 0.85NS 0.71NS 0.89* 0.91*GB 0.88* 0.86NS 0.83NS 0.83NS 0.82NS 0.76NS 0.94* 0.86NS 0.84NS 0.87NS 0.73NS 0.90* 0.92*TSP 0.76NS 0.67NS 0.63NS 0.62NS 0.63NS 0.55NS 0.83NS 0.71NS 0.71NS 0.71NS 0.50NS 0.73NS 0.77NS
MDA - 0.85NS - 0.82NS - 0.78NS - 0.78NS - 0.77NS - 0.71NS - 0.92* - 0.82NS - 0.81NS - 0.83NS - 0.67NS -0.86NS -0.88*ΨS 0.86NS 0.83NS 0.80NS 0.82NS 0.77NS 0.80NS 0.92* 0.83NS 0.81NS 0.86NS 0.72NS 0.87NS 0.91*ΨW 0.86NS 0.82NS 0.79NS 0.81NS 0.77NS 0.80NS 0.92* 0.82NS 0.80NS 0.85NS 0.71NS 0.87NS 0.90*ΨP 0.80NS 0.77NS 0.74NS 0.75NS 0.72NS 0.72NS 0.88* 0.92** 0.75NS 0.78NS 0.62NS 0.82NS 0.85NS
SKC 0.97** 0.91* 0.89* 0.86NS 0.88* 0.73NS 0.99** 0.95* 0.95* 0.94* 0.82NS 0.93* 0.96**GCPC 0.94* 0.99** 0.98** 0.97** 0.97** 0.87NS 0.96* 0.96** 0.91* 0.96** 0.92* 0.99** 0.99**
* = Significant (p ≤ 0.05); ** = Significant (p ≤ 0.01); NS = Non-significant (p ≤ 0.05); GPS = Grains per spike; TGW = 1000-grain weight; GY = Grain yield; BY = Biological yield; HI = Harvest index; SY = Straw yield; PH= Plant height; SL = Spike length; SPS = Spikelets per spike; GFR = Grain filling rate; GFD = Grain filling duration; Chl a = Chlorophyll a; Chl b = Chlorophyll b; SOD = Superoxide dismutase; POD = Peroxidase; CAT = Catalase; TPC = Total phenolic contents; LP = Leaf proline; GB = Glycine betaine; TSP = Total soluble proteins; MDA = Malondialdehyde; ΨS = Osmotic potential; ΨW = Water potential; ΨP = Pressure potential; SKC = Shoot potassium contents; GCPC = Grain crude protein contentsn (number of pairs of observations) = 45
115

Table 4.2.16 (d): Correlation analyses showing strength of association among recorded attributes of wheat under heat from spike to grain filling (H1) and foliar applied potassium during 2016-17
Parameters SOD POD CAT TPC LP GB TSP MDA ΨS ΨW ΨP SKCPOD 0.98**CAT 0.99** 0.98**TPC 0.96** 0.98** 0.99**LP 0.99** 0.98** 0.99** 0.98**GB 0.99** 0.99** 0.99** 0.99** 0.99**TSP 0.92* 0.95* 0.96** 0.99** 0.95* 0.95*
MDA -0.98** -0.99** -0.99** -0.99** -0.99** -0.99** -0.97**ΨS 0.98** 0.97** 0.99** 0.97** 0.98** 0.98** 0.93* -0.98**ΨW 0.98** 0.98** 0.99** 0.97** 0.99** 0.98** 0.93* -0.98** 0.99**ΨP 0.97** 0.97** 0.99** 0.99** 0.99** 0.99** 0.97** -0.99** 0.98** 0.98**
SKC 0.97** 0.98** 0.94* 0.94* 0.95* 0.97** 0.89* -0.95* 0.93* 0.93* 0.92*GCPC 0.96* 0.91* 0.90* 0.86NS 0.92* 0.93* 0.78NS -0.90* 0.90* 0.90* 0.86NS 0.95*
* = Significant (p ≤ 0.05); ** = Significant (p ≤ 0.01); NS = Non-significant (p ≤ 0.05); SOD = Superoxide dismutase; POD = Peroxidase; CAT = Catalase; TPC = Total phenolic contents; LP = Leaf proline; GB = Glycine betaine; TSP = Total soluble proteins; MDA = Malondialdehyde; Ψ S = Osmotic potential; ΨW = Water potential; ΨP = Pressure potential; SKC = Shoot potassium contents; GCPC = Grain crude protein contentsn (number of pairs of observations) = 45
116

Table 4.2.17 (a): Correlation analyses showing strength of association among recorded attributes of wheat under heat from flowering to grain filling (H2) and foliar applied potassium during 2015-16
Parameters GPS TGW GY BY HI SY PH SL SPS GFR GFD Chl a Chl b
TGW 0.91*GY 0.91* 0.99**BY 0.84NS 0.97** 0.98**HI 0.92* 0.91* 0.92* 0.82NS
SY 0.71NS 0.89* 0.89* 0.97** 0.65NS
PH 0.86NS 0.99** 0.98** 0.99** 0.85NS 0.95*SL 0.98** 0.97** 0.97** 0.93* 0.94* 0.82NS 0.94*SPS 0.96** 0.98** 0.98** 0.95* 0.94* 0.84NS 0.96** 0.99**GFR 0.89* 0.99** 0.96** 0.94* 0.87NS 0.87NS 0.97** 0.95* 0.96**GFD 0.96* 0.95* 0.96** 0.95* 0.88* 0.87NS 0.94* 0.98** 0.98** 0.92*Chl a 0.90* 0.97** 0.92* 0.90* 0.86NS 0.81NS 0.94* 0.95* 0.95* 0.99** 0.89*Chl b 0.94* 0.99** 0.96** 0.94* 0.90* 0.85NS 0.96** 0.98** 0.98** 0.99** 0.95* 0.99**SOD 0.73NS 0.94* 0.94* 0.95* 0.83NS 0.89* 0.96* 0.85NS 0.88* 0.92* 0.83NS 0.86NS 0.89*POD 0.70NS 0.93* 0.92* 0.96** 0.73NS 0.95* 0.97** 0.83NS 0.86NS 0.93* 0.83NS 0.87NS 0.89*CAT 0.82NS 0.98** 0.98** 0.98** 0.86NS 0.92* 0.99** 0.92* 0.94* 0.96** 0.90* 0.92* 0.95*TPC 0.63NS 0.88* 0.89* 0.95* 0.66NS 0.97** 0.93* 0.77NS 0.81NS 0.85NS 0.80NS 0.77NS 0.81NS
LP 0.69NS 0.92* 0.90* 0.89* 0.74NS 0.82NS 0.91* 0.81NS 0.84NS 0.90* 0.76NS 0.86NS 0.86NS
GB 0.78NS 0.97** 0.96** 0.96** 0.84NS 0.91* 0.98** 0.89* 0.92* 0.96** 0.87* 0.92* 0.94*TSP 0.83NS 0.98** 0.98** 0.99** 0.85NS 0.94* 0.99** 0.92* 0.95* 0.96* 0.92* 0.91* 0.94*
MDA - 0.81NS - 0.98** - 0.95* - 0.93* - 0.87NS -0.86NS - 0.96** - 0.90* - 0.92NS - 0.97** - 0.86NS - 0.94* - 0.95*ΨS 0.78NS 0.97** 0.95* 0.96** 0.81NS 0.92* 0.98** 0.89* 0.91* 0.97** 0.87NS 0.93* 0.94*ΨW 0.76NS 0.96** 0.95* 0.97** 0.80NS 0.93* 0.98** 0.87NS 0.90* 0.96* 0.86NS 0.91* 0.93*ΨP 0.68NS 0.92* 0.92* 0.95* 0.74NS 0.94* 0.95* 0.81NS 0.85NS 0.89* 0.82NS 0.83NS 0.86NS
SKC 0.74NS 0.95* 0.92* 0.95* 0.77NS 0.92* 0.97** 0.85NS 0.88* 0.96* 0.83NS 0.92* 0.92*GCPC 0.88* 0.97** 0.95* 0.90* 0.94* 0.78NS 0.94* 0.94* 0.95* 0.97** 0.87NS 0.96* 0.96**
* = Significant (p ≤ 0.05); ** = Significant (p ≤ 0.01); NS = Non-significant (p ≤ 0.05); GPS = Grains per spike; TGW = 1000-grain weight; GY = Grain yield; BY = Biological yield; HI = Harvest index; SY = Straw yield; PH= Plant height; SL = Spike length; SPS = Spikelets per spike; GFR = Grain filling rate; GFD = Grain filling duration; Chl a = Chlorophyll a; Chl b = Chlorophyll b; SOD = Superoxide dismutase; POD = Peroxidase; CAT = Catalase; TPC = Total phenolic contents; LP = Leaf proline; GB = Glycine betaine; TSP = Total soluble proteins; MDA = Malondialdehyde; ΨS = Osmotic potential; ΨW = Water potential; ΨP = Pressure potential; SKC = Shoot potassium contents; GCPC = Grain crude protein contentsn (number of pairs of observations) = 45
117

Table 4.2.17 (b): Correlation analyses showing strength of association among recorded attributes of wheat under heat from flowering to grain filling (H2) and foliar applied potassium during 2015-16
Parameters SOD POD CAT TPC LP GB TSP MDA ΨS ΨW ΨP SKCPOD 0.97**CAT 0.99** 0.97**TPC 0.95* 0.98** 0.94*LP 0.98** 0.95* 0.96** 0.90*GB 0.99** 0.98** 0.99** 0.94* 0.97**TSP 0.98** 0.97** 0.99** 0.95* 0.93* 0.99**
MDA - 0.98** - 0.96* - 0.98** - 0.89* - 0.98** - 0.99** - 0.97**ΨS 0.98** 0.99** 0.99** 0.94* 0.96** 0.99** 0.98** - 0.99**ΨW 0.98** 0.99** 0.99** 0.96* 0.96** 0.99** 0.98** - 0.98** 0.99**ΨP 0.98** 0.99** 0.97** 0.99** 0.95* 0.98** 0.97** - 0.94* 0.97** 0.98**
SKC 0.97** 0.99** 0.98** 0.95* 0.96** 0.99** 0.97** - 0.98** 0.99** 0.99** 0.97**GCPC 0.94* 0.89* 0.96* 0.81NS 0.94* 0.96* 0.94* - 0.98** 0.94* 0.93* 0.88* 0.93*
* = Significant (p ≤ 0.05); ** = Significant (p ≤ 0.01); NS = Non-significant (p ≤ 0.05); SOD = Superoxide dismutase; POD = Peroxidase; CAT = Catalase; TPC = Total phenolic contents; LP = Leaf proline; GB = Glycine betaine; TSP = Total soluble proteins; MDA = Malondialdehyde; Ψ S = Osmotic potential; ΨW = Water potential; ΨP = Pressure potential; SKC = Shoot potassium contents; GCPC = Grain crude protein contentsn (number of pairs of observations) = 45
118

Table 4.2.17 (c): Correlation analyses showing strength of association among recorded attributes of wheat under heat from flowering to grain filling (H2) and foliar applied potassium during 2016-17
Parameters GPS TGW GY BY HI SY PH SL SPS GFR GFD Chl a Chl b
TGW 0.98**GY 0.94* 0.93*BY 0.91* 0.91* 0.99**HI 0.96* 0.95* 0.98** 0.95*SY 0.87NS 0.87NS 0.99** 0.99** 0.91*PH 0.99** 0.99** 0.95* 0.93* 0.95* 0.89*SL 0.97** 0.96** 0.92* 0.91* 0.91* 0.88* 0.99**SPS 0.94* 0.95* 0.99** 0.99** 0.95* 0.98** 0.95* 0.93*GFR 0.97** 0.99** 0.94* 0.93* 0.91* 0.91* 0.99** 0.98** 0.97**GFD 0.96* 0.92* 0.87NS 0.86NS 0.85NS 0.84NS 0.96** 0.99** 0.89* 0.96*Chl a 0.99** 0.99** 0.94* 0.92* 0.95* 0.87NS 0.99** 0.98** 0.95* 0.98** 0.94*Chl b 0.99** 0.99** 0.95* 0.94* 0.94* 0.91* 0.99** 0.99** 0.97** 0.99** 0.96** 0.99**SOD 0.95* 0.90* 0.85NS 0.84NS 0.83NS 0.83NS 0.95* 0.98** 0.87NS 0.94* 0.99** 0.93* 0.95*POD 0.90* 0.85NS 0.78NS 0.78NS 0.76NS 0.76NS 0.90* 0.95* 0.80NS 0.90* 0.98** 0.88* 0.90*CAT 0.95* 0.90* 0.87* 0.89* 0.86NS 0.87NS 0.95* 0.99** 0.90* 0.95* 0.99** 0.93* 0.96*TPC 0.90* 0.83NS 0.78NS 0.78NS 0.76NS 0.77NS 0.89* 0.95* 0.80NS 0.87NS 0.97** 0.86NS 0.89*LP 0.96* 0.91* 0.86NS 0.84NS 0.85NS 0.82NS 0.95* 0.99** 0.86NS 0.93* 0.99** 0.93* 0.95*GB 0.97** 0.92* 0.91* 0.90* 0.89* 0.88* 0.96** 0.99** 0.91* 0.94* 0.98** 0.94* 0.96*TSP 0.90* 0.83NS 0.77NS 0.76NS 0.75NS 0.75NS 0.89* 0.95* 0.79NS 0.88* 0.98** 0.87NS 0.89*
MDA -0.94* -0.88* -0.92* -0.91* -0.89* -0.90* -0.94* -0.97** -0.91* -0.92* -0.96* -0.92* -0.94*ΨS 0.84NS 0.77NS 0.72NS 0.73NS 0.67NS 0.72NS 0.84NS 0.91* 0.75NS 0.85NS 0.96* 0.81NS 0.85NS
ΨW 0.84NS 0.77NS 0.72NS 0.73NS 0.67NS 0.73NS 0.84NS 0.91* 0.75NS 0.84NS 0.95* 0.80NS 0.84NS
ΨP 0.84NS 0.74NS 0.72NS 0.72NS 0.70NS 0.70NS 0.82NS 0.89* 0.72NS 0.79NS 0.93* 0.79NS 0.81NS
SKC 0.94* 0.93* 0.82NS 0.81NS 0.81NS 0.78NS 0.95* 0.97** 0.86NS 0.96* 0.98** 0.94* 0.95*GCPC 0.98** 0.98** 0.98** 0.97** 0.97** 0.94* 0.99** 0.98** 0.98** 0.98** 0.95* 0.98** 0.99**
* = Significant (p ≤ 0.05); ** = Significant (p ≤ 0.01); NS = Non-significant (p ≤ 0.05); GPS = Grains per spike; TGW = 1000-grain weight; GY = Grain yield; BY = Biological yield; HI = Harvest index; SY = Straw yield; PH= Plant height; SL = Spike length; SPS = Spikelets per spike; GFR = Grain filling rate; GFD = Grain filling duration; Chl a = Chlorophyll a; Chl b = Chlorophyll b; SOD = Superoxide dismutase; POD = Peroxidase; CAT = Catalase; TPC = Total phenolic contents; LP = Leaf proline; GB = Glycine betaine; TSP = Total soluble proteins; MDA = Malondialdehyde; ΨS = Osmotic potential; ΨW = Water potential; ΨP = Pressure potential; SKC = Shoot potassium contents; GCPC = Grain crude protein contentsn (number of pairs of observations) = 45
119

Table 4.2.17 (d): Correlation analyses showing strength of association among recorded attributes of wheat under heat from flowering to grain filling (H2) and foliar applied potassium during 2016-17
Parameters SOD POD CAT TPC LP GB TSP MDA ΨS ΨW ΨP SKCPOD 0.99**CAT 0.99** 0.98**TPC 0.99** 0.99** 0.98**LP 0.99** 0.99** 0.99** 0.99**GB 0.98** 0.96* 0.99** 0.97** 0.99**TSP 0.99** 0.99** 0.98** 0.99** 0.99** 0.96*
MDA -0.97** -0.94* -0.99** -0.96** -0.97** -0.99** -0.94*ΨS 0.97** 0.99** 0.96* 0.99** 0.96* 0.93* 0.99** -0.92*ΨW 0.97** 0.99** 0.96* 0.99** 0.96* 0.93* 0.99** -0.92* 0.99**ΨP 0.95* 0.97** 0.94* 0.99** 0.95* 0.94* 0.98** -0.94* 0.97** 0.97**
SKC 0.98** 0.96* 0.96* 0.94* 0.96* 0.94* 0.95* -0.90* 0.93* 0.92* 0.87NS
GCPC 0.93* 0.88* 0.95* 0.88* 0.94* 0.96* 0.87NS -0.95* 0.82NS 0.82NS 0.81NS 0.92** = Significant (p ≤ 0.05); ** = Significant (p ≤ 0.01); NS = Non-significant (p ≤ 0.05); SOD = Superoxide dismutase; POD = Peroxidase; CAT = Catalase; TPC = Total phenolic contents; LP = Leaf proline; GB = Glycine betaine; TSP = Total soluble proteins; MDA = Malondialdehyde; Ψ S = Osmotic potential; ΨW = Water potential; ΨP = Pressure potential; GCPC = Grain crude protein contentsn (number of pairs of observations) = 45
120

Experiment III: Alleviation of terminal heat stress in wheat through foliar
application of selenium
4.3.1. Yield components and grain yield
(a) Results
Wheat grain yield and components were adversely affected due to heat however,
exogenous selenium remarkably alleviated these adverse impacts. Selenium mediated
improvements were similar in all main plots and thus non-significant interaction of heat
and foliar spray was observed for these parameters.
Treatments’ effects were non-significant on fertile tillers over the two study years.
While, significantly lesser number of grains per spike was recorded under ‘heat from
spike to grain filling’ compared to ‘no heat stress’ and ‘heat from flowering to grain
filling’ over the years. Whereas, some discrepancies were observed in 1000-grain weight
and grain yield over the years under varying heat imposition treatments. Number of grains
per spike was decreased by 41-43% under ‘heat from spike to grain filling’ and 23%
under ‘heat from flowering to grain filling’ compared to ‘no heat stress’ over the two
years of study. Whereas, ‘heat from spike to grain filling’ and ‘heat from flowering to
grain filling’ caused a decrease in 1000-grain weight by 21-22% and 12-19%,
respectively over the years. Likewise, grain yield was decreased by 43-44% under ‘heat
from spike to grain filling’ and 33-36% under ‘heat from flowering to grain filling’
compared to no heat stress’ over the years.
Significant improvements in grain yield and yield components were recorded with
the varying concentrations of exogenous selenium compared to control/water spray.
Statistically similar and relatively more number of grains per spike were observed with
25, 50, 75 and 100 mg L-1 exogenous selenium compared to control/water spray over
temporal variations. Whereas, statistically alike and relatively more 1000-grain weight
was observed with 50, 75 and 100 mg L-1 foliar selenium compared to control or lower
level of selenium (25 mg L-1) selenium during 2015-16 and 2016-17. While, statistically
similar and more grain yield was recorded with 75 and 100 mg L -1 exogenous selenium in
2015-16 and with 50, 75 and 100 mg L-1 foliar selenium in 2016-17 compared to other
selenium concentrations (Table 4.3.1 and Table 4.3.2).
Furthermore, number of grains per spike was enhanced by 0.13-0.14 under ‘no
heat stress’, 0.07 under ‘heat from spike to grain filling’ and 0.06 under ‘heat from
flowering to grain filling’ with each 25 mg L-1 increase in exogenous selenium over the
years. While, each 25 mg L-1 addition of exogenous selenium enhanced 1000-grain
121

weight by 0.05-0.06 g, 0.05-0.07 g and 0.03-0.05 g under ‘no heat stress’, ‘heat from
spike to grain filing’ and ‘heat from flowering to grin filling’ respectively, over the years.
Whereas, grain yield was enhanced by 0.011 t ha-1 under ‘no heat stress’, 0.005 t ha-1
under ‘heat from spike to grain filling’ and 0.009-0.011 t ha-1 under ‘heat from flowering
to grain filling’ during 2015-16 and 2016-17 with each unit addition of selenium.
Moreover, the selenium modulated improvements in grain yield and components were
more dependent on exogenous selenium under heat compared to ‘no heat stress’ over the
years (Figure 4.3.1 and Figure 4.3.2).
(b) Discussion
Deleterious impacts of high temperature on grain yield and components can be
elucidated in the context of heat-triggered decrease in biological yield of wheat.
Imposition of heat might have aggravated photorespiration and reduced the carbohydrates
availability for the vegetative growth. Ultimately, lesser green area of plant under heat
might have intercepted lesser light in photosynthesis and resulted into poor partitioning of
carbohydrates for the development of grains and related components. Moreover, strong
positive and significant correlation of grain yield, grains per spike and 1000-grain weight
with biological yield was recorded under ‘no heat stress (Table 4.3.14 a, c), under ‘heat
from spike to grain filling’ (Table 4.3.15 a, c) and under ‘heat from flowering to grain
filling (Table 4.3.16 a, c) over the temporal variations. High temperature stress decreased
the light interception, triggered photorespiration and ultimately decreased carbohydrates
availability for the development of vegetative and reproductive parts (Szymańska et al.,
2017). While, coincidence of high temperature with reproductive stages of wheat reduced
the carbohydrates synthesis for vegetative growth, enhanced grain filling rate and
ultimately decreased grain yield and components (Dwivedi et al., 2017).
Decrease in yield components and grain yield under heat can be attributed to
adverse impacts of heat on spike growth. High temperature mediated diminishment in
carbohydrates availability might have deleteriously reduced carbohydrate partitioning
towards spike and ultimately impaired ovule, pollens and pollen tube development.
Hence, decreased number of grains per spike might be a consequence of lesser ovules in
each spike. While, impaired pollen viability might have diminished the number of
fertilized ovules. Consequently, grains per spike might have decreased because of lesser
spike length and number of spikelets under heat.
122

Table 4.3.1: Effect of foliar applied selenium on fertile tillers and grains per spike of heat stressed wheat
A. Mean sum of square
Source of
variationDF
Fertile tillers Grains per spike
2015-16 2016-17 2015-16 2016-17
Blocks 2 381588 274930 535.0 226.7
Heat (H) 2 844NS 6911NS 1598.4** 1643.7**
Error I 4 1292 15641 38.3 42.1
Selenium (Se) 4 1490NS 525NS 117.5** 117.2**
H × Se 8 849NS 772NS 11.6NS 11.7NS
Error II 24 1276 1792 20.6 19.9** = Significant (p ≤ 0.01); NS = Non-significant
B. Comparison of treatments’ means
TreatmentsFertile tillers per m2 Grains per spike
2015-16 2016-17 2015-16 2016-17
Heat stress (H)
No heat stress (H0) 258 239 50.3 A 48.7 A
Heat from spike to grain filling (H1) 273 277 29.7 C 27.8 C
Heat from flowering to grain filling (H2) 265 240 38.8 B 37.3 B
Tukey’s HSD (p ≤ 0.05) NS NS 8.06 8.45
Selenium foliar spray (Se)
Control/ water spray (Se0) 280 262 34.8 B 33.1 B
25 mg L-1 selenium (Se25) 276 258 37.1 AB 35.3 AB
50 mg L-1 selenium (Se50) 260 247 40.5 AB 38.9 AB
75 mg L-1 selenium (Se75) 248 246 42.9 A 41.2 A
100 mg L-1 selenium (Se100) 261 247 42.9 A 41.2 A
Tukey’s HSD (p ≤ 0.05) NS NS 6.30 6.20
Year mean 265 252 39.6 37.9
Tukey’s HSD (p ≤ 0.05) NS NSAny two means not sharing a letter in common differ significantly at p ≤ 0.05; NS = Non-significant
Figure 4.3.1: Regression analysis for effect of foliar applied selenium on grains per spike of heat stressed wheat
123
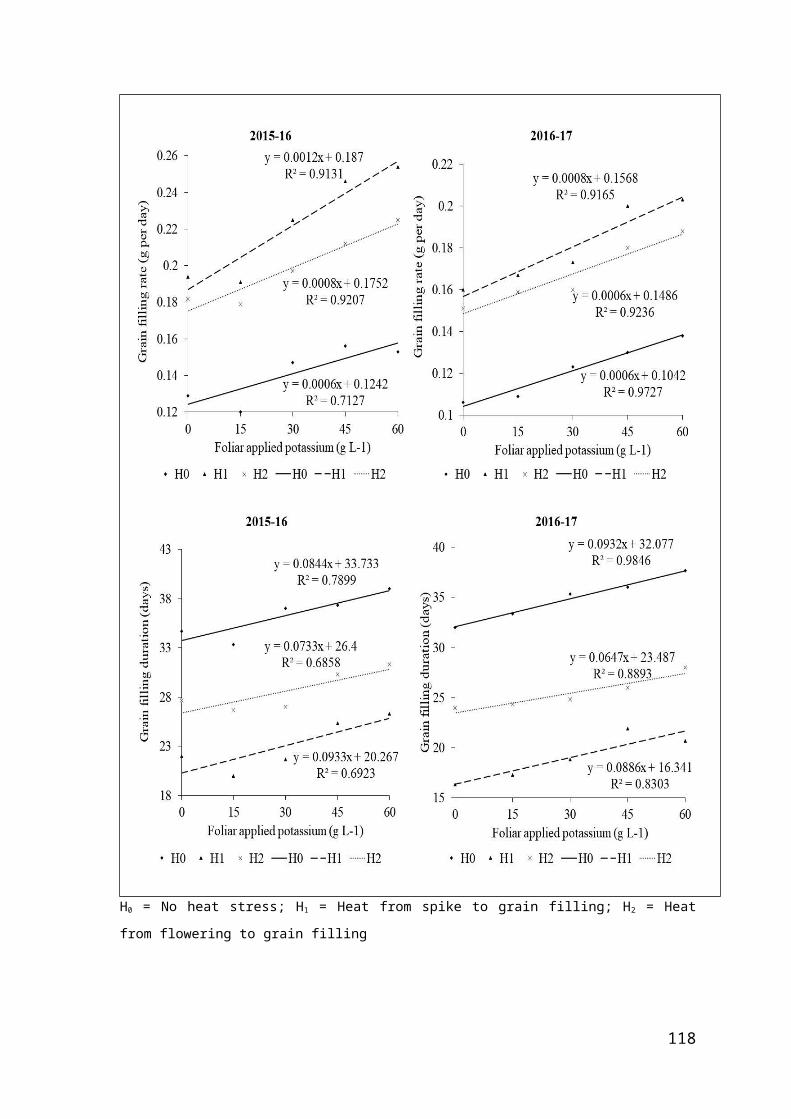
H0 = No heat stress; H1 = Heat from spike to grain filling; H2 = Heat from flowering to grain filling
Table 4.3.2: Effect of foliar applied selenium on 1000-grain weight and grain yield of heat stressed wheat
124
A. Mean sum of square
Source of
variationDF
1000-grain weight Grain yield
2015-16 2016-17 2015-16 2016-17
Blocks 2 368.51 251.8 8.36 1.84
Heat (H) 2 606.92** 391.4* 17.63* 18.08**
Error I 4 18.40 45.5 1.23 0.87
Selenium (Se) 4 52.22** 34.6** 1.17** 1.13**
H × Se 8 2.69NS 3.3NS 0.10NS 0.06NS
Error II 24 4.62 4.4 0.06 0.09* = Significant (p ≤ 0.05); ** = Significant (p ≤ 0.01); NS = Non-significant
B. Comparison of treatments’ means
Treatments1000-grain weight (g) Grain yield (t ha-1)
2015-16 2016-17 2015-16 2016-17
Heat stress (H)
No heat stress (H0) 52.2 A 48.5 A 5.08 A 4.74 A
Heat from spike to grain filling (H1) 40.6 B 38.3 B 2.91 B 2.63 B
Heat from flowering to grain filling (H2) 42.0 B 42.5 AB 3.87 AB 3.18 B
Tukey’s HSD (p ≤ 0.05) 5.58 8.78 1.443 1.214
Selenium foliar spray (Se)
Control/ water spray (Se0) 41.9 B 40.8 B 3.54 C 3.10 C
25 mg L-1 selenium (Se25) 43.4 B 41.4 B 3.63 C 3.21 BC
50 mg L-1 selenium (Se50) 44.8 AB 43.5 AB 3.98 B 3.56 AB
75 mg L-1 selenium (Se75) 47.8 A 45.3 A 4.26 AB 3.88 A
100 mg L-1 selenium (Se100) 46.8 A 44.7 A 4.34 A 3.84 A
Tukey’s HSD (p ≤ 0.05) 2.98 2.92 0.355 0.423
Year mean 44.9 43.2 3.95 3.52
Tukey’s HSD (p ≤ 0.05) NS NSAny two means not sharing a letter in common differ significantly at p ≤ 0.05; NS = Non-significant
Figure 4.3.2: Regression analysis for effect of foliar applied selenium on 1000-grain weight and grain yield of heat stressed wheat
125

H0 = No heat stress; H1 = Heat from spike to grain filling; H2 = Heat from flowering to grain filling
Likewise, high temperature might have enhanced the growth rate of spike while
lesser carbohydrates were available relative to accelerated growth of spike under heat.
Hence, sucrose availability was not enough to satiate the needs of rapidly growing spike
126

under heat stressed environment. Resultantly, 1000-grain weight might have reduced
because of more sink demand and lesser availability of carbohydrates from source which
ultimately decreased grain yield also. Besides, strong positive and pronouncing
association of spike length, spikelets per spike, grain filling rate and duration with grain
yield, grains per spike and 1000-grain weight under varying temperature stress
accomplished the spike growth meditated damages in grain yield and yield components
over the years (Table 4.3.14-4.3.16 a, c). Heat stress at terminal stages reduced the
duration of phenology, enhanced the growth, caused infertile pollen and ultimately
decreased grain yield and components (Iqbal et al., 2017). High temperature stress
triggered the grain filling rate, decreased pollen fertility, number of rains per spike and
grain yield (Barlow et al., 2015).
Another explanation is that heat stress caused excessive biosynthesis of ROS.
High temperature stress might have triggered the biosynthesis of ROS, which might have
outcompeted defensive mechanism of wheat leading to increased lipid peroxidation.
Oxidative stress might have reduced the carbohydrates partitioning towards reproductive
parts and thus grain yield and related components were adversely affected under heat.
Moreover, negative impacts of excessive ROS were also established form strong negative
and significant association of malondialdehyde with grains per spike, 1000-grain weight
and grain yield under ‘no heat stress’ (Table 4.3.14 a, c), under ‘heat from spike to grain
filling’ (Table 4.3.15 a, c) and under ‘heat from flowering to grain filling’ (Table 4.3.16 a,
c) over the years. Heat stress reduced the activities of superoxide dismutase, catalase,
peroxidase, glutathione reductase and enhanced membrane leakage in wheat seedlings
(Wang et al., 2014). Heat stress at terminal stages damaged the photosystem and
decreased grains per spike, 1000-grain weight and grain yield of wheat (Chen et al.,
2017).
Improvement in grain yield and components was ascribed to selenium modulated
improvements in chlorophyll a and b. Exogenous selenium improved the activities of
chlorophyll biosynthesizing enzymes and thus wheat stayed green for comparatively
longer duration. Hence, carbohydrates partitioning towards grains sustained for longer
duration and grain yield and components were improved. Strong positive and significant
association of chlorophyll contents with grain yield and yield components was recorded
which further accomplished the stay green role in the improvement of grain yield and
components over the years (Table 4.3.14-4.3.16 a, c) over the years. Likewise, selenium
127

enhanced chlorophyll contents and stay green trait under the stressed conditions which
ultimately improved yield (Nawaz et al., 2015).
Foliar applied selenium boosted the biosynthesis of osmo-protectants which
ultimately enhanced osmotic potential. Depression of osmotic potential ultimately caused
the water movements from apoplast to cells and thus cells retained turgor under heat and
conferred heat tolerance. Moreover, strong positive and pronouncing association of grain
yield and components with osmo-protectants and water relation attributes was recorded
under distinct temperature regimes over temporal variations. It accomplished the role of
osmo-protectants in improving grain yield and components (Table 4.3.14-4.3.16 a, c).
Foliar applied selenium enhanced the osmotic potential and improved turgor.
Enhancement in capability of plant to retain water under stress and improved antioxidants
conferred tolerance against stress (Naz et al., 2015).
Improvement in grain yield and components under exogenous selenium can also
be defined in terms of improved antioxidants activities. Exogenous selenium might have
triggered the SOD mediated dismutation of 1O2●- into H2O2. Resultantly, increased
availability of H2O2 might have triggered CAT and POD activities. Detoxification of ROS
might have alleviated oxidative stress and enhanced membrane integrity and thus induced
heat tolerance. Alleviation of adversities of heat might have improved yield and yield
components. Besides, strong positive and pronouncing correlation of antioxidants and
phenolics with grain yield and yield components was recorded under ‘no heat stress’
(Table 4.3.14 a, c), under ‘heat from spike to grain filling’ (Table 4.3.15 a, c) and under
‘heat from flowering to grain filling’ (Table 4.3.16 a, c) over the years which
accomplished the antioxidants modulated improvements in grain yield and yield
components. Application of selenium enhanced activities of SOD, POD, CAT,
glutathione peroxidase, proline contents and improved chlorophyll fluorescence under
stress environment (Cheng et al., 2016). Application of selenium enhanced pollen
viability, alleviated adverse impacts of oxidative stress and boosted antioxidant activities
under stressed environment (Tedeschini et al., 2015). Likewise, exogenously applied
selenium effectively alleviated the adverse impacts of stress and enhanced proline
biosynthesis, improved gaseous exchange attributes, photosynthetic efficiency and water
relations of wheat (Hajiboland et al., 2015).
4.3.2. Biomass accumulation
(a) Results
128

Imposition of heat stress significantly decreased biological yield, harvest index,
straw yield and plant height compared to ‘no heat stress’. While, deleterious impacts of
heat were more pronouncing under ‘heat from spike to grain filling’ compared to ‘heat
from flowering to grain filling’ over years. Yet, exogenously applied selenium depicted
significant improvements in biomass accumulation attributes compared to control/water
spray over temporal erraticism. Similar trends of selenium-modulated improvements
under all main plots were observed which resulted into non-significant interaction over
the years.
More reduction in plant height, straw yield, biological yield and harvest index was
observed in plots where crop remained under heat stress for relatively longer duration
(spike to grain filling) than in plots where crop faced heat for shorter time (flowering to
grain filling). However, crop under ‘no heat stress’ gained maximum values for these
parameters. So, ‘heat from spike to grain filling’ and ‘heat from flowering to grain
filling’ induced decrease in biological yield compared to ‘no heat stress’ was 34-35% and
18-23%, respectively. While, a diminishment of 12-16% under ‘heat from spike to grain
filling’ and 7-13% under ‘heat from flowering to grain filling’ compared to ‘no heat
stress’ was observed over the years. Similarly, straw yield was decreased by 27-31%
under ‘heat from spike to grain filling’ and 15-17% under ‘heat from flowering to grain
filling’ compared to ‘no heat stress’ over the two study years. Whereas, plant height was
reduced by 21-22% and 12-15% under ‘heat from spike to grain filling’ and under ‘heat
from flowering to grain filling’ over temporal variations.
Biomass accumulation attributes were improved significantly under exogenous
selenium application. Statistically similar and relatively more biological yield and harvest
index were recorded with 50,75 and 100 mg L-1 foliar selenium compared to other
concentrations over the years. Whereas, statistically similar and comparatively more
straw yield was observed with 50, 75 and 100 mg L-1 in 2015-16 and 25, 50, 75 and 100
mg L-1 application of foliar selenium in 2016-17. While, plant height was significantly
more with 75 mg L-1 selenium in 2015-16 whereas relatively more and statistically alike
under the 50, 75 and 100 mg L-1 foliar selenium in 2016-17 compared to other doses of
exogenous selenium (Table 4.3.3 and Table 4.3.4).
Besides, each 25 mg L-1 increment in exogenous selenium, biological yield was
increased by 0.012-0.016 t ha-1, 0.007-0.008 t ha-1 and 0.017-0.022 t ha-1 under ‘no heat
stress’, ‘heat from spike to grain filling’ and ‘heat from flowering to grain filling’,
respectively over the years. While, per unit foliar selenium modulated improvements in
129

harvest index were 0.04-05% under ‘no heat stress’, 0.02-0.04% under ‘heat from spike to
grain filling’ and 0.003% under’ heat from flowering to grain filling’ during 2015-16 and
2016-17. While, straw yield was enhanced by 0.001-0.004 t ha-1 under ‘no heat stress’,
0.002-0.003 t ha-1 under ‘heat from spike to grain filling’ and 0.008-0.011 t ha-1 under
‘heat from flowering to grain filling’ over the two years study period. Similarly, with each
addition of 25 mg L-1 of selenium dose, plant height was enhanced by 0.05-0.07 cm, 0.11
cm and 0.07 cm under ‘no heat stress’, ‘heat from spike to grain filling’ and ‘hat from
flowering to grain filling’ over the years. While, selenium mediated improvements in
biomass accumulating attributes were more under heat compared to ambient conditions
(Figure 4.3.3 and Figure 4.3.4).
(b) Discussion
High temperature environment might have impaired the activities of enzymes that
regulate chlorophyll biosynthesis. While, heat stress might have boosted the activities of
chlorophyll degrading enzymes and thus further escalated the senescence. It led to the
interception of light and thereby reduced the availability of carbohydrates and thus
decreased harvest index, plant height, straw and biological yield. Moreover, strong
positive and pronouncing association of biomass accumulation attributes with chlorophyll
contents was recorded under ‘no heat stress’ (Table 4.3.14 a, c), ‘heat from spike to grain
filling’ (Table 4.3.15 a, c) and ‘heat from flowering to grain filling’ (Table 4.3.16 a, c)
over the years. It accomplished the negative impacts of accelerated degradation of
chlorophyll on biomass accumulating attributes. High temperature stress aggravated
photoinhibition, disintegrated Mn-D1D2 complex at light harvesting complex of
photosystem-II, damaged photosynthetic machinery and inhibited the electron transfer in
electron transport chain of light reactions (Mathur et al., 2014). Consequently,
biosynthesis of reductants (NADH and NADPH) was decreased under heat which
ultimately downregulated the photosynthesis (Szymańska et al., 2017).
Similarly, lesser accumulation of proline under heat might have enhanced the
accumulation of singlet oxygen (1O2*), which aggravated chlorophyll degradation and
lipid peroxidation. While, impaired biosynthesis of osmo-protectants due to heat might
have depressed osmotic, water and turgor potential. Thereafter, hydrolases activities were
decreased which ultimately restricted the extension of cells under limitations of water
potential. Hence, cells could not sustain growth and resulted in lesser plant height,
biological and straw yield. Moreover, strong positive and remarkable correlation of osmo-
protectants with biomass accumulating attributes was observed under varying
130

temperatures over the temporal discrepancies. It established the damages in biomass
accumulation due to lesser biosynthesis of osmo-protectants.
Table 4.3.3: Effect of foliar applied selenium on biological yield and harvest index of heat stressed wheat
A. Mean sum of square
Source of
variationDF
Biological yield Harvest index
2015-16 2016-17 2015-16 2016-17
Blocks 2 20.93 16.51 726.15 565.91
Heat (H) 2 87.54** 66.94** 68.13* 163.71**
Error I 4 1.48 0.84 6.15 7.43
Selenium (Se) 4 3.37** 2.33** 13.40** 26.46**
H × Se 8 0.36NS 0.14NS 1.01NS 0.91NS
Error II 24 0.27 0.41 2.58 3.55* = Significant (p ≤ 0.05); ** = Significant (p ≤ 0.01); NS = Non-significant
B. Comparison of treatments’ means
TreatmentsBiological yield (t ha-1) Harvest index (%)
2015-16 2016-17 2015-16 2016-17
Heat stress (H)
No heat stress (H0) 13.74 A 12.14 A 36.97 A 39.04 A
Heat from spike to grain filling (H1) 8.91 C 8.00 C 32.66 B 32.87 B
Heat from flowering to grain filling (H2) 11.22 B 9.34 B 34.49 AB 34.05 B
Tukey’s HSD (p ≤ 0.05) 1.584 1.194 3.228 3.548
Selenium foliar spray (Se)
Control/ water spray (Se0) 10.60 C 9.20 C 33.40 C 33.70 B
25 mg L-1 selenium (Se25) 10.71 BC 9.40 BC 33.89 BC 34.15 B
50 mg L-1 selenium (Se50) 11.40 AB 9.93 ABC 34.91 ABC 35.85 AB
75 mg L-1 selenium (Se75) 11.80 A 10.33 A 36.10 AB 37.56 A
100 mg L-1 selenium (Se100) 11.93 A 10.27 AB 36.38 A 37.39 A
Tukey’s HSD (p ≤ 0.05) 0.722 0.894 2.233 2.617
Year mean 11.29 A 9.83 B 34.99 35.81
Tukey’s HSD (p ≤ 0.05) 0.933 NSAny two means not sharing a letter in common differ significantly at p ≤ 0.05; NS = Non-significant
131

Figure 4.3.3: Regression analysis for effect of foliar applied selenium on biological yield and harvest index of heat stressed wheat
H0 = No heat stress; H1 = Heat from spike to grain filling; H2 = Heat from flowering to grain filling
132

Table 4.3.4: Effect of foliar applied selenium on straw yield and plant height of heat stressed wheat
A. Mean sum of square
Source of
variationDF
Straw yield Plant height
2015-16 2016-17 2015-16 2016-17
Blocks 2 12.81 0.07 5198.7 3435.6
Heat (H) 2 26.61* 15.64** 1562.4* 2101.8*
Error I 4 1.85 0.12 131.7 137.0
Selenium (Se) 4 0.57** 0.22* 140.4** 121.2**
H × Se 8 0.13NS 0.07NS 9.9NS 6.7NS
Error II 24 0.12 0.06 10.2 15.7* = Significant (p ≤ 0.05); ** = Significant (p ≤ 0.01); NS = Non-significant
B. Comparison of treatments’ means
TreatmentsStraw yield (t ha-1) Plant height (cm)
2015-16 2016-17 2015-16 2016-17
Heat stress (H)
No heat stress (H0) 8.66 A 7.40 A 106.9 A 106.6 A
Heat from spike to grain filling (H1) 6.00 B 5.37 C 84.7 B 83.4 B
Heat from flowering to grain filling (H2) 7.35 AB 6.16 B 94.3 AB 90.9 B
Tukey’s HSD (p ≤ 0.05) 1.773 0.452 14.94 15.24
Selenium foliar spray (Se)
Control/ water spray (Se0) 7.06 C 6.10 B 91.7 C 89.1 C
25 mg L-1 selenium (Se25) 7.08 BC 6.19 AB 93.4 BC 90.8 BC
50 mg L-1 selenium (Se50) 7.42 ABC 6.37 AB 95.6 BC 94.3 ABC
75 mg L-1 selenium (Se75) 7.54 AB 6.45 A 101.9 A 97.9 A
100 mg L-1 selenium (Se100) 7.59 A 6.43 AB 97.3 B 96.1 AB
Tukey’s HSD (p ≤ 0.05) 0.473 0.339 4.44 5.50
Year mean 7.34 A 6.31 B 95.97 93.6
Tukey’s HSD (p ≤ 0.05) 0.503 NSAny two means not sharing a letter in common differ significantly at p ≤ 0.05; NS = Non-significant
133

Figure 4.3.4: Regression analysis for effect of foliar applied selenium on straw yield and plant height of heat stressed wheat
H0 = No heat stress; H1 = Heat from spike to grain filling; H2 = Heat from flowering to grain filling
134
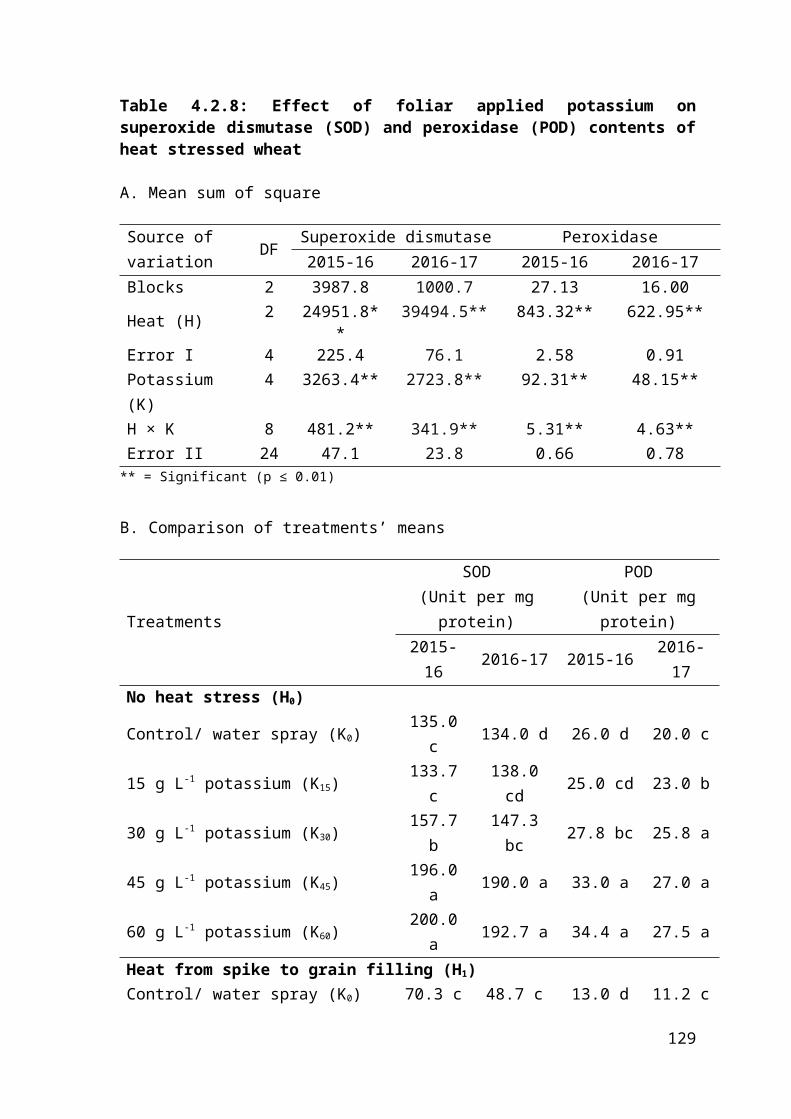
Likewise, strong negative and pronouncing correlation of biological, straw yield,
harvest index and plant height with malondialdehyde was recorded under varying
temperature regimes during 2015-16 and 2016-17 (Table 4.3.14-4.3.16 a, c). High
temperature stress reduced the pollen viability, caused the abortion of flowers and thus
reduced harvest index of wheat by affecting grains (Prasad et al., 2017). While, 5°C
higher temperature than ambient environment deleteriously impacted gaseous exchange
attributes, photosynthetic efficiency, plant height, harvest index and grain yield of
terminal heat stressed wheat crop (Dwivedi et al., 2017).
Improvement of biomass accumulation attributes under exogenous selenium can
be ascribed to selenium modulated improvements in water relations of wheat under heat.
Exogenously applied selenium induced the biosynthesis of proline and other osmo-
protectants leading to the detoxification of 1O2* which ultimately alleviated oxidative
stress. As a result, ability of cells to retain water was enhanced under heat. This greater
amount of water might have transferred from apoplast to cell cytosol, which enhanced
turgor and cells continued to grow under stressed environment. Moreover, strong positive
and pronouncing correlation of water relations attributes with biological, straw yield,
harvest index and plant height was recorded under different temperatures over the
temporal variability (Table 4.3.14-4.3.16 a, c). It further established the water relations
modulated enhancements in biomass accumulation. Foliar application of selenium
improved antioxidant defensive mechanism of plant, alleviated ROS, improved
membrane stability and water relations under stress condition (Ahmad et al., 2016).
Whereas, exogenous selenium modulated alleviation of oxidative stress decreases lipid
peroxidation under UV light stress (Mostafa and Hassan, 2015).
Likewise, selenium might have boosted the enzymatic (SOD) scavenging of 1O2●-
to H2O2. Concurrently, improved water relations might have decreased the sensitivity of
wheat to ROS and antioxidants were not saturated from excessive substrates (ROS).
Consequently, alleviation of oxidative stress might have slowed down the degradation of
chlorophyll and augmented activities of enzymes involved in synthesis of chlorophyll.
More chlorophyll ultimately enhanced the availability of assimilates to produce more
biological yield, harvest index and plant height. Furthermore, strong positive and
significant association of chlorophyll contents with biomass accumulating attributes over
the temperature and temporal variations accomplished the role of chlorophyll in
enhancement of biomass accumulating attributes (Table 4.3.14-4.3.16 a, c). Increase of
selenium availability improved the peroxidase, phenolic content, chlorophyll content and
135

decreased lipid peroxidation (Sharma et al., 2014b). Application of selenium under heat
and UV light stress conditions enhanced the biosynthesis of antioxidants and chlorophyll
contents (Sieprawska et al., 2015).
4.3.3. Growth of spike
(a) Results
Imposition of both heat treatments significantly decreased spike length, spikelets
per spike and grain filling duration compared to ‘no heat stress’. Whereas, grain filling
rate was significantly faster under heat compared to ambient conditions. Foliar
application of selenium significantly enhanced spike length, spikelets per spike, grain
filling rate and duration compared to control/water spray. Moreover, quite similar trends
were observed with different selenium concentrations in all main plots that resulted into
non-significant ‘heat × selenium’ effect over the years regarding growth of spike.
Significantly lesser and statistically similar spike length was measured under ‘heat
from spike to grain filling’ and ‘heat from flowering to grain filling’ compared to ‘no heat
stress’ over the years. While, significantly fewer number of spikelets per spike were
obtained under ‘heat from spike to grain filling’ compared to ‘no heat stress’ and ‘heat
from flowering to grain filling’ over the temporal inconsistencies. Whereas, grain filling
rate under ‘heat from flowering to grain filling’ was statistically alike to those under ‘no
heat stress’ and ‘heat from spike to grain filling’ during 2015-16. While, statistically alike
and significantly quicker grain filling rate was recorded under both heat stress treatments
compared to ‘no heat stress’ during 2016-17. Likewise, grain filling duration was
significantly shorter under heat stress treatments compared to ‘no heat stress’ during
2015-16. While, grain filling duration under ‘heat from flowering to grain filling’ was
statistically similar to those under ‘no heat stress’ and ‘heat from spike to grain filling’
during 2016-17.
Different concentrations of exogenous selenium varied significantly for spike
growth. Relatively more spike length and spikelets per spike were recorded with 75 and
100 mg L-1 exogenous selenium compared to control/water spray over the years. Whereas,
statistically higher grain filling rate and prolonged duration were evident with 50, 75 and
100 mg L-1 exogenous selenium over the control/water spray or 25 mg L-1 selenium over
the years (Table 4.3.5 and Table 4.3.6).
Additionally, with each unit application of selenium the spike length was
enhanced by 0.04 cm, 0.02-0.03 cm and 0.03 cm under ‘no heat stress’, ‘heat from spike
to grain filling’ and ‘heat from flowering to grain filling’, respectively over the years.
136

While, spikelets per spike were improved by 0.03 under ‘no heat stress’, 0.02-0.03 under
‘heat from spike to grain filling’ and 0.02-0.03 under ‘heat from flowering to grain
filling’ with each 25 mg L-1 addition of foliar selenium over the years. Likewise, each 25
mg L-1 application of foliar selenium enhanced grain filling rate by 0.0002-0.0003 g per
day under ‘no heat stress’, 0.0003-0.0004 g per day under ‘heat from spike to grain
filling’ and 0.0001-0.0002 g per day under ‘heat from flowering to grain filling’ over the
two study years. Whereas, grain filling duration was enhanced by 0.02 days, 0.05-0.06
days and 0.02 days under ‘no heat stress’, ‘heat from spike to grain filling’ and ‘heat from
flowering to grain filling’ with each unit increment in foliar selenium over the temporal
variability. Moreover, dependence of spike length and spikelets per spike on exogenous
selenium was enhanced under the stress compared to ‘no heat stress’ over the years.
Foliar selenium triggered improvements in grain filling rate were higher under ‘heat from
spike to grain filling’ compared to ‘no heat stress in 2015-16. While, relatively more
improvements in grain filling rate were observed under ‘no heat stress/control compared
to both heat stress treatments in 2016-17. Likewise, improvements in grain filling
duration were more dependent on exogenous selenium under ‘heat from spike to grain
filling’ compared to control/no heat stress over the years. However, this dependence was
lesser under ‘heat from flowering to grain filling’ compared to ‘control/no heat stress’
over the temporal variations (Figure 4.3.5 and Figure 4.3.6).
(b) Discussion
Heat stress adversely impacted the biomass accumulation and ultimately reduced
the sources (leaves) for photosynthesis. Lesser biomass might have reduced the
partitioning of carbohydrates towards reproductive parts. Hence decreased spike length
and spikelets per spike might be consequence of decreased availability of carbohydrates.
Moreover, heat stress accelerated growth of spike in conjunction with impaired
availability of assimilates. Thus, decrease in spike length and spikelets per spike was an
adaptive response to poor synchronization of source supply and sink growth rate. While,
strong positive and pronouncing association of biological yield and plant height with
spike growth attributes was observed over the varying temperature stresses and years. It
further accomplished the heat mediated negative impacts on spike growth due to lesser
biological yield and plant height (Table 4.3.14-4.3.16 a, c). Higher temperature in rice
decreased above ground biomass, leaf area, spikelets per panicle and panicle length.
137

Table 4.3.5: Effect of foliar applied selenium on spike length and spikelets per spike of heat stressed wheat
A. Mean sum of square
Source of
variationDF
Spike length Spikelets per spike
2015-16 2016-17 2015-16 2016-17
Blocks 2 27.9 20.5 33.90 94.89
Heat (H) 2 150.2** 197.6** 196.07** 188.44**
Error I 4 2.2 4.0 2.54 3.58
Selenium (Se) 4 18.5** 18.8** 12.78** 14.30**
H × Se 8 1.8NS 2.5NS 0.38NS 1.06NS
Error II 24 1.0 2.3 0.47 1.04** = Significant (p ≤ 0.01); NS = Non-significant
B. Comparison of treatments’ means
TreatmentsSpike length (cm) Spikelets per spike
2015-16 2016-17 2015-16 2016-17
Heat stress (H)
No heat stress (H0) 20.4 A 19.5 A 19.1 A 18.1 A
Heat from spike to grain filling (H1) 14.5 B 12.6 B 11.9 C 11.0 C
Heat from flowering to grain filling (H2) 15.4 B 14.2 B 15.2 B 14.0 B
Tukey’s HSD (p ≤ 0.05) 1.91 2.60 2.08 2.46
Selenium foliar spray (Se)
Control/ water spray (Se0) 15.0 D 13.4 C 14.3 B 13.4 C
25 mg L-1 selenium (Se25) 15.7 CD 14.9 BC 14.4 B 13.1 C
50 mg L-1 selenium (Se50) 17.0 BC 15.5 ABC 15.0 B 14.0 BC
75 mg L-1 selenium (Se75) 18.6 A 17.3 A 16.9 A 16.1 A
100 mg L-1 selenium (Se100) 17.5 AB 16.1 AB 16.5 A 15.3 AB
Tukey’s HSD (p ≤ 0.05) 1.41 2.11 0.95 1.41
Year mean 16.8 15.42 15.4 14.4
Tukey’s HSD (p ≤ 0.05) NS NSAny two means not sharing a letter in common differ significantly at p ≤ 0.05; NS = Non-significant
Figure 4.3.5: Regression analysis for effect of foliar applied selenium on spike length and spikelets per spike of heat stressed wheat
138

H0 = No heat stress; H1 = Heat from spike to grain filling; H2 = Heat from flowering to grain filling
Table 4.3.6: Effect of foliar applied selenium on grain filling rate (GFR) and grain filling duration (GFD) of heat stressed wheat
139

A. Mean sum of square
Source of
variationDF
Grain filling rate Grain filling duration
2015-16 2016-17 2015-16 2016-17
Blocks 2 0.00663 0.00172 243.9 66.7
Heat (H) 2 0.01103* 0.00795** 628.0** 503.1*
Error I 4 0.00073 0.00029 19.5 32.9
Selenium (Se) 4 0.00121** 0.00106** 19.6** 18.4**
H × Se 8 0.00010NS 0.00009NS 2.4NS 2.2NS
Error II 24 0.00009 0.00015 4.0 3.9* = Significant (p ≤ 0.05); ** = Significant (p ≤ 0.01); NS = Non-significant
B. Comparison of treatments’ means
TreatmentsGFR (g per day) GFD (days)
2015-16 2016-17 2015-16 2016-17
Heat stress (H)
No heat stress (H0) 0.12 B 0.11 B 34.74 A 32.43 A
Heat from spike to grain filling (H1) 0.17 A 0.16 A 21.87 B 20.96 B
Heat from flowering to grain filling (H2) 0.15 AB 0.13 A 27.11 B 25.27 AB
Tukey’s HSD (p ≤ 0.05) 0.035 0.022 5.750 7.467
Selenium foliar spray (Se)
Control/ water spray (Se0) 0.13 C 0.13 BC 26.18 B 24.68 B
25 mg L-1 selenium (Se25) 0.14 BC 0.12 C 26.83 B 25.18 B
50 mg L-1 selenium (Se50) 0.15 AB 0.14 ABC 27.92 AB 25.98 AB
75 mg L-1 selenium (Se75) 0.16 A 0.15 A 29.88 A 28.21 A
100 mg L-1 selenium (Se100) 0.16 A 0.14 AB 28.72 AB 27.06 AB
Tukey’s HSD (p ≤ 0.05) 0.013 0.017 2.788 2.731
Year mean 0.15 0.13 27.91 26.22
Tukey’s HSD (p ≤ 0.05) NS NSAny two means not sharing a letter in common differ significantly at p ≤ 0.05; NS = Non-significant
Figure 4.3.6: Regression analysis for effect of foliar applied selenium on grain filling rate and grain filling duration of heat stressed wheat
140

H0 = No heat stress; H1 = Heat from spike to grain filling; H2 = Heat from flowering to grain filling
Heat triggered decrease in photosynthesis and increase in photorespiration
reduced the availability of carbohydrates for development of reproductive organs (Laza et
141

al., 2015). Additionally, heat stress during post heading stages shortened the phenology of
spike and related attributes of wheat crop (Liu et al., 2016b).
Conversely, ever swelling demands of spike for carbohydrates due to more growth
rate and lesser duration could not be satiated and thus grain filling duration was reduced
under heat compared to ‘no heat stress’. While, negative feedback and reduced
availability of carbohydrates to reproductive parts was also accomplished from decrease
of 1000-grain weight and number of grains per spike under heat compared to those under
‘no heat stress’. Moreover, relative decrease of grain filling duration was also higher than
the increase of grain filling rate under heat compared to ‘no heat stress’ over the years.
Thus, increased grain filling duration could not compensate for reduced phenology and
resulted in reduced spikelets per spike, spike length, 1000-grain weight and number of
grains per spike. Moreover, strong positive and remarkable association of spike growth
attributes was observed with chlorophyll contents. Additionally, 1000-grains weight and
number of grain per spike also depicted strong positive and noticeable association with
spike growth attributes under varying conditions of heat and over the years (Table 4.3.14-
4.3.16 a, c). Increase of temperature accelerated senescence in wheat, adversely affected
spike attributes and yield components (Barlow et al., 2015). While, high temperature
stress reduced the biosynthesis of aminolaevulinic acid dehydratase and enhanced the
biosynthesis of protochlorophyllide oxidoreductase. Consequently, chlorophyll
degradation was more than the rate of biosynthesis, which resulted in accelerated
senescence and affected spike development (Iqbal et al., 2017).
Foliar application of selenium enhanced the biosynthesis of proline, glycine
betaine and soluble proteins. Consequently, the osmotic and water potential and the turgor
potential might have been improved. Retention of water in cells decreased the sensitivity
of wheat towards heat and thereby spike took more time for grain filling. While, more
turgor with the selenium availability might have activated hydrolases which ultimately
triggered the breakdown of cell wall cellulose and pectin. Simultaneously, the
biosynthesis of osmo-protectants enhanced the osmotic, water and turgor potential and
thus cell sustained to grow for longer duration which ultimately improved spike length,
spikelets per spike, grain filling rate and duration. While, strong positive and remarkable
association of osmo-protectants with attributes of spike growth and water relations was
recorded under varying temperature regimes over the years. It further confirmed the role
of osmo-protectants in growth of spike (Table 4.3.14-4.3.16 a, c). Application of selenium
enhanced the biosynthesis of proline, alleviated oxidative stress, and improved the
142

membrane stability and turgor potential of cells under stress conditions (Bybordi, 2016).
Likewise, exogenous selenium improved the antioxidant defensive mechanism of plant,
enhanced membrane stability and relative leaf water contents under stress conditions
(Mozafariyan et al., 2016).
Likewise, improvements in antioxidants and phenolic contents under heat might
have prolonged the stay green by and carbohydrates partitioning to spike improved spike
growth. While, strong positive and pronounced correlation of antioxidants, phenolics and
chlorophyll contents with the spike attributes was recorded under ‘no heat stress’ (Table
4.3.14 a, c), ‘heat from spike to grain filling’ (Table 4.3.15 a, c) and ‘heat from flowering
to grain filling’ (Table 4.3.16 a, c) during 2015-16 and 2016-17. While, strong negative
and remarkable association of spike growth attributes was recorded with malondialdehyde
contents under the varying conditions of temperature and over the years. It accomplished
the importance of decreased lipid peroxidation for development of spike (Table 4.3.14 a,
c; Table 4.3.15 a, c and Table 4.3.16 a, c). Application of selenium enhanced the activities
of enzymatic and non-enzymatic antioxidants and improved bio-membrane stability
(Yildiztugay et al., 2017). While, antioxidant defense mechanism and quality was
improved with increasing selenium contents of plant (Mora et al., 2015).
4.3.4. Stay green and antioxidants
(a) Results
Heat stress and selenium significantly affected the chlorophyll a, b contents, SOD,
POD, CAT and TPC. Different concentrations of selenium exhibited similar responses
under all heat treatments and resulted into non-significant interaction of heat and
selenium foliar spray for stay green trait. Whereas, selenium modulated improvements in
SOD, POD, CAT and TPC differed significantly under varying high temperature
environments and resulted into significant ‘heat × selenium’ effect over the years.
Significantly lesser chlorophyll a contents were recorded under ‘heat from spike
to grain filling’ compared to ‘no heat stress’ and ‘heat from flowering to grain filling’
over the years. While, significantly lesser and statistically alike chlorophyll b contents
were quantified under ‘heat from spike to grain filling’ and ‘heat from flowering to grain
filling’ compared to ‘no heat stress’ over the temporal variations. Moreover, ‘heat from
spike to grain filling’ and ‘heat from flowering to grain filling’ caused decrease in
chlorophyll a contents by 36-38% and 19-21%, respectively compared to ‘no heat stress’.
Whereas, chlorophyll b contents were diminished by 42-49% under ‘heat from spike to
143

grain filling’ and 33-35% under ‘heat from flowering to grain filling’ compared to no heat
stress.
Varying concentrations of foliar applied selenium significantly improved
chlorophyll a and b contents compared to control/ water spray. Statistically similar and
significantly more chlorophyll a contents were recorded with 75 and 100 mg L-1 selenium
compared to other concentrations during 2015-16 and 2016-17. Likewise, relatively better
chlorophyll b contents were recorded with 75 and 100 mg L-1 exogenous selenium
compared to control/water spray over the years (Table 4.3.7).
Moreover, chlorophyll a contents were improved by 0.004, 0.003-0.004 and 0.003
mg g-1 FW under ‘no heat stress’, ‘heat from spike to grain filling’ and ‘heat from
flowering to grain filling’ with each unit foliar application of selenium over the period of
two years. While, each 25 mg L-1 exogenous selenium enhanced chlorophyll b contents by
0.002 mg g-1 FW under ‘no heat stress’, 0.0008-0.0010 mg g-1 FW under ‘heat from spike
to grain filling’ and 0.0008-0.0009 mg g-1 FW under ‘heat from flowering to grain filling’.
Besides, improvement in chlorophyll contents was generally more dependent on selenium
under stress compared to ambient conditions over the years (Figure 4.3.7).
Regards antioxidants, comparatively more activities of SOD, POD and CAT were
recorded under ‘no heat stress’ compared to both heat stress treatments. While, ‘heat from
spike to grain filling’ depicted more adverse impacts for SOD, POD, CAT and TPC
contents compared to ‘heat from flowering to grain filling’ over the years.
Under ‘no heat stress’, application of exogenous selenium at 75 mg L -1 either
exhibited significantly more or remained at par with 100 mg L-1 selenium regarding the
activities of SOD and POD over the years. While, application of 100 mg L -1 exogenous
selenium either depicted significantly more activities or it was statistically alike to 75 mg
L-1 foliar selenium concerning SOD and POD activities under both heat stress treatments
during 2015-16 and 2016-17. Likewise, significantly more activities of CAT and TPC
were recorded with 75 mg L-1 exogenous selenium during 2015-17 under ‘no heat stress’.
While, statistically similar and significantly more CAT and TPC were measured with 75
and 100 mg L-1 foliar selenium in 2016-17 under ‘no heat stress’. Whereas, significantly
higher activities of CAT and TPC were observed with 100 mg L -1 exogenous selenium
compared to other concentrations under heat over the years. While, relatively lesser and
statistically alike activities of SOD, POD, CAT and TPC were recorded with
control/water spray in all main plots over the two years study (Table 4.3.8 and Table
4.3.9).
144

Moreover, each 25 mg L-1 selenium modulated increments in SOD were 0.53-0.57
U mg-1 protein under ‘no heat stress’, 0.37-0.41 U mg-1 protein under ‘heat from spike to
grain filling’ and 0.31 U mg-1 protein under ‘heat from flowering to grain filling’ over the
years. While, POD contents were enhanced by 0.03, 0.07 and 0.05-0.06 U mg-1 protein
under ‘no heat stress’, ‘heat from spike to grain filling’ and ‘heat from flowering to grain
filling, respectively with each unit application of foliar selenium over the years. While,
each unit of selenium mediated improvements in CAT were 0.23 U mg-1 protein under ‘no
heat stress’, 0.08-0.09 U mg-1 protein under ‘heat from spike to grain filling’ and 0.06-
0.08 U mg-1 protein under ‘heat from flowering to grain filling’ over the years. Each 25
mg L-1 addition of foliar selenium enhanced the TPC by 0.08-0.09, 0.06 and 0.03-0.05 mg
GAE g-1 under ‘no heat stress’, ‘heat from spike to grain filling’ and ‘heat from flowering
to grain filling’, respectively over the years. Moreover, SOD, POD, CAT and TPC
dependence on availability of foliar selenium was enhanced under stress conditions
compared to ambient conditions over the years (Figure 4.3.8 and Figure 4.3.9).
(b) Discussion
Decrease of chlorophyll, antioxidants and TPC under heat can be attributed to
degradation of chlorophyll. High temperature might have destabilized the reaction center
of photosystem-II (PS-II). It resulted in more energy transfer to reaction center and
accelerated photolysis of water. Whereas, transfer of electrons in electron transport chain
was slowed down under heat. Therefore, plethora of free electrons at reaction center of
PS-II reacted with lipids of bio-membranes on one side while activated the ground state
oxygen released from photolysis of water to singlet oxygen (1O2*) on the other hand.
Consequently, 1O2* triggered the breakdown of chlorophyll. While, impairment in flow of
electrons in electron transport chain of light reaction might have reduced reductants
(NADPH) to reduce carbon dioxide in photosynthesis. Poor partitioning of carbohydrates
was also confirmed from lesser 1000-grain weight and number of grains per spike under
heat compared to ‘no heat stress’. Moreover, strong positive and remarkable association
of chlorophyll contents with antioxidants and TPC confirmed the chlorophyll breakdown
damages to antioxidants activities (Table 4.3.14-4.3.16 a, c). Impairment in electron
generation at reaction center and transfer in electron transport chain triggered the
synthesis of ROS, which enhanced degradation of chlorophyll and restricted biosynthesis
of chlorophyll.
145

Table 4.3.7: Effect of foliar applied selenium on chlorophyll a (Chl a) and on chlorophyll b (Chl b) contents of heat stressed wheat
A. Mean sum of square
Source of
variationDF
Chlorophyll a Chlorophyll b
2015-16 2016-17 2015-16 2016-17
Blocks 2 0.499 0.530 0.0622 0.1086
Heat (H) 2 2.263** 2.425** 0.2502** 0.2970**
Error I 4 0.265 0.033 0.0022 0.0136
Selenium (Se) 4 0.194** 0.210** 0.0233** 0.0187**
H × Se 8 0.007NS 0.009NS 0.0011NS 0.0015NS
Error II 24 0.011 0.012 0.0008 0.0010** = Significant (p ≤ 0.01); NS = Non-significant
B. Comparison of treatments’ means
TreatmentsChl a (mg g-1 FW) Chl b (mg g-1 FW)
2015-16 2016-17 2015-16 2016-17
Heat stress (H)
No heat stress (H0) 2.12 A 2.08 A 0.60 A 0.57 A
Heat from spike to grain filling (H1) 1.35 C 1.28 C 0.35 B 0.29 B
Heat from flowering to grain filling (H2) 1.72 B 1.65 B 0.40 B 0.37 B
Tukey’s HSD (p ≤ 0.05) 0.212 0.236 0.059 0.152
Selenium foliar spray (Se)
Control/ water spray (Se0) 1.57 B 1.50 B 0.39 C 0.36 D
25 mg L-1 selenium (Se25) 1.62 B 1.55 B 0.40 C 0.37 CD
50 mg L-1 selenium (Se50) 1.69 B 1.63 B 0.46 B 0.41 BC
75 mg L-1 selenium (Se75) 1.88 A 1.84 A 0.51 A 0.46 A
100 mg L-1 selenium (Se100) 1.88 A 1.82 A 0.49 AB 0.45 AB
Tukey’s HSD (p ≤ 0.05) 0.143 0.153 0.039 0.044
Year mean 1.73 1.67 0.45 0.41
Tukey’s HSD (p ≤ 0.05) NS NSAny two means not sharing a letter in common differ significantly at p ≤ 0.05; NS = Non-significant
Figure 4.3.7: Regression analysis for effect of foliar applied selenium on chlorophyll a and on chlorophyll b contents of heat stressed wheat
146

H0 = No heat stress; H1 = Heat from spike to grain filling; H2 = Heat from flowering to grain filling
147

Table 4.3.8: Effect of foliar applied selenium on superoxide dismutase (SOD) and peroxidase (POD) contents of heat stressed wheat
A. Mean sum of square
Source of variation
DFSuperoxide dismutase Peroxidase
2015-16 2016-17 2015-16 2016-17Blocks 2 1082.9 3985.1 30.5 26.0Heat (H) 2 27074.4** 24566.5** 933.4** 1131.4**Error I 4 45.3 361.4 6.2 2.9Selenium (Se) 4 2587.4** 2552.8** 39.2** 45.7**H × Se 8 329.6** 258.3** 3.9** 4.9**Error II 24 15.7 50.6 0.5 1.3
** = Significant (p ≤ 0.01)
B. Comparison of treatments’ means
TreatmentsSOD
(Unit per mg protein)POD
(Unit per mg protein)2015-16 2016-17 2015-16 2016-17
No heat stress (H0)Control/ water spray (Se0) 128.3 c 125.0 c 30.7 d 29.0 d25 mg L-1 selenium (Se25) 131.7 c 126.7 c 30.9 cd 29.2 cd50 mg L-1 selenium (Se50) 161.7 b 156.7 b 32.9 b 31.0 ab75 mg L-1 selenium (Se75) 191.7 a 180.0 a 34.9 a 33.2 a100 mg L-1 selenium (Se100) 170.0 b 165.0 ab 32.6 bc 30.9 abHeat from spike to grain filling (H1)Control/ water spray (Se0) 50.8 d 51.2 c 14.6 d 11.3 c25 mg L-1 selenium (Se25) 65.2 c 60.2 bc 14.8 cd 11.5 c50 mg L-1 selenium (Se50) 74.2 bc 69.2 b 16.5 c 13.2 bc75 mg L-1 selenium (Se75) 79.6 b 74.6 b 18.8 b 15.4 b100 mg L-1 selenium (Se100) 89.7 a 94.7 a 21.0 a 18.4 aHeat from flowering to grain filling (H2)Control/ water spray (Se0) 95.7 d 94.0 c 19.3 b 16.0 c25 mg L-1 selenium (Se25) 100.4 cd 92.1 c 19.7 b 16.3 c50 mg L-1 selenium (Se50) 108.3 bc 103.3 bc 20.3 b 16.9 bc75 mg L-1 selenium (Se75) 114.8 b 111.5 ab 22.9 a 19.9 a100 mg L-1 selenium (Se100) 126.8 a 123.5 a 24.5 a 21.9 aTukey’s HSD (p ≤ 0.05) 9.52 17.08 1.70 2.74Year mean 112.6 108.5 23.6 20.9Tukey’s HSD (p ≤ 0.05) NS NS
Any two means not sharing a letter in common within a column differ significantly at p ≤ 0.05; NS = Non-
significant
148

Figure 4.3.8: Regression analysis for effect of foliar applied selenium on superoxide dismutase and peroxidase contents of heat stressed wheat
H0 = No heat stress; H1 = Heat from spike to grain filling; H2 = Heat from flowering to grain filling
149

Table 4.3.9: Effect of foliar applied selenium on catalase (CAT) and total phenolic contents (TPC) of heat stressed wheat
A. Mean sum of square
Source of variation
DFCatalase Total phenolics
2015-16 2016-17 2015-16 2016-17Blocks 2 66.62 327.10 25.92 187.82Heat (H) 2 1255.42** 1395.74** 436.81** 505.44**Error I 4 10.04 8.29 1.61 9.09Selenium (Se) 4 228.14** 270.05** 60.53** 54.36**H × Se 8 59.80** 55.03** 4.28** 7.25**Error II 24 1.91 3.36 0.58 0.94
** = Significant (p ≤ 0.01)
B. Comparison of treatments’ means
TreatmentsCAT (Unit per mg protein) TPC (mg GAE g-1)
2015-16 2016-17 2015-16 2016-17No heat stress (H0)Control/ water spray (Se0) 31.3 d 29.6 c 23.9 d 21.6 c25 mg L-1 selenium (Se25) 31.7 d 30.0 c 24.2 d 21.9 c50 mg L-1 selenium (Se50) 38.0 c 36.3 b 27.6 c 25.3 b75 mg L-1 selenium (Se75) 52.6 a 51.2 a 32.0 a 29.7 a100 mg L-1 selenium (Se100) 49.3 b 47.6 a 30.0 b 28.7 aHeat from spike to grain filling (H1)Control/ water spray (Se0) 20.9 c 18.2 c 14.8 d 11.5 c25 mg L-1 selenium (Se25) 21.1 c 18.3 c 15.2 cd 11.8 c50 mg L-1 selenium (Se50) 23.3 bc 19.6 bc 16.4 c 13.1 bc75 mg L-1 selenium (Se75) 24.6 b 22.9 ab 18.2 b 15.1 b100 mg L-1 selenium (Se100) 28.9 a 27.2 a 20.7 a 17.9 aHeat from flowering to grain filling (H2)Control/ water spray (Se0) 23.9 b 20.9 b 17.8 d 17.0 b25 mg L-1 selenium (Se25) 23.9 b 21.1 b 18.4 cd 17.9 b50 mg L-1 selenium (Se50) 25.3 b 21.9 b 20.0 bc 18.3 b75 mg L-1 selenium (Se75) 26.6 b 23.8 b 21.1 b 18.3 b100 mg L-1 selenium (Se100) 30.2 a 29.2 a 23.1 a 20.7 aTukey’s HSD (p ≤ 0.05) 3.32 4.40 1.83 2.33Year mean 30.1 27.9 21.6 19.2Tukey’s HSD (p ≤ 0.05) NS NS
Any two means not sharing a letter in common within a column differ significantly at p ≤ 0.05; NS = Non-
significant
150

Figure 4.3.9: Regression analysis for effect of foliar applied selenium on catalase and total phenolic contents of heat stressed wheat
H0 = No heat stress; H1 = Heat from spike to grain filling; H2 = Heat from flowering to grain filling
151

Escalated senescence under heat ultimately reduced carbohydrates availability for
reproductive parts (Mathur et al., 2014). While, heat stress decreased the soluble
carbohydrates by 10-25% in varying wheat genotypes depending on heat tolerance
(Talukder et al., 2014).
Likewise, decrease of antioxidants, chlorophyll contents and TPC under heat can
also be attributed to aggravated lipid peroxidation. So, strong negative and remarkable
association of antioxidants, chlorophyll contents and TPC with malondialdehyde was
recorded under varying temperatures over the years (Table 4.3.14-4.3.16). It further
confirmed the adverse impacts of lipid peroxidation of antioxidants activities and TPC.
Plethora of ROS outcompeted the biosynthesis of antioxidants and disrupted the
membrane stability (Ashraf and Harris, 2013). Hydroxyl radical depicted the most
detrimental effects regarding the lipid peroxidation. While, singlet oxygen and superoxide
radicals exhibited relatively more damaging effects for chlorophyll degradation in wheat
under heat (Iqbal et al., 2017).
Impairment in biosynthesis of osmo-protectants under heat might be another
reason for inhibition of enzymatic activities and degradation of chlorophyll under heat.
Heat stress might have reduced the accumulation of proline, glycine betaine and soluble
proteins. Consequently, proline modulated detoxification of 1O2* was decreased and thus
it initiated cascade of reactions to synthesize ROS. Ultimately, chlorophyll contents and
carbohydrates partitioning towards grains was also reduced. Reduced biosynthesis of
proline also results in excessive synthesis of OH●-, which ultimately enhances the lipid
peroxidation of bio-membranes. Additionally, reduced accumulation of proline, glycine
betaine and soluble proteins depressed osmotic, water and turgor potential, which further
enhanced the sensitivity of cells for lipid peroxidation. Moreover, strong positive and
remarkable association of chlorophyll a and b contents with osmo-protectants was
recorded under ‘no heat stress’ (Table 4.3.14 a, d), ‘heat from spike to grain filling’
(Table 4.3.15 a, c) and ‘heat from flowering to grain filling’ (Table 4.3.16 a, c) during
2015-16 and 2-16-17. Likewise, strong positive and remarkable association of
antioxidants with osmo-protectants was observed under varying temperatures over the
years (Table 4.3.14-4.3.16 b, d). Thus, it was confirmed that enzyme activities were
diminished due to lesser accumulation of osmo-protectants. Excessive generation of ROS
decreased the activities of antioxidants, biosynthesis of proline, glycine betaine and
adversely affected chlorophyll fluorescence (Hemantaranjan et al., 2014). Imposition of
152

heat stress enhanced the synthesis of ROS, which ultimately depressed the water relations
(Kamal et al., 2017).
Selenium modulated improvements in chlorophyll contents, antioxidants and
phenolics, which can be ascribed to role of selenium in scavenging of ROS. Availability
of selenium might have escalated the spontaneous dismuatation (non-enzymatic) of 1O2●-
to H2O2. Together with non-enzymatic dismutation of 1O2●-, selenium improved activities
of SOD as well. Both enzymatic and non-enzymatic dismutation might have acted in
conjunction with each other to detoxify 1O2●-. Ultimately, SOD activities were not
restricted because of substrate (1O2●-) saturation. Afterwards, H2O2 might have enhanced
substrate availability for catalase and peroxidase. Concurrently, selenium might have
enhanced the activities of glutathione peroxidase, guaiacol peroxidase, ascorbate
peroxidase and catalase. Therefore, selenium modulated improvements in peroxidase and
catalase enzymes might have alleviated the saturation of substrate for POD and CAT.
Hence, boost in activities under selenium might have triggered the detoxification of H2O2
to H2O and oxygen and thus alleviated oxidative stress. Whereas, strong positive and
significant association of SOD, POD, CAT and TPC with each other was recorded under
‘no heat stress’ (Table 4.3.14 b, d), ‘heat from spike to grain filling’ (Table 4.3.15 b, d)
and ‘heat from flowering to grain filling’ (Table 4.3.16 b, d) over the years. It established
the enhancement in activities of POD, CAT and TPC with the enhancing SOD activities.
Exogenous application of selenium under the stress conditions improved antioxidant
defense mechanism, alleviated oxidative stress and improved yield components of wheat
under stress environment (Nawaz et al., 2015). Application of selenium under abiotic
stresses improved the detoxification of 1O2●- and H2O2 and ultimately enhanced membrane
integrity (Ahmad et al., 2016).
Selenium mediated improvements in biosynthesis of antioxidants and chlorophyll
might also be consequence seleno-methionine and seleno-cysteine synthesis. Availability
of selenium might have replaced the sulfur in sulpho-hydral groups of glutathione
reductase (GSH). Replacement of sulpho-hydral groups in fatty acids might have caused
the biosynthesis of seleno-methionine and seleno-cysteine (the heat stable amino acids).
Afterwards, GSH containing seleno-methionine and seleno-cysteine might have promoted
the quenching of H2O2. Hence, restrictions of substrate saturation of POD and CAT were
alleviated and thus relatively lesser H2O2 under selenium triggered the activities of POD
and CAT. Furthermore, strong positive and significant correlation of SOD with POD and
CAT established the rapid detoxification of H2O2 under selenium availability (Table
153
4.3.14-4.3.16 b, d). Application of selenium enhanced the stability of sulpho-hydral group
containing antioxidants such as glutathione reductase and glutathione s-transferase by
enhancing the synthesis of heat stable seleno-methionine and seleno-cysteine (Malik et
al., 2012). Application of selenium stabilized sulpho-hydral groups of fatty acids by
improving the detoxification of ROS through boost of antioxidants (Mroczek-Zdyrska
and Wójcik, 2011).
Detoxification of ROS, amplification of antioxidants and chlorophyll contents can
be attributed to selenium role in sustenance of reducing powers under heat. So, Feng et al.
(2013) concluded that application of selenium enhanced the availability of reductants for
antioxidants and improved output of photosynthesis.
Improvement in antioxidant activities under selenium availability can also be
consequence of decreased lipid peroxidation. Selenium availability might have replaced
thiol groups with the heat stable amino acids and thus conferred tolerance against heat.
Moreover, strong negative and significant association of antioxidants with
malondialdehyde confirmed lipid peroxidation caused damages for antioxidants activities
(Table 4.3.14-4.3.16 b, d). Application of selenium reorganized bio-membranes, regulated
unsaturation and galactolipids accumulation and ultimately enhanced membrane integrity
(Winkel et al., 2015). While, decrease of antioxidants and TPC with 100 mg L-1 foliar
selenium under no heat stress can be result of imbalance in selenium mediated ROS
quenching and synthesis of NADPH. Lesser ROS under normal conditions might inhibit
the assimilation of selenium as seleno-methionine and seleno-cysteine. Excessive free
selenium under ‘no heat stress’ might have caused outburst of ROS, which decreases
antioxidants with 100 mg L-1 foliar selenium. Excessive application of selenium under
ambient conditions caused an imbalance between thiols groups of chloroplast thylakoid,
NADPH synthesis and assimilation of selenium and enhanced ROS synthesis (Mroczek-
Zdyrska and Wójcik, 2011).
4.3.5. Osmo-protectants and lipid peroxidation
(a) Results
Imposition of heat stress either from ‘spike to grain filling’ or ‘flowering to grain
filling’ significantly decreased the biosynthesis of osmo-protectants (proline, glycine
betaine and soluble proteins) while enhanced lipid peroxidation compared to ‘no heat
stress’. Imposition of ‘heat from spike to grain filling’ proved more damaging than ‘heat
from flowering to grain filling’ for biosynthesis of osmo-protectants and lipid
peroxidation. While, exogenous selenium modulated improvements were significant and
154

varying responses were observed with different concentrations of selenium under
different high temperature environments. Hence interaction of heat stress and foliar
selenium differed significantly for biosynthesis of osmo-protectants and malondialdehyde
contents.
Statistically similar and comparatively more proline and glycine betaine were
quantified with 75 and 100 mg L-1 exogenous selenium under ‘no heat stress’ over the
years. Whereas, significantly more proline was observed with 100 mg L -1 foliar selenium
compared to other concentrations under ‘heat from spike to grain filling’ and ‘heat from
flowering to grain filling’ over the two years of study. Likewise, significantly more
glycine betaine content was recorded with 100 mg L-1 compared to other concentrations
of foliar selenium under both heat stress treatments. However, some inconsistencies were
recorded over the years where 75 and 100 mg L-1 selenium produced statistically similar
glycine betaine under heat induced conditions. Statistically similar and relatively more
total soluble proteins and statistically alike and lesser malondialdehyde contents were
observed with 75 and 100 mg L-1 exogenous selenium under ‘no heat stress’ over the
years. While some discrepancies were recorded in soluble proteins under ambient
conditions in 2015-16 where 100 mg L-1 selenium synthesized significantly more soluble
proteins compared to other concentrations. Whereas, significantly more total soluble
proteins and significantly lesser malondialdehyde contents were recorded with 100 mg L -1
foliar selenium compared to other selenium concentrations under both heat stress
treatments over the years. Moreover, relatively higher malondialdehyde contents were
recorded for water spray under all three treatments of heat stress (Table 4.3.10 and Table
4.3.11).
Moreover, each 25 mg L-1 application of foliar selenium enhanced proline
synthesis by 0.009, 0.009 and 0.008 µmol g-1 under ‘no heat stress’, ‘heat from spike to
grain filling’ and ‘heat from flowering to grain filling’ respectively over the years. While,
each unit of foliar selenium modulated enhancements in glycine betaine was 0.59 µmol g -
1 under ‘no heat stress’, 0.42-0.49 µmol g-1 under ‘heat from spike to grain filling’ and
0.39-0.41 µmol g-1 under ‘heat from flowering to grain filling’ over the years. Similarly,
each 25 mg L-1 foliar selenium triggered enhancement in total soluble proteins was
0.0012-0.0013 mg g-1 under ‘no heat stress’, 0.0011-0.0015 mg g-1 under ‘heat from spike
to grain filling’ and 0.0012-0.0013 mg g-1 under ‘heat from flowering to grain filling’
over the years. Likewise, each unit application of selenium decreased the
malondialdehyde by 0.0016-0.0017, 0.004-0.006 and 0.003-0.005 µmol g-1 under ‘no heat
155

stress’, ‘heat from spike to grain filling’ and ‘heat from flowering to grain filling’ over the
years. Moreover, improvements in glycine betaine, soluble proteins and decrease in
malondialdehyde contents were more dependent on foliar selenium under the stress
environment compared to ambient conditions over the years. While, dependence of
proline on selenium was reduced slightly under ‘heat from flowering to grain filling’
compared to ‘no heat stress’ over the temporal variations. However, importance of
exogenous selenium for proline improvements was more under ‘heat from spike to grain
filling’ compared to ‘no heat stress’ over the years (Figure 4.3.10 and Figure 4.3.11).
(b) Discussion
Downregulation in biosynthesis of proline, glycine betaine and soluble proteins
under heat stress can be attributed to accelerated senescence under heat. Heat stress
triggered the enzymes that accelerate degradation of chlorophyll while inhibited the
chlorophyll synthesizing enzymes. Therefore, utilization of sunlight in photosynthesis
was decreased because of lesser chlorophyll contents. Henceforth, carbohydrates
availability for synthesis of carbon skeleton of amino acids (proline and glycine betaine)
and soluble proteins might have decreased. Hence, accumulation of osmo-protectants
under stress environment was lesser compared to ambient conditions. Whereas, lesser
grains per spike and 1000-grain weight under heat compared to control confirmed the
decreased availability of assimilates for synthesis of osmo-protectants. Likewise, decrease
of green leaf area and grain filling duration under heat also caused accelerated senescence
and thus reduced carbon chain availability for synthesis of amino acids and proteins.
Moreover, strong positive and remarkable association of osmo-protectants with
chlorophyll a and b contents was recorded under varying temperatures over the years
(Table 4.3.14-4.316 a, c). High temperature stress inhibited the activities of antioxidants,
impaired the biosynthesis of osmo-protectants and osmolytes (Wang et al., 2014). High
temperature mediated boost in activities of chlorophyllide oxidoreductase escalated the
breakdown of chlorophyll. While, lesser activities of aminolaevulinic acid dehydratase
decreased the biosynthesis of chlorophyll under heat stress which reduced the synthesis of
carbohydrates (Hemantaranjan et al., 2014).
Decrease of osmo-protectants under high temperature stress can also be explained
in terms of impairment in activities of antioxidants and phenolics. Excessive heat caused
instability in energy absorption and electron transfer in electron transport chain might
have slowed down than the generation of free electrons at the reaction center from
photolysis of water. Hence, disruption of balance might have enhanced the availability of
156
free electrons which ultimately excited chlorophyll and led to synthesize 1O2*. Besides,
free electrons might have reacted with environmental oxygen at reaction center of
photosystem-II (PS-II) and generated 1O2●-.
Table 4.3.10: Effect of foliar applied selenium on leaf proline and glycine betaine contents of heat stressed wheat
A. Mean sum of square
Source of variation
DFProline Glycine betaine
2015-16 2016-17 2015-16 2016-17Blocks 2 2.941 0.337 1706.3 2200.5Heat (H) 2 15.298* 15.545** 31360.6** 40494.2**Error I 4 1.377 0.039 138.1 92.9Selenium (Se) 4 1.192** 1.105** 3640.5** 3144.9**H × Se 8 0.093** 0.082** 229.2* 355.2**Error II 24 0.017 0.016 70.7 69.6
* = Significant (p ≤ 0.05); ** = Significant (p ≤ 0.01)
B. Comparison of treatments’ means
TreatmentsProline (µmol g-1) Glycine betaine (µmol g-1)
2015-16 2016-17 2015-16 2016-17No heat stress (H0)Control/ water spray (Se0) 4.25 c 3.92 c 221.7 c 215.0 c25 mg L-1 selenium (Se25) 4.30 c 3.97 c 225.0 bc 218.0 bc50 mg L-1 selenium (Se50) 4.70 b 4.37 b 245.0 b 239.0 b75 mg L-1 selenium (Se75) 5.17 a 4.83 a 283.3 a 276.7 a100 mg L-1 selenium (Se100) 4.90 ab 4.57 ab 266.7 a 260.0 aHeat from spike to grain filling (H1)Control/ water spray (Se0) 2.40 c 2.07 c 130.7 c 122.7 b25 mg L-1 selenium (Se25) 2.47 c 2.13 c 148.3 bc 130.0 b50 mg L-1 selenium (Se50) 2.63 bc 2.30 bc 163.0 a 135.0 b75 mg L-1 selenium (Se75) 2.87 b 2.53 b 169.3 a 142.7 b100 mg L-1 selenium (Se100) 3.37 a 2.94 a 181.7 a 168.3 aHeat from flowering to grain filling (H2)Control/ water spray (Se0) 2.97 c 2.64 c 169.3 d 158.0 b25 mg L-1 selenium (Se25) 2.80 c 2.47 c 175.0 cd 163.3 b50 mg L-1 selenium (Se50) 2.90 c 2.57 c 189.7 bc 170.0 b75 mg L-1 selenium (Se75) 3.35 b 3.02 b 197.0 ab 176.3 b100 mg L-1 selenium (Se100) 3.75 a 3.38 a 210.0 a 200.0 aTukey’s HSD (p ≤ 0.05) 0.313 0.303 20.19 20.04Year mean 3.52 3.18 198.4 185.0Tukey’s HSD (p ≤ 0.05) NS NS
157

Any two means not sharing a letter in common within a column differ significantly at p ≤ 0.05; NS = Non-
significant
Figure 4.3.10: Regression analysis for effect of foliar applied selenium on leaf proline and glycine betaine contents of heat stressed wheat
H0 = No heat stress; H1 = Heat from spike to grain filling; H2 = Heat from flowering to grain filling
158

Table 4.3.11: Effect of foliar applied selenium on total soluble proteins (TSP) and malondialdehyde (MDA) contents of heat stressed wheat
A. Mean sum of square
Source of variation
DFTotal soluble proteins Malondialdehyde
2015-16 2016-17 2015-16 2016-17Blocks 2 0.0135 0.0128 0.0291 0.0402Heat (H) 2 0.5663** 0.6820** 0.6879** 1.6207**Error I 4 0.0005 0.0017 0.0067 0.0024Selenium (Se) 4 0.0267** 0.0201** 0.1048** 0.2658**H × Se 8 0.0024** 0.0012* 0.0107** 0.0312**Error II 24 0.0004 0.0005 0.0023 0.0015
* = Significant (p ≤ 0.05); ** = Significant (p ≤ 0.01)
B. Comparison of treatments’ means
TreatmentsTSP (mg g-1) MDA (µmol g-1)
2015-16 2016-17 2015-16 2016-17No heat stress (H0)Control/ water spray (Se0) 0.75 d 0.70 c 0.70 a 0.86 a25 mg L-1 selenium (Se25) 0.79 cd 0.76 b 0.66 ab 0.81 ab50 mg L-1 selenium (Se50) 0.80 c 0.79 ab 0.61 abc 0.76 b75 mg L-1 selenium (Se75) 0.90 a 0.84 a 0.53 c 0.65 bc100 mg L-1 selenium (Se100) 0.85 b 0.81 ab 0.57 bc 0.73 cHeat from spike to grain filling (H1)Control/ water spray (Se0) 0.37 d 0.34 c 1.27 a 1.71 a25 mg L-1 selenium (Se25) 0.41 cd 0.38 bc 1.08 b 1.55 b50 mg L-1 selenium (Se50) 0.45 bc 0.40 b 0.99 b 1.46 b75 mg L-1 selenium (Se75) 0.46 b 0.41 b 0.97 b 1.26 c100 mg L-1 selenium (Se100) 0.53 a 0.47 a 0.83 c 1.07 dHeat from flowering to grain filling (H2)Control/ water spray (Se0) 0.49 c 0.37 c 1.05 a 1.46 a25 mg L-1 selenium (Se25) 0.51 bc 0.40 bc 0.96 ab 1.31 b50 mg L-1 selenium (Se50) 0.53 bc 0.42 bc 0.91 b 1.14 c75 mg L-1 selenium (Se75) 0.55 b 0.44 b 0.90 b 1.01 d100 mg L-1 selenium (Se100) 0.63 a 0.50 a 0.76 c 0.99 dTukey’s HSD (p ≤ 0.05) 0.046 0.051 0.115 0.093Year mean 0.60 0.53 0.86 B 1.12 ATukey’s HSD (p ≤ 0.05) NS 0.116
Any two means not sharing a letter in common within a column differ significantly at p ≤ 0.05; NS = Non-
significant
159
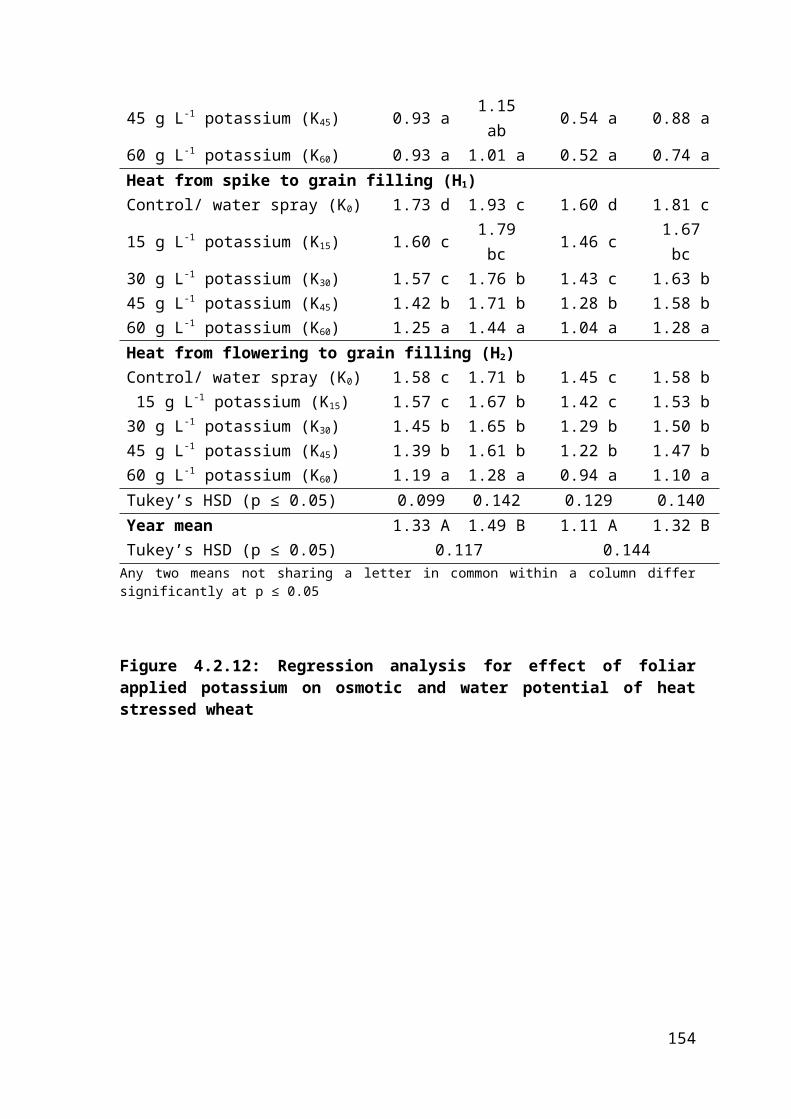
Figure 4.3.11: Regression analysis for effect of foliar applied selenium on total soluble proteins and malondialdehyde contents of heat stressed wheat
H0 = No heat stress; H1 = Heat from spike to grain filling; H2 = Heat from flowering to grain filling
160

Both 1O2* and 1O2
●- might have triggered degradation of chlorophyll, outcompeted
antioxidants and reacted with unsaturated fatty acids of membranes to synthesize OH●-.
Moreover, impairment in electron transfer in electron transport chain might have
decreased reduction of NADP to NADPH at ferredoxin of photosystem-I (PS-I). It might
have decreased the NAPDH and thereby restricted carbon dioxide fixation in
photosynthesis together with the generation of 1O2●- at the ferredoxin of photosystem-I.
All these cascades of reactions might have enhanced the synthesis of ROS and decreased
antioxidant activities by saturation of substrates. Consequently, membrane integrity was
decreased which aggravated the leakage of solutes and thus decreased osmo-protectants.
While, excessive ROS induced damages to chlorophyll might have reduced carbon chain
availability for amino acid synthesis concurrently. Furthermore, strong positive and
significant association of osmo-protectants with SOD, POD, CAT and TPC was recorded
under varying temperatures over the years. It established the relationship of osmo-
protectants with antioxidant enzymes (Table 4.3.14-4.3.16 b, d). Excessive synthesis of
ROS from chloroplast under heat stress decreased the reduction of carbon in
photosynthesis, depressed SOD, POD, CAT and phenolics and enhanced membrane
leakage (Mathur et al., 2014). Likewise, high light intensity and heat stress destabilized
photosystem-II, aggravated lipid peroxidation and impaired the activities of antioxidants
in wheat crop (Chen et al., 2017).
Foliar applied selenium might have enhanced efficacy of light reactions under
heat and thus improved chlorophyll contents also. Moreover, strong positive and
remarkable association of osmo-protectants with chlorophyll a and b contents was
recorded under varying temperature environments over the two years (Table 4.3.14-4.3.16
a, c). Application of selenium improved chlorophyll contents, enhanced energy
absorption by light harvesting complex, increased the energy of excitation, electron
transfer and eventually output quantum of light reaction in three wheat genotypes under
the stressed conditions. Moreover, application of higher concentrations of selenium under
ambient conditions often caused disruptions in photosynthetic machinery (Labanowska et
al., 2012). Exogenous application of selenium delayed the senescence, improved
antioxidant activities and ultimately increased biomass accumulation (Cheng et al., 2016).
Exogenous selenium modulated improvements in membrane stability might be
another reason for enhancement of osmo-protectants. Availability of selenium might have
activated transport proteins at bio-membranes that channelized various solutes across the
membranes under stress conditions. Moreover, selenium mediated biosynthesis of osmo-
161

protectants might have encapsulated thiol groups and points of unsaturation along the
carbon chain of fatty acids. Thus, selenium might have shielded the fatty acids from the
attack of OH●- and subsequent cascade of reactions of ROS generation. Besides, selenium
availability under heat stress might have regulated the degree of unsaturation in
galactolipids constituting ground structure of membranes of plastids and thereby
conferred heat tolerance. Moreover, strong negative and pronouncing association of
osmo-protectants with malondialdehyde under varying temperatures established the role
of osmo-protectants in the integration of bio-membranes (Table 4.3.14-4.3.16 b, d).
Availability of selenium enhanced the biosynthesis of antioxidants, osmo-protectants and
regulated solute transport across membranes under stress conditions (Kaur et al., 2014).
Exogenous application of selenium improved soluble sugars and free amino acids which
ultimately enhanced the water of wheat crop under stress conditions (Nawaz et al., 2015).
Selenium role in improvement of osmo-protectants and membrane integrity can
also be elucidated in terms of improved antioxidant defensive mechanism under heat.
Application of selenium might have enhanced non-enzymatic dismutation of 1O2●- to H2O2
and thus alleviated 1O2●- mediated substrate saturation of SOD. Subsequently,
comparatively lesser concentration of 1O2●- boosted the activities of SOD. Therefore, H2O2
concentration might have improved due to SOD mediated and non-enzymatic
dismutation. While increased availability of reductants enhanced the activities of DHAR,
MDHAR, CAT, ascorbate peroxidase and glutathione peroxidase which ultimately
detoxified ROS. Hence, oxidative stress was alleviated under selenium availability.
Alleviation of oxidative stress increased membrane stability and water relations of wheat
under stress. While, strong positive and remarkable association of antioxidants and
phenolics with osmo-protectants under varying conditions of temperature over the years
further accomplished the role of antioxidants in synthesis of osmo-protectants (Table
4.3.14 b, d; Table 4.3.15 b, d and Table 4.3.16 b, d). Foliar application of selenium
improved synthesis of osmo-protectants, uptake of osmolytes, chlorophyll contents and
antioxidant activities under stressed environment (Hajiboland et al., 2015). Likewise,
application of selenium enhanced the accumulation of osmolytes, photosynthetic
pigments and antioxidant defense system under the stress conditions (Abd-Allah et al.,
2016).
4.3.6. Water relations and quality attributes
(a) Results
162
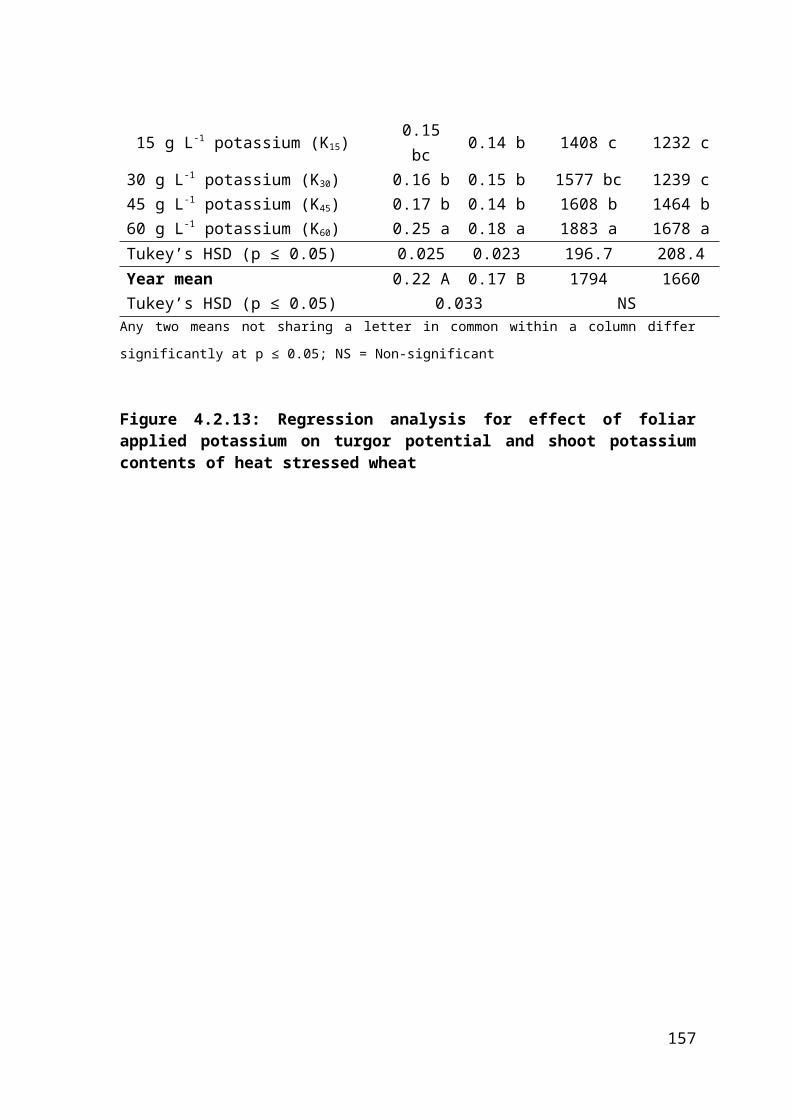
Imposition of heat stress from ‘spike to grain filling’ and ‘flowering to grain
filling’ significantly depressed the water relations and degraded grain crude protein
contents compared to ‘no heat stress’. While, more deleterious impacts for these
parameters were recorded under ‘heat from spike to grain filling’ compared to ‘heat from
flowering to grain filling’ over the years. However, exogenous application of selenium
effectively alleviated the deleterious impacts and significantly enhanced the osmotic,
water and turgor potential and grain crude proteins. Varying responses of osmotic and
water potential were recorded with different foliar concentrations of selenium under ‘no
heat stress’, ‘heat from spike to grain filling’ and ‘heat from flowering to grain filling’.
Thus, significant interaction of heat and foliar selenium for osmotic and water potential
was recorded over the years.
Under ‘no heat stress’, selenium at 75 mg L-1 depicted more osmotic and water
potential compared to other. While, under ‘heat from spike to grain filling’ and ‘heat from
flowering to grain filling’, 100 mg Se L-1 performed best in this regard (Table 4.3.12).
Moreover, each 25 mg L-1 increment in foliar selenium enhanced the osmotic
potential by 0.0021-0.0025, 0.0030-0.0031 and 0.0018-0.0034 MPa under ‘no heat
stress’, ‘heat from spike to grain filling’ and ‘heat from flowering to grain filling’,
respectively over the years. Whereas, each unit of foliar selenium modulated
improvements in water potential were 0.0026-0.0030 MPa under ‘no heat stress’, 0.0038-
0.0039 MPa under ‘heat from spike to grain filling’, 0.0025-0.0042 MPa under ‘heat from
flowering to grain filling’ over the two years. While, importance of selenium for
improvement of osmotic and water potential was enhanced under stress conditions
compared to ‘no heat stress’ over the years (Figure 4.3.12).
Exogenous selenium modulated improvements in turgor potential and grain crude
proteins were similar under varying conditions of temperature over the years. Thus, a
non-significant ‘heat × selenium’ effect for these parameters was recorded over the years.
Significantly lesser turgor potential was observed under ‘heat from spike to grain filling’
compared to ‘heat from flowering to grain filling’ and ‘no heat stress’ over the years.
Whereas, statistically alike and significantly more degradation of grain crude proteins was
recorded under both heat imposed conditions compared to ambient conditions over the
years. While, significantly more turgor potential and grain crude proteins were recorded
under ‘no heat stress’ compared to heat treatments over the temporal variations. So,
turgor potential was decreased by 51-59% and 34-46% under ‘heat from spike to grain
filling’ and ‘heat from flowering to grain filling’ compared to ‘no heat stress’ over the
163
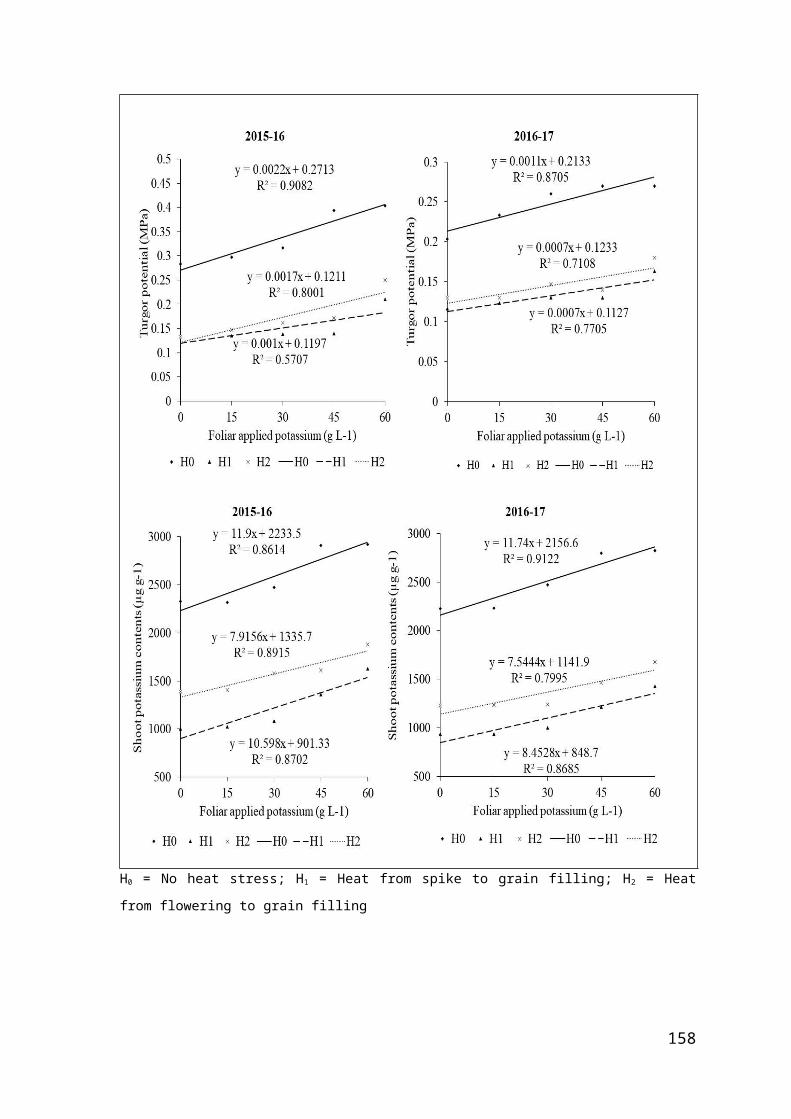
years. While, a decrease of 20-22% in grain crude proteins was recorded under ‘heat from
spike to grain filling’ and 18-20% under ‘heat from flowering to grain filling’ compared
to ‘no heat stress’ over the years.
Varying concentrations of foliar selenium depicted significant improvements in
turgor potential and grain crude protein contents. Relatively more and statistically alike
turgor potential and grain crude proteins were recorded with 50, 75 and 100 mg L -1
selenium during 2015-16 and 75 and 100 mg L-1 selenium during 2016-17 compared to
other treatments. While, statistically similar and relatively lesser turgor potential and
grain crude proteins were recorded with control/water spray and 25 mg L-1 exogenous
selenium over the years (Table 4.3.13).
Besides, each unit application of foliar selenium enhanced turgor potential by
0.0004-0.0005 MPa under ‘no heat stress’, 0.0008 MPa under ‘heat from spike to grain
filling’ and 0.0006-0.0008 MPa under ‘heat from flowering to grain filling’ over the
years. While, each 25 mg L-1 modulated enhancements in grain crude proteins were
0.008-0.015, 0.007-0.011 and 0.009-0.013% under ‘no heat stress’, ‘heat from spike to
grain filling’ and ‘heat from flowering to grain filling’, respectively over the years.
Moreover, selenium mediated improvements in turgor potential and grain crude proteins
under stress environments was more compared to ‘no heat stress’ over the years (Figure
4.3.13).
(b) Discussion
Therefore, availability of carbon chain for synthesis of solutes and osmo-
protectants might have decreased and water relations were also decreased as an adaptive
response to lesser solutes. Decrease in availability of sucrose under heat was also
accomplished from lesser grains per spike and 1000-grain weight under heat compared to
ambient conditions. Moreover, decrease of chlorophyll contents might have decreased the
availability of carbon chain for synthesis of amino acids and subsequent grain crude
proteins. While, strong positive and pronouncing association of chlorophyll a and b
contents with water relations and grain crude proteins was observed under varying
temperatures over the years (Table 4.3.14-4.3.16 a, c). Heat stress disrupted the light
reactions, aggravated chlorophyll degradation, membrane leakage and decreased the
synthesis of soluble sugars, proteins and proline. Lesser synthesis of osmo-protectants
depressed water relations and enhanced the membrane leakage (Szymańska et al., 2017).
Imposition of heat stress from spike initiation to grain filling initiation reduced the
164

synthesis of proline, glycine betaine, soluble proteins and grain yield (Shahid et al.,
2017).
Depression of water relations and degradation of grain crude proteins under heat
stress can also be elucidated in context of aggravated lipid peroxidation under heat. Heat
stress might have triggered the synthesis of 1O2●-, 1O2
*, H2O2 and OH●- and plethora of
ROS might have overcome the antioxidants activities and thus aggravated lipid
peroxidation.
Table 4.3.12: Effect of foliar applied selenium on osmotic (ΨS) and water potential (ΨW) of heat stressed wheat
A. Mean sum of square
Source of variation
DFOsmotic potential Water potential
2015-16 2016-17 2015-16 2016-17Blocks 2 0.0195 0.0641 0.2233 0.1706Heat (H) 2 1.5048** 1.8871** 2.7087** 3.3382**Error I 4 0.0022 0.0027 0.0191 0.0047Selenium (Se) 4 0.1272** 0.0793** 0.1921** 0.1269**H × Se 8 0.0050* 0.0047** 0.0068* 0.0061*Error II 24 0.0016 0.0013 0.0022 0.0018
* = Significant (p ≤ 0.05); ** = Significant (p ≤ 0.01)
B. Comparison of treatments’ means
TreatmentsΨS (-MPa) ΨW (-MPa)
2015-16 2016-17 2015-16 2016-17No heat stress (H0)Control/ water spray (Se0) 1.11 c 1.15 e 0.73 b 0.79 d25 mg L-1 selenium (Se25) 1.08 c 1.11 d 0.68 b 0.74 cd50 mg L-1 selenium (Se50) 0.96 b 1.03 c 0.53 a 0.64 bc75 mg L-1 selenium (Se75) 0.85 a 0.92 a 0.42 a 0.51 a100 mg L-1 selenium (Se100) 0.91 ab 0.98 b 0.49 a 0.58 abHeat from spike to grain filling (H1)Control/ water spray (Se0) 1.73 d 1.81 e 1.58 d 1.69 d25 mg L-1 selenium (Se25) 1.67 cd 1.78 d 1.49 cd 1.63 cd50 mg L-1 selenium (Se50) 1.61 bc 1.73 c 1.40 bc 1.57 bc75 mg L-1 selenium (Se75) 1.53 b 1.58 b 1.31 b 1.40 a100 mg L-1 selenium (Se100) 1.41 a 1.53 a 1.18 a 1.33 aHeat from flowering to grain filling (H2)Control/ water spray (Se0) 1.61 d 1.70 e 1.38 c 1.51 c25 mg L-1 selenium (Se25) 1.52 cd 1.66 d 1.27 c 1.47 c50 mg L-1 selenium (Se50) 1.43 bc 1.61 c 1.15 b 1.41 bc
165

75 mg L-1 selenium (Se75) 1.38 b 1.58 b 1.09 b 1.35 ab100 mg L-1 selenium (Se100) 1.26 a 1.51 a 0.95 a 1.26 aTukey’s HSD (p ≤ 0.05) 0.096 0.021 0.113 0.102Year mean 1.34 1.44 1.04 1.19Tukey’s HSD (p ≤ 0.05) NS NS
Any two means not sharing a letter in common within a column differ significantly at p ≤ 0.05; NS = Non-
significant
Figure 4.3.12: Regression analysis for effect of foliar applied selenium on osmotic and water potential of heat stressed wheat
166

H0 = No heat stress; H1 = Heat from spike to grain filling; H2 = Heat from flowering to grain filling
Table 4.3.13: Effect of foliar applied selenium on turgor potential (ΨP) and grain crude protein contents of heat stressed wheat
A. Mean sum of square
Source of
variationDF
Turgor potential Grain crude proteins
2015-16 2016-17 2015-16 2016-17
Blocks 2 0.02393 0.01769 0.86 1.58
Heat (H) 2 0.17718** 0.20738** 32.84** 23.29**
Error I 4 0.00152 0.00063 0.70 0.92
Selenium (Se) 4 0.00712** 0.00560** 2.43** 1.00**
H × Se 8 0.00028NS 0.00031NS 0.09NS 0.02NS
Error II 24 0.00025 0.00034 0.50 0.11* = Significant (p ≤ 0.05); ** = Significant (p ≤ 0.01); NS = Non-significant
B. Comparison of treatments’ means
TreatmentsΨP (MPa) Grain crude proteins (%)
2015-16 2016-17 2015-16 2016-17
167

Heat stress (H)
No heat stress (H0) 0.41 A 0.39 A 12.23 A 11.46 A
Heat from spike to grain filling (H1) 0.20 C 0.16 C 9.54 B 9.19 B
Heat from flowering to grain filling (H2) 0.27 B 0.21 B 9.82 B 9.42 B
Tukey’s HSD (p ≤ 0.05) 0.051 0.033 0.985 1.250
Selenium foliar spray (Se)
Control/ water spray (Se0) 0.25 C 0.22 D 9.99 B 9.69 C
25 mg L-1 selenium (Se25) 0.28 B 0.24 CD 10.07 B 9.76 C
50 mg L-1 selenium (Se50) 0.31 A 0.25 BC 10.51 AB 9.92 BC
75 mg L-1 selenium (Se75) 0.31 A 0.27 AB 10.88 AB 10.32 AB
100 mg L-1 selenium (Se100) 0.32 A 0.28 A 11.20 A 10.43 A
Tukey’s HSD (p ≤ 0.05) 0.022 0.025 0.985 0.459
Year mean 0.29 0.25 10.53 10.02
Tukey’s HSD (p ≤ 0.05) NS NSAny two means not sharing a letter in common differ significantly at p ≤ 0.05; NS = Non-significant
Figure 4.3.13: Regression analysis for effect of foliar applied selenium on turgor potential and grain crude protein contents of heat stressed wheat
168

H0 = No heat stress; H1 = Heat from spike to grain filling; H2 = Heat from flowering to grain filling
Consequently, leakage of solutes from membrane might have enhanced and
thereby depressed osmotic, water and turgor potential. While, excessive ROS might have
also decreased the activities of enzymes involved in biosynthesis of grain crude proteins.
169

Furthermore, strong negative and conspicuous correlation of malondialdehyde with water
relations and grain proteins were observed under ‘no heat stress’ (Table 4.3.14 b, d), ‘heat
from spike to grain filling’ (Table 4.3.15 b, d) and ‘heat from flowering to grain filling’
(Table 4.3.16 b, d). It accomplished the negative impacts of lipid peroxidation on water
relations and grain quality of heat stressed wheat crop. High temperature stress enhanced
lipid peroxidation, disrupted photosystem-II, decreased the capability of membranes to
retain solutes and protein contents under high temperature stress conditions (Chen et al.,
2017). Post anthesis heat stress wheat inhibited the activities of sucrose
fructosyltransferase and fructan fructosyltransferase which declined carbo chain
availability for synthesis of amino acids (Wang et al., 2012). Lesser availability of
carbohydrates ultimately deteriorated grain quality (Rakszegi et al., 2014).
Improvement in water relations and grain proteins under foliar selenium might be
consequence of selenium-modulated improvement in biosynthesis of osmo-protectants.
Afterwards, osmo-protectants might have encapsulated ROS susceptible thiol groups and
unsaturated fatty acids along the carbon chain and thus imparted heat tolerance by
improving membrane stability. Osmo-protectants mediated alleviation of oxidative stress
might also have improved the partitioning of carbohydrates and amino acids to synthesize
grain proteins. While, solute retention inside cells might have enhanced osmotic, water
and turgor potential. Moreover, strong positive and remarkable association of water
relations and grain crude proteins with osmo-protectants under varying temperatures over
the years was recorded. It established the role of osmo-protectants in improving water
relations and grain crude protein contents (Table 4.3.14-4.3.16 b, d). Exogenous
application of selenium improved the synthesis of carbohydrates and dry matter
accumulation in wheat under drought stress conditions (Nawaz et al., 2014). Moreover,
foliar applied selenium improved membrane stability and thus conferred tolerance to heat
stressed wheat crop (Iqbal et al., 2015).
Another explanation is selenium-mediated improvement in grain filling rate.
Increased availability of carbohydrates for increased grain filling rate ultimately enhanced
the synthesis of amino acids which might have contributed for synthesis of amino acids
involved in membrane protection (proline and glycine betaine) and grain crude proteins.
While, strong positive and pronouncing association of grain filling rate with water
relations and grain proteins accomplished the role of accelerated grain filling rate to
improve water relations and quality of grain (Table 4.3.14-4.3.16 a, c). Availability of
170

selenium under heat stress enhanced the reductants output of light reactions which
enhanced carbon fixation ability under heat stress (Feng et al., 2013).
Likewise, selenium might have regulated the antioxidant activities by triggering
the enzymatic (SOD) and non-enzymatic dismutation of 1O2●-. While selenium might have
alleviated H2O2 mediated oxidative stress through enhancement of reductants that
ultimately boosted the recuing potential of CAT, POD, DHAR and MDHAR. Resultantly,
decrease of ROS produced suitable environment for chlorophyll to synthesize
carbohydrates and partition these for the synthesis of amino acids and soluble sugars.
While, amino acids thus contributed both towards osmotic adjustments as well as in grain
protein synthesis. Besides, strong positive and significant association of antioxidants and
phenolics with water relations and grain crude protein contents was recorded under
varying heat stress treatments over the years (Table 4.3.14-4.3.16 a, c). Application of
selenium improved the activities of antioxidants, alleviated oxidative stress, enhanced
membrane integrity and ultimately increased pollen fertility (Tedeschini et al., 2015).
Likewise, application of selenium decreased malondialdehyde contents and H2O2 while
boosted the activities of glutathione reductase and redox potential of POD under UV
stress (Mostafa and Hassan, 2015).
171
Table 4.3.14 (a): Correlation analyses showing strength of association among recorded attributes of wheat under no heat stress (H0) and foliar applied selenium during 2015-16
Parameters GPS TGW GY BY HI SY PH SL SPS GFR GFD Chl a Chl bTGW 0.94*GY 0.99** 0.93*BY 0.98** 0.90* 0.99**HI 0.99** 0.95* 0.99** 0.98**SY 0.92* 0.81NS 0.95* 0.98** 0.92*PH 0.70NS 0.79NS 0.75NS 0.77NS 0.71NS 0.79NS
SL 0.90* 0.91* 0.90* 0.88* 0.91* 0.80NS 0.85NS
SPS 0.87NS 0.79NS 0.92* 0.94* 0.88* 0.96* 0.90* 0.88*GFR 0.99** 0.93* 0.98** 0.96** 0.99** 0.88* 0.65NS 0.90* 0.84NS
GFD 0.98** 0.95* 0.98** 0.97** 0.99** 0.91* 0.79NS 0.96** 0.91* 0.98**Chl a 0.90* 0.80NS 0.94* 0.97** 0.90* 0.99** 0.83NS 0.81NS 0.98** 0.86NS 0.90*Chl b 0.99** 0.92* 0.99** 0.99** 0.99** 0.96* 0.78NS 0.91NS 0.94* 0.97** 0.99** 0.95*SOD 0.98** 0.93* 0.98** 0.97** 0.97** 0.91* 0.80NS 0.96** 0.93* 0.97** 0.99** 0.91* 0.99**POD 0.92* 0.92* 0.92* 0.90* 0.92* 0.82NS 0.85NS 0.99** 0.89* 0.92* 0.97** 0.84NS 0.93*CAT 0.95* 0.84NS 0.98** 0.99** 0.95* 0.99** 0.80NS 0.85NS 0.97** 0.92* 0.94* 0.99** 0.98**TPC 0.98** 0.90* 0.99** 0.99** 0.98** 0.96* 0.80NS 0.92* 0.95* 0.96** 0.99** 0.96* 0.99**LP 0.98** 0.92* 0.99** 0.98** 0.98** 0.94* 0.80NS 0.94* 0.94* 0.97** 0.99** 0.94* 0.99**GB 0.96** 0.89* 0.98** 0.99** 0.96** 0.97** 0.83NS 0.92* 0.97** 0.94* 0.98** 0.97** 0.97**TSP 0.93* 0.92* 0.95* 0.96** 0.93* 0.96* 0.90* 0.90* 0.96** 0.89* 0.95* 0.96** 0.96**
MDA - 0.99** - 0.96** - 0.99** - 0.99** - 0.85NS - 0.74NS - 0.80NS - 0.92* - 0.92* - 0.96** - 0.99** - 0.93* - 0.99**ΨS 0.99** 0.94* 0.99** 0.98** 0.99** 0.93* 0.76NS 0.93* 0.91* 0.99** 0.99** 0.92* 0.99**ΨW 0.99** 0.95* 0.99** 0.97** 0.99** 0.90* 0.74NS 0.93* 0.88* 0.99** 0.99** 0.89* 0.99**ΨP 0.92* 0.95* 0.89* 0.83NS 0.92* 0.70NS 0.54NS 0.85NS 0.95* 0.94* 0.90* 0.66NS 0.86NS
GCPC 0.96* 0.84NS 0.98** 0.99** 0.95* 0.99** 0.74NS 0.82NS 0.94* 0.94* 0.94* 0.98** 0.98*** = Significant (p ≤ 0.05); ** = Significant (p ≤ 0.01); NS = Non-significant (p ≤ 0.05); GPS = Grains per spike; TGW = 1000-grain weight; GY = Grain yield; BY = Biological yield; HI = Harvest index; SY = Straw yield; PH= Plant height; SL = Spike length; SPS = Spikelets per spike; GFR = Grain filling rate; GFD = Grain filling duration; Chl a = Chlorophyll a; Chl b = Chlorophyll b; SOD = Superoxide dismutase; POD = Peroxidase; CAT = Catalase; TPC = Total phenolic contents; LP = Leaf proline; GB = Glycine betaine; TSP = Total soluble proteins; MDA = Malondialdehyde; Ψ S = Osmotic potential; ΨW = Water potential; ΨP = Pressure potential; GCPC = Grain crude protein contentsn (number of pairs of observations) = 45
172

Table 4.3.14 (b): Correlation analyses showing strength of association among recorded attributes of wheat under no heat stress (H0) and foliar applied selenium during 2015-16
Parameters SOD POD CAT TPC LP GB TSP MDA ΨS ΨW ΨP
POD 0.97**CAT 0.95* 0.88*TPC 0.99** 0.94* 0.98**LP 0.99** 0.96** 0.97** 0.99**GB 0.98** 0.93* 0.99** 0.99** 0.99**TSP 0.95* 0.92* 0.96** 0.96** 0.96* 0.98**
MDA - 0.98** - 0.94* - 0.96** - 0.98** - 0.99** - 0.98** - 0.97**ΨS 0.99** 0.95* 0.96** 0.99** 0.99** 0.98** 0.95* - 0.99**ΨW 0.99** 0.95* 0.94* 0.98** 0.99** 0.97** 0.93* - 0.99** 0.99**ΨP 0.87NS 0.86NS 0.75NS 0.84NS 0.86NS 0.80NS 0.78NS - 0.89* 0.90* 0.93*
GCPC 0.94* 0.85NS 0.99** 0.98** 0.96** 0.98** 0.95* - 0.96** 0.96** 0.94* 0.77NS
* = Significant (p ≤ 0.05); ** = Significant (p ≤ 0.01); NS = Non-significant (p ≤ 0.05); SOD = Superoxide dismutase; POD = Peroxidase; CAT = Catalase; TPC = Total phenolic contents; LP = Leaf proline; GB = Glycine betaine; TSP = Total soluble proteins; MDA = Malondialdehyde; Ψ S = Osmotic potential; ΨW = Water potential; ΨP = Pressure potential; GCPC = Grain crude protein contentsn (number of pairs of observations) = 45
173
Table 4.3.14 (c): Correlation analyses showing strength of association among recorded attributes of wheat under no heat stress (H0) and foliar applied selenium during 2016-17
Parameters GPS TGW GY BY HI SY PH SL SPS GFR GFD Chl a Chl bTGW 0.98**GY 0.99** 0.96**BY 0.99** 0.97** 0.99**HI 0.99** 0.95* 0.99** 0.99**SY 0.83NS 0.91* 0.83NS 0.87NS 0.80NS
PH 0.92* 0.97** 0.93* 0.95* 0.91* 0.98**SL 0.92* 0.96** 0.92* 0.94* 0.90* 0.97** 0.99**
SPS 0.91* 0.89* 0.95* 0.96* 0.93* 0.87NS 0.93* 0.92*GFR 0.98** 0.98** 0.98** 0.99** 0.97** 0.88* 0.96* 0.93* 0.93*GFD 0.88* 0.83NS 0.92* 0.93* 0.91* 0.80NS 0.87NS 0.88* 0.98** 0.87NS
Chl a 0.87NS 0.80NS 0.92* 0.91* 0.91* 0.72NS 0.83NS 0.81NS 0.97** 0.88** 0.98**Chl b 0.98** 0.95* 0.99** 0.99** 0.99** 0.85NS 0.94* 0.93* 0.97** 0.97** 0.95* 0.93*SOD 0.98** 0.98** 0.99** 0.99** 0.98** 0.88* 0.96* 0.94* 0.93* 0.99** 0.88* 0.88* 0.98**POD 0.91* 0.96* 0.92* 0.95* 0.90* 0.97** 0.99** 0.98** 0.94* 0.96** 0.87NS 0.84NS 0.93*CAT 0.94* 0.89* 0.97** 0.96** 0.97** 0.79NS 0.89* 0.86NS 0.97** 0.95* 0.96* 0.98** 0.97**TPC 0.98** 0.93* 0.99** 0.99** 0.99** 0.80NS 0.90* 0.88* 0.95* 0.98** 0.93* 0.95* 0.99**LP 0.98** 0.97** 0.99** 0.99** 0.98** 0.88* 0.96** 0.94* 0.96** 0.99** 0.92* 0.92* 0.99**GB 0.96** 0.94* 0.99** 0.99** 0.95* 0.86NS 0.94* 0.92* 0.98** 0.98** 0.95* 0.95* 0.99**TSP 0.96** 0.95* 0.95* 0.95* 0.95* 0.84NS 0.91* 0.93* 0.88* 0.91* 0.88* 0.82NS 0.96*
MDA - 0.95* - 0.96** - 0.96** - 0.98** - 0.95* - 0.93* - 0.98** - 0.98** - 0.97** - 0.96* - 0.94* - 0.90* - 0.98**ΨS 0.99** 0.97** 0.99** 0.99** 0.99** 0.88* 0.96** 0.95* 0.96** 0.98** 0.93* 0.91* 0.99**ΨW 0.99** 0.97** 0.99** 0.99** 0.99** 0.88* 0.96** 0.95* 0.96** 0.98** 0.93* 0.91* 0.99**ΨP 0.99** 0.98** 0.99** 0.99** 0.99** 0.86NS 0.95* 0.88* 0.94* 0.98** 0.91* 0.89* 0.99**
GCPC 0.91* 0.84NS 0.95* 0.94* 0.95* 0.73NS 0.84NS 0.83NS 0.97** 0.90* 0.98** 0.99** 0.96*** = Significant (p ≤ 0.05); ** = Significant (p ≤ 0.01); NS = Non-significant (p ≤ 0.05); GPS = Grains per spike; TGW = 1000-grain weight; GY = Grain yield; BY = Biological yield; HI = Harvest index; SY = Straw yield; PH= Plant height; SL = Spike length; SPS = Spikelets per spike; GFR = Grain filling rate; GFD = Grain filling duration; Chl a = Chlorophyll a; Chl b = Chlorophyll b; SOD = Superoxide dismutase; POD = Peroxidase; CAT = Catalase; TPC = Total phenolic contents; LP = Leaf proline; GB = Glycine betaine; TSP = Total soluble proteins; MDA = Malondialdehyde; Ψ S = Osmotic potential; ΨW = Water potential; ΨP = Pressure potential; GCPC = Grain crude protein contentsn (number of pairs of observations) = 45
174
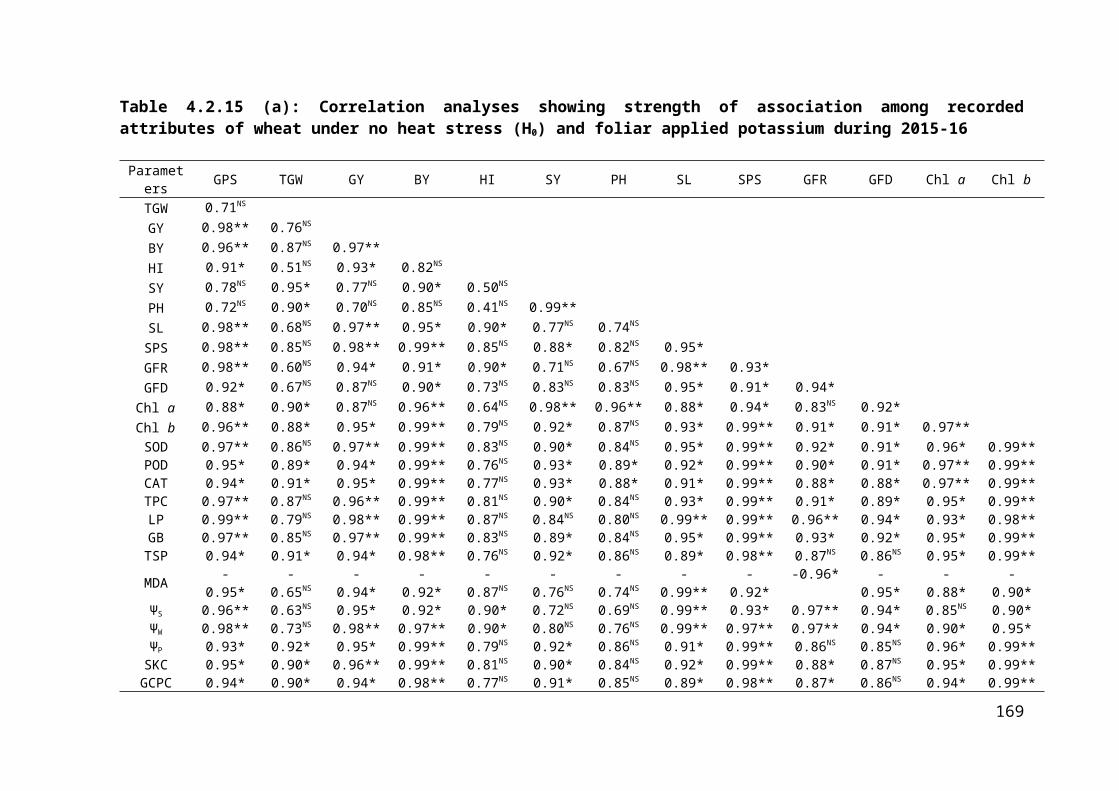
Table 4.3.14 (d): Correlation analyses showing strength of association among recorded attributes of wheat under no heat stress (H0) and foliar applied selenium during 2016-17
Parameters SOD POD CAT TPC LP GB TSP MDA ΨS ΨW ΨP
POD 0.96**CAT 0.95* 0.90*TPC 0.98** 0.91* 0.99**LP 0.99** 0.96** 0.97** 0.99**GB 0.98** 0.95* 0.99** 0.99** 0.99**TSP 0.92* 0.87NS 0.87NS 0.90* 0.92* 0.90*
MDA - 0.96** - 0.97** - 0.94* 0.90* - 0.97** - 0.97** - 0.95*ΨS 0.99** 0.95* 0.97** 0.98** 0.99** 0.99** 0.96* - 0.99**ΨW 0.99** 0.95* 0.96** 0.98** 0.99** 0.99** 0.96* - 0.99** 0.99**ΨP 0.99** 0.94* 0.95* 0.98** 0.99** 0.98* 0.97** - 0.98** 0.99** 1.00*
GCPC 0.90* 0.84NS 0.99** 0.97** 0.93* 0.96** 0.87NS - 0.92* 0.94* 0.94* 0.94** = Significant (p ≤ 0.05); ** = Significant (p ≤ 0.01); NS = Non-significant (p ≤ 0.05); SOD = Superoxide dismutase; POD = Peroxidase; CAT = Catalase; TPC = Total phenolic contents; LP = Leaf proline; GB = Glycine betaine; TSP = Total soluble proteins; MDA = Malondialdehyde; Ψ S = Osmotic potential; ΨW = Water potential; ΨP = Pressure potential; GCPC = Grain crude protein contentsn (number of pairs of observations) = 45
175

Table 4.3.15 (a): Correlation analyses showing strength of association among recorded attributes of wheat under heat from spike to grain filling (H1) and foliar applied selenium during 2015-16
Parameters GPS TGW GY BY HI SY PH SL SPS GFR GFD Chl a Chl bTGW 0.91*GY 0.91* 0.92*BY 0.94* 0.93* 0.99**HI 0.90* 0.95* 0.99** 0.99**SY 0.98** 0.94* 0.98** 0.99** 0.96**PH 0.86NS 0.98** 0.84NS 0.86NS 0.87NS 0.87NS
SL 0.93* 0.90* 0.79NS 0.82NS 0.78NS 0.86NS 0.88*SPS 0.85NS 0.97** 0.95* 0.94* 0.97** 0.91* 0.92* 0.81 NS
GFR 0.94* 0.95* 0.99** 0.99** 0.99** 0.98** 0.87 NS 0.85 NS 0.96*GFD 0.93* 0.99** 0.93* 0.94* 0.94* 0.95* 0.98** 0.89* 0.95* 0.94*Chl a 0.98** 0.94* 0.97** 0.98** 0.95* 0.99** 0.86 NS 0.91* 0.90* 0.99** 0.94*Chl b 0.98** 0.96** 0.92* 0.94* 0.92* 0.97** 0.94* 0.92* 0.90* 0.94* 0.98** 0.96**SOD 0.98** 0.90* 0.93* 0.95* 0.90* 0.96** 0.82 NS 0.92* 0.87 NS 0.97** 0.90* 0.99** 0.94*POD 0.89* 0.91* 0.99** 0.99** 0.98** 0.96** 0.82 NS 0.76 NS 0.95* 0.98** 0.98** 0.96* 0.90*CAT 0.88* 0.82NS 0.98** 0.96** 0.95* 0.938 0.70 NS 0.69 NS 0.87 NS 0.96* 0.82 NS 0.93* 0.83 NS
TPC 0.89* 0.88* 0.99** 0.98** 0.99** 0.95* 0.77 NS 0.74 NS 0.93* 0.98** 0.87 NS 0.95* 0.86 NS
LP 0.85NS 0.83NS 0.97** 0.96** 0.96* 0.92* 0.71 NS 0.70 NS 0.89* 0.96** 0.82 NS 0.92* 0.82 NS
GB 0.99** 0.91* 0.93* 0.95* 0.91* 0.97** 0.83 NS 0.92* 0.87 NS 0.97** 0.91* 0.99** 0.95*TSP 0.93* 0.84NS 0.95* 0.96** 0.93* 0.95* 0.73 NS 0.81 NS 0.86 NS 0.97** 0.84 NS 0.97** 0.86 NS
MDA 0.97** - 0.84NS - 0.89* - 0.92* - 0.86NS - 0.93* -0.75 NS -0.91* -0.81 NS -0.93* -0.85 NS -0.97** -0.90*ΨS 0.92* 0.90* 0.98** 0.98** 0.97** 0.96** 0.79 NS 0.81 NS 0.92* 0.99** 0.89* 0.98** 0.90*ΨW 0.95* 0.91* 0.98** 0.99** 0.97** 0.98** 0.82 NS 0.85 NS 0.92* 0.99** 0.91* 0.99** 0.92*ΨP 0.99** 0.92* 0.90* 0.93* 0.88* 0.96** 0.87 NS 0.95* 0.85 NS 0.94* 0.93* 0.98** 0.97**
GCPC 0.96** 0.90* 0.98** 0.99** 0.96** 0.99** 0.83 NS 0.82 NS 0.89* 0.97** 0.93* 0.98** 0.95* * = Significant (p ≤ 0.05); ** = Significant (p ≤ 0.01); NS = Non-significant (p ≤ 0.05); GPS = Grains per spike; TGW = 1000-grain weight; GY = Grain yield; BY = Biological yield; HI = Harvest index; SY = Straw yield; PH= Plant height; SL = Spike length; SPS = Spikelets per spike; GFR = Grain filling rate; GFD = Grain filling duration; Chl a = Chlorophyll a; Chl b = Chlorophyll b; SOD = Superoxide dismutase; POD = Peroxidase; CAT = Catalase; TPC = Total phenolic contents; LP = Leaf proline; GB = Glycine betaine; TSP = Total soluble proteins; MDA = Malondialdehyde; Ψ S = Osmotic potential; ΨW = Water potential; ΨP = Pressure potential; GCPC = Grain crude protein contentsn (number of pairs of observations) = 45
176

Table 4.3.15 (b): Correlation analyses showing strength of association among recorded attributes of wheat under heat from spike to grain filling (H1) and foliar applied selenium during 2015-16
Parameters SOD POD CAT TPC LP GB TSP MDA ΨS ΨW ΨP
POD 0.92*CAT 0.91* 0.98**TPC 0.92* 0.99** 0.99**LP 0.91* 0.98** 0.99** 0.99**GB 0.99** 0.92* 0.90* 0.92* 0.90*TSP 0.97** 0.96* 0.97** 0.97** 0.86 NS 0.97**
MDA -0.99** -0.89* -0.88* -0.89* -0.88* -0.99** -0.97**ΨS 0.96** 0.99** 0.98** 0.99** 0.98** 0.96** 0.99** -0.94*ΨW 0.98** 0.99** 0.96** 0.98** 0.97** 0.98** 0.99** -0.96** 0.99**ΨP 0.98** 0.88* 0.85 NS 0.87 NS 0.84 NS 0.99** 0.93* -0.97** 0.92* 0.95*
GCPC 0.95* 0.97** 0.95* 0.95* 0.94* 0.96** 0.96** -0.93* 0.97** 0.97** 0.95** = Significant (p ≤ 0.05); ** = Significant (p ≤ 0.01); NS = Non-significant (p ≤ 0.05); SOD = Superoxide dismutase; POD = Peroxidase; CAT = Catalase; TPC = Total phenolic contents; LP = Leaf proline; GB = Glycine betaine; TSP = Total soluble proteins; MDA = Malondialdehyde; Ψ S = Osmotic potential; ΨW = Water potential; ΨP = Pressure potential; GCPC = Grain crude protein contentsn (number of pairs of observations) = 45
177

Table 4.3.15 (c): Correlation analyses showing strength of association among recorded attributes of wheat under heat from spike to grain filling (H1) and foliar applied selenium during 2016-17
Parameters GPS TGW GY BY HI SY PH SL SPS GFR GFD Chl a Chl bTGW 0.97**GY 0.92* 0.94*BY 0.97** 0.98** 0.98**HI 0.86NS 0.89* 0.99** 0.94*SY 0.94* 0.92* 0.78NS 0.88* 0.68NS
PH 0.93* 0.97** 0.99** 0.98** 0.97** 0.81NS
SL 0.83NS 0.84NS 0.73NS 0.83NS 0.64NS 0.93* 0.74NS
SPS 0.64NS 0.73NS 0.88* 0.78NS 0.93* 0.41NS 0.86NS 0.39NS
GFR 0.89* 0.95** 0.88* 0.90* 0.85NS 0.81NS 0.94* 0.39NS 0.75NS
GFD 0.93* 0.96** 0.98** 0.97** 0.96** 0.80NS 0.99** 0.67NS 0.86NS 0.95*Chl a 0.98** 0.94* 0.95* 0.97** 0.91* 0.87NS 0.94* 0.76NS 0.71NS 0.85NS 0.94*Chl b 0.99** 0.98** 0.95* 0.99** 0.92* 0.90* 0.97** 0.79NS 0.73NS 0.91* 0.96** 0.99**SOD 0.92* 0.83NS 0.89* 0.90* 0.86NS 0.78NS 0.85NS 0.71NS 0.65NS 0.68NS 0.97** 0.96** 0.91*POD 0.88* 0.82NS 0.93* 0.90* 0.93* 0.69NS 0.89* 0.61NS 0.65NS 0.72NS 0.88* 0.95* 0.91*CAT 0.83NS 0.76NS 0.91* 0.86NS 0.92* 0.62NS 0.85NS 0.56NS 0.79NS 0.65NS 0.84NS 0.91* 0.91*TPC 0.87NS 0.81NS 0.93* 0.90* 0.93* 0.69NS 0.88* 0.62NS 0.79NS 0.70NS 0.87NS 0.95* 0.90*LP 0.87NS 0.80NS 0.91* 0.89* 0.91* 0.69NS 0.86NS 0.62NS 0.78NS 0.68NS 0.85NS 0.94* 0.90*GB 0.84NS 0.74NS 0.85NS 0.89* 0.84NS 0.68NS 0.97** 0.62NS 0.65NS 0.58NS 0.77NS 0.91* 0.85NS
TSP 0.93* 0.84NS 0.88* 0.84NS 0.84NS 0.82NS 0.84NS 0.76NS 0.61NS 0.68NS 0.83NS 0.96** 0.92*MDA - 0.93* - 0.89* - 0.95* - 0.96* - 0.93* - 0.81NS - 0.92NS - 0.77NS - 0.75NS - 0.76NS - 0.90* - 0.97** - 0.95*
ΨS 0.90* 0.90* 0.99** 0.96** 0.98** 0.74NS 0.96* 0.69NS 0.87NS 0.81NS 0.95* 0.95* 0.94*ΨW 0.92* 0.91* 0.99** 0.97** 0.97** 0.77NS 0.96* 0.73NS 0.84NS 0.81NS 0.94* 0.96** 0.95*ΨP 0.95* 0.91* 0.93* 0.96** 0.89* 0.88* 0.91* 0.85NS 0.67NS 0.76NS 0.89* 0.97** 0.96*
GCPC 0.90* 0.85NS 0.95* 0.93* 0.95* 0.72NS 0.91* 0.64NS 0.80NS 0.76NS 0.91* 0.96** 0.93** = Significant (p ≤ 0.05); ** = Significant (p ≤ 0.01); NS = Non-significant (p ≤ 0.05); GPS = Grains per spike; TGW = 1000-grain weight; GY = Grain yield; BY = Biological yield; HI = Harvest index; SY = Straw yield; PH= Plant height; SL = Spike length; SPS = Spikelets per spike; GFR = Grain filling rate; GFD = Grain filling duration; Chl a = Chlorophyll a; Chl b = Chlorophyll b; SOD = Superoxide dismutase; POD = Peroxidase; CAT = Catalase; TPC = Total phenolic contents; LP = Leaf proline; GB = Glycine betaine; TSP = Total soluble proteins; MDA = Malondialdehyde; Ψ S = Osmotic potential; ΨW = Water potential; ΨP = Pressure potential; GCPC = Grain crude protein contentsn (number of pairs of observations) = 45
178

Table 4.3.15 (d): Correlation analyses showing strength of association among recorded attributes of wheat under heat from spike to grain filling (H1) and foliar applied selenium during 2016-17
Parameters SOD POD CAT TPC LP GB TSP MDA ΨS ΨW ΨP
POD 0.97**CAT 0.96** 0.99**TPC 0.98** 0.95* 0.99**LP 0.98** 0.99** 0.99** 0.99**GB 0.99** 0.97** 0.98** 0.98** 0.99**TSP 0.99** 0.95* 0.93* 0.96* - 0.98** 0.97*
MDA - 0.98** - 0.98** - 0.96** - 0.98** - 0.98** - 0.96** 0.98**ΨS 0.93* 0.97** 0.96** 0.97** 0.96** 0.92* 0.92* - 0.98**ΨW 0.95* 0.97** 0.96* 0.97** 0.96** 0.93* 0.94* - 0.99** 0.99**ΨP 0.97** 0.93* 0.91* 0.94* 0.94* 0.93* 0.98** - 0.99** 0.95* 0.96**
GCPC 0.97** 0.99** 0.99** 0.99** 0.99** 0.96** 0.95* - 0.98** 0.98** 0.98** 0.94** = Significant (p ≤ 0.05); ** = Significant (p ≤ 0.01); NS = Non-significant (p ≤ 0.05); SOD = Superoxide dismutase; POD = Peroxidase; CAT = Catalase; TPC = Total phenolic contents; LP = Leaf proline; GB = Glycine betaine; TSP = Total soluble proteins; MDA = Malondialdehyde; Ψ S = Osmotic potential; ΨW = Water potential; ΨP = Pressure potential; GCPC = Grain crude protein contentsn (number of pairs of observations) = 45
179

Table 4.3.16 (a): Correlation analyses showing strength of association among recorded attributes of wheat under heat from flowering to grain filling (H2) and foliar applied selenium during 2015-16
Parameters GPS TGW GY BY HI SY PH SL SPS GFR GFD Chl a Chl bTGW 0.94*GY 0.94* 0.91*BY 0.92* 0.87NS 0.99**HI 0.94* 0.93* 0.95* 0.90*SY 0.88* 0.82NS 0.96** 0.99** 0.84NS
PH 0.89* 0.82NS 0.84NS 0.88* 0.70NS 0.90*SL 0.94* 0.98** 0.94* 0.93* 0.92* 0.90* 0.89*SPS 0.97** 0.98** 0.96** 0.94* 0.94* 0.91* 0.89* 0.99**GFR 0.89* 0.83NS 0.90* 0.94* 0.76NS 0.96* 0.99** 0.90* 0.91NS
GFD 0.73NS 0.76NS 0.58NS 0.60NS 0.72NS 0.60NS 0.87NS 0.78NS 0.76NS 0.79NS
Chl a 0.95* 0.99** 0.93* 0.90* 0.92* 0.87NS 0.88* 0.99** 0.99* 0.88* 0.80NS
Chl b 0.95* 0.96** 0.94* 0.94* 0.89* 0.92* 0.94* 0.99** 0.99* 0.94* 0.81NS 0.99**SOD 0.95* 0.92* 0.98** 0.94* 0.90* 0.88* 0.76NS 0.91* 0.95* 0.81NS 0.53NS 0.92* 0.90*
POD 0.92* 0.97** 0.93* 0.87NS 0.96** 0.80NS 0.72NS 0.94* 0.95* 0.75NS 0.59NS 0.95* 0.91*CAT 0.86NS 0.87NS 0.92* 0.86NS 0.98** 0.79NS 0.60NS 0.85NS 0.88* 0.67NS 0.36NS 0.84NS 0.81NS
TPC 0.95* 0.92* 0.99** 0.95* 0.99** 0.90* 0.78NS 0.93* 0.96* 0.83NS 0.54NS 0.92* 0.91*LP 0.79NS 0.90* 0.85NS 0.78NS 0.99** 0.70NS 0.53NS 0.85NS 0.86NS 0.59NS 0.41NS 0.86NS 0.79NS
GB 0.96** 0.92* 0.99** 0.97** 0.94* 0.93* 0.82NS 0.93* 0.96** 0.87NS 0.57NS 0.93* 0.93*TSP 0.87NS 0.83NS 0.90* 0.83NS 0.97** 0.75NS 0.58NS 0.80NS 0.85NS 0.59NS 0.35NS 0.81NS 0.77NS
MDA -0.92* -0.82NS -0.93* - 0.88* - 0.96** - 0.83NS -0.70NS -0.80NS -0.87NS -0.75NS -0.43NS -0.82NS -0.81NS
ΨS 0.97** 0.90* 0.98** 0.95* 0.97** 0.90* 0.81NS 0.90* 0.94* 0.85NS 0.56NS 0.90* 0.90*ΨW 0.97** 0.90* 0.98** 0.95* 0.97** 0.91* 0.82NS 0.91* 0.95* 0.82NS 0.57NS 0.91* 0.91*ΨP 0.97** 0.89* 0.99** 0.97** 0.94* 0.95* 0.87NS 0.92* 0.95* 0.91* 0.62NS 0.91* 0.93*
GCPC 0.90* 0.88* 0.96** 0.92* 0.99** 0.86NS 0.68NS 0.87 NS 0.91* 0.75NS 0.42NS 0.87NS 0.85NS
* = Significant (p ≤ 0.05); ** = Significant (p ≤ 0.01); NS = Non-significant (p ≤ 0.05); GPS = Grains per spike; TGW = 1000-grain weight; GY = Grain yield; BY = Biological yield; HI = Harvest index; SY = Straw yield; PH= Plant height; SL = Spike length; SPS = Spikelets per spike; GFR = Grain filling rate; GFD = Grain filling duration; Chl a = Chlorophyll a; Chl b = Chlorophyll b; SOD = Superoxide dismutase; POD = Peroxidase; CAT = Catalase; TPC = Total phenolic contents; LP = Leaf proline; GB = Glycine betaine; TSP = Total soluble proteins; MDA = Malondialdehyde; Ψ S = Osmotic potential; ΨW = Water potential; ΨP = Pressure potential; GCPC = Grain crude protein contentsn (number of pairs of observations) = 45
180

Table 4.3.16 (b): Correlation analyses showing strength of association among recorded attributes of wheat under heat from flowering to grain filling (H2) and foliar applied selenium during 2015-16
Parameters SOD POD CAT TPC LP GB TSP MDA ΨS ΨW ΨP
POD 0.97**CAT 0.97** 0.96**TPC 0.99** 0.97** 0.97**LP 0.90* 0.96** 0.96* 0.90*GB 0.99** 0.95* 0.95* 0.99** 0.87NS
TSP 0.97** 0.94* 0.99** 0.96* 0.91* 0.93*MDA -0.97** -0.90* -0.94* -0.96** -0.81NS -0.96* -0.97**
ΨS 0.99** 0.94* 0.94* 0.99** 0.84NS 0.99** 0.95* -0.98**ΨW 0.99** 0.93* 0.93* 0.99* 0.83NS 0.99** 0.94* -0.98** 0.99**ΨP 0.97** 0.91* 0.89* 0.97** 0.79NS 0.99** 0.89* -0.95* 0.99** 0.99**
GCPC 0.99** 0.95* 0.99** 0.99** 0.92* 0.98** 0.98** -0.96** 0.97** 0.97** 0.94** = Significant (p ≤ 0.05); ** = Significant (p ≤ 0.01); NS = Non-significant (p ≤ 0.05); SOD = Superoxide dismutase; POD = Peroxidase; CAT = Catalase; TPC = Total phenolic contents; LP = Leaf proline; GB = Glycine betaine; TSP = Total soluble proteins; MDA = Malondialdehyde; Ψ S = Osmotic potential; ΨW = Water potential; ΨP = Pressure potential; GCPC = Grain crude protein contentsn (number of pairs of observations) = 45
181

Table 4.3.16 (c): Correlation analyses showing strength of association among recorded attributes of wheat under heat from flowering to grain filling (H2) and foliar applied selenium during 2016-17
Parameters GPS TGW GY BY HI SY PH SL SPS GFR GFD Chl a Chl bTGW 0.83NS 1.00GY 0.96* 0.82NS
BY 0.96* 0.82NS 0.99**HI 0.95* 0.82NS 0.99** 0.99**SY 0.96** 0.82NS 0.99** 0.99** 0.99**PH 0.96** 0.72NS 0.97** 0.98** 0.97** 0.98**SL 0.94* 0.88* 0.87NS 0.87NS 0.88* 0.88* 0.84NS
SPS 0.83NS 0.87NS 0.94* 0.94* 0.94** 0.93* 0.84NS 0.81NS
GFR 0.80NS 0.74NS 0.94* 0.94* 0.94** 0.93* 0.87NS 0.69NS 0.97**GFD 0.65NS 0.48NS 0.68NS 0.67NS 0.78NS 0.67NS 0.65NS 0.77NS 0.65NS 0.59NS
Chl a 0.91* 0.85NS 0.92* 0.91* 0.92* 0.91* 0.86NS 0.97** 0.89* 0.81NS 0.86NS
Chl b 0.84NS 0.88* 0.89* 0.89* 0.89* 0.88* 0.79NS 0.91* 0.94* 0.84NS 0.82NS 0.98**SOD 0.91* 0.96** 0.91* 0.91* 0.90* 0.91* 0.85NS 0.87NS 0.90* 0.83NS 0.45NS 0.85NS 0.85NS
POD 0.92* 0.97** 0.85NS 0.98** 0.85NS 0.86NS 0.80NS 0.93* 0.82NS 0.71NS 0.51NS 0.87NS 0.85NS
CAT 0.83NS 0.92* 0.76NS 0.76NS 0.74NS 0.76NS 0.71NS 0.79NS 0.71NS 0.62NS 0.23NS 0.69NS 0.67NS
TPC 0,85NS 0.80NS 0.76NS 0.76NS 0.74NS 0.76NS 0.77NS 0.74NS 0.63NS 0.59NS 0.94* 0.62NS 0.55NS
LP 0.80NS 0.99** 0.76NS 0.75NS 0.75NS 0.75NS 0.66NS 0.85NS 0.79NS 0.65NS 0.38NS 0.78NS 0.80NS
GB 0.90* 0.90* 0.83NS 0.83NS 0.82NS 0.83NS 0.80NS 0.82NS 0.75NS 0.69NS 0.30NS 0.73NS 0.69NS
TSP 0.93* 0.88* 0.86NS 0.86NS 0.85NS 0.87NS 0.86NS 0.84NS 0.76NS 0.72NS 0.99** 0.76NS 0.70NS
MDA -0.99** -0.80NS -0.98** - 0.98** - 0.98** - 0.98** -0.98** -0.92* -0.87NS -0.86NS -0.71NS -0.93* -0.87NS
ΨS 0.97** 0.88* 0.93* 0.93* 0.93* 0.94** 0.93* 0.88* 0.83NS 0.80NS 0.49NS 0.84NS 0.78NS
ΨW 0.97** 0.92* 0.93* 0.93* 0.92* 0.93** 0.90* 0.91* 0.85NS 0.79NS 0.49NS 0.86NS 0.81 NS
ΨP 0.91* 0.98** 0.87NS 0.87NS 0.86NS 0.87NS 0.80NS 0.93* 0.85NS 0.74NS 0.51NS 0.88* 0.86NS
GCPC 0.96* 0.96* 0.94* 0.93* 0.93* 0.94* 0.88* 0.95* 0.90* 0.82NS 0.61NS 0.93* 0.91** = Significant (p ≤ 0.05); ** = Significant (p ≤ 0.01); NS = Non-significant (p ≤ 0.05); GPS = Grains per spike; TGW = 1000-grain weight; GY = Grain yield; BY = Biological yield; HI = Harvest index; SY = Straw yield; PH= Plant height; SL = Spike length; SPS = Spikelets per spike; GFR = Grain filling rate; GFD = Grain filling duration; Chl a = Chlorophyll a; Chl b = Chlorophyll b; SOD = Superoxide dismutase; POD = Peroxidase; CAT = Catalase; TPC = Total phenolic contents; LP = Leaf proline; GB = Glycine betaine; TSP = Total soluble proteins; MDA = Malondialdehyde; Ψ S = Osmotic potential; ΨW = Water potential; ΨP = Pressure potential; GCPC = Grain crude protein contentsn (number of pairs of observations) = 45
182

Table 4.3.16 (d): Correlation analyses showing strength of association among recorded attributes of wheat under heat from flowering to grain filling (H2) and foliar applied selenium during 2016-17
Parameters SOD POD CAT TPC LP GB TSP MDA ΨS ΨW ΨP
POD 0.97**CAT 0.95* 0.95*TPC 0.89* 0.88* 0.95*LP 0.95* 0.97** 0.95* 0.83NS
GB 0.96** 0.95* 0.99** 0.98** 0.92*TSP 0.96* 0.94* 0.96** 0.98** 0.88* 0.99**
MDA - 0.89* - 0.87NS - 0.76NS - 0.78NS - 0.74NS - 0.84NS - 0.88*ΨS 0.96** 0.94* 0.92* 0.94* 0.86NS 0.97** 0.99** - 0.95*ΨW 0.98** 0.97** 0.94* 0.93* 0.90* 0.97** 0.98** - 0.94* 0.99**ΨP 0.98** 0.99** 0.95* 0.87NS 0.97** 0.95* 0.94* - 0.87NS 0.99** 0.97**
GCPC 0.98** 0.98** 0.90* 0.84NS 0.93* 0.93* 0.93* - 0.94* 0.96** 0.98** 0.98*** = Significant (p ≤ 0.05); ** = Significant (p ≤ 0.01); NS = Non-significant (p ≤ 0.05); SOD = Superoxide dismutase; POD = Peroxidase; CAT = Catalase; TPC = Total phenolic contents; LP = Leaf proline; GB = Glycine betaine; TSP = Total soluble proteins; MDA = Malondialdehyde; Ψ S = Osmotic potential; ΨW = Water potential; ΨP = Pressure potential; GCPC = Grain crude protein contentsn (number of pairs of observations) = 45
183

SUMMARY CHAPTER-5
The present research work was conducted to determine the thermo-sensitivity of
Pakistani wheat genotypes and alleviation of negative implications of heat on varying
terminal phenological stages through exogenous application of potassium and selenium. The
research work was comprised of two phases. In the first phase wheat genotypes were
screened for terminal thermo-sensitivity and tolerance under field conditions during 2014-15.
Heat was imposed in main plots viz. H0 = no heat stress (control) and H1 = Heat imposition
from complete emergence of spike to grain filling initiation (early milk stage) (Feekes scale =
10.50 to 11.0). Different genotypes were randomized in split plots. A medium heat tolerant
genotype was selected on the basis of recorded response variables and used in further
experimentation.
Imposition of heat stress deleteriously impacted the metabolism of all genotypes.
Antioxidants (superoxide dismutase, peroxidase, catalase and total phenolics) and osmo-
protectants (proline, glycine betaine and soluble proteins) were enhanced in genotypes ‘AAS-
2011, Chakwal-50 and Mairaj-2008’ under high temperature environment compared to ‘no
heat stress’. While, in all other genotypes biosynthesis of antioxidants and osmo-protectants
was depressed under heat compared to control. Likewise, adverse impacts of heat on spike
growth, the stay green trait, grain yield and yield components were relatively lesser in
genotypes ‘AAS-2011, Chakwal-50 and Mairaj-2008’ than other genotypes. On the basis of
recorded attributes, genotypes ‘AAS-2011, Chakwal-50 and Mairaj-2008’ depicted
terminal heat tolerance while genotypes ‘Fareed-2006’ and ‘Punjab-2011’ exhibited
medium tolerance. Genotypes AARI-2011, Galaxy-2013, Millat-2011, Pakistan-2013,
NIBGE-NIAB-1 and Kohistan-97 could not produce remarkable responses under heat
and were characterized as terminal heat susceptible on the basis of recorded
parameters.
During the 2nd year of study (2015-16), more detailed studies of heat were performed
to explicate relative damages of terminal heat on different terminal stages under field
environment. Moreover, negative implications of heat stress were alleviated through
exogenous application of varying concentrations of potassium and selenium. The second and
third experiment were comprised of heat stress in main plots viz. H0 = no heat imposition
(control); H1 = Heat imposition from complete emergence of spike to grain filling initiation
184

(early milk stage) (Feekes scale = 10.50 to 11.0)’ and H2 = Heat imposition from flowering
initiation to grain filling initiation (early milk stage) (Feekes scale = 10.5.1 to 11.0)’. In the
second experiment, subplot treatments were comprised of varying concentrations of foliar
potassium viz. control/water spray, 15, 30, 45 and 60 g L-1. While, split plot treatments in the
third experiment were different concentrations of foliar selenium viz. control/water spray, 25,
50, 75 and 100 mg L-1. Second and third experiments were repeated during 2016-17.
Heat stress either from ‘spike to grain filling’ or ‘flowering to grain filling’ adversely
affected yield and related components, biomass accumulation attributes, spike growth, stay
green, antioxidants, osmo-protectants, lipid peroxidation and quality compared to ‘no heat
stress’. While negative implications of heat were more pronouncing under ‘heat from
spike to grain filling’ compared to ‘heat from flowering to grain filling’. Varying
concentrations of foliar potassium differed significantly. Relatively more and statistically
alike grain yield, yield components, biomass accumulating attributes, spike growth attributes,
chlorophyll contents and grain crude protein contents were recorded with 45 and 60 g L -1
exogenous potassium generally. Whereas, statistically similar and relatively more
antioxidants, osmo-protectants, water relation attributes and statistically similar and relatively
lesser lipid peroxidation were recorded with 45 and 60 g L-1 under ‘no heat stress’. While,
application of 60 g L-1 exogenous potassium depicted significantly more antioxidants,
osmo-protectants, water relation attributes and significantly lesser lipid peroxidation
compared to other concentrations. Whereas, relatively poor and statistically similar
responses were observed with control/water spray and 15 g L-1 exogenous potassium for most
of instances.
Likewise, statistically alike and relatively more yield, yield components, spike
attributes, biomass accumulation, turgor potential and grain crude protein contents were
observed with 75 and 100 mg L-1 exogenous selenium compared to other concentrations.
While, application of selenium at 100 mg L-1 proved toxic for antioxidants, osmo-protectants,
lipid peroxidation, water and osmotic potential under ‘no heat stress’. Hence, application of
100 mg L-1 exogenous selenium either depicted significantly lesser or 100 mg L-1
selenium was at par with 75 mg L-1 foliar selenium under ambient conditions.
Contrarily, application of 100 mg L-1 selenium proved advantageous under both
treatments of heat stress and depicted significantly more antioxidants, osmo-
protectants, lipid peroxidation, water and osmotic potential compared to other
concentrations. While, comparatively poor and statistically similar responses were observed
185

with control/water spray and 25 mg L-1 exogenous selenium. Moreover, importance of
availability of potassium and selenium was enhanced for almost all the studied
attributes under heat stress conditions compared to ‘no heat stress’. Thus, significant
associations of biochemical attributes were observed with growth, yield and other
morphological attributes.
CONCLUSION
Not surprisingly, the imposition of heat stress adversely affected biochemical and
morphological attributes of all genotypes tested. While, genotypes ‘AAS-2011, Chakwal-50
and Mairaj-2008’ depicted heat tolerance; ‘Fareed-2006’ and ‘Punjab-2011’ depicted
medium tolerance and genotypes ‘AARI-2011, Galaxy-2013, Millat-2011, Pakistan-2013,
NIBGE-NIAB-1 and Kohistan-97’ were susceptible to terminal heat. Imposition of ‘heat
from spike to grain filling’ and ‘heat from flowering to grain filling’ significantly affected
yield components, grain yield, spike growth attributes, antioxidants, osmo-protectants, water
relations and quality attributes compared to ‘no heat stress’. Whereas, imposition of ‘heat
stress from spike to grain filling’ was more damaging compared to ‘heat from flowering to
grain filling’. Under ‘no heat stress’ application of exogenous potassium at 45 g L-1 or
selenium at 75 mg L-1 depicted more promising results. Whereas, application of potassium at
60 g L-1 or selenium at 100 mg L-1 depicted more promising morphological and biochemical
responses under ‘heat from spike to grain filling and ‘heat from flowering to grain filling’.
Moreover, foliar application of potassium or selenium proved more advantageous under heat
imposition compared to no heat stress. In addition, biochemical attributes (such as superoxide
dismutase, catalase, peroxidase, chlorophyll contents, proline, glycine betaine, phenolics and
malondialdehyde) significantly modulated changes in growth, yield components and grain
yield under varying temperatures. This, significant association of biochemical attributes with
morphological attributes can be used as futuristic roadmap to improve heat resistance in
wheat. Likewise, improving the capability of wheat to uptake potassium and selenium can
also prove potent tool as stratagem to improve terminal heat tolerance.
FUTURE PERSPECTIVES
1. Potassium and selenium modulated regulations in stomatal conductance, glutathione
peroxidase, ascorbate peroxidase and reducing powers (NADPH) should be explored in
future.
2. Heat stress and exogenous potassium and selenium triggered alterations in fertility of
pollens and ovule development should constitute the bases for futuristic roadmaps.
186

3. It is suggested to conduct experiments on thermo-sensitivity of genotypes over years and
locations.
4. Experiments on potassium and selenium modulated alleviations in adversities of heat stress
should be conducted using multiple genotypes and on multiple locations in future to
determine heat alleviation potential of these nutrients.
5. Heat stress is often accompanied by physiological drought under field conditions. Hence, it
is suggested to conduct experiments on combined imposition of drought and heat stress in
wheat crop in future.
187

LITERATURE CITED
Abd-Allah, E.F., A. Hashem, A.A. Alqarawi1, D.A.W. Soliman and M.A. Alghamdi. 2016. Selenium ameliorates cadmium stress-induced damage by improving antioxidant defense system in Chlamydomonas reinhardtii. Pak. J. Bot. 48: 2223-2231.
Ahanger, M.A. and R.M. Agarwal. 2017. Salinity stress induced alterations in antioxidant metabolism and nitrogen assimilation in wheat (Triticum aestivum L) as influenced by potassium supplementation. Plant Physiol. Biochem. 115: 449-460.
Ahmad, I. and F.J.M. Maathuis. 2014. Cellular and tissue distribution of potassium; physiological relevance, mechanisms and regulation. J Plant Physiol. 171: 708-714.
Ahmad, P., M. Ashraf, K.R. Hakeem, M.M. Azooz, S. Rasool, R. Chandna and N.A. 2014. Potassium starvation-induced oxidative stress and antioxidant defense responses in Brassica juncea, J. Plant Interact. 9: 1-9. doi: 10.1080/17429145.2012.747629.
Ahmad, R., E.A. Waraich, F. Nawaz, M.Y. Ashraf and M. Khalid. 2016. Selenium (Se) improves drought tolerance in crop plants – a myth or fact? Sci. Food Agric. 96: 372-380.
Ainsworth, E.A. and K.M. Gillespie. 2007. Estimation of total phenolic content and their oxidation substrates in plant tissues using Folin-Ciocalteu reagent. Nat. Protoc. 2: 875-877.
Albokari, M.A.M., A.M.J. Khashoggi and M.A. Almuwalid. 2016. Effect of different irrigated conditions on some morphological traits of wheat genotypes grown in Saudi Arabia. Pak. J. Bot. 48: 519-526.
Alghabari, F., M.Z. Ihsan, A. Khaliq, S. Hussain, I. Daur, S. Fahad and W. Nasim. 2016. Gibberellin-sensitive Rht alleles confer tolerance to heat and drought stresses in wheat at booting stage. J. Cereal Sci. 70: 72-78.
Almeselmani, M., P.S. Deshmukh and R.K. Sairam. 2009. High temperature stress tolerance in wheat genotypes: Role of antioxidant defence enzymes. Acta Agron. Hungar. 57: 1-14.
Altenbach, S.B. 2012. New insights into the effects of high temperature, drought and post-anthesis fertilizer on wheat grain development. J. Cereal Sci. 56: 39-50.
Andrés, Z., J. Pérez-Hormaeche, E.O. Leidi, K. Schlücking, L. Steinhorst, D.H. McLachlan, K. Schumacher, A.M. Hetherington, J. Kudla, B. Cubero and J.M. Pardo. 2014. Control of vacuolar dynamics and regulation of stomatal aperture by tonoplast potassium uptake. Pro. Nat. Acad. Sci. April 14, 2014. www.pnas.org/cgi/doi/10.1073/pnas.1320421111.
Ang, J.B. and P.G. Fredriksson. 2017. Wheat agriculture and family ties. Euro. Econ. Rev. 100: 236-256.
Anschütz, U., D. Becker and S. Shabala. 2014. Going beyond nutrition: Regulation of potassium homoeostasis as a common denominator of plant adaptive responses to environment. J. Plant Physiol. 171: 670-687.
Arnon, D.I. 1949. Copper enzymes in isolated chloroplasts polyphenol oxidase in Beta vulgaris. Plant Physiol. 24: 1-15.
Ashraf, M. and P.J.C. Harris. 2013. Photosynthesis under stressful environments: An overview. Photosynthetica 51 (2): 163-190. doi: 10.1007/s11099-013-0021-6.
188

Asthir, B. 2015. Protective mechanisms of heat tolerance in crop plants, J. Plant Interact. 10: 202-210. doi: 10.1080/17429145.2015.1067726.
Awasthi, R., K. Bhandari and H. Nayyar. 2015. Temperature stress and redox homeostasis in agricultural crops. Front. Environ. Sci. 3:11. doi:10.3389/fenvs. 2015.00011.
Barlow, K.M., B.P. Christy, G.J. O’Leary, P.A. Riffkin and J.G. Nuttall. 2015. Simulating the impact of extreme heat and frost events on wheat crop production: A review. Field Crops Res. 171: 109-119.
Bastida, F., I.F. Torres, T. Hern_Andez and C. García. 2017. The impacts of organic amendments: Do they confer stability against drought on the soil microbial community? Soil Biol. Biochem. 113: 173-183.
Bate, L.S., R.P. Waldron and I.W. Teaxe. 1973. Rapid determination of free proline for water stress studies. Plant Soil 39: 205-207.
Bekele, F., D. Korecha and L. Negatu. 2017. Demonstrating effect of rainfall characteristics on wheat yield: case of Sinana district, south eastern Ethiopia. Agric. Sci. 8: 371-384. https://doi.org/10.4236/as.2017.85028
Benlloch-Gonzáleza, M., J.M. Quintero, M.P. Suárez, R. Sánchez-Lucas, R. Fernández-Escobar and M. Benlloch. 2016. Effect of moderate high temperature on the vegetative growth andpotassium allocation in olive plants. J. Plant Physiol. 207: 22-29.
Bradford, M.M. 1976. A rapid and sensitive method for the quantitation of microgram quantities of protein utilizing the principle of protein-dye binding. Ann. Biochem. 72: 248-254.
Bremner, R.M. and C.S. Mulvaney. 1982. Nitrogen total. pp. 595-624. In A.L. Page (ed.), Methods of soil analysis, Agron. No. 9. Madison, WI, USA.
Buresh, R.J., E.R. Austin and E.T. Craswell. 1982. Analytical methods in N-15 research. Fert. Res. 3: 37-62.
Bybordi, A. 2016. Influence of zeolite, selenium and silicon upon some agronomic and physiologic characteristics of canola grown under salinity. Commun. Soil Sci. Plant Anal. 47: 832-850. doi: 10.1080/00103624.2016.1146898.
Cakmak, I. and W.J. Horst. 1991. Effect of aluminum on lipid peroxidation, superoxide dismutase, catalase, and peroxidase activities in root tips of soybean (Glycine max L.). Physiol. Plant. 83: 463-468.
Carmo-Silva, A.E., M.A. Gore, P. Andrade-Sanchez, A.N. French, D.J. Hunsaker and M.E. Salvucci. 2012. Decreased CO2 availability and inactivation of Rubisco limit photosynthesis in cotton plants under heat and drought stress in the field. Environ. Exp. Bot. 83: 1-11.
Chapman, H.D. and P.F. Pratt. 1961. Methods of analysis for soil plant and waters. Barkeley, CA, USA: University of California Division of Agriculture Science.
Chen, Y.E., C-M. Zhang, Y-Q. Su, J. Ma, Z-W. Zhang, M. Yuan, H-Y. Zhang and S. Yuan. 2017. Responses of photosystem II and antioxidative systems to high light and high temperature co-stress in wheat. Environ. Exp. Bot. 135: 45-55.
Cheng, B., H. Lian, Y. Liu, X. Yu, Y. Sun, X. Sun, Q. Shi and S. Liu. 2016. Effects of selenium and sulfur on antioxidants and physiological parameters of garlic plants during senescence. J. Integr. Agric. 15: 566-572.
Conaty, W., J. Burke, J. Mahan, J. Neilsen and B. Sutton. 2012. Determining the optimum plant temperature of cotton physiology and yield to improve plant based irrigation scheduling. Crop Sci. 1828-1836.
Czégény, G., A. Mátai and É. Hideg. 2016. UV-B effects on leaves-oxidative stress and acclimation in controlled environments. Plant Sci. 248: 57-63.
189
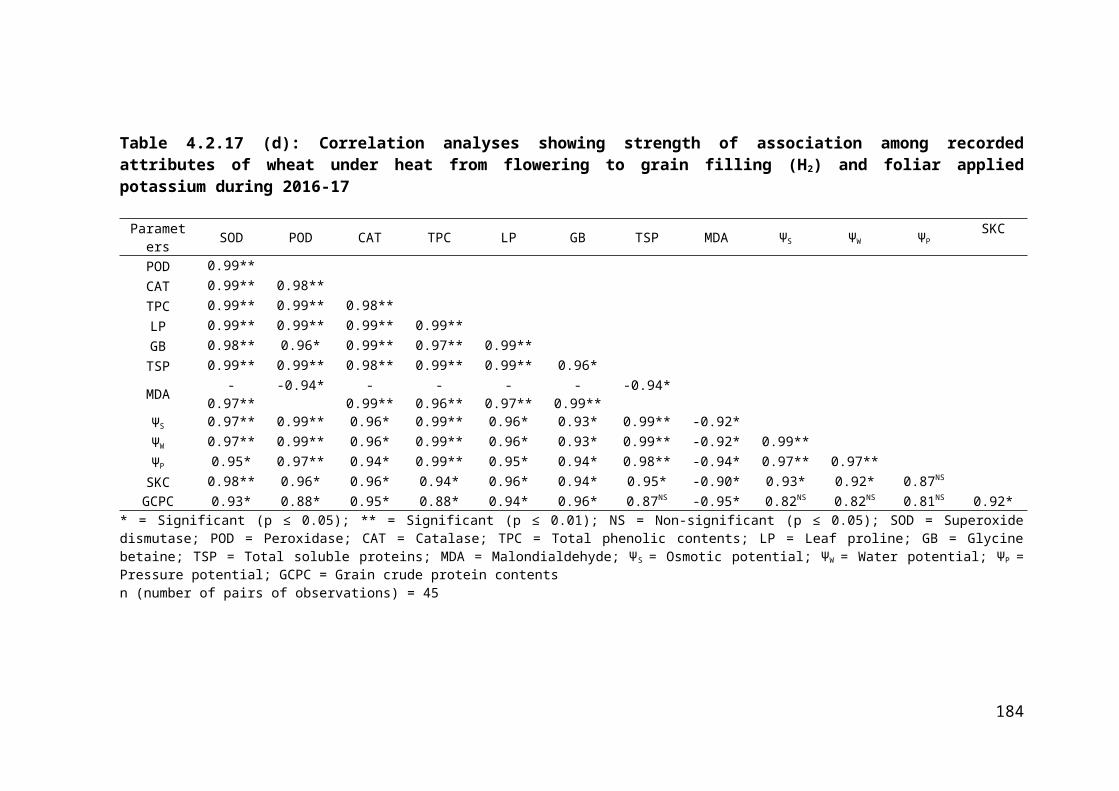
Das, K. and A. Roychoudhury. 2014. Reactive oxygen species (ROS) and response of antioxidants as ROS-scavengers during environmental stress in plants. Front. Environ. Sci. 2: 53. doi: 10.3389/fenvs.2014.00053.
Dong, J.Z., Y. Wang, S.H. Wang, L.P. Yin, G.J. Xu, C. Zheng, C. Leia and M.Z. Zhang. 2013. Selenium increases chlorogenic acid, chlorophyll and carotenoids of Lycium chinense leaves. J. Sci. Food Agric.93: 310-315.
Duan, H.W.J., G. Huang, S. Zhou, W. Liu, Y. Liao, X. Yang, Z. Xiao and H. Fan. 2017. Individual and interactive effects of drought and heat on leaf physiology of seedlings in an economically important crop. AoB Plants 9: plw090; 10.1093/aobpla/plw090.
Dube, E., R. Mare-Patose, W. Kilian, A. Barnard and T.J. Tsilo. 2016. Identifying high-yielding dry land wheat cultivars for the summer rainfall area of South Africa. S. Afr. J. Plant Soil 33: 77-81.
Dwivedi, S.K., S. Basu, S. Kumar, G. Kumar, V. Prakash, S. Kumar, J.S. Mishra, B.P. Bhatt, N. Malviya, G.P. Singh and A. Arora. 2017. Heat stress induced impairment of starch mobilisation regulates pollen viability and grain yield in wheat: Study in Eastern Indo-Gangetic Plains. Field Crops Res. 206: 106-114.
FAO (Food and Agriculture Organization of United Nations). 2003. Food energy- methods of analysis and conversion factors. Report of technical workshop Rome 3-6 December 2002 pp. 9.
FAO (Food and Agriculture Organization of United Nations). 2017. Food outlook: biennial reports on global markets. June 2017 pp. 2.
Fardus, S., A. Wahid, F. Javed and B. Sadia. 2014. Changes in leaf phenolics concentrations determine the survival of evening primrose (Oenothera biensis) in various seasons. Int. J. Agric. Biol. 16: 819-824.
Farooq, M., H. Bramley, J.A. Palta and K.H.M. Siddique. 2011. Heat stress in wheat during reproductive and grain-filling phases. Crit. Rev. Plant Sci. 30: 1-17.
Feng, B., P. Liu, G. Li, S.T. Dong, F.H. Wang, L.A. Kong and J.W. Zhang. 2014. Effect of heat stress on the photosynthetic characteristics in flag leaves at the grain-filling stage of different heat-resistant winter wheat varieties. J. Agron. Crop Sci. 200: 143-155.
Feng, R., C. Wei and S. Tu. 2013. The roles of selenium in protecting plants against abiotic stresses. Environ. Exp. Bot. 87: 58-68.
Fernando, N., J. Panozzo, M. Tausz, R.M. Norton, N. Neumann, G.J. Fitzgerald and S. Seneweera. 2014. Elevated CO2 alters grain quality of two bread wheat cultivars grownunder different environmental conditions. Agric. Ecosys. Environ. 185: 24-33.
Gallé, Á., J. Csiszár, M. Secenji, A. Guóth, L. Cseuz, I. Tari, J. Györgyey and L. Erdei. 2013. Drought response strategies during grain filling in wheat. Glutathione transferase activity and expression pattern in flag leaves. J. Plant Physiol. 170: 1389-1399. http://dx.doi.org/10.1016/j.jplph.2013.04.010.
Gardner, F.P., R.B. Pearce and R.L. Mitchell. 1985. Physiology of Crop Plants. Iowa State Univ. Press, Iowa.
Geiger, D. 2011. Plant sucrose transporters from a biophysical point of view. Mol. Plant 4: 395-406.
Ghaffari, A., M.A. Wahid, M.F. Saleem and M.Z. Rehman. 2015. Inducing thermo-tolerance in late sown wheat (Triticum aestivum L.) through pre-conditioning with H2O2. Pak. J. Agric. Sci. 52: 945-951.
Giannopolitis, C.N. and S.K. Ries. 1977. Superoxide dismutase: I. occurrence in higher plants. Plant Physiol. 59: 309-314.
190

Gomez, K.A. and A.A. Gomez. 1984. Sampling in experimental plots. In: Statistical Procedures for agricultural research, 2nd Ed. A Wiley Interscience Publication, John Wiley and Sons; pp.533-557.
Gouache, D., X.L. Bris, M. Bogard, O. Deudon, C. Pagé and P. Gate. 2012. Evaluating agronomic adaptation options to increasing heat stress under climate change during wheat grain filling in France. Europ. J. Agron. 39: 62-70.
Govt. of Pakistan. 2017. Economic survey of Pakistan 2016-17. Ministry of Food and Agriculture Islamabad, Pakistan, Chap. 2 pp. 19-40.
Grieve, C.M. and S.R. Grattan. 1983. Rapid assay for determination of water soluble quaternary amino compounds. Plant Soil. 70: 303-307.
Gulnaz, S., M. Sajja, I. Khaliq, A.S. Khan and S.H. Khan. 2011. Relationship among coleoptile length, plant height and tillering capacity for developing improved wheat varieties. Int. J. Agric. Biol. 13: 130-133.
Gupta, M. and S. Gupta. 2017. An Overview of selenium uptake, metabolism, and toxicity in plants. Front. Plant Sci. 7: 2074. doi: 10.3389/fpls.2016.02074.
Gupta, P.K. 1999. Plant analysis, In: Soil, plant, water and fertilizer analysis. Agrobios Publisher. Jodhpur India. pp. 279-280.
Haghighi, M., A. Sheibanirad and M. Pessarakli. 2015. Effects Of selenium as a beneficial element on growth and photosynthetic attributes of greenhouse cucumber, J. Plant Nutr. DOI: 10.1080/01904167.2015.1109116
Hajiboland, R., N. Sadeghzadeh, N. Ebrahimi, B. Sadeghzadeh and S.A. Mohammadi. 2015. Influence of selenium in drought-stressed wheat plants under greenhouse and field conditions. Acta Agric. Slov. 105: 175-191. doi: 10.14720/aas.2015.105.2.01.
Harris, J.M., B. Roach and A. Codur. 2015. The economics of global climate change. global development and environment institute Tufts University Somerville, MA 02144 http://ase.tu fts.edu/gdae.
Hasanuzzaman, M., K. Nahar, M.M. Alam, R. Roychowdhury and M. Fujita. 2013. Physiological, biochemical, and molecular mechanisms of heat stress tolerance in plants. Int. J. Mol. Sci. 14: 9643-9684. doi:10.3390/ijms14059643.
Hassan, M.U., M. Aamer, M.U. Chattha, M.A. Ullah, S. Sulaman, M. Nawaz, W. Zhiqiang, M. Yanqin and H. Guoqin. 2017. The Role of Potassium in Plants under Drought Stress: Mini Review. J. Basic Appl. Sci. 13: 268-271.
Hatfield, J.L. and J.H. Prueger. 2015. Temperature extremes: Effect on plant growth and development. Weather Clim. Extrem.10: 4-10.
Hayat, S., Q. Hayat, M.N. Alyemeni, A.S. Wani, J. Pichtel and A. Ahmad. 2012. Role of proline under changing environments A review. Plant Signal. Behav. 7: 1456-1466. http://dx.doi.org/10.4161/psb.21949.
Helmke, P.A. and D.L. Sparks. 1996. Lithium, sodium, potassium, rubidium and cesium. In A.L. Page and D.L. Sparks (Eds.), Methods of soil analysis. Part 3, 3rd ed. pp. 551–601. Madison, WI: Soil Sci. Soc. Amer. 5.
Hemantaranjan, A., A.N. Bhanu, M.N. Singh, D.K. Yadav, P.K. Patel, R. Singh and D. Katiyar. 2014. Heat stress responses and thermotolerance. Adv. Plants Agric. Res. 1 (3): 00012. doi: 10.15406/apar.2014.01.00012
Hlaváčová, M., K. Klem, P. Smutná, P. Škarpa, P. Hlavinka, K. Novotná, B. Rapantová and M. Trnka. 2017. Effect of heat stress at anthesis on yield formation in winter wheat. Plant Soil Environ. 63: (3) 139-144. doi: 10.17221/73/2017-PSE.
Hosseini, S.A., M.R. Hajirezaei, C. Seiler, N. Sreenivasulu and N. von Wirén. 2016. A potential role of flag leaf potassium in conferring tolerance to drought-induced leaf senescence in barley. Front. Plant Sci. 7: 206. doi: 10.3389/fpls.2016.00206.
191

Hu, L., Z. Zhang, Z. Xiang and Z. Yang. 2016. Exogenous application of citric acid ameliorates the adverse effect of heat stress in tall fescue (Lolium arundinaceum). Front. Plant Sci. 7: 179. doi: 10.3389/fpls.2016.00179.
Huang, Y., J. Huang, Y. Song and H. Liu. 2017. Use of selenium to alleviate naphthalene induced oxidative stress in Trifolium repens L. Ecotoxicol. Environ. Saf. 143: 1-5.
Hunt, R. 1978. Plant growth analysis. Edward Arnold. U.K. pp. 26-38. Ihsan, M.Z., F.S. El-Nakhlawy, S.M. Ismail, S. Fahad and I. Daur. 2016. Wheat phenological
development and growth studies as affected by drought and late season high temperature stress under arid environment. Front. Plant Sci. 7: 795. doi: 10.3389/fpls.2016.00795.
Innes, P.J., D.K.Y. Tan, F.V. Ogtrop and J.S. Amthor. 2015. Effects of high-temperature episodes on wheat yields in New South Wales, Australia. Agric. For. Meteorol. 208: 95-107.
IPCC (Intergovernmental Panel on Climate Change). 2014. Technical summary of climate change 2014: Mitigation of climate change. Working group III contribution to the IPCC fifth assessment report (AR5).
Iqbal, M. N.I. Raja, F. Yasmeen, M. Hussain, M. Ejaz and M.A. Shah. 2017. Impacts of heat stress on wheat: a critical review. Adv. Crop Sci. Technol. 5: 251. doi: 10.4172/2329-8863.1000251.
Iqbal, M., I. Hussain, H. Liaqat, M.A. Ashraf, R. Rasheed and A.U. Rehman. 2015. Exogenously applied selenium reduces oxidative stress and induces heat tolerance in spring wheat. Plant Physiol. Biochem. 94: 95-103.
Jackson, M. L. 1962. Soil chemical analysis. Englewood Cliffs, NJ: Prentice Hall Inc.Jacoby, R.P., A.H. Millar and N.L. Taylor. 2016. Opportunities for wheat proteomics to
discover the biomarkers for respiration-dependent biomass production, stress tolerance and cytoplasmic male sterility. J Proteom. 143: 36-44.
Jain, M. 2013. Emerging role of metabolic pathways in abiotic stress tolerance. Plant Biochem. Physiol. 1: 1-2.
Jan, A.U., F. Hadi, Midrarullah, M.A. Nawaz and K. Rahman. 2017. Potassium and zinc increase tolerance to salt stress in wheat (Triticum aestivum L.). Plant Physiol. Biochem. 116: 139-149.
Javed, N., M. Ashraf, F.A. Qurainy and N.A. Akram. 2014. Integration of physio-biochemical processes at different phenological stages of wheat (Triticum aestivum l.) plants in response to heat stress. Pak. J. Bot. 46: 2143-2150.
Jiang, C., C. Zu, D. Lu, Q. Zheng, J. Shen, H. Wang and D. Li. 2017. Effect of exogenous selenium supply on photosynthesis, Na+ accumulation and antioxidative capacity of maize (Zea mays L.) under salinity stress. Sci. Rep. 7: 42039. doi: 10.1038/srep42039.
Jiménez-Quesada, M.J., J.Á. Traverso and J.D. Alché. 2016. NADPH oxidase-dependent superoxide production in plant reproductive tissues. Front. Plant Sci. 7: 359. doi: 10.3389/fpls.2016.00359.
Jin, S.H., J.Q. Huang, X.Q. Li, B.S. Zheng, J.S. Wu, Z.J. Wang, G.H. Liu and M. Chen. 2011. Effects of potassium supply on limitations of photosynthesis by mesophyll diffusion conductance in Carya cathayensis L. Tree Physiol. 31: 1142-1151.
Kajla, M., V.K. Yadav, R.S. Chhokar and R.K. Sharma. 2015. Management practices to mitigate the impact of high temperature on wheat. J. Wheat Res. 7: 1-12.
Kamal, M.A., M.F. Saleem, M. Shahid, M. Awais, H.Z. Khan and K. Ahmed. 2017. Ascorbic acid triggered physiochemical transformations at different phenological stages of heat-stressed Bt cotton. J. Agron. Crop Sci. 203: 323-331. https://doi.org/10.1111/jac.12211.
192

Kanai, S., R.E. Moghaieb, H.A. El-Shemy, R. Panigrahi, P.K Mohapatra, J. Ito, N.T. Nguyen, H. Saneoka and K. Fujita. 2011. Potassium deficiency affects water status and photosynthetic rate of the vegetative sink in green house tomato prior to its effects on source activity. Plant Sci. 180: 368-374.
Kaur, N., S. Sharma, S. Kaur and H. Nayyar. 2014. Selenium in agriculture: a nutrient or contaminant for crops? Arch. Agron. Soil Sci. 60: 1593-1624. doi: 10.1080/03650340.2014.918258.
Khaliq, A., M. Zia-ul-Haq, F. Ali, F. Aslam, A. Matloob, A. Navab and S. Hussain. 2015. Salinity tolerance in wheat cultivars is related to enhanced activities of enzymatic antioxidants and reduced lipid peroxidation. Clean Soil Air Water 43: 1115-1266.
Klusonova, I., P. Horky, J. Skladanka, M. Kominkova, D. Hynek, O. Zitka, P. Skarpa, R. Kizek and V. Adam. 2015. An Effect of various selenium forms and doses on antioxidant pathways at clover (Trifolium pratense L.). Int. J. Electrochem. Sci. 10: 9975-9987.
Koehler, P. and Wieser, H. 2013. Chemistry of cereal grains, Chapter 2 In: Gobbetti, M. and M. Ganzle. Handbook on sourdough biotechnology, Publisher Springer. pp. 11-15.
Krishnasamy, K., R. Bell and Q. Ma. 2014. Wheat responses to sodium vary with potassium use efficiency of cultivars. Front. Plant Sci. 5: 631. doi: 10.3389/fpls.2014.00631.
Kuo, S. 1996. Phosphorus. In: D.L. Sparks, A.L. Page, P.A. Helmke, R.H. Loeppert, P.N. Soltanpour, M.A. Tabatabai, C.T. Johnston and M.E. Sumner (Eds.), Methods of soil analysis, Part 3. Chemical methods pp. 869-919. Madison, WI: Soil Sci. Soc. Amer. Book Series, Number 5.
Labanowska, M., M. Filek, J. Koscielniak, M. Kurdziel, E. Kulis and H. Hartikainen. 2012. The effects of short-term selenium stress on Polish and Finnish wheat seedlings-EPR, enzymatic and fluorescence studies. J. Plant Physiol. 169: 275-284.
Laza, M.R.C., H. Sakai, W. Cheng, T. Tokida, S. Peng and T. Hasegawa. 2015. Differential response of rice plants to high night temperatures imposed at varying developmental phases. Agric. For. Meteorol. 209-210: 69-77.
Lemoine R, S. La Camera, R. Atanassova, F. Dédaldéchamp, T. Allario, N. Pourtau, J-L. Bonnemain, M. Laloi, P. Coutos-Thévenot, L. Maurousset, M. Faucher, C. Girousse, P. Lemonnier, J. Parrilla and M. Durand. 2013. Source- to-sink transport of sugar and regulation by environmental factors. Front. Plant Sci. 4: 272. doi:10.3389/fpls.2013. 00272.
Li, Y., Y. Wua, N.H. Espinosa and R.J. Pena. 2013. The influence of drought and heat stress on the expression of end-use quality parameters of common wheat. J. Cereal Sci. 57:73-78.
Lin, L., W. Zhou, H. Dai, F. Cao, G. Zhang and F. Wu. 2012.Selenium reduces cadmium uptake and mitigates cadmium toxicity in rice. J. Hazard. Mater. 235: 343-351.
Liu, B., L. Liu, S. Asseng, X. Zou, J. Li, W. Cao and Y. Zhu. 2016a. Modelling the effects of heat stress on post-heading durations in wheat: A comparison of temperature response routines. Agric. For. Meteorol. 222: 45-58.
Liu, B., S. Asseng, L. Liu, L. Tang, W. Cao and Y. Zhu. 2016b. Testing the responses of four wheat crop models to heat stress at anthesis and grain filling. Global Change Biol. 22: 1890-1903 doi: 10.1111/gcb.13212.
Liu, D., J. Zou, Q. Meng, J. Zou and W. Jiang. 2009. Uptake and accumulation and oxidative stress in garlic (Allium sativum L.) under lead phytotoxicity. Ecotoxicolo. 18: 134-143.
193

Liu, K., B.L. Ma, L. Luan and C. Li. 2011. Nitrogen, phosphorus, and potassium nutrient effects on grain filling and yield of high-yielding summer corn. J. Plant Nutr. 34: 10: 1516-1531. doi: 10.1080/01904167.2011.585208.
Ma, D., D. Sun, C. Wang, H. Ding, H. Qin, J. Hou, X. Huang, Y. Xie and T. Guo. 2017. Physiological responses and yield of wheat plants in zinc-mediated alleviation of drought stress. Front. Plant Sci. 8: 860. doi: 10.3389/fpls.2017.00860.
Mahmood, S., A. Parveen, I. Hussain, S. Javed and M. Iqbal. 2014. Possible involvement of secondary metabolites in the thermotolerance of maize seedlings. Int. J. Agric. Biol. 16: 1075-1082.
Malik, J.A., S. Goel, N. Kaur, S. Sharma, I. Singh and H. Nayyar. 2012. Selenium antagonises the toxic effects of arsenic on mungbean (Phaseolus aureus Roxb.) plants by restricting its uptake and enhancing the antioxidative and detoxification mechanisms. Environ. Exp. Bot. 77: 242-248.
Manaf, H.H. 2016. Beneficial effects of exogenous selenium, glycine betaine and seaweed extract on salt stressed cowpea plant. Ann. Agric. Sci. 61: 41-48.
Marias, D.E., F.C. Meinzer and C. Still. 2017. Impacts of leaf age and heat stress duration on photosynthetic gas exchange and foliar nonstructural carbohydrates in Coffea arabica. Ecol. Evol. 7: 1297-1310. doi: 10.1002/ece3.2681.
Marschner, P. 2012. Marschner’s Mineral Nutrition of Higher Plants, 3rd ed.; Academic Press: London, UK, 2012; pp. 178–189.
Mathur, S., D. Agrawal and A. Jajoo. 2014. Photosynthesis: Response to high temperature stress. J. Photochem. Photobiol. B: Biol. 137: 116-126.
Mattioli, R., M. Biancucci, C. Lonoce, P. Costantino and M. Trovato. 2012. Proline is required for male gametophyte development in arabidopsis. BMC Plant Biol. 12: 236-252.
Mehdi, Y., J.L. Hornick, L. Istasse and I. Dufrasne. 2013. Selenium in the environment, metabolism and involvement in body functions. Molecules 18: 3292-3311. doi:10.3390/molecules18033292.
Moharramnejad, S., O. Sofalian, M. Valizadeh, A.A.M. Shiri. 2015. Proline, glycine betaine, total phenolics and pigment contents in response to osmotic stress in maize seedlings. J. Biosci. Biotechnol. 4: 313-319.
Mondal, S., R.P. Singh, E.R. Mason, J. Huerta-Espino, E. Autrique and A.K. Joshi. 2016. Grain yield, adaptation and progress in breeding for early-maturing and heat-tolerant wheat lines in South Asia. Field Crops Res. 192: 78-85.
Mondal, S., R.P. Singh, J. Crossa, J. Huerta-Espino, I. Sharma, R. Chatrath, G.P. Singh, V.S. Sohu, G.S. Mavi, V.S.P. Sukuru, I.K. Kalappanavar, V.K. Mishra, M. Hussain, N.R. Gautam, J. Uddin, N.C.D. Barma, A. Hakimand and J.K. Joshi. 2013. Earliness in wheat: A key to adaptation under terminal and continual high temperature stress in South Asia. Field Crops Res. 151: 19-26.
Moodie, C. D., N.W. Smithand and R.A. Mcgreery. 1959. Laboratory manual for soil fertility development in corn (Zea mays L.) and subsequent grain yield. Crop Sci. 11: 368-372.
Mora, M.L., P. Durán, A.J. Acuña, P. Cartes, R. Demanet and L. Gianfreda. 2015. Improving selenium status in plant nutrition and quality. J. Soil Sci. Plant Nutr. 15: 486-503.
Mostafa, E.M. and A.M.A. Hassan. 2015. "The ameliorative effect of selenium on Azolla caroliniana grown under UV-B stress." Phytoprotection 951: 20-26. doi: 10.7202/1031954ar.
Mozafariyan, M., M.M. Kamelmanesh and B. Hawrylak-Nowak. 2016. Ameliorative effect of selenium on tomato plants grown under salinity stress, Arch. Agron. Soil Sci. 62:10, 1368-1380. doi: 10.1080/03650340.2016.1149816.
194

Mroczek-Zdyrska, M. and M. Wójcik. 2011. The influence of selenium on root growth and oxidative stress induced by lead in Vicia faba L. minor plants. Biol. Trace Elem. Res. 147: 320-328. http://dx.doi.org/10.1007/s12011-011-9292-6.
Mumtaz, M.Z., M. Aslam, H.M. Nasrullah, M. Akhtar and B. Ali. 2015. Effect of various sowing dates on growth, yield and yield components of different wheat genotypes. Am. Eurasian J. Agric. Environ. Sci. 15: 2230-2234.
Mwadzingeni, L., H. Shimelis, S. Tesfay and T. Tsilo. 2016. Screening of bread wheat genotypes for drought tolerance using phenotypic and proline analyses. Front. Plant. Sci. 7: 1-12. doi: 10.3389/fpls.2016.01276.
Naderi, R., M. Valizadeh, M. Toorchi and M.R. Shakiba. 2014. Antioxidant enzyme changes in response to osmotic stress in wheat (Triticum aestivum L.) seedling. Acta Biol. Szeged. 58: 95-101.
Nawaz, F., M.Y. Ashraf, R. Ahmad, E.A. Waraich and R.N. Shabbir. 2014. Selenium (Se) regulates seedling growth in wheat under drought stress. Adv. Chem. 143567: 1-7. http://dx.doi.org/10.1155/2014/143567.
Nawaz, F., R. Ahmad, M.Y. Ashraf, E.A. Waraich and S.Z. Khan. 2015. Effect of selenium foliar spray on physiological and biochemical processes and chemical constituents of wheat under drought stress. Ecotoxic. Environ. Saf. 113: 191-200.
Naz, F.S., M. Yusuf, T.A. Khan, Q. Fariduddin and A. Ahmad. 2015. Low level of selenium increases the efficacy of 24-epibrassinolide through altered physiological and biochemical traits of Brassica juncea plants. Food Chem. l185: 441-448.
OECD (Organization for Economic Co-operation and Development). 2012. The OECD Environmental Outlook to 2050: The consequences of inaction. Publisher OECD and the PBL Netherlands Environmental Assessment Agency. pp. 1-8.
Oosterhuis, D.M., D.A. Loka and T.B. Raper. 2013. Potassium and stress alleviation: Physiological functions and management of cotton. J. Plant Nutr. Soil Sci. 176: 331-343. doi: 10.1002/jpln.201200414.
Paupière, M.J., A.W. van Heusden and A.G. Bovy. 2014. The metabolic basis of pollen thermo-tolerance: perspectives for breeding. Metabolites 4: 889-920. doi:10.3390/metabo4040889.
Perez, P., A. Alonso, G. Zita, R. Morcuende and R. Martınez-Carrasco. 2011. Downregulation of rubisco activity under combined increases of CO2 and temperature minimized by changes in rubisco kcat in wheat, Plant Growth Regul. 65: 439-447.
Pimentel, A.J.B., J.R.A.S.C. Rocha, M.A. de Souza, G. Ribeiro, C.R. Silva, I. Cristina and M. Oliveira. 2015. Characterization of heat tolerance in wheat cultivars and effects on production components. Rev. Ceres (Impr.). 62: 191-198. http://dx.doi.org/10.1590/0034-737X201562020009.
Prasad, P.V.V., R. Bheemanahalli and S.V. Krishna Jagadish. 2017. Field crops and the fear of heat stress-Opportunities, challenges and future directions. Field Crops Res. 200: 114-121.
Rahman, M.A., M.M. Rahman, M.M. Hasan, F. Begum and M.A.Z. Sarker. 2014. Effects of foliar application of potassium orthophosphate on grain yield and kernel quality of wheeat (Triticum aestivum) under terminal heat stress. Bangladesh J. Agric. Res. 39: 67-77.
Rahut, D.B. and A. Ali. 2017. Coping with climate change and its impact on productivity, income, and poverty: Evidence from the Himalayan region of Pakistan. Int. J. Disaster Risk Reduct. 24: 515-525.
195

Rakszegi, M., A. Lovegrove, K. Balla, L. Láng, Z. Bedo, O. Veisz and P.R. Shewry. 2014. Effect of heat and drought stress on the structure and composition of arabinoxylan and β-glucan in wheat grain. Carbohydr. Polym. 102: 557-565.
Raza, M.A.S., M.F. Saleem and I.H. Khan. 2015. Combined application of glycine betaine and potassium on the nutrient uptake performance of wheat under drought stress. Pak. J. Agric. Sci. 52: 19-26.
Raza, M.A.S., M.F. Saleem, G.M. Shah, I.H. Khan and A. Raza. 2014. Exogenous application of glycine betaine and potassium for improving water relations and grain yield of wheat under drought. J. Soil Sci. Plant Nutr. 14: 348-364.
Reguera, M., Z. Peleg and E. Blumwald. 2012. Targeting metabolic pathways for genetic engineering abiotic stress-tolerance in crops. Biochim. Biophys. Acta 1819: 186-194.
Rehman, A., L. Jingdong, B. Shahzad, A.A. Chandio, I. Hussain, G. Nabi, M.S. Iqbal. 2015. Economic perspectives of major field crops of Pakistan: An empirical study. Pac. Sci. Rev. B: Hum. and Soc. Sci.1: 145-158.
Rehman, S., M. Bilal, R.M. Rana, M.N. Tahir, M.K.N. Shah, H. Ayalew and G. Yan. 2016. Cell membrane stability and chlorophyll content variation in wheat (Triticum aestivum) genotypes under conditions of heat and drought. Crop Pasteur Sci. 67: 712-718. https://doi.org/10.1071/CP15385.
Reynolds, M. and P. Langridge. 2016. Physiological breeding. Curr. Opin. Plant Biol. 31: 162-171.
Rezaei, E.E., H. Webber, T. Gaiser, J. Naab and F. Ewert. 2015. Heat stress in cereals: mechanisms and modelling. Eur. J. Agron. 64: 98-113.
Rhoades, J. D. 1996. Salinity, electrical conductivity and total dissolved solids. In: Sparks, D.L., A.L. Page, P.A. Helmke and R.H. Loeppe. Methods of soil analysis Part 3- Chemical Methods. Soil. Sci. Soc. America. Book Series 5. Madison, Wisconsin, USA. pp. 417-435 doi:10.2136/ sssabookser5.3.
Ruan, L., J. Zhang, X. Xin, C. Zhang, D. Ma, L. Chen and B. Zhao.2015. Comparative analysis of potassium deficiency-responsive transcriptomes in low potassium susceptible and tolerant wheat (Triticum aestivum L.). Sci. Rep. 5: 10090. doi: 10.1038/srep10090.
Ryan, J., G. Estefan and A. Rashid. 2001. Soil and plant analysis laboratory manual . 2nd ed. International Center for Agriculture Research in the Dry Areas (ICARDA), Allepo, Syria.
Sadat, S., K.A. Saeid and M.R. Bihamta. 2013. Marker assisted selection for heat tolerance in bread wheat. World Appl. Sc. J. 21: 1181-1189.
Saleem, M.F., M.A.S. Raza, S. Ahmad, I.H. Khan and A.M. Shahid. 2016. Understanding and mitigating the impacts of drought stress in cotton- a review. Pak. J. Agric. Sci. 53: 609-623.
Savicka, M. and N. Skute. 2010. Effects of high temperature on malondialdehyde content, superoxide production and growth changes in wheat seedlings (Triticum aestivum L.). Ekologija 56: 26-33.
Scholander, P.F., H.T. Hammel, E.A. Hemmingsen and E.D. Bradstreet. 1964. Hydrolytic pressure and osmotic potential in leaves of mangroves and some other plants. Proceedings of the national academy of sciences, USA. 52: 119-125.
Shabbir, R.N., M.Y. Ashraf, E.A. Waraich, R. Ahmad and M. Shahbaz. 2015. Combined effects of drought stress and npk foliar spray on growth, physiological processes and nutrient uptake in wheat. Pak. J. Bot. 47: 1207-1216.
196

Shahid, M., M.F. Saleem, S.A. Anjum, M. Shahid and I. Afzal. 2017. Effect of terminal heat stress on proline, secondary metabolites and yield components of wheat (Triticum aestivum L.) genotypes. Philipp. Agric. Sci. 100 (3). 278-286.
Sharma, D.K., J.O. Fernandez, E. Rosenqvist, C.O. Ottosen and S.B. Andersen. 2014a. Genotypic response of detached leaves versus intact plants for chlorophyll fluorescence parameters under high temperature stress in wheat. J. Plant Physiol. 171: 576-586.
Sharma, S., R. Goyal and U.S. Sadana. 2014b. Selenium accumulation and antioxidant status of rice plants grown on seleniferous soil from northwestern India. Rice Sci. 21: 327-334. doi: 10.1016/S1672-6308(14)60270-5.
Sharma, T., I. Dreyer and J. Riedelsberger. 2013. The role of K+ channels in uptake and redistribution of potassium in the model plant Arabidopsis thaliana. Front. Plant Sci. 4: 224 doi: 10.3389/fpls.2013.00224.
Shekari, F., A. Abbasi and S.H. Mustafavi. 2015. Effect of silicon and selenium on enzymatic changes and productivity of dill in saline condition. J. Saudi Soc. Agric. Sci. http://dx.doi.org/10.1016/j.jssas.2015.11.006.
Shin, R. 2017. Potassium sensing, signaling, and transport: toward improved potassium use efficiency in plants. In: Plant macronutrient use efficiency. Molecular and genomic perspectives in crop plants. Chapter 8. 1st edition, Publisher Elsevier pp. 149-163.
Siebert, S. and F. Ewert. 2014. Future crop production threatened by extreme heat. Environ. Res. Lett. 9: 1-4.
Sieprawska, A., A. Kornaś and M. Filek. 2015. Involvement of selenium in protective mechanisms of plants under environmental stress conditions – review. Acta Biol. Cracov. Ser. Bot. 57: 9-20. doi: 10.1515/abcsb-2015-0014.
Slafer, G.A., M. Elia, R. Savin, G.A. García, I.I. Terrile, A. Ferrante, D.J. Miralles and F.G. González. 2015. Fruiting efficiency: an alternative trait to further rise wheat yield. Food Ener. Secur. 4: 92-109.
Steel, R.G.D., J.H. Torrie and D. Dickey. 1997. Principles and procedures of statistics, a biometrical approach, 3rd ed. McGraw Hill Book Co. Inc. New York. pp. 352-358.
Stratonovitch, P. and M.A. Semenov. 2015. Heat tolerance around flowering in wheat identified as a key trait for increased yield potential in Europe under climate change. J. Exp. Bot. 66: 3599-3609. doi:10.1093/jxb/erv070.
Suryavanshi P. and G.S. Buttar. 2016. Mitigating terminal heat stress in wheat. Int. J. Bioresour. Stress Manag. 7 (1): 142-150. doi: 10.5958/0976-4038.2016.00023.3.
Suryavanshi, P., G.S. Buttar and A.S. Brar. 2016. Effect of osmoprotectants on performance of wheat (Triticum aestivum) under terminal heat stress condition of North-West India. Ind. J. Agric. Sci. 86: 1037-1042.
Szymańska, R., I. Ślesak, A. Orzechowska and J. Kruk. 2017. Physiological and biochemical responses to high light and temperature stress in plants. Environ. Exp. Bot. 139: 165-177.
Talukder, A.S.M.H.M., K. Glenn, McDonald and G.S. Gill. 2014. Effect of short-term heat stress prior to flowering and early grain set on the grain yield of wheat. Field Crops Res. 160: 54-63.
Tao, F., Z. Zhang, S. Zhang and R.P. Rotter. 2015. Heat stress impacts on wheat growth and yield were reduced in the Huang-Huai-Hai Plain of China in the past three decades. Europ. J. Agron. 71: 44-52.
Tedeschini, E., P. Proietti, V. Timorato, R. D’Amato, L. Nasini, D.D. Buono, D. Businelli and G. Frenguelli. 2015. Selenium as stressor and antioxidant affects pollen performance in Olea europaea. Flora 215: 16-22.
197

Thomas, G. W. (1996). Soil pH and soil acidity. In: Sparks, D.L., Page, A.L., Helmke, P.A. and Loeppe, R.H. Methods of soil analysis Part 3- Chemical Methods. Soil. Sci. Soc. America. Book Series 5. Madison, Wisconsin, USA. pp. 475-490 doi:10.2136/sssabookser5.3.
Trnka, M., R.P. Rotter, M. Ruiz-Ramos, K.C. Kersebaum, J.E. Olesen, Z. Zalud and M.A. Semenov. 2014. Adverse weather conditions for European wheat production will become more frequent with climate change. Nat. Clim. Change 4: 637-643.
Van Deynze, A., K. Stoffel, M. Lee, K.A. Wilkins, A. Kozik, R.G. Cantrell, J.Z. Yu, R.J. Kohel and D.M. Stelly. 2009. Sampling nucleotide diversity in cotton. BMC Plant Biol. 9:125.
Van Esbroeck, G.A., D.T. Bowman, D.S. Calhoun and O.L. May. 1998. Changes in the genetic diversity of cotton in the USA from 1970 to 1995. Crop Sci. 38: 33-37. doi:10.2135/cropsci1998.0011183X003800010006x.
Vimal, S.R., J.S. Singh, N.K. Arora and S. Singh. 2017. Soil-Plant-microbe interactions in stressed agriculture management: a review. Pedosphere 27: 177-192.
Wang, C., D. Wen, A. Sun, X. Han, J. Zhang, Z. Wang and Y. Yin. 2014. Differential activity and expression of antioxidant enzymes and alteration in osmolyte accumulation under high temperature stress in wheat seedlings. J. Cereal Sci. 60: 653-659.
Wang, M., Q. Zheng, Q. Shen and S. Guo. 2013. The critical role of potassium in plant stress response. Int. J. Mol. Sci. 14: 7370-7390. doi:10.3390/ijms14047370.
Wang, X., B.S. Dinler, M. Vignjevic, S. Jacobsen and B. Wollenweber. 2015. Physiological and proteome studies of responses to heat stress during grain filling in contrasting wheat cultivars. Plant Sci. 230: 33-50.
Wang, X., J. Cai, F. Liu, M. Jin, H. Yu, D. Jiang, B. Wollenweber, T. Dai and W. Cao. 2012. Pre-anthesis high temperature acclimation alleviates the negative effects of post-anthesis heat stress on stem stored carbohydrates remobilization and grain starch accumulation in wheat. J. Cereal Sci. 55: 331-336.
Wang. Y. and W.H. Wu. 2017. Regulation of potassium transport and signaling in plants. Curr. Opin. Plant Biol. 39: 123-128.
Waraich, E.A., R. Ahmad, A. Halim and T. Aziz. 2012. Alleviation of temperature stress by nutrient management in crop plants: a review. J. Soil Sci. Plant Nutr. 12: 221-244.
Wasaya, A., M.S. Shabir, M. Hussain, M. Ansar, A. Aziz, W. Hassan and I. Ahmad. 2017. Foliar application of zinc and boron improved the productivity and net returns of maize grown under rainfed conditions of Pothwar plateau. J. Soil Sci. Plant Nutr. 17: 33-45.
Wei, J., C. Li, Y. Li, G. Jiang, G. Cheng and Y. Zheng. 2013. Effects of external potassium (K) supply on drought tolerances of two contrasting winter wheat cultivars. PLoS ONE 8: e69737. doi: 10.1371/journal.pone.0069737.
Winkel, L.H.E., B. Vriens, G.D. Jones, L.S. Schneider, E. Pilon-Smits and G.S. Bañuelos. 2015. Selenium cycling across soil-plant-atmosphere interfaces: a critical review. Nutrients 7: 4199-4239. doi:10.3390/nu7064199.
Wolde, T., F. Eticha, S. Alamerew, E. Assefa, D. Dutamo and B. Mecha. 2016. Trait associations in some durum wheat (Triticum durum L.) accessions among yield and yield related traits at Kulumsa, South Eastern Ethiopia. Adv. Crop Sci. Tech. 4: 234. doi:10.4172/2329-8863.1000234.
Wormuth, D., I. Heiber, J. Shaikali, A. Kandlbinder, M. Baier and K.J. Dietz. 2007. Redox regulation and antioxidative defence in Arabidopsis leaves viewed from a systems biology perspective. J. Biotechnol. 129: 229-248.
198

Xiaokang, L., T. Li, X. Wen, Y. Liao and Y. Liu. 2017. Effect of potassium foliage application post-anthesis on grain filling of wheat under drought stress. Field Crops Res. 206: 95-105.
Yamauchi, N. 2015. Postharvest chlorophyll degradation and oxidative stress. In: Kanayama Y. and A. Kochetov. (eds). Abiotic stress biology in horticultural plants. Springer, Tokyo. pp 101-113.
Yao, X.Q., J. Chu, X. He and C. Ba. 2011. Protective role of selenium in wheat seedlings subjected to enhanced UV-B radiation. Russ. J. Plant Physiol. 58: 283-289.
Yildiztugay, E., C. Ozfidan-Konakci, M. Kucukoduk and S.A. Tekis. 2017. The impact of selenium application on enzymatic and non-enzymatic antioxidant systems in Zea mays roots treated with combined osmotic and heat stress. Arch. Agron. Soil Sci. 63: 261-275. doi: 10.1080/03650340.2016.1201810.
Zahoor, R., H. Dong, M. Abid, W. Zhao, Y. Wang and Z. Zhou. 2017b. Potassium fertilizer improves drought stress alleviation potential in cotton by enhancing photosynthesis and carbohydrate metabolism. Environ. Exp. Bot. 137: 73-83.
Zahoor, R., W. Zhao, H. Dong, J.L. Snider, M. Abid, B. Iqbal and Z. Zhou. 2017c. Potassium improves photosynthetic tolerance to and recovery from episodic drought stress in functional leaves of cotton (Gossypium hirsutum L.). Plant Physiol. Biochem. 119: 21-32.
Zahoor, R., W. Zhao, M. Abid, H. Dong and Z. Zhou. 2017a. Potassium application regulates nitrogen metabolism and osmotic adjustment in cotton (Gossypium hirsutum L.) functional leaf under drought stress. J. Plant Physiol. 215: 30-38.
Zain, N.A.M. and M.R. Ismail. 2016. Effects of potassium rates and types on growth, leaf gas exchange and biochemical changes in rice (Oryza sativa) planted under cyclic water stress. Agric. Water Manag. 164: 83-90.
Zareian, A., H.H.S. Abad, A. Hamidi, G.N. Mohammadi and S.A. Tabatabaei. 2013. Effect of drought stress and potassium foliar application on some physiological indices of three wheat (Triticum aestivum L.) cultivars. Ann. Biol. Res. 4: 71-74.
Zorb, C., M. Senbayram and E. Peiter. 2014. Potassium in agriculture – Status and perspectives. J. Plant Physiol. 171: 656-669.
199