by Geography · 2020-01-01 · Geography A County by County Analysis of the Road to Execution in...
28
by Geography A County by County Analysis of the Road to Execution in California A report by the ACLU of Northern California
Transcript of by Geography · 2020-01-01 · Geography A County by County Analysis of the Road to Execution in...

byGeography
A County by County Analysis of the
Road to Execution in California
A report by the ACLU of Northern California

Table of Contents
1 Executive Summary 3 Analysis of Data 9 Fact Sheets
County Death Sentences, 2000-2007 Alameda Contra Costa Kern Los Angeles Orange Riverside Sacramento San Bernardino San Diego San Francisco San Mateo Santa Barbara Santa Clara Tulare Ventura
26 About the Data Author: Romy Ganschow Research Assistant: Lauren Cohen Editors: Elise Banducci, Jeff Gillenkirk, and Natasha Minsker

1
Executive Summary California’s death penalty is arbitrary, unnecessary and a waste of critical resources. While the vast majority of California counties have largely abandoned execution in favor of simply sentencing people to die in prison, 10 counties continue to aggressively sentence people to execution, accounting for nearly 85 percent of death sentences since 2000. California’s death penalty has become so arbitrary that the county border, not the facts of the case, determines who is sentenced to execution and who is simply sentenced to die in prison. Pursuing executions provides no identifiable benefit to these counties but costs millions. California’s Death Penalty is Arbitrary The 10 counties that send the most people to death row – Los Angeles, Riverside, San Bernardino, Alameda, Orange, Contra Costa, San Diego, Sacramento, Tulare, and Ventura counties – have little else in common. These 10 counties also share important qualities with the counties that rarely send people to death row. Factors such as homicide rates, population densities and voting patterns do not correlate with death sentencing. For example:
• A resident of Alameda County is nearly eight times more likely to be sentenced to death than a resident of nearby Santa Clara County, despite similar demographics;
• A person charged with murder in Tulare County is 13 times more likely to be
sentenced to execution then someone in neighboring Fresno. California’s Death Penalty is Unnecessary Seeking execution provides no benefit in terms of reduced crime or higher rates of solving crime to the counties that continue to send many people to death row. For example:
• The four counties that solve the most homicides rarely sentence people to execution;
• Only five of the 10 counties most aggressive in sentencing people to execution
solved more than 50 percent of all homicides in their counties in 2005.
2
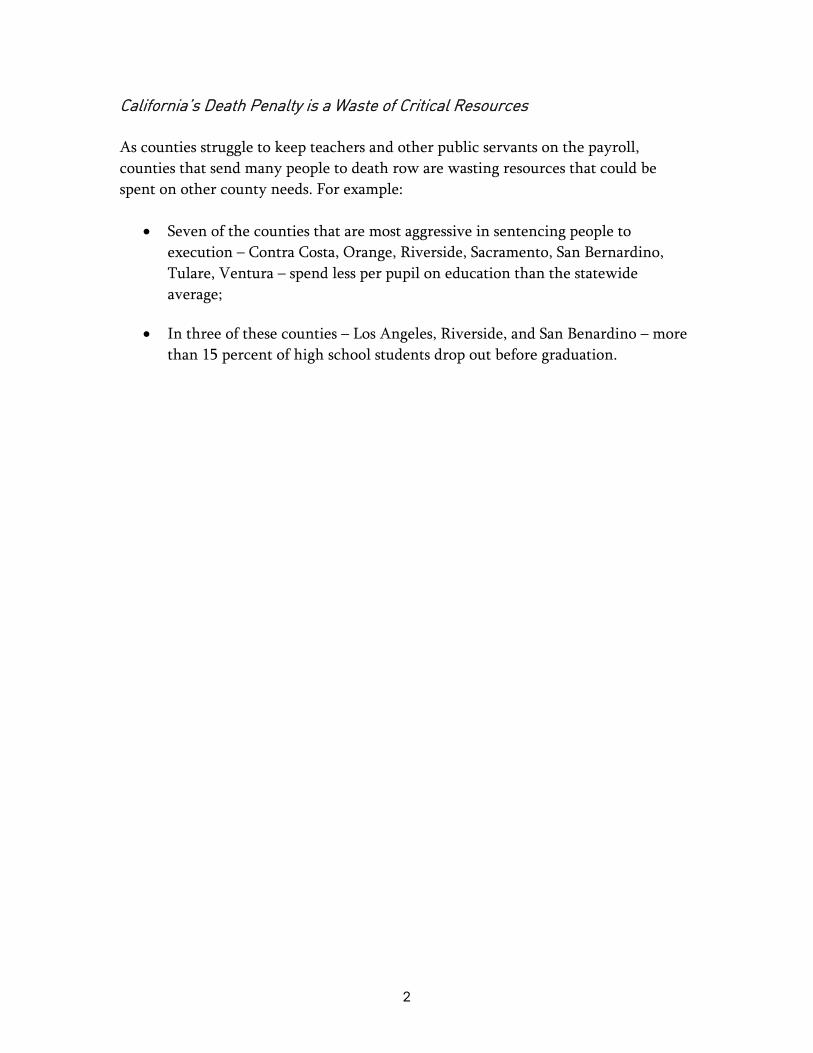
California’s Death Penalty is a Waste of Critical Resources As counties struggle to keep teachers and other public servants on the payroll, counties that send many people to death row are wasting resources that could be spent on other county needs. For example:
• Seven of the counties that are most aggressive in sentencing people to execution – Contra Costa, Orange, Riverside, Sacramento, San Bernardino, Tulare, Ventura – spend less per pupil on education than the statewide average;
• In three of these counties – Los Angeles, Riverside, and San Benardino – more
than 15 percent of high school students drop out before graduation.

3
Analysis of Data California’s Death Penalty is Arbitrary The decision by the state to execute a human being is perhaps the most important decision a government can make. It is a decision that should be made logically and based on the facts of the case, and on a common set of sentencing criteria applied consistently throughout the state. But in California, whether someone is sentenced to death by execution or death in prison by other causes depends largely on where in the state the crime occurred, not on the facts or common criteria. Only a small number of California counties regularly sentence people to execution while a large majority of counties do not. As a result, the county border has become the dividing line between those sentenced to execution and those sentenced to permanent incarceration. A close examination of California’s 24 largest counties reveals just how arbitrarily the death penalty is applied in this state. There has been a dramatic decrease in death sentencing statewide since 2000. However, a select few counties continue to aggressively send people to death row. From 1977-1999, 10 counties accounted for more than 70 percent of all death sentences. Since 2000, these 10 counties accounted for 83 percent of all death sentences. While death sentencing rates have declined statewide, they have done so at a lower rate on average in these 10 counties, all of which sent five or more people to death row since 2000. These 10 counties have little else in common. The counties that sentence the most people to execution share as much or more with counties that do not pursue execution or do so rarely. Based on the demographics, crime rates, and voting patterns of these counties on criminal justice initiatives, there is no logical reason why these 10 counties would send people to death row while their neighbors would not. Counties that are aggressive in death sentencing are in both the northern and southern parts of the state, inland and coastal regions. They represent counties that have liberal and conservative views on criminal justice. The counties are both densely and sparsely populated. They have both high and low homicide rates, and high and low rates of solving homicides. Counties that sentence people to execution less frequently exhibit all of these same characteristics.

4
For example:
• Santa Clara has a larger population than Sacramento, but the two counties have similar population densities. Sacramento sentences almost five times as many people to execution per capita as does Santa Clara.
• Riverside and Tulare sentence people to execution at the highest rates
per capita of any county in the state, but the two counties have little else in common. Riverside is four times larger in population and one- and-a-half times larger in geographic size. One-fifth of Tulare’s residents live below the poverty line, where as close to one-tenth of Riverside’s population does. Tulare’s homicide rate is more than twice as high.
• An individual in Alameda is six times more likely to be sentenced to
execution than someone in San Mateo, across the San Francisco Bay. Both counties voted against Proposition 21, a ballot measure that increased crimes eligible for the death penalty, at rates far greater than the statewide voting population. The populations of both counties are relatively well educated and have lower than average rates of poverty.
California’s Death Penalty is Unnecessary There is no correlation between the homicide rates in California counties and how aggressive the county is in sentencing people to execution. The chart on the following page demonstrates that the 10 counties that have sent the most people to death row since 2000 vary widely in homicide rates, as measured by the number of homicides for every 100,000 residents. The homicide rates in some of these counties, such as Tulare and Los Angeles, are far greater than the statewide average, and in others, such as Orange and San Diego, are less than half the statewide average.

5
Homicide Rates, 2005
0
2
4
6
8
10
12
14
Alameda County
Contra Costa County
Los Angeles County
Orange County
Riverside County
Sacramento County
San Bernard
ino County
San Diego County
Tulare County
Ventura County
State Average
6.8
Counties with Five or More Death Sentences Since 2000
Homicides per 100,000 Population
High death sentencing rates cannot be explained by high homicide rates, as four of the 10 most aggressive counties have comparatively low homicide rates. At the same time, aggressively sentencing people to execution does not result in a lower homicide rate for the county: Five aggressive counties have higher homicide rates than neighboring counties that rarely send people to death row. When we consider the fact that 59 people have died on death row awaiting execution, more than four times the number that have actually been executed, it is clear that sentencing people to execution is simply unnecessary.
• Tulare, Los Angeles, San Bernardino, Alameda, Sacramento, and Contra Costa counties have murder rates higher than the statewide average and actively sentence people to execution. These six counties account for nearly one-half of all death sentences since 2000.
• Riverside, Ventura, San Diego, and Orange have lower than average
homicide rates. These counties are responsible for nearly one-third of all death sentences since 2000.
• The remaining fraction of death sentences, accounting for about 15
percent of all, come from counties with high homicide rates, including Fresno, Kern and Merced, and from counties with low homicide rates, including Monterey, Santa Barbara and Santa Clara.
• Ventura and San Mateo both experience low homicide rates, yet six
percent of the murders prosecuted by Ventura end in a sentence of

6
death by execution, whereas one percent of San Mateo’s prosecutions result in the death penalty.
• By contrast, Alameda and Fresno both have higher-than-average
homicide rates, yet nine times as many homicide prosecutions in Alameda result in a death sentence compared with Fresno.
The chart below demonstrates that counties that send people to death row have both higher than average and lower than average rates of solving homicides. The “percentage of homicides solved” measures the number of reported homicides that are in fact solved within a given year. The four counties with the highest rate of solving homicides rarely impose execution. Only five of the 10 most aggressive counties solved more than 50 percent of all homicides in 2005. The 10 counties that sent the most people to death row since 2000 appear in red in the following chart.
Percentage of Homicides Solved, 2005
0
20
40
60
80
100
120
140
Santa Cruz
Sonoma
Santa Clara
Santa Barbara
Orange
Stanislaus
Ventura
San Diego
Sacramento
Fresn
o
Solano
Riversi
de
Merced
San Bern
ardino
San Luis Obispo
Tulare
San Mateo
Los Angeles
Monterey
Kern
San Francis
co
Contra
Costa
Marin
Alameda
State Average
49.9
Percentageof
Homicides Solved
Counties

7
California’s Death Penalty is a Waste of Resources Counties that rarely send people to death row experience the same variety of homicide rates and the same variety of rates of solving homicides. But these counties do save millions of dollars every time they choose to sentence someone to permanent imprisonment rather than death by execution, money that can be spent on other critical county needs. The high death-sentencing counties, in contrast, waste millions seeking execution, a choice that has not provided the communities with any proven benefits to public safety. It is difficult to know exactly how much each county wastes on death penalty trials because no government agency tracks these expenses. In fact, no government agency even tracks the number of death penalty trials that occur each year. While the number of actual death sentences in each county is known, the number of costly death penalty trials that resulted in a lesser sentence is not. Being conservative, we have estimated that each sentence of execution costs the county at least $1.1 million more than death in prison from other causes.
• Five counties – Los Angeles, Riverside, San Bernardino, Alameda, and Orange – have wasted an estimated $10 million or more each seeking death sentences since 2000.
• Since 2000, Riverside sentenced 20 people to execution, costing the
county at least $22.2 million above and beyond what it would have cost to simply sentence them to die in prison from other causes.
• The $22.2 million wasted during that eight-year period could have paid
the salaries of 49 experienced teachers or 46 new homicide investigators. Riverside ranks 23rd out of 24 counties on education expenditures, per pupil, and solved just over 50 percent of homicides in 2005.
• In three of the five counties – Orange, San Bernardino, and Riverside --
public schools also spent less than the state average on educating their students.
• Three of the five counties – Los Angeles, San Bernardino and Alameda
– suffered from higher than average homicide rates and solved no more than half of all homicides in 2005.

8
Riverside County: What Can A County Get for $22 Million?
0
10
20
30
40
50
60
PersonsSentenced to
Execution Since2000 (20)
TeachersEmployed per
Year (49)
HomicideInvestigatorsEmployed per
Year (46)
Fact Sheets The next page ranks the 24 most populous counties by three measures of death sentencing: actual death sentences, death sentences per capita and death sentences per murder charged. Following the rankings is a close examination of 15 of these counties, including the 10 that have sentenced five or more people to death row since 2000, and five others that have sentenced fewer. The sheets compare information about the counties’ death sentencing practices, homicide rates, homicide clearance rates and spending on public programs. Finally, the money wasted on executions is calculated for each county, and the sacrifices to public spending are highlighted.
9
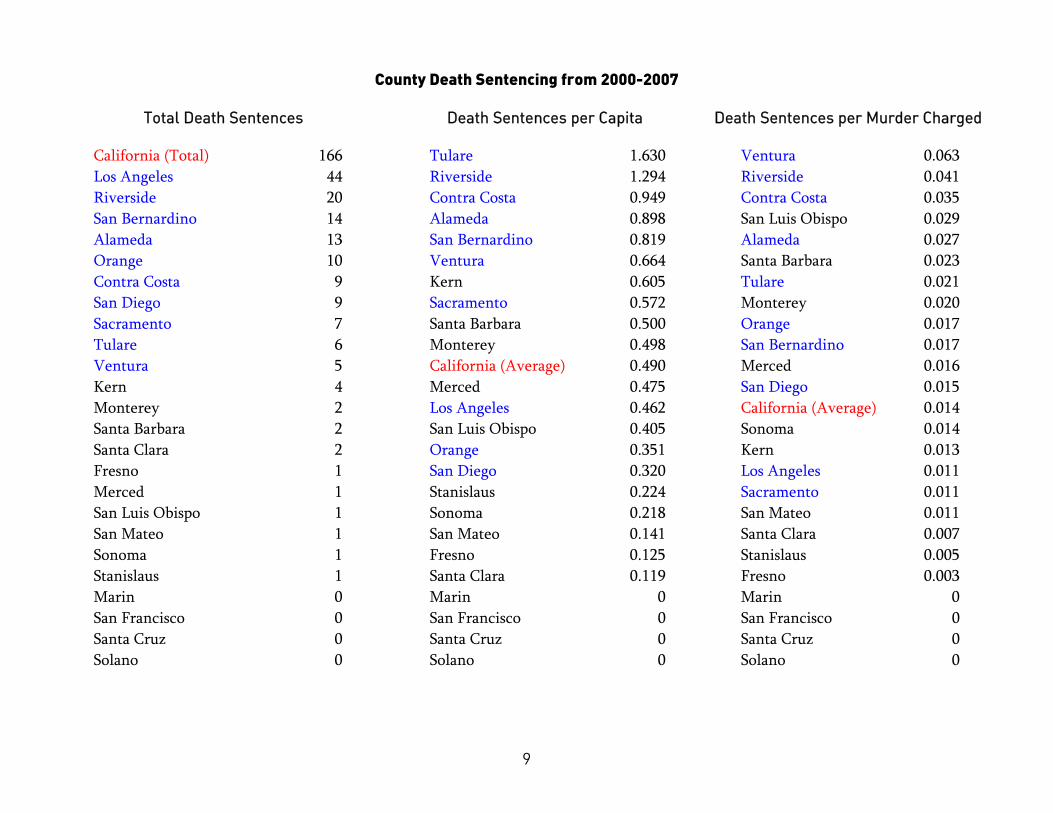
County Death Sentencing from 2000-2007
Total Death Sentences Death Sentences per Capita Death Sentences per Murder Charged
California (Total) 166 Tulare 1.630 Ventura 0.063Los Angeles 44 Riverside 1.294 Riverside 0.041Riverside 20 Contra Costa 0.949 Contra Costa 0.035San Bernardino 14 Alameda 0.898 San Luis Obispo 0.029Alameda 13 San Bernardino 0.819 Alameda 0.027Orange 10 Ventura 0.664 Santa Barbara 0.023Contra Costa 9 Kern 0.605 Tulare 0.021San Diego 9 Sacramento 0.572 Monterey 0.020Sacramento 7 Santa Barbara 0.500 Orange 0.017Tulare 6 Monterey 0.498 San Bernardino 0.017Ventura 5 California (Average) 0.490 Merced 0.016Kern 4 Merced 0.475 San Diego 0.015Monterey 2 Los Angeles 0.462 California (Average) 0.014Santa Barbara 2 San Luis Obispo 0.405 Sonoma 0.014Santa Clara 2 Orange 0.351 Kern 0.013Fresno 1 San Diego 0.320 Los Angeles 0.011Merced 1 Stanislaus 0.224 Sacramento 0.011San Luis Obispo 1 Sonoma 0.218 San Mateo 0.011San Mateo 1 San Mateo 0.141 Santa Clara 0.007Sonoma 1 Fresno 0.125 Stanislaus 0.005Stanislaus 1 Santa Clara 0.119 Fresno 0.003Marin 0 Marin 0 Marin 0San Francisco 0 San Francisco 0 San Francisco 0Santa Cruz 0 Santa Cruz 0 Santa Cruz 0Solano 0 Solano 0 Solano 0
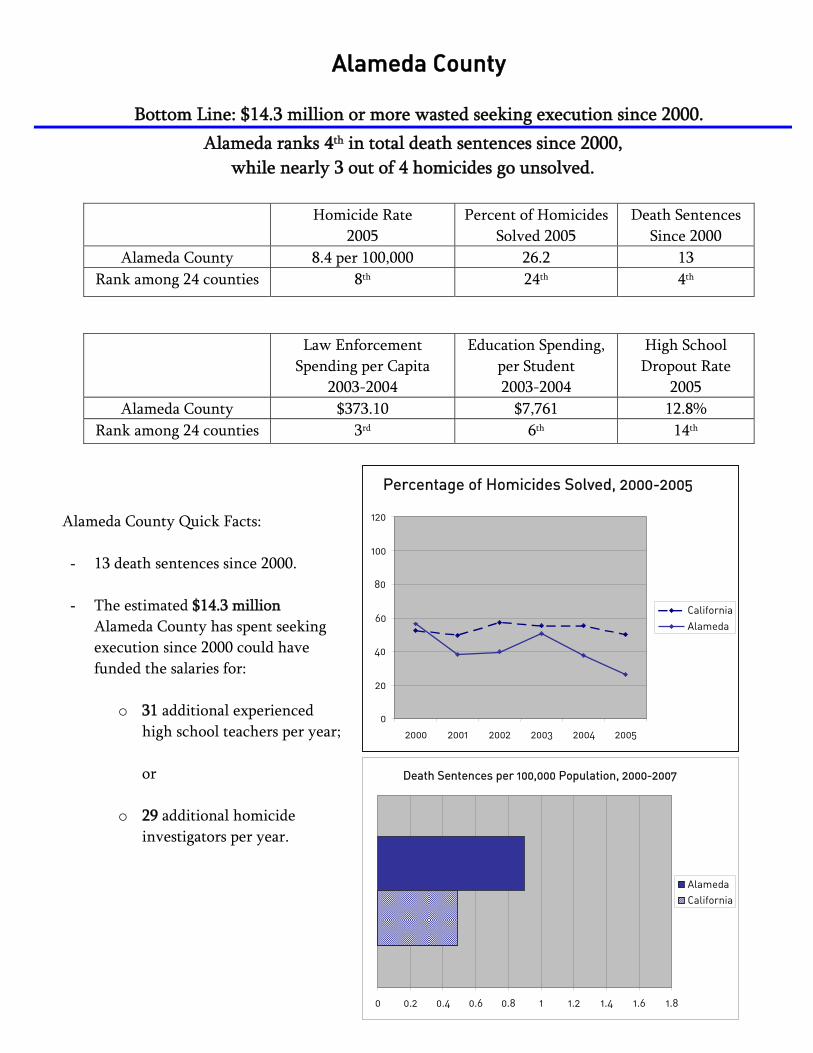
Alameda County
Bottom Line: $14.3 million or more wasted seeking execution since 2000. Alameda ranks 4th in total death sentences since 2000,
while nearly 3 out of 4 homicides go unsolved.
Law Enforcement Spending per Capita
2003-2004
Education Spending, per Student 2003-2004
High School Dropout Rate
2005 Alameda County $373.10 $7,761 12.8%
Rank among 24 counties 3rd 6th 14th
Homicide Rate 2005
Percent of Homicides Solved 2005
Death Sentences Since 2000
Alameda County 8.4 per 100,000 26.2 13 Rank among 24 counties 8th 24th 4th
Death Sentences per 100,000 Population, 2000-2007
0 0.2 0.4 0.6 0.8 1 1.2 1.4 1.6 1.8
AlamedaCalifornia
Percentage of Homicides Solved, 2000-2005
0
20
40
60
80
100
120
2000 2001 2002 2003 2004 2005
CaliforniaAlameda
Alameda County Quick Facts: - 13 death sentences since 2000. - The estimated $14.3 million
Alameda County has spent seeking execution since 2000 could have funded the salaries for:
o 31 additional experienced
high school teachers per year;
or
o 29 additional homicide investigators per year.

Contra Costa County
Bottom Line: $9.9 million or more wasted seeking execution since 2000. Contra Costa’s homicide rate has been rising, despite the high number of death sentences, while nearly two-thirds of homicides go unsolved.
Law Enforcement Spending per Capita
2003-2004
Education Spending per Student 2003-2004
High School Dropout Rate
2005 Contra Costa County $247.74 $7,306 9.3%
Rank among 24 counties 17th 15th 17th
Homicide Rate 2005
Percent of Homicides Solved, 2005
Death Sentences Since 2000
Contra Costa County 7.8 per 100,000 35 9 Rank among 24 counties 10th 22nd 6th
Death Sentences per Murder Charged, 2000-2007
0 0.01 0.02 0.03 0.04 0.05 0.06 0.07 0.08
Contra CostaCalifornia
Percentage of Homicides Solved, 2000-2005
0
20
40
60
80
100
120
2000 2001 2002 2003 2004 2005
CaliforniaContra Costa
Contra Costa County Quick Facts: - 9 death sentences since 2000. - The estimated $9.9 million Contra
Costa County has spent seeking execution since 2000 could have funded the salaries for:
o 22 additional experienced
high school teachers per year;
or
o 21 additional homicide investigators per year.

Kern County
Bottom Line: $4.4 million or more wasted seeking execution since 2000. Kern has sentenced 4 people to execution, ranking 7th per capita. It has the
4th highest homicide rate and 5th highest school dropout rate.
Law Enforcement Spending per Capita
2003-2004
Education Spending per Student 2003-2004
High School Dropout Rate
2005 Kern County $196.18 $7,527 16.7%
Rank among 24 counties 22nd 9th 5th
Homicide Rate 2005
Percent of Homicides Solved 2005
Death Sentences Since 2000
Kern County 9 per 100,000 37.7 4 Rank among 24 counties 4th 20th 11th
Death Sentences per 100,000 Population, 2000-2007
0 0.2 0.4 0.6 0.8 1 1.2 1.4 1.6 1.8
Kern
California
Percentage of Homicides Solved, 2000-2005
0
20
40
60
80
100
120
2000 2001 2002 2003 2004 2005
California
Kern
Kern County Quick Facts: - 4 death sentences since 2000. - The estimated $4.4 million Kern
County has spent seeking execution since 2000 could have funded the salaries for:
o 10 additional experienced
high school teachers per year;
or o 9 additional homicide
investigators per year.

Los Angeles County
Bottom Line: $48.4 million or more wasted seeking execution since 2000. Los Angeles has the 3rd highest homicide rate. It leads the state in
law enforcement spending and total death sentencing.
Law Enforcement Spending per Capita
2003-2004
Education Spending per Student 2003-2004
High School Dropout Rate
2005 Los Angeles County $403.51 $7,891 17.3%
Rank among 24 counties 1st 4th 4th
Homicide Rate 2005
Percent of Homicides Solved 2005
Death Sentences Since 2000
Los Angeles County 10.4 per 100,000 43.6 44 Rank among 24 counties 3rd 18th 1st
Share of Total Death Sentences, 2000-2007
All Other Counties122 death sentences
Los Angeles 44 death
sentences
Percentage of Homicides Solved, 2000-2005
0
20
40
60
80
100
120
2000 2001 2002 2003 2004 2005
California
Los Angeles
Los Angeles County Quick Facts: - 44 death sentences since 2000. - The estimated $48.4 million Los
Angeles County has spent seeking execution since 2000 could have funded the salaries for:
o 107 additional experienced
high school teachers per year;
or
o 101 additional homicide investigators per year.

Orange County
Bottom Line: $11 million or more wasted seeking execution since 2000. Orange ranks 5th in overall death sentencing while it spends
less than the statewide average on education.
Law Enforcement Spending per Capita,
2003-2004
Education Spending, per Student 2003-2004
High School Dropout Rate
2005 Orange County $304.73 $7,228 5.9%
Rank among 24 counties 7th 16th 22nd
Homicide Rate 2005
Percent of Homicides Solved 2005
Death Sentences Since 2000
Orange County 2.5 per 100,000 85.7 10 Rank among 24 counties 18th 5th 5th
Death Sentences per Murder Charged, 2000-2007
0 0.01 0.02 0.03 0.04 0.05 0.06 0.07 0.08
Orange
California
Percentage of Homicides Solved, 2000-2005
0
20
40
60
80
100
120
2000 2001 2002 2003 2004 2005
California
Orange
Orange County Quick Facts: - 10 death sentences since 2000. - The estimated $11 million Orange
County has spent seeking execution since 2000 could have funded the salaries for:
o 24 additional experienced
high school teachers per year;
or
o 23 additional homicide investigators per year.
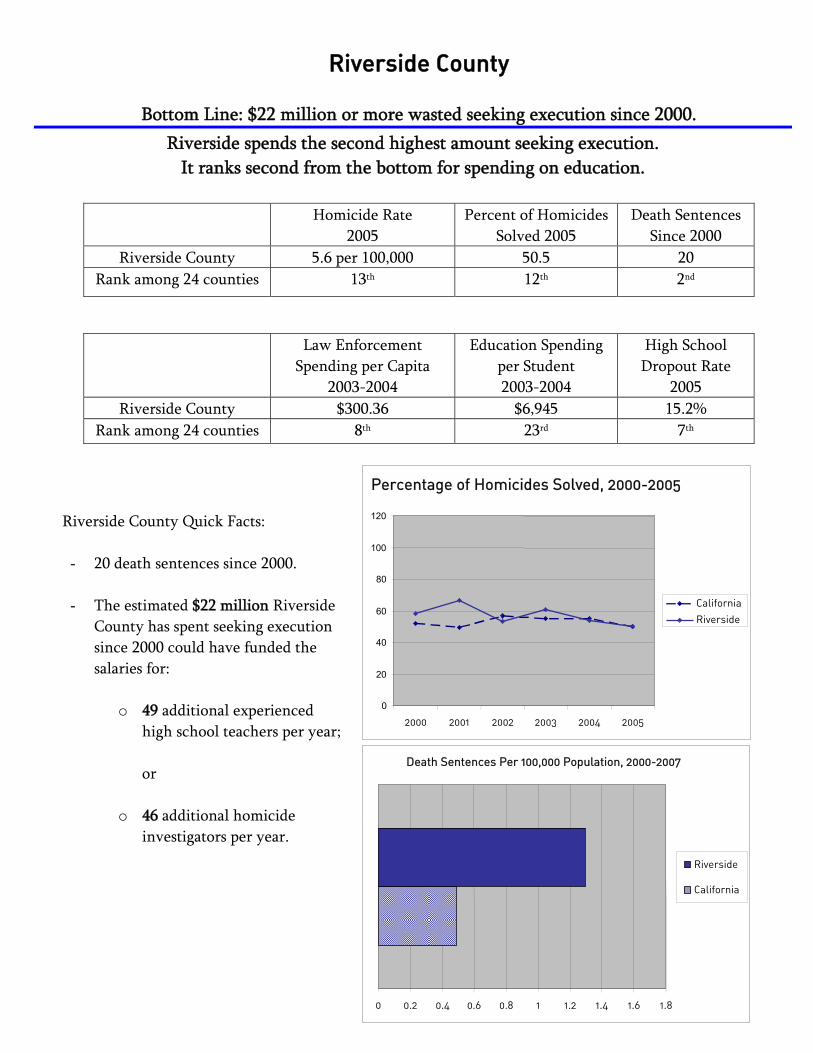
Riverside County
Bottom Line: $22 million or more wasted seeking execution since 2000. Riverside spends the second highest amount seeking execution.
It ranks second from the bottom for spending on education.
Law Enforcement Spending per Capita
2003-2004
Education Spending per Student 2003-2004
High School Dropout Rate
2005 Riverside County $300.36 $6,945 15.2%
Rank among 24 counties 8th 23rd 7th
Homicide Rate 2005
Percent of Homicides Solved 2005
Death Sentences Since 2000
Riverside County 5.6 per 100,000 50.5 20 Rank among 24 counties 13th 12th 2nd
Percentage of Homicides Solved, 2000-2005
0
20
40
60
80
100
120
2000 2001 2002 2003 2004 2005
California
Riverside
Death Sentences Per 100,000 Population, 2000-2007
0 0.2 0.4 0.6 0.8 1 1.2 1.4 1.6 1.8
Riverside
California
Riverside County Quick Facts: - 20 death sentences since 2000. - The estimated $22 million Riverside
County has spent seeking execution since 2000 could have funded the salaries for:
o 49 additional experienced
high school teachers per year;
or
o 46 additional homicide investigators per year.

Sacramento County
Bottom Line: $7.7 million or more wasted seeking execution since 2000. While Sacramento sends a large number of people to death row, its homicide rate
is rising and its rate of solving homicides is declining.
Law Enforcement Spending per Capita
2003-2004
Education Spending per Student 2003-2004
High School Dropout Rate
2005 Sacramento County $299.54 $7,324 12.9%
Rank among 24 counties 9th 14th 13th
Homicide Rate 2005
Percent of Homicides Solved 2005
Death Sentences Since 2000
Sacramento County 8 per 100,000 63.6 7 Rank among 24 counties 9th 9th 8th
Percentage of Homicides Solved, 2000-2005
0
20
40
60
80
100
120
2000 2001 2002 2003 2004 2005
California
Sacramento
Death Sentences per 100,000 Population, 2000-2007
0 0.2 0.4 0.6 0.8 1 1.2 1.4 1.6 1.8
Sacramento
California
Sacramento County Quick Facts: - 7 death sentences since 2000. - The estimated $7.7 million
Sacramento County has spent seeking execution since 2000 could have funded the salaries for:
o 17 additional experienced
high school teachers per year;
or
o 16 additional homicide investigators per year.
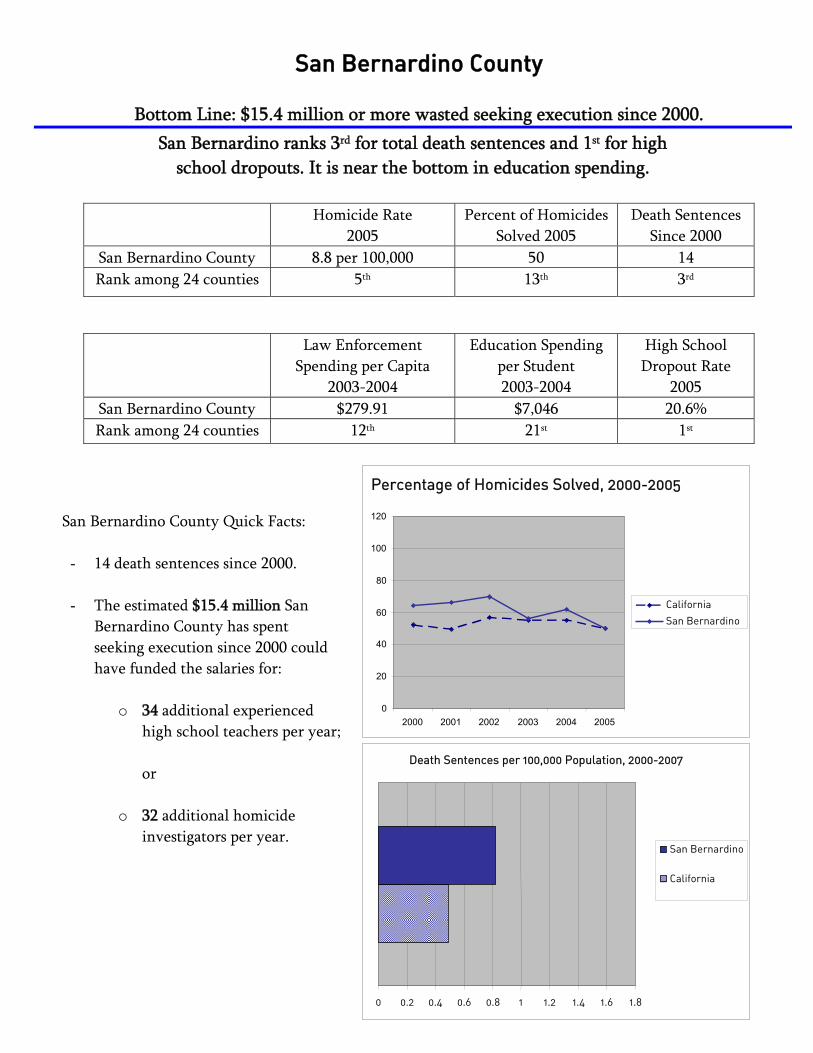
San Bernardino County
Bottom Line: $15.4 million or more wasted seeking execution since 2000. San Bernardino ranks 3rd for total death sentences and 1st for high
school dropouts. It is near the bottom in education spending.
Law Enforcement Spending per Capita
2003-2004
Education Spending per Student 2003-2004
High School Dropout Rate
2005 San Bernardino County $279.91 $7,046 20.6% Rank among 24 counties 12th 21st 1st
Homicide Rate 2005
Percent of Homicides Solved 2005
Death Sentences Since 2000
San Bernardino County 8.8 per 100,000 50 14 Rank among 24 counties 5th 13th 3rd
Percentage of Homicides Solved, 2000-2005
0
20
40
60
80
100
120
2000 2001 2002 2003 2004 2005
California
San Bernardino
Death Sentences per 100,000 Population, 2000-2007
0 0.2 0.4 0.6 0.8 1 1.2 1.4 1.6 1.8
San Bernardino
California
San Bernardino County Quick Facts: - 14 death sentences since 2000. - The estimated $15.4 million San
Bernardino County has spent seeking execution since 2000 could have funded the salaries for:
o 34 additional experienced
high school teachers per year;
or
o 32 additional homicide investigators per year.

San Diego County
Bottom Line: $9.9 million or more wasted seeking execution since 2000. San Diego sentences more people to execution per murder charged
than average. It ranks 8th for highest rate of school drop outs.
Law Enforcement Spending per Capita
2003-2004
Education Spending per Student 2003-2004
High School Dropout Rate
2005 San Diego County $274.74 $7,813 14.3%
Rank among 24 counties 13th 5th 8th
Homicide Rate 2005
Percent of Homicides Solved 2005
Death Sentences Since 2000
San Diego County 3.2 per 100,000 69.4 9 Rank among 24 counties 17th 8th 6th
Percentage of Homicides Solved, 2000-2005
0
20
40
60
80
100
120
2000 2001 2002 2003 2004 2005
California
San Diego
Death Sentences per Murder Charged, 2000-2007
0 0.01 0.02 0.03 0.04 0.05 0.06 0.07 0.08
San Diego
California
San Diego County Quick Facts: - 9 death sentences since 2000. - The estimated $9.9 million San
Diego County has spent seeking execution since 2000 could have funded the salaries for:
o 22 additional experienced
high school teachers per year;
or
o 21 additional homicide investigators per year.

San Francisco County
San Francisco has not wasted any money on executions since 1991. The death penalty “drains millions of dollars from efforts that more effectively protect public
safety and promote justice.” –District Attorney Kamala Harris
Law Enforcement Spending per Capita
2003-2004
Education Spending, per Student 2003-2004
High School Dropout Rate
2005 San Francisco County $378.71 $7,593 10.9%
Rank among 24 counties 2nd 8th 15th
Homicide Rate 2005
Percent of Homicides Solved 2005
Death Sentences Since 2000
San Francisco County 12.1 per 100,000 37.5 0 Rank among 24 counties 2nd 21st 21st (last)
Death Sentences per 100,000 Population, 2000-2007
0 0.2 0.4 0.6 0.8 1 1.2 1.4 1.6 1.8
San Francisco
California
San Francisco has not sentenced a single person to execution since
1991
Percentage of Homicides Solved, 2000-2005
0
20
40
60
80
100
120
2000 2001 2002 2003 2004 2005
California
San Francisco
San Francisco County Quick Facts: - 0 death sentences since 1991. - San Francisco County has not spent
additional money seeking execution since 2000.
- Every time San Francisco avoids
pursuing a death sentence, it saves at least $1.1 million.

San Mateo County
Bottom Line: $1.1 million or more wasted seeking execution since 2000. San Mateo rarely pursues execution, while it ranks 2nd for spending
on education and graduates the 2nd highest number of students.
Law Enforcement Spending per Capita
2003-2004
Education Spending, per Student 2003-2004
High School Dropout Rate
2005 San Mateo County $316.13 $8,223 5.3%
Rank among 24 counties 5th 2nd 23rd
Homicide Rate 2005
Percent of Homicides Solved 2005
Death Sentences Since 2000
San Mateo County 4.2 per 100,000 46.7 1 Rank among 24 counties 14th 17th 15 (tie)
Death Sentences per 100,000 Population, 2000-2007
0 0.2 0.4 0.6 0.8 1 1.2 1.4 1.6 1.8
San Mateo California
Percentage of Homicides Solved, 2000-2005
0
20
40
60
80
100
120
2000 2001 2002 2003 2004 2005
California
San Mateo
San Mateo County Quick Facts: - 1 death sentence since 2000. - The estimated $1.1 million San
Mateo County has spent seeking execution since 2000 could have funded the salaries for:
o 2 additional experienced high
school teachers per year; or
o 2 additional homicide investigators per year.
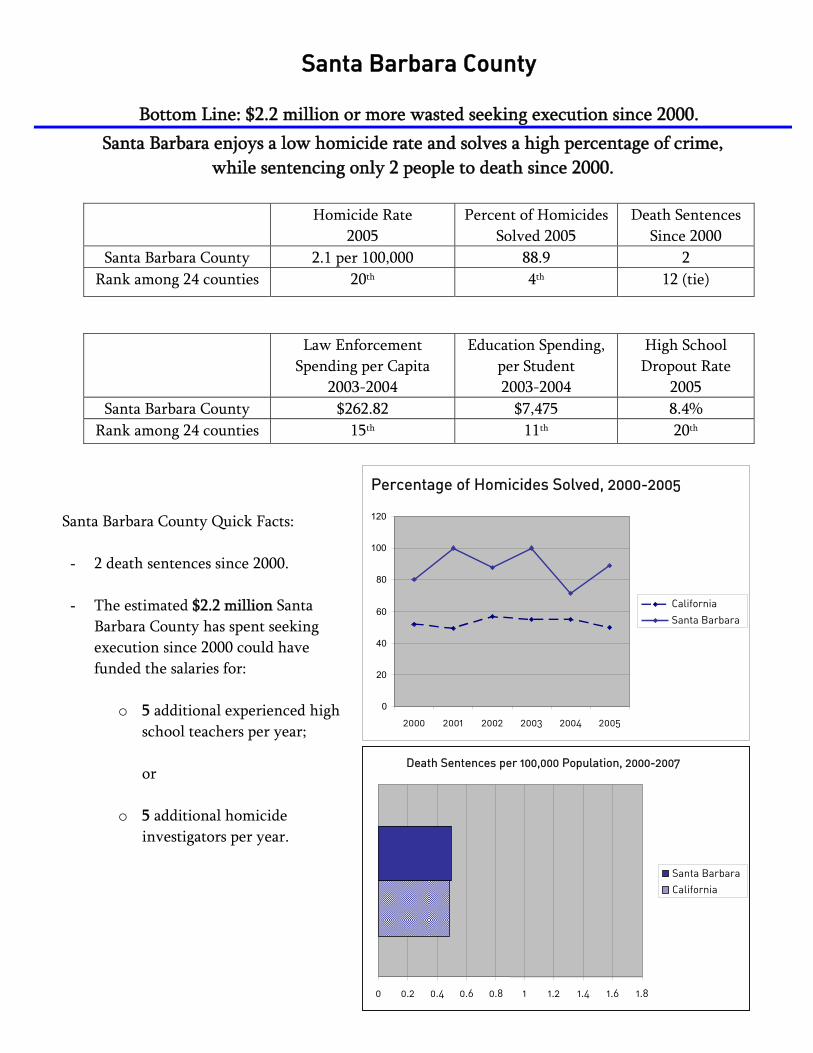
Santa Barbara County
Bottom Line: $2.2 million or more wasted seeking execution since 2000. Santa Barbara enjoys a low homicide rate and solves a high percentage of crime,
while sentencing only 2 people to death since 2000.
Law Enforcement Spending per Capita
2003-2004
Education Spending, per Student 2003-2004
High School Dropout Rate
2005 Santa Barbara County $262.82 $7,475 8.4%
Rank among 24 counties 15th 11th 20th
Homicide Rate 2005
Percent of Homicides Solved 2005
Death Sentences Since 2000
Santa Barbara County 2.1 per 100,000 88.9 2 Rank among 24 counties 20th 4th 12 (tie)
Percentage of Homicides Solved, 2000-2005
0
20
40
60
80
100
120
2000 2001 2002 2003 2004 2005
California
Santa Barbara
Death Sentences per 100,000 Population, 2000-2007
0 0.2 0.4 0.6 0.8 1 1.2 1.4 1.6 1.8
Santa Barbara
California
Santa Barbara County Quick Facts: - 2 death sentences since 2000. - The estimated $2.2 million Santa
Barbara County has spent seeking execution since 2000 could have funded the salaries for:
o 5 additional experienced high
school teachers per year; or
o 5 additional homicide
investigators per year.
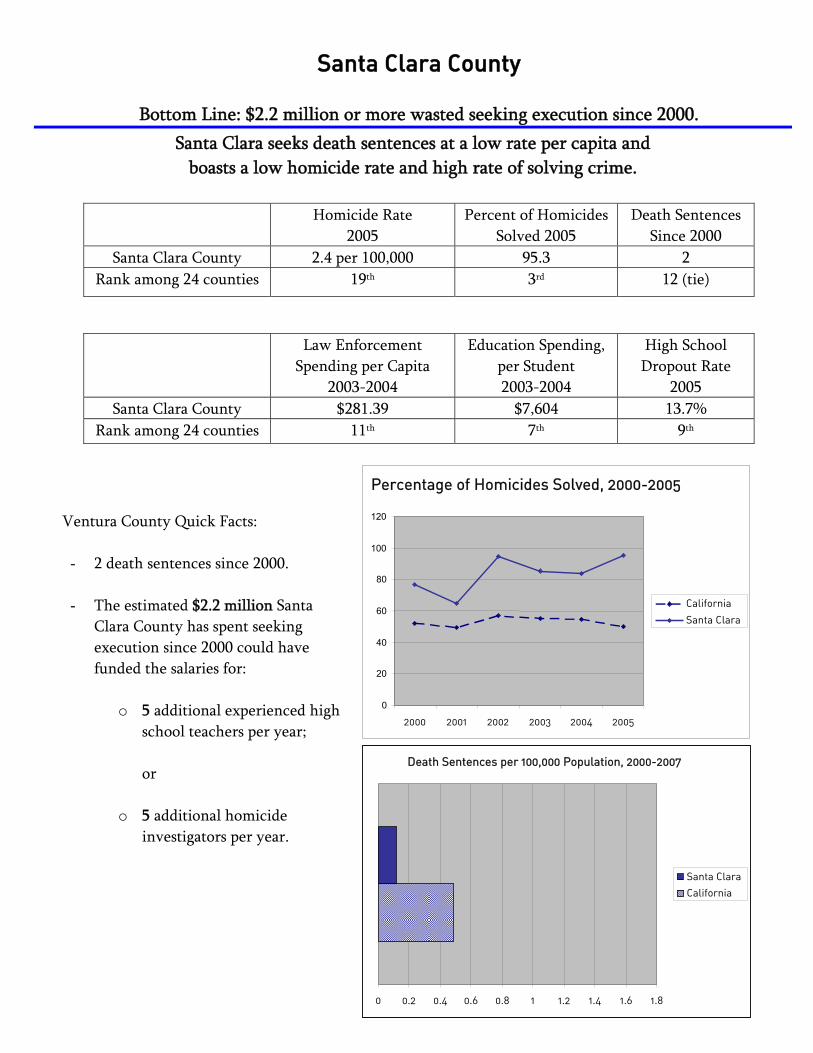
Santa Clara County
Bottom Line: $2.2 million or more wasted seeking execution since 2000. Santa Clara seeks death sentences at a low rate per capita and
boasts a low homicide rate and high rate of solving crime.
Law Enforcement Spending per Capita
2003-2004
Education Spending, per Student 2003-2004
High School Dropout Rate
2005 Santa Clara County $281.39 $7,604 13.7%
Rank among 24 counties 11th 7th 9th
Homicide Rate 2005
Percent of Homicides Solved 2005
Death Sentences Since 2000
Santa Clara County 2.4 per 100,000 95.3 2 Rank among 24 counties 19th 3rd 12 (tie)
Percentage of Homicides Solved, 2000-2005
0
20
40
60
80
100
120
2000 2001 2002 2003 2004 2005
California
Santa Clara
Death Sentences per 100,000 Population, 2000-2007
0 0.2 0.4 0.6 0.8 1 1.2 1.4 1.6 1.8
Santa Clara
California
Ventura County Quick Facts: - 2 death sentences since 2000. - The estimated $2.2 million Santa
Clara County has spent seeking execution since 2000 could have funded the salaries for:
o 5 additional experienced high
school teachers per year;
or
o 5 additional homicide investigators per year.

Tulare County
Bottom Line: $6.6 million or more wasted seeking execution since 2000. Tulare has the highest homicide rate and the highest death sentencing
rate per capita, while ranking lowest on law enforcement spending.
Law Enforcement Spending per Capita
2003-2004
Education Spending per Student 2003-2004
High School Dropout Rate
2005 Tulare County $190.01 $7,186 8.6%
Rank among 24 counties 24th 19th 19th
Homicide Rate 2005
Percent of Homicides Solved 2005
Death Sentences Since 2000
Tulare County 12.9 per 100,000 50 6 Rank among 24 counties 1st 13th 9th
Death Sentences per 100,000 Population, 2000-2007
0 0.2 0.4 0.6 0.8 1 1.2 1.4 1.6 1.8
Tulare
California
Percentage of Homicides Solved, 2000-2005
0
20
40
60
80
100
120
2000 2001 2002 2003 2004 2005
California
Tulare
Tulare County Quick Facts: - 6 death sentences since 2000. - The estimated $6.6 million Tulare
County has spent seeking execution since 2000 could have funded the salaries for:
o 14 additional experienced
high school teachers per year;
or
o 13 additional homicide investigators per year.

Ventura County
Bottom Line: $5.5 million or more wasted seeking execution since 2000. Ventura has the highest rate of death sentences per murder
charged and ranks near the bottom for school spending.
Law Enforcement Spending per Capita
2003-2004
Education Spending per Student 2003-2004
High School Dropout Rate
2005 Ventura County $311.89 $6,994 9%
Rank among 24 counties 6th 22nd 18th
Homicide Rate 2005
Percent of Homicides Solved 2005
Death Sentences Since 2000
Ventura County 3.9 per 100,000 78.1 5 Rank among 24 counties 15th 7th 10
Death Sentences per Murder Charged, 2000-2007
0 0.01 0.02 0.03 0.04 0.05 0.06 0.07 0.08
Ventura
California
Percentage of Homicides Solved, 2000-2005
0
20
40
60
80
100
120
2000 2001 2002 2003 2004 2005
California
Ventura
Ventura County Quick Facts: - 5 death sentences since 2000. - The estimated $5.5 million Ventura
County has spent seeking execution since 2000 could have funded the salaries for:
o 12 additional experienced
high school teachers per year;
or
o 11 additional homicide investigators per year.
26
About the Data in this Report In this report, we compare data for California counties with populations greater than 200,000, as reported in the 2000 Census. This threshold takes into consideration 24 counties and more than 91 percent of California’s population. Because small changes in data have a disproportionate impact in counties of smaller sizes, the 34 counties with populations lower than 200,000 were not included in comparisons. All rankings are sorted in descending order. A ranking of “1st” indicates that the county has the greatest percentage or rank for that category. The term “percentage of homicides solved” refers to the “homicide clearance rate,” which is the total number of homicides solved in a given year, divided by the number of homicides reported in that year. Some counties report homicide clearance rates greater than 100. In these cases, law enforcement agencies have reported solving a greater number of homicides than were committed within that year; some of the homicides solved that year would have been committed in previous years. This occurs rarely and in counties with particularly low homicide rates. The term “death sentences per capita” refers to the total number of death sentences handed down in a county between the years 2000-2007 inclusive, divided by the 2000 population estimate, and multiplied by 100,000. This number thus reflects the number of death sentences relative to the population. The term “death sentence per murder charged” refers to the total number of death sentences within a county between the years 2000-2007 inclusive, divided by the total number of criminal complaints charging murder for the years 1998-2005. This difference in years covered is due to the fact that reliable data about the number of complaints sought are only available through 2005. It also takes into account the delay between filing of a complaint and sentencing. The number of other personnel that could have been hired with funds spent pursuing death sentences was calculated by multiplying the number of death sentences in a given county, 2000-2007 inclusive, by $1.1 million, the estimated extra costs of a death penalty trial as compared to a normal homicide trial. This sum is divided by estimated annual salaries for experienced teachers and starting homicide investigators ($57,651 and $60,000 respectively), and then divided by eight years.

27
The sources for all of the data in this report are California Department of Justice, Criminal Justice Statistics Center
Homicide rates and homicide clearance rates, available at: http://ag.ca.gov/cjsc/
California Department of Education
High school dropout information available at: http://www.ed-data.k12.ca.us/Navigation/fsTwoPanel.asp?bottom=%2Fprofile%2 Easp%3Flevel%3D05%26reportNumber%3D16
Education expenditures per pupil available at: http://www.cde.ca.gov/ds/fd/ec/
Teacher salary information available at: http://www.cde.ca.gov/ta/ac/sa/salaries0203.asp
California Department of Corrections and Rehabilitation.
Capital punishment information available at: http://www.cdcr.ca.gov/Reports_Research/capital.html
U.S. Census Bureau, California information available at: http://quickfacts.census.gov/qfd/states/06000.html Voting Results on Propositions, available at http://www.sos.ca.gov/elections/elections_elections.htm See also Ellen Kreitzberg, A Review of Special Circumstances in California Death
Penalty Cases: Special Report to the California Commission on the Fair Administration of Justice (Jan. 10, 2008), available at
http://ccfaj.org/documents/reports/dp/expert/Kreitzberg.pdf