By: Bob Pullman. 2 A Guide to Studying the Weather And Having Some Fun in the Process.
55
By: Bob Pullman
-
date post
21-Dec-2015 -
Category
Documents
-
view
214 -
download
1
Transcript of By: Bob Pullman. 2 A Guide to Studying the Weather And Having Some Fun in the Process.

By: Bob Pullman
2
A Guide to Studying the Weather
And
Having Some Fun in the Process

3
Disclaimer
• This presentation is not a replacement nor substitute for information that is supplied by the National Weather Service nor any public government agency.
• In times of severe weather always follow the instructions of the NWS or government agency.

4
Why this Presentation ?• This presentation is about how to have fun
learning – a long forgotten art form.
• This is about how to grow a hobby.
• This is about paying attention to Mother Nature
• This is about how to recognize and understand phenomena in nature through observation and instrumentation.
• This is a bridge from the past to the present; a reminder that simplicity is often the right course.

5
Who’s this Presentation For ?
• Hams
• Kids
• Parents
• Anyone who just wants to learn
• No previous qualifications necessary
• Those who question the standard attitudes

6
My Background………
• Grew up in Eastern Canada where temperatures range from -60F to 120F
• A climate that can kill you in 30 minutes in the winter
• A climate that fuels forest fires in the heat of summer
• A climate influenced by the Atlantic and prone to getting hit by hurricanes and nor’easters

7
Learning the basics….
• Due to the climate, survival was taught at a very early age
• Got my first weather station when I was 11 years old
• Always been interested in the weather
• Career has been spent in media, and technical documentation specifically in the defense industry

8
The Scientific Method - Basic Science 101
The 4 Steps of the Scientific Method:
1. Observation & description of a phenomenon or group of phenomena.
2. Formulation of an hypothesis to explain the phenomena.
3. Use of the hypothesis to predict the existence of other phenomena.
4. Performance of experimental tests of the predictions.

9
Basic Science 101 – Part 2
• The scientific method works best in situations where one can isolate the phenomenon of interest, by eliminating or accounting for extraneous factors, and where one can repeatedly test the system under study after making limited, controlled changes in it.

10
Basic Science 101 – Part 3
• There are circumstances when one cannot isolate the phenomena.
• This doesn’t mean abandoning the Scientific Method which many places of education do these days.
• This is about learning from the phenomena with a wide open mind.

11
Basic Science 101 – Part 4
• Science is based on the correlation of facts, and not of opinion based consensus.
• A single data point does not imply a trend.
• The purpose of collecting data, is either to support, or refute, a perception.

12
The Scientific Method at Work
Let’s ask a basic question:
Is Global Warming happening on other planets besides earth?

13
Let’s Look at Some Data -The Facts Ma’am - Just the Facts
• Global Warming on Pluto Puzzles Scientists http://www.space.com/scienceastronomy/pluto_warming_021009.html
• New Storm on Jupiter Hints at Climate Changehttp://www.space.com/scienceastronomy/060504_red_jr.html
• NASA looks at a monster storm on Saturn http://www.upi.com/NewsTrack/view.php?StoryID=20061109-022035-4126r
• Global Warming Detected on Tritonhttp://www.scienceagogo.com/news/19980526052143data_trunc_sys.shtml
• Study Says Sun Getting hotterhttp://www.lubbockonline.com/news/092897/study.htm
• The Truth About Global Warming - it's the Sun that's to blame
http://www.telegraph.co.uk/news/main.jhtml?xml=/news/2004/07/18/wsun18.xml&sSheet=/news/2004/07/18/ixnewstop.html

14
Temperature Variations• Figure shows eight records of local
temperature variability on multi-centennial scales throughout the course of the Holocene, and an average of these (thick dark line). The records are plotted with respect to the mid 20th century average temperatures, and the global average temperature in 2004 is indicated. The inset plot compares the most recent two millennia of the average to other high resolution reconstructions of this period.
Source:http://en.wikipedia.org/wiki/Image:Holocene_Temperature_Variations.png

15
The Scientific Method at Work
Let’s ask another basic question:
Is there a connection between carbon dioxide emissions and Global Warming?

16
Temperature Variations – vs CO2 Levels over Time
"Although CO2 can have a minor influence on global temperature the effect is minimal and short lived as this cycle sits on top of the much larger water cycle, which is what truly controls global temperatures. The water cycle is in turn primarily influenced by natural celestial cycles and trends."
Dr. Tim Patterson, Professor of Geology at Carleton University

17
There is no statistical correlation between the level of carbon dioxide in the atmosphere through the last 500 million years and the temperature record in this interval. In fact, one of the highest levels of carbon dioxide concentration occurred during a major ice age that occurred about 450 million years ago. Carbon dioxide concentrations at that time were about 15 times higher than at present."
Temperature Variations – vs CO2 Levels over Time

18
Frequently Asked Questions - FAQ• Is the earth really going to heat up due to man’s use of
fossil fuels?– I’m sorry Al Gore. But, mankind has little to do with the warmup
of planet Earth.
A Taste of the Truthhttp://www.heartland.org/Article.cfm?artid=17977
Mars Is Warming, NASA Scientists ReportData coincide with increasing solar output
Written By: James M. TaylorPublished In: Environment NewsPublication Date: November 1, 2005Publisher: The Heartland Institute

19
Meaning?One of two things:
Man’s growth and development on Mars is creating the same issues as on Earth.
Or,
The sun has increased in output and all the planets are getting the same conditions.

20
Space Probes 20 Years Apart• The hard cold facts that are available to the
public (not hidden by some conspiracy theory) are that spacecraft that traveled by various planets and moons in the last few years have seen a unified increase in temperature from the spacecraft that flew by the same locations 20 years ago.
• All report a solar system temperature increase on planets and moons across the board.
• Therefore Global Warming is NOT manmade.

21
A Lesson Learned - Question Orthodoxy
• All knowledge is based on tested theory and hypothesis.
• Knowledge has nothing to do with political parties.
• If you don’t believe something is accurate, go out and research the issue to find the real answers.
• Real facts don’t lie – always search for the truth.
• Question interpretations – never settle on bad science or politics.
• Remember if there is a dollar to be made…….that will take precedence over truth by somebody someplace in a capitalist society.
• The truth will always persevere.

22
Now Back to the Program….Planet Earth, our home planet, IS undergoing climate change!
Which way – warming up or cooling down or just average? Irrelevant at this stage….
Basic Physics 101 – heat from the sun is energy
The expression used for calculating heat is:
Q= cTmwhere: Q= Heat in Caloriesc= heat capacity in the units cal/gm-°C, the heat capacity is defined as 1 for water.T= change of temperaturem= mass in grams
No, we are not going to get into the calculations of the physics of the atmosphere!Lets simply assume that we have change taking place which creates stronger storms – a fact found around the world and growing as each month passes.

23
Increased Energy• When there is increased energy in the
atmosphere, you will have a change in the way the weather develops.
• The bottom line, is if we can not predict the weather globally with a steady model, then it is logical to state that we can’t make long term predictions of what will or what won’t happen.
• Predictions are only as good as the data and the understanding of the data.
• “We have so much to learn” – a favorite quote I like from a USM biology professor.

24
Global View Earth – Conventional Image

25
Global View Earth – Thermal Imaging
Storm Systems

26
The Big PictureAdvantages:
– You see the whole planet in one shake.
– You can see storms a long ways away.
– You can make generalized statements.
– Easier for computers to make predictions.
Disadvantages:
– Real hard to tell what the weather is like locally.
– Real hard to understand micro-climates.
– Real hard to predict local weather events.
27
The Big Picture Prediction
What can we determine?
• Large Scale storm intensity predictions are good for only a few hours; changes too much; not enough data nor experience to be accurate a day or two in advance.

28
The Weather Scientist’s Favorite Tool - RADAR

29
CoverageGap
Earth curvature effects prevent 72% of the troposphere below 1 km from being observed
Weather Radar’s Weakness

30
Look Familiar?

31
Large Scale Communications Systems Fail – Especially During Disasters (ie Katrina)
• All the large network communication systems either failed or were destroyed.
• Infrastructure that we relied on, was gone.
• Ham radio, CB radio, generators, and private weather instrumentation systems survived.

32
What have we learned so far?• Question orthodoxy.
• Don’t count on the government (insurance companies?) to bail you out………
• Global Warming is NOT manmade.
• Is this bad? No, simply the facts of life!
• Will this happen again? We hope not – only time will tell…the odds are good that yes it will happen again and it could be this year.
Have we learned anything?
33
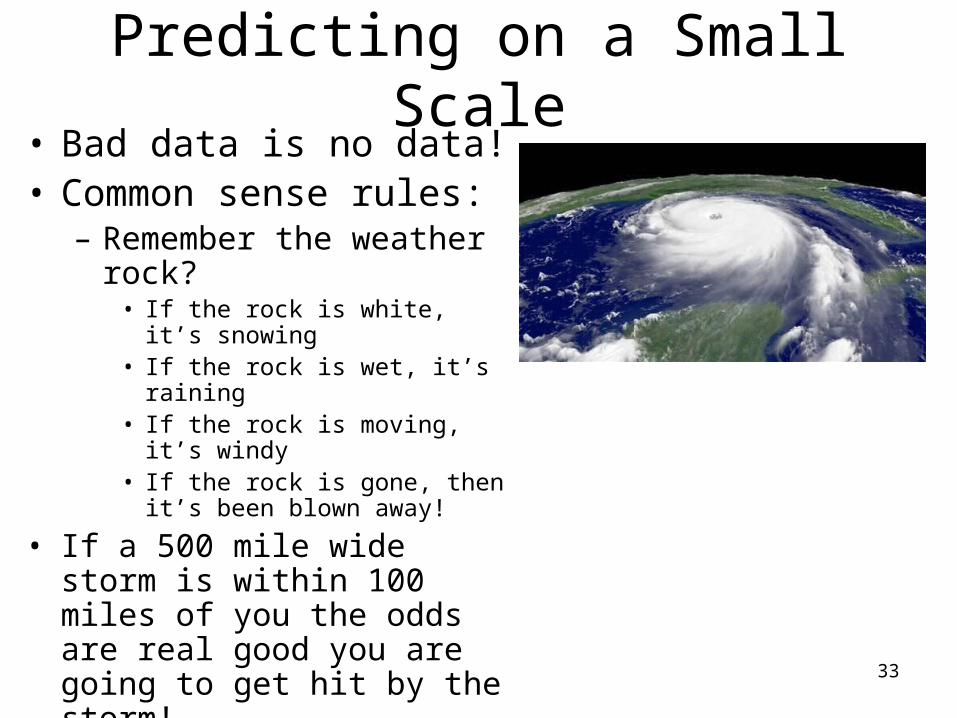
Predicting on a Small Scale• Bad data is no data!• Common sense rules:
– Remember the weather rock?
• If the rock is white, it’s snowing• If the rock is wet, it’s raining• If the rock is moving, it’s windy• If the rock is gone, then it’s been
blown away!
• If a 500 mile wide storm is within 100 miles of you the odds are real good you are going to get hit by the storm!

34
Listen, then Ask Questions
• Listening to an approaching storm or Mother Nature in general, and you have facts – then interpretation of those facts is the learning process.
• You can make a difference for your own satisfaction by setting up your own systems for observing Mother Nature.

35
Ways to Listen to Weather
• Ground Stations Temperature Relative Humidity Barometric Pressure Wind Speed Wind Direction Precipitation
• Weather Balloons
• Radar
• Sounding Rockets

36
Ground Weather StationsGround weather stations rapidly collect wind speed, wind direction, temperature, relative humidity, and precipitation data and record it for future analysis. Increasing numbers of systems also post their information in real time to the internet at such sites as http://weatherunderground.com

37
Weather Satellite Photographs
Photos transmitted from weather satellites can be received using a conventional Hamtronics receiver, satellite frequency antenna, WXSAT analysis software

38
Weather Faxes
The National Hurricane Center regularly broadcasts via shortwave its WEFAX weather service of forecasts maps translated by PC software.

39
Lightning Detection
Lightning can also be detected with conventional antennas and receivers. Then, collected on a PC for further analysis. Range up to 500 miles is possible, with 250 miles normal. This makes an effective early warning system for thunderstorms and possibly tornados.

40
Magnetic Effects
Thunderstorms and tornados produce magnetic fields which get stronger as they approach. These fields are easily monitored and captured via PC, or basic chart recorders.

41
New Orleans Tornado Signature

42
New Orleans Tornado Life

43
3D Spectrum Analysis
Combining computing and sensors allows the capability for advanced spectrum analysis. Shown above is a 3D EMF analysis of a tornado based off of a three second data capture. The circular effects of the funnel are easily visible and provide a snap shot of the electrical activity around a tornado.

44
Frequently asked Questions (FAQ)
• Is studying weather expensive to do?
• Only if you want it to be!
– You can do this on a shoestring budget – You can do this with old items around the house– You can do this with yard sale items you can find

45
Private Weather Radar for Homes
Couple of problems with this concept:
• Way too expensive for 99% of the population
• Send out a signal that you control and you get back a reply that only matches what you ask…….
• Would suffer the same coverage problem that the major systems have.

46
Developed Glenda Project• I moved into the “industrial”
side of weather research while living in Seattle back in 1994, and formed the Glenda Project with Dave Davis http://glendaproject.org
• Dave has a career background in rocketry and the aerospace business
• I have a heavy background in computers and instrumentation
• Solution – deliver instrumentation via rockets to study the weather…..not a new idea in itself….
• Our approach…use off the shelf components

47
Glenda Project – Typical Flight Profile
1 – Launch Phase
2 – Boost Phase3 – Deployment Phase
4 – Recovery Phase
Note: Propulsion is provided byreloadable/reusable rocket motorsgiving the capability of rapidturnaround between flights.

48
Rocketry Fundamentals• Once a rocket goes above a mile you simply
can’t see it.
• No point launching unless you have a chance of finding the rocket.
• Therefore, no point launching unless you have telemetry.
• Could one do micro-prospecting from a rocket?
• Could we learn more about the weather by launching instrumentation payloads into the storm fronts?

49
Motivation for Products• Need to define research goals and develop products to
pay for further research.
• Basic high power rocketry, gets expensive quickly.
• High Power Rocketry requires licenses for the purchase of motors.
• Comprehensive government requirements for control and storage of motors and fuels (Homeland Security Regulations have increased controls to the extreme)
• How often do you launch, and when needed defining.
• FAA launch requirements are different than the hobby (no launch into clouds) rocket regulations.

50
Defining Research & DevelopmentThe Goals of the Glenda Project:
• The primary mission of the Glenda Project is to provide the capability to rapidly gather previously inaccessible localized microclimate data from altitudes ranging from ground level to 40,000 feet and to return this data for immediate use.
• The Glenda Project is a reusable sounding rocket delivery system research and development program designed to place instrument packages into areas previously considered to be to hazardous or inaccessible using traditional platforms such as balloons, aircraft, helicopters, kites, etc.
• The Glenda Project rockets have the capability to collect temperature, humidity, barometric pressure, wind speed and other types of environmental data from ground level to 40,000 feet.
• The rockets are designed to be launched into thunderstorms, tornados, and other volatile weather environments and to return intact with the collected data.

51
Back to the Program….Okay how do you know when to launch?
• Storm chasers go in search of storms for pictures, radar analysis, and thrills.
• Storm chasers have lots of open room on the plains; in Washington state you have mountain ranges, coulees and empty desert – and not necessarily in that order.
• In Mississippi you can do research on storms – however tornado chasing is dangerous due to lack of evacuation routes.

52
What Has Glenda Learned?• Celebrating 10 Years of Research and
Development 1997 – 2007
• Glenda has three methods of collecting data:Active Flight Data Collection Systems - Transmitters
Passive Flight Data Collection Systems – Dataloggers
Ground Stations

53
Identifying Phenomena• Bottom Line - Identifying the approaching
weather phenomena to determine whether to go or no go – chase or hide.
• Weather conditions happen at altitude before being perceived by ground stations.
• Only way one can do that is with long range, or satellite sensors.
• Weather services do this with radar.

54
In Conclusion
• The Scientific Method generates more reliable data, than political consensus.
• Localized systems tend to be more robust in disasters.
• There are multiple ways to listen to the weather.

55
More Information:• Websites:
http://pullmangeosciences.comhttp://glendaproject.org
• Cell phone or Dialup Weather Website:http://pullman.net/w/0.html
• Email Bob Pullman:[email protected]
• Glenda Demo for NWS/NOAA (open to public): Pendleton Airport, Pendleton, OregonSaturday, May 19th, 2007