BW OFFSHORE - newsweb.oslobors.no
34
BW OFFSHORE Q2 2019 30 August 2019 CEO Marco Beenen CFO Ståle Andreassen SMARTER TOGETHER
Transcript of BW OFFSHORE - newsweb.oslobors.no

BW OFFSHOREQ2 2019
30 August 2019
CEO Marco Beenen
CFO Ståle Andreassen
SMARTER TOGETHER

Disclaimer
This Presentation has been produced by BW Offshore Limited exclusively for information purposes. This presentation may not be redistributed, in whole or in part, to any other
person.
This document contains certain forward-looking statements relating to the business, financial performance and results of BW Offshore and/or the industry in which it operates.
Forward-looking statements concern future circumstances and results and other statements that are not historical facts, sometimes identified by the words “believes”, expects”,
“predicts”, “intends”, “projects”, “plans”, “estimates”, “aims”, “foresees”, “anticipates”, “targets”, and similar expressions. The forward-looking statements contained in this
Presentation, including assumptions, opinions and views of BW Offshore or cited from third party sources are solely opinions and forecasts which are subject to risks, uncertainties
and other factors that may cause actual events to differ materially from any anticipated development. None of BW Offshore or any of its parent or subsidiary undertakings or any
such person’s officers or employees provides any assurance that the assumptions underlying such forward-looking statements are free from errors nor does any of them accept
any responsibility for the future accuracy of the opinions expressed in this Presentation or the actual occurrence of the forecasted developments. BW Offshore assumes no
obligation, except as required by law, to update any forward-looking statements or to conform these forward-looking statements to our actual results.
No representation or warranty (express or implied) is made as to, and no reliance should be placed on, any information, including projections, estimates, targets and opinions,
contained herein, and no liability whatsoever is accepted as to any errors, omissions or misstatements contained herein, and, accordingly, neither BW Offshore nor any of its parent
or subsidiary undertakings or any such person’s officers or employees accepts any liability whatsoever arising directly or indirectly from the use of this document. Actual experience
may differ, and those differences man be material.
By attending this Presentation you acknowledge that you will be solely responsible for your own assessment of the market and the market position of BW Offshore and that you will
conduct your own analysis and be solely responsible for forming your own view of the potential future performance of the businesses of BW Offshore. This presentation must be
read in conjunction with the recent Financial Information and the disclosures therein.
This announcement is not an offer for sale or purchase of securities in the United States or any other country. The securities referred to herein have not been registered under the
U.S. Securities Act of 1933, as amended (the “U.S. Securities Act”), and may not be sold in the United States absent registration or pursuant to an exemption from registration
under the U.S. Securities Act. BW Offshore has not registered and does not intend to register its securities in the United States or to conduct a public offering of its securities in the
United States. Any offer for sale or purchase of securities will be made by means of an offer document that may be obtained by certain qualified investors from BW Offshore.
Copies of this Presentation are not being made and may not be distributed or sent into the United States, Canada, Australia, Japan or any other jurisdiction in which such
distribution would be unlawful or would require registration or other measures.
In any EEA Member State that has implemented Directive 2003/71/EC (together with any applicable implementing measures in any member State, the “Prospectus Directive”), this
communication is only addressed to and is only directed at qualified investors in that Member State within the meaning of the Prospectus Directive.
This Presentation is only directed at (a) persons who are outside the United Kingdom; or (b) investment professionals within the meaning of Article 19 of the Financial Services and
Markets Act 2000 (Financial Promotion) Order 2005 (the “Order”); or (c) persons falling within Article 49(2)(a) to (d) of the Order; or (d) persons to whom any invitation or
inducement to engage in investment activity can be communicated in circumstances where Section 21(1) of the Financial Services and Markets Act 2000 does not apply.
2019 Q2

Q2 highlights
2019 Q2
Record EBITDA of USD 191.6 million
Extension of Abo FPSO and
Petróleo Nautipa
Approved by ANP as operator
in Brazil
Completed one lifting of 615k
bbls net to BW Energy
Dussafu 2019 production
forecast increased to 4.1 – 4.4
million bbls gross
3
Dussafu gross reserves tripled since
YE 2017
RECENT HIGHLIGHTS
Strong growth in FPSO earnings

2019 Q2 4
Q2 income statement highlights
0
50
100
150
200
250
300
Q3 17 Q4 17 Q1 18 Q2 18 Q3 18 Q4 18 Q1 19 Q2 19
286
Revenues
USD
million
0
20
40
60
80
100
120
140
160
180
200
Q3 17 Q4 17 Q1 18 Q2 18 Q3 18 Q4 18 Q1 19 Q2 19
192
EBITDA
USD
million
0
10
20
30
40
50
60
70
80
90
100
Q3 17 Q4 17 Q1 18 Q2 18 Q3 18 Q4 18 Q1 19 Q2 19
91
EBIT
USD
million

HSE performance
5
HSE record (LTI)Lost time injuries per million man-hours | Last Twelve Months (LTM) figures
0.0
1.0
2.0
3.0
4.0
5.0
2019 Q2

FLEET STATUS
6

Strong Fleet Performance
99% average uptime over last 5 years
Fleet uptime
99.8 % 98.4 % 99.6 % 100.0 %95.6 %
98.4 % 99.5 % 99.4 % 99.7 %
2019 Q2

Preparing for redeployment to
Maromba
Preservation and condition assessment
ongoing at Keppel Shipyard
Production stable at ~ 12,100 bopd
Uptime ~ 100%
Offshore modification work for phase 2
tie-in progressing well
Capex of ~ USD 30 million
Production stable between 65,000 and
66,000 bopd
Offloaded more than 30 million bbls
Uptime ~ 100%
Positive effects from excess production
Berge HeleneBW AdoloBW Catcher
Unit update
2019 Q2 8

Four out of six 2019 extensions confirmed
2019 Q2 9
FPSO Polvo
1 year extension until
Q3 2020
Client planning for
further extension of
field life
Umuroa
Ongoing drilling
activities on field
likely to extend field
life
BW Cidade de
São Vicente
1 year extension until
Q2 2020
BW Pioneer
Murphy Oil assumed
operatorship 1 April
and is evaluating
long-term
development of the
field
Abo FPSO
6 month extension
until end 2019
Petróleo Nautipa
1 year extension until
Q3 2021

Fleet contract overview
2019 Q2 10
Lease & Operate - fixed period Operation - fixed period Construction / EPC
Lease & Operate - option period Operation - option period
* Contract duration reflects BWO estimated field life (2028) and current license (2038)
** At yard pending agreement with Client
Unit 2013 2014 2015 2016 2017 2018 2019 2020 2021 2022 2023 2024 2025 2026
BW Adolo*
BW Catcher
Yúum K’ak’ Náab
BW Joko Tole
Espoir Ivoirien
Sendje Berge
Petróleo Nautipa
BW Cidade de São Vicente
FPSO Polvo
BW Pioneer
Umuroa
Abo FPSO
Berge Helene (Reserved) Petronas, Mauritania: 2006-2017
FPSO Cidade de São Mateus** Petrobras, Brazil: 2009-2019 (2024)
BW Athena (Tendering) Ithaca, UK: 2012-2016
Premier Oil, UK: 2018-2025 (2043)
BW Energy, Gabon: 2018-2028 (2038)
Pemex, Mexico: 2007-2022 (2025)
Kangean, Indonesia: 2012-2022 (2026)
CNR, Ivory Coast: 2002-2022 (2036)
Addax/Sinopec, Nigeria: 2012-2021 (2023)
Petrobras, Brazil: 2009-2020 (2024)
PetroRio, Brazil: 2007-2020 (2022)
VAALCO, Gabon: 2002-2021 (2022)
Murphy Oil, US: 2012-2020
Tamarind, New Zealand: 2007-2019 (2022)
Agip/Eni, Nigeria: 2003-2019 (2020)

Quarterly FPSO EBITDA doubled over past two years
2019 Q2 11
75
83
75
109105
120
134 137
156
Q2 17 Q3 17 Q4 17 Q1 18 Q2 18 Q3 18 Q4 18 Q1 19 Q2 19
Note
Q2 2017 excludes USD 45.5 million reversal of provisions on Sendje Berge
FPSO EBITDA before eliminations (USD million)
E&P STATUS
2019 Q2 13
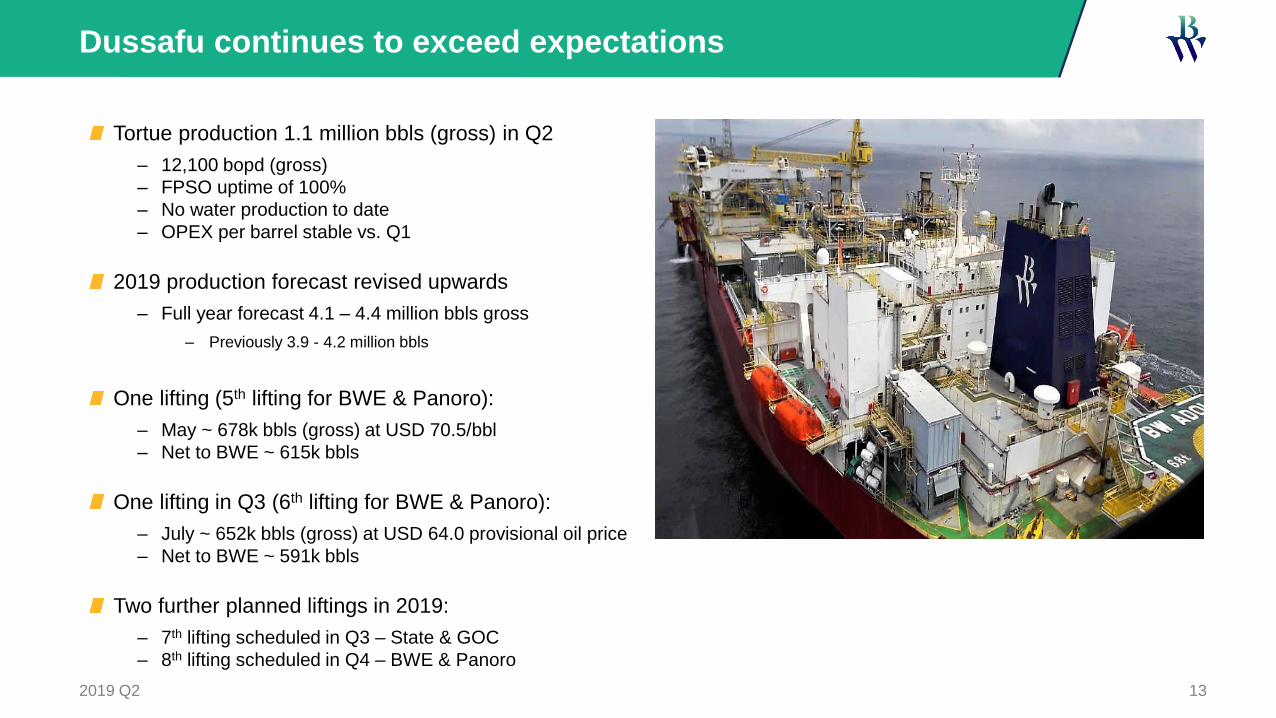
Tortue production 1.1 million bbls (gross) in Q2
‒ 12,100 bopd (gross)
‒ FPSO uptime of 100%
‒ No water production to date
‒ OPEX per barrel stable vs. Q1
2019 production forecast revised upwards
‒ Full year forecast 4.1 – 4.4 million bbls gross
‒ Previously 3.9 - 4.2 million bbls
One lifting (5th lifting for BWE & Panoro):
‒ May ~ 678k bbls (gross) at USD 70.5/bbl
‒ Net to BWE ~ 615k bbls
One lifting in Q3 (6th lifting for BWE & Panoro):
‒ July ~ 652k bbls (gross) at USD 64.0 provisional oil price
‒ Net to BWE ~ 591k bbls
Two further planned liftings in 2019:
‒ 7th lifting scheduled in Q3 – State & GOC
‒ 8th lifting scheduled in Q4 – BWE & Panoro
Dussafu continues to exceed expectations

Dussafu 2P reserves tripled since year-end 20171
2019 Q2 1414
1) Calculated based on Estimated Ultimate Recovery of 70 million bbls for mid-year 2019
2) Netherland, Sewell & Associates Inc.
23.5
35.1
66.3
YE2017 YE2018 Mid-year 2019
Inclusion of Ruche development and improved Tortue
reservoir size and performance gives 66.3 million
barrels in 2P gross reserves
‒ Ruche alone added 25.4 million bbls
‒ Reserves calculated after cumulative production of ~ 3.5
million bbls as of 30 June 2019
NSAI reserves update in line with management
previous estimate
NSAI2 2P gross reserves in million bbls
Tortue phase 1 and 2 Tortue phase 1 and 2 plus
Ruche

15
Dussafu development progressing as planned
Four subsea production wells to be tied back to BW Adolo
First oil expected in Q1 2020 from the two initial wells
Remaining two wells expected to start producing late Q2 2020
FPSO modifications progressing well
Development capex ~ USD 240 million for phase 2‒ excluding ~ USD 30 million in FPSO modifications‒ excluding exploration program
Hibiscus exploration well spudded in August
‒ Completed initial well bore, hydrocarbons encountered‒ Logging operations ongoing with an appraisal side-track planned
Selection of second exploration prospect, planned after the four producers, will be based on the ongoing seismic reprocessing
2019 Q2
Borr Norve on tow from Limbe, Cameroon, July 2019

Wellhead platform tied back to BW Adolo
Expected to add another 15,000 bopd gross
production‒ 6 wells planned targeting gross reserves of
25.4 million bbls1
Target FID Q4 2019 and first oil expected
Q4 2021
Capex of USD ~ 375 million (gross)‒ Largely funded by operating cash flow
Hibiscus success would add resources for
the Ruche development and improve
further understanding of several nearby
prospects‒ Espadon
‒ Hibiscus North
Finalising concept for Ruche FID
1) NSAI 2019 mid-year report
162019 Q2 162018 Q3
~16 km
Prospect AProspect B
Hibiscus
Hibiscus NorthEspadon
Mupale
WW North West

Maromba – Campos Basin development with significant upside
Approved by ANP as operator in Brazil in August
ANP also approved transfer of the participating interest in
the field to BW Offshore‒ Triggers first milestone payment of USD 30 million
‒ Remaining USD 85 million will be paid closer to first oil
Finalisation of phased development concept targeted for
H1 2020
First oil targeted Q1 2022
NSAI 2C recoverable gross reserves of 106 million bbls
2019 Q2 17

BWE structure and plan for listing
Announced intention to list on the Oslo Stock Exchange in H2
2019 in Q1 market update
Encouraging investor feedback from existing BWO
shareholders and potential new investors received during
market sounding in May and June
Current market sentiment is volatile
Proceeding with preparations and restructuring to be ready for
listing
Arnet Energy
(CEO Carl K. Arnet)
BW Energy Limited
(Bermuda)
68.6% 0.9%30.5%
BW Maromba
Holdings Pte. Ltd
(Singapore)
BW Kudu Holding Pte.
Ltd
(Singapore)
BW Energy Holdings
Pte. Ltd
(Singapore)
New
investors
Maromba,
Brazil
(100% operated WI*)
Kudu,
Namibia
(56% operated WI)
Dussafu Permit,
Gabon
(73.5% operated WI)
182019 Q2

FINANCE
2019 Q2 20
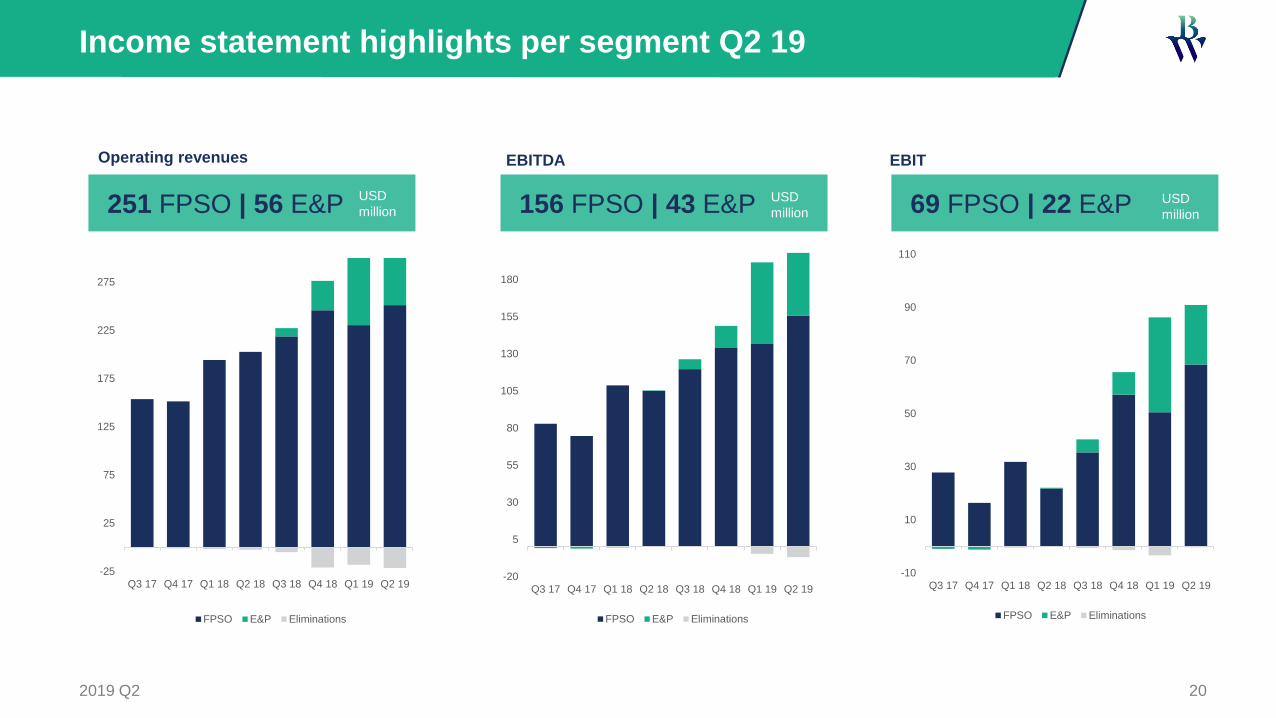
Income statement highlights per segment Q2 19
-25
25
75
125
175
225
275
Q3 17 Q4 17 Q1 18 Q2 18 Q3 18 Q4 18 Q1 19 Q2 19
FPSO E&P Eliminations
251 FPSO | 56 E&P
Operating revenues
USD
million
EBITDA
USD
million
EBIT
USD
million
-20
5
30
55
80
105
130
155
180
Q3 17 Q4 17 Q1 18 Q2 18 Q3 18 Q4 18 Q1 19 Q2 19
FPSO E&P Eliminations
-10
10
30
50
70
90
110
Q3 17 Q4 17 Q1 18 Q2 18 Q3 18 Q4 18 Q1 19 Q2 19
FPSO E&P Eliminations
156 FPSO | 43 E&P USD
million 69 FPSO | 22 E&P USD
million

Income statement
2019 Q2 21
USD million Q2 2019 Q1 2019 2018
Operating revenues 286.0 296.4 870.4
Operating expenses (94.8) (110.1) (382.6)
Share of profit from associates 0.4 0.5 1.4
EBITDA 191.6 186.8 489.2
Depreciation, amortisation and impairment (101.1) (104.1) (336.7)
Gain/(loss) sale of assets 0.0 0.1 7.0
EBIT 90.5 82.8 157.5
Net interest expense (21.1) (21.1) (77.1)
FX, financial instruments and other financial items (18.7) (8.7) (3.6)
Profit (loss) before tax 50.7 53.0 76.8
Income tax expense (21.3) (16.4) (40.3)
Net profit (loss) 29.4 36.6 36.5
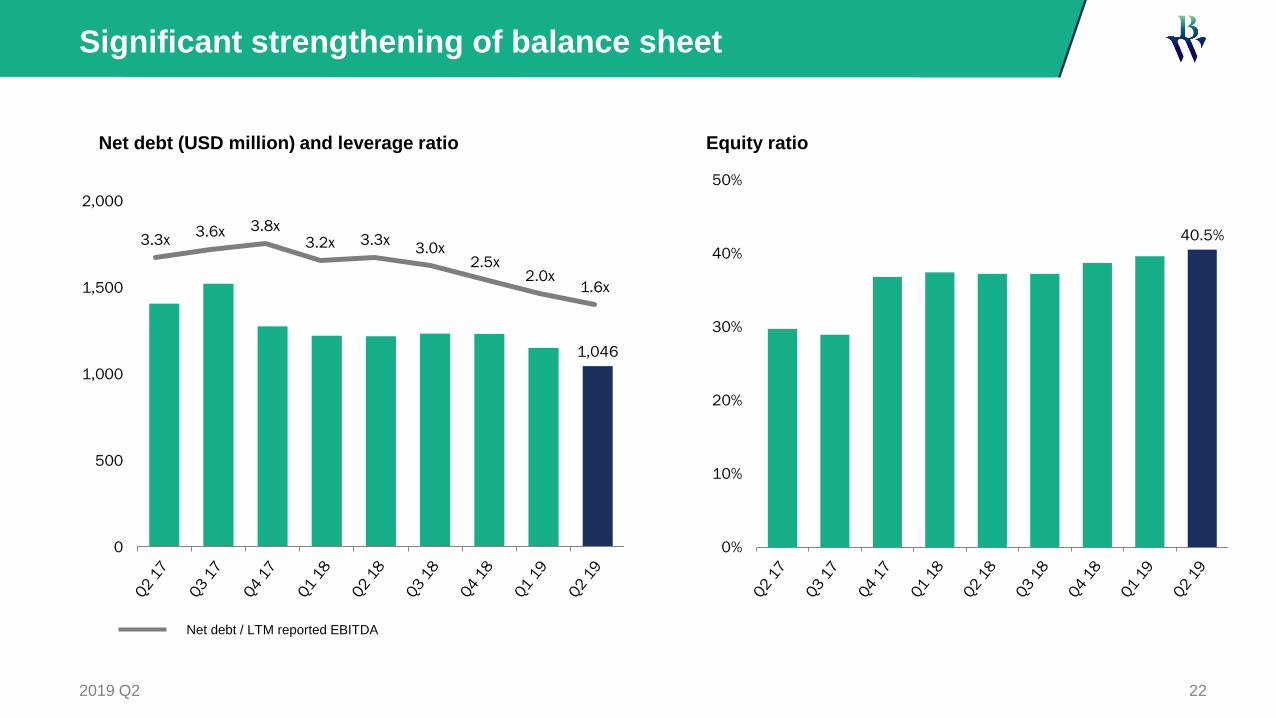
1,046
0
500
1,000
1,500
2,000
3.3x3.6x 3.8x
3.2x 3.3x3.0x
2.5x2.0x
1.6x
0
Significant strengthening of balance sheet
2019 Q2 22
40.5%
0%
10%
20%
30%
40%
50%
Equity ratio Net debt (USD million) and leverage ratio
Net debt / LTM reported EBITDA

Strong operational cash flow in Q2
177 177
318.9 302.9 302.9 288 273.2 264.8 265
142
15 31
340 355
15 8
0
100
200
300
400
500
600
700
Cash Q1'19 Operating cashflow
Net investmentsE&P
Net investmentsFPSO
New debt Debt instalments Net interest andlease liabilities
Non-controllinginterest
Cash Q2'19
2019 Q2 23

Strong liquidity and balanced long-term instalment profile
Available liquidity including corporate facilities
of USD 537.7 million
Uncommitted accordion USD 300 million for
redeployment modifications – Berge Helene
0
200
400
600
800
1,000
1,200
1,400
Bonds
Petróleo Nautipa facility
BW Catcher facility
Corporate facility0
100
200
300
400
500
600
H2 2019 2020 2021 2022 2023 2024
RBL financing progressing well
Healthy liquidity position and maturities from March 2020
provides flexibility to time the market for bond refinancing
Gross debt (USD million end Q2 19) Instalments (USD million)
242019 Q2

50%50%Firm
Option
35%
44%
16%
5%
Int. E&P
Catcher partnership
BW Energy
NOC
USD 6 billion revenue backlog to a diversified set of clients
25
Note: Options considered likely to be exercised
FPSO revenue backlog per Q2 Client base
2019 Q2

OUTLOOK

On track to deliver on strategic priorities
FPSO backlog provides long-term cash flow
visibility
Oil price fluctuates at levels providing FPSO
extensions
Selective bidding new FPSO projects
Focus on value generation through redeployments
for field developments
Phased development concept proven on Dussafu
license and ready for Maromba roll-out
Proceeding with preparations for BWE listing
272019 Q2

Event guidance
2019 Q2
- FPSO Polvo extension ✓
- BW Cidade de São Vicente
extension✓
- Abo FPSO extension ✓
- Start Tortue phase 2 project ✓
- Announce spin-off of BWE ✓
- Petróleo Nautipa extension ✓
- Umuroa extension
- Extension for BW Pioneer
- Upgrades to BW Adolo
- FPSO Cidade de São Mateus
agreement
- BWE IPO
- Hibiscus exploration well
- RBL
- Two Tortue production wells
- Ruche FID
- Maromba FDP work
- Kudu license development
continues
- Berge Helene redeployment
contract
- Extensions for:
- Abo FPSO
- FPSO Polvo
- First oil Tortue phase 2
- Two Tortue production wells
- Second exploration well
- Start Maromba phase 1 project
H1 2019 H2 2019 H1 2020
28

For further information please contact [email protected]

Income statement
302019 Q2
Q2 2017 Q3 2017 Q4 2017 FY 2017 Q1 2018 Q2 2018 Q3 2018 Q4 2018 FY 2018 Q1 2019 Q2 2019
Operating revenue 163.4 152.7 150.3 626.0 192.5 200.2 222.3 255.4 870.4 296.4 286.0
Operating expenses (45.3) (70.5) (77.3) (290.7) (84.5) (95.1) (96.0) (107.0) (382.6) (110.1) (94.8)
Share of profit/(loss) from equity accounted investments 0.5 (0.1) 0.5 0.9 0.5 0.3 0.1 0.5 1.4 0.5 0.4
Operating profit /(loss) before depreciation/amortisation 118.6 82.1 73.5 336.2 108.5 105.4 126.4 148.9 489.2 186.8 191.6
Depreciation (57.1) (54.6) (57.6) (225.9) (76.5) (82.7) (86.2) (91.1) (336.5) (103.4) (100.6)
Amortisation (0.7) (0.6) (0.7) (2.7) (0.5) (0.5) (0.5) (0.6) (2.1) (0.7) (0.5)
Impairment vessels and other assets (27.4) - - (27.4) - (0.1) - - (0.1) - -
Gain/(loss) sale of assets - - - - - - - 7.0 7.0 0.1 -
Operating profit/(loss) 33.4 26.9 15.2 80.2 31.5 22.1 39.7 64.2 157.5 82.8 90.5
Interest income 0.8 0.3 0.5 1.8 0.5 0.6 0.6 0.7 2.4 0.8 1.1
Interest expense (11.1) (8.5) (8.8) (39.6) (18.9) (20.4) (18.9) (21.3) (79.5) (21.9) (22.2)
Gain/(loss) on financial instruments 5.5 20.5 (4.3) 31.7 29.4 (14.0) 4.9 (34.0) (13.7) (6.7) (9.8)
Other financial items (13.8) (17.7) 10.6 (30.6) (14.9) 11.7 (1.5) 14.8 10.1 (2.0) (8.9)
Net financial income/(expense) (18.6) (5.4) (2.0) (36.7) (3.9) (22.1) (14.9) (39.8) (80.7) (29.8) (39.8)
Profit/(loss) before tax 14.8 21.5 13.2 43.5 27.6 0.0 24.8 24.4 76.8 53.0 50.7
Income tax expense (9.6) (17.6) 34.0 (2.3) (9.5) (7.5) (9.2) (14.1) (40.3) (16.4) (21.3)
Net profit/(loss) for the period 5.2 3.9 47.2 41.2 18.1 (7.5) 15.6 10.3 36.5 36.6 29.4
Attributable to shareholders of the parent 5.4 4.0 45.5 39.8 16.5 (9.3) 12.7 9.1 33.5 26.6 24.7
Attributable to non-controlling interests (0.2) (0.1) 1.7 1.4 1.6 1.8 2.9 1.2 3.0 10.0 4.7
Basic/diluted earnings/(loss) per share (USD) net 0.03 0.02 0.25 0.22 0.09 (0.05) 0.07 0.05 0.18 0.14 0.13

Balance sheet
312019 Q2
ASSETS Q2 2017 Q3 2017 Q4 2017 Q1 2018 Q2 2018 Q3 2018 Q4 2018 Q1 2019 Q2 2019
Vessels and vessels under construction 2,618.0 2,734.3 2,808.4 2,778.2 2,743.1 2,681.2 2,614.6 2,555.5 2,498.3
Property and other equipment 9.3 9.4 10.1 10.2 10.6 12.0 13.3 13.3 14.1
Right-of-use assets* - - - - - - - 23.0 25.0
E&P tangible assets 51.2 55.6 63.3 109.4 150.4 226.9 183.4 188.0 184.1
Intangible assets 5.8 5.8 6.7 6.9 8.5 29.0 37.7 36.5 40.4
Equity accounted investments 7.5 7.5 7.9 8.3 8.5 8.6 9.2 9.7 9.9
Finance lease receivables 87.0 82.3 77.5 72.6 67.6 62.5 57.3 52.1 46.7
Deferred tax assets 3.2 3.8 11.5 10.5 10.7 10.3 12.5 12.7 11.5
Pension assets 1.9 1.7 0.5 0.8 0.6 0.5 - - -
Derivatives 5.6 5.7 7.7 15.6 18.0 21.2 12.9 6.7 2.3
Other non-current assets 4.0 5.1 5.4 6.4 10.0 2.6 10.8 8.3 4.9
Total non-current assets 2,793.5 2,911.2 2,999.0 3,018.9 3,028.0 3,054.8 2,951.7 2,905.8 2,837.2
Inventories 26.2 30.5 31.8 37.1 44.4 46.5 63.8 56.3 56.7
Trade receivables and other current assets 175.3 169.0 245.0 171.3 175.2 160.1 208.5 247.9 205.6
Derivatives 0.8 2.2 1.5 2.5 0.5 0.4 0.0 0.1 0.2
Cash and cash equivalents 149.0 148.6 145.5 162.7 145.0 145.4 142.1 177.0 265.2
Assets held for sale - - - - - - 50.4 24.0 25.1
Total current assets 351.3 350.3 423.8 373.6 365.1 352.4 464.8 505.3 552.8
TOTAL ASSETS 3,144.8 3,261.5 3,422.8 3,392.5 3,393.1 3,407.2 3,416.5 3,411.1 3,390.0
EQUITY AND LIABILITIES Q2 2017 Q3 2017 Q4 2017 Q1 2018 Q2 2018 Q3 2018 Q4 2018 Q1 2019 Q2 2019
Shareholders' equity 918.8 925.7 971.5 987.6 975.9 987.4 995.6 1,019.8 1,045.6
Non-controlling interests 15.8 15.7 287.9 281.8 286.0 281.3 325.3 330.3 327.8
Total equity 934.6 941.4 1,259.4 1,269.4 1,261.9 1,268.7 1,320.9 1,350.1 1,373.4
Interest-bearing long-term debt 1,398.3 1,438.2 1,198.0 1,117.1 1,103.0 1,118.2 1,112.8 826.4 1,135.9
Pension obligations 4.1 4.4 4.2 4.3 4.3 4.3 4.6 4.5 4.7
Asset retirement obligations - - - - - 16.0 16.2 14.6 15.3
Other long-term liabilities 290.0 281.3 337.9 338.0 290.9 271.6 252.5 240.9 230.0
Long-term lease liabilities* - - - - - - - 16.8 16.6
Derivatives 118.8 98.1 101.9 79.8 92.8 90.5 112.9 89.5 96.5
Total non-current liabilities 1,811.2 1,822.0 1,642.0 1,539.2 1,491.0 1,500.6 1,499.0 1,192.7 1,499.0
Trade and other payables 209.7 222.1 287.8 305.8 370.1 365.9 324.0 321.6 296.8
Derivatives 3.2 1.6 1.1 0.5 1.0 1.2 2.3 26.3 25.2
Interest-bearing short-term debt 157.3 232.8 222.8 266.6 260.1 260.4 260.9 502.0 175.4
Short-term lease liabilities* - - - - - - - 6.5 8.9
Income tax l iabilities 28.8 41.6 9.7 11.0 9.0 10.4 9.4 11.9 11.3
Total current liabilities 399.0 498.1 521.4 583.9 640.2 637.9 596.6 868.3 517.6
Total liabilities 2,210.2 2,320.1 2,163.4 2,123.1 2,131.2 2,138.5 2,095.6 2,061.0 2,016.6
TOTAL EQUITY AND LIABILITIES 3,144.8 3,261.5 3,422.8 3,392.5 3,393.1 3,407.2 3,416.5 3,411.1 3,390.0
*Effects from the implementation of IFRS 16

Cashflow
322019 Q2
Q2 2017 Q3 2017 Q4 2017 FY 2017 Q1 2018 Q2 2018 Q3 2018 Q4 2018 FY 2018 Q1 2019 Q2 2019
Profit/(loss) before taxes 14.8 21.5 13.2 43.5 27.6 - 24.8 24.4 76.8 53.0 50.7
Unrealised currency exchange loss/(gain) 13.3 16.9 (11.1) 28.0 14.1 (12.3) 0.6 (15.7) (13.3) 0.6 4.9
Depreciation and amortisation 57.8 55.2 58.3 228.6 77.0 83.2 86.7 91.7 338.6 104.1 101.0
Share of loss/(profit) from equity accounted investments (0.5) 0.1 (0.5) (0.9) (0.5) (0.3) (0.1) (0.5) (1.4) (0.6) (0.3)
Loss/ (gain) on sale of shares and fixed assets - - - - - - - (7.0) (7.0) (0.1) -
Impairment 27.4 - - 27.4 - 0.1 - - 0.1 - -
Change in fair value of derivatives (5.5) (20.5) 4.3 (31.7) (29.4) 14.0 (4.9) 34.0 13.7 6.7 9.8
Changes in ARO through income statement - - - - - - - 0.2 0.2 0.2 0.4
Add back of net interest expense 10.2 8.3 8.3 37.8 18.4 19.8 18.3 20.6 77.1 21.0 21.2
Instalment on financial lease 4.3 4.3 4.5 17.3 4.5 4.6 4.7 4.9 18.7 4.9 5.0
Changes in inventories (5.7) (4.3) (1.2) (17.8) (5.3) (7.3) (2.1) (17.3) (32.0) 7.5 (0.4)
Changes in trade and other current assets (2.6) 6.8 (75.7) 231.9 73.7 (3.7) 28.7 (60.9) 37.8 (38.8) 42.6
Changes in trade and other payables 1.6 12.3 37.6 31.6 17.9 64.3 (4.3) (76.2) 1.7 (3.5) (8.0)
Changes in other balance sheet items and items related to operating activities (0.7) 2.1 79.8 91.8 (4.0) (46.8) (46.1) 61.2 (35.7) 18.3 (65.8)
Taxes paid (8.1) (6.4) (7.2) (28.0) (6.5) (9.3) (7.4) (16.2) (39.4) (12.9) (19.2)
Net cash flow from operating activities 106.3 96.3 110.3 659.5 187.5 106.3 98.9 43.2 435.9 160.4 141.9
Investment in operating fixed assets and intangible assets (83.8) (175.0) (128.9) (443.0) (95.8) (101.2) (107.1) (53.1) (357.2) (48.2) (44.2)
Sale of fixed assets - - - - - - - - - - 28.6
Interest received 0.8 0.3 0.5 1.8 0.5 0.6 0.6 0.7 2.4 0.8 1.0
Cash outflow on business combinations (34.3) (1.0) (0.1) (35.4) - - - - - - -
Net cash flow from investing activities (117.3) (175.7) (128.5) (476.6) (95.3) (100.6) (106.5) (52.4) (354.8) (47.4) (14.6)
Proceeds from new interest-bearing debt 64.0 177.0 33.0 374.0 56.0 25.0 95.0 65.0 241.0 105.0 340.0
Repayment of interest-bearing debt (276.2) (77.5) (275.4) (725.9) (108.5) (35.5) (80.7) (53.6) (278.3) (152.0) (354.9)
Interest paid (22.9) (20.5) (21.4) (87.3) (19.5) (19.2) (20.4) (19.2) (78.3) (21.2) (13.3)
Payment of lease liabilities - - - - - - - - - (2.6) (2.5)
Cash transfer from non-controlling interests* 16.0 - 278.9 294.9 (3.0) 6.3 14.1 13.7 31.1 (7.3) (8.4)
Net cash flow from financing activities (219.1) 79.0 15.1 (144.3) (75.0) (23.4) 8.0 5.9 (84.5) (78.1) (39.1)
Net change in cash and cash equivalents (230.1) (0.4) (3.1) 38.6 17.2 (17.7) 0.4 (3.3) (3.4) 34.9 88.2
Cash and cash equivalents at beginning of period 379.1 149.0 148.6 106.9 145.5 162.7 145.0 145.4 145.5 142.1 177.0
Cash and cash equivalents at end of period 149.0 148.6 145.5 145.5 162.7 145.0 145.4 142.1 142.1 177.0 265.2
*Cash transfer from non-controlling interests includes equity investment and loan

Key figures
332019 Q2
Q2 2017 Q3 2017 Q4 2017 FY 2017 Q1 2018 Q2 2018 Q3 2018 Q4 2018 FY 2018 Q1 2019 Q2 2019
EBITDA-margin 72.6 % 53.8 % 48.9 % 53.7 % 56.4 % 52.6 % 56.9 % 58.3 % 56.2 % 63.0 % 67.0 %
Equity ratio 29.7 % 28.9 % 36.8 % 36.8 % 37.4 % 37.2 % 37.2 % 38.7 % 38.7 % 39.6 % 40.5 %
Return on equity 4.9 % 0.5 % 17.9 % 4.5 % 2.7 % -2.4 % 4.8 % 9.5 % 3.7 % 15.7 % 14.6 %
Return on capital employed 6.8 % 6.2 % 3.6 % 4.0 % 4.6 % 3.3 % 5.5 % 8.9 % 5.7 % 11.3 % 12.5 %
Net interest-bearing debt (USD million) 1,406.6 1,522.4 1,275.3 1,275.3 1,221.0 1,218.1 1,233.2 1,231.6 1,231.6 1,151.4 1,046.1
Cash flow per share (USD) 0.57 0.52 0.60 3.57 1.01 0.57 0.53 0.23 2.36 0.87 0.77
EPS - basic and diluted (USD) 0.03 0.02 0.25 0.22 0.09 (0.05) 0.07 0.05 0.18 0.14 0.13
Shares - end of period (million) 185.0 185.0 185.0 185.0 185.0 185.0 185.0 185.0 185.0 185.0 185.0
Share price (NOK) 21.0 27.9 35.8 35.8 42.8 41.7 64.6 31.7 31.7 44.8 52.0
Market cap (NOKm) 3,884 5,160 6,621 6,621 7,916 7,713 11,948 5,854 5,854 8,286 9,608
Market cap (USDm) 463 647 807 807 1,018 945 1,461 674 674 964 1,128

Segments
342019 Q2
Q2 2017 Q3 2017 Q4 2017 FY 2017 Q1 2018 Q2 2018 Q3 2018 Q4 2018 FY 2018 Q1 2019 Q2 2019
FPSO 164.4 153.6 151.4 629.0 194.2 202.7 218.7 245.9 861.5 230.5 251.2
E&P - - - - - - 8.7 30.5 39.2 84.0 56.2
Eliminations (1.0) (0.9) (1.1) (3.0) (1.7) (2.5) (5.1) (21.0) (30.3) (18.1) (21.4)
Revenue 163.4 152.7 150.3 626.0 192.5 200.2 222.3 255.4 870.4 296.4 286.0
Q2 2017 Q3 2017 Q4 2017 FY 2017 Q1 2018 Q2 2018 Q3 2018 Q4 2018 FY 2018 Q1 2019 Q2 2019
FPSO 120.1 83.0 74.7 339.8 108.8 105.1 119.7 134.3 467.9 137.0 155.8
E&P (1.5) (0.9) (1.2) (3.6) (0.3) 0.3 6.7 14.6 21.3 54.6 42.7
Eliminations - - - - - - - - - (4.8) (6.9)
EBITDA 118.6 82.1 73.5 336.2 108.5 105.4 126.4 148.9 489.2 186.8 191.6
Q2 2017 Q3 2017 Q4 2017 FY 2017 Q1 2018 Q2 2018 Q3 2018 Q4 2018 FY 2018 Q1 2019 Q2 2019
FPSO (85.2) (55.2) (58.3) (256.0) (77.0) (83.3) (84.3) (77.2) (321.8) (86.5) (87.3)
E&P - - - - - - (1.8) (6.1) (7.9) (18.9) (20.3)
Eliminations - - - - - - (0.6) (1.4) (2.0) 1.4 6.5
Depreciation, amortisation, impairment and gain sale of assets (85.2) (55.2) (58.3) (256.0) (77.0) (83.3) (86.7) (84.7) (331.7) (104.0) (101.1)
Q2 2017 Q3 2017 Q4 2017 FY 2017 Q1 2018 Q2 2018 Q3 2018 Q4 2018 FY 2018 Q1 2019 Q2 2019
FPSO 34.9 27.8 16.4 83.8 31.8 21.8 35.4 57.1 146.1 50.5 68.5
E&P (1.5) (0.9) (1.2) (3.6) (0.3) 0.3 4.9 8.5 13.4 35.7 22.4
Eliminations - - - - - - (0.6) (1.4) (2.0) (3.4) (0.4)
EBIT 33.4 26.9 15.2 80.2 31.5 22.1 39.7 64.2 157.5 82.8 90.5
Q2 2017 Q3 2017 Q4 2017 FY 2017 Q1 2018 Q2 2018 Q3 2018 Q4 2018 FY 2018 Q1 2019 Q2 2019
FPSO 65.4 171.3 132.8 424.0 47.0 48.3 54.3 37.8 187.4 29.9 33.5
E&P 52.7 4.6 9.0 67.2 46.4 66.5 75.0 19.6 207.5 17.8 11.2
Eliminations - - - - - (23.9) (6.1) (4.4) (34.4) (1.3) (1.8)
CAPEX 118.1 175.9 141.8 491.2 93.4 90.9 123.2 53.0 360.5 46.4 42.9
Q2 2017 Q3 2017 Q4 2017 FY 2017 Q1 2018 Q2 2018 Q3 2018 Q4 2018 FY 2018 Q1 2019 Q2 2019
FPSO 2,726.8 2,840.2 2,913.1 2,913.1 2,887.4 2,877.5 2,820.3 2,743.7 2,743.7 2,680.7 2,604.5
E&P 53.6 58.2 67.2 67.2 113.6 163.3 253.3 227.3 227.3 375.2 400.8
Assets not allocated to segments 13.1 12.8 18.7 18.7 17.9 17.8 17.9 19.6 19.6 43.4 44.8
Eliminations - - - - - (30.6) (36.7) (38.9) (38.9) (193.5) (212.9)
Total non-current assets 2,793.5 2,911.2 2,999.0 2,999.0 3,018.9 3,028.0 3,054.8 2,951.7 2,951.7 2,905.8 2,837.2
Q2 2017 Q3 2017 Q4 2017 FY 2017 Q1 2018 Q2 2018 Q3 2018 Q4 2018 FY 2018 Q1 2019 Q2 2019
FPSO - - - - - - - - - 1.6 1.6
E&P - - - - - - - - - 5.0 6.2
Eliminations - - - - - - - - - (4.8) (4.8)
Effect on EBITDA of Implementing IFRS 16* - - - - - - - - - 1.8 3.0
*The effect on EBITDA of implementing IFRS 16 is provided for information purposes only.