BVMF Presentation - October 2013
58
1 BM&FBOVESPA Investor Relations Department October 2013
Transcript of BVMF Presentation - October 2013

7/27/2019 BVMF Presentation - October 2013
http://slidepdf.com/reader/full/bvmf-presentation-october-2013 1/58
1
BM&FBOVESPA
Investor Relations Department
October 2013

7/27/2019 BVMF Presentation - October 2013
http://slidepdf.com/reader/full/bvmf-presentation-october-2013 2/58
7/27/2019 BVMF Presentation - October 2013
http://slidepdf.com/reader/full/bvmf-presentation-october-2013 3/58
3
HISTORY, BUSINESS MODEL AND CORPORATE GOVERNANCE
BRAZILIAN MARKET OPPORTUNITIES
MAIN GROWTH INITIATIVES
OPERATIONAL PERFORMANCE
FINANCIAL HIGHLIGHTS
APPENDIX (includes results for 2Q13)

7/27/2019 BVMF Presentation - October 2013
http://slidepdf.com/reader/full/bvmf-presentation-october-2013 4/58
4
HISTORY, BUSINESS MODEL AND CORPORATE
GOVERNANCE Safety, resilience and transparency

7/27/2019 BVMF Presentation - October 2013
http://slidepdf.com/reader/full/bvmf-presentation-october-2013 5/58
5
1890:Foundation of Bolsa
Livre (BOVESPA's
predecessor)
1986:Start of
BM&F
activities
Aug 2007:BOVESPA Hld
demutualization
Sep 2007: BM&F
demutualization
Oct 2007:BOVESPA Hld
IPO (BOVH3)
Nov 2007:BM&F IPO
(BMEF3)
May 2008:integration between BM&F and
BOVESPA Hld and creation of
BM&FBOVESPA (BVMF3)
1967:BOVESPA’s
Mutualization
MARKET CAPITALIZATION (US$ billion) AND OPERATING MARGIN (%)
•¹12M to Jun. 28, 2012. ²12M to Mar 31, 2012. ³9M to Sep. 30, 2012. Source: Bloomberg (Sep 30, 2013).
History of BM&FBOVESPAImportant global exchange

7/27/2019 BVMF Presentation - October 2013
http://slidepdf.com/reader/full/bvmf-presentation-october-2013 6/58
6
PRE-TRADING TRADING POST-TRADE
Access TradeAllocation
Transfer
Clearing/risk
analysis
Position/
CollateralDepository
Auxiliary
Services
VALUE CHAIN
Vertically integrated
Trading Platform: equities, derivatives, government and
corporate bonds, funds, spot FX, among others
Post-Trade Platform:
Central Counterparty (CCP) : An entity that interposes itself
between operations or contracts, becoming the guarantor of all
business
Settlement System (SSS): system that allows the transfer of
securities or assets from investors, in which the transfer may be
free or against payment
Central Depository (CSD): performs centralized asset custody and
treatment of corporate actions (dividends, stock splits, etc.)
Services for issuers and brokers Listing (stocks, funds, corporate bonds,
securitization, among other)
Trading access (brokers)
Securities Lending
Custody for clubs and foreign investors
(2.689 account)
Market Data (vendors)
Indices Licensing
Software Licensing
OTC (derivatives and fixed income)
Commodities certification
Vertical model as a differentialValue gained across most of the chain
SettlementRisk Analysis
(DMA)Risk Analysis

7/27/2019 BVMF Presentation - October 2013
http://slidepdf.com/reader/full/bvmf-presentation-october-2013 7/587
DTCC
BRAZIL(Internalization of orders is forbidden)
US(Internalization of orders is allowed)
Post tradeCCP
SSS
CSD
Trading
Brokers
A and B
Investors Investors
Brokers A and B
Investors Investors
Broker
A
Broker
B
Model 100% vertical: clearing, settlementand central depository at the final beneficial
owner level
Brokers settle positions and control theirclients’ portfolios through BM&FBOVESPA’s
infrastructure (impact on post-trade fees)
Clearing, settlement and custody occur at thebrokerage houses
Each prime broker has its own structure tocontrol its customers’ portfolios and settle
positions (impact on the prime broker’s costs)
Trading Venues
Vertical model as a differentialBM&FBOVESPA present at all post-trade stages

7/27/2019 BVMF Presentation - October 2013
http://slidepdf.com/reader/full/bvmf-presentation-october-2013 8/588
Brokerage
houses &
investors
Trading
Post-Trade
Regulations prohibit internalization of orders, dark pools
and ATS/MTFs and simultaneous exchange/OTC equities
trading
Settlement and clearing of equities trading must be donethrough a CCP
Settlement and clearing at the final beneficial owner level
make the Brazilian market safer and more resilient
Under the prevailing regulations, potential competitorsmust provide an integrated solution with the same statusregarding rules and transparency
In Brazil the final investor pays the exchange: compared to
other markets we have a competitive all-in-cost, as
BM&FBOVESPA provides more services than other
exchanges
Naked access is not allowed
Naked short selling is not possible
Brazilian market regulatory frameworkResilience and safety as priorities

7/27/2019 BVMF Presentation - October 2013
http://slidepdf.com/reader/full/bvmf-presentation-october-2013 9/589
EXECUTIVE OFFICERSBOARD OF DIRECTORS
COMMITTEES
Edemir PintoCEO
Luis FurtadoCIO
Cícero VieiraCOO
Daniel SonderCFO
Eduardo GuardiaChief Product / IRO
Audit Committee
Risk Committee
Nominations and Corporate Governance Committee
Compensation Committee
Corporate GovernanceMultidisciplinary knowledge in conducting business
Charles CareyIndependent Director, Director of CME Group
José Roberto Mendonça de BarrosIndependent Director, economist and professor
Pedro Parente (Chairman)Independent Director, CEO of Bunge Brasil
Marcelo Trindade (Vice Chairman)
Independent Director, lawyer
Claudio HaddadIndependent Director, engineer and professor
André EstevesNon Executive Director, CEO of BTG Pactual
Alfredo Antônio Lima de MenezesNon Executive Director, Executive Officer of Bradesco
Luiz Fernando FigueiredoIndependent Director, Co-Founder of Mauá Investments
Luiz Nelson Guedes De CarvalhoIndependent Director, professor
Candido BracherNon Executive Director, CEO of Itaú BBA
José Berenguer Neto
Non Executive Director, CEO of JP Morgan Brazil
Advisory Committee For The Securities Intermediation Industry
7/27/2019 BVMF Presentation - October 2013
http://slidepdf.com/reader/full/bvmf-presentation-october-2013 10/5810
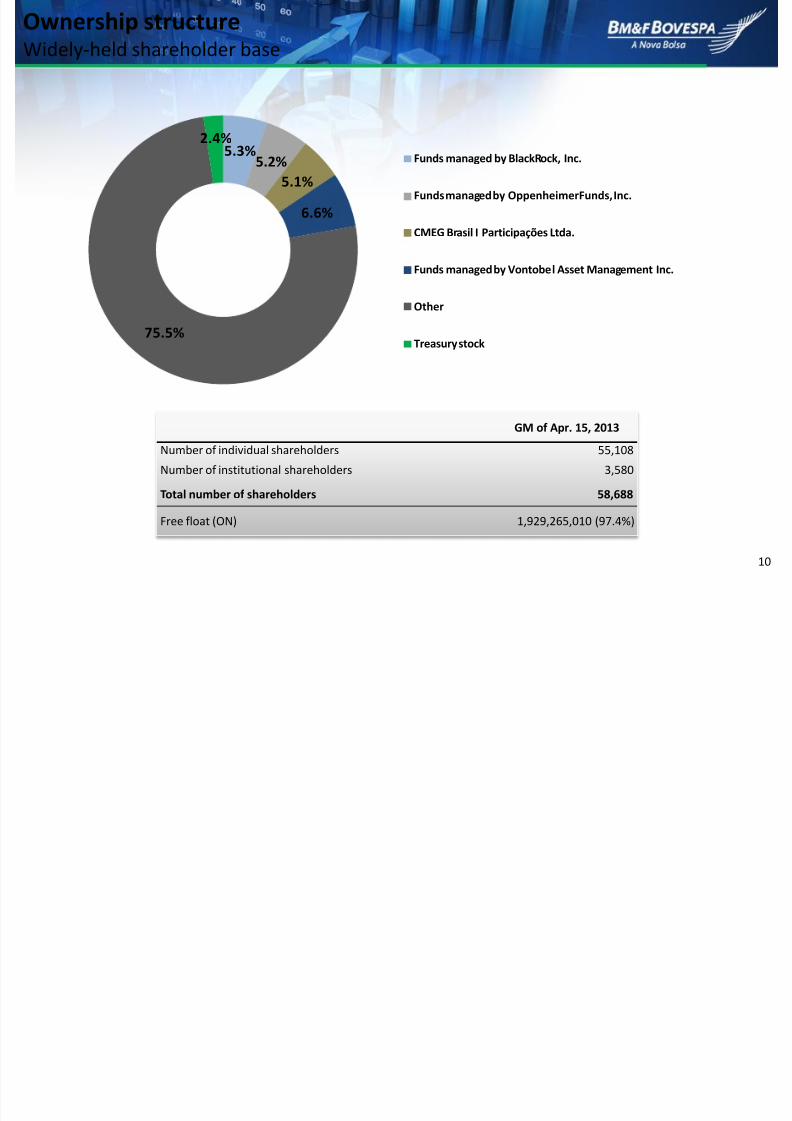
GM of Apr. 15, 2013
Number of individual shareholders 55,108
Number of institutional shareholders 3,580
Total number of shareholders 58,688
Free float (ON) 1,929,265,010 (97.4%)
Ownership structureWidely-held shareholder base
5.3%5.2%
5.1%
6.6%
75.5%
2.4%Funds managed by BlackRock, Inc.
Funds managed by OppenheimerFunds, Inc.
CMEG Brasil I Participações Ltda.
Funds managed by Vontobel Asset Management Inc.
Other
Treasury stock

7/27/2019 BVMF Presentation - October 2013
http://slidepdf.com/reader/full/bvmf-presentation-october-2013 11/5811
BRAZILIAN MARKET OPPORTUNITIES
Main growth drivers

7/27/2019 BVMF Presentation - October 2013
http://slidepdf.com/reader/full/bvmf-presentation-october-2013 12/5812
Opportunities in the Brazilian marketBM&FBOVESPA prepared to capture future growth
Source : Central Bank of Brazil. * For Brazil, considers only bank credit.
GROWTH DRIVES
EQUITIES MARKET
Porfolio diversification => opportunity for diversification of investmentsof institutional investors in equities
more resources being directed into equities
more listed companies
DERIVATIVES MARKET
more credit and more in fixed-rate government debt => more demand
for hedging from financial institutions lower interest rates=> longer maturities of traded contracts
more foreign trade => higher volumes in FX contracts
stock market growth, the launch and development of ETFs and moreexposure to equity among institutional investors => growth in Index-basedcontractsCAPITAL MARKETS WILL HAVE
CENTRAL ROLE IN THE COMING YEARS
Investmentneeded topromotegrowth
Nationalsavings still
highlyconcentrated
in fixedincome
Interest ratesat the lowest
in history
Total Credit/GDP Evolution in Brazil (%) Selic Interest Rate (% p.a.). – Jan-07 to Aug-13
27.4%
55.1%
2001 2002 2003 2004 2005 2006 2007 2008 2009 2010 2011 2012 2013
13.2511.25
13.75
8.7510.75 11.00
7.259.00
2007 2008 2009 2010 2011 2012 2013
7/27/2019 BVMF Presentation - October 2013
http://slidepdf.com/reader/full/bvmf-presentation-october-2013 13/5813
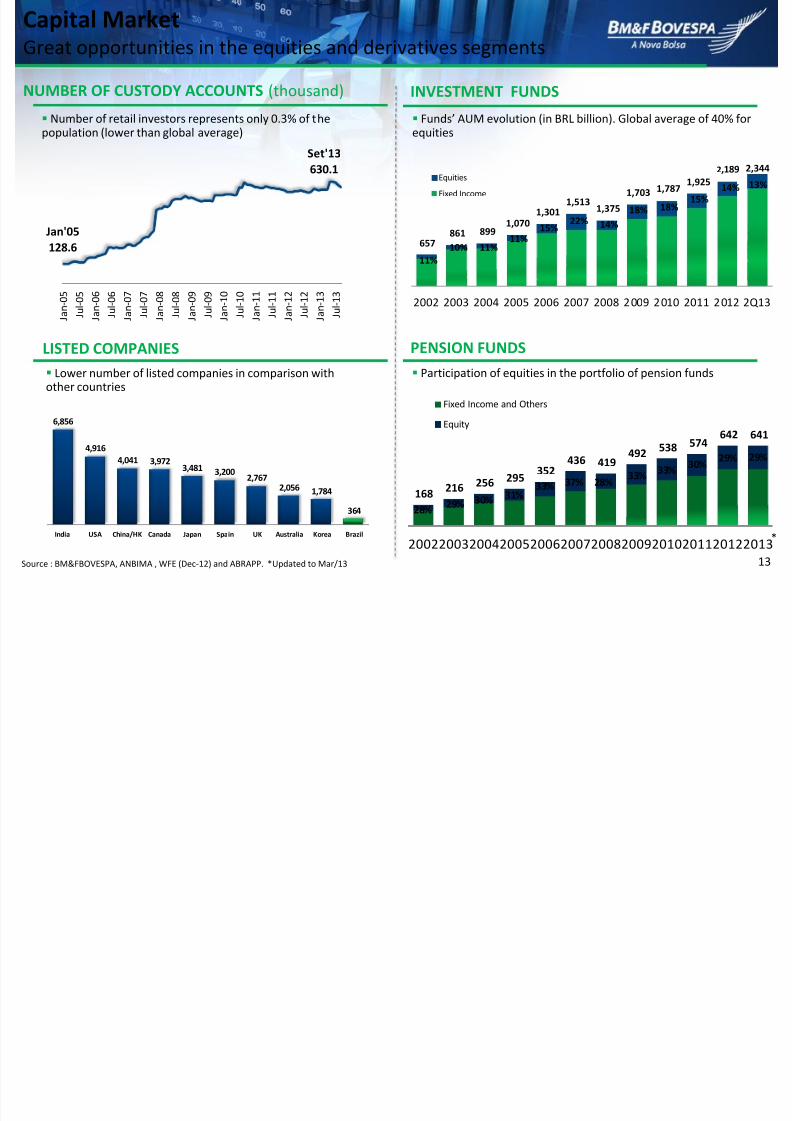
Capital MarketGreat opportunities in the equities and derivatives segments
Funds’ AUM evolution (in BRL billion). Global average of 40% for
equities
LISTED COMPANIES
Source : BM&FBOVESPA, ANBIMA , WFE (Dec-12) and ABRAPP. *Updated to Mar/13
INVESTMENT FUNDSNUMBER OF CUSTODY ACCOUNTS (thousand)
PENSION FUNDS
Number of retail investors represents only 0.3% of the
population (lower than global average)
Lower number of listed companies in comparison withother countries
Participation of equities in the portfolio of pension funds
6,856
4,916
4,041 3,9723,481 3,200
2,7672,056 1,784
364
India USA China/HK Canada Japan Spain UK Australia Korea Brazil
657861 899
1,0701,301
1,5131,375
1,703 1,7871,925
2,189 2,344
11%
10% 11%11%
15%22% 14%
18% 18%15%
14% 13%
2002 2003 2004 2005 2006 2007 2008 2009 2010 2011 2012 2Q13
Equities
Fixed Income
168216 256 295
352436 419
492538 574
642 641
28%29% 30% 31%
33% 37% 28%33%
33%30%
29% 29%
200220032004200520062007200820092010201120122013
Fixed Income and Others
Equity
*
Jan'05
128.6
Set'13
630.1
J a n - 0 5
J u l - 0 5
J a n - 0 6
J u l - 0 6
J a n - 0 7
J u l - 0 7
J a n - 0 8
J u l - 0 8
J a n - 0 9
J u l - 0 9
J a n - 1 0
J u l - 1 0
J a n - 1 1
J u l - 1 1
J a n - 1 2
J u l - 1 2
J a n - 1 3
J u l - 1 3

7/27/2019 BVMF Presentation - October 2013
http://slidepdf.com/reader/full/bvmf-presentation-october-2013 14/5814
STOCK OF FIXED-RATE CREDIT (BRL billion) PUBLIC DEBT / FIXED RATE (BRL billion)
Source: Central Bank of Brazil
Interest Rate Contracts in Brazilian RealsStructural changes behind the growth in volumes
more credit increases the banks’ demand for financialderivatives on BM&FBOVESPA
more fixed-rate debt increases banks andinstitutional investors’ demand for futurescontracts on BM&FBOVESPA
INTEREST RATES IN BRL: ADV PER CONTRACT MONTH (million contracts)
longer maturities of contracts
Jan-05 Jan-06 Jan-07 Jan-08 Jan-09 Jan-10 Jan-11 Jan-12
Jan'05:
BRL 180.0
Dec'12:
BRL 850.9
CAGR: -14%
CAGR: +25%
CAGR: +8%
Mar-05Mar-06Mar-07Mar-08Mar-09Mar-10Mar-11Mar-12Mar-13
Jan'05:
BRL 151.4 bn
Jul'13:
BRL 726.1 bn
0.29 0.40
0.880.99
0.55 0.56
0.57 0.460.76
0.89
1.371.49
0.86 0.86
1.631.88 1.92 2.05
9M08 9M09 9M10 9M11 9M12 9M13
1st-4th Maturity 5th Maturity-on Total

7/27/2019 BVMF Presentation - October 2013
http://slidepdf.com/reader/full/bvmf-presentation-october-2013 15/5815
OperatingLeverage
Significant investments
in technology and the
quest for greaterefficiency (cost control)
Strengthening of
regulatory and
institutional
structure
Focus on clients:
development of
markets and products
Falling interest rates
Strong need for
investments to
promote growth
Investments
portfolios still
concentrated in highliquidity fixed
income products
High Potentialfor Revenue
Growth
Sustainable Results(Maximization of Shareholders’ Return)
External
Factors
BM&FBOVESPA Strategic
Focus
BM&FBOVESPAWell positioned to capture and generate growth

7/27/2019 BVMF Presentation - October 2013
http://slidepdf.com/reader/full/bvmf-presentation-october-2013 16/5816
MAIN GROWTH INITIATIVES
Investments, new products and focus on thecustomer

7/27/2019 BVMF Presentation - October 2013
http://slidepdf.com/reader/full/bvmf-presentation-october-2013 17/5817
Update of strategic projects
*IPN/CORE implementation requires the authorization of the regulators.
PUMA Trading System™ - Multi-Asset Trading Platform A high-performance, high-speed and high-capacity electronic trading platform
RTT (Round Trip Time) of less than one millisecond
Derivatives and FX module: implemented in Oct/11
Equities module: implemented in Apr/13
Clearinghouses integration The integration of BM&FBOVESPA’s clearinghouses will enhance the Company’s competitive position
Development of the new risk architecture (CloseOut Risk Evaluation - CORE)* will increase allocation
efficiency for clients
Tests for derivatives started in Jul/13, with conclusion scheduled for Mar/14
iBalcão – OTC Registration Platform Registration of OTC derivatives and fixed income securities
Deployment in Jul/13 (for FX non-deliverable forward – no central counterparty)
Pricing Policy Changes for Cash Equities First phase (Apr/13): reduction from 0.7 bps to 0.5 bps in trading fees and a realignment between the
trading fees and post-trade fees of institutional investors and day traders
Second phase (Dec/13): increased discounts per tier of volume for day traders and a progressive reductionof trading fees per tier of global volume
Initiatives for Small and Medium Enterprises (SMEs) Establishment of the Technical Committee for Smaller Offerings composed of private sector and
government agencies
Developing proposals to facilitate capital raising through issuance of shares (incentives to SMEs, investors
and intermediaries)
Project was presented to the Ministry of Finance in Jul/13

7/27/2019 BVMF Presentation - October 2013
http://slidepdf.com/reader/full/bvmf-presentation-october-2013 18/5818
BM&FBOVESPA IT DevelopmentsBuilding a world-class IT platform
Increasing competitive differentiation for derivative andcash equity markets
LATENCY
BM&F Segment (derivatives) BOVESPA Segment (equities)
70
2520
10-15~1 ~1 <1
2007 2008 2009 2010 2011 2012 2013
450
300
20 10-15 10-15 10-15 <1
2007 2008 2009 2010 2011 2012 2013
Core of the system (average latency milliseconds) Core of the system (average latency milliseconds) Latency has been
dramatically reduced
Standard deviation of latency has been
reduced by more than200
MACRO VIEW: PERFORMANCE OF CO-LOCATION
Co-location
Participant
Infrastructure of PUMA Trading System
Gateway
+LiNe
Matching Engines
~300 µs~500 µs~200 µs
~1000 µs
Network Infra¹
Networks built for the developmentand deployment of PUMA platform
Gateway² + LiNe
Pre-trade risk control (LiNe) representsabout 60% of Gateway + LiNe latency
Matching Engines³
Meet all auction rules and bands/fluctuationlimits set out in regulations (100% of orders)
Network

7/27/2019 BVMF Presentation - October 2013
http://slidepdf.com/reader/full/bvmf-presentation-october-2013 19/5819
Listed
ETFs - Exchange Traded Funds: International
Fixed income
Equities
FIIs
Market Maker: Cash equities
Options
Commodities
Futures
Ibovespa (methodology review)
SMEs - Small and MediumEnterprises (BOVESPA Mais)
Incentive programs (retail
investors)
Selic Derivatives: Selic futures - OC1
FX spread - DCO
FX swap - SCS
Options on single stocks New fee policy for HFTs/day
traders
Ethanol Futures Contracts
BDR (exchange market)
Securities Lending (BTC)
Product and Market DevelopmentListed products
CONTINUOUS DEVELOPMENT OF LISTED PRODUCTS
d d k l

7/27/2019 BVMF Presentation - October 2013
http://slidepdf.com/reader/full/bvmf-presentation-october-2013 20/5820
Derivatives Fixed Income
R e g i s
t r a t i o n NDFs – deployed in Jul/13
Flexible options on single stocks
COE (Structured Notes) Swaps
LCAs (Agribusiness Credit Bill): improvements
LCIs (Real Estate Credit Bill) and CDBs (timedeposits): adaptation of the platform –
pending regulatory approval Changes to listing rules and procedures for
corporate bonds and financial bills (LF)
T r a d i n g
-
Trading platform for government andcorporate bonds
Changes to the fee policy
CONTINUOUS DEVELOPMENT OF iBALCÃO PROJECT
Product and Market DevelopmentOTC products and fixed income – iBalcão
Cl i h ’ I t ti

7/27/2019 BVMF Presentation - October 2013
http://slidepdf.com/reader/full/bvmf-presentation-october-2013 21/5821
Clearinghouses’ Integration Further differentiation in BM&FBOVESPA post-trade
Equities and corporate
debt (BRL 85.2 bn*)
Equities, ETFs andcorporate fixed incomecash market
Equity and indicesderivatives (options andforward)
Securities lending
Derivatives
(BRL 111.2 bn*)
Financial andcommodities derivatives(futures, options andforwards)
OTC derivatives
FX(BRL 4.8 bn*)
FX spot market
(US$ vs. BRL )
Securities(BRL 1.0 bn*)
Cash market andforward market forgovernment bonds
INTEGRATED CLEARINGHOUSE**=
Capital efficiency
* Aggregate of pledged collateral at our clearinghouses totaled BRL 202.2 billion in Jun. 30, 2013. **IPN/CORE implementation requires the authorization of the regulators.
Hi h h d

7/27/2019 BVMF Presentation - October 2013
http://slidepdf.com/reader/full/bvmf-presentation-october-2013 22/58
22
18.6 28.548.7
115.9 107.5
2009 2010 2011 2012 2013*
48.8
75.2
ADTV before
Market Maker
ADTV after
Market Maker*
2.9 3.96.1
9.0 9.7
2009 2010 2011 2012 2013*
Securities Lending Real Estate Funds (FIIs)Options with Market Maker
(Open Interest - average for the period - in BRL billion)
Initiatives to develop and prompt higher volume in certain products;
Performance shows that the initiatives are being well received by the market.
ETFs Brazilian Treasury Direct - Tesouro Direto Agribusiness Credit Bills
(ADTV in BRL million)
+54.2%
(ADTV in BRL million)
(ADTV in BRL million) (Custody – in BRL billion)
High growth productsGrowing sophistication of market participants
BM&FBOVESPA has a 74% marketshare of the registered AUM (Sep-13).
CAGR(09-13):
+146.2%
CAGR (09-13):
+35.1%
CAGR (09-13):
+55.0%
CAGR (09-13):
+35.2%
*Updated to Sep. 30, 2013. **Updated to Jul. 30, 2013
(AUM – in BRL billion)
*
12.720.5
30.2 31.942.4
2009 2010 2011 2012 2013*
0.9 1.53.7
14.6
34.2
2009 2010 2011 2012 2013*
3.6 20.0
52.0
2011 2012 Sep-13

7/27/2019 BVMF Presentation - October 2013
http://slidepdf.com/reader/full/bvmf-presentation-october-2013 23/58
23
OPERATIONAL PERFORMANCE
Records in 2013
BOVESPA S t

7/27/2019 BVMF Presentation - October 2013
http://slidepdf.com/reader/full/bvmf-presentation-october-2013 24/58
24
BOVESPA SegmentOperational highlights
*Updated to Sep 30, 2013. **Ratio of cash market trading volume to the market cap of the exchange.
AVERAGE DAILY TRADING VOLUME – ADTV (BRL billion)*
AVERAGE ANNUAL MARKET CAP (BRL trillion) TURNOVER VELOCITY** (12 months average*)
0.720.94
1.31
1.98 2.031.83
2.332.37 2.42 2.40
2004 2005 2006 2007 2008 2009 2010 2011 2012 2013*
30.8%
29.4%
36.8%37.6%38.7%42.3%
56.4%
63.2%
66.6%
63.8%
64.2%
70.0%73.4%
2001 2002 2003 2004 2005 2006 2007 2008 2009 2010 2011 2012 2013
1.2 1.6 2.4
4.9 5.5 5.36.5 6.5 7.3 7.7 8.4
6.7 6.67.9 7.3 7.8 7.4 8.2 7.7
8.9
6.08.5
7.2
2004 2005 2006 2007 2008 2009 2010 2011 2012 2013 Sep-12 Oct-12 Nov-12 Dec-12 Jan-13 Feb-13 Mar-13 Apr-13 May-13 Jun-13 Jul-13 Aug-13 Sep-13
*
*
T di i ADR f B ili i

7/27/2019 BVMF Presentation - October 2013
http://slidepdf.com/reader/full/bvmf-presentation-october-2013 25/58
25
Trading in ADRs of Brazilian companiesLiquidity Migration Process Interrupted
Sep´13
Source: Bloomberg (in USD
traded value of 35 companies
with ADRs programs )
Sarbanes-Oxley Act(Jul. 2002)
*Updated to Sep. 30, 2013.
Novo MercadoLaunch
(Dec. 2000)
PUBLIC OFFERINGS IN NUMBER OF COMPANIES
End of IOF Tax (2%) forforeign investors
(Dec. 2011)
End of CPMF(Financial
Transaction Tax)
29.1%
24.8%
19.1%
27.0%
46.1%
53.9%
2001 2002 2003 2004 2005 2006 2007 2008 2009 2010 2011 2012 2013 Total
IPOs - 1 - 7 9 26 64 4 6 11 11 3 7 149
Follow ons 14 5 8 8 10 16 12 8 18 11 11 9 5 135
Total 14 6 8 15 19 42 76 12 24 22 22 12 12 284
Dual Listings - - - 2 1 1 - - 1 - - - - 5
1 9 9 6
1 9 9 7
1 9 9 8
1 9 9 9
2 0 0 0
2 0 0 1
2 0 0 2
2 0 0 3
2 0 0 4
2 0 0 5
2 0 0 6
2 0 0 7
2 0 0 8
2 0 0 9
2 0 1 0
2 0 1 1
2 0 1 2
J a n - 1 3
F e b - 1 3
M a r - 1 3
A p r - 1 3
M a y - 1 3
J u n - 1 3
J u l - 1 3
A u g - 1 3
S e p - 1 3
Other USA Venues - Brazilian ADRs NYSE - Brazilian ADRs
BM&FBOVESPA - companies with ADRs BM&FBOVESPA (except companies with ADRs)
BM&F S t

7/27/2019 BVMF Presentation - October 2013
http://slidepdf.com/reader/full/bvmf-presentation-october-2013 26/58
26
BM&F SegmentOperational highlights
AVERAGE DAILY TRADED VOLUME – ADV (thousands of contracts)
REVENUE PER CONTRACT - RPC (BRL)
*Updated to Sep. 30, 2013.
2006 2007 2008 2009 2010 2011 2012 2013* S-12 O-12 N-12 D-12 J-13 F-13 M-13 A-13 M-13 J-13 J-13 A-13 S-13
Interest rates i n BRL 0.906 0.950 1.141 0.979 0.889 0.918 1.004 1.017 1.130 0.924 1.044 1.037 1.032 1.013 1.037 0.945 0.843 1.099 1.067 1.112 1.222
FX rates 2.244 1.859 2.065 2.161 1.928 1.894 2.205 2.489 2.481 2.506 2.370 2.453 2.368 2.305 2.273 2.292 2.347 2.590 2.691 2.731 2.720
Stock Indices 1.419 1.501 2.145 1.620 1.564 1.614 1.524 1.729 1.407 1.752 1.400 1.981 1.547 1.974 1.413 1.846 1.408 1.867 1.590 1.938 1.656
Interest rates i n USD 1.094 0.965 1.283 1.357 1.142 0.941 1.015 1.200 1.086 1.024 1.164 1.152 1.073 1.140 1.121 1.093 0.928 1.280 1.370 1.309 1.412
Commodities 4.749 3.195 3.587 2.307 2.168 2.029 2.239 2.514 2.840 2.680 2.485 3.360 2.449 2.415 2.382 2.349 2.550 2.595 2.632 2.385 2.766
Mini contracts 0.034 0.054 0.162 0.176 0.128 0.129 0.116 0.119 0.109 0.112 0.107 0.112 0.120 0.122 0.119 0.118 0.116 0.119 0.114 0.117 0.126
OTC 1.571 2.111 2.355 1.655 1.610 1.635 1.769 1.529 1.139 1.738 1.711 2.475 1.988 2.868 1.642 1.460 1.428 1.418 1.839 1.160 1.477
Total RPC 1.247 1.224 1.527 1.365 1.134 1.106 1.191 1.242 1.314 1.098 1.242 1.303 1.266 1.191 1.190 1.114 1.020 1.361 1.320 1.397 1.511
422 501 711 988 789 843
1,684 1,797 1,926 2,0461.710
2.1991.747 1.856 1.561
2.6302.235
2.694 2.944
1.977
1.5191.713
1.239110 168266
473535 447
541 496 494 505451
327476 547
474
494491
468507
635
435541
502
86 74
68
112 88 80
89 123 143 120111
12399
11384
126
100
145105
183
99146
90
187109
124
167162 150
191 285336 380
355322
331340
290
341
341
352424
495
389434
351
805 8521,167
1,740 1,573 1,521
2,505 2,701 2,899 3,0502,626
2,9712,653 2,856
2,410
3,5913,166
3,6583,980
3,290
2,4332,835
2,182
2004 2005 2006 2007 2008 2009 2010 2011 2012 2013* Sep-12 Oct-12 Nov-12 Dec-12 Jan-13 Feb-13 Mar-13 Apr-13 May-13 Jun-13 Jul-13 Aug-13 Sep-13
BRL Int. Rate (Thousands) FX (Thousands ) Index (Thous ands ) Others (Thousands)
Investor participation in volumes

7/27/2019 BVMF Presentation - October 2013
http://slidepdf.com/reader/full/bvmf-presentation-october-2013 27/58
27
Investor participation in volumesEquities and derivatives segments
BM&F SEGMENT (DERIVATIVES)
BOVESPA SEGMENT (EQUITIES)
56% 51% 49% 48% 45% 42% 38% 34% 33% 33% 29% 31% 32% 37% 32% 34% 30% 32%
12% 15% 17% 19% 20% 22% 23% 25% 25% 23% 25% 26% 26%26%
25% 23% 25% 26%
24%25% 23%
23%24%
30%33% 34% 36% 38% 41% 38% 37% 32% 36% 35% 37% 33%
7% 7% 9% 8% 8% 4% 4% 5% 5% 4% 3% 4% 4% 4% 5% 6% 6% 6%
2005 2006 2007 2008 2009 2010 2011 2012 2013 Jan-13 Feb-13 Mar-13 Apr-13 May-13 Jun-13 Jul-13 Aug-13 Sep-13
Individuals Institutional Investors Foreign Investors Financial Institutions Companies Central Bank
25% 25% 23% 27% 31% 26% 21% 18% 15% 17% 16% 18% 15% 16% 13% 16% 14% 15%
27% 27% 30% 27% 26% 33%33% 32% 33% 35% 33% 32% 32% 32% 33% 32% 34% 32%
33% 36% 35% 35% 34% 30% 35% 40% 43% 40% 41% 43% 42% 44% 44% 45% 42% 46%
12% 10% 10% 8% 7% 8% 9% 8% 8% 8% 9% 7% 9% 7% 8% 6% 9% 6%
2005 2006 2007 2008 2009 2010 2011 2012 2013 Jan-13 Feb-13 Mar-13 Apr-13 May-13 Jun-13 Jul-13 Aug-13 Sep-13
Individuals Institutional Investors Foreign Investors Financial Institutions Companies Others

7/27/2019 BVMF Presentation - October 2013
http://slidepdf.com/reader/full/bvmf-presentation-october-2013 28/58
28
FINANCIAL HIGHLIGHTS
Reduction in expenses. Return to shareholders
Income Statement
7/27/2019 BVMF Presentation - October 2013
http://slidepdf.com/reader/full/bvmf-presentation-october-2013 29/58
29
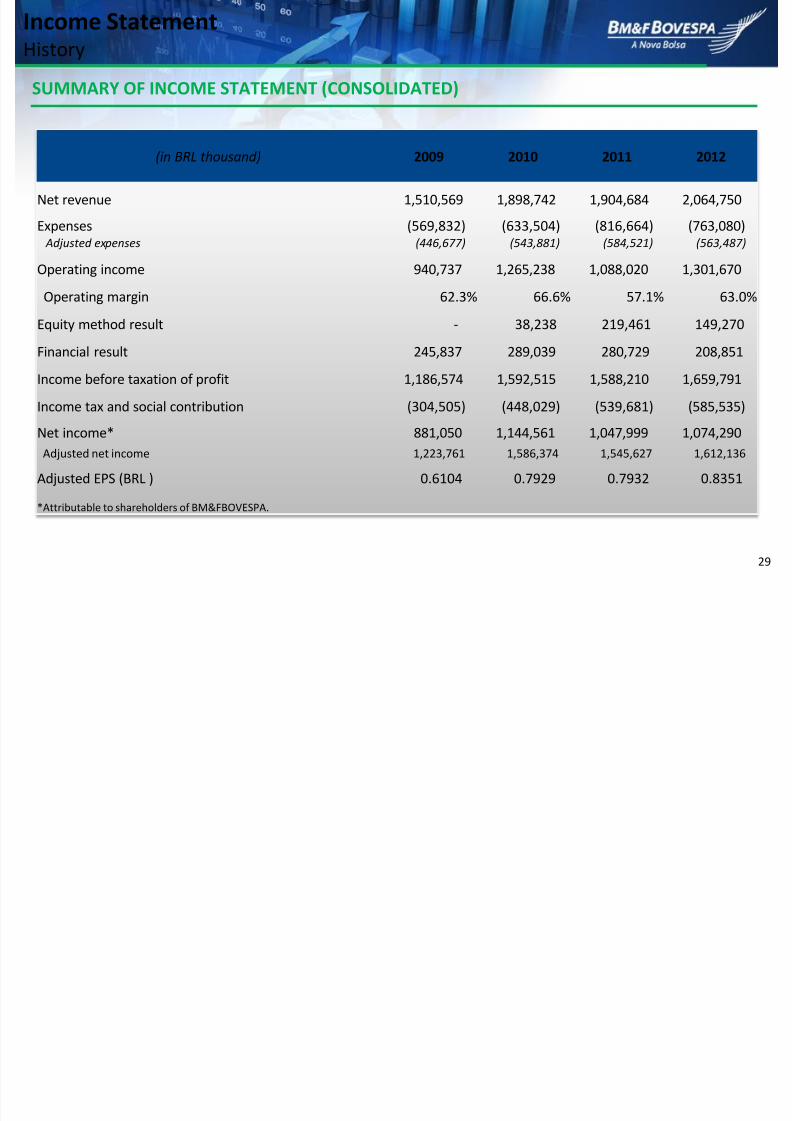
Income StatementHistory
SUMMARY OF INCOME STATEMENT (CONSOLIDATED)
(in BRL thousand) 2009 2010 2011 2012
Net revenue 1,510,569 1,898,742 1,904,684 2,064,750
Expenses (569,832) (633,504) (816,664) (763,080) Adjusted expenses (446,677) (543,881) (584,521) (563,487)
Operating income 940,737 1,265,238 1,088,020 1,301,670
Operating margin 62.3% 66.6% 57.1% 63.0%
Equity method result - 38,238 219,461 149,270
Financial result 245,837 289,039 280,729 208,851
Income before taxation of profit 1,186,574 1,592,515 1,588,210 1,659,791
Income tax and social contribution (304,505) (448,029) (539,681) (585,535)
Net income* 881,050 1,144,561 1,047,999 1,074,290
Adjusted net income 1,223,761 1,586,374 1,545,627 1,612,136
Adjusted EPS (BRL ) 0.6104 0.7929 0.7932 0.8351
*Attributable to shareholders of BM&FBOVESPA.
7/27/2019 BVMF Presentation - October 2013
http://slidepdf.com/reader/full/bvmf-presentation-october-2013 30/58
Adjusted Opex¹ and Capex Budgets
7/27/2019 BVMF Presentation - October 2013
http://slidepdf.com/reader/full/bvmf-presentation-october-2013 31/58
31
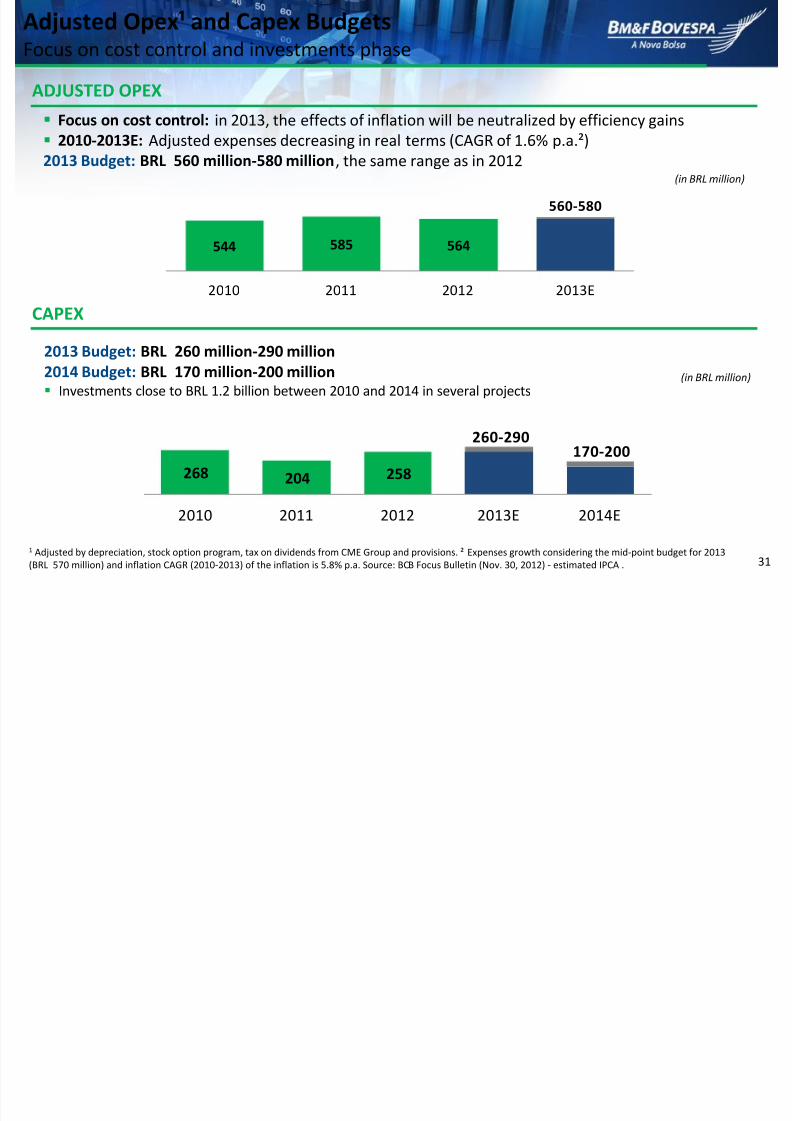
Adjusted Opex¹ and Capex BudgetsFocus on cost control and investments phase
Focus on cost control: in 2013, the effects of inflation will be neutralized by efficiency gains
2010-2013E: Adjusted expenses decreasing in real terms (CAGR of 1.6% p.a.²)2013 Budget: BRL 560 million-580 million, the same range as in 2012
1 Adjusted by depreciation, stock option program, tax on dividends from CME Group and provisions. ² Expenses growth considering the mid-point budget for 2013
(BRL 570 million) and inflation CAGR (2010-2013) of the inflation is 5.8% p.a. Source: BCB Focus Bulletin (Nov. 30, 2012) - estimated IPCA .
(in BRL million)
ADJUSTED OPEX
CAPEX
(in BRL million)
2013 Budget: BRL 260 million-290 million
2014 Budget: BRL 170 million-200 million Investments close to BRL 1.2 billion between 2010 and 2014 in several projects
544 585 564
560-580
2010 2011 2012 2013E
268 204 258
260-290170-200
2010 2011 2012 2013E 2014E
Growth Path

7/27/2019 BVMF Presentation - October 2013
http://slidepdf.com/reader/full/bvmf-presentation-october-2013 32/58
32
(in BRL million)
(in BRL)
GROWTH IN ADJUSTED EARNINGS PER SHARE
GROWTH IN REVENUES AND RESULTS
Growth PathGrowth in business and results
Financial Highlights

7/27/2019 BVMF Presentation - October 2013
http://slidepdf.com/reader/full/bvmf-presentation-october-2013 33/58
33
7051,145 912 1,074
75
435 606 16780
1,579 1,518
1,091
2009 2010 2011 2012
Total payout Buyback
Financial HighlightsFocus on cash generation and total shareholder return
HISTORY OF PROCEEDS
SHARE BUYBACK: MAXIMIZING RETURN
(in BRL millon)
(in BRL million)
*Dividend Yield is the result of the sum of earnings per share distributed during the year divided by the average share price during the year. ROIC: Return on Invested Capital.
1,612Adj. Netincome
1,5461,5861,224
1,074 Net income1,0481,145881
432841 762 984274
304150
90705
1,145912
1,0743.4%
4.5%4.5%
4.8%80%
100%87%
100%
2009 2010 2011 2012
Dividends Interest on capital Dividend Yield* Payout ratio (%)
8.9% ROIC8.4%9.4%8.3%
Financial Soundness

7/27/2019 BVMF Presentation - October 2013
http://slidepdf.com/reader/full/bvmf-presentation-october-2013 34/58
34
Sound financial position - an important factor for the Company, given itsrole as CCP, guaranteeing the settlement of trades executed by global
and Brazilian investors
Standard & Poor sBBB+ (counterparty credit rating)
A-2 (issuer)
Moody sA3 (global scale issuer)
A3 (Brazilian local currency issuer)
Baa1 (global notes)
R$ million Dec/10 Dec/11 Dec/12 Jun/13
Available funds 1,677 1,582 1,964 1,967
Indebtedness 1,043 1,172 1,279 1,388
R$ million
CASH POSITIONSOUND FINANCIAL POSITION
*Includes collateral pledged by participants in the form of cash, receivables and rights in securities under custody, as well as payouts still undisbursed.
**Includes third party collateral and restricted funds at BM&FBOVESPA Settlement Bank (Banco BM&FBOVESPA).
993
1,551
1,191
1,139
496
380
346
351
269
270
350
475
1,677
1,582
1,964
1,967
3,435
3,782
3,851
3,932
4Q10
4Q11
4Q12
2Q13
Market participants´ cash collateral and others*
Restricted funds
Subsidiaries**
Available funds
Financial SoundnessHigh liquidity and low indebtedness

7/27/2019 BVMF Presentation - October 2013
http://slidepdf.com/reader/full/bvmf-presentation-october-2013 35/58
35
APPENDIX
Financial Highlights

7/27/2019 BVMF Presentation - October 2013
http://slidepdf.com/reader/full/bvmf-presentation-october-2013 36/58
36
Different earnings impact the P/E calculation and distort comparisons and market consensus
The reported adjusted net income reflects better the company´s cash generation
1 Excludes the investment in associate (CME Group) accounted under the equity-method. 2 Simulates the Interest on Capital amount that would be approved if
there was no goodwill tax benefit; 3 Stock at R$13.79 (March 12 th, 2013).
EPS 2012 P/E3
Estimated GAAP EPS (A) 0.56 24.8
Earnings without goodwill = (A) x Δ:1,142 0.64 21.7
Stock price discounted by goodwill NPV(R$1.00 per share) / Earnings without
goodwill0.64 20.1
Adjusted Earnings 0.84 16.5
15-20% impact on P/E multiple
Difference between GAAP EPS andthe EPS adjusted to non existence of
goodwill simulation
GAAP Book in 2012Current
Simulation withoutgoodwillR$ millions
EBT¹ 1,511 1,511
Deferred Tax 539 -
Other taxes /credits (14) -
Total taxes 525 282
GAAP Net income 1,074 1,228 Δ: 14.2%
Tax Book in 2012Current
Simulationwithout goodwill
R$ millions
EBT¹ 1,511 1,511
(-) Goodwill amortization 1,586 -
(-) Interest on capital 90 680(2)
(=) Taxable earnings (165) 831
Tax (34%) (56) 282
Since 2009, the goodwill tax benefit has been recognized as deferred liability (being cashneutral), reducing the GAAP earnings
Financial HighlightsP/E analysis
BOVESPA Segment

7/27/2019 BVMF Presentation - October 2013
http://slidepdf.com/reader/full/bvmf-presentation-october-2013 37/58
37
PUBLIC OFFERINGS (BRL billion)
PIPELINE: OFFERINGS ANNOUNCED SO FAR TO THE MARKET
Updated to Sep. 30, 2013.
BOVESPA SegmentRaising Capital
There are 7 offerings in the pipeline
IPOs (5): Ouro Verde Locação e Serviço; Unidas; Sascar participações; Ser educacional; Gaec Educação
Follow-ons (2): Tupy, Cambuci
Additionally, there are 21 Real Estate Funds filed with CVM: estimated value of R$ 3.6billion
* Excludes the portion acquired by the Brazilian government in the Petrobras offering, via the transfer of rights in barrels (BRL 74.8 billion).
4.3 8.5 15.1 14.526.8 22.2
63.2
10.8 9.3 2.74.55.4
15.4
55.6
7.5 23.8
11.2
7.2 3.9 15.68.8
13.9
30.4
70.1
34.346.0
74.4
18.0 13.218.3
2004 2005 2006 2007 2008 2009 2010* 2011 2012 2013
Follow-On
IPO
BOVESPA Segment

7/27/2019 BVMF Presentation - October 2013
http://slidepdf.com/reader/full/bvmf-presentation-october-2013 38/58
38
BOVESPA SegmentForeign investment flow
MONTHLY NET FLOW OF FOREGIN INVESTMENTS (in BRL billon)
Includes public offering (primary market) and regular trades (secondary market).
Updated until Sep. 30, 2013.
0.4
1.7
(1.3)
1.8
3.4
1.9 2.2
(0.4)(0.2)
0.8 1.0
(2.4)
7.2
(1.1)(1.3)
2.9
(2.3)
(0.3)
0.61.1
(4.2)
(1.2)
0.7
4.9 4.9
2.6
1.6
7.6
(1.2)
(3.8)
0.1 0.3
4.2
BOVESPA Segment

7/27/2019 BVMF Presentation - October 2013
http://slidepdf.com/reader/full/bvmf-presentation-october-2013 39/58
39
11.2%
14.3%
2.2%
5.1%
20.4%
5.4%
0.4%5.5%
8.8%
26.8%
Oil, Gas and Biofuels Basic Materials Capital Goods and Service s Construction and TransportationConsumer Non Cyclical Consumer Cyclical Information Technology Telecommunications
Public Utilities Financial
15.7%
21.6%
2.5%
3.6%
8.6%
2.6%
0.3%11.1%
11.5%
22.4%
BOVESPA SegmentPotencial to increase the number of listed companies
177%
126% 121%
109%100%
136%
67%75%
87%
72%
129%
100%
39%
174%
137%
158%
119%107%
129%
75% 76%
96%
72%
138%
80%
44%
129%
110% 109%104%
89% 87%
60%57% 55% 50% 49% 46%
35%
Singapore Canada Chile USA Korea Australia Japan France India Brazil UK China Mexico
2009 2010 2011
MARKET CAPITALIZATION TO GDP (%)*
MARKET CAPITALIZATION BY ECONOMIC SECTOR * Source: World Bank
Dec’05 Dec’12
Hong Kong : 438% 481% 365%
High Frequency Trading (HFT)

7/27/2019 BVMF Presentation - October 2013
http://slidepdf.com/reader/full/bvmf-presentation-october-2013 40/58
40
High Frequency Trading (HFT)
BOVESPA SEGMENT: HFT ADTV* (BRL million) AND MKT. SHARE
BM&F SEGMENT: HFT ADV* (thousands of contracts) AND MKT. SHARE
*Updated to Sep. 30, 2013
84 95179 146 135 193 209 209 191
270 25167 101
148120 129
137 74 45 53
78 97
4445
6851 47
6558 53 48
70 61
211251
420342
413 404342 307 292
418 409
3.9% 5.0%7.8% 7.3% 8.0%
6.3% 6.7% 5.7% 5.0% 6.0%8.7%
1Q11 2Q11 3Q11 4Q11 1Q12 2Q12 3Q12 4Q12 1Q13 2Q13 3Q13
Mini FX Equities Other % of overall volume
319 447835 917 874
1,186 1,044830 927
876 1,160291
267
319 249 325
268252
233296
256 207
205184
175 146 -74
341369
667 450
814 899
1,329 1,3121,199
1,454 1,369 1,4041,592
1,800 1,8186.1% 7.4%
10.3% 10.3% 8.5% 9.4% 9.8% 9.9% 10.6% 10.7%
13.4%
1Q11 2Q11 3Q11 4Q11 1Q12 2Q12 3Q12 4Q12 1Q13 2Q13 3Q13
ADTV (Foreigners) ADTV (Individuals) ADTV (Institutionals) % of overall market
R l t F k

7/27/2019 BVMF Presentation - October 2013
http://slidepdf.com/reader/full/bvmf-presentation-october-2013 41/58
41
CLEARINGHOUSES’ ACTIVITIES
Law 10.214 of Mar. 27, 2001 Clearinghouses considered systemically important by
the BCB should ensure settlement (i.e., act as CCPs)
BCB Resolution 2.882 of Aug. 30, 2001
Clearinghouses shall guarantee, at least, settlement
of the highest net amount owed
Access criteria must be public and allow wide
participation
Circular BCB 3.057 of Aug. 31, 2001
Rules, manuals and safeguard mechanisms must be
approved by BCB
Maintenance of a secondary data center and
contingency procedures
Supervision by BCB
CVM Instruction 441 of Nov. 10, 2006
Securities lending with guaranteed settlement - final
beneficiary model
STOCK EXCHANGE ACTIVITY
CVM Instruction 461 of Oct. 23, 2007
Regulates the security markets and
decides on the formation, organization,
operation and dissolution of stock
exchanges, futures and commodities
exchanges and OTC markets
Establishes the organization and
minimal corporate governance
structure of organized market
management bodies
Establishes self-regulation activities of the in the organized market
management bodies
Regulatory Framework
BM&FBOVESPA Market Supervision (BSM)

7/27/2019 BVMF Presentation - October 2013
http://slidepdf.com/reader/full/bvmf-presentation-october-2013 42/58
42
AuditMarket
supervision
Analysisand
strategyLegal dept.
Self –regulation
Officer
Supervision Board(12 members*)
StrategicCommittee
• Atribuições da BSM estabelecidas na
Instrução CVM 461/2007:
Monitor and supervise transactions in
the organized markets
Determine deficient compliance with
the rules and norms
Monitor the activities of the Stock
Exchange
Initiate and prosecute disciplinary
administrative legal proceedings
Apply penalities
Main activities of BSM Organizational chart
Monitor 100% of the participants’
transactions
Assess 100% of intermediaries
Enforcement Education
BSM duties established in CVM Instruction461/2007
BSM is is a not-for-profit association organized as a self-regulatory and market surveillanceorganization, responsible for regulatory and oversight activities relative to the markets we operate.
* 9 independent
BM&FBOVESPA Market Supervision (BSM)Self-Regulation Entity

7/27/2019 BVMF Presentation - October 2013
http://slidepdf.com/reader/full/bvmf-presentation-october-2013 43/58
43
How? Why?
BM&FBOVESPA’s Sustainability Mission
Program created in 2010
as the umbrella of exchange s
sustainability actions.
It aims to instigate and
promote the sustainabledevelopment of BM&FBOVESPA
and capital markets, involving
various audiences: investors,
companies, brokerage houses etc
New products and services
New Markets
International projection
Competitive edge
Risk management Cost reduction
Induction Role
Image
Reputation
Sustainability Policy
To promote sustainability and strategically-aligned private social investment, contributing towards the institutional strengthening of
BM&FBOVESPA
BM&FBOVESPA’s Sustainability Policy

7/27/2019 BVMF Presentation - October 2013
http://slidepdf.com/reader/full/bvmf-presentation-october-2013 44/58
44
BM&FBOVESPA s Susta ab ty o cyApproved by the Board at 4/4/2013
BM&FBOVESPA’s Sustainability Policy

7/27/2019 BVMF Presentation - October 2013
http://slidepdf.com/reader/full/bvmf-presentation-october-2013 45/58
45
• ISE – Corporate Sustainability Indexand ETF
• IGC – Corporate Governance Indices
• Em Boa Companhia(program with listed companies)
• Founding Signatory to the SustainableStock Exchanges Initiative – UN
• Signatory to the PRI – Principles forResponsible Investment - UN
• ICO2 – Carbon Efficient Index and ETF• Carbon Market• Green IT•
Greenhouse Gas Emissions Inventory(verification and offsetting)
• Compensation of greenhouse gasemissions
• Selective collection program
• Internal and External stakeholders
• Signatory to the Global Compact(the first stock exhange in the world)
• Compacts and commitments
• BM&FBOVESPA Institute
• Voluntary Service Program
• Novo Mercado
•
Sustainability Policy • Report or Explain for Sustainability
reports
• Internal governance (SustainabilityComission and Committee)
• Annual Report by GRI Model
y yInitiatives

7/27/2019 BVMF Presentation - October 2013
http://slidepdf.com/reader/full/bvmf-presentation-october-2013 46/58
46
RESULTS FOR 2Q13
Revenue growth and cost control
2Q13 vs. 2Q12 Highlights

7/27/2019 BVMF Presentation - October 2013
http://slidepdf.com/reader/full/bvmf-presentation-october-2013 47/58
47
Total revenue: R$668.8 million, +10.9%
BOVESPA seg.: R$289.5 million, +7.7% BM&F seg. R$268.8 million, +12.2%
Other revenue: R$110.5 million, +16.4%
Net revenue: R$599.8 million, +10.8%
Adjusted expenses¹: R$133.2 million, +4.1%
Operating income: R$423.0 million, +12.8%
Adjusted net income²: R$469.6 million, +11.0%
Adjusted EPS: R$0.244, +11.4%
Dividends: payment of R$280.7 million in 2Q13,
R$0.147 per share (80% of GAAP net income)
EBITDA: R$503.2 million, +14.0% and margin of 83.9%(according to CVM Rule 527/12 that does not exclude equity methodaccounting).
BOVESPA segment:
ADTV: R$8.3 billion, +8.5% Margin: 5.314 bps, -3.4%
BM&F segment:
ADV: 3.6 million contracts, +8.7%
RPC: R$1.151, +1.6%
High growth products:
Securities Lending: record of average open interestpositions (R$44.8 billion), +53.4%
Tesouro Direto: +10.4% average of assets under custody
FIIs (real estate funds): strong growth in ADTV (R$41.3
million in 2Q13) and number of investors (104.1 thousand)
LCAs (agribusiness credit bills): assets under custody of
R$52.3 billion in Jun/13.
MAIN PROJECTS AND HIGHLIGHTS
47
Q Q g gRecord of revenue and volumes
FINANCIAL HIGHLIGHTS OPERATIONAL HIGHLIGHTS
1Expenses adjusted to Company´s depreciation, stock options plan, tax on dividends from the CME
Group and provisions.2Net income adjusted by: i) the e ffect of deferred liability recognition in connection with temporary
differences from amortization of goodwill for tax purposes; ii) the impact of the stock options plan;
iii) investment in affiliates (CME Group) accounted for under the equity method, net of taxes; andiv) taxes paid overseas to be compensated.3IPN/CORE implementation requires the authorization of the regulators.
PUMA Trading System™: less than 1 millisecond of latency
Clearinghouses Integration (IPN)3: integrated tests with
market participants started in Jul/13.
iBalcão - OTC Platform: in operation for FX NDFs since Jul/13
Pricing: first phase of changes for cash equities implemented
on Apr/13SMEs: proposals for developing the Access Market
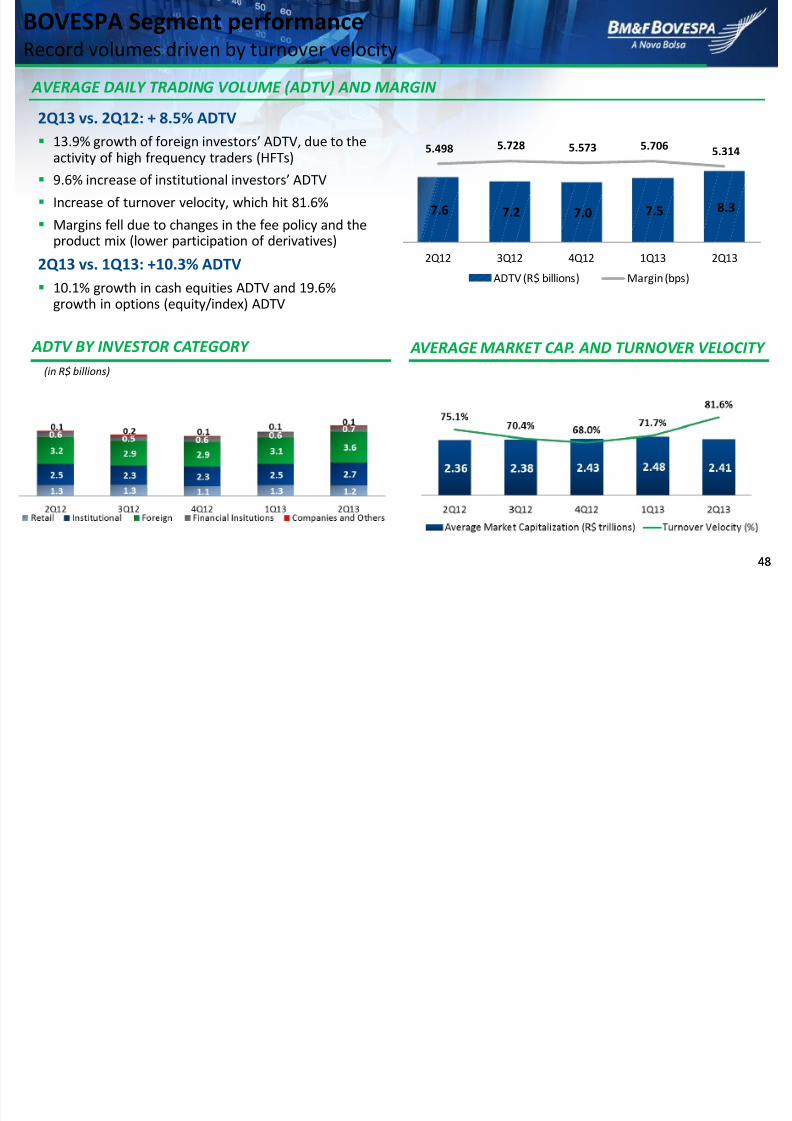
BOVESPA Segment performance
7/27/2019 BVMF Presentation - October 2013
http://slidepdf.com/reader/full/bvmf-presentation-october-2013 48/58
48
2Q13 vs. 2Q12: + 8.5% ADTV
13.9% growth of foreign investors’ ADTV, due to theactivity of high frequency traders (HFTs)
9.6% increase of institutional investors’ ADTV
Increase of turnover velocity, which hit 81.6%
Margins fell due to changes in the fee policy and theproduct mix (lower participation of derivatives)
2Q13 vs. 1Q13: +10.3% ADTV
10.1% growth in cash equities ADTV and 19.6%growth in options (equity/index) ADTV
48
AVERAGE DAILY TRADING VOLUME (ADTV) AND MARGIN
g pRecord volumes driven by turnover velocity
AVERAGE MARKET CAP. AND TURNOVER VELOCITY ADTV BY INVESTOR CATEGORY
(in R$ billions)
7.6 7.2 7.0 7.5 8.3
5.498 5.728 5.573 5.706 5.314
2Q12 3Q12 4Q12 1Q13 2Q13
ADTV (R$ billions) Margin (bps)
BM&F Segment Performance

7/27/2019 BVMF Presentation - October 2013
http://slidepdf.com/reader/full/bvmf-presentation-october-2013 49/58
49
2Q13 vs. 2Q12: +8.7% ADV
ADV: 12.8% increase in Brazilian Real interest ratecontracts
RPC: +1.6%
• Appreciation of the FX rate (USD/R$) - FX and USDDollar interest rate contracts
• Growth in RPC of index-based contracts
2Q13 vs. 1Q13: +20.5% ADV
+20.5% interest rate contracts in R$ ADV.
49
ADV BY INVESTOR CATEGORY
(in %)
AVERAGE DAILY VOLUME (ADV) AND AVERAGE RPC
gRecord ADV driven by interest rate contracts
INTEREST RATES IN R$ - ADV BY MATURITY
(in millions of contracts)
(in millions of contracts)
0.3 0.2 0.6 0.30.8
1.9
(86%) 1.6
(90%)
1.4( 71%)
1.8
(84%)
1.8
(70%)
2.3
1.81.9 2.1
2.5
2Q12 3Q12 4Q12 1Q13 2Q13
1st-3rd Maturity 4th Maturity-on
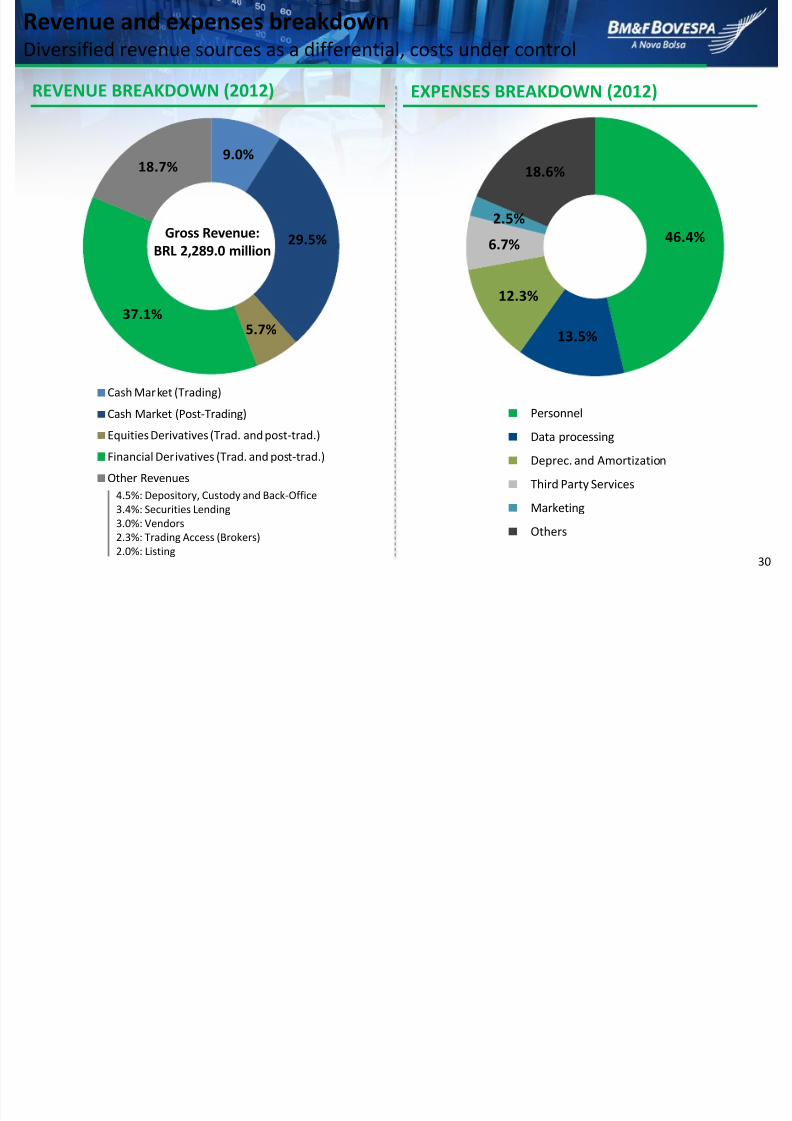
Revenue Breakdown in 2Q13

7/27/2019 BVMF Presentation - October 2013
http://slidepdf.com/reader/full/bvmf-presentation-october-2013 50/58
50
6.3%
30.9%
4.3%39.3%
19.2%
39.3%: Financial/Commodity Derivatives
37.2%: Cash Market¹
6.3%: Trading
30.9%: Post-Trade
4.3%: Stock and Indices Derivatives
Total RevenueR$668.8 million
4.4%: Securities Lending
4.3%: Depository, Custody and Back-Office
2.6%: Vendors
1.9%: Trading Access
1.8%: Listing
19.2%: Other Revenues
50
Diversified revenue sources as a differential
REVENUE BREAKDOWN
¹Revenue breakdown for the cash market (trading + post-trade) reflects the pricing policy changes which came into force in Apr/13.
i) Reduction of trading fee to 0.5 bps from 0.7 bps for all investors
ii) Post-trade increase to 2.0 bps from 1.8 bps for institutional investors and day trades
CASH MARKET TRADING REVENUE
ACCOUNTED FOR6.3% OF TOTAL
DERIVATIVES REVENUE
(BM&F + BOVESPA) ACCOUNTED FOR43.6% OF THE TOTAL
2Q13 Expenses

7/27/2019 BVMF Presentation - October 2013
http://slidepdf.com/reader/full/bvmf-presentation-october-2013 51/58
51
Expense:R$176.8million
51
Continued focus on cost control and operational efficiency
ADJUSTED EXPENSE TOTAL EXPENSE BREAKDOWN
(in R$ millions)
*Includes expenses with maintenance in general, taxes adjusted by the dividends from CME Group,board and committee members’ compensation and others (excluding provisions).
**12 month inflation (Consumer Price Index - IPCA) of 6.7%. Source: IBGE.
127.9133.2
7.3 1.0
(1.8)
0.3
(1.6)
0.1
2Q12 Adj.
Exp.
Adj.
Personnel
Data proc. Third
Party
Commun. Marketing Others* 2Q13 Adj.
Exp.
ADJUSTED EXPENSE INCREASED 4.1% OVER2Q12, BELOW ACCUMULATED INFLATION IN
THE PERIOD** AND IN LINE WITH THE BUDGETFOR THE YEAR (R$560-580 MILLION)
Financial Highlights

7/27/2019 BVMF Presentation - October 2013
http://slidepdf.com/reader/full/bvmf-presentation-october-2013 52/58
52
1,443
1,166
1,191
1,041
1,139
340
343
346
348
351
363
390
350
440
475
1,979
2,100
1,964
2,341
1,967
4,125
3,999
3,851
4,169
3,932
2Q12
3Q12
4Q12
1Q13
2Q13
Market participants cash collateral and others* Restricted funds
Subsidiaries** Available funds
*Includes collateral pledged by participants in the form of cash, receivables and rights in securities under
custody, as well as payouts still undisbursed.**Includes third party collateral and restricted funds at BM&FBOVESPA Settlement Bank (Banco
BM&FBOVESPA). 52
Reduction compared to 1Q13 due to dividend paymentsin April and June and execution of the buyback program
Acceleration of the share buyback program
(In R$ millions)
CASH AND FINANCIAL INVESTMENTS RETURN TO SHAREHOLDERS
FINANCIAL RESULTS
Financial result of R$43.1 million, down 21.2% YoY
Financial expenses rose 44.9%, reflecting, mainly, thedepreciation of the Brazilian Real against the USD
Financial income down 1.9%, reflecting the interestrate reduction
CAPEX
In 2Q13, investments amounted to R$78.6 million,totaling R$120.4 million in 1H13
CAPEX budget ranges:
2013: between R$260 – 290 million
2014: between R$170 – 200 million
BUYBACK PROGRAM
Repurchased 20.9 million shares (R$263.1 million) in2Q13, at an average price of R$12.61 per share (morethan 1.0% of the Company’s free-float)***
New program: up to 60 million shares until Jun/14.Through Jul/13, 3.35 million shares were repurchasedat the average price of R$12.33 per share
PAYOUT On Aug. 8, 2013, the Board of Directors approved the
payment of R$280.7 million in dividends, equivalentsto R$0.147 per share and 80% of GAAP net income
Payment on Sep. 30, 2013 based on shareholders’position dated Aug. 21, 2013
*** This share buyback program ended on June 28, 2013 and authorized the acquisition of up to
60.0 million shares.
Summary of Income Statement (consolidated)

7/27/2019 BVMF Presentation - October 2013
http://slidepdf.com/reader/full/bvmf-presentation-october-2013 53/58
53
(in R$ millions, unless otherwise indicated) 2Q13 2Q12Change
2Q13/2Q121Q13
Change
2Q13/1Q13
Net revenues 599.8 541.2 10.8% 521.0 15.1%
Expenses (176.8) (166.1) 6.4% (172.8) 2.3%
Operating income 423.0 375.0 12.8% 348.2 21.5%
Operating margin 70.5% 69.3% 122 bps 66.8% 369 bps
Equity in income of investees 51.4 42.4 21.3% 37.2 38.3%
Financial results 43.1 54.7 -21.2% 37.1 16.0%
EBT 517.5 472.1 9.6% 422.5 22.5%
Net income* 350.8 300.1 16.9% 267.0 31.4%
Adjusted net income 469.6 422.9 11.0% 394.6 19.0%
Adjusted EPS (in R$) 0.244 0.219 11.4% 0.204 19.6%
Adjusted expenses (133.2) (127.9) 4.1% (124.0) 7.4%
Summary of Income Statement (consolidated)
* Attributable to BM&FBOVESPA shareholders.
NET INCOME GROWTH REFLECTING GOOD OPERATING PERFORMANCE
THE DECREASE IN FINANCIAL RESULTS WAS PRACTICALLY OFFSET BY THE INCREASEIN THE EQUITY IN INCOME OF INVESTEES
High growth products

7/27/2019 BVMF Presentation - October 2013
http://slidepdf.com/reader/full/bvmf-presentation-october-2013 54/58
54
Increasing revenue diversification
54
CAGR: +48%
*Updated until June 28, 2013.
OPERATIONAL FIGURES REVENUE
CAGR: +197% CAGR: +30%
CAGR: +55% CAGR: +36%
CAGR: +249% CAGR: +14%
29.2
49.076.6
94.0
2.8%
4.7%
6.6%7.5%
1H10 1H11 1H12 1H13
Revenue (R$ million) Share in total revenue (%)
Strong revenue growth of selected
products
In 1H13, representing 7.5% of total
revenue, or R$94.0 million
Products well received by clients
Continuous developments to maintain
strong growth trend
1.5
40.1
2010 2013*
FIIs (ADTV - R$ million)
20.5
44.7
2010 2013*
Securities Lending
(open interest - R$ billion)
28.5
107.0
2010 2013*
ETFs (ADTV - R$ million)
51.5
77.2
2011 2013*
Options with market maker
(ADTV - R$ million)
3.6
43.7
2011 2013*
LCAs (assets registered - R$ billion)
3,9
9,7
2010 2013*
Tesouro Direto
(ativos em custódia - em R$ BI)
Company's priorities

7/27/2019 BVMF Presentation - October 2013
http://slidepdf.com/reader/full/bvmf-presentation-october-2013 55/58
Company s priorities
REVENUE GROWTH AND DIVERSIFICATION
Growth of the main markets and products (equities and derivatives) Focus on developing products and markets with high growth potential and which
diversify revenue
ACHIEVING OPERATING AND TECHNOLOGICAL EXCELLENCE
Development of platforms that bring efficiency to BM&FBOVESPA and the market
Assuring market integrity (risk control)
FOCUS ON THE CUSTOMER
Deepen the relationship with investors, brokerage houses and issuers, strengthening theCompany's position
Launch of new products
SHAREHOLDER RETURN
Remain focused on cost control
Payment of at least 80% of GAAP earnings as dividends
Share buyback program
55
Summary of Balance Sheet (Consolidated)

7/27/2019 BVMF Presentation - October 2013
http://slidepdf.com/reader/full/bvmf-presentation-october-2013 56/58
56
Summary of Balance Sheet (Consolidated)
LIABILITIES AND SHAREHOLDERS’ EQUITY ASSETS
(in R$ millions) 06/30/2013 12/31/2012 (in R$ millions) 06/30/2013 12/31/2012
Current assets 3,539.0 3,536.3 Current liabilities 1,735.3 1,660.6
Cash and cash equivalents 187.6 43.6 Collateral for transactions 1,010.8 1,134.2
Financial investments 3,093.6 3,233.4 Others 724.5 526.4
Others 257.8 259.3 Non-current liabilities 3,517.2 3,072.6
Non-current assets 21,151.2 20,610.8 Debt issued abroad 1,348.1 1,242.2
Long-term receivables 922.8 808.9 Deferred Inc. Tax and Social Contrib. 2,017.4 1,739.6
Financial investments 651.2 573.6 Others 151.7 90.7
Others 271.5 235.2 Shareholders' equity 19,437.6 19,413.9
Investments 3,235.4 2,928.8 Capital 2,540.2 2,540.2
Property and equipment, net 363.2 361.0 Capital reserve 16,047.2 16,037.4
Intangible assets 16,629.8 16,512.2 Others 834.5 820.3
Goodwill 16,064.3 16,064.3 Non-controlling interests 15.7 16.0
Total Assets 24,690.2 24,147.1 Liabilities and Shareholders' Equity 24,690.2 24,147.1
Reconciliation – 2Q13
7/27/2019 BVMF Presentation - October 2013
http://slidepdf.com/reader/full/bvmf-presentation-october-2013 57/58
57
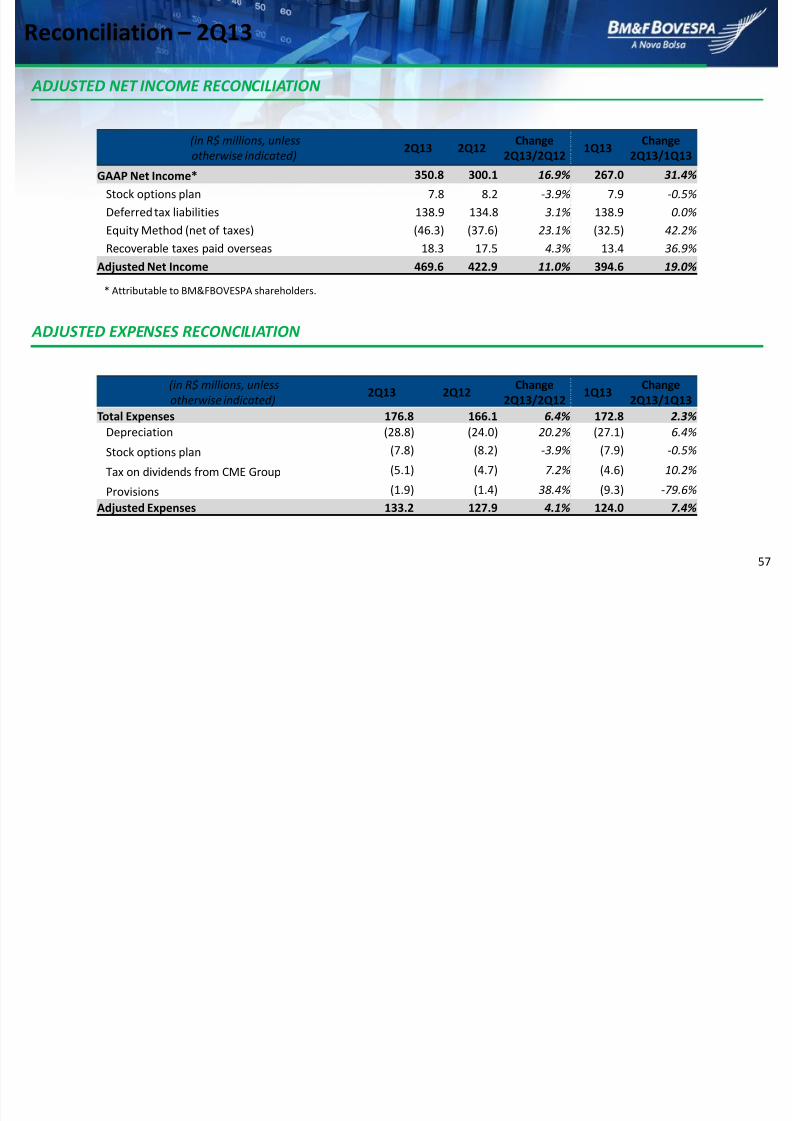
Reconciliation 2Q13
ADJUSTED NET INCOME RECONCILIATION
ADJUSTED EXPENSES RECONCILIATION
* Attributable to BM&FBOVESPA shareholders.
(in R$ millions, unlessotherwise indicated)
2Q13 2Q12 Change2Q13/2Q12
1Q13 Change2Q13/1Q13
GAAP Net Income* 350.8 300.1 16.9% 267.0 31.4%
Stock options plan 7.8 8.2 -3.9% 7.9 -0.5%
Deferred tax liabilities 138.9 134.8 3.1% 138.9 0.0%
Equity Method (net of taxes) (46.3) (37.6) 23.1% (32.5) 42.2%
Recoverable taxes paid overseas 18.3 17.5 4.3% 13.4 36.9%
Adjusted Net Income 469.6 422.9 11.0% 394.6 19.0%
(in R$ millions, unless
otherwise indicated)2Q13 2Q12
Change2Q13/2Q12
1Q13Change
2Q13/1Q13
Total Expenses 176.8 166.1 6.4% 172.8 2.3%
Depreciation (28.8) (24.0) 20.2% (27.1) 6.4%
Stock options plan (7.8) (8.2) -3.9% (7.9) -0.5%
Tax on dividends from CME Group (5.1) (4.7) 7.2% (4.6) 10.2%
Provisions (1.9) (1.4) 38.4% (9.3) -79.6%
Adjusted Expenses 133.2 127.9 4.1% 124.0 7.4%

7/27/2019 BVMF Presentation - October 2013
http://slidepdf.com/reader/full/bvmf-presentation-october-2013 58/58
BM&FBOVESPA – INVESTOR RELATIONS
+55 (11) 2565 4729 / 4418 / 4834 / 7073 / 4007/4702
ir.bmfbovespa.com.br