Buyse Final
40
University of Pennsylvania Annual Conference on Statistical Issues in Clinical Trials April 13, 2011 Efficient source data verification in randomized trials Marc Buyse IDDI, Louvain-la-Neuve and I-BioStat, Hasselt University, Belgium
-
Upload
md-ashfaq-hussain -
Category
Documents
-
view
219 -
download
0
Transcript of Buyse Final

8/3/2019 Buyse Final
http://slidepdf.com/reader/full/buyse-final 1/40
University of Pennsylvania Annual Conference onStatistical Issues in Clinical Trials
April 13, 2011
Efficient source data verificationin randomized trials
Marc Buyse
IDDI, Louvain-la-Neuve and
I-BioStat, Hasselt University, Belgium

8/3/2019 Buyse Final
http://slidepdf.com/reader/full/buyse-final 2/40
2
Outline
1. Trials as a cost-effective, sustainable activity
2. Scientific vs. regulatory requirements
3. The continuum from errors to fraud
4. Monitoring strategies
± Extensive monitoring
± Reduced monitoring
± Targeted monitoring5. The SMART project
6. Conclusions

8/3/2019 Buyse Final
http://slidepdf.com/reader/full/buyse-final 3/40
3
Potential reductions in clinical trial costs
Assumptions: Treatment of chronic disease
20,000 patients
1,000 sites
48 months enrollment (24) + follow-up (24)
24 visits per site (every other month)
60-page CRF
10,000 $ per patient site
Total budget in millions of $: 421 $ Coordinating Center 170 $ (40%)
Site payments 200 $ (48%)
Other costs: travel, meetings, etc 51 $ (12%)
Ref: Ei senst ein et al, Clinical Trial s 2008;5:75 .

8/3/2019 Buyse Final
http://slidepdf.com/reader/full/buyse-final 4/40
4Ref: Ei senst ein et al, Clinical Trial s 2008;5:75 .
Potential reductions in clinical trial costs 4 mths planning
24 mths accrual
1,000 sites
24 site visits
60-page CRF
10,000 $ per site

8/3/2019 Buyse Final
http://slidepdf.com/reader/full/buyse-final 5/40
5Ref: Ei senst ein et al, Clinical Trial s 2008;5:75 .
Potential reductions in clinical trial costs
4 mths planning
18 mths accrual 750 sites
4 site visits
20-page CRF + EDC
5,000 $ per site
4 mths planning
24 mths accrual
1,000 sites
24 site visits
60-page CRF
10,000 $ per site

8/3/2019 Buyse Final
http://slidepdf.com/reader/full/buyse-final 6/40
6Ref: Ei senst ein et al, Clinical Trial s 2008;5:75 .
Potential reductions in clinical trial costs
4 mths planning
18 mths accrual
100 sites
no site visits
5-page CRF + EDC
650 $ per site
4 mths planning
18 mths accrual 750 sites
4 site visits
20-page CRF + EDC
5,000 $ per site
4 mths planning
24 mths accrual
1,000 sites
24 site visits
60-page CRF
10,000 $ per site

8/3/2019 Buyse Final
http://slidepdf.com/reader/full/buyse-final 7/40
7

8/3/2019 Buyse Final
http://slidepdf.com/reader/full/buyse-final 8/40
8
Scientific vs. regulatory requirementsfor a clinical trial
From a scient ific point of view, a trial must estimate the effectof a treatment without bias.
Randomized trials enable such unbiased inference even in
the presence of massive random errors which only causeconservatism (in tests for superiority).
From a regulatory point of view, a trial must provide verifiableevidence that it was carried out according tospecifications.
Absence of errors must be demonstrated regardless of their consequences.
8/3/2019 Buyse Final
http://slidepdf.com/reader/full/buyse-final 9/40
9
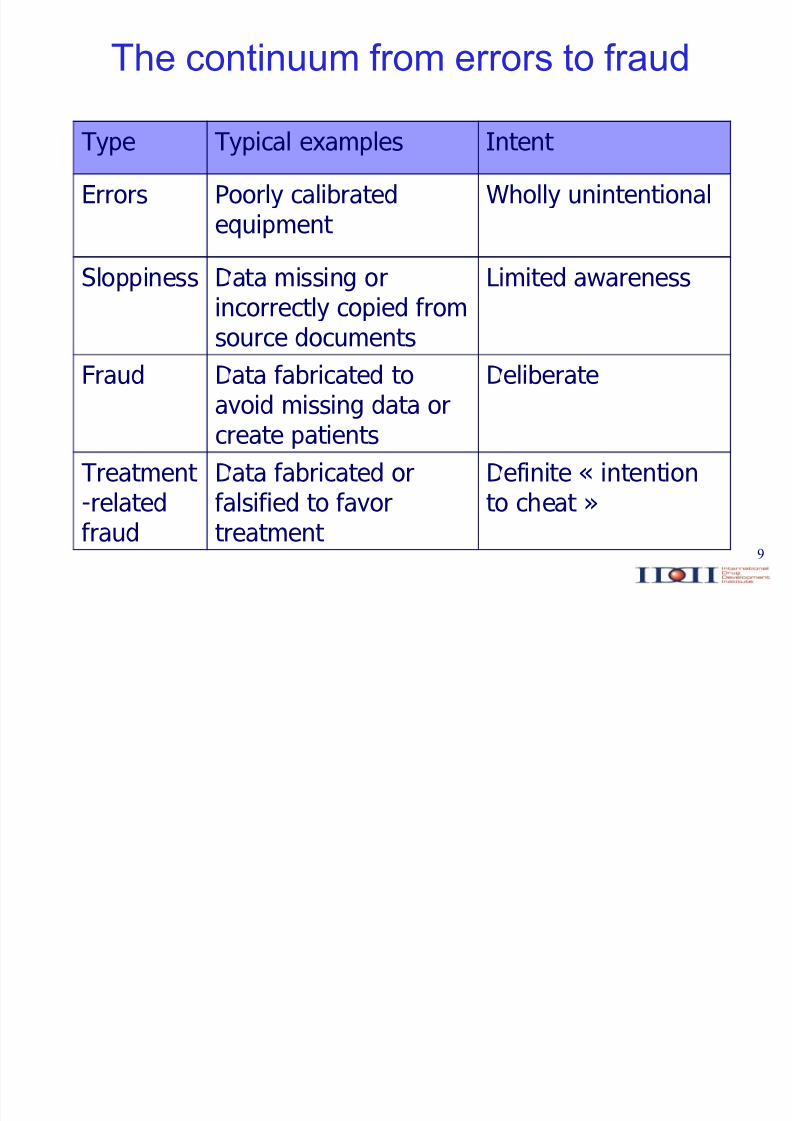
The continuum from errors to fraud
Type Typical examples Intent
Errors Poorly calibratedequipment
Wholly unintentional
Sloppiness Data missing orincorrectly copied fromsource documents
Limited awareness
Fraud Data fabricated to
avoid missing data orcreate patients
Deliberate
Treatment -relatedfraud
Data fabricated orfalsified to favortreatment
Definite « intentionto cheat »
8/3/2019 Buyse Final
http://slidepdf.com/reader/full/buyse-final 10/40
10
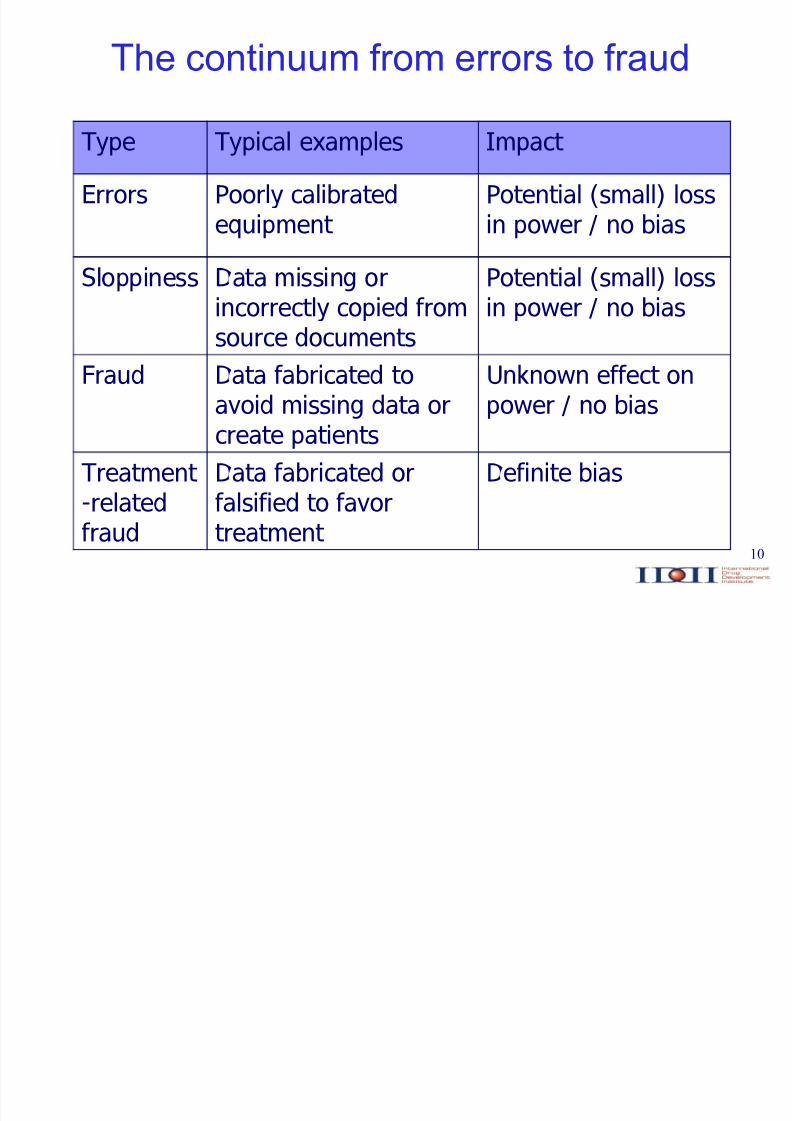
Type Typical examples Impact
Errors Poorly calibratedequipment
Potential (small) lossin power / no bias
Sloppiness Data missing orincorrectly copied fromsource documents
Potential (small) lossin power / no bias
Fraud Data fabricated to
avoid missing data orcreate patients
Unknown effect on
power / no bias
Treatment -relatedfraud
Data fabricated orfalsified to favortreatment
Definite bias
The continuum from errors to fraud

8/3/2019 Buyse Final
http://slidepdf.com/reader/full/buyse-final 11/40
11
Type Typical examples Ease of detection
Errors Poorly calibratedequipment
Difficult to detect
Sloppiness Data missing orincorrectly copied fromsource documents
May be hard todetect
Fraud Data fabricated to
avoid missing data orcreate patients
Detectable through
center comparisons
Treatment -relatedfraud
Data fabricated orfalsified to favortreatment
Detectable throughtreatment by centercomparisons
The continuum from errors to fraud

8/3/2019 Buyse Final
http://slidepdf.com/reader/full/buyse-final 12/40
12

8/3/2019 Buyse Final
http://slidepdf.com/reader/full/buyse-final 13/40
13
Extensive monitoring 100% SDV for primary and key secondary
outcomes
Reduced monitoring Random sampling of centers / patients /
outcomes to ensure rate of errors < x%
Risk-adapted monitoring
Targeted monitoring
Monitoring based on Key Risk Indicators
Statistical Monitoring
Monitoring strategies

8/3/2019 Buyse Final
http://slidepdf.com/reader/full/buyse-final 14/40
14
Extensive monitoring 100% SDV for primary and key secondary
outcomes
Reduced monitoring Random sampling of centers / patients /
outcomes to ensure rate of errors < x%
Risk-adapted monitoring
Targeted monitoring
Monitoring based on Key Risk Indicators
Statistical Monitoring
Monitoring strategies
8/3/2019 Buyse Final
http://slidepdf.com/reader/full/buyse-final 15/40
15
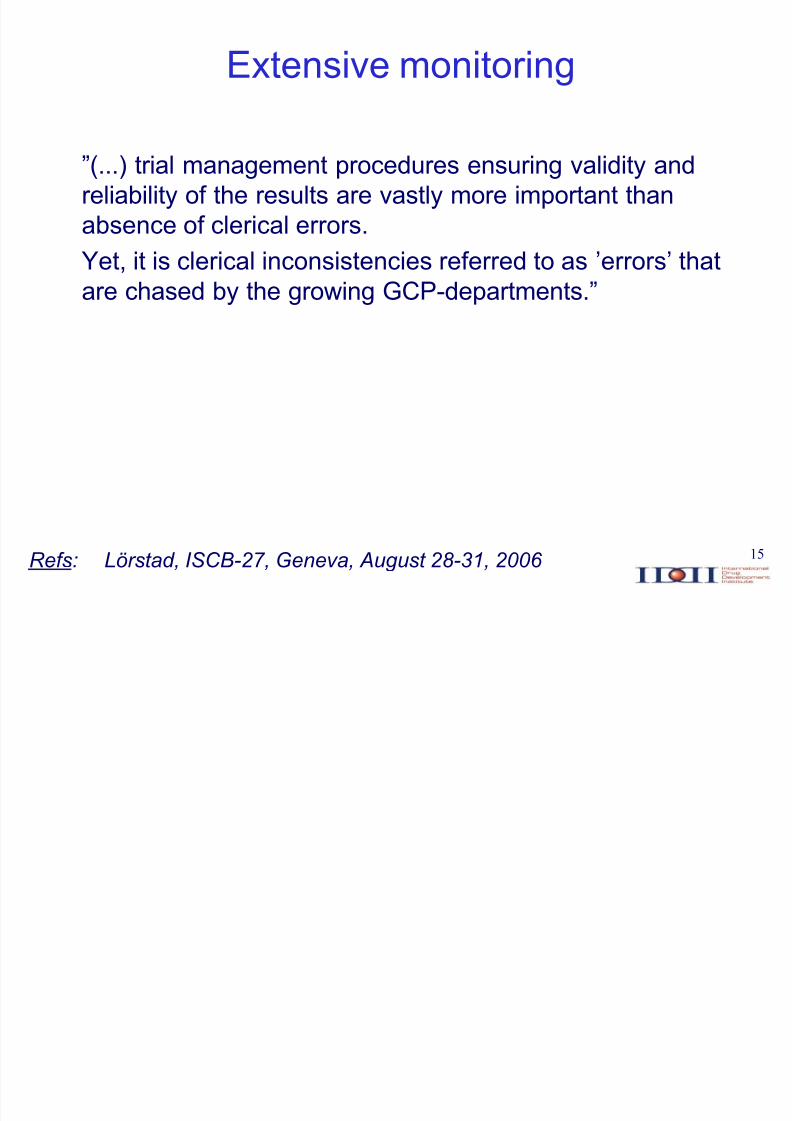
Extensive monitoring
´(...) trial management procedures ensuring validity andreliability of the results are vastly more important thanabsence of clerical errors.
Yet, it is clerical inconsistencies referred to as ¶errors¶ thatare chased by the growing GCP-departments.´
Ref s: Lör st ad, ISCB-27, Genev a, August 28-31, 2006
8/3/2019 Buyse Final
http://slidepdf.com/reader/full/buyse-final 16/40
16
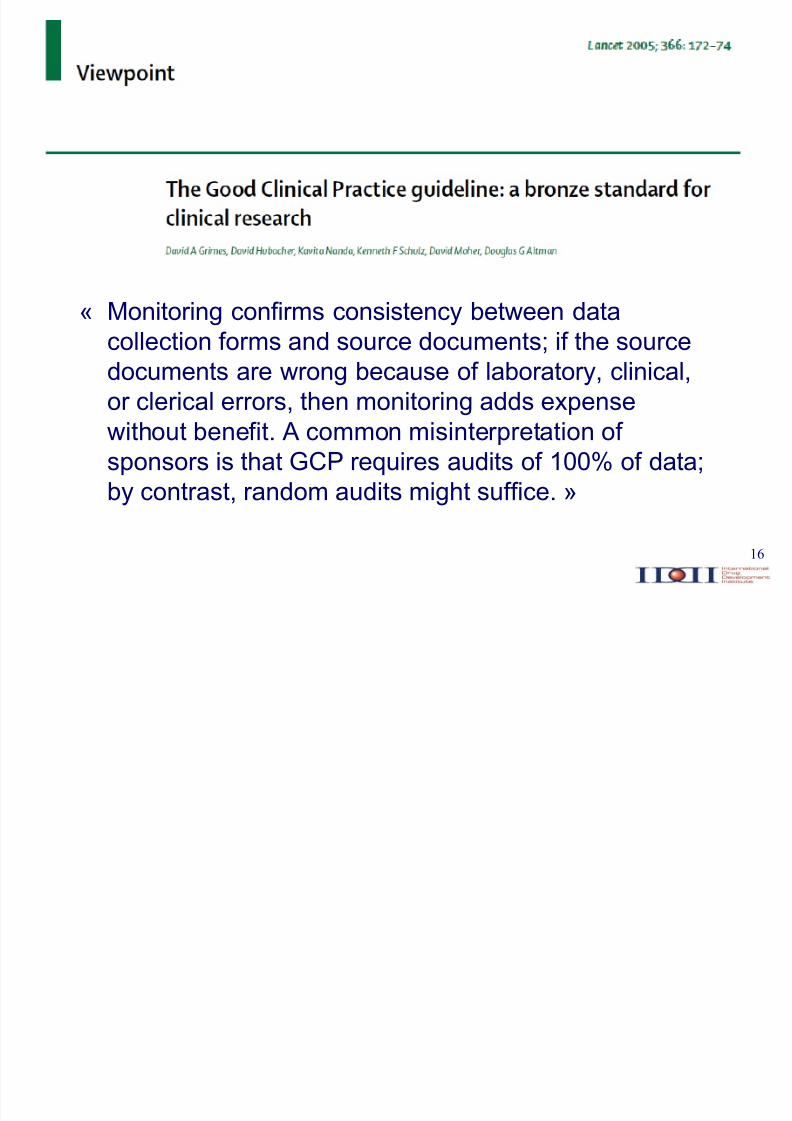
« Monitoring confirms consistency between datacollection forms and source documents; if the sourcedocuments are wrong because of laboratory, clinical,or clerical errors, then monitoring adds expensewithout benefit. A common misinterpretation of sponsors is that GCP requires audits of 100% of data;by contrast, random audits might suffice. »

8/3/2019 Buyse Final
http://slidepdf.com/reader/full/buyse-final 17/40
17Ref: Glickman et al, NEJM 2009;360:816 .

8/3/2019 Buyse Final
http://slidepdf.com/reader/full/buyse-final 18/40
18
Extensive monitoring 100% SDV for primary and key secondary
outcomes
Reduced monitoring Random sampling of centers / patients /
outcomes to ensure rate of errors < x%
Risk-adapted monitoring
Targeted monitoring
Monitoring based on Key Risk Indicators
Statistical Monitoring
Monitoring strategies

8/3/2019 Buyse Final
http://slidepdf.com/reader/full/buyse-final 19/40
19
Reduced monitoring
Random sampling
CountriesCountriesCountriesCountries Countries
CountriesCountries
Centers
CountriesCountriesCountries
PatientsCountriesCountriesCountries
VisitsCountriesCountriesCountries
Items

8/3/2019 Buyse Final
http://slidepdf.com/reader/full/buyse-final 20/40
20
Risk A ± Negligible risk (non invasive procedures)
Risk B ± Risk similar to that of usual care (trials involving
approved drugs)
Risk C ± High risk (phase III trials of new agents, newindications or at risk populations)
Risk D ± Very high risk (phase I or II trials of new agents)

8/3/2019 Buyse Final
http://slidepdf.com/reader/full/buyse-final 21/40
21
OPTIMON: OPTimisation of MONitoringfor clinical research studies
Control(³pharma´ st andard s)
Experimental( less v i si ts / c heck s)
Centers
accruing
> 5 patients
in severaltrials
Trialsstratified byrisk group:
- A
- B- C
S ource: Genev ièv e C hêne, Uni v er si t y Teac hing H os pi t al Bordeaux, France
https://ssl2.isped.u-bordeaux2.fr/optimon/Documents.aspx
Goal: non-inferiority of the proportion of patients with at least one severeerror in informed consent, suspected unexpected serious adverse eventsreports, major eligibility criteria, or primary endpoint (expected: 95% withnon-inferiority margin of 5%).

8/3/2019 Buyse Final
http://slidepdf.com/reader/full/buyse-final 22/40
22
Extensive monitoring 100% SDV for primary and key secondary
outcomes
Reduced monitoring Random sampling of centers / patients /
outcomes to ensure rate of errors < x%
Risk-adapted monitoring
Targeted monitoring
Monitoring based on Key Risk Indicators
Statistical Monitoring
Monitoring strategies
8/3/2019 Buyse Final
http://slidepdf.com/reader/full/buyse-final 23/40
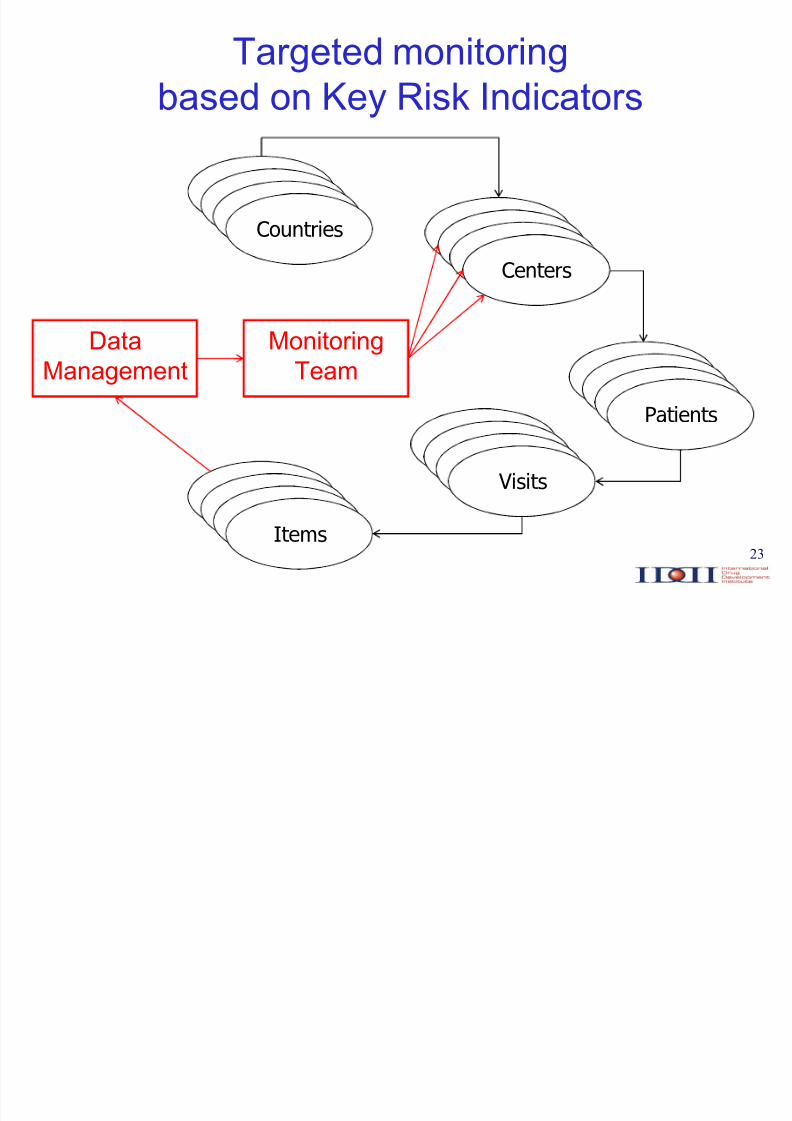
23
Targeted monitoringbased on Key Risk Indicators
CountriesCountriesCountriesCountries Countries
CountriesCountries
Centers
CountriesCountriesCountries
PatientsCountriesCountriesCountries
VisitsCountriesCountriesCountries
Items
MonitoringTeam
DataManagement

8/3/2019 Buyse Final
http://slidepdf.com/reader/full/buyse-final 24/40
24
Examples of ³Key Risk Indicators´
Study conduct
Actual accrual vs. target
% pts with protocol violations
% dropouts
«

8/3/2019 Buyse Final
http://slidepdf.com/reader/full/buyse-final 25/40
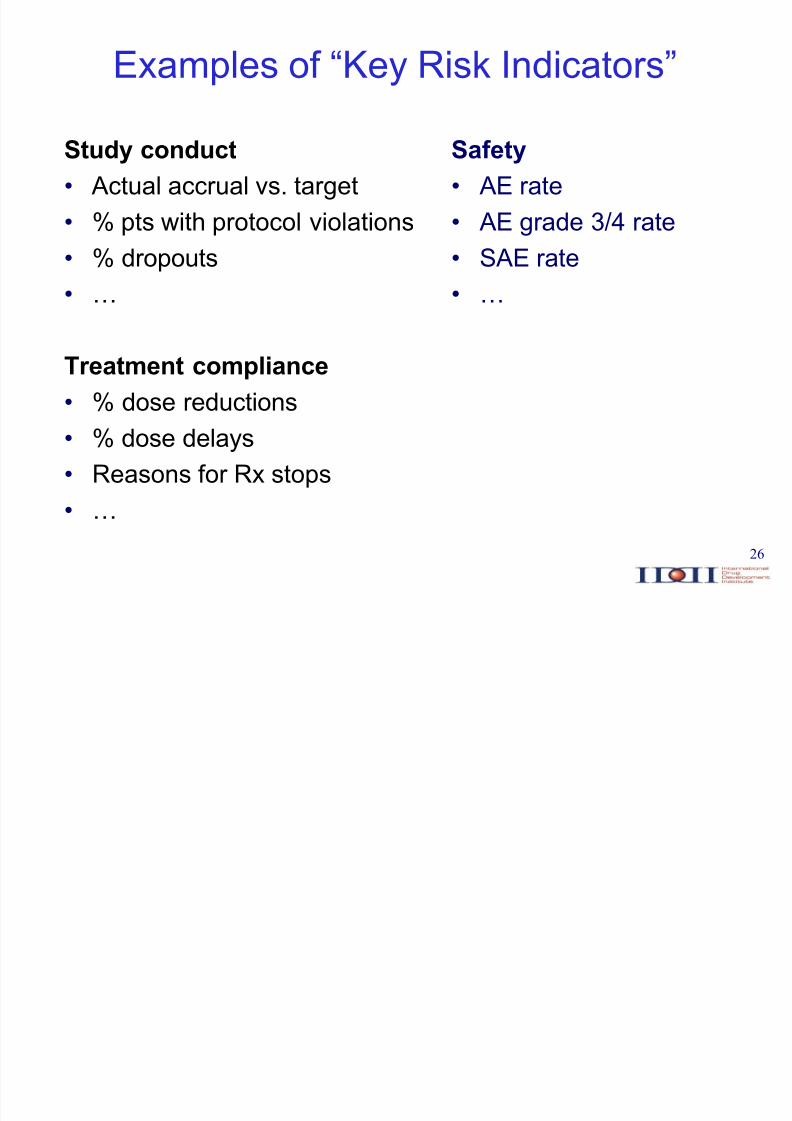
25
Examples of ³Key Risk Indicators´
Study conduct
Actual accrual vs. target
% pts with protocol violations
% dropouts
«
Treatment compliance
% dose reductions
% dose delays
Reasons for Rx stops
«
8/3/2019 Buyse Final
http://slidepdf.com/reader/full/buyse-final 26/40
26
Examples of ³Key Risk Indicators´
Study conduct
Actual accrual vs. target
% pts with protocol violations
% dropouts
«
Treatment compliance
% dose reductions
% dose delays
Reasons for Rx stops
«
Safety
AE rate
AE grade 3/4 rate
SAE rate
«
8/3/2019 Buyse Final
http://slidepdf.com/reader/full/buyse-final 27/40
27
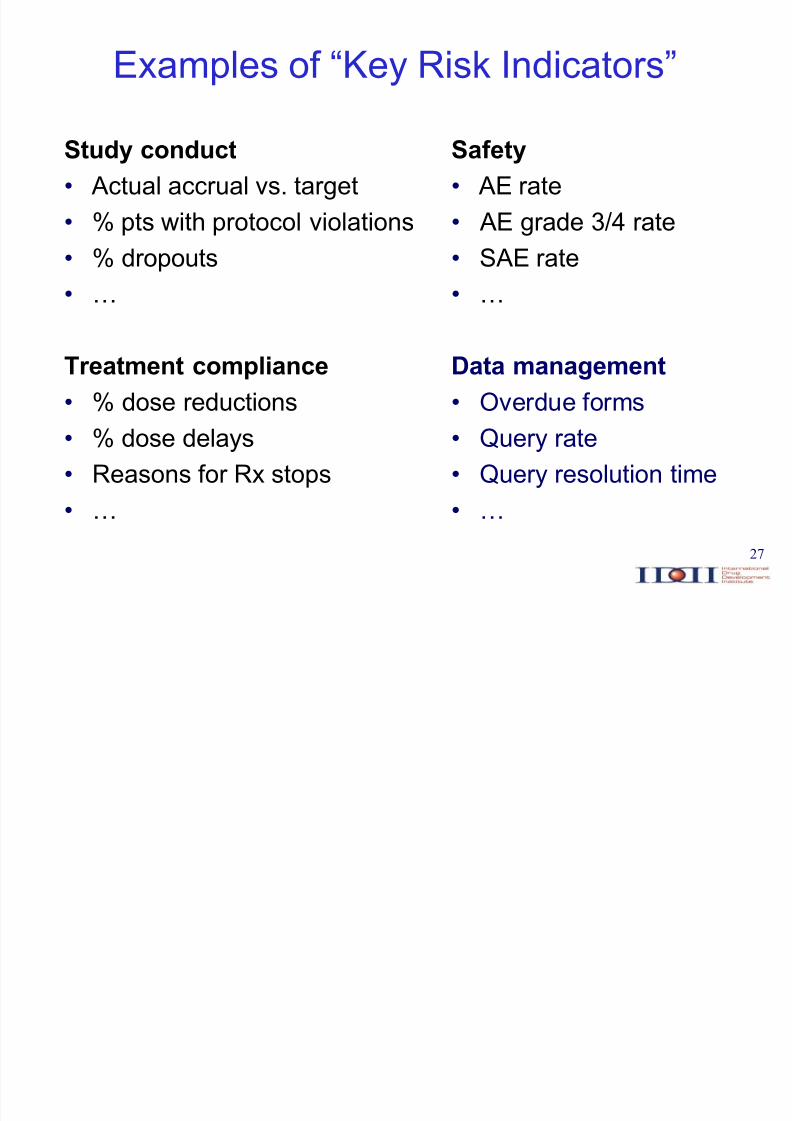
Examples of ³Key Risk Indicators´
Study conduct
Actual accrual vs. target
% pts with protocol violations
% dropouts
«
Treatment compliance
% dose reductions
% dose delays
Reasons for Rx stops
«
Safety
AE rate
AE grade 3/4 rate
SAE rate
«
Data management
Overdue forms
Query rate
Query resolution time
«

8/3/2019 Buyse Final
http://slidepdf.com/reader/full/buyse-final 28/40
28
Targeted monitoring ± based onstatistical monitoring
CountriesCountriesCountriesCountries Countries
CountriesCountries
Centers
CountriesCountriesCountries
PatientsCountriesCountriesCountries
VisitsCountriesCountriesCountries
Items
MonitoringTeam
SMART
DataManagement
8/3/2019 Buyse Final
http://slidepdf.com/reader/full/buyse-final 29/40
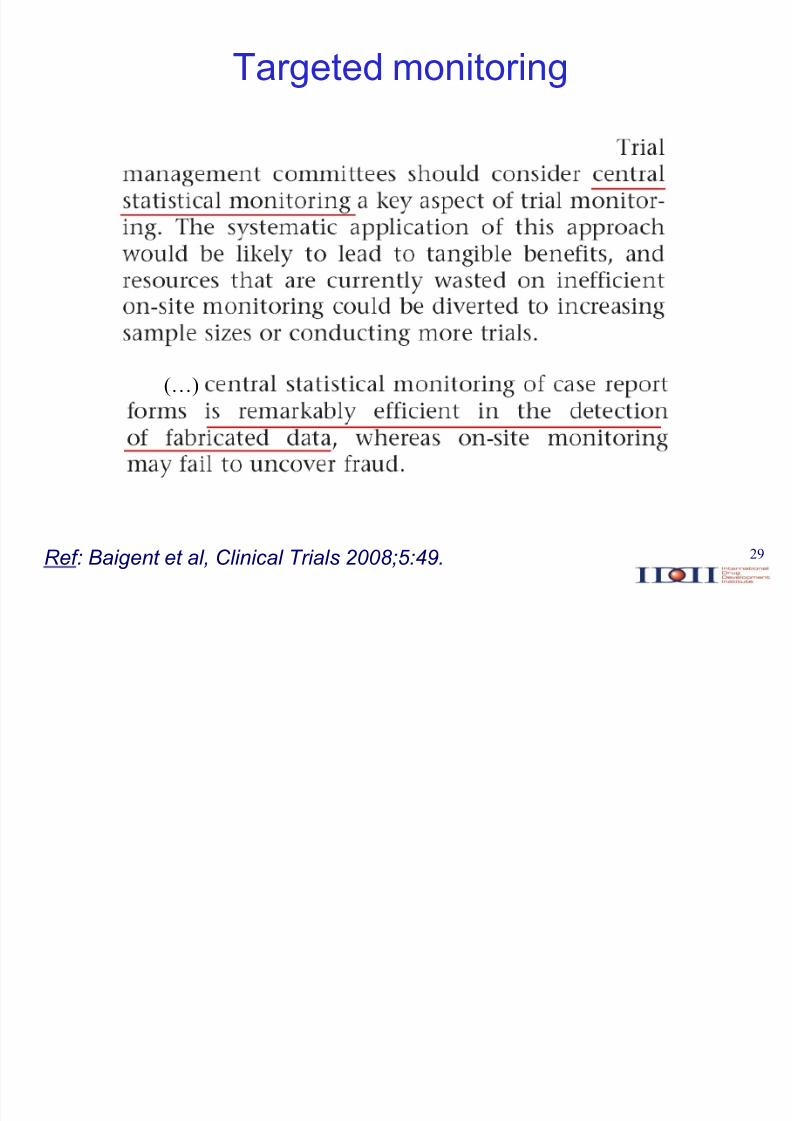
29Ref: Baigent et al, Clinical Trial s 2008;5:49.
(«)
Targeted monitoring

8/3/2019 Buyse Final
http://slidepdf.com/reader/full/buyse-final 30/40
30
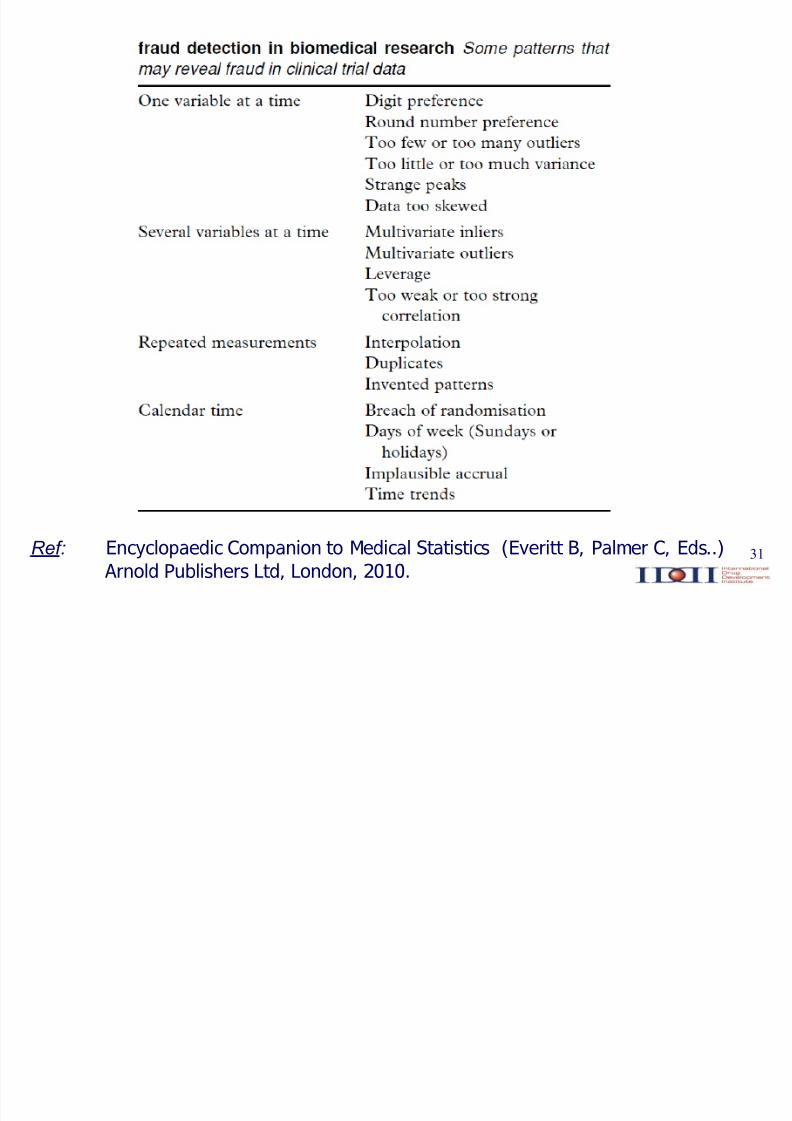
Principles behind statistical checks
Plausible data are hard to fabricatep c heck plausibili t y ( e.g . mean, v ariance, c orrelat i on st ruc t ure, out lier s,inlier s, dat es, et c .)
Humans are poor random number generatorsp c heck rand omness ( e.g . Benf ord¶ s law f or fir st digi t , digi t preference, et c .)
Clinical trial data are highly structuredp check c om parabili t y ( e.g . bet ween cent er s, t reat ment arms, et c .)
8/3/2019 Buyse Final
http://slidepdf.com/reader/full/buyse-final 31/40
31Ref: Encyclopaedic Companion to Medical Statistics (Everitt B, Palmer C, Eds..) Arnold Publishers Ltd, London, 2010.

8/3/2019 Buyse Final
http://slidepdf.com/reader/full/buyse-final 32/40
32
SMART*
A software that systematically performs alarge battery of statistical tests on the values
of all variables collected in a clinical trial.These tests generate a large number of p-values, ranks and other statistics that are keptin a database for checks of randomness,
plausibility and comparability.
* Statistical Monitoring Applied to Randomized Trials

8/3/2019 Buyse Final
http://slidepdf.com/reader/full/buyse-final 33/40
33
Brute force approach
In multicentric trials, the distribution of allvariables can be compared between eachcenter and all other centers
These tests can be applied automatically,without regard to meaning or plausibility
They yield very large number of center-specific statistics
Meta-statistics can be applied to thesestatistics to identify outlying centers
8/3/2019 Buyse Final
http://slidepdf.com/reader/full/buyse-final 34/40
34
An example
Trial in depression
Two stages:
± an open-label run-in treatment stage
± a double-blind randomized treatment stage
} 800 patients from } 70 centers

8/3/2019 Buyse Final
http://slidepdf.com/reader/full/buyse-final 35/40
35
Exemplary findings:heart rate/blood pressure
To be taken at each visit, in two positions (supine/standing)
Variability suspiciously low for several centers
³Strange´ patient:
VISIT POS HR SYSBP DIABP
1 1 72 115 75
1 2 70 110 70
2 1 72 115 75
2 2 70 110 70
3 1 70 110 75
3 2 70 110 70
4 1 72 110 75
4 2 70 105 70
5 1 74 115 75
5 2 72 110 70
... ... ... ... ...

8/3/2019 Buyse Final
http://slidepdf.com/reader/full/buyse-final 36/40
36
Exemplary findings:heart rate/blood pressure
To be taken at each visit, in two positions (supine/standing)
Variability suspiciously low for several centers
³Strange´ patient:
VISIT POS HR SYSBP DIABP
1 1 72 115 75
1 2 70 110 70
2 1 72 115 75
2 2 70 110 70
3 1 70 110 75
3 2 70 110 70
4 1 72 110 75
4 2 70 105 70
5 1 74 115 75
5 2 72 110 70
... ... ... ... ...
I s i t w or t h asking f or inessent ial,
t edi ous measurements?

8/3/2019 Buyse Final
http://slidepdf.com/reader/full/buyse-final 37/40
37
Exemplary findings:baseline MADRS score
MADRS score (the sum of results on 10 questions) < 12needed to enter the randomized stage
Half of the patients were expected to have a score < 12after the run-in period

8/3/2019 Buyse Final
http://slidepdf.com/reader/full/buyse-final 38/40
38
Exemplary findings:baseline MADRS score
MADRS score (the sum of results on 10 questions) < 12needed to enter the randomized stage
Half of the patients were expected to have a score < 12after the run-in period
In reality, 67% had a score < 12

8/3/2019 Buyse Final
http://slidepdf.com/reader/full/buyse-final 39/40
39
Exemplary findings:baseline MADRS score
³Strange´ centers :
± Center A: 5 8 5 4 7 8 9 4 6 5 7 5 4 3
± Center B: 11 11 11 11 10 11 11 11 11
MADRS score (the sum of results on 10 questions) < 12needed to enter the randomized stage
Half of the patients were expected to have a score < 12after the run-in period
In reality, 67% had a score < 12
8/3/2019 Buyse Final
http://slidepdf.com/reader/full/buyse-final 40/40
40
Conclusions
Current clinical research practices (such asintensive monitoring and 100% source dataverification) are not useful, effective, or sustainable
A statistical approach to quality assurancecould yield huge cost savings and yetincrease the reliability of the trial results
Regulatory requirements should evolveaccordingly