BUY Habitually consistent - hdfcsec.com Bank... · RESULTS REVIEW 3QFY18. 11 JAN 2018. IndusInd...
13
RESULTS REVIEW 3QFY18 11 JAN 2018 IndusInd Bank BUY HDFC securities Institutional Research is also available on Bloomberg HSLB <GO> & Thomson Reuters Habitually consistent Barring the optical blip in asset quality, it was business as usual for IIB. Loans grew at ~25% YoY which led to a ~20% growth in core earnings. NIMs were stable (~4%) even as yields witnessed downward pressure. The drop (~17% YoY) in provisions and sustained momentum in fees (+22%) led to a jump (+25%) in net earnings. The uptrend (+68% YoY) in SA deposits and strong CV disbursals (+39%) were positive surprises. Clarity of objectives and precise execution remain IIB’s key competencies. We believe expansion of the CFD slice (targeting 50% of loans by FY20), further uptick in CASA deposits (aspire to reach 45%) and a tight leash on costs will propel best in class return ratios to new highs (1.84% in FY20). This coupled with the impending merger (expected in 2QFY19) will provide a further uplift to earnings. RBI divergence and venturing into new businesses will be additional monitorables hereon. Maintain BUY with a revised TP of Rs 1,889 (3.75x Dec-19 ABV of Rs 504). Highlights of the quarter Asset Quality: GNPAs were optically higher (+10% QoQ) even as slippages moderated to ~1.3% ann. from a peak of 2.4% ann. in 4QFY17. This was due to lower reductions (down ~40% sequentially). CFD slippages (Rs 2.7bn, 2% ann.) were elevated owing to LAP, cards and 2W segments. A diversified and granular book, lower exposure to stressed sectors, minuscule restructured book (15bps) and SMA II (<1%) provide cushion to our slippage assumption of 1.2% over FY18-20E Growth trend sustains: Growth was broad based as corp loans grew ~26/2% YoY/QoQ and CFD loans jumped ~7% QoQ (+24% YoY vs. 20-22% earlier). CFD loans were driven by a 34% disbursal growth in VF business (w/w CV disbursals grew ~39%). Unsecured businesses (PL/CC) also reported robust growth (64/55% YoY), albeit on a smaller base. We have factored in a loan CAGR of 26% over FY18-20E. Near term outlook: After being stagnant for a quarter, the stock is expected to react positively as business momentum continues. Financial Summary (Rs mn) 3QFY18 3QFY17 YoY (%) 2QFY18 QoQ (%) FY17 FY18E FY19E FY20E Net Interest Income 18,948 15,784 20.0% 18,210 4.1% 60,626 74,528 93,573 117,141 PPOP 16,649 13,633 22.1% 16,335 1.9% 54,510 65,744 81,386 100,949 PAT 9,365 7,506 24.8% 8,801 6.4% 28,679 35,904 44,616 55,373 EPS (Rs) 15.6 12.6 24.1% 14.7 6.2% 47.9 59.8 74.4 92.3 ROAE (%) 15.3 16.5 17.7 18.7 ROAA (%) 1.78 1.81 1.84 1.84 Adj. BVPS (Rs) 331 380 444 524 P/ABV (x) 5.13 4.48 3.83 3.25 P/E (x) 35.5 28.4 22.9 18.4 Source: Bank, HDFC sec Inst Research. Note: We have not factored the BFI merge in our estimates. INDUSTRY BANKS CMP (as on 11 Jan 2018) Rs 1,700 Target Price Rs 1,889 Nifty 10,651 Sensex 34,503 KEY STOCK DATA Bloomberg IIB IN No. of Shares (mn) 600 MCap (Rs bn) / ($ mn) 1,020/16,021 6m avg traded value (Rs mn) 2,098 STOCK PERFORMANCE (%) 52 Week high / low Rs 1,818/1,185 3M 6M 12M Absolute (%) (1.0) 8.9 37.8 Relative (%) (9.4) 0.3 10.7 SHAREHOLDING PATTERN (%) Promoters 15.0 FIs & Local MFs 13.6 FPIs 55.3 Public & Others 16.1 Source : BSE Darpin Shah [email protected] +91-22-6171-7328 Pranav Gupta [email protected] +91-22-6171-7337
Transcript of BUY Habitually consistent - hdfcsec.com Bank... · RESULTS REVIEW 3QFY18. 11 JAN 2018. IndusInd...

RESULTS REVIEW 3QFY18 11 JAN 2018
IndusInd Bank BUY
HDFC securities Institutional Research is also available on Bloomberg HSLB <GO> & Thomson Reuters
Habitually consistent Barring the optical blip in asset quality, it was business as usual for IIB. Loans grew at ~25% YoY which led to a ~20% growth in core earnings. NIMs were stable (~4%) even as yields witnessed downward pressure. The drop (~17% YoY) in provisions and sustained momentum in fees (+22%) led to a jump (+25%) in net earnings. The uptrend (+68% YoY) in SA deposits and strong CV disbursals (+39%) were positive surprises. Clarity of objectives and precise execution remain IIB’s key competencies. We believe expansion of the CFD slice (targeting 50% of loans by FY20), further uptick in CASA deposits (aspire to reach 45%) and a tight leash on costs will propel best in class return ratios to new highs (1.84% in FY20). This coupled with the impending merger (expected in 2QFY19) will provide a further uplift to earnings. RBI divergence and venturing into new businesses will be additional monitorables hereon. Maintain BUY with a revised TP of Rs 1,889 (3.75x Dec-19 ABV of Rs 504).
Highlights of the quarter Asset Quality: GNPAs were optically higher (+10%
QoQ) even as slippages moderated to ~1.3% ann. from a peak of 2.4% ann. in 4QFY17. This was due to lower reductions (down ~40% sequentially). CFD slippages (Rs 2.7bn, 2% ann.) were elevated owing to LAP, cards and 2W segments. A diversified and granular book, lower exposure to stressed sectors, minuscule restructured book (15bps) and SMA II (<1%) provide cushion to our slippage assumption of 1.2% over FY18-20E
Growth trend sustains: Growth was broad based as corp loans grew ~26/2% YoY/QoQ and CFD loans jumped ~7% QoQ (+24% YoY vs. 20-22% earlier). CFD loans were driven by a 34% disbursal growth in VF business (w/w CV disbursals grew ~39%). Unsecured businesses (PL/CC) also reported robust growth (64/55% YoY), albeit on a smaller base. We have factored in a loan CAGR of 26% over FY18-20E.
Near term outlook: After being stagnant for a quarter, the stock is expected to react positively as business momentum continues.
Financial Summary (Rs mn) 3QFY18 3QFY17 YoY (%) 2QFY18 QoQ (%) FY17 FY18E FY19E FY20E Net Interest Income 18,948 15,784 20.0% 18,210 4.1% 60,626 74,528 93,573 117,141 PPOP 16,649 13,633 22.1% 16,335 1.9% 54,510 65,744 81,386 100,949 PAT 9,365 7,506 24.8% 8,801 6.4% 28,679 35,904 44,616 55,373 EPS (Rs) 15.6 12.6 24.1% 14.7 6.2% 47.9 59.8 74.4 92.3 ROAE (%) 15.3 16.5 17.7 18.7 ROAA (%) 1.78 1.81 1.84 1.84 Adj. BVPS (Rs) 331 380 444 524 P/ABV (x) 5.13 4.48 3.83 3.25 P/E (x) 35.5 28.4 22.9 18.4 Source: Bank, HDFC sec Inst Research. Note: We have not factored the BFI merge in our estimates.
INDUSTRY BANKS CMP (as on 11 Jan 2018) Rs 1,700 Target Price Rs 1,889 Nifty 10,651
Sensex 34,503
KEY STOCK DATA
Bloomberg IIB IN
No. of Shares (mn) 600
MCap (Rs bn) / ($ mn) 1,020/16,021
6m avg traded value (Rs mn) 2,098
STOCK PERFORMANCE (%)
52 Week high / low Rs 1,818/1,185
3M 6M 12M
Absolute (%) (1.0) 8.9 37.8
Relative (%) (9.4) 0.3 10.7
SHAREHOLDING PATTERN (%)
Promoters 15.0
FIs & Local MFs 13.6
FPIs 55.3
Public & Others 16.1 Source : BSE
Darpin Shah [email protected] +91-22-6171-7328 Pranav Gupta [email protected] +91-22-6171-7337

INDUSIND BANK : RESULTS REVIEW 3QFY18
Page | 2
Five Quarters At A Glance Rs mn 3QFY17 4QFY17 1QFY18 2QFY18 3QFY18 YoY Growth QoQ Growth Net Interest Income 15,784 16,675 17,741 18,210 18,948 20.0% 4.1% Non-interest Income 10,168 12,113 11,673 11,876 11,870 16.7% 0.0% Treasury Income 1,320 2150 1930 1750 1100 -16.6% -37.1% Operating Income 25,952 28,788 29,413 30,086 30,818 18.7% 2.4% Operating Expenses 12,319 13,065 13,528 13,751 14,169 15.0% 3.0% Pre Provision Profits (PPOP) 13,633 15,722 15,885 16,335 16,649 22.1% 1.9% Provisions And Contingencies 2,169 4,301 3,100 2,938 2,362 8.9% -19.6% NPA Provisions 1,524 2556 2100 2220 1870 22.7% -15.8% PBT 11,465 11,421 12,786 13,398 14,288 24.6% 6.6% Provision for Tax 3,959 3,905 4,420 4,597 4,923 24.4% 7.1% PAT 7,506 7,516 8,365 8,801 9,365 24.8% 6.4% Balance Sheet items/ratios Deposits 1,192 1,266 1,337 1,414 1,461 22.5% 3.3% CASA Deposits 442 446 505 598 626 41.8% 4.8% Advances 1,028 1,131 1,164 1,232 1,285 25.1% 4.4% CD Ratio (%) 86.2 89.3 87.1 87.1 88.0 179 bps 90 bps CAR (%) 15.31 15.31 16.18 15.63 15.83 52 bps 20 bps Tier I (%) 14.74 14.72 15.66 15.09 15.33 59 bps 24 bps Profitability Yield On Advances (%) 11.73 11.41 11.53 11.27 11.04 -69 bps -23 bps Cost Of Deposits (%) 6.35 6.08 6.15 5.90 5.93 -42 bps 3 bps NIM (%) 4.00 4.00 4.00 4.00 3.99 -1 bps -1 bps Cost-Income Ratio (%) 47.5 45.4 46.0 45.7 46.0 -149 bps 27 bps Tax Rate (%) 34.5 34.2 34.6 34.3 34.5 -7 bps 15 bps Asset quality Gross NPA (Rs bn) 9.7 10.5 12.7 13.5 15.0 54.2% 11.4% Net NPA (Rs bn) 4.0 4.4 5.1 5.4 5.9 47.8% 10.3% Gross NPAs (%) 0.94 0.93 1.09 1.08 1.16 22 bps 8 bps Net NPAs (%) 0.39 0.39 0.44 0.44 0.46 7 bps 2 bps Delinquency Ratio (%) 1.11 2.35 2.12 1.66 1.30 18 bps -37 bps Restructuring O/s (%) 0.41 0.37 0.17 0.16 0.15 -26 bps -1 bps Coverage Ratio (%) 58.8 58.4 60.0 60.1 60.5 173 bps 39 bps
Change In Estimates
(Rs mn) FY18E FY19E FY20E
Old New Change Old New Change Old New Change NII 74,638 74,528 -0.1% 92,772 93,573 0.9% 119,751 117,141 -2.2% PPOP 65,462 65,744 0.4% 80,562 81,386 1.0% 99,615 100,949 1.3% PAT 35,377 35,904 1.5% 43,492 44,616 2.6% 54,228 55,373 2.1% Adj. BVPS (Rs) 381.6 379.5 -0.5% 443.7 443.6 0.0% 521 523.7 0.5%
Source: HDFC sec Inst Research
In line with estimates led by robust loan growth of 25% YoY and stable NIMs Fees grew ~21/6% YoY/QoQ largely driven by distribution (+41%) and loan processing fees (+24%) Curtailed Opex growth led to a 230/85bps drop in core C-I ratio
Led by strong SA traction (+68%) despite the higher base. Consequently, CASA ratio stood at ~42.9% (+60bps QoQ and 760bps FYTD) Growth was broad based as corp loans grew by ~26% YoY while CFD grew ~24%. Within CFD, the non-vehicle portfolio reported a robust growth of ~36% YoY
Flattish NIMs were owing to a 69/23bps drop in yields. The 10bps drop in CoF provided some cushion to NIMs Asset quality slightly deteriorated with lower reductions and rise in CFD slippages; SMA-II book remained well below Rs 10bn which will keep future accretion to NPAs under check

INDUSIND BANK : RESULTS REVIEW 3QFY18
Page | 3
Momentum continues
IIB delivered broad based and healthy loan growth (+25% YoY) yet again. This was led by 26% growth in the corp segment (58.7% of loans) and 24% growth in the CFD segment.
The corp growth was owing to rising working capital requirement, an uptick in brown-field projects and continued refinancing. Uptick (24% vs. 20-22% in earlier qtrs) in the CFD segment was encouraging, as it was evenly spread and led by healthy disbursals (34% YoY) in the VF segment (led by 39% rise in CV disbursals). The non-VF retail book grew ~36% YoY, led by 64/55/22% growth in the PL/ CC/LAP respectively.
IIB’s CASA grew 42/5% YoY/QoQ to form ~42.9% (+60bps QoQ and 760bps FYTD) of deposits. The healthy growth was led by sustained momentum (68/5% YoY/QoQ and 56% FYTD) in SA deposits. Surge in SA deposits was largely due to continued customer addition (added 0.3mn customers during the qtr). Digital initiatives now contribute ~25% of incremental SA accretion.
After overshooting their guidance on CASA for the planning cycle, the mgt has revised its CASA target to 45% by FY20.
Strong Loan Growth Of ~25% YoY Loan Mix (%) Stable Sequentially
Source: Company, HDFC sec Inst Research Source: Company, HDFC sec Inst Research
Loan growth was driven by the corporate segment (+26%) and CFD (+24%) Corporate loans were driven by w/c requirement and some uptick in brown field expansion Power exposure jumped to ~4.3% (from 2.01% in 2Q) led by one PSU exposure The non-vehicle CFD portfolio grew ~36/6% YoY/QoQ, led by a strong growth in credit cards (+55%), PL (+64%) and LAP (+22%) VF disbursals grew ~34% YoY w/w CV disbursals grew ~39% YoY Within the VF portfolio, only 2Ws and 3Ws reported single-digit YoY growth Banks MFI portfolio stood at Rs 30bn
20%
22%
24%
26%
28%
30%
32%
100
300
500
700
900
1,100
1,300
1,500
1QFY
152Q
FY15
3QFY
154Q
FY15
1QFY
162Q
FY16
3QFY
164Q
FY16
1QFY
172Q
FY17
3QFY
174Q
FY17
1QFY
182Q
FY18
3QFY
18
Advances (Rsbn) YoY Growth (RHS)Rsbn % YoY
57
57
58
59
58
59
58
59
59
59
58
60
60
60
59
43
43
42
41
42
41
42
41
41
41
42
40
40
40
41
1QFY
15
2QFY
15
3QFY
15
4QFY
15
1QFY
16
2QFY
16
3QFY
16
4QFY
16
1QFY
17
2QFY
17
3QFY
17
4QFY
17
1QFY
18
2QFY
18
3QFY
18
Corp. CFD

INDUSIND BANK : RESULTS REVIEW 3QFY18
Page | 4
CFD Mix: Granularity Continues To improve CASA Ratio: Up 580/60bps YoY/QoQ
Source: Bank, HDFC sec Inst Research Source: Bank, HDFC sec Inst Research
Stable NIMs and superior fees
Despite the dissimilar movement in yields (down 70bps YoY) and funding costs (down 24bps YoY), NIM at 3.99% remained surprisingly sticky. This is largely attributable to the fact that a large portion of the book is at a fixed rate.
We believe that NIMs should sustain at these levels, given the management’s focus on (1) growing the higher yielding CFD book faster and (2) constantly capturing CASA deposits. The flexibility to tweak SA
rates provides some headroom for maintaining higher NIMs if pressure on yields continue We have factored in NIMs of 4.20% over FY18-20E
Core fees grew ~22% YoY to form ~3.4% of loans. This is largely driven by strong growth in distribution income (+41% YoY) and loan processing fees (+24% YoY. IIB’s non-interest income stream is one of the healthiest in the industry and remains a key contributor to the banks’ superior RoA
CV proportion QoQ jumps 80bps QoQ to ~38.5%; The share of CC, PL and LAP continues to increase SA growth momentum continues (68% YoY and 56% FYTD) Added ~0.3mn CASA customers during the qtr Incrementally 25% of SA booked through digital channels CASA ratio improved ~60bps QoQ (after 450bps QoQ in 2Q) and 760bps FYTD to ~42.9% Margins were flat QoQ at 4% with sharp drop in yields (down 23bps) Corp yields declined ~20bps QoQ and CFD yields dipped ~30bps
0%10%20%30%40%50%60%70%80%90%
100%
1QFY
152Q
FY15
3QFY
154Q
FY15
1QFY
162Q
FY16
3QFY
164Q
FY16
1QFY
172Q
FY17
3QFY
174Q
FY17
1QFY
182Q
FY18
3QFY
18
CV UV 3W 2W Car Equip. Fin CC LAP PL
17%
17%
18%
17%
18%
19%
19%
19%
19%
18%
21%
21%
24% 28
%
29%
17%
17%
17%
17%
17%
16%
16%
17%
16%
18% 16
%
14% 14
% 14%
14%
0%
10%
20%
30%
40%
50%
1QFY
15
2QFY
15
3QFY
15
4QFY
15
1QFY
16
2QFY
16
3QFY
16
4QFY
16
1QFY
17
2QFY
17
3QFY
17
4QFY
17
1QFY
18
2QFY
18
3QFY
18
SA % CA %

INDUSIND BANK : RESULTS REVIEW 3QFY18
Page | 5
NIM Strong At ~4% (Flat QoQ) C-I Ratio: Up 30bps QoQ
Source: Bank, HDFC sec Inst Research Source: Bank, HDFC sec Inst Research
Well-diversified Fee Income Stream Fee Income As % of Loans Stable Sequentially
Source: Bank, HDFC sec Inst Research Source: Bank, HDFC sec Inst Research
We have factored in calc. NIMs of 4.2% over FY18-20E Core fees grew ~22% YoY (+6% QoQ), led by 3rd party distribution income (+41/8% YoY/QoQ), loan processing fees (24/13% YoY/QoQ) and FX income (13/10% YoY) Investment banking income dipped ~3% QoQ Treasury gains further moderated QoQ to Rs 1.10bn vs. Rs 1.75bn and Rs 1.93bn in 1Q Non-interest income contributed ~39% of the total income and core fees is ~3.4% of loans – highest amongst peers
2.5%
2.7%
2.9%
3.1%
3.3%
3.5%
3.7%
3.9%
4.1%
5%
7%
9%
11%
13%
15%
1QFY
152Q
FY15
3QFY
154Q
FY15
1QFY
162Q
FY16
3QFY
164Q
FY16
1QFY
172Q
FY17
3QFY
174Q
FY17
1QFY
182Q
FY18
3QFY
18
Yield on Advances Cost of Deposits NIM (RHS)
45.6
49.2
48.8
46.3
47.0
46.4
47.3
47.2
47.0
47.3
47.5
45.4
46.0
45.7
46.0
1QFY
15
2QFY
15
3QFY
15
4QFY
15
1QFY
16
2QFY
16
3QFY
16
4QFY
16
1QFY
17
2QFY
17
3QFY
17
4QFY
17
1QFY
18
2QFY
18
3QFY
18
-
2.0
4.0
6.0
8.0
10.0
12.0
1QFY
15
2QFY
15
3QFY
15
4QFY
15
1QFY
16
2QFY
16
3QFY
16
4QFY
16
1QFY
17
2QFY
17
3QFY
17
4QFY
17
1QFY
18
2QFY
18
3QFY
18
Trade & Remit. Processing fees FX IncomeTPP distribution IB Fee General fees
Rs bn
3.4%
3.7%
3.6%
3.4%
3.6%
3.6%
3.6%
3.6%
3.4% 3.4% 3.
5%3.
7%
3.4%
3.4%
3.4%
1QFY
15
2QFY
15
3QFY
15
4QFY
15
1QFY
16
2QFY
16
3QFY
16
4QFY
16
1QFY
17
2QFY
17
3QFY
17
4QFY
17
1QFY
18
2QFY
18
3QFY
18
INDUSIND BANK : RESULTS REVIEW 3QFY18
Page | 6
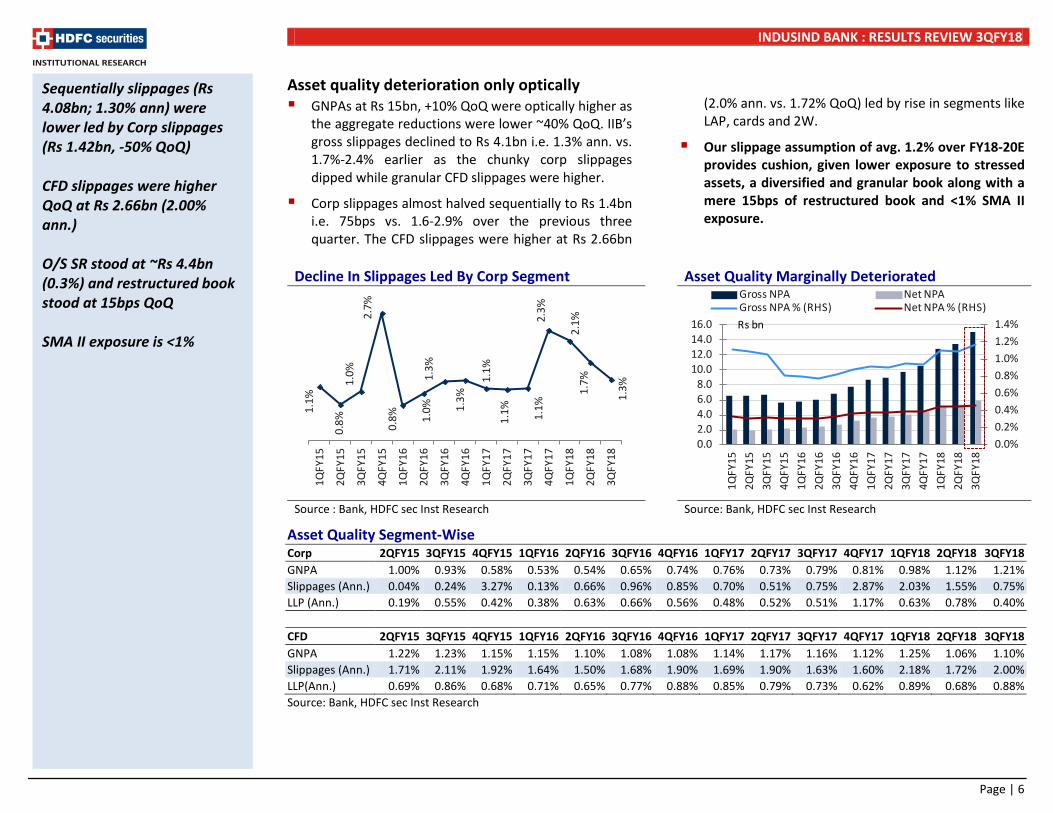
Asset quality deterioration only optically GNPAs at Rs 15bn, +10% QoQ were optically higher as
the aggregate reductions were lower ~40% QoQ. IIB’s gross slippages declined to Rs 4.1bn i.e. 1.3% ann. vs. 1.7%-2.4% earlier as the chunky corp slippages dipped while granular CFD slippages were higher.
Corp slippages almost halved sequentially to Rs 1.4bn i.e. 75bps vs. 1.6-2.9% over the previous three quarter. The CFD slippages were higher at Rs 2.66bn
(2.0% ann. vs. 1.72% QoQ) led by rise in segments like LAP, cards and 2W.
Our slippage assumption of avg. 1.2% over FY18-20E provides cushion, given lower exposure to stressed assets, a diversified and granular book along with a mere 15bps of restructured book and <1% SMA II exposure.
Decline In Slippages Led By Corp Segment Asset Quality Marginally Deteriorated
Source : Bank, HDFC sec Inst Research Source: Bank, HDFC sec Inst Research
Asset Quality Segment-Wise Corp 2QFY15 3QFY15 4QFY15 1QFY16 2QFY16 3QFY16 4QFY16 1QFY17 2QFY17 3QFY17 4QFY17 1QFY18 2QFY18 3QFY18 GNPA 1.00% 0.93% 0.58% 0.53% 0.54% 0.65% 0.74% 0.76% 0.73% 0.79% 0.81% 0.98% 1.12% 1.21% Slippages (Ann.) 0.04% 0.24% 3.27% 0.13% 0.66% 0.96% 0.85% 0.70% 0.51% 0.75% 2.87% 2.03% 1.55% 0.75% LLP (Ann.) 0.19% 0.55% 0.42% 0.38% 0.63% 0.66% 0.56% 0.48% 0.52% 0.51% 1.17% 0.63% 0.78% 0.40%
CFD 2QFY15 3QFY15 4QFY15 1QFY16 2QFY16 3QFY16 4QFY16 1QFY17 2QFY17 3QFY17 4QFY17 1QFY18 2QFY18 3QFY18 GNPA 1.22% 1.23% 1.15% 1.15% 1.10% 1.08% 1.08% 1.14% 1.17% 1.16% 1.12% 1.25% 1.06% 1.10% Slippages (Ann.) 1.71% 2.11% 1.92% 1.64% 1.50% 1.68% 1.90% 1.69% 1.90% 1.63% 1.60% 2.18% 1.72% 2.00% LLP(Ann.) 0.69% 0.86% 0.68% 0.71% 0.65% 0.77% 0.88% 0.85% 0.79% 0.73% 0.62% 0.89% 0.68% 0.88% Source: Bank, HDFC sec Inst Research
Sequentially slippages (Rs 4.08bn; 1.30% ann) were lower led by Corp slippages (Rs 1.42bn, -50% QoQ) CFD slippages were higher QoQ at Rs 2.66bn (2.00% ann.) O/S SR stood at ~Rs 4.4bn (0.3%) and restructured book stood at 15bps QoQ SMA II exposure is <1%
1.1%
0.8%
1.0%
2.7%
0.8% 1.
0%1.
3%
1.3%
1.1%
1.1% 1.1%
2.3%
2.1%
1.7%
1.3%
1QFY
15
2QFY
15
3QFY
15
4QFY
15
1QFY
16
2QFY
16
3QFY
16
4QFY
16
1QFY
17
2QFY
17
3QFY
17
4QFY
17
1QFY
18
2QFY
18
3QFY
18
0.0%0.2%0.4%0.6%0.8%1.0%1.2%1.4%
0.02.04.06.08.0
10.012.014.016.0
1QFY
152Q
FY15
3QFY
154Q
FY15
1QFY
162Q
FY16
3QFY
164Q
FY16
1QFY
172Q
FY17
3QFY
174Q
FY17
1QFY
182Q
FY18
3QFY
18
Gross NPA Net NPA Gross NPA % (RHS) Net NPA % (RHS)Rs bn
INDUSIND BANK : RESULTS REVIEW 3QFY18
Page | 7
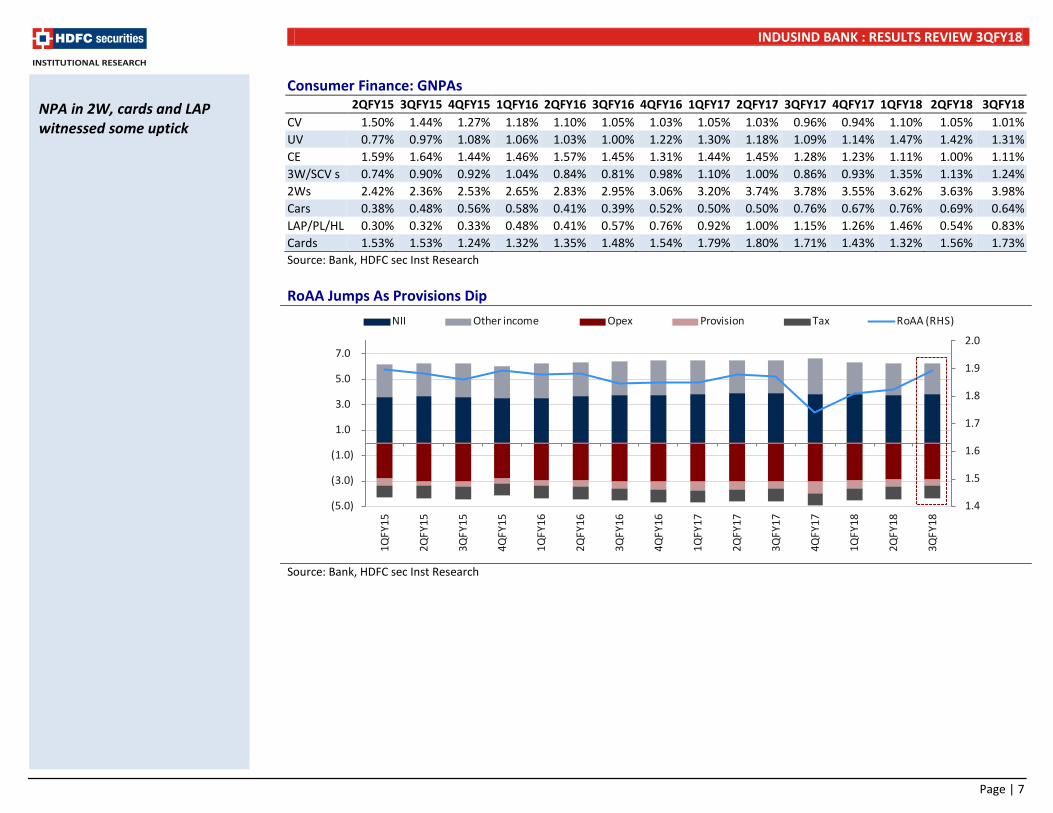
Consumer Finance: GNPAs
2QFY15 3QFY15 4QFY15 1QFY16 2QFY16 3QFY16 4QFY16 1QFY17 2QFY17 3QFY17 4QFY17 1QFY18 2QFY18 3QFY18 CV 1.50% 1.44% 1.27% 1.18% 1.10% 1.05% 1.03% 1.05% 1.03% 0.96% 0.94% 1.10% 1.05% 1.01% UV 0.77% 0.97% 1.08% 1.06% 1.03% 1.00% 1.22% 1.30% 1.18% 1.09% 1.14% 1.47% 1.42% 1.31% CE 1.59% 1.64% 1.44% 1.46% 1.57% 1.45% 1.31% 1.44% 1.45% 1.28% 1.23% 1.11% 1.00% 1.11% 3W/SCV s 0.74% 0.90% 0.92% 1.04% 0.84% 0.81% 0.98% 1.10% 1.00% 0.86% 0.93% 1.35% 1.13% 1.24% 2Ws 2.42% 2.36% 2.53% 2.65% 2.83% 2.95% 3.06% 3.20% 3.74% 3.78% 3.55% 3.62% 3.63% 3.98% Cars 0.38% 0.48% 0.56% 0.58% 0.41% 0.39% 0.52% 0.50% 0.50% 0.76% 0.67% 0.76% 0.69% 0.64% LAP/PL/HL 0.30% 0.32% 0.33% 0.48% 0.41% 0.57% 0.76% 0.92% 1.00% 1.15% 1.26% 1.46% 0.54% 0.83% Cards 1.53% 1.53% 1.24% 1.32% 1.35% 1.48% 1.54% 1.79% 1.80% 1.71% 1.43% 1.32% 1.56% 1.73% Source: Bank, HDFC sec Inst Research RoAA Jumps As Provisions Dip
Source: Bank, HDFC sec Inst Research
NPA in 2W, cards and LAP witnessed some uptick
1.4
1.5
1.6
1.7
1.8
1.9
2.0
(5.0)
(3.0)
(1.0)
1.0
3.0
5.0
7.0
1QFY
15
2QFY
15
3QFY
15
4QFY
15
1QFY
16
2QFY
16
3QFY
16
4QFY
16
1QFY
17
2QFY
17
3QFY
17
4QFY
17
1QFY
18
2QFY
18
3QFY
18
NII Other income Opex Provision Tax RoAA (RHS)
INDUSIND BANK : RESULTS REVIEW 3QFY18
Page | 8
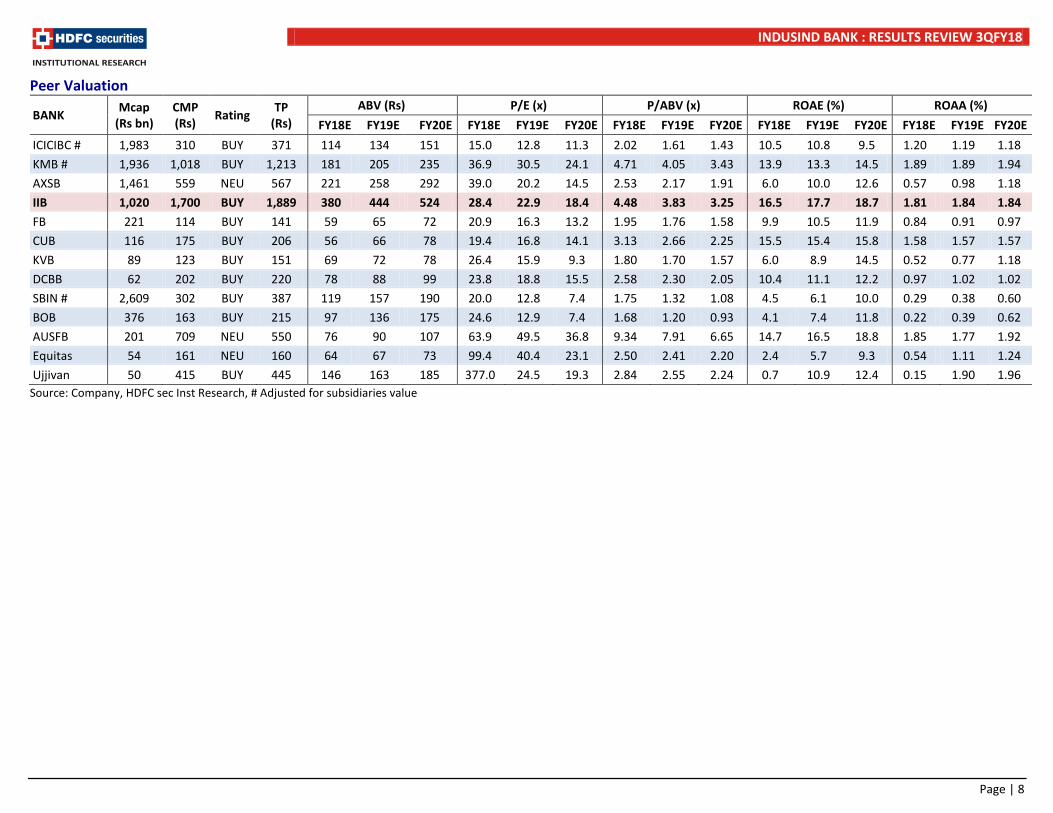
Peer Valuation
BANK Mcap (Rs bn)
CMP (Rs) Rating TP
(Rs) ABV (Rs) P/E (x) P/ABV (x) ROAE (%) ROAA (%)
FY18E FY19E FY20E FY18E FY19E FY20E FY18E FY19E FY20E FY18E FY19E FY20E FY18E FY19E FY20E ICICIBC # 1,983 310 BUY 371 114 134 151 15.0 12.8 11.3 2.02 1.61 1.43 10.5 10.8 9.5 1.20 1.19 1.18 KMB # 1,936 1,018 BUY 1,213 181 205 235 36.9 30.5 24.1 4.71 4.05 3.43 13.9 13.3 14.5 1.89 1.89 1.94 AXSB 1,461 559 NEU 567 221 258 292 39.0 20.2 14.5 2.53 2.17 1.91 6.0 10.0 12.6 0.57 0.98 1.18 IIB 1,020 1,700 BUY 1,889 380 444 524 28.4 22.9 18.4 4.48 3.83 3.25 16.5 17.7 18.7 1.81 1.84 1.84 FB 221 114 BUY 141 59 65 72 20.9 16.3 13.2 1.95 1.76 1.58 9.9 10.5 11.9 0.84 0.91 0.97 CUB 116 175 BUY 206 56 66 78 19.4 16.8 14.1 3.13 2.66 2.25 15.5 15.4 15.8 1.58 1.57 1.57 KVB 89 123 BUY 151 69 72 78 26.4 15.9 9.3 1.80 1.70 1.57 6.0 8.9 14.5 0.52 0.77 1.18 DCBB 62 202 BUY 220 78 88 99 23.8 18.8 15.5 2.58 2.30 2.05 10.4 11.1 12.2 0.97 1.02 1.02 SBIN # 2,609 302 BUY 387 119 157 190 20.0 12.8 7.4 1.75 1.32 1.08 4.5 6.1 10.0 0.29 0.38 0.60 BOB 376 163 BUY 215 97 136 175 24.6 12.9 7.4 1.68 1.20 0.93 4.1 7.4 11.8 0.22 0.39 0.62 AUSFB 201 709 NEU 550 76 90 107 63.9 49.5 36.8 9.34 7.91 6.65 14.7 16.5 18.8 1.85 1.77 1.92 Equitas 54 161 NEU 160 64 67 73 99.4 40.4 23.1 2.50 2.41 2.20 2.4 5.7 9.3 0.54 1.11 1.24 Ujjivan 50 415 BUY 445 146 163 185 377.0 24.5 19.3 2.84 2.55 2.24 0.7 10.9 12.4 0.15 1.90 1.96
Source: Company, HDFC sec Inst Research, # Adjusted for subsidiaries value
INDUSIND BANK : RESULTS REVIEW 3QFY18
Page | 9
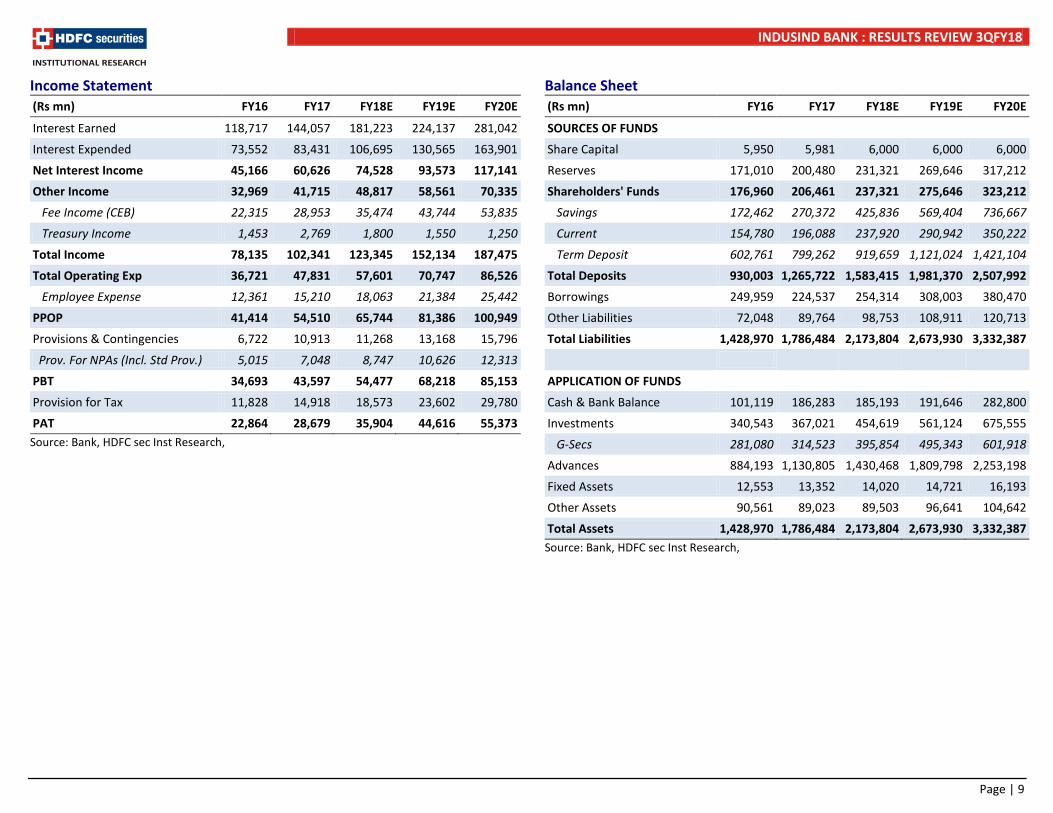
Income Statement (Rs mn) FY16 FY17 FY18E FY19E FY20E
Interest Earned 118,717 144,057 181,223 224,137 281,042
Interest Expended 73,552 83,431 106,695 130,565 163,901
Net Interest Income 45,166 60,626 74,528 93,573 117,141
Other Income 32,969 41,715 48,817 58,561 70,335
Fee Income (CEB) 22,315 28,953 35,474 43,744 53,835
Treasury Income 1,453 2,769 1,800 1,550 1,250
Total Income 78,135 102,341 123,345 152,134 187,475
Total Operating Exp 36,721 47,831 57,601 70,747 86,526
Employee Expense 12,361 15,210 18,063 21,384 25,442
PPOP 41,414 54,510 65,744 81,386 100,949
Provisions & Contingencies 6,722 10,913 11,268 13,168 15,796
Prov. For NPAs (Incl. Std Prov.) 5,015 7,048 8,747 10,626 12,313
PBT 34,693 43,597 54,477 68,218 85,153
Provision for Tax 11,828 14,918 18,573 23,602 29,780
PAT 22,864 28,679 35,904 44,616 55,373 Source: Bank, HDFC sec Inst Research,
Balance Sheet (Rs mn) FY16 FY17 FY18E FY19E FY20E
SOURCES OF FUNDS Share Capital 5,950 5,981 6,000 6,000 6,000
Reserves 171,010 200,480 231,321 269,646 317,212
Shareholders' Funds 176,960 206,461 237,321 275,646 323,212
Savings 172,462 270,372 425,836 569,404 736,667
Current 154,780 196,088 237,920 290,942 350,222
Term Deposit 602,761 799,262 919,659 1,121,024 1,421,104
Total Deposits 930,003 1,265,722 1,583,415 1,981,370 2,507,992
Borrowings 249,959 224,537 254,314 308,003 380,470
Other Liabilities 72,048 89,764 98,753 108,911 120,713
Total Liabilities 1,428,970 1,786,484 2,173,804 2,673,930 3,332,387
APPLICATION OF FUNDS Cash & Bank Balance 101,119 186,283 185,193 191,646 282,800
Investments 340,543 367,021 454,619 561,124 675,555
G-Secs 281,080 314,523 395,854 495,343 601,918
Advances 884,193 1,130,805 1,430,468 1,809,798 2,253,198
Fixed Assets 12,553 13,352 14,020 14,721 16,193
Other Assets 90,561 89,023 89,503 96,641 104,642
Total Assets 1,428,970 1,786,484 2,173,804 2,673,930 3,332,387 Source: Bank, HDFC sec Inst Research,
INDUSIND BANK : RESULTS REVIEW 3QFY18
Page | 10
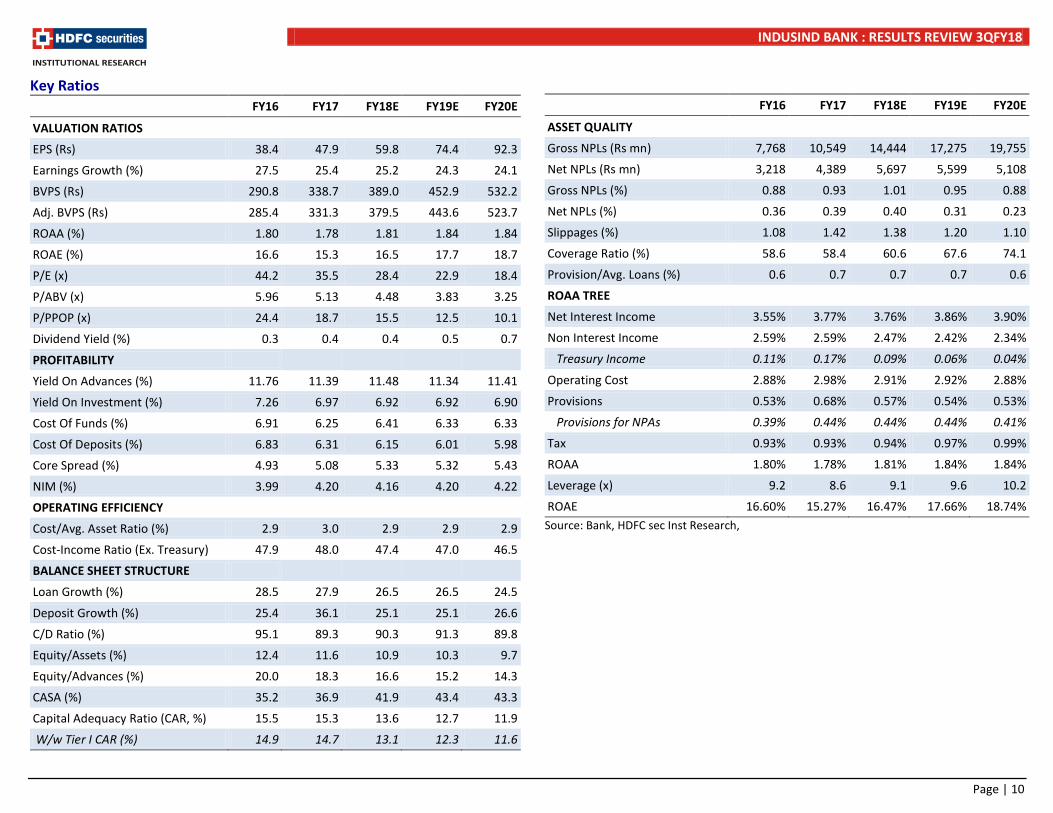
Key Ratios
FY16 FY17 FY18E FY19E FY20E
VALUATION RATIOS EPS (Rs) 38.4 47.9 59.8 74.4 92.3
Earnings Growth (%) 27.5 25.4 25.2 24.3 24.1
BVPS (Rs) 290.8 338.7 389.0 452.9 532.2
Adj. BVPS (Rs) 285.4 331.3 379.5 443.6 523.7
ROAA (%) 1.80 1.78 1.81 1.84 1.84
ROAE (%) 16.6 15.3 16.5 17.7 18.7
P/E (x) 44.2 35.5 28.4 22.9 18.4
P/ABV (x) 5.96 5.13 4.48 3.83 3.25
P/PPOP (x) 24.4 18.7 15.5 12.5 10.1
Dividend Yield (%) 0.3 0.4 0.4 0.5 0.7
PROFITABILITY Yield On Advances (%) 11.76 11.39 11.48 11.34 11.41
Yield On Investment (%) 7.26 6.97 6.92 6.92 6.90
Cost Of Funds (%) 6.91 6.25 6.41 6.33 6.33
Cost Of Deposits (%) 6.83 6.31 6.15 6.01 5.98
Core Spread (%) 4.93 5.08 5.33 5.32 5.43
NIM (%) 3.99 4.20 4.16 4.20 4.22
OPERATING EFFICIENCY Cost/Avg. Asset Ratio (%) 2.9 3.0 2.9 2.9 2.9
Cost-Income Ratio (Ex. Treasury) 47.9 48.0 47.4 47.0 46.5
BALANCE SHEET STRUCTURE Loan Growth (%) 28.5 27.9 26.5 26.5 24.5
Deposit Growth (%) 25.4 36.1 25.1 25.1 26.6
C/D Ratio (%) 95.1 89.3 90.3 91.3 89.8
Equity/Assets (%) 12.4 11.6 10.9 10.3 9.7
Equity/Advances (%) 20.0 18.3 16.6 15.2 14.3
CASA (%) 35.2 36.9 41.9 43.4 43.3
Capital Adequacy Ratio (CAR, %) 15.5 15.3 13.6 12.7 11.9
W/w Tier I CAR (%) 14.9 14.7 13.1 12.3 11.6
FY16 FY17 FY18E FY19E FY20E
ASSET QUALITY Gross NPLs (Rs mn) 7,768 10,549 14,444 17,275 19,755
Net NPLs (Rs mn) 3,218 4,389 5,697 5,599 5,108
Gross NPLs (%) 0.88 0.93 1.01 0.95 0.88
Net NPLs (%) 0.36 0.39 0.40 0.31 0.23
Slippages (%) 1.08 1.42 1.38 1.20 1.10
Coverage Ratio (%) 58.6 58.4 60.6 67.6 74.1
Provision/Avg. Loans (%) 0.6 0.7 0.7 0.7 0.6
ROAA TREE Net Interest Income 3.55% 3.77% 3.76% 3.86% 3.90%
Non Interest Income 2.59% 2.59% 2.47% 2.42% 2.34%
Treasury Income 0.11% 0.17% 0.09% 0.06% 0.04%
Operating Cost 2.88% 2.98% 2.91% 2.92% 2.88%
Provisions 0.53% 0.68% 0.57% 0.54% 0.53%
Provisions for NPAs 0.39% 0.44% 0.44% 0.44% 0.41%
Tax 0.93% 0.93% 0.94% 0.97% 0.99%
ROAA 1.80% 1.78% 1.81% 1.84% 1.84%
Leverage (x) 9.2 8.6 9.1 9.6 10.2
ROAE 16.60% 15.27% 16.47% 17.66% 18.74% Source: Bank, HDFC sec Inst Research,
INDUSIND BANK : RESULTS REVIEW 3QFY18
Page | 11
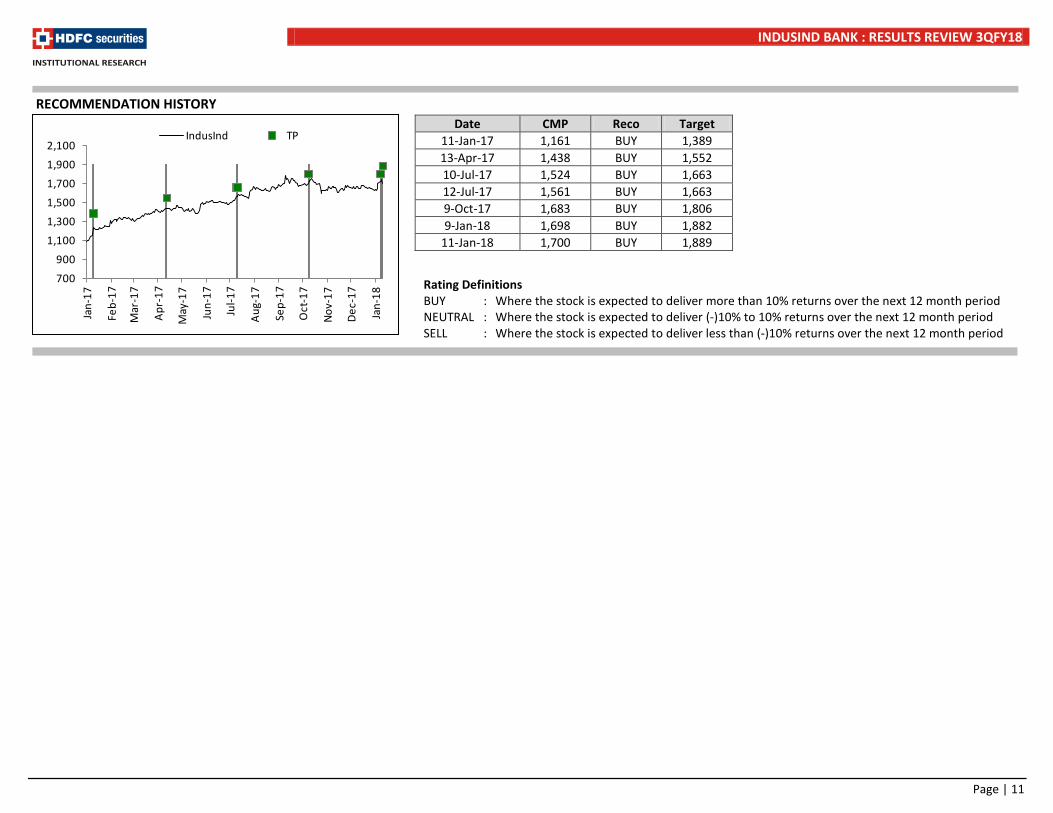
RECOMMENDATION HISTORY
Rating Definitions BUY : Where the stock is expected to deliver more than 10% returns over the next 12 month period NEUTRAL : Where the stock is expected to deliver (-)10% to 10% returns over the next 12 month period SELL : Where the stock is expected to deliver less than (-)10% returns over the next 12 month period
Date CMP Reco Target 11-Jan-17 1,161 BUY 1,389 13-Apr-17 1,438 BUY 1,552 10-Jul-17 1,524 BUY 1,663 12-Jul-17 1,561 BUY 1,663 9-Oct-17 1,683 BUY 1,806 9-Jan-18 1,698 BUY 1,882
11-Jan-18 1,700 BUY 1,889
700
900
1,100
1,300
1,500
1,700
1,900
2,100
Jan-
17
Feb-
17
Mar
-17
Apr-
17
May
-17
Jun-
17
Jul-1
7
Aug-
17
Sep-
17
Oct
-17
Nov-
17
Dec-
17
Jan-
18
IndusInd TP
INDUSIND BANK : RESULTS REVIEW 3QFY18
Page | 12
Disclosure: We, Darpin Shah, MBA & Pranav Gupta, ACA, authors and the names subscribed to this report, hereby certify that all of the views expressed in this research report accurately reflect our views about the subject issuer(s) or securities. HSL has no material adverse disciplinary history as on the date of publication of this report. We also certify that no part of our compensation was, is, or will be directly or indirectly related to the specific recommendation(s) or view(s) in this report. Research Analyst or his/her relative or HDFC Securities Ltd. does not have any financial interest in the subject company. Also Research Analyst or his relative or HDFC Securities Ltd. or its Associate may have beneficial ownership of 1% or more in the subject company at the end of the month immediately preceding the date of publication of the Research Report. Further Research Analyst or his relative or HDFC Securities Ltd. or its associate does not have any material conflict of interest. Any holding in stock –No HDFC Securities Limited (HSL) is a SEBI Registered Research Analyst having registration no. INH000002475. Disclaimer: This report has been prepared by HDFC Securities Ltd and is meant for sole use by the recipient and not for circulation. The information and opinions contained herein have been compiled or arrived at, based upon information obtained in good faith from sources believed to be reliable. Such information has not been independently verified and no guaranty, representation of warranty, express or implied, is made as to its accuracy, completeness or correctness. All such information and opinions are subject to change without notice. This document is for information purposes only. Descriptions of any company or companies or their securities mentioned herein are not intended to be complete and this document is not, and should not be construed as an offer or solicitation of an offer, to buy or sell any securities or other financial instruments. This report is not directed to, or intended for display, downloading, printing, reproducing or for distribution to or use by, any person or entity who is a citizen or resident or located in any locality, state, country or other jurisdiction where such distribution, publication, reproduction, availability or use would be contrary to law or regulation or what would subject HSL or its affiliates to any registration or licensing requirement within such jurisdiction. If this report is inadvertently send or has reached any individual in such country, especially, USA, the same may be ignored and brought to the attention of the sender. This document may not be reproduced, distributed or published for any purposes without prior written approval of HSL. Foreign currencies denominated securities, wherever mentioned, are subject to exchange rate fluctuations, which could have an adverse effect on their value or price, or the income derived from them. In addition, investors in securities such as ADRs, the values of which are influenced by foreign currencies effectively assume currency risk. It should not be considered to be taken as an offer to sell or a solicitation to buy any security. HSL may from time to time solicit from, or perform broking, or other services for, any company mentioned in this mail and/or its attachments. HSL and its affiliated company(ies), their directors and employees may; (a) from time to time, have a long or short position in, and buy or sell the securities of the company(ies) mentioned herein or (b) be engaged in any other transaction involving such securities and earn brokerage or other compensation or act as a market maker in the financial instruments of the company(ies) discussed herein or act as an advisor or lender/borrower to such company(ies) or may have any other potential conflict of interests with respect to any recommendation and other related information and opinions. HSL, its directors, analysts or employees do not take any responsibility, financial or otherwise, of the losses or the damages sustained due to the investments made or any action taken on basis of this report, including but not restricted to, fluctuation in the prices of shares and bonds, changes in the currency rates, diminution in the NAVs, reduction in the dividend or income, etc. HSL and other group companies, its directors, associates, employees may have various positions in any of the stocks, securities and financial instruments dealt in the report, or may make sell or purchase or other deals in these securities from time to time or may deal in other securities of the companies / organizations described in this report. HSL or its associates might have managed or co-managed public offering of securities for the subject company or might have been mandated by the subject company for any other assignment in the past twelve months. HSL or its associates might have received any compensation from the companies mentioned in the report during the period preceding twelve months from t date of this report for services in respect of managing or co-managing public offerings, corporate finance, investment banking or merchant banking, brokerage services or other advisory service in a merger or specific transaction in the normal course of business. HSL or its analysts did not receive any compensation or other benefits from the companies mentioned in the report or third party in connection with preparation of the research report. Accordingly, neither HSL nor Research Analysts have any material conflict of interest at the time of publication of this report. Compensation of our Research Analysts is not based on any specific merchant banking, investment banking or brokerage service transactions. HSL may have issued other reports that are inconsistent with and reach different conclusion from the information presented in this report. Research entity has not been engaged in market making activity for the subject company. Research analyst has not served as an officer, director or employee of the subject company. We have not received any compensation/benefits from the subject company or third party in connection with the Research Report. HDFC securities Limited, I Think Techno Campus, Building - B, "Alpha", Office Floor 8, Near Kanjurmarg Station, Opp. Crompton Greaves, Kanjurmarg (East), Mumbai 400 042 Phone: (022) 3075 3400 Fax: (022) 2496 5066 Compliance Officer: Binkle R. Oza Email: [email protected] Phone: (022) 3045 3600 HDFC Securities Limited, SEBI Reg. No.: NSE-INB/F/E 231109431, BSE-INB/F 011109437, AMFI Reg. No. ARN: 13549, PFRDA Reg. No. POP: 04102015, IRDA Corporate Agent License No.: HDF 2806925/HDF C000222657, SEBI Research Analyst Reg. No.: INH000002475, CIN - U67120MH2000PLC152193 Mutual Funds Investments are subject to market risk. Please read the offer and scheme related documents carefully before investing.
INDUSIND BANK : RESULTS REVIEW 3QFY18
Page | 13
HDFC securities Institutional Equities Unit No. 1602, 16th Floor, Tower A, Peninsula Business Park, Senapati Bapat Marg, Lower Parel, Mumbai - 400 013 Board : +91-22-6171 7330 www.hdfcsec.com