BUY $1.20 Initiating Coverage - Beacon Securities Limited · CFPS -$0.03 -$0.03 -$0.02 -$0.02 ......
11
Beacon Securities Ltd.| 66 Wellington Street West Suite 4050, Toronto, Ontario, M5K 1H1 |416.643.3830 |www.beaconsecurities.ca Goldquest Mining Corp. (GQC-V) Not Just Beaches In The Dominican Republic August 9, 2016 Michael Curran, CFA (416) 507-3950 [email protected] We are initiating coverage of Goldquest Mining with a BUY rating and a 12-month target price of $1.20/sh. Our recommendation is based on the following: Advancing Romero Gold-Copper Project: GQC’s assets are located in the Tireo gold belt of western Dominican Republic (DR), a newly-discovered area of gold mineralization in Central America. A 2015 PEA for the Romero gold deposit outlined a robust 2,500tpd underground mine capable of producing +80Koz/yr over a 9-year minelife. Material copper by-product credits help bring the forecasted AISC to below US$600/oz. Additional Upside: the PEA focused on a higher- grade core zone of the deposit, 7.7MMt with an average grade of 4.0g/t gold and 0.8% copper. There are another +20MMt of resources (at lower grades, but potentially economic) not currently included in the mineplan. The PEA mineplan also showed gold production peaking at 110,000oz in Year 3 and declining thereafter. The company’s goal is to maintain output at the +100Koz/yr level. District Potential: Goldquest controls the majority of the Tireo gold belt. With over 50km of strike length and numerous gold and/or copper occurrences, we believe a larger producer could become interested in the multi-deposit potential of the region. For example, Newmont Mining (NEM-NYSE, no rating, not covered) has been exploring on the Haitian side of the same gold belt. Re-rating Opportunity: we expect market interest in GQC shares to increase as the company delivers prefeasibility results in the next few months. While the feasibility work continues, regional exploration success could also provide a catalyst for GQC shares. Initiating Coverage BUY $1.20 Ticker GQC Previous Close $0.64 12-month Target Price $1.20 Potential Return 87.5% Dividend Yield 0.0% Low High 52 Week Price Range $0.09 $0.68 Annual Estimates (C$MM, except per unit) FY15 FY16e FY17e FY18e Revenue $0.0 $0.0 $0.0 $0.0 Net Income -$4.9 -$6.0 -$6.0 -$6.0 Shares O/S (wgt avg) 152 215 275 345 EPS (operating) -$0.03 -$0.03 -$0.02 -$0.02 CFPS -$0.03 -$0.03 -$0.02 -$0.02 Valuation P/E neg. neg. neg. neg. P/CF neg. neg. neg. neg. NAV $1.11 $1.38 P/NAV 0.6x 0.5x Financials Shares Outstanding 213.6 million Mgt/Insiders 2% (C$MM) Market Cap $136.7 LT Debt (corporate) $0.0 Working Capital $7.0 Enterprise Value $129.7 Fiscal Year End December 31 Reserves / Resources 2P Reserves - MMoz M+I Resources 1.6 MMoz Total Resources (M+I+I) 2.2 MMoz Quarterly Estimates Q1/15 Q2/15 Q3/15 Q4/15 EPS (operating) -$0.01 -$0.01 $0.00 -$0.01 CFPS -$0.01 -$0.01 $0.00 -$0.01 Q1/16 Q2/16e Q3/16e Q4/16e EPS (operating) ($0.01) ($0.01) $0.00 ($0.01) CFPS ($0.01) ($0.01) $0.00 ($0.01) Company at a Glance Stock Performance Goldquest is a Canadian-based exploration and development company focused on gold and copper in the Dominican Republic. The main asset is the 100%-owned Romero gold-copper property. All prices in C$ unless otherwise indicated.
Transcript of BUY $1.20 Initiating Coverage - Beacon Securities Limited · CFPS -$0.03 -$0.03 -$0.02 -$0.02 ......
Beacon Securities Ltd.| 66 Wellington Street West Suite 4050, Toronto, Ontario, M5K 1H1 |416.643.3830 |www.beaconsecurities.ca
Goldquest Mining
Corp. (GQC-V) Not Just Beaches In The
Dominican Republic
August 9, 2016
Michael Curran, CFA (416) 507-3950
We are initiating coverage of Goldquest Mining with a
BUY rating and a 12-month target price of $1.20/sh. Our
recommendation is based on the following:
Advancing Romero Gold-Copper Project: GQC’s
assets are located in the Tireo gold belt of western
Dominican Republic (DR), a newly-discovered area
of gold mineralization in Central America. A 2015
PEA for the Romero gold deposit outlined a robust
2,500tpd underground mine capable of producing
+80Koz/yr over a 9-year minelife. Material copper
by-product credits help bring the forecasted AISC
to below US$600/oz.
Additional Upside: the PEA focused on a higher-
grade core zone of the deposit, 7.7MMt with an
average grade of 4.0g/t gold and 0.8% copper.
There are another +20MMt of resources (at lower
grades, but potentially economic) not currently
included in the mineplan. The PEA mineplan also
showed gold production peaking at 110,000oz in
Year 3 and declining thereafter. The company’s
goal is to maintain output at the +100Koz/yr level.
District Potential: Goldquest controls the majority of
the Tireo gold belt. With over 50km of strike length
and numerous gold and/or copper occurrences,
we believe a larger producer could become
interested in the multi-deposit potential of the
region. For example, Newmont Mining (NEM-NYSE,
no rating, not covered) has been exploring on the
Haitian side of the same gold belt.
Re-rating Opportunity: we expect market interest in
GQC shares to increase as the company delivers
prefeasibility results in the next few months. While
the feasibility work continues, regional exploration
success could also provide a catalyst for GQC
shares.
Initiating Coverage
BUY $1.20Ticker GQC
Previous Close $0.64
12-month Target Price $1.20
Potential Return 87.5%
Dividend Yield 0.0%
Low High
52 Week Price Range $0.09 $0.68
Annual Estimates
(C$MM, except per unit) FY15 FY16e FY17e FY18e
Revenue $0.0 $0.0 $0.0 $0.0
Net Income -$4.9 -$6.0 -$6.0 -$6.0
Shares O/S (wgt avg) 152 215 275 345
EPS (operating) -$0.03 -$0.03 -$0.02 -$0.02
CFPS -$0.03 -$0.03 -$0.02 -$0.02
Valuation
P/E neg. neg. neg. neg.
P/CF neg. neg. neg. neg.
NAV $1.11 $1.38
P/NAV 0.6x 0.5x
Financials
Shares Outstanding 213.6 million
Mgt/Insiders 2%
(C$MM)
Market Cap $136.7
LT Debt (corporate) $0.0
Working Capital $7.0
Enterprise Value $129.7
Fiscal Year End December 31
Reserves / Resources
2P Reserves - MMoz
M+I Resources 1.6 MMoz
Total Resources (M+I+I) 2.2 MMoz
Quarterly Estimates
Q1/15 Q2/15 Q3/15 Q4/15
EPS (operating) -$0.01 -$0.01 $0.00 -$0.01
CFPS -$0.01 -$0.01 $0.00 -$0.01
Q1/16 Q2/16e Q3/16e Q4/16e
EPS (operating) ($0.01) ($0.01) $0.00 ($0.01)
CFPS ($0.01) ($0.01) $0.00 ($0.01)
Company at a Glance
Stock Performance
Goldquest is a Canadian-based exploration and development
company focused on gold and copper in the Dominican Republic. The
main asset is the 100%-owned Romero gold-copper property. All prices in
C$ unless otherwise indicated.

August 9, 2016 Page | 2 Michael Curran| 416.507.3950 | [email protected]
Goldquest Mining
Investment Thesis…Re-rating Opportunity As Romero
Advances
We consider Goldquest Mining to be an attractive investment for the
combination of an undervalued emerging junior gold producer with
additional district-scale exploration upside for free.
Economic Project – Goldquest’s Romero deposit could become an
80Koz/yr underground mine with AISC below US$600/oz. We also see good
potential to both extend the minelife and maintain production levels
closer to the 100Koz/yr level for several years.
Exploration Upside – GQC controls the vast majority of the Tireo gold belt
in the Dominican Republic, covering some 50km of favourable strike for
potential gold-copper mineralization. Early prospecting along the belt has
identified numerous areas that justify further follow-up exploration drilling.
Re-Valuation Potential - we consider GQC to be under-owned by
traditional institutional resource fund managers, and to have above
average potential to qualify for addition to several precious metal
indeces over the next 12 months.
DR-experienced Management Team – several of the senior management
were involved with GlobeStar Mining, which successfully explored,
permitted, financed, and built the Cerro de Maimon copper/gold mine in
the Dominican Republic (GlobeStar was later sold to an Australian mid-tier
base metal producer). Thus the team has extensive experience working in
the DR.

August 9, 2016 Page | 3 Michael Curran| 416.507.3950 | [email protected]
Goldquest Mining
Lifecycle Model The lifecycle of a mining share model links mining share price movements
to the stage of development or advancement of a project, through
exploration, discovery, feasibility, and construction/production.
Fig 1 Lifecycle of a Mining Share
Lassonde 1990 Beacon 2013
Time
Mark
et
Cap
1 2 3 4
Stages1- Exploration2- Discovery3- Feasibility4-Construction/Production
GQC -Romero
GQC -Tireo
Source: P.Lassonde’s The Gold Book (1990), M.Curran modifications
The lifecycle model shows that the best opportunities for share price
performance relate to the new discoveries and the successful
advancement of projects to production.
Goldquest’s Romero property is expected to remain within the Feasibility
Stage until late this year or perhaps until mid-2017. This suggests to us that
GQC shares should react positively to news flow in the coming quarters
relating to advancing the project towards development (updated
economic studies, permits, financing, etc.).
Elsewhere in the Tireo gold belt, Goldquest is concurrently advancing
properties that are firmly in the Exploration Stage, where an initial
discovery has yet to be made, suggesting to us that shares should react
positively to news flow in the short-term relating to initial exploration results
that indicate/confirm a significant new metal deposit discovery.

August 9, 2016 Page | 4 Michael Curran| 416.507.3950 | [email protected]
Goldquest Mining
Valuation Methodology
Our favored valuation method for precious metals producers is a price-to-
net-asset-value (P/NAV) multiple based on a discounted cash flow (DCF)
model constructed using our estimates of the parameters of existing or
potential mining operations. We employ long-term assumptions of
$1,300/oz for gold starting in 2018. Future year cash flows are then
discounted using a base rate of 5%, to which a risk premium is added,
depending on the overall political risk the company’s assets are exposed
to. Goldquest’s asset exposure to the DR is considered medium risk (5%
base + 2% premium). Until the prefeasibility study is completed, we also
impose a further 2% premium to our valuation (7% + 2 % premium).
Fig 2 Net Asset Value Breakdown: Goldquest Mining
Discount Rate Ownership Value Per Share (C$/sh)
C$MM 2017e 2018E 2019E
Romero (Dom. Rep.) 9.0% 100% $230 $1.08 $1.33 $1.42
Other exploration $0 $0.00 $0.00 $0.00
OPERATING ASSETS $230 $1.08 $1.33 $1.42
Working Capital $7 $0.03 $0.05 $0.05
LT Debt (corporate only) $0 $0.00 $0.00 $0.00
CORPORATE ASSETS $7 $0.03 $0.05 $0.05
NET ASSET VALUE $237 $1.11 $1.38 $1.47
Source: Beacon Securities estimates
In Fig. 2 we provide forward-looking NAV/sh estimates to show how the
company’s NAV is forecast to change over the next few years. For junior
gold producers (gold production <250Koz/yr), we employ a target range
of 0.50x-1.25x P/NAV. Using a target P/NAV multiple of 0.90x on our 2017
NAV estimate suggests a fair value of $1.00/sh for Goldquest.
On a forward-looking P/CF multiple analysis basis, we forecast Goldquest
could achieve average CFPS of US$0.21/sh in its first two full years of
production (2020-2021). Discounting back to the present (at 20% per
annum) suggests $0.15/sh. Applying our target multiple of 9.0x P/CF to this
estimate, which is towards the middle of our 5.0x-12.5x target range for
junior gold producers, suggests a fair value of $1.40/sh.
Using the valuation methods described above, and a 50/50 blend of fair
values generated by NAV and CF analysis, generates our 12-month target
price of $1.20 per GQC share.
August 9, 2016 Page | 5 Michael Curran| 416.507.3950 | [email protected]
Goldquest Mining
Company Description
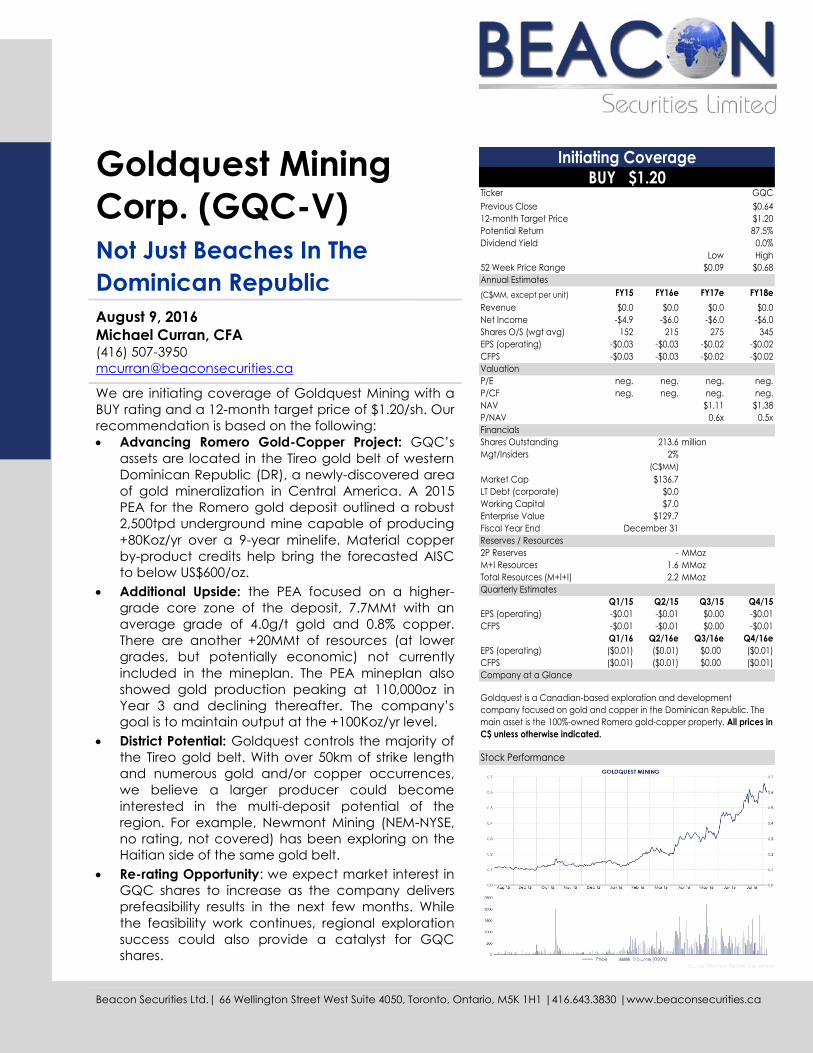
Romero Project (Dominican Republic) This property is located in the Province of San Juan, Dominican Republic,
~165km west-northwest of the capital city of Santo Domingo, and 35km
north of the city of San Juan de la Maguana (the capital of the province).
The Tireo Gold Belt represents a new discovery area, as there is no
historical mining (of any significance) in the region.
Fig 3 Location Map: Romero Project
Source: Company website
Geology/Mineralization
Gold and associated base metal mineralization is considered to be
epigenetic, of an intermediate sulphidation epithermal type. The deposit
forms a stratiform body in dacite breccias, with mineralization related to
silicification and quartz-sulphide veining. The high-grade core area of
mineralization occurs as 10-40m thick sub-parallel lenses. The main high-
grade zone has a small footprint, within a 200mX200m area (strikeXdepth).
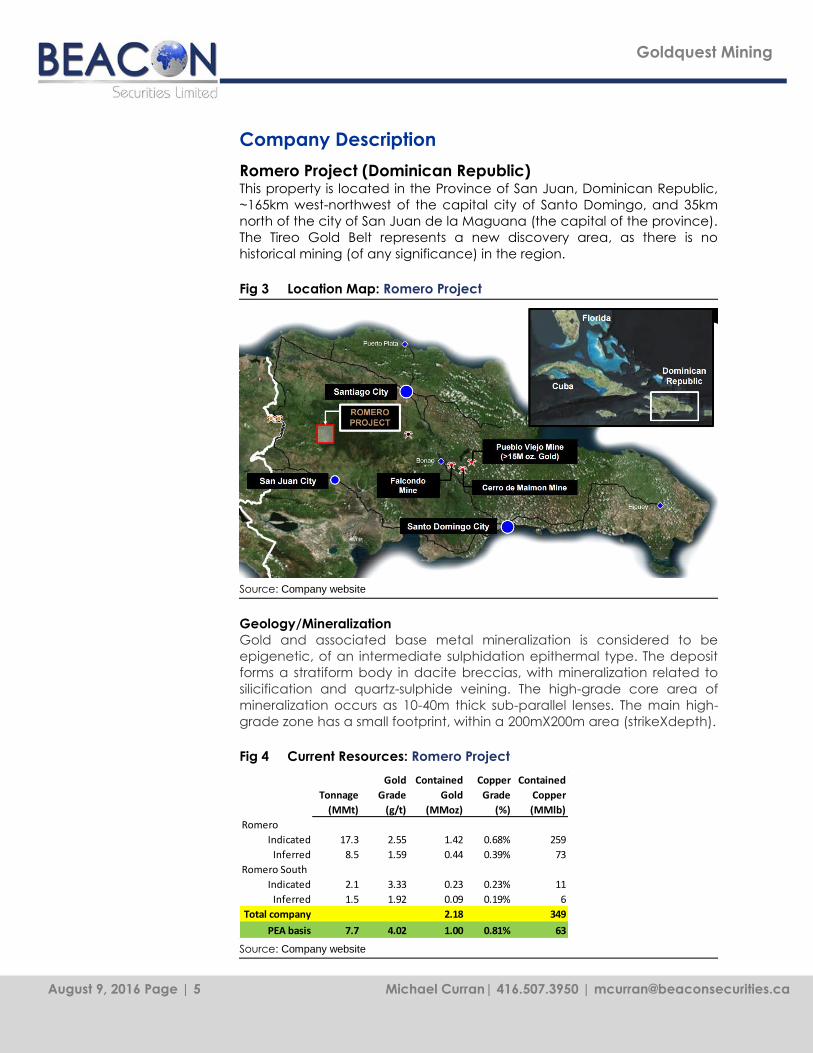
Fig 4 Current Resources: Romero Project
Gold Contained Copper Contained
Tonnage Grade Gold Grade Copper
(MMt) (g/t) (MMoz) (%) (MMlb)
Romero
Indicated 17.3 2.55 1.42 0.68% 259
Inferred 8.5 1.59 0.44 0.39% 73
Romero South
Indicated 2.1 3.33 0.23 0.23% 11
Inferred 1.5 1.92 0.09 0.19% 6
Total company 2.18 349
PEA basis 7.7 4.02 1.00 0.81% 63
Source: Company website

August 9, 2016 Page | 6 Michael Curran| 416.507.3950 | [email protected]
Goldquest Mining
Mining/Processing
The 2015 PEA contemplated a 2,500tpd ramp-accessed underground
mine capable of producing, on average 75-80Koz gold, 14MMlb of
copper, and minor silver over a 10-year minelife. With a central high-
grade core, the majority of the deposit is amenable to lower cost
longhole stoping mining methods. Mined stopes would be backfilled with
cemented paste.
Fig 5 Cross-section: Romero Deposit with Mineplan
Source: Company website
Ore processing would involve conventional crushing, milling, and flotation
to produce a high quality (low deleterious material) 20% copper
concentrate containing gold and silver. Recoveries are forecast to be
96.5% for copper, 75% for gold, and 50% for silver.
Feasibility Work
JDS Energy and Mining, an independent consultant, is expected to deliver
a pre-feasibility study (PFS) in September 2016.
Fig 6 Romero Timeline: Potentially 5 Years “from Disco to Devo”
Source: Company website
August 9, 2016 Page | 7 Michael Curran| 416.507.3950 | [email protected]
Goldquest Mining
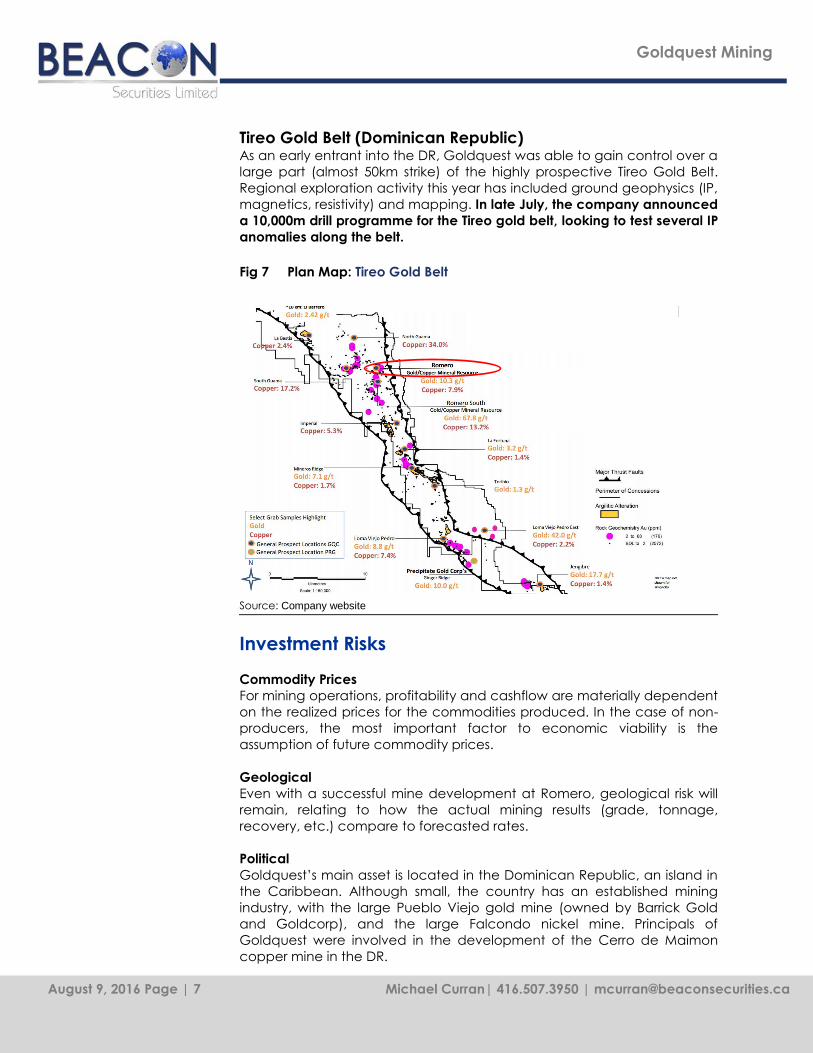
Tireo Gold Belt (Dominican Republic) As an early entrant into the DR, Goldquest was able to gain control over a
large part (almost 50km strike) of the highly prospective Tireo Gold Belt.
Regional exploration activity this year has included ground geophysics (IP,
magnetics, resistivity) and mapping. In late July, the company announced
a 10,000m drill programme for the Tireo gold belt, looking to test several IP
anomalies along the belt.
Fig 7 Plan Map: Tireo Gold Belt
Source: Company website
Investment Risks
Commodity Prices
For mining operations, profitability and cashflow are materially dependent
on the realized prices for the commodities produced. In the case of non-
producers, the most important factor to economic viability is the
assumption of future commodity prices.
Geological
Even with a successful mine development at Romero, geological risk will
remain, relating to how the actual mining results (grade, tonnage,
recovery, etc.) compare to forecasted rates.
Political
Goldquest’s main asset is located in the Dominican Republic, an island in
the Caribbean. Although small, the country has an established mining
industry, with the large Pueblo Viejo gold mine (owned by Barrick Gold
and Goldcorp), and the large Falcondo nickel mine. Principals of
Goldquest were involved in the development of the Cerro de Maimon
copper mine in the DR.

August 9, 2016 Page | 8 Michael Curran| 416.507.3950 | [email protected]
Goldquest Mining
Political (cont.)
At this point in time, we consider political risk for the DR to be low, and
believe that the current framework (royalties, tax structure, etc.) can be
maintained over the minelife proposed for Romero.
Financial
Goldquest has sufficient cash on hand to complete pre-feasibility work, as
well as take the project through feasibility and permitting, while
maintaining exploration efforts until a production decision is made for the
Romero mine. We believe the US$143 million capital requirement should
be within the ability of Goldquest to fund on its own.
Summary/Conclusions
Goldquest’s Romero gold deposit looks to be a robust project capable of
generating significant cashflow over a +10-year. Annual production is
forecast to average over 80,000 ounces of gold.
Focusing on the higher-grade core of the Romero deposit should allow for
low capital (under US$150 million), and the combination of bulk
underground mining methods and associated metals production (copper
and silver) should deliver lowest quartile operating costs (AISC forecast of
US$572 per eqAu oz).
Medium-term, the company’s land position in the Tireo Gold Belt of
western Dominican Republic has above-average potential to host
additional gold deposits that could become standalone operations.
At this point in time, we consider GQC shares to be undervaluing the
potential for a +80Kopy gold mine at Romero, and that investors are
getting the exploration upside of the Tireo Gold Belt for free. As a result,
we are initiating coverage of Goldquest Mining with a 12-month target
price of $1.20/sh and a BUY rating.

August 9, 2016 Page | 9 Michael Curran| 416.507.3950 | [email protected]
Goldquest Mining
Appendix A : Management/Directors
Bill Fisher: Executive Chairman
Mr. Fisher is a geologist with over 35 years’ experience in the mining industry. He
previously worked with GlobeStar Mining, Karmin Exploration, and Boliden AB, and
was a Director of Aurelian Resources. He joined Goldquest’s Board in July 2010.
Julio Espaillat: President, CEO, and Director
Mr. Espaillat is a Dominican Republic trained geologist with over 25 years’
experience in the mining industry. He has held senior management positions with
GlobeStar Mining and Falconbridge. He joined Goldquest in Feb 2011.
Paul Robertson: CFO
Mr. Robertson is a Chartered Accountant with +16 years’ experience in the mining
sector. He joined Goldquest in Sep 2010.
Jeremy Niemi: VP Exploration
Mr. Niemi is a geologist who brings over 20 years’ experience to Goldquest, having
previously worked with Noront Resources, Kinross Gold, and Inco. He joined GQC
in 2012.
Felix Mercedes: Country Manager
Mr. Mercedes is a Dominican geologist over 20 years’ experience in the DR mining
industry, with several companies including Energold Drilling.
Board of Directors:
Bill Fisher – see above
Julio Espaillat – see above
Patrick Michaels – Swiss portfolio manager
Florian Siegfried – Swiss portfolio manager
Frank Balint – ex-Inmet Mining

August 9, 2016 Page | 10 Michael Curran| 416.507.3950 | [email protected]
Goldquest Mining
Appendix B: Summary Financials
Goldquest Mining Beacon Securities Limited
Symbol GQC-V Share Price $0.64
Stock Rating BUY Shares O/S (MM) 213.6
Price Target $1.20 Mkt Cap ($MM) 137Michael Curran, CFA (416) 507-3950
INCOME STATEMENT 2015 2016e 2017e 2018e RATIO ANALYSIS 2015 2016e 2017e 2018e
Revenues C$MM - - - - Dividends Per Share $/sh - - - -
Operating Costs C$MM - - - - Dividend Yield % - - - -
EBITDA C$MM (4.9) (6.0) (6.0) (6.0) LT Debt/(Total Capital) % - - - -
DD&A C$MM 0.1 - - - EV/EBITDA x - - - -
EBIT C$MM (4.9) (6.0) (6.0) (6.0) PRICES/EXCHANGE RATES 2015 2016e 2017e 2018e
Interest Expense C$MM (0.0) - - - Gold Price US$/oz $1,262 $1,250 $1,300 $1,300
EBT C$MM (4.9) (6.0) (6.0) (6.0) Realized Gold Price US$/oz - - - -
Taxes/Recovery C$MM - - - - Copper Price US$/lb $2.42 $2.35 $2.35 $2.35
Net Income (reported) C$MM (4.9) (6.0) (6.0) (6.0) Realized Copper Price US$/lb - - - -
Non-Recurring Items/Other C$MM 0.0 - - - C$/US$ 1.28 1.33 1.30 1.27
Net Income (operating) C$MM (4.7) (6.0) (6.0) (6.0) MINE/EQUITY PRODUCTION 2015 2016e 2017e 2018e
Shares o/s (wgt avg.) MM 151.6 215.0 275.0 344.9 Gold Production 000 oz - - - -
EPS (operating) $/sh ($0.03) ($0.03) ($0.02) ($0.02) Total Cash Costs US$/oz - - - -
P/E Multiple x n.m. n.m. n.m. n.m. All-in Costs US$/oz - - - -
Cash Flow (operating) C$MM -4.931 -6 -6 -6 Total incl. Cash Costs + royalties All-in CCs incl. sustex, exploration, corpG&A
CFPS $/sh ($0.03) ($0.03) ($0.02) ($0.02)
P/CF Multiple x n.m. n.m. n.m. n.m.
SCFP
Cash Flow from Operations
Net Income C$MM (4.9) (6.0) (6.0) (6.0)
DD&A C$MM 0.1 - - -
Deferred Taxes C$MM - - - -
Other C$MM 0.3 - - -
Changes in Working Capital C$MM - - - -
(4.6) (6.0) (6.0) (6.0)
Cash Flow From Investing
Capital Expenditure (net) C$MM - - (25.0) (80.0)
Acquis./Investments C$MM - - - -
Other C$MM - - - -
0.0 0.0 (25.0) (80.0)
Cash Flow From Financing
Equity Issues (net of costs) C$MM 3.4 7.4 59.0 5.0
Net Borrowings C$MM - - - 75.0
Dividends Paid & Other C$MM - - - - RESERVES / RESOURCES
3.4 7.4 59.0 80.0 Reserves MMoz -
Net Inc/Dec (incl FX) C$MM (1.2) 1.4 28.0 (6.0) AMC/oz* US$/oz n.m.
Cash at End of Year C$MM 4.4 5.8 33.8 27.8 Total Resources MMoz 2.2
BALANCE SHEET AMC/oz** US$/oz 45
Cash & Equivalents C$MM 4.4 5.8 33.8 27.8 * AMC = Adjusted Market Capitalization = Market Cap + LT Debt - working cap
Total Current Assets C$MM 4.9 6.3 34.3 28.3 ** Total Resources include measured, indicated, and inferred
PP&E & Mining Interests C$MM 1.3 1.3 22.6 92.6 ESTIMATED NET ASSET VALUE (NAV)/SHARE - 2017
Other C$MM 0.0 0.0 0.0 0.0 Status Own'ship $M $/Sh %NAV
Total Assets C$MM 6.2 7.6 56.9 120.9 Romero devo 100% $230 $1.08 97%
Current Liabilities C$MM 0.4 0.4 0.4 0.4 Other $0 $0.00 0%
Long Term Debt C$MM - - - 75.0 Total Operating $230 $1.08
Other LT Liabilities C$MM - - - - Working capital $7 $0.03 3%
Total Liabilities C$MM 0.4 0.4 0.4 75.4 LT Debt $0 $0.00 0%
S/Holder Equity C$MM 5.8 7.2 56.5 45.5 NAV at 9% $237 $1.11
Total Liab. & S/Holder Equity C$MM 6.2 7.6 57.0 121.0 Current P/NAV 0.6x
Working Capital C$MM 4.4 5.8 33.8 27.8 Source: Company reports, Beacon estimates
0
20,000
40,000
60,000
80,000
100,000
120,000
2016E 2017E 2018E 2019E 2020E 2021E
Gold Prod'n (000oz)
Beacon Securities Ltd.| 66 Wellington Street West Suite 4050, Toronto, Ontario, M5K 1H1 |416.643.3830 |www.beaconsecurities.ca
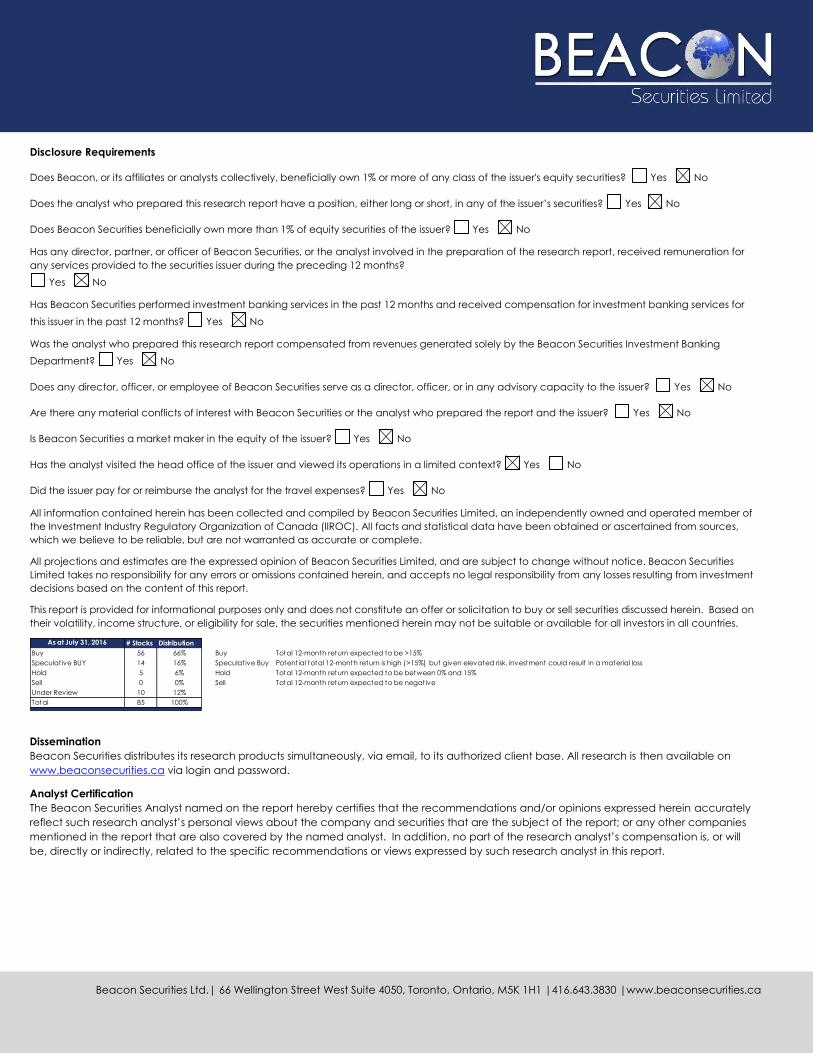
Disclosure Requirements
Does Beacon, or its affiliates or analysts collectively, beneficially own 1% or more of any class of the issuer's equity securities? Yes No
Does the analyst who prepared this research report have a position, either long or short, in any of the issuer’s securities? Yes No
Does Beacon Securities beneficially own more than 1% of equity securities of the issuer? Yes No
Has any director, partner, or officer of Beacon Securities, or the analyst involved in the preparation of the research report, received remuneration for
any services provided to the securities issuer during the preceding 12 months?
Yes No
Has Beacon Securities performed investment banking services in the past 12 months and received compensation for investment banking services for
this issuer in the past 12 months? Yes No
Was the analyst who prepared this research report compensated from revenues generated solely by the Beacon Securities Investment Banking
Department? Yes No
Does any director, officer, or employee of Beacon Securities serve as a director, officer, or in any advisory capacity to the issuer? Yes No
Are there any material conflicts of interest with Beacon Securities or the analyst who prepared the report and the issuer? Yes No
Is Beacon Securities a market maker in the equity of the issuer? Yes No
Has the analyst visited the head office of the issuer and viewed its operations in a limited context? Yes No
Did the issuer pay for or reimburse the analyst for the travel expenses? Yes No
All information contained herein has been collected and compiled by Beacon Securities Limited, an independently owned and operated member of
the Investment Industry Regulatory Organization of Canada (IIROC). All facts and statistical data have been obtained or ascertained from sources,
which we believe to be reliable, but are not warranted as accurate or complete.
All projections and estimates are the expressed opinion of Beacon Securities Limited, and are subject to change without notice. Beacon Securities
Limited takes no responsibility for any errors or omissions contained herein, and accepts no legal responsibility from any losses resulting from investment
decisions based on the content of this report.
This report is provided for informational purposes only and does not constitute an offer or solicitation to buy or sell securities discussed herein. Based on
their volatility, income structure, or eligibility for sale, the securities mentioned herein may not be suitable or available for all investors in all countries.
As at July 31, 2016 # Stocks Distribution
Buy 56 66% Buy Total 12-month return expected to be >15%
Speculative BUY 14 16% Speculative Buy Potential total 12-month return is high (>15%) but given elevated risk, investment could result in a material loss
Hold 5 6% Hold Total 12-month return expected to be between 0% and 15%
Sell 0 0% Sell Total 12-month return expected to be negative
Under Review 10 12%
Total 85 100%
Dissemination
Beacon Securities distributes its research products simultaneously, via email, to its authorized client base. All research is then available on
www.beaconsecurities.ca via login and password.
Analyst Certification
The Beacon Securities Analyst named on the report hereby certifies that the recommendations and/or opinions expressed herein accurately
reflect such research analyst’s personal views about the company and securities that are the subject of the report; or any other companies
mentioned in the report that are also covered by the named analyst. In addition, no part of the research analyst’s compensation is, or will
be, directly or indirectly, related to the specific recommendations or views expressed by such research analyst in this report.