Butterfinger Social Media Analysis Q4 2015
36
Butterfinger Social Media Report Oct 01 2015 - Dec 31 2015 Cover image courtesy of Butterfinger FB
-
Upload
unmetric -
Category
Social Media
-
view
326 -
download
1
Transcript of Butterfinger Social Media Analysis Q4 2015

ButterfingerSocial Media Report
Oct 01 2015 - Dec 31 2015
Cover image courtesy of Butterfinger FB

Butterfinger: Social Media Report
This report looks at Butterfinger’sperformance on social media between
October 1st – December 31st, 2015
Generate Your Own Social Media Report
This report was generated entirely by
the Unmetric Reporting Engine.
It took minutes to create.
Create Your FreeSocial Media Report Now

Analysis of
ButterfingerFacebook Page
Oct 01, 2015 - Dec 31, 2015

Brand Overview
FANS NEW FANS FAN GROWTH COUNTRY DEMOGRAPHICS
1,988,023 -486 -.02%United
States
Mostly Young, Female
and Single
Butterfinger
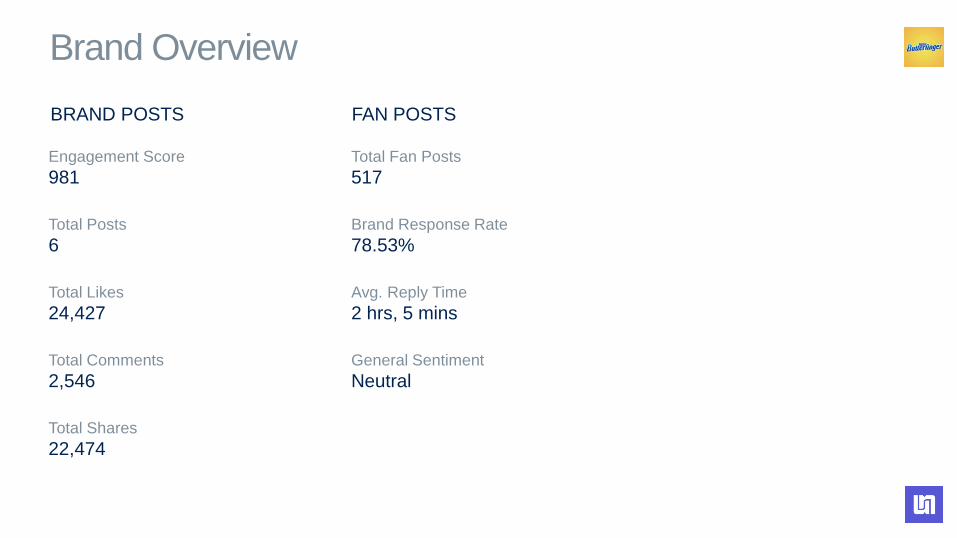
Engagement Score Total Fan Posts
981 517
Total Posts Brand Response Rate
6 78.53%
Total Likes Avg. Reply Time
24,427 2 hrs, 5 mins
Total Comments General Sentiment
2,546 Neutral
Total Shares
22,474
BRAND POSTS FAN POSTS
Brand Overview

1,986K
1,987K
1,988K
1,989K
1,990K
1,991K
1,992K
1,993K
1-Oct 15-Oct 29-Oct 12-Nov 26-Nov 10-Dec 24-Dec
Fan Growth
Total Fans
1,988,023
New Fans
-486

Engagement
0
250
500
750
1,000
1,250
Butterfinger had an average engagement score of 981 and a highest of 999.
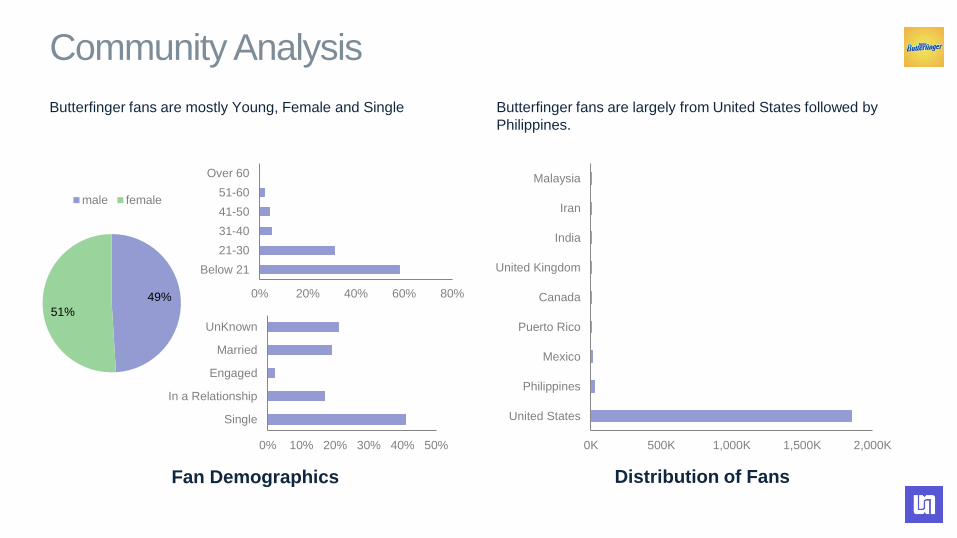
Community Analysis
Butterfinger fans are mostly Young, Female and Single Butterfinger fans are largely from United States followed by
Philippines.
Fan Demographics Distribution of Fans
49%
51%
male female
0% 20% 40% 60% 80%
Below 21
21-30
31-40
41-50
51-60
Over 60
0% 10% 20% 30% 40% 50%
Single
In a Relationship
Engaged
Married
UnKnown
0K 500K 1,000K 1,500K 2,000K
United States
Philippines
Mexico
Puerto Rico
Canada
United Kingdom
India
Iran
Malaysia
0
1
1
2
2
3
3
4
1-Oct 15-Oct 29-Oct 12-Nov 26-Nov 10-Dec 24-Dec
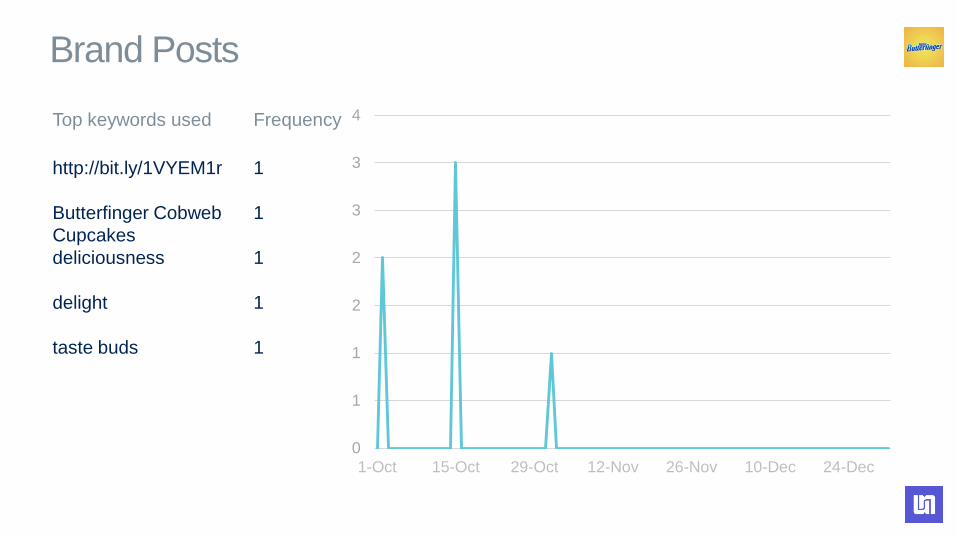
Brand Posts
Top keywords used Frequency
http://bit.ly/1VYEM1r 1
Butterfinger Cobweb
Cupcakes
1
deliciousness 1
delight 1
taste buds 1

100%
0%
Brand Participation Brand Non Participation
100%
0% 0%
Posititve Negative Neutral
Brand Posts - Engagement
Butterfinger responded to 6 conversations generated by the 6
Posts they published.
Butterfinger receives more positive than negative vibes from
comments on their Posts.
Brand Responses Sentiment of Brand Posts

Most Engaging Brand Posts
15-OCT-15, THU 9:00PM
Butterfinger Cobweb Cupcakes will trap your taste buds in a web of deliciousness.
Make this at: ht ..
ENGMT
.
LIKES COMMENTS SHARE
S
SENTIMENT
1,000 8,543 801 8,142 Positive
01-NOV-15, SUN 9:00PM
What to do with that extra Halloween
candy? Make Leftover Candy Cookies!
Make this at: http://bit. ..
02-OCT-15, FRI 9:00PM
How many Butterfinger Shortbread Eyeballs does it take to make Halloween out of sight? 20/20
Make ..
ENGMT
.
LIKES COMMENTSSHARESSENTIMENT
999 7,989 864 6,668 Positive
ENGMT
.
LIKES COMMENTS SHARE
S
SENTIMENT
977 3,749 327 3,598 Positive
NO
IMAGE
NO
IMAGE
NO
IMAGE

Brand Posts - Analysis
Brand Post Types Days of the week
0 1 2 3 4 5 6 7
0 200 400 600 800 1,000 1,200
Photos
Plain Text
Links
Videos
Polls
Number of Posts
Engagement Score
Engagement Score Number of Posts
0 1 2 3 4
0 200 400 600 800 1,000 1,200
Monday
Tuesday
Wednesday
Thursday
Friday
Saturday
Sunday
Number of Posts
Engagement Score
Engagement Score Number of Posts
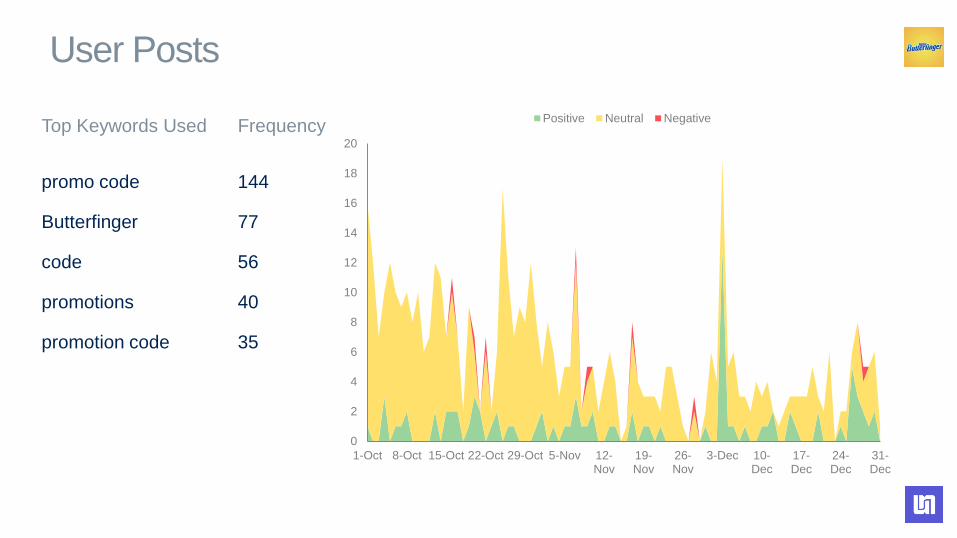
Top Keywords Used Frequency
promo code 144
Butterfinger 77
code 56
promotions 40
promotion code 35
User Posts
0
2
4
6
8
10
12
14
16
18
20
1-Oct 8-Oct 15-Oct 22-Oct 29-Oct 5-Nov 12-Nov
19-Nov
26-Nov
3-Dec 10-Dec
17-Dec
24-Dec
31-Dec
Positive Neutral Negative
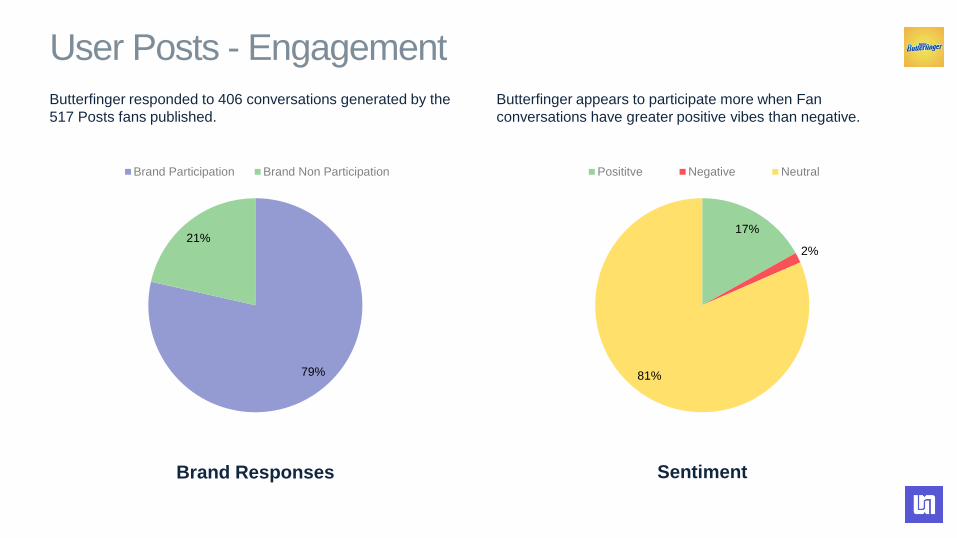
Butterfinger responded to 406 conversations generated by the
517 Posts fans published.
Butterfinger appears to participate more when Fan
conversations have greater positive vibes than negative.
User Posts - Engagement
Brand Responses Sentiment
79%
21%
Brand Participation Brand Non Participation
17%
2%
81%
Posititve Negative Neutral

Analysis of
ButterfingerTwitter Account
Oct 01, 2015 - Dec 31, 2015
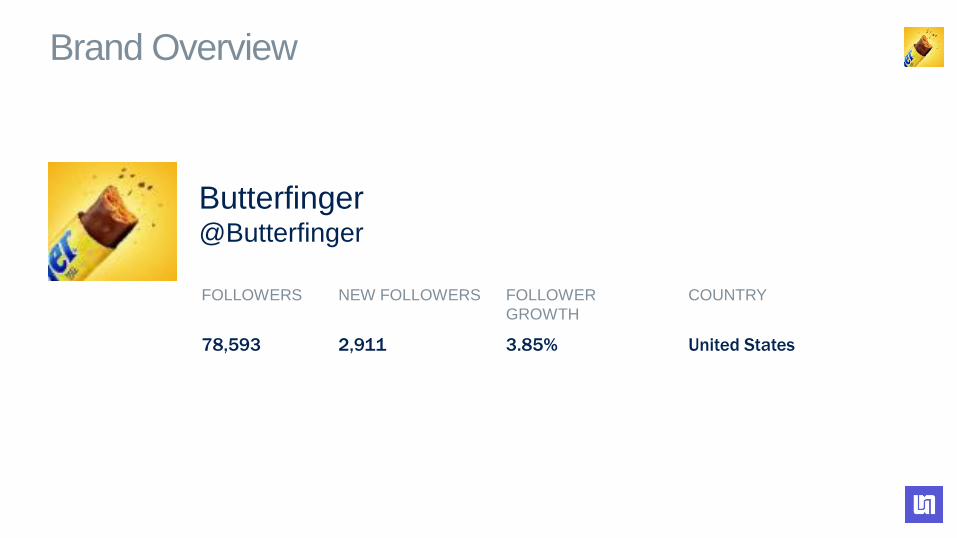
Brand Overview
FOLLOWERS NEW FOLLOWERS FOLLOWER
GROWTH
COUNTRY
78,593 2,911 3.85% United States
Butterfinger@Butterfinger

Engagement Score
256
Total Proactive Tweets
6
Retweets Total
0
Replies Total
91
Favorites Total
547
Total Mention
688
Total Retweets
108
Total Replies
0
Response Rate (%)
13.08%
Average Reply Time (mins)
952
BRAND TWEETS USER TWEETS
Brand Overview

74K
75K
75K
76K
76K
77K
77K
78K
78K
79K
79K
1-Oct 15-Oct 29-Oct 12-Nov 26-Nov 10-Dec 24-Dec
Follower Growth
Total Followers
78,593
New Followers
2,911
2K
2K
2K
2K
2K
2K
2K
2K
1-Oct 15-Oct 29-Oct 12-Nov 26-Nov 10-Dec 24-Dec
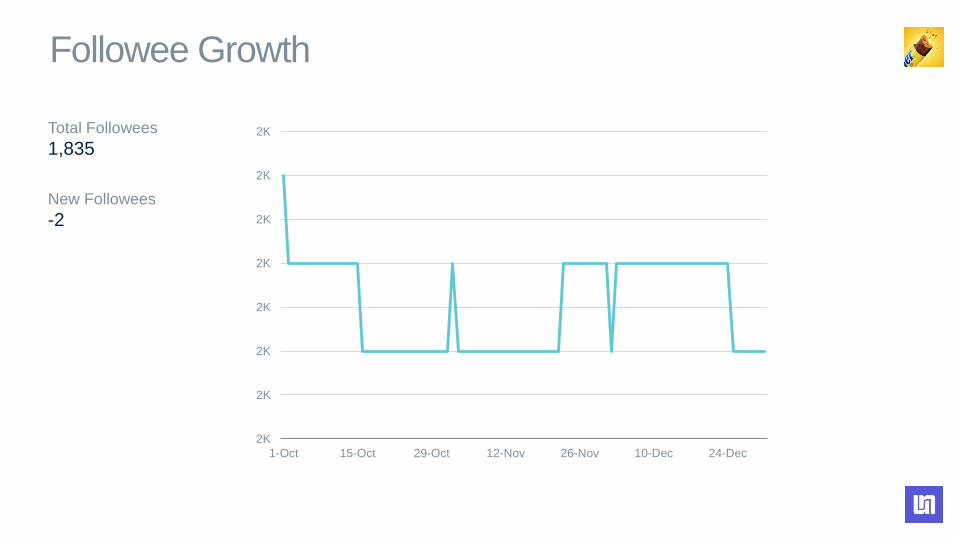
Followee Growth
Total Followees
1,835
New Followees
-2
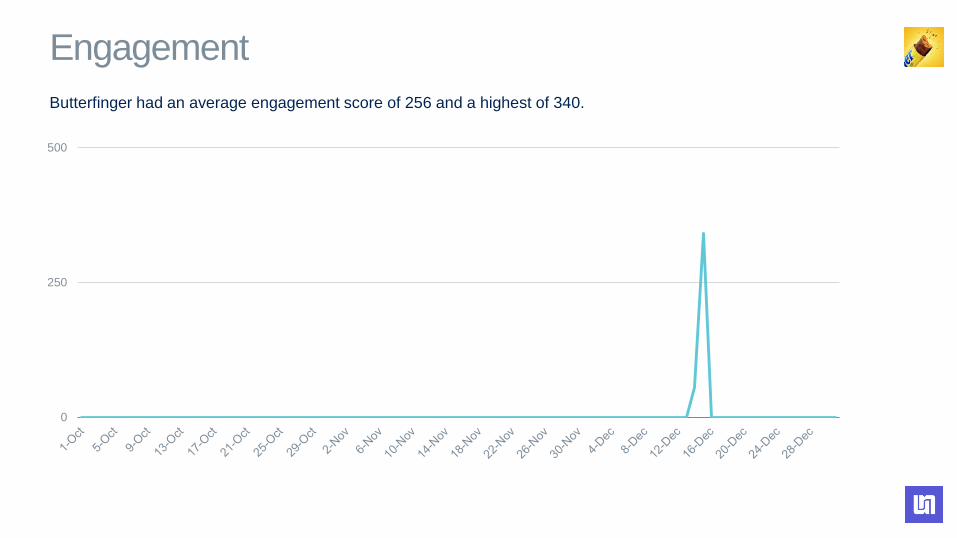
Engagement
0
250
500
Butterfinger had an average engagement score of 256 and a highest of 340.
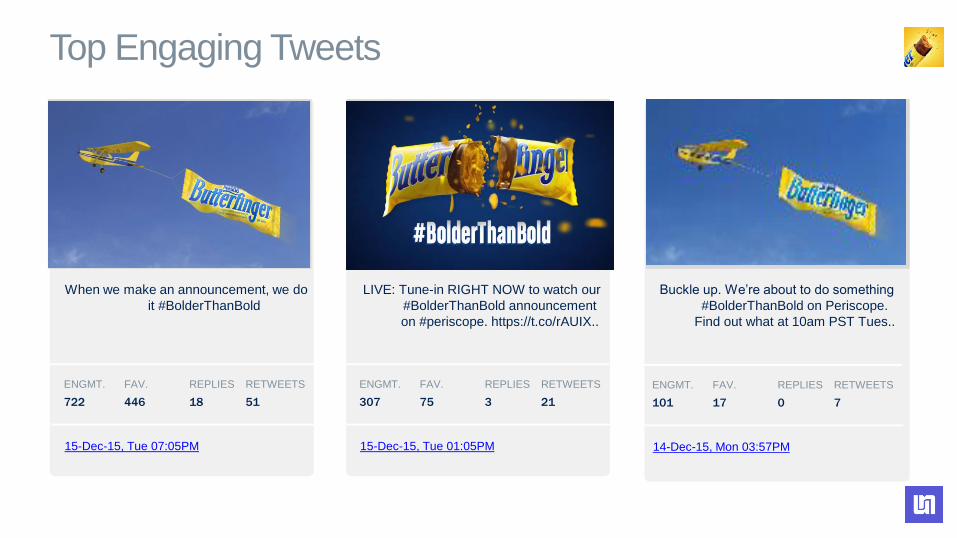
When we make an announcement, we do
it #BolderThanBold
15-Dec-15, Tue 07:05PM
ENGMT. FAV. REPLIES RETWEETS
722 446 18 51
Top Engaging Tweets
LIVE: Tune-in RIGHT NOW to watch our
#BolderThanBold announcement
on #periscope. https://t.co/rAUIX..
Buckle up. We’re about to do something
#BolderThanBold on Periscope.
Find out what at 10am PST Tues..
15-Dec-15, Tue 01:05PM
ENGMT. FAV. REPLIES RETWEETS
307 75 3 21
14-Dec-15, Mon 03:57PM
ENGMT. FAV. REPLIES RETWEETS
101 17 0 7
NO IMAGE NO IMAGE NO IMAGE
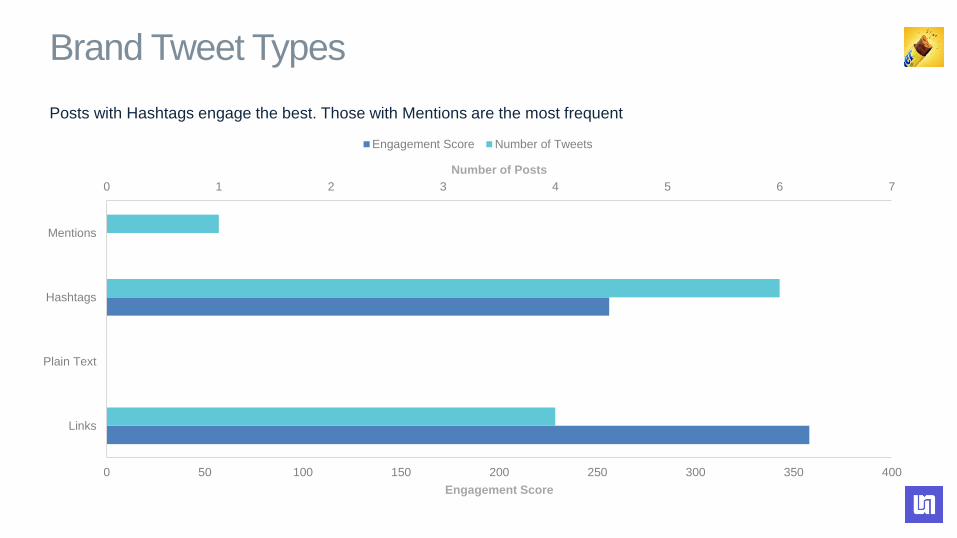
Posts with Hashtags engage the best. Those with Mentions are the most frequent
0 1 2 3 4 5 6 7
0 50 100 150 200 250 300 350 400
Links
Plain Text
Hashtags
Mentions
Number of Posts
Engagement Score
Engagement Score Number of Tweets
Brand Tweet Types

0 1 2 3 4 5 6 7
0 10 20 30 40 50 60 70 80
#bolderthanbold*
#periscope*
#halloween*
#reinventsweet
#superbowl*
#butterfinger*
#kyloren*
#candymonday*
#cupcakes*
#scotch*
User Tweets about Hashtag
Brand Tweets about Hashtag
Brand tweets User Tweets
Volume of Tweets with Hashtags

0
5
10
15
20
25
30
35
40
45
50
1-Oct 6-Oct 11-Oct 16-Oct 21-Oct 26-Oct 31-Oct 5-Nov 10-Nov 15-Nov 20-Nov 25-Nov 30-Nov 5-Dec 10-Dec 15-Dec 20-Dec 25-Dec 30-Dec
bolderthanbold periscope halloween reinventsweet superbowl
Spread of Hashtags by day
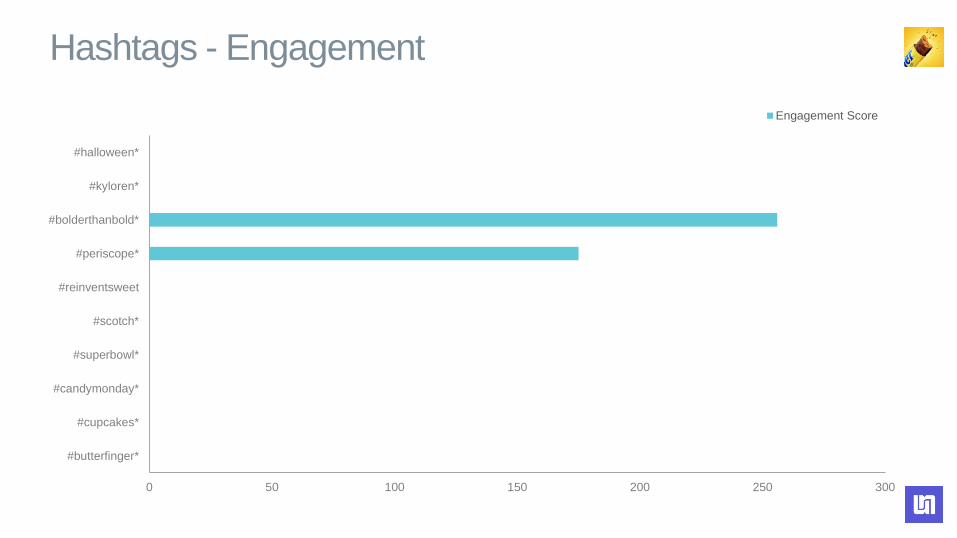
0 50 100 150 200 250 300
#butterfinger*
#cupcakes*
#candymonday*
#superbowl*
#scotch*
#reinventsweet
#periscope*
#bolderthanbold*
#kyloren*
#halloween*
Engagement Score
Hashtags - Engagement
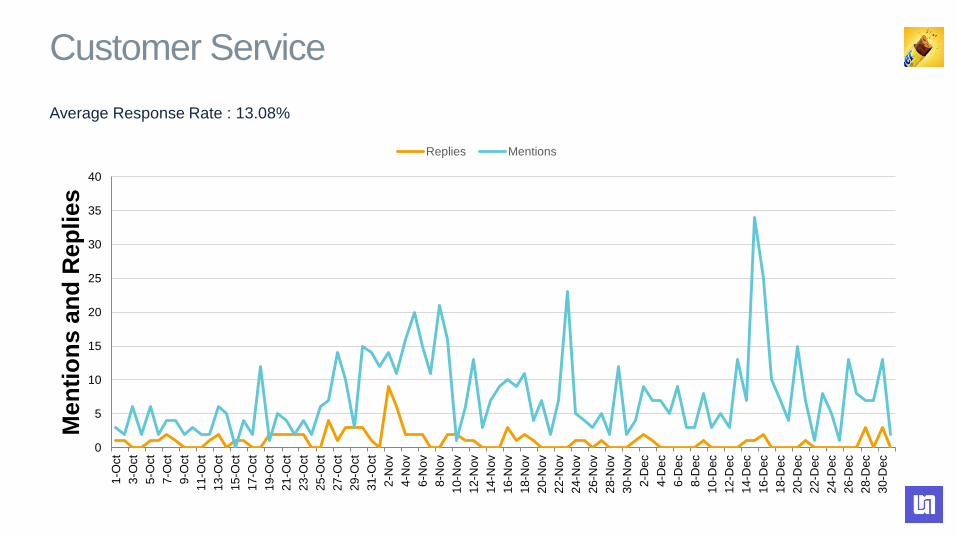
Average Response Rate : 13.08%
0
5
10
15
20
25
30
35
40
1-O
ct
3-O
ct
5-O
ct
7-O
ct
9-O
ct
11-O
ct
13-O
ct
15-O
ct
17-O
ct
19-O
ct
21-O
ct
23-O
ct
25-O
ct
27-O
ct
29-O
ct
31-O
ct
2-N
ov
4-N
ov
6-N
ov
8-N
ov
10-N
ov
12-N
ov
14-N
ov
16-N
ov
18-N
ov
20-N
ov
22-N
ov
24-N
ov
26-N
ov
28-N
ov
30-N
ov
2-D
ec
4-D
ec
6-D
ec
8-D
ec
10-D
ec
12-D
ec
14-D
ec
16-D
ec
18-D
ec
20-D
ec
22-D
ec
24-D
ec
26-D
ec
28-D
ec
30-D
ec
Men
tio
ns a
nd
Rep
lies
Replies Mentions
Customer Service
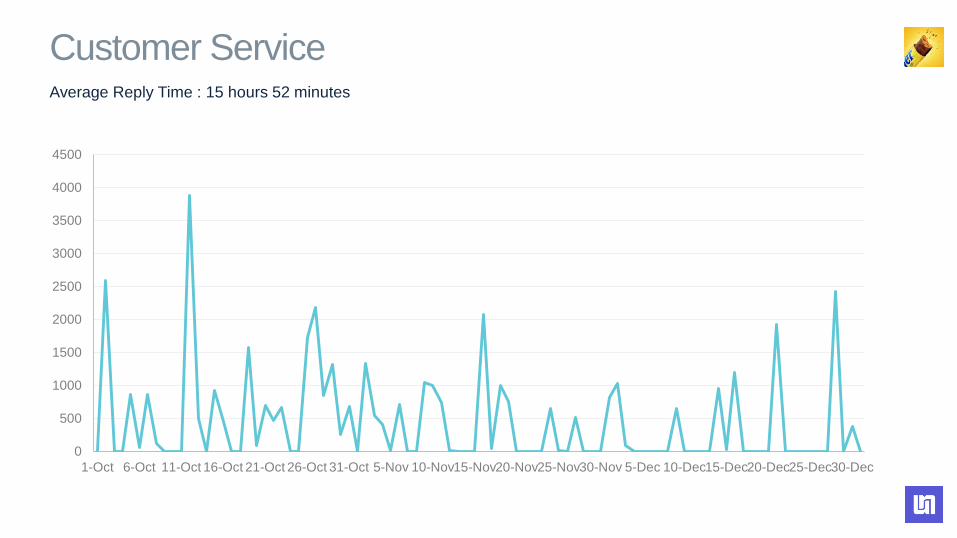
Average Reply Time : 15 hours 52 minutes
0
500
1000
1500
2000
2500
3000
3500
4000
4500
1-Oct 6-Oct 11-Oct 16-Oct 21-Oct 26-Oct 31-Oct 5-Nov 10-Nov15-Nov20-Nov25-Nov30-Nov 5-Dec 10-Dec15-Dec20-Dec25-Dec30-Dec
Customer Service
Positive Negative Neutral
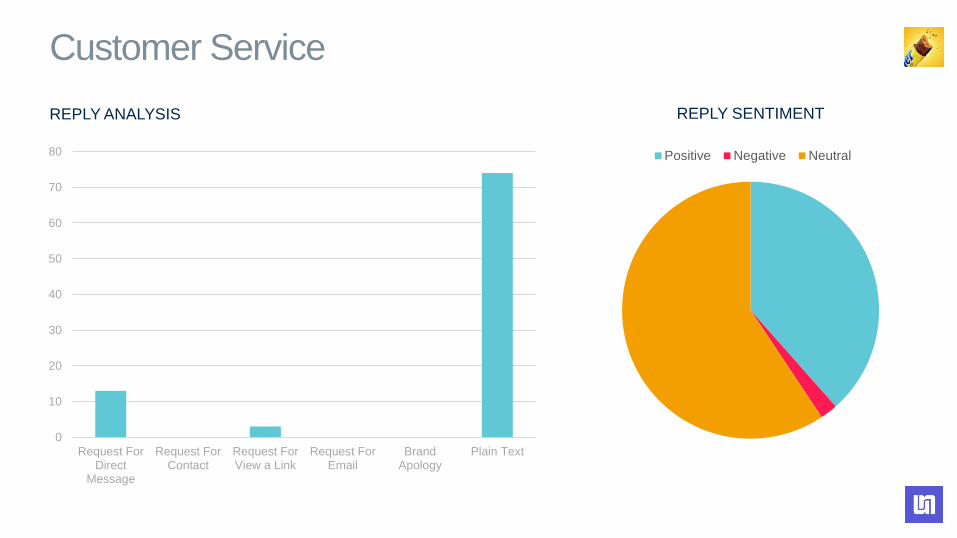
Customer Service
REPLY ANALYSIS REPLY SENTIMENT
0
10
20
30
40
50
60
70
80
Request ForDirect
Message
Request ForContact
Request ForView a Link
Request ForEmail
BrandApology
Plain Text
0
20
40
60
80
100
120
140
Monday Tuesday Wednesday Thursday Friday Saturday Sunday
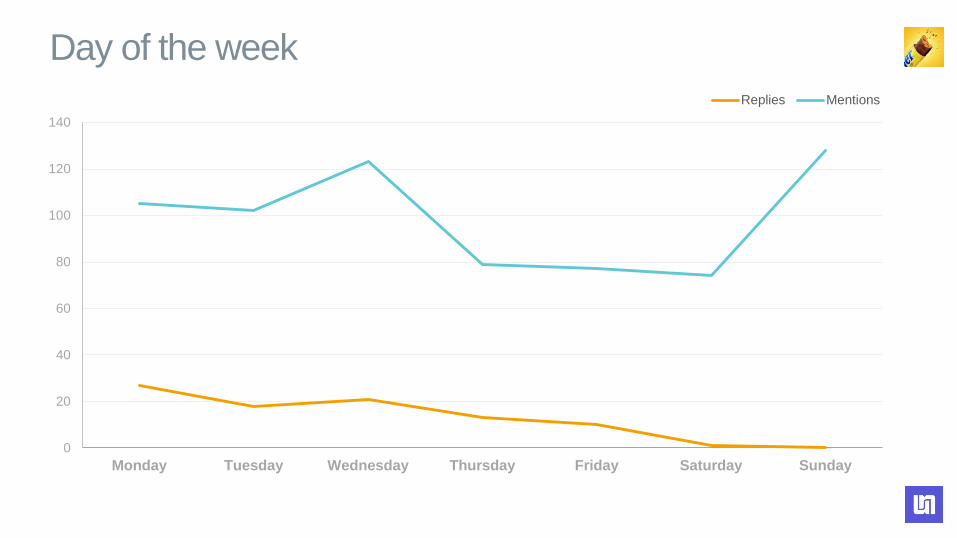
Replies Mentions
Day of the week
0
10
20
30
40
50
60
12:00 AM 2:00 AM 4:00 AM 6:00 AM 8:00 AM 10:00 AM 12:00 PM 2:00 PM 4:00 PM 6:00 PM 8:00 PM 10:00 PM
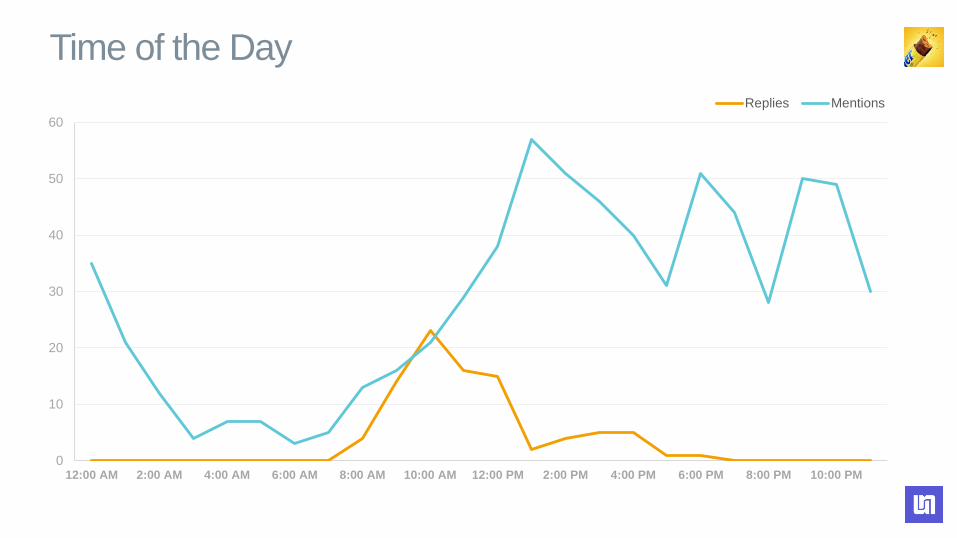
Replies Mentions
Time of the Day

Total number of Retweets : 108
-10
0
10
20
30
40
50
60
70
80
1-Oct 6-Oct 11-Oct 16-Oct 21-Oct 26-Oct 31-Oct 5-Nov 10-Nov 15-Nov 20-Nov 25-Nov 30-Nov 5-Dec 10-Dec 15-Dec 20-Dec 25-Dec 30-Dec
Retweets of Brand Tweets Brand Tweets
Retweets
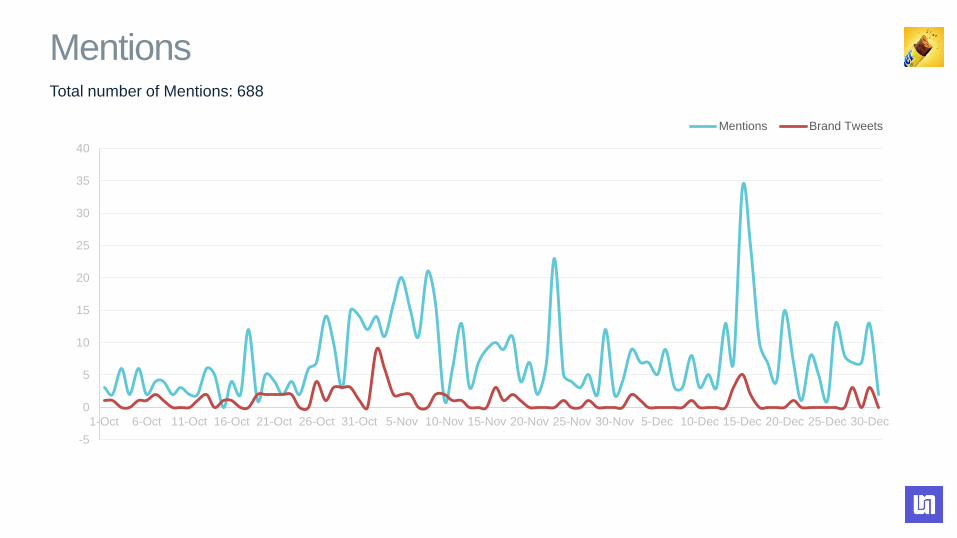
Total number of Mentions: 688
-5
0
5
10
15
20
25
30
35
40
1-Oct 6-Oct 11-Oct 16-Oct 21-Oct 26-Oct 31-Oct 5-Nov 10-Nov 15-Nov 20-Nov 25-Nov 30-Nov 5-Dec 10-Dec 15-Dec 20-Dec 25-Dec 30-Dec
Mentions Brand Tweets
Mentions
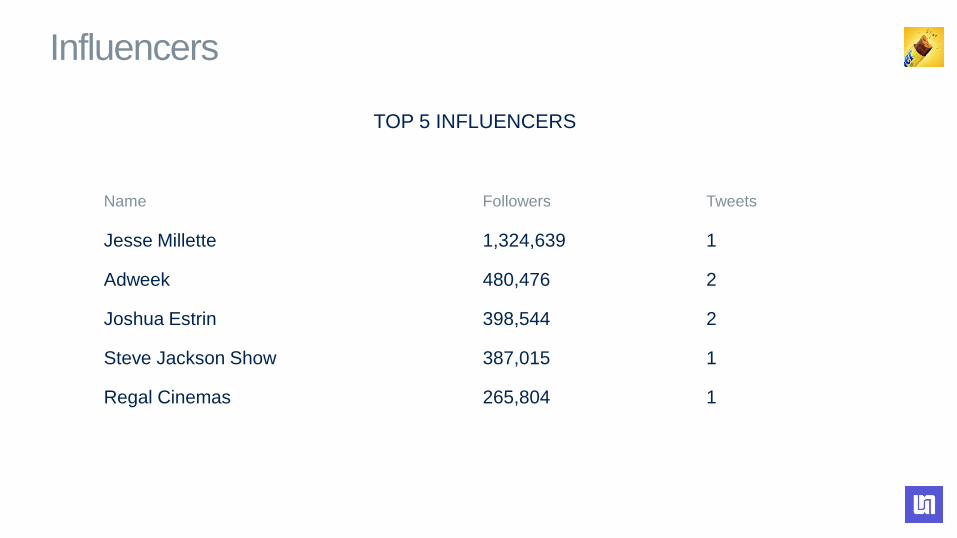
Influencers
Name Followers Tweets
Jesse Millette 1,324,639 1
Adweek 480,476 2
Joshua Estrin 398,544 2
Steve Jackson Show 387,015 1
Regal Cinemas 265,804 1
TOP 5 INFLUENCERS

Generate Your Own Social Media Report
This report was generated entirely by
the Unmetric Reporting Engine.
It took minutes to create.
Create Your FreeSocial Media Report Now