Butte Firecdfdata.fire.ca.gov/pub/cdf/images/incidentfile1221_1956.pdf · II. Butte Fire and...
37
Butte Fire CA AEU-024918 Post Fire Emergency Watershed Response Team October 12, 2015
-
Upload
duongkhuong -
Category
Documents
-
view
217 -
download
1
Transcript of Butte Firecdfdata.fire.ca.gov/pub/cdf/images/incidentfile1221_1956.pdf · II. Butte Fire and...

Butte Fire CA AEU-024918
Post Fire Emergency Watershed Response TeamOctober 12, 2015

Credits
California Department of Forestry and Fire Protection Team Lead, Len Nielson Registered Professional Forester License #2792 Coleader, Patrick McDaniel Registered Professional Forester License #2679 Geographic Information Specialist, Daniel Dresselhaus Registered Professional Forester License #2919 California Department of Water Resources Scott Kennedy, P.E. #C63801, Water Resources Engineer
California Geological Survey Technical Lead, Jeremy Lancaster, PG #7692, CEG #2379, Engineering Geologist Peter Holland PG #7994, CEG #2400, Engineering Geologist Central Valley Regional Water Quality Control Board René Leclerc, P.E. License #82180, Engineering Geologist, Central Valley Regional Water Quality Control Board California Department of Fish and Wildlife Henry Lomeli, Associate Wildlife Biologist Cover Photographs Top – Looking south from the central portion of the burn area Bottom left – Looking from Deer ridge toward Jesus Maria watershed Bottom-Right – Quiggs Mountain looking north
i

Table of Contents Credits Page ..................................................................................................................................... i Table of Contents ............................................................................................................................. ii I. Introduction ...............................................................................................................................1
Post Fire Watershed Emergency Response Team .............................................................. 1 II. Butte Fire and Historic Fire Occurrences .................................................................................. 2
Fire Progression .................................................................................................................. 2 Fire History .......................................................................................................................... 2
III. Physical Setting.......................................................................................................................... 2 Geologic Setting .................................................................................................................. 3 Hazardous Materials ........................................................................................................... 4 Soils ..................................................................................................................................... 4 Erosion and Landslides ........................................................................................................ 4 Post-Fire Debris Flow Hazards ............................................................................................ 4 Flood Hazards...................................................................................................................... 5
IV. Methods Used .......................................................................................................................... 5 Burn Area Reflectance Classification (BARC) Map .............................................................. 6 Debris Flow Hazard Modeling ............................................................................................. 6 Flood Hazard Review .......................................................................................................... 7 Flood History ....................................................................................................................... 8 Rain and Stream Gage Network .......................................................................................... 8
V. Results ...................................................................................................................................... 8 USGS Post-Fire Debris Flow Hazards ................................................................................... 8 Post-Fire Flood Risks ........................................................................................................... 9
VI. Summary of Field Observations ............................................................................................... 9 VII. General Observations .............................................................................................................. 9
Soils ..................................................................................................................................... 9 Hazardous Materials ......................................................................................................... 10 Debris Flows ...................................................................................................................... 10 Flooding ............................................................................................................................ 10
VIII. Specific Observations ............................................................................................................. 10 IX. Recommendations ................................................................................................................ 11 X. Notifications .......................................................................................................................... 11 XI. Emergency-Response Planning ............................................................................................. 12 XII. References ............................................................................................................................. 13 XIII. Appendices ............................................................................................................................ 16
Maps ................................................................................................................................. 16 Figure 1. Slope ..................................................................................................... 17 Figure 2. Geologic Map ....................................................................................... 18 Figure 3. Soil Burn Severity Map ......................................................................... 19 Figure 4. Hazard Map Index Page ....................................................................... 20 Figure 4. a-f. Debris Flow Hazard Maps ......................................................... 21-26 Figure 5. USGS Probability Model Results .......................................................... 27 Figure 6. USGS Volume Model Results ............................................................... 28 Figure 7. BLMSBS Hillslope Erosion Yields .......................................................... 29
Table 1 .......................................................................................................................... 30-31 Photos .......................................................................................................................... 32-35
ii
4

I. Introduction:The California Department of Forestry and Fire Protection (CAL FIRE), California Geological Survey (CGS), Department of Water Resources (DWR) and Regional Water Quality Control Board (RWQCB) were requested on September 22, 2015 by the California Office of Emergency Services (CalOES) to provide assistance in understanding the potential post fire runoff hazards, including flooding and debris flows,to watersheds burned in the 2015 Butte Fire. The objective of this preliminary report is to present observations made during a limited and general evaluation of downstream areas in a position that could be affected by flooding and/or debris-flows generated from watersheds burned by the Butte Fire CA-AEU 024918. The observations herein are not intended to be comprehensive and conclusive, but rather to serve as a preliminary tool to assist emergency responding agencies (for example CAL FIRE, Calaveras and Amador County Fire Departments, Calaveras and Amador County, Cal Trans, Amador and Calaveras County Public Works, US Forest Service, Cal OES, Natural Resource Conservation Service, utility companies, and other responsible agencies) in development of more detailed post fire emergency response plans. This report does not provide emergency response plans. It is intended that the emergency responding agencies will use the information presented in this report as a preliminary guide to complete their own more detailed evaluations and develop detailed emergencyresponse plans and emergency protective measure.
The Butte Fire started on September 9, 2015 and burned approximately 70,868 acres of terrain including the communities of Jesus Maria and Mountain Ranch. Larger communities outside of the burn area include Jackson to the northwest and San Andreas to the west (See: http://cdfdata.fire.ca.gov/incidents). The burn area is drained by a number of perennial and ephemeral watercourses including the Mokelumne River and the North and South forks of the Calaveras River. These watercourses discharge toward Pardee and New Hogan reservoirs, respectively. Infrastructure and development in these watersheds are within the fire perimeter and downstream of the perimeter to the west.
State Post Fire Watershed Emergency Response TeamThe Post Fire Watershed Emergency Response Team (SPFWERT) operations for Phase I were managed by Len Nielson - Forester II, with assistance from Daniel Dresselhaus – Forester II and Patrick McDaniel – Forester I of CAL FIRE. SPFWERT specialists on geologic hazards included and Jeremy Lancaster and Peter Holland – Engineering Geologists with CGS. SPFWERT specialists on flood hazards included Scott Kennedy – Water Resources Engineer (DWR); and, René Leclerc – Water Quality Engineer (RWQCB).
1

II. Butte Fire and Historic Fire Occurrences
Fire ProgressionThe Butte fire started on September 9, 2015 at 2:26 PM. The fire made significant runs to the south at a dangerous rate of spread on September 10th and 11th, consuming approximately 25,000 acres and 29,000 acres respectively. These significant runs occurred in the areas of North Fork Calaveras Creek, Jesus Maria Creek, and Salamander creek. The fire was declared 100% contained on the evening of October 1, 2015. The vegetative communities within the fire area range from grasslands, to young and mature brush/chaparral, to mature timber. In all, the Butte fire burned 70,868 acres, destroyed 475 residences, 343 outbuildings, and resulted in two civilian fatalities.
Fire HistoryWhile Amador and Calaveras counties have an extensive fire history, much of the Butte fire area had no recorded fire history. Within the Butte fire perimeter, all or portions of 30 fires have occurred. All but two of these fires were less than 1,700 acres. The two largest fires were the Gulch fire in 1992 which burned 17,419 acres in the Calaveritas Creek watershed, and the Leonard fire in 2001 which burned 5,188 acres on the west side of Quiggs mountain. Jesus Maria Creek, North Fork Calaveras River, and much of Salamander Creek watersheds have virtually no recorded fire history.
III. Physical Setting The Butte Fire occurred within the central portion of the Sierra Nevada Geomorphic Province (Sierra Nevada), approximately 3.5 miles southeast of Jackson, Amador County, and 1.2 miles east of San Andreas California. The topography in the burn area ranges from a high of about 3000 feet in the east to a low of about 600 feet along the Mokelumne River in the northwest. The majority of the burn area ranges in elevation from about 2800 feet to about 1000 feet. The average annual high and low temperatures are 76 and 43 (degrees F), respectively. The average temperature is 60degrees. On average, the burn area experiences 32.7 inches of rainfall annually.
The burn area is drained by a number of perenial and ephemeral watercourses including the north and south forks of the Calaveras River and the Mokelumne River. The Mokelumne River, located in the northern portion of the burn area, is the largest watershed affected by the Butte fire and is divided into the Hunt Gulch, Lower Middle Fork and Lower South Fork. A total of 18,455 acres of the 70,868 acre fire was within Mokelumne River watershed. The remaining 52,413 acres was within the Calaveras River watershed, including the North Fork Calaveras River and its tributaries, including Esperanza Creek in the north, Jesus Maria Creek in the south. Jesus Maria Creek is fed by two tributaries, Wet Gulch and Salamander Gulch. The total watershed area at the junction of the North Fork Creek and of the Calaveras River and Jesus Maria Creek is
2

approximately 73 miles, according to the USGS Streamstats that were provided(http://water.usgs.gov/osw/streamstats/california.html). Within the burn area, the South Fork Calaveras River is fed by Murray Creek in the north, Calaveritas Creek and O’Niel Creek, and the Lower San Antonio Creek in the south. The side-canyon slopes within each of these drainages tend to be steep (greater than 56%) (Figure 1). The topography between these drainages generally consists of gentle (0% to 25%) to moderate (26% to 55%) slopes. The western portion of the burn area has a number of smaller, steeper areas (greater than 40%) outside of the major drainages when compared to the eastern portion of the burn area, which has broader, gentler slopes between the drainages. Generally the steepest slopes (greater than 56%) within the burn area are found in the eastern and central portions of the major drainages), with the Mokelumne River exhibiting the largest continuous area of steep side slopes with the highest topographic relief. The fire burned approximately 12,000 acres of public land of the Bureau of Land Management and 59,000 acres of privately owned land.
Geologic Setting The Sierra Nevada is an approximate 400 mile long tilted fault block with a gentle western slope and a high, steep eastern face. Within the geomorphic province the bedrock is generally comprised of the metamorphosed Paleozoic era (250 million to 540 million years) sedimentary and volcanic rocks and Mesozoic era (65 million years to 250 million years) metasedimentary and metavolcanic rocks of the western metamorphic belt and the Mesozoic era granitic batholith and plutons. In places, the Paleozoic and Mesozoic basement bedrock is capped by younger Tertiary period (1.6 million to 65 million years) sedimentary and volcanic rocks.
Regional geologic mapping at 1:250,000 scale by Wagner and others (1981) and at 1:62,500 scale by Clark et al. (1970) indicates that the majority of the Butte Fire burn area occurred in the Paleozoic era Calaveras Complex (primarily interbedded chert, phyllite, argillite, slate, and schist) (Figure 2). Within the Calaveras Complex in the burn area are also smaller bodies of Mesozoic era intrusive granitic and dioritic rocks, Mesozoic era metasedimentary and ultramafic rock, Paleozoic era limestone, and scattered alluvial gravels and volcanic rocks of Tertiary age, as well as Quaternary alluvial deposits. Along the eastern margin of the burn area the Calaveras Complex terminates at the Pre-Quaternary (greater than 1.6 million years) Calaveras-Shoo Fly Thrust Fault (Jennings et al, 2010). On the eastern side of the fault undifferentiated metasedimentary rocks and Mesozoic era gabbroic rocks capped by Tertiary volcanic rocks and alluvial rocks. The Tertiary volcanics are primarily the rhyolitic tuff deposits of the Valley Springs Formation and the volcanic andesite and mudflow deposits of the Mehrten Formation. The Mehrten Formation is typically a resistant unit that regionally caps the ridgetops. Clark et al. (1970) maps a shear zone within the central southern
3

part of the burn area. The shear zone trends to the northwest, which is consistent with the overall structural trend of the geomorphic province.
Hazardous MineralsHazardous minerals in the Sierra Nevada province are often associated asbestos and mercury. Asbestos is classified as a known human carcinogen by state, federal and international agencies. State and federal health officials consider all types of asbestos to be hazardous. There is no agreed-upon “safe” level of asbestos exposure because there is insufficient scientific information to support the identification of an exposure level at which there would be zero risk of cancer. Based on our limited review of geologic units within the burn area, ultramafic rock units are present.
The burn area has numerous mines with associated mine tailings and mine waste. The use of mercury was common practice to enhance gold recovery in all the various types of mining operations since 1850. For additional information, see: http://pubs.usgs.gov/fs/2005/3014/
For general review information on hazardous minerals, see: http://www.conservation.ca.gov/cgs/geologic_hazards/hazardous_minerals/Pages/Index.aspx
SoilsSoils in the burn area are typically shallow, over poorly weathered bedrock. These soils typically develop into gravelly loams, sometimes with a high clay content. Deeper soils are found in some valley bottoms and below the flanks of the Tertiary age volcanic deposits (Mehrten Formation) described above. At the time of this report, NRCS soil mapping was in progress, and therefore not available for this summary.
Erosion and Landslides Calaveras County light detection and ranging (LiDAR) bare-earth hillshade was reviewed in conjunction with geology and soil references to identify geologic and soil units subject to erosion and shallow landslides. Our observations indicate that much of the burn area is underlain by geologic formations, such as the Calaveras Complex, that are relatively resistant to erosion. However, several geologic units and features exhibit the geomorphic expression of relatively higher erosion rates. These include granitic rocks of Mesozoic age, the Merhten Formation and its unconformity with underlying rock units, and bedrock units within a northwest trending shear zone that runs parallel an east of Salamander Gulch, and Jesus Maria Creek.
4

Post Fire Debris Flow HazardsWildfire can have profound effects on a watershed. Consumption of the rainfall-intercepting canopy and of the soil-mantling litter and duff, intensive drying of the soil, combustion of soil- binding organic matter, and the enhancement or formation of water repellent soils can result in decreased rainfall infiltration into the soil and subsequently significant increased overland flow and runoff in channels. Removal of obstructions to flow (e.g. live and downed timber, plant stems, etc.) by wildfire can enhance the erosivepower of overland flow, resulting in accelerated stripping of material from hillslopes. Increased runoff can also erode significant volumes of material from channels. The net result of rainfall on burned basins is often the accelerated transport of water along withthe transport and deposition of large volumes of sediment, both within and down-stream from the burned area. Debris flows are among the most hazardousconsequences of rainfall on burned hillslopes. Debris flows pose a hazard distinct from other sediment-laden flows because of their unique destructive power. They can occur with little warning, can exert great impulsive loads on objects in their paths, and evensmall debris flows can strip vegetation, block drainage ways, damage structures, and endanger human life. The entrainment of sediment in runoff “bulks” the volume of flowresulting in an increased total amount of material moving down the watercourse whencompared to “clear water flows” that do not entrain sediment. A recent study conducted by CGS in Inyo County following post fire debris flows provides an example; the studycan be found at this link:
http://www.consrv.ca.gov/cgs/information/publications/sr/Documents/SR_225.pdf .
Flood HazardsIncreased flood risk is a significant hazard in the post fire environment. Because of the additional water and sediment delivery to streams from the burned landscape, flood elevations and areas of inundation following a given storm event will be greater after a fire has occurred. Post fire increases in flood risk are largely a function of the size of the rainfall event and the percentage of bare soil exposed to rainfall, but are also dependent on topography, land practices, soil characteristics, soil burn severity, and time since the fire (Robichaud et al. 2010).
IV. Methods usedThe general approach implemented by the Butte Fire SPFWERT is founded in the need to identify post fire runoff hazards and their potential down-stream effects on life and property in the built environment. The hazards assessed are limited to runoff-initiated debris flows and flooding and do not include the potential for deep-seated landslides, rockfalls, and other natural hazards.
The SPFWERT used the post fire debris flow hazard model completed by the USGS toreview the potential for post fire runoff hazards (Staley et al., 2013). A FEMA Flood
5

Insurance Study (FIS) was used to assist the team with the identification of post fireflooding hazards. Both resources were used to guide the assessment of locations where hazards to life and property may exist.
Field observations were made between 10/1/2015 and 10/3/2015 to collect soil burn severity data as a part of the Burned Area Reflectance Classification (BARC) map validation and revision process. Observation of locations where hazards to life and property may occur began on 10/3/2015 and continued through 10/9/2015.
Burn Area Reflectance Classification (BARC) Map:The US Forest Service (USFS) developed a Burned Area Reflectance Classification(BARC) map for the Butte Fire burn area (Plate 1). The BARC map is composed ofsatellite-derived data layers of post fire vegetation conditions. The BARC has four classes: high, moderate, low, and unchanged. Typically the higher the burn severity,the more susceptible the area is to rapid runoff and erosion. Layers for the BARC map may be found at:
http://activefiremaps.fs.fed.us/baer/download.php
Adjustments to the BARC product are generally based on field observations used to validate and ultimately create a soil burn severity map. The SPFWERT team made observations using an abbreviated version of the soil burn severity classification developed by Parsons et al. (2010) due to the short timeframe necessary to develop the revised soil burn severity map. In the field, the team collected information on:
Percent of ground cover (organic litter and duff) that remained after the fireDepth of ash on the ground surfaceSoil structureWhether the roots were burned or unburnedSoil water repellency field tests Depth of repellency test
The SPFWERT collected 94 data points and combined these with 26 data points collected by the US Bureau of Land Management. Burned soil conditions were observed after a rainfall event totaling 0.74 inches on 10/1/2015, and therefore affected observations of soil color and ash depth. These points were used to revise the BARC map classifications into a soil burn severity map. This map was completed by CAL FIREGIS staff, and delivered to the USGS on Sunday 10/5/2015.
In general the BARC map was found to be accurate during the field inspection, except at a few locations. These locations were found to occur where ground fuels were unusually low or unusually high prior to the fire. For example, hydrophobic soils and thick ash deposits indicated high soil burn severity in some areas where the BARC map indicated moderate soil burn severity, possibly due to a hot ground fire but largely unburned tree canopy. Conversely, moderate soil burn severity was observed in an area treated with pruning and possible ground litter removal for defensible space, where
6

the BARC map indicated high soil burn severity, and the canopy was fully consumed in the fire. Lastly, several areas of open grassland exhibited low soil burn severity where the BARC map indicated moderate burn severity.
Debris Flow Hazard ModelingThe USGS post fire debris flow hazard model uses the results of the SPFWERT soil burn severity map along with empirical models to estimate the probability and volume of debris flows for selected basins in response to a selected storm. The empirical models are based upon historical debris-flow occurrence and magnitude data, rainfall storm conditions, terrain and soils information, and burn-severity data from recently burned areas. Post fire debris-flow probability, volume, and combined hazards are estimated at both the drainage basin scale and in a spatially distributed manner along the drainage network within each basin. The characteristics of basins affected by the fire were calculated using a geographic information system (GIS). Debris-flow probability and volume were estimated for each basin outlet as well as along the upstream drainage networks.
The US Geological Survey (USGS) preliminary hazard assessment of the Butte Fire can be accessed at:
http://landslides.usgs.gov/hazards/postfire_debrisflow/2015/20150909butte/
Hillslope Erosion ModelingHillslope erosion modeling was conducted by Mary Ellen Miller (Research Engineer,Michigan Technological University) using GeoWEPP (Geographical interface for the Water Erosion Prediction Project) and Disturbed WEPP parameters that weredeveloped for forest conditions. The model estimates the quantity of erosion during a ten year storm event/recurrence interval based on the field verified Soil Burn Severity map and assumed values for post fire ground cover in areas of differing burn severity.The modeling results are mapped as sediment yields from each simulated representative hillslope entering a channel segment (Renschler, 2003)
Flood Hazard ReviewGoogle EarthTM was used as a screening tool to identify structures (and other features) in low-lying areas adjacent to watercourses that are most likely to be exposed to additional flood risk following the Butte Fire. The aim of this effort was to conduct a preliminary survey of structures at risk during a 2-day field inspection period allotted for this part of the study. Due to the size of the fire, lack of access in some cases and preliminary nature of the assessment, the structures identified in this report represent a sample and not an exhaustive list of structures or facilities potentially to be exposed to additional flood risk following a precipitation event. In addition to structures (and other features), several bridge and culvert crossings were also identified and visually assessed as part of the field inspection effort in order to identify flood risks to crossing vehicles or pedestrian traffic.
7
FEMA has mapped the floodplains for all or parts of several of the more significant rivers and streams within the Butte Fire burn area. The more notable streams are:
North Fork Calaveras River, including the following tributaries:o Jesus Maria Creek, Spring Gulch and Wet Gulch
North Fork Calaveras River, including the following tributaries:o Murray Creek, El Dorado Creek, McKinney Creek, Martin Gulch, Adobe Gulch,
O’Neil Creek, Calaveritas Creek
These rivers and streams all have a FEMA Zone A designation. FEMA defines flood Zone A as “Areas subject to inundation by the 1-percent-annual-chance flood event generally determined using approximate methodologies. Because detailed hydraulic analyses have not been performed, no Base Flood Elevations (BFEs) or flood depths are shown.” The Calaveras County Flood Insurance Study describes several waterways that were studied in greater detail, but none of these waterways are located within the Butte Fire burn area. If an area is determined to have “low development potential or minimal flood hazards” then approximate methods are used to generate the flood maps and a Zone A designation is assigned. Flood map panels and Flood Insurance Studies can be obtained from FEMA’s Map Service Center at this web address: https://msc.fema.gov/portal/advanceSearch.
Flood HistoryAccording to the FEMA Flood Insurance Study Calaveras County does not have a significant history of flooding. The Flood Insurance study briefly states that “Flooding occurs in the county from periods of heavy rainfall or rapid snowmelt” but no other information is given for the unincorporated areas of Calaveras County.
Rain and Stream Gage NetworkThe Butte Fire perimeter is flanked by rain gages. The rain gages are located at Electra Power House (Pacific Gas and Electric Company) to the north, Railroad Flat (United States Army Corps of Engineers) to the north-east, Esperanza (CAL FIRE) to the east, Sheep Ranch (United States Army Corps of Engineers) to the south-east, and San Andreas (National Weather Service) to the west.
Given the location of these gages and that the entire Butte Fire burn area receives generally similar annual rainfall (approximately 35 inches annually) and generally similar rainfall intensity (1.0 to 1.2 inches per hour in a 25-year event), it is believed that these five rain gages should provide a relatively good representation of the rainfall that occurs on the burned area. These rain gages can be monitored remotely on the California Data Exchange Center website when storm events occur (http://www.cdec.water.ca.gov/). Rainfall intensity maps can be found on NOAA’s site at this web address: http://hdsc.nws.noaa.gov/hdsc/pfds/pfds_maps.html.
No stream flow gages are located within the burn area. The East Bay Municipal Utility District operates a stream gage on the Mokelumne River at Highway 49 near the town of Mokelumne Hill, but the data is provisional. Additionally, PG&E operates a stream
8

gage on the Mokelumne River at the Electra Power Plant within the burn area. Additionally, PG&E operates a stream gage on the Mokelumne River at the Electra Power Plant within the burn area.
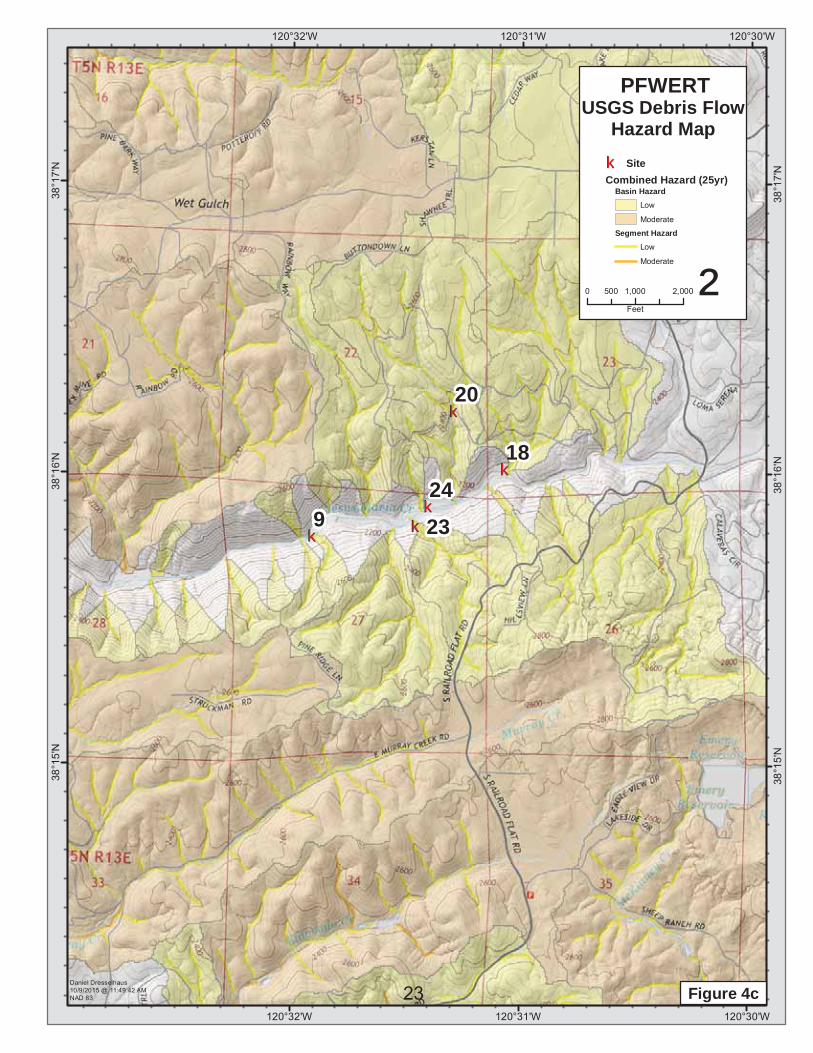
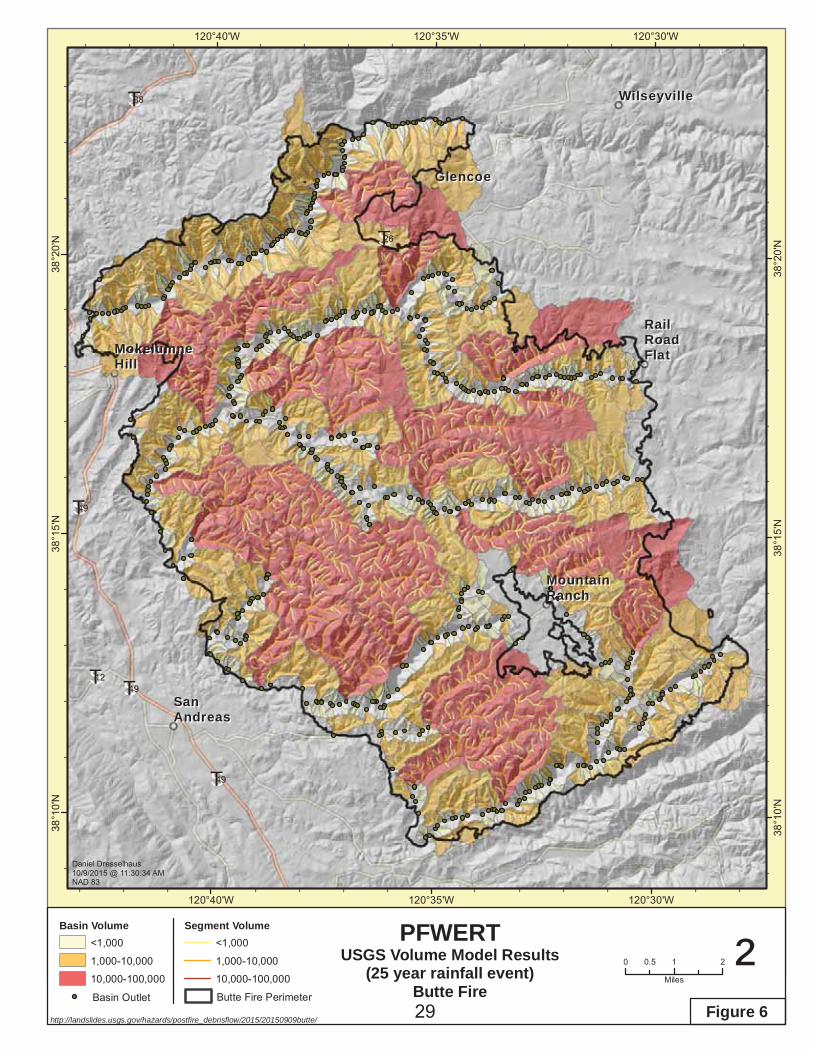
V. ResultsUSGS Post fire Debris Flow HazardsUSGS post fire debris flow hazard model results generated for the Butte Fire burn area are based on a 25-year rainfall event, as defined in NOAA Atlas 14 (Bonnin et al., 2006). Model results were used in our assessment of locations where hazards to life and property may exist and are presented as debris flow hazard maps on Figures 4through 6 (Appendix A). Figure 4 shows the results of the combined relative debris flow hazard results, and figures 5 and 6 display results of the probability and volume models.
The probabilistic maps categorize the results for each watershed or sub-watershed in percent probability with five groups. These probability classes, very low (0 to 20%), low (21 to 40%), moderate (41 to 60%), high (61 to 80%) and very high (81 to 100%), are ranked 1 through 5, respectively. The volume maps categorize the results in total volume (m3) for each watershed or sub-watershed with four groups. These volume classes, 0 to 1,000 m3, 1,001 to 10,000 m3, 10,001 to 100,000 m3, and >100,000 m3,are ranked 1 through 4, respectively. Results are then combined into an estimated relative debris flow hazard ranking by combining the ranks within the probability and volume classes into a total score. Therefore the combined probability and volume relative hazard ranking is Low (1-3), Moderate (4-6), and High (7-9).
The combined relative hazard results indicate that within the burned area, 169 basins have a “moderate” combined hazard and 438 basins have a low combined hazard. For the watersheds burned in the Butte Fire, these results give an indication of potential post fire watershed response. However, it is important to note that USGS probability and volume models are not used to identify cumulative hazards from multiple storm events. However, in reality the greatest post fire runoff hazard may be the result of one large and particularly intense storm on a burned watershed that has an abundance of available sediment stored in channels, or a series of storms on a burned watershed that ultimately load channel networks, ultimately impacting life and property.
Sites located in or near USGS post fire debris flow hazard areas, are listed in Table 1, and include the USGS basin identification number. Upstream basins that issue into lower gradient channels are not listed, but should also be considered given their potential to load channel networks.
Hillslope ErosionHillslope erosion modeling was carried out by Mary Ellen Miller (Research Engineer, Michigan Technical University) using GeoWEPP (Geographical interface for the Water Erosion Prediction Project). WEPP parameters included the PFWERT soil burn severity map and the cligen station (TIGER CREEK PH CA). The cligen station parameters were
9

modified using Rock:Clime and Prism datasets to represent a central location within the Butte fire. A return period analysis was conducted in order to select a modeling year containing a 10-year storm event in order to represent a “wet” year as there is concern of above average precipitation due to El Nino. The predicted precipitation for the modeled year was 49.2 inches (Miller, personal comm.).
The GeoWEPP results (Figure 7) are provided for a one year modeling period andpredict mean hillslope erosion rates of 7.8 tons/acre per year for the burn area (or 17.5 Mg/ha per year with a standard deviation of 22 Mg/ha year). The range in erosion rates provided in the model results is 0 to 75.8 tons/acre per year (or 0-170 Mg/ha per year).
The GeoWEPP results show the greatest increase in post fire erosion hazards within the Mokelumne River and North Fork Calaveras River watersheds. In these areas, modeling of steep side-canyon tributaries with slopes greater than 40 to 50 percent and moderate to high burn severity, indicates a range in annual erosion rates from 22.7 to 75.8 tons/acre (Note: Figure 7 shows the data range extending to 260 Mg/acre per year, but actual GIS grid maximum output is approximately 170 Mg/acre per year).
Post fire Flood Risks The results of the USGS debris flow and GeoWEPP models indicate that debris and sediment loading of perennial and ephemeral watercourses will be enhanced in the coming years. In review of these models, the PFWERT recognized the potential for post fire runoff, erosion and debris loading, to exceed that of the pre-fire conditions by as much as 1 to 2 orders of magnitude for a given rainfall event (Elliott et al. 2004, Larsen et al. 2009, Robichaud et al. 2010). As a result of post fire runoff processes, a 10-year storm event in a severely burned watershed may produce a flood event equivalent to a 50-year or 100-year storm event in the pre-fire condition. Based on this understanding FEMA Flood Insurance Rate Maps (FIRMs) (FEMA 2010) were used to assist in the identification of sites with additional post fire flood risk. Sites identified during the flood risk review are listed in Table 1. These sites are differentiated from debris flow hazard sites in Table 1 by their designation as ‘flooding / debris flow’ hazards rather than ‘debris flow / flooding’ hazards.
All of the structures identified as a ‘flooding / debris flow’ hazard site in Table 1 are located either within Zone A (the 100-year flood) of the FIRM or next to a small, unmapped watercourse. Because of higher expected runoff rates from the post firelandscape, it is assumed that a post fire flood event with less than a 100-year return period may inundate all or portions of Zone A.
VI. Summary of Field Observations General field observations and attendant location photos are summarized in Appendix B.
10

VII. General Observations SoilsIt appears that soils derived from granitic bedrock, and those associated with the northwest trending shear zone are loose and susceptible to erosion, regardless if they are affected by wildland fires.
Development of water repellent soils. Our limited soils observations within the burn area indicate that water repellent soils have developed in areas where the BARC map indicates moderate to high burn classifications. The presence of water repellent soils is anticipated to decrease infiltration of water resulting in an increase of surface flow during storm events.
Hazardous MineralsGeologic literature review suggest there is potential for the burn area to contain naturally occurring asbestos.
The presence of mines, mine tailings and waste, suggest that mercury may be present in the burn area.
Debris FlowsThe development of water repellent soils and attendant increase in runoff may result in increased erosion of hillsides, scouring of watercourse channels, bulking of sediment and development of in-channel debris flows.
Steeply sloping terrain and side-canyon drainage networks may produce debris-laden flows and debris flows that could load channels associated with the Mokelumne River, and the North and South forks of the Calaveras River drainages.
FloodingDrainages in portions of the Mokelumne River, and the North and South forks of theCalaveras River will be a focal point for increased flood risk following the fire. In addition to higher peak flows and runoff volumes, the post fire runoff hydrograph will typically exhibit a more rapid response time such that the peak flow arrives more quickly following a rain event as compared to the pre-fire hydrograph.
Increases in runoff, subsequent erosion and debris loading (peak flow and volume), may exceed that of the pre-fire environment by as much as 1 to 2 orders of magnitude for a given rainfall event (Elliott et al. 2004, Larsen et al. 2009, Robichaud et al. 2010). Consequently, a 10-year storm event in a severely burned watershed may produce a flood event equivalent to a 50-year or 100-year storm event in the pre-fire condition.
11

VIII. Specific observations Specific observations are summarized in the attached spread sheet (Appendix 1). The observations are intended to be used as a preliminary indication of some of the most obvious areas of potential concern for follow-up work and more detailed evaluations.Review of debris flow and flood hazards for each site are provided in Table 1.
IX. Conclusions and RecommendationsConclusionsLandowners located within, and downstream of, debris flow hazard areas and areas of increased flood risk should consider emergency measures to protect life and property during the expected 2 to 5 year period of watershed recovery following the Butte Fire. Debris flow and flood hazard risks are expected to be highest in the first winter following the fire, then decrease as the watershed recovers and vegetation cover is restored.
The largest increases in post fire runoff and sediment peak flows and volumes (relativeto pre-fire conditions) will occur in drainages where more than 50% of the watershed area exhibits moderate to high soil burn severity. Post fire runoff and erosion rates may increase by as much as one to two orders of magnitude in severely burned watersheds,particularly where 90% to 100% of the ground surface is bare soil and the tree canopy is completely burned. Consequently, low-lying (floodplain) areas adjacent to stream channels downstream of moderately to severely burned watersheds will likely exhibit unusually high flows with high water surface elevations due to increased runoff of water and sediment. Such large increases may not be anticipated by local public works employees or by local residents.
Large quantities of ash and sediment are expected to be transported downstream of the Butte Fire and deposited in Pardee Reservoir and New Hogan Lake, producing high turbidity levels and potentially affecting water chemistry due to ash and sediment loading. Water supply reservoirs may receive significantly higher rates of sediment deposition than would normally occur for a given rainfall event.
It should be noted that the USGS debris flow model indicates areas of high probability, but with low volumes. Conversely, the model identifies areas with low probability and high volumes. Depending on the setting, a high volume debris flow event may have greater consequences to life and property than a low volume event.
The modeling results and flood hazard map review provided in this report are based on the 10-, 25-, and 100- year storm events. However, given that a strong El Nino is forecasted to continue through the winter of 2015/16, extreme meteorological events that tap elevated subtropical moisture may exceed the 100-year rainfall.
Culverts that have not been designed for a 100-year flood event may be subject to increased likelihood of failure from the enhanced volumes of water from the burned area. Additional road hazards include overtopping flows from road ditches or plugged
12

culverts that could be diverted down roadways, potentially causing erosion and scour of the road bed.
Naturally occurring asbestos and mercury may be present in the burn area. For state and local guidance, see:http://www.arb.ca.gov/toxics/asbestos/asbestos.htm
http://www.arb.ca.gov/toxics/asbestos/geninfo.htm
http://envhmgmt.calaverasgov.us/AirPollutionControl.aspx
http://pubs.usgs.gov/fs/2005/3014/
RecommendationsIt is recommended that a general public advisory be issued to landowners regarding elevated flooding and debris-laden runoff potential near rivers, streams and hillsides, including evacuation notices as necessary. Additionally, placement of transitional housing on low-lying ground susceptible to flooding and debris flows should be avoided.
Emergency protective measures may include items such as:
Placement of sand bags or K-Rail to protect structures from potential debris flows and/or flooding.
Placing signage on road approaches to bridges that warn of flood risk, closure of at-risk roads or bridges prior to a large storm event.
Road System: Storm patrol of the stormwater drainage system (ditches, culverts, and bridges) should be conducted to ensure proper function. Ditch and culvert cleanouts may be necessary after each storm event, in addition to sediment removal from roadways. Culverts that have not been designed to the 100-year level should be replaced to increase the ability of the drainage facility to handle to probable volumes of storm runoff.
Utilities: Companies with linear facilities/structures, such as PG&E and Calaveras County Water District, may need to consider specific studies to address runoff hazards.This is particularly important in the Mokelumne River watershed where PG&E has numerous hydropower related facilities in the burn area.
Reservoirs: Reservoir operators should anticipate large quantities of ash and sediment to be transported downstream of the Butte Fire, producing high turbidity levels and potentially affecting water chemistry due to ash and sediment loading.
13

Hazardous Trees: Burned and damaged trees may be present adjacent to homes and should be felled to ensure safety of residents and trees from within the right of way should be felled to ensure ingress and egress.
In our review of potential runoff hazards at locations in the burn perimeter, numerous areas were inaccessible due to rugged terrain, locked gates, and locations where signs of illegal activity were present. Therefore, the PFWERT did not evaluate every structure, culvert, bridge or other type of crossing within or downstream of the burn area. Only those areas that appeared at risk to obvious debris flow impact or flooding were noted. The observations documented in this report are intended to be used as a preliminary indication of some of the most obvious areas of potential concern for follow-up work and more detailed evaluations.
X NotificationsIt appears that several agencies control infrastructure that is listed or discussed in this report. It is intended that the information in this report be relayed to all responsible agencies. The SPFWERT does not assume responsibility of relaying this information. It is incumbent on representatives of Calaveras and Amador County Fire Departments to determine who the responsible agencies are and how to notify them. Possibleresponsible agencies may consist of:
CAL FIREEast Bay Municipal Utility DistrictPacific Gas and Electric CompanyCalaveras and Amador County Fire Departments Bureau of Land ManagementCalaveras County Water DistrictAmador and Calaveras County Public Works Cal TransUS Forest ServiceCalOESNatural Resource Conservation Service
Utility companies, and other responsible agencies
The Natural Resources Conservation Service (NRCS) is an agency that can provide funding for emergency watershed restoration. They may be contacted through the following links:http://www.nrcs.usda.gov/wps/portal/nrcs/main/ca/programs/financial/ewp/http://offices.sc.egov.usda.gov/locator/app?service=page/CountyMap&state=CA2&stateName=Southern%20California&stateCode=06
XI Emergency-Response Planning
Following a wildfire, agencies responsible for floodplain management, public safety,
14

and evacuation decisions require both advanced warning of potential storm rainfall and real-time information on storm rainfall distribution. The USGS and the National Oceanic and Atmospheric Administration (NOAA) developed a flash flood and debris flow early warning system in 2005 (USGS, 2005). Using a network of radar and rain gauges along with established rainfall thresholds that are known to trigger flash floods and debris flows, the National Weather Service may issue watches and warnings for areas recently burned by wildfire. In addition, the USGS and NOAA compiled information on the hydrologic conditions and watershed response to winter storms occurring on burned watersheds in southern California (Cannon et al., 2010). Information and methodology critical to this process is provided for by the USGS open file report OF10-1039 that can be accessed at:
http://pubs.usgs.gov/of/2010/1039/pdf/OF10-1039.pdf
XII ReferencesBonnin, G.M., Martin, D., Lin, B., Parzybok, T., Yekta, M., and Riley, D., 2006, Precipitation frequency atlas of the United States: Silver Spring, Md., National Weather Service, National Oceanic and Atmospheric Administration (NOAA) atlas 14, v. 1, version 5, accessed July 30, 2013, at http://hdsc.nws.noaa.gov/hdsc/pfds/.
Cannon, S.H., Boldt, E.M., Kean, J.W., Laber, J.L., and Staley, D.M., 2010, Relations Between Rainfall and Postfire Debris-Flow and Flood Magnitudes for Emergency-Response Planning, San Gabriel Mountains, Southern California: U.S. Geological Survey Open–File Report 2010-1039, 31 pElliott, J.G, Smith, M.E., Friedel, M.J.,
Clark, L.D., Stromquist, A.A., and Tatlock, D.B., 1970, Geologic map of the San Andreas Quadrangle, Calaveras County, California, California Division of Mines and Geology, Bulletin 195, scale 1:62,500.
Elliott, J.G, Smith, M.E., Friedel, M.J., Stevens, M.R., Bossong, C.R., Litke, D.W., Parker, R.S., Costello, C., Wagner, J., Char, S.J., Bauer, M.A. and Wilds, S.R. 2004. Analysis and Mapping of Post fire Hydrologic Hazards for the 2002 Hayman, Coal Seam, and Missionary Ridge Wildfires, Colorado, U.S. Geological Survey Scientific Investigations Report 2004-5300, 104 p.
FEMA (Federal Emergency Management Agency), 2010. Flood insurance study, Calaveras County, California, and incorporated areas, Study No. 06009CV000A, 37 p. + plates.
Flood Insurance Study, Calaveras County, California and Unincorporated Areas, dated December 2010.
15
Jennings, C.W., Bryant, W.A., and Saucedo, G., 2010, Fault activity map of California, California Geological Survey, California Geologic Data Map Series, Map No. 6, scale 1:750,000.
Larsen, I.J, MacDonald, L.H., Brown, E., Rough, D., Welsh, M.J., Pietraszek, J.H., Libohova, Z., Benavides-Solorio, J., Schaffrath, K. 2009. Causes of Post fire Runoff and Erosion: Water Repellency, Cover, or Soil Sealing?. Soil Science Society of American Journal 73, 1393-1407.
Parson, Annette; Robichaud, Peter R.; Lewis, Sarah A.; Napper, Carolyn; Clark, Jess T. 2010. Field guide for mapping post fire soil burn severity. Gen. Tech. Rep. RMRS-GTR-243. Fort Collins, CO: U.S. Department of Agriculture, Forest Service, Rocky Mountain Research Station. 49 p
Renschler, C. S., 2003, Designing geo-spatial interfaces to scale process models: the GeoWEPP approach. Hydrological Processes, 17(5), 1005-1017.
Robichaud, P.R., Ashmun, L.E., Sims, B.D., 2010. Post fire treatment effectiveness for hillslope stabilization. U.S. Forest Service, Rocky Mountain Research Station, RMRS-GTR-240, 72 p.
Staley, D.M., Gartner, J.E., Smoczyk, G.M., and Reeves, R.R., 2013b, Emergency Assessment of Post fire Debris-Flow Hazards for the 2013 Mountain Fire, Southern California: U.S. Geological Survey Open-File Report 2013–1249, 13 p., 3 plates.
Stevens, M.R., Bossong, C.R., Litke, D.W., Parker, R.S., Costello, C., Wagner, J., Char, S.J., Bauer, M.A. and Wilds, S.R. 2004. Analysis and Mapping of Post fire Hydrologic Hazards for the 2002 Hayman, Coal Seam, and Missionary Ridge Wildfires, Colorado, U.S. Geological Survey Scientific Investigations Report 2004-5300, 104 p.
USGS, 2005b, NOAA-USGS Demonstration Flash-Flood and Debris-Flow Early-Warning System, Fact Sheet 2005-3104, 2p
Wagner, D.L., Jennings, C.W., Bedrossian, T.L., and Bortugno, E.J., 1981, Geologic map of the Sacramento Quadrangle: California Division of Mines and Geology Regional Geologic Map Series, Map 1A, scale 1:250,000.
XIII. AppendicesA. MapsB. Photos
16

Slope Map
17

120°30'W
120°30'W
120°35'W
120°35'W
120°40'W
120°40'W
38°2
0'N
38°2
0'N
38°1
5'N
38°1
5'N
38°1
0'N
38°1
0'N
Daniel Dresselhaus10/9/2015 @ 12:57:48 PMNAD 83
Butte Fire Perimeter
PFWERTGeologic Map
Butte Fire
0 1 20.5
Miles ²Figure 2
18

ST49
ST26
ST12
ST88
SanSanAndreasAndreas
MokelumneMokelumneHillHill
GlencoeGlencoe
RailRailRoadRoadFlatFlat
MountainMountainRanchRanch
WilseyvilleWilseyville
120°30'W
120°30'W
120°35'W
120°35'W
120°40'W
120°40'W
38°2
0'N
38°2
0'N
38°1
5'N
38°1
5'N
38°1
0'N
38°1
0'N
Daniel Dresselhaus10/9/2015 @ 12:38:35 PMNAD 83
PFWERTSoil Burn Severity Map
Butte Fire0 1 20.5
Miles ²Figure 3
Burn Severity Unburned
Low
Moderate
High
Butte Fire Perimeter 19

kk
kk
kk
kk
kk
kk
kk
kk kk
kkkkkk
kkkk
kk
kkkkkk kk
kk
kkkk
kk
kk
kk
kk
Figure 4a
Angels Camp
SanAndreas
Jackson
Map 15678
101112151621
Map 213
1722
Map 39
18202324
Map 4141925
Map 526
Page 624
13
Figure 4bFigure 4c
Figure 4d
Figure 4eFigure 4f
ST104
ST49
ST88
ST4
ST26
ST12
Daniel Dresselhaus10/9/2015 @ 11:55:33 AMNAD 83
kk Site
Butte Fire Perimeter
PFWERT
Index Page
USGS Debris FlowHazard Map
0 2 41
Miles ²
Figure 420

kk
kk
kk
kk
kkkk
kkkk
kk
kk
10
5
1121
126
7 8
1516
120°38'W
120°38'W
120°39'W
120°39'W
120°40'W
120°40'W
38°1
9'N
38°1
9'N
38°1
8'N
38°1
8'N
38°1
7'N
38°1
7'N
Daniel Dresselhaus10/9/2015 @ 11:49:31 AMNAD 83
PFWERTUSGS Debris Flow
Hazard Map
0 1,000 2,000500
Feet ²
kk Site
Basin HazardLow
Moderate
Segment HazardLow
Moderate
Combined Hazard (25yr)
Figure 4a21

kk
kk
kk
kk
1
17
22
3
120°34'W
120°34'W
120°35'W
120°35'W
120°36'W
120°36'W
38°1
6'N
38°1
6'N
38°1
5'N
38°1
5'N
38°1
4'N
38°1
4'N
Daniel Dresselhaus10/9/2015 @ 11:49:36 AMNAD 83
PFWERTUSGS Debris Flow
Hazard Map
0 1,000 2,000500
Feet ²
kk Site
Basin HazardLow
Moderate
Segment HazardLow
Moderate
Combined Hazard (25yr)
Figure 4b22
kk
kk
kk
kk
kk
20
2324
9
18
120°30'W
120°30'W
120°31'W
120°31'W
120°32'W
120°32'W
38°1
7'N
38°1
7'N
38°1
6'N
38°1
6'N
38°1
5'N
38°1
5'N
Daniel Dresselhaus10/9/2015 @ 11:49:42 AMNAD 83
PFWERTUSGS Debris Flow
Hazard Map
0 1,000 2,000500
Feet ²
kk Site
Basin HazardLow
Moderate
Segment HazardLow
Moderate
Combined Hazard (25yr)
Figure 4c23

kk
kk
kk
19
14
25
120°29'W
120°29'W
120°30'W
120°30'W
120°31'W
120°31'W
120°32'W
120°32'W
38°1
3'N
38°1
3'N
38°1
2'N
38°1
2'N
38°1
1'N
38°1
1'N
Daniel Dresselhaus10/9/2015 @ 11:49:48 AMNAD 83
PFWERTUSGS Debris Flow
Hazard Map
0 1,000 2,000500
Feet ²
kk Site
Basin HazardLow
Moderate
Segment HazardLow
Moderate
Combined Hazard (25yr)
Figure 4d24

kk26
120°32'W
120°32'W
120°33'W
120°33'W
120°34'W
120°34'W
38°1
1'N
38°1
1'N
38°1
0'N
38°1
0'N
38°9
'N
38°9
'N
Daniel Dresselhaus10/9/2015 @ 11:49:53 AMNAD 83
PFWERTUSGS Debris Flow
Hazard Map
0 1,000 2,000500
Feet ²
kk Site
Basin HazardLow
Moderate
Segment HazardLow
Moderate
Combined Hazard (25yr)
Figure 4e25

kk
kk
kk
2
13
4
120°37'W
120°37'W
120°38'W
120°38'W
120°39'W
120°39'W
38°1
2'N
38°1
2'N
38°1
1'N
38°1
1'N
38°1
0'N
38°1
0'N
Daniel Dresselhaus10/9/2015 @ 11:49:59 AMNAD 83
PFWERTUSGS Debris Flow
Hazard Map
0 1,000 2,000500
Feet ²
kk Site
Basin HazardLow
Moderate
Segment HazardLow
Moderate
Combined Hazard (25yr)
Figure 4f26

ST49
ST49
ST49
ST26
ST12
ST88
SanSanAndreasAndreas
MokelumneMokelumneHillHill
GlencoeGlencoe
RailRailRoadRoadFlatFlat
MountainMountainRanchRanch
WilseyvilleWilseyville
120°30'W
120°30'W
120°35'W
120°35'W
120°40'W
120°40'W
38°2
0'N
38°2
0'N
38°1
5'N
38°1
5'N
38°1
0'N
38°1
0'N
Daniel Dresselhaus10/9/2015 @ 11:37:26 AMNAD 83
Basin Probability0-20%
20-40%40-60%
60-80%
PFWERTUSGS Probability Model Results
(25 year rainfall event)Butte Fire
0 1 20.5
Miles ²http://landslides.usgs.gov/hazards/postfire_debrisflow/2015/20150909butte/
Segment Probability0-20%
20-40%40-60%
60-80%
Basin Outlet Figure 5Butte Fire Perimeter27

28
ST49
ST49
ST49
ST26
ST12
ST88
SanSanAndreasAndreas
MokelumneMokelumneHillHill
GlencoeGlencoe
RailRailRoadRoadFlatFlat
MountainMountainRanchRanch
WilseyvilleWilseyville
120°30'W
120°30'W
120°35'W
120°35'W
120°40'W
120°40'W
38°2
0'N
38°2
0'N
38°1
5'N
38°1
5'N
38°1
0'N
38°1
0'N
Daniel Dresselhaus10/9/2015 @ 11:30:34 AMNAD 83
Basin Volume<1,000
1,000-10,00010,000-100,000
PFWERTUSGS Volume Model Results
(25 year rainfall event)Butte Fire
0 1 20.5
Miles ²http://landslides.usgs.gov/hazards/postfire_debrisflow/2015/20150909butte/
Segment Volume<1,000
1,000-10,00010,000-100,000
Basin OutletFigure 6
Butte Fire Perimeter29

Poss
ible
U
SGS
FEM
APr
elim
inar
y or
Pos
sibl
e Si
te N
umbe
rSt
reet
Latit
ude
Long
itude
Haza
rdPo
stRe
spon
sibl
e Ag
ency
Basi
n ID
FIRM
Pan
elEm
erge
ncy
Prot
ectiv
e M
easu
res
1W
. Mur
ray
Cree
k Rd
.38
° 13.
713'
N12
0° 3
4.48
2' W
Debr
is Fl
ow &
Flo
odin
g,
Resid
ence
(bur
ned)
High
Land
owne
r48
6806
009C
0425
ETr
ansit
iona
l hou
sing
be p
lace
d in
diff
eren
t loc
atio
n
2M
urra
y Da
le L
ane
38° 1
2.26
0' N
120°
38.
578'
WDe
bris
Flow
& F
lood
ing,
24-
inch
Cu
lver
t (CM
P)Hi
ghLa
ndow
ner
0600
9C04
00E
Clea
n de
bris
from
the
culv
ert.
Plac
e ro
ws o
f t-p
osts
in th
e dr
aina
ge u
pstr
eam
of t
he c
ulve
rt to
serv
e as
tras
h ra
cks.
If
signi
fican
t rai
nfal
l is a
ntic
ipat
ed th
e do
wns
trea
m re
siden
ce
shou
ld b
e ev
acua
ted.
3Sa
lam
ande
r Gul
ch R
oad,
nor
th o
f W
. Mur
ray
Ck R
d.38
° 14.
167'
N12
0° 3
5.17
8' W
Debr
is Fl
ow &
Flo
odin
g, C
ampe
r tr
aile
rHi
ghLa
ndow
ner
3858
0600
9C04
25E
Mov
e th
e tr
aile
r to
high
er g
roun
d, o
ut o
f the
floo
dpla
in o
f Sa
lam
ande
r Gul
ch.
4M
urra
y Da
le L
ane
38° 1
2.24
4' N
120°
38.
589'
WDe
bris
Flow
& F
lood
ing,
Re
siden
ceHi
ghLa
ndow
ner
0600
9C04
00E
Evac
uate
hom
e if
a sig
nific
ant r
ainf
all e
vent
is e
xpec
ted.
5Je
sus M
aria
Roa
d, e
ast o
f Haw
ver
Road
38° 1
7.03
5' N
120°
39.
226'
WFl
oodi
ng &
Deb
ris F
low
, Jes
us
Mar
ia R
oad
High
Coun
ty06
009C
0225
ESt
orm
Pat
rol
6Ha
wve
r Roa
d cr
ossin
g of
NF
Cala
vera
s Riv
er38
° 16.
918'
N12
0° 4
0.19
8' W
Floo
ding
& D
ebris
Flo
w, 6
- 48
-in
ch C
ulve
rts (
CMP)
Mod
erat
eCo
unty
2429
0600
9C02
25E
Clos
e ro
ad d
urin
g an
ticip
ated
hig
h in
tens
ity ra
infa
ll ev
ent.
In
stal
l sta
ge re
cord
er to
mon
itor w
ater
leve
ls in
the
river
.
7Hi
ghw
ay 2
638
° 19.
060'
N12
0° 3
9.17
4' W
Debr
is Fl
ow &
Flo
odin
g,
Resid
ence
High
Land
owne
r14
7906
009C
0225
E
Plac
e K-
Rail
on e
ach
side
of th
e ho
use,
par
ticul
arly
in th
e ea
ster
n dr
aw, t
o di
vert
deb
ris fl
ows a
way
from
the
hous
e.
Evac
uate
the
hous
e in
adv
ance
of a
ntic
ipat
ed h
igh
inte
nsity
ra
in fa
ll ev
ent.
8Hi
ghw
ay 2
638
° 19.
069'
N12
0° 3
9.15
1' W
Floo
ding
& D
ebris
Flo
w, 1
8-in
ch
Culv
ert
High
Coun
ty14
7906
009C
0225
EU
se ro
ws o
f t-p
osts
to c
onst
ruct
tras
h ra
cks u
pstr
eam
of t
he
culv
ert.
Mon
itor r
oad
durin
g fir
st si
zeab
le ra
in e
vent
.
9Ce
dar S
prin
gs R
oad
38° 1
5.78
3' N
120°
31.
907'
WFl
oodi
ng &
Deb
ris F
low
, Re
siden
ce (b
urne
d)M
oder
ate
Land
owne
r33
4706
009C
0250
EGe
nera
l not
ifica
tion
of h
azar
d re
gard
ing
elev
ated
pos
t-fire
flo
od ri
sk.
10Je
sus M
aria
Roa
d, n
orth
of H
awve
r Ro
ad38
° 17.
190'
N12
0° 4
0.23
6' W
Debr
is Fl
ow &
Flo
odin
g, C
ulve
rt
Mod
erat
eCo
unty
2429
0600
9C02
25E
Clea
n de
bris
out o
f roa
dsid
e di
tch.
Pla
ce ro
ws o
f t-p
osts
at
seve
ral l
ocat
ions
ups
trea
m o
f cul
vert
to se
rve
as tr
ash
rack
s.
Mon
itor t
he si
te a
fter
rain
eve
nts.
11Je
sus M
aria
Roa
d cr
ossi
ng N
F Ca
lave
ras R
iver
38° 1
7.24
0' N
120°
39.
611'
WFl
oodi
ng &
Deb
ris F
low
, Ro
adw
ay &
Brid
geM
oder
ate
Coun
ty06
009C
0225
E
Rem
ove
inst
ream
veg
etat
ion
30 fe
et u
pstr
eam
of b
ridge
, un
der b
ridge
, and
60
feet
dow
nstr
eam
of b
ridge
. M
onito
r th
e ro
adw
ay n
orth
and
wes
t of t
he b
ridge
dur
ing
antic
ipat
ed
high
inte
nsity
rain
fall
even
ts.
12Ha
wve
r Roa
d, 1
00' s
outh
of J
esus
M
aria
Roa
d38
° 16.
958'
N12
0° 4
0.18
8' W
Debr
is Fl
ow &
Flo
odin
g, 3
0-in
ch
Flat
tene
d Cu
lver
tM
oder
ate
Coun
ty24
2906
009C
0225
E
Durin
g th
e fir
st w
inte
r use
K-R
ail o
r san
dbag
s to
prev
ent
wat
er a
nd d
ebris
del
iver
ed b
y th
e Je
sus M
aria
Roa
d ro
adsid
e di
tch
from
flow
ing
acro
ss H
awve
r Roa
d.
13Co
sta
Road
at C
alav
erita
s Cre
ek38
° 9.4
34' N
120°
36.
763'
WFl
oodi
ng &
Deb
ris F
low
, Low
w
ater
ford
Low
Coun
ty06
009C
0425
ECl
ose
the
road
if a
larg
e st
orm
eve
nt is
fore
cast
.
14Ca
ve C
ity R
oad
at O
'Nei
l Cre
ek
38° 1
1.63
4' N
120°
30.
222'
WFl
oodi
ng &
Deb
ris F
low
, Brid
geM
oder
ate
Coun
ty60
6206
009C
0425
E
Fill
the
void
beh
ind
the
win
g w
all w
ith 1
2” –
18”
rock
ex
tend
ing
dow
n to
the
slope
toe
to p
rote
ct b
ridge
. Add
sig
nage
stat
ing
that
road
is c
lose
d w
hen
flood
ed.
15Je
sus M
aria
Roa
d38
° 17.
073'
N12
0° 4
0.22
5' W
Debr
is Fl
ow &
Flo
odin
g, B
ridge
(D
estr
oyed
by
Fire
)M
oder
ate
Land
owne
r24
2906
009C
0225
E
Rem
ove
inst
ream
veg
etat
ion
30 fe
et u
pstr
eam
of b
ridge
, un
der b
ridge
, and
60
feet
dow
nstr
eam
of b
ridge
. M
onito
r th
e ro
adw
ay n
orth
and
wes
t of t
he b
ridge
dur
ing
antic
ipat
ed
high
inte
nsity
rain
fall
even
ts.
16Je
sus M
aria
Roa
d, n
orth
of H
awve
r Ro
ad38
° 17.
174'
N12
0° 4
0.23
1' W
Debr
is Fl
ow &
Flo
odin
g, 1
8-in
ch
Culv
ert (
CMP)
Mod
erat
eCo
unty
2429
0600
9C02
25E
Plac
e ro
ws o
f t-p
osts
at s
ever
al lo
catio
ns in
the
drai
nage
ch
anne
l ups
trea
m o
f the
cul
vert
s to
serv
e as
tras
h ra
cks.
M
onito
r the
site
aft
er ra
in e
vent
s.
PREL
IMIN
ARY
DATA
This
is no
t com
preh
ensiv
e an
d is
base
d up
on p
relim
inar
y fie
ld w
ork.
Add
ition
al e
valu
atio
n is
nece
ssar
y to
dev
elop
em
erge
ncy
prot
ectiv
e m
easu
res.
Dim
ensio
ns a
re e
stim
ated
.
Prop
erty
GP
S Lo
catio
n
30

Poss
ible
U
SGS
FEM
APr
elim
inar
y or
Pos
sibl
e Si
te N
umbe
rSt
reet
Latit
ude
Long
itude
Haza
rdPo
stRe
spon
sibl
e Ag
ency
Basi
n ID
FIRM
Pan
elEm
erge
ncy
Prot
ectiv
e M
easu
res
17W
hisk
ey S
lide
Road
38° 1
5.50
0' N
120°
34.
690'
WFl
oodi
ng &
Deb
ris F
low
, Re
siden
ceM
oder
ate
Land
owne
r06
009C
0250
E
Prov
ide
sand
bag
s to
hom
eow
ner f
or fl
ood
prot
ectio
n an
d re
mov
e w
oody
deb
ris u
pstr
eam
of b
ridge
to m
aint
ain
flow
co
nvey
ance
thro
ugh
the
brid
ge o
peni
ng.
18Ce
dar S
prin
gs R
oad
38° 1
6.01
5' N
120°
31.
066'
WDe
bris
Flow
& F
lood
ing,
Re
siden
ce (b
urne
d)M
oder
ate
Land
owne
r31
1306
009C
0250
EIf
tran
sitio
nal h
ousin
g is
used
, pro
vide
sand
bag
s to
hom
eow
ner f
or fl
ood
prot
ectio
n fr
om sm
all d
rain
age.
19Ca
ve C
ity R
oad
38° 1
2.19
7' N
120°
30.
519'
WDe
bris
Flow
& F
lood
ing,
O
utbu
ildin
gs &
Par
king
Lot
Low
Land
owne
r57
7806
009C
0425
EM
onito
r site
dur
ing
antic
ipat
ed h
igh
inte
nsity
rain
fall
even
t.
Clos
e lo
wer
par
king
lot a
nd tr
ail t
o ca
ve e
ntra
nce
20O
ld E
mig
rant
Tra
il (w
est o
f Ha
ngm
ans T
ree
Rd.)
38° 1
6.21
4' N
120°
31.
291'
WDe
bris
Flow
& F
lood
ing,
60-
inch
cu
lver
t (CM
P)Lo
wLa
ndow
ner
3110
0600
9C02
50E
Add
12 –
18”
rock
at b
ase
of c
ulve
rt o
utle
t and
alo
ng sl
ope
toe
to st
abili
ze ro
ad fi
ll.
21Je
sus M
aria
Roa
d38
° 17.
126'
N12
0° 3
8.75
6' W
Debr
is Fl
ow &
Flo
odin
g, 4
8-in
ch
Culv
ert (
CMP)
Low
Coun
ty28
2306
009C
0225
EIn
stal
l row
s of t
-pos
ts u
pstr
eam
of c
ulve
rt to
serv
e as
tras
h ra
cks
22W
hisk
ey S
lide
Road
cro
ssin
g W
et
Gul
ch38
° 16.
466'
N12
0° 3
5.50
8' W
Floo
ding
& D
ebris
Flo
w, B
ox
Culv
ert (
11'W
x 5
'H)
Low
Coun
ty28
2306
009C
0250
EM
onito
r site
afte
r hig
h flo
w e
vent
s
23Ce
dar S
prin
gs R
oad
(no
hous
e #
foun
d)38
° 15.
818'
N12
0° 3
1.45
5' W
Debr
is Fl
ow &
Flo
odin
g,
Resid
ence
(bur
ned)
Low
Land
owne
r32
9206
009C
0250
E
If tr
ansit
iona
l hou
sing
is pl
aced
her
e, th
en sa
nd b
ags o
r a k
-ra
il ar
e re
com
men
ded
to d
iver
t deb
ris fl
ows a
way
from
ho
usin
g.
24Ac
cess
from
Ced
ar S
prin
gs R
oad
38° 1
5.88
5' N
120°
31.
400'
WFl
oodi
ng &
Deb
ris F
low
, M
ariju
ana
Culti
vatio
n Si
teLo
wLa
ndow
ner
3130
0600
9C02
50E
Gene
ral n
otifi
catio
n of
haz
ard
to C
ount
y re
gard
ing
elev
ated
po
st-fi
re fl
ood
risk.
25Ca
ve C
ity R
oad
at M
artin
Gul
ch (C
A Ca
vern
s)38
° 12.
105'
N12
0° 3
0.52
1' W
Floo
ding
& D
ebris
Flo
w, B
ridge
Lo
wCo
unty
5735
0600
9C04
25E
Plac
e flo
od h
azar
d sig
nage
on
road
if a
larg
e st
orm
eve
nt is
fo
reca
st. C
lose
the
road
if th
e br
idge
is o
vert
oppe
d.
26Po
nder
osa
Way
at C
alav
erita
s Crk
38
° 10.
187'
N12
0° 3
3.33
2' W
Floo
ding
& D
ebris
Flo
w,
Resid
ence
Low
Land
owne
r66
7506
009C
0425
EPr
ovid
e sa
nd b
ags t
o ho
meo
wne
r for
floo
d pr
otec
tion
PREL
IMIN
ARY
DATA
This
is no
t com
preh
ensiv
e an
d is
base
d up
on p
relim
inar
y fie
ld w
ork.
Add
ition
al e
valu
atio
n is
nece
ssar
y to
dev
elop
em
erge
ncy
prot
ectiv
e m
easu
res.
Dim
ensio
ns a
re e
stim
ated
.
GPS
Loca
tion
Prop
erty
31

View southwest over the burned watersheds of Jesus Maria Creek, North Fork Calaveras River. In the foreground, manzanita was denuded by the fire and organic litter and duff exhibited high soil burn severity (ash and soil are moist from recent rainfall).
Residence in the drainage path of a small basin tributary to Murray Creek. The upstream side of the culvert is approximately half filled with sediment, the downstream side is buried in artificial fill. The basin upstream of the culvert experienced moderate-to-high soil burn severity.
24 32
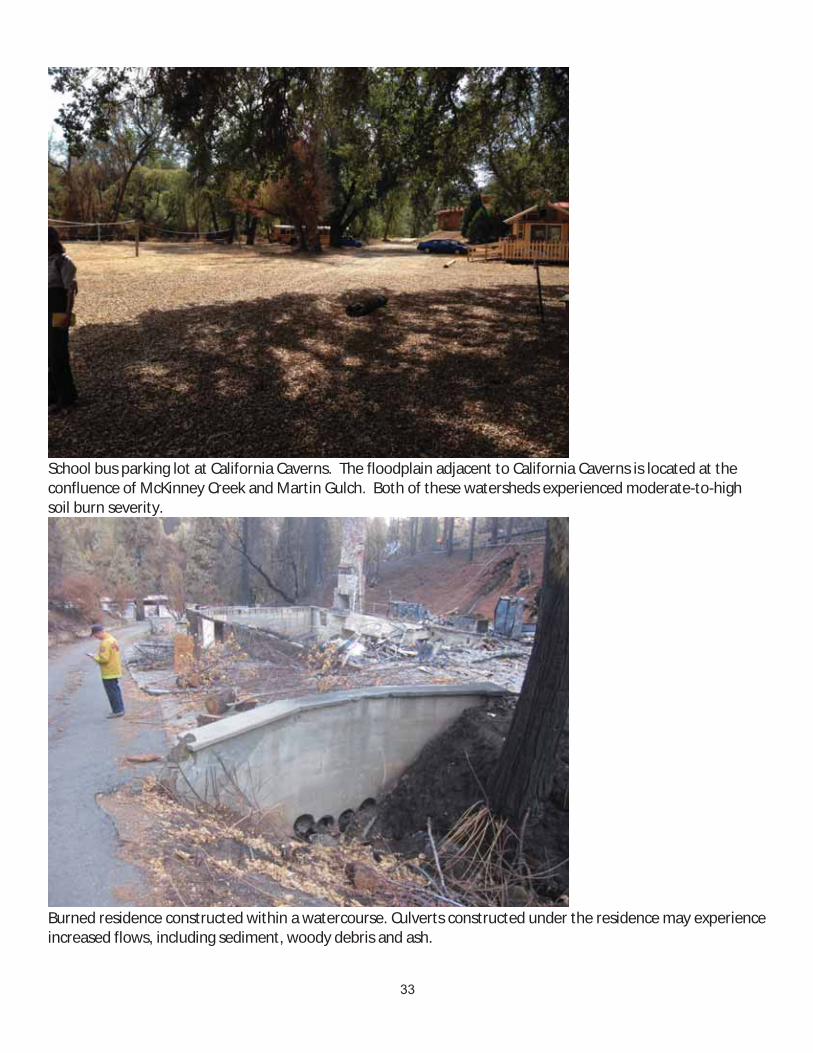
School bus parking lot at California Caverns. The floodplain adjacent to California Caverns is located at the confluence of McKinney Creek and Martin Gulch. Both of these watersheds experienced moderate-to-high soil burn severity.
Burned residence constructed within a watercourse. Culverts constructed under the residence may experience increased flows, including sediment, woody debris and ash.
25 33

View southeast over the burned watersheds of O’Niel Creek and San Antonio Creek, South Fork Calaveras River. In the foreground, a relatively dense stand of manzanita was denuded by the fire and organic litter and duff exhibited high soil burn severity (ash and soil are moist from recent rainfall).
26 34