Busiu n nese ss PPlla n - MIT Crime Clubmitcrimeclub.org/Tornero_Business_Plan-abr.pdf ·...
17
Business Plan FALL-WINTER 2011 Moreno Buehler Theodora Koullias Arthur Rogers David Rosenman
-
Upload
nguyenhanh -
Category
Documents
-
view
214 -
download
0
Transcript of Busiu n nese ss PPlla n - MIT Crime Clubmitcrimeclub.org/Tornero_Business_Plan-abr.pdf ·...

Buusinneesss PPllann
FALL-WINTER 2011
Moreno Buehler Theodora Koullias Arthur Rogers David Rosenman

Tornero™ Proprietary and Confidential Page 4
1. Executive Summary SUMMARY
Americans, on average, have more portable electronic devices than ever. Though loss and theft are common, recovery rates are limited, not because these items are not found, but because they have no identifying information on them and are more often than not password protected. The business traveler who inadvertently leaves his or her laptop computer on an airport terminal seat relies on someone turning in that item to the airport’s “Lost and Found.” Studies show that a valuable new electronic item is more likely to become the finder’s ‘gift to himself’ if it is devoid of identifiable contact information. Even if the unmarked laptop is turned in to a security agent or to the Lost and Found, ultimate return to the original owner depends heavily on his or her inquiry of the valuable, the timing of that inquiry, and again, upon the honesty of each person who touches it along the way. Experiments with lost items that have been clearly marked with contact information resulted in recovery rates of 75% or more.
1 Tornero™ labels
offer a unique and intuitive solution to greatly increase an owner’s chances of reuniting with his or her lost property. BACKGROUND
Extraordinary growth in the mobile electronics industry has led to the ubiquity of cell phones, laptop and tablet computers, cameras, and digital music players among other such devices. In the case of mobile telephones alone, the number of subscriptions worldwide increased over the last decade from 12.4 million to almost 5 billion.
2 While many of these subscriptions are within developing economies and have
reached the so-called “bottom of the economic pyramid,” it is not uncommon for business travelers and tech-savvy young adults in the western world to each have several portable electronic devices (for example, a smart phone, an iPod, a laptop and/or an iPad).
3 A remarkable number of these devices are
lost or stolen. As many of 77% of American adults say that they have lost a mobile phone and 23% report having had theirs stolen.
4 Despite such alarming rates of loss and theft, fewer than 5% of surveyed airport
travelers have any identifying information on the exterior of their mobile electronic hardware5. Not
surprisingly therefore, though three out of four lost items are found, most of them are never recovered by their original owners. PRODUCT
Our solution is a strongly adhering label with both a unique serial ID number, which can be registered by the owner at our website, and a space to provide additional contact information. A third path to recovery which will incorporate near field communication (NFC) tags will be available in future releases of the label. Our solution offers benefits rooted both in superior capability and position. Regarding capability, it is the most durable and technologically advanced property label available. Our labels withstand high temperature ranges (-40° F up to 302° F), and are water, UV, abrasion, oil, chemical, and solvent resistant, unlike competitor labels. Neither the NFC locating technology nor the high-performance permanent acrylic adhesive technologies are available in any other property label. Tornero™ is the only player in the property label market to offer online personalized design option for our other design-conscious target market. Comparable customization in other sectors has been very successful.
6
BUSINESS MODEL
Our business model is based on retail sale of standard labels for $4.99 and online sale of personalized labels for $6.99. For standard labels, $0.40 will go to variable costs, including manufacturing and distribution, while customizable labels will have variable costs of $0.60 for the first year. Net revenue for the first year will be $4.59 per standard label sold in retail stores and $6.39 for customizable labels sold online.
Tornero™ label offer a clear sustainable competitive advantage. The unique selling proposition is a

product that offers the customer three ways in which he or she can reunite with his or her valuables. Tornero™ will attempt to obtain exclusive rights to the adhesive and NFC technology combination at least through 2019. Our communication with managers and purchasing agents for Hudson News at Boston Logan and JFK International Airports also suggests that Tornero™ will be able to secure an exclusive agreement with Hudson, whose inventories presently include luggage tags, but not comparable adhesive property labels. TARGET CUSTOMERS AND MARKET
Tornero™ Proprietary and Confidential Page 7
FOUNDING TEAM
The Founding Team is comprised of four previously successful entrepreneurs and is well qualified to see this company succeed. They each have worked in a variety of team environments and already share a track record of successful collaboration. THEODORA KOULLIAS, Founding CEO SB ’12-’13 Ms. Koullias is a successful entrepreneur and is completing her studies at MIT in Management Science and Economics. In addition, she is responsible for all the graphics in this business plan, from the labels to the cartoons. MORENO BUEHLER, Founding CFO MIT Sloan Fellow, MBA ’12, MA Mr. Buehler headed portfolio management for a Swiss firm prior to his studies at MIT. He specializes in Finance and Accounting. ARTHUR ROGERS, Founding Director of Marketing MIT Sloan Fellow, MBA ’12, MA, MPH Mr. Rogers is a successful entrepreneur and has served as Special Forces, Intelligence, and Reconnaissance Operator in the US Army. DAVID ROSENMAN, Founding Director of Strategy MIT Sloan Fellow, MBA ’12, MD, MA, MSc Dr. Rosenman has been involved in three successful start-up ventures and led the collaborative creation of several innovation-related enterprises at the Mayo Clinic in Rochester, Minnesota.

Tornero™ Proprietary and Confidential Page 8
ADVISORY BOARD
JAMES HERMS MtE ’87, Course IIICambridge, [email protected] M: 617-835-2922 CC&A (Crime Club & Assocs.), 2007– General Partner PO Box 397152, MIT Sta. Cambridge, MA 02139 Sensodyne Group, Block Drug Co., 1990–1998 Senior Scientist
○ James Herms & Gregory Dodd, Oral Care Formulation for Treatment of Sensitive Teeth, US Patent No. 6,241,972 (“When applied to the surface of a sensitive tooth by brushing or rinsing, thecopolymers [fill up] the dentinal tubules and seal them off.”)
Cambridge Chronicle, 2006–2007
Police Log Compiler for MIT & Harvard
○ Dawn Witlin & James Herms, Crime Watch, March 12–March 19, Cambridge Chron., Mar. 22, 2007,at 6, http://www.wickedlocal.com/cambridge/archive/x1640211239
○ Emily Anthes, Harvard Police Update Crime Log Data, Bos. Globe, July 20, 2004, at B3, http://mitcrimeclub.org/66792923.html
Inventor, 1989–
Granted 6 US patents
○ Patent Database Search Results (IN/"Herms, James" in US Patent Collect’n), http://patft.uspto.gov/netacgi/nph-Parser?Sect1=PTO2&p=1&u=%2Fnetahtml%2FPTO%2Fsearch-bool.html&r=0&f=S&l=50&TERM1=Herms+James&FIELD1=INNM&d=PTXT
SIMON VALENTIN Billerica, MA City of Cambridge Police Department, 1997–
School Resource Officer ○ Larry Burke Community Services Award, 2011
- Police Units: /ƻƳƳdzƴƛǘȅ Services Unit, City of Cambridge, http://www.cambridgema.gov/cpd/policeunits/operationsdivision/communityservicesunit.aspx
- City Council Res. 49 of Apr. 25, 2011, http://www2.cambridgema.gov/cityClerk/SearchResults.cfm?curPage=15&searchType=keyword
Property Recovery Service Project Author
○ Draft completed Jan. 11, 2011, http://mitcrimeclub.org/propertyrecovery.doc

Tornero™ Proprietary and Confidential Page 9
ROBERT MARSHALL Harvard GP ’78, GSAS Cambridge, MA [email protected]
M: 857-247-8560 City of Cambridge Police Department
Inspector, 1991–2007 Commissioner’s Advisory Board, 1991–1995 Auxiliary Police Officer & Photographer, 2007–2010 Cambridge Auxiliary Police Service Award, 2008
○ Police Department News Detail, City of Cambridge, May 6, 2008, http://www2.cambridgema.gov/deptann.cfm?story_id=1689
○ Cambridge Aux. Police & Cambridge Emergency Commc’ns, Cambridge Aux. Police Award 2008,http://mitcrimeclub.org/08capsa.pdf
City of Cambridge, 1978–1989Constable Inventor, 1974–1992
Granted 3 US patents ○ Robert Marshall, Filtration of Tobacco Using Electrically Neutral Hydrophobic Particles, US Patent
No. 5,115,824 (filed 1990) (“Hydrophobic particles containing polar groups on their surfaces are incorporated into a tobacco smoking article to remove deleterious chemical compounds ... from thetobacco smoke.”), http://patft1.uspto.gov/netacgi/nph-Parser?Sect1=PTO1&d=PALL&p=1&u=%2Fnetahtml%2FPTO%2Fsrchnum.htm&r=1&f=G&l=50&s1=5115824.PN.&OS=

Tornero™ Proprietary and Confidential Page 10
2. Market Analysis BACKGROUND
In the U.S. alone, most of the billions of dollars of consumer goods—each with a unique serial number—if stolen, have no chance of ever being reunited with their owners. This problem stems from having no perfect way of identifying the owner of the property. According to the FBI’s Crime in the U.S. report, in 2010, $9.3 billion of property (primarily jewelry, currency, televisions, radios, stereos, and “office equipment” such as computers) was reported stolen and only 6% by value of the reported stolen property was recovered.
10
The most frequently used method for connecting lost or stolen items with their respective owners is via serial number. The idea behind assigning a unique serial number to an individual product is, in part, that the code may be used as a deterrent against theft, since serial numbers can be recorded and, at least ideally, stolen goods can be identified and returned to their owners based on this unique number. Yet in an age of unprecedented manufacturing and serial number generation, present mechanisms for reconnecting stolen property with original owners are surprisingly ineffective.
This is due in large part to having missed the “matching opportunity” between the individual owner and the serial number of the item at the point of sale. In other words, if a customer had the chance to establish in an official and secure record that “this particular item belongs to *me+,” any subsequent loss and recovery could be followed by the item’s return to that individual who purchased it.
The difficulty with establishing a “matching opportunity” at the point of sale, however, stems from customers lacking the correct motivation to register their valuables with any of the available property recovery services. Rather, motivation to do so stems from an experience the customer has had that is equivalent or nearly equivalent to losing an item of value. Most systems today function with that premise—that the individual will actively register his or her valuables when that individual realizes the need to do so.
The Endowment Effect
According to behavioral economics, people “tend to value a good or service more once their property right to it has been established.”
11 Thus, this phenomenon known as the endowment effect (described by
Richard Thaler in 1980), can explain why a person who has lost his or her property is willing to (1) register his or her property with a property recovery service; and (2) thereby pay to re-obtain the lost property.
In 2005, Huck et. al explained the endowment effect by comparing it to evolutionary examples. The authors modeled a world with only x- and y-goods and argued that despite an individual’s fitness depending directly on consumption of those two goods—“with more balanced diets yielding higher fitness”—individuals’ utilities would inevitably cause them to prefer the goods with which they have been endowed. The presence of the endowment effect thus “distorts the marginal rate of substitution at which a person is willing to trade away from the ‘objective’ marginal rate of substation given by the fitness function.”
12
The premise of our business model lies precisely on this idea—that even though individuals can opt to buy new valuables to replace the lost or stolen ones, individuals would rather opt to regain the original valuables—assuming all else equal and that the items are of equal value, quality, etc. The authors of the study concluded that individuals tend to develop an endowment effect because “individuals with an endowment effect end up with more resources and therefore higher fitness.”
13 In the case of an individual
losing his or her smart phone or laptop, the loss of information on those devices is sometimes more valuable than the cost of acquisition for a replacement item. Until 2008, for example, the FBI would lose three to four laptops a month to theft, according to the agency’s National Crime Information Center, which also found that laptops are the most “sought-after devices by thieves.” Such a loss for the investigative body in charge of protecting American security is mind-boggling, and certainly in a case of

national security the value of the loss of such information contained on those laptops would outweigh the value of a replacement laptop.
14
Air Travel and Property Loss

Tornero™ Proprietary and Confidential Page 16
3. Competition and Competitive Advantage CURRENT SOLUTIONS
Currently, three types of solutions exist for property recovery, specifically for tech devices.
STOP Plates STOP stands for “Security Tracking of Office Property.” STOP is used by the MIT Police at a cost of $10 per label in order to “secure” laptops against theft. STOP’s weaknesses not only include active participation on the part of the owner to have the laptop or valuable registered, but also active participation on the part of the person who ends up finding or recovering the valuable. This brings into question the infallibility of the system. For example, if finder comes upon a laptop tagged with a STOP label, it may be tempting for the finder to keep it just for that reason, as the STOP plate is meant to deter people from stealing laptops to begin with; unfortunately, STOP does not allow the finder to immediately identify the owner. Hence, even if someone has a laptop with a STOP plate, you cannot be sure it is truly his or hers. STOP works under the pretense that good Samaritans exist and will do the right thing, but unfortunately, STOP does not incentivize people to return a valuable if it is found, especially since there is no personal written information on the tag. Further, the company claims 95% effectiveness in recovering items, yet in a December 2,
, 2011 MIT Police informational bulletin, it was reported that only two laptops were STOP
tagged. 9% get stolen if stop tagged, company claims; interview with stop rep
Lojack Lojack, amongst many other things, includes services for laptops (and compelling reasons as to why you should have theft-prevention software):
More than 2 million laptops are stolen every year, meaning that you have a 1 in 10 chance of becoming a victim of laptop theft. Laptops are not just stolen for their monetary value. Most laptops contain personal documents and important information that can be highly valuable to today's laptop thieves. Having your laptop stolen can cost you more than just the value of your computer; it can also leave you at risk for identity theft or other more serious crimes.19
One of the weaknesses of Lojack is the price point of the software ($59.99 per year) which needs to be downloaded in order for the Lojack to be activated. The website also says that the “a small portion of our technology is embedded into most computers at the factory,” but there are many not computer OEMs have done this. The third weakness relates to the system: your computer will carry out the lock command only if it connects to the internet after it is stolen. If thieves know about this system, they will simply try to avoid areas with Wi-Fi connection. The final obvious weakness is that this system only works for laptops, whereas people tend to care about their other valuables such as phones and bikes, as well. The system also assumes a person will have immediate access to another laptop or computer in order to locate and lock his or her laptop, which is an unreasonable assumption, especially for travelers.
Existing Property Registry Sites JustStolen.net, a site that was compiled along with strong support from various police departments, was until recently, one of the most recognized property registry sites. One weakness of JustStolen.net was that it needed active participation by the owner of the valuable; that is, the owner needed to go online, register his or her valuable, and pay a fee. The most interesting detail of the site was that it was taken down due to a conviction of fraud; that is, the site owner was running a scam website, and as a result, many people had lost their money and their trust in online property registration sites.
A number of other property registration sites still exist, but all of them require that the owner actively register his or her valuable on the site. Existing property label sites are our main competitors, and these sites all target customers in various ways. An analysis of our closest competitors is provided below.

Tornero™ Proprietary and Confidential Page 17
Figu
re 3
. Co
mp
eti
tor
An
alys
is o
f Ex
isti
ng
Pro
pe
rty
Reg
istr
y Si
tes

Tornero™ Proprietary and Confidential Page 31
7. Finance Based on the hiring and investment budges, as well as on the expected revenues in the first year, we are looking to raise $500,000 in a Series A round from a Venture fund (convertible with warrants, or preferred or common stock). Through personal savings as well as from friends and family, the team has already been able to raise $50,000. We are aiming to break even and turn cash flow positive in the first quarter of 2013:
As explained under the Go-To-Market section, we will target selected airports in year one which are expected to generate revenues of $980,000 and grow to $5,440,000 in year 5 (CAGR of 39% and 47% for standard and customized stickers respectively). Under the current pricing and cost assumptions, we are aiming to achieve a net profit margin of 24% by year 5, which includes a very aggressive commission and sales bonus of 50%:
The majority of expenses are due to staffing for management, marketing and sales, as well as operations (including quality assurance and service):
-200'000
-
200'000
400'000
600'000
800'000
1'000'000
1'200'000
1'400'000
Jan12
Feb12
Mrz12
Apr12
Mai12
Jun12
Jul 12 Aug12
Sep12
Okt12
Nov12
Dez12
FY2012
Q113
Q213
Q313
Q413
FY2013
FY2014
FY2015
FY2016
Cumulative cash Net income Net change in cash
0%
5%
10%
15%
20%
25%
30%
-
1'000'000
2'000'000
3'000'000
4'000'000
5'000'000
6'000'000
FY 2012 FY 2013 FY 2014 FY 2015 FY 2016
Total revenue Net income Net change in cash Profit margin %

Tornero™ Proprietary and Confidential Page 32
Salaries for the management team (founding team) are kept at a very low level given the participation through equity (equally distributed among the funding team):
Pricing and COGS assumptions for both standard and customized options are outlined below. The reductions in variable costs per sticker are primarily driven by the standardization of the NFC technology which is expected to significantly decline in price over the next 24 months. Further reductions in variable costs are expected through better purchasing agreements with the 3
rd party supplier as our order volume
increases over time:
-
2
4
6
8
10
12
14
16
18
Jan12
Feb12
Mrz12
Apr12
Mai12
Jun12
Jul 12 Aug12
Sep12
Okt12
Nov12
Dez12
FY2012
Q1 13Q2 13Q3 13Q4 13 FY2013
FY2014
FY2015
FY2016
Management Marketing and sales Operations Total FTEs
Employment costs per FTE per function p.a. (fully loaded) Y1 Y2 Y3 Y4 Y5
Management 35'000 35'000 40'000 45'000 50'000
Marketing and sales 50'000 55'000 60'000 65'000 65'000
Operations (sourcing & distribution) 35'000 40'000 40'000 45'000 45'000
Price per product (retail, excl. sales tax) Y1 Y2 Y3 Y4 Y5
Standard sticker 4.99 4.99 4.99 4.99 4.99
Customized sticker (excl. shipment) 6.99 6.99 6.99 6.99 6.99
Other - - - - -
Variable costs per product Y1 Y2 Y3 Y4 Y5
Standard sticker 0.40 0.25 0.16 0.10 0.10
Customized sticker 0.60 0.35 0.20 0.14 0.10
Other - - - - -
Tornero™ Proprietary and Confidential Page 33
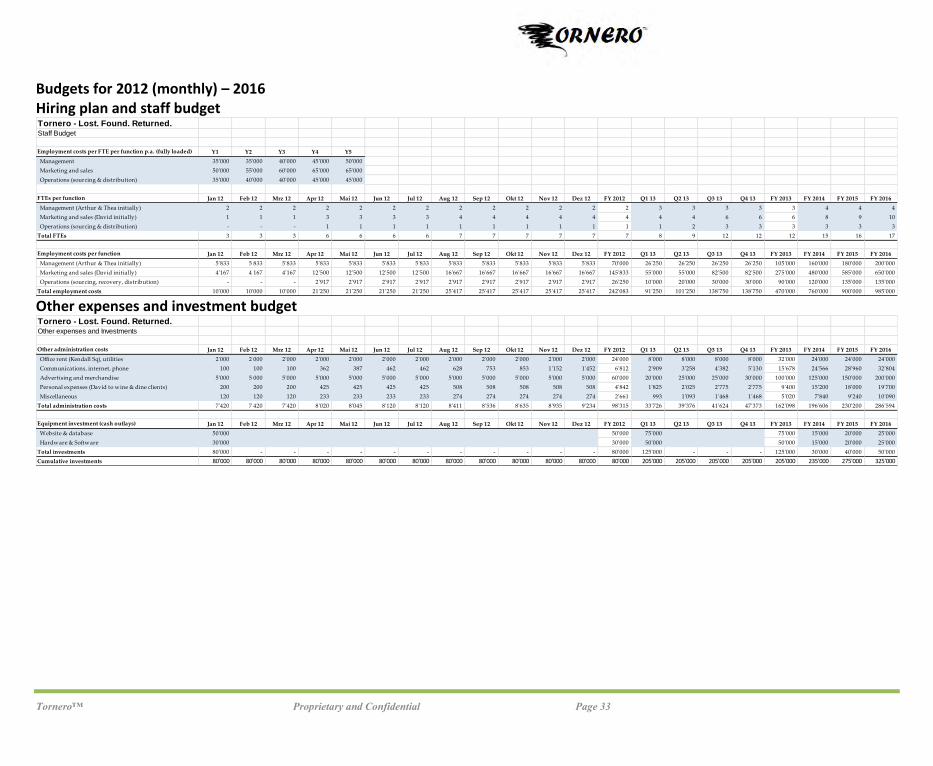
Budgets for 2012 (monthly) – 2016 Hiring plan and staff budget
Other expenses and investment budget
Tornero - Lost. Found. Returned.Staff Budget
Employment costs per FTE per function p.a. (fully loaded) Y1 Y2 Y3 Y4 Y5
Management 35'000 35'000 40'000 45'000 50'000
Marketing and sales 50'000 55'000 60'000 65'000 65'000
Operations (sourcing & distribution) 35'000 40'000 40'000 45'000 45'000
FTEs per function Jan 12 Feb 12 Mrz 12 Apr 12 Mai 12 Jun 12 Jul 12 Aug 12 Sep 12 Okt 12 Nov 12 Dez 12 FY 2012 Q1 13 Q2 13 Q3 13 Q4 13 FY 2013 FY 2014 FY 2015 FY 2016
Management (Arthur & Thea initially) 2 2 2 2 2 2 2 2 2 2 2 2 2 3 3 3 3 3 4 4 4
Marketing and sales (David initially) 1 1 1 3 3 3 3 4 4 4 4 4 4 4 4 6 6 6 8 9 10
Operations (sourcing & distribution) - - - 1 1 1 1 1 1 1 1 1 1 1 2 3 3 3 3 3 3
Total FTEs 3 3 3 6 6 6 6 7 7 7 7 7 7 8 9 12 12 12 15 16 17
Employment costs per function Jan 12 Feb 12 Mrz 12 Apr 12 Mai 12 Jun 12 Jul 12 Aug 12 Sep 12 Okt 12 Nov 12 Dez 12 FY 2012 Q1 13 Q2 13 Q3 13 Q4 13 FY 2013 FY 2014 FY 2015 FY 2016
Management (Arthur & Thea initially) 5'833 5 833 5'833 5'833 5'833 5'833 5'833 5'833 5'833 5'833 5'833 5'833 70'000 26'250 26'250 26'250 26'250 105'000 160'000 180'000 200'000
Marketing and sales (David initially) 4'167 4 167 4'167 12'500 12'500 12'500 12'500 16'667 16'667 16'667 16'667 16'667 145'833 55'000 55'000 82'500 82'500 275'000 480'000 585'000 650'000
Operations (sourcing, recovery, distribution) - - - 2'917 2'917 2'917 2'917 2'917 2'917 2'917 2'917 2'917 26'250 10'000 20'000 30'000 30'000 90'000 120'000 135'000 135'000
Total employment costs 10'000 10'000 10'000 21'250 21'250 21'250 21'250 25'417 25'417 25'417 25'417 25'417 242'083 91'250 101'250 138'750 138'750 470'000 760'000 900'000 985'000
Tornero - Lost. Found. Returned.Other expenses and Investments
Other administration costs Jan 12 Feb 12 Mrz 12 Apr 12 Mai 12 Jun 12 Jul 12 Aug 12 Sep 12 Okt 12 Nov 12 Dez 12 FY 2012 Q1 13 Q2 13 Q3 13 Q4 13 FY 2013 FY 2014 FY 2015 FY 2016
Office rent (Kendall Sq), utilities 2'000 2 000 2'000 2'000 2'000 2'000 2'000 2'000 2'000 2'000 2'000 2'000 24'000 8'000 8'000 8'000 8'000 32'000 24'000 24'000 24'000
Communications, internet, phone 100 100 100 362 387 462 462 628 753 853 1'152 1'452 6'812 2'909 3'258 4'382 5'130 15'678 24'566 28'960 32'804
Advertising and merchandise 5'000 5 000 5'000 5'000 5'000 5'000 5'000 5'000 5'000 5'000 5'000 5'000 60'000 20'000 25'000 25'000 30'000 100'000 125'000 150'000 200'000
Personal expenses (David to wine & dine clients) 200 200 200 425 425 425 425 508 508 508 508 508 4'842 1'825 2'025 2'775 2'775 9'400 15'200 18'000 19'700
Miscellaneous 120 120 120 233 233 233 233 274 274 274 274 274 2'661 993 1'093 1'468 1'468 5'020 7'840 9'240 10'090
Total administration costs 7'420 7 420 7'420 8'020 8'045 8'120 8'120 8'411 8'536 8'635 8'935 9'234 98'315 33'726 39'376 41'624 47'373 162'098 196'606 230'200 286'594
Equipment investment (cash outlays) Jan 12 Feb 12 Mrz 12 Apr 12 Mai 12 Jun 12 Jul 12 Aug 12 Sep 12 Okt 12 Nov 12 Dez 12 FY 2012 Q1 13 Q2 13 Q3 13 Q4 13 FY 2013 FY 2014 FY 2015 FY 2016
Website & database 50'000 50'000 75'000 75'000 15'000 20'000 25'000
Hardware & Software 30'000 30'000 50'000 50'000 15'000 20'000 25'000
Total investments 80'000 - - - - - - - - - - - 80'000 125'000 - - - 125'000 30'000 40'000 50'000
Cumulative investments 80'000 80'000 80'000 80'000 80'000 80'000 80'000 80'000 80'000 80'000 80'000 80'000 80'000 205'000 205'000 205'000 205'000 205'000 235'000 275'000 325'000

Tornero™ Proprietary and Confidential Page 34
Product revenues and COGS plan
Tornero - Lost. Found. Returned.Product revenues and COGS
Price per product (retail, excl. sales tax) Y1 Y2 Y3 Y4 Y5
Standard sticker 4.99 4.99 4.99 4.99 4.99
Customized sticker (excl. shipment) 6.99 6.99 6.99 6.99 6.99
Other - - - - -
Variable costs per product Y1 Y2 Y3 Y4 Y5
Standard sticker 0.40 0.25 0.16 0.10 0.10
Customized sticker 0.60 0.35 0.20 0.14 0.10
Other - - - - -
Products sold per category Jan 12 Feb 12 Mrz 12 Apr 12 Mai 12 Jun 12 Jul 12 Aug 12 Sep 12 Okt 12 Nov 12 Dez 12 FY 2012 Q1 13 Q2 13 Q3 13 Q4 13 FY 2013 FY 2014 FY 2015 FY 2016
Standard sticker - - - 3'000 3'500 5'000 5'000 7'500 10'000 12'000 18'000 24'000 88'000 40'000 45'000 60'000 75'000 220'000 340'000 400'000 460'000
Customized sticker (excl. shipment) - - - 1'800 2'100 3'000 3'000 4'500 8'000 9'000 14'400 19'200 65'000 32'000 36'000 48'000 60'000 170'000 280'000 360'000 450'000
Other - - - - - - - - - - - - - - - - - - - - -
Total products sold - - - 4'800 5'600 8'000 8'000 12'000 18'000 21'000 32'400 43'200 153'000 72'000 81'000 108'000 135'000 390'000 620'000 760'000 910'000
Revenues per category Jan 12 Feb 12 Mrz 12 Apr 12 Mai 12 Jun 12 Jul 12 Aug 12 Sep 12 Okt 12 Nov 12 Dez 12 FY 2012 Q1 13 Q2 13 Q3 13 Q4 13 FY 2013 FY 2014 FY 2015 FY 2016
Standard sticker - - - 14'970 17'465 24'950 24'950 37'425 49'900 59'880 89'820 119'760 439'120 199'600 224'550 299'400 374'250 1'097'800 1'696'600 1'996'000 2'295'400
Customized sticker - - - 12'582 14'679 20'970 20'970 31'455 55'920 62'910 100'656 134'208 454'350 223'680 251'640 335'520 419'400 1'230'240 1'957'200 2'516'400 3'145'500
Other - - - - - - - - - - - - - - - - - - - - -
Total revenue - - - 27'552 32'144 45'920 45'920 68'880 105'820 122'790 190'476 253'968 893'470 423'280 476'190 634'920 793'650 2'328'040 3'653'800 4'512'400 5'440'900
Variable costs per category Jan 12 Feb 12 Mrz 12 Apr 12 Mai 12 Jun 12 Jul 12 Aug 12 Sep 12 Okt 12 Nov 12 Dez 12 FY 2012 Q1 13 Q2 13 Q3 13 Q4 13 FY 2013 FY 2014 FY 2015 FY 2016
Standard sticker - - - 1'200 1'400 2'000 2'000 3'000 4'000 4'800 7'200 9'600 35'200 10'000 11'250 15'000 18'750 55'000 54'400 40'000 46'000
Customized sticker - - - 1'080 1'260 1'800 1'800 2'700 4'800 5'400 8'640 11'520 39'000 11'200 12'600 16'800 21'000 61'600 56'000 50'400 45'000
Other - - - - - - - - - - - - - - - - - - - - -
Total variable costs per product - - - 2'280 2'660 3'800 3'800 5'700 8'800 10'200 15'840 21'120 74'200 21'200 23'850 31'800 39'750 116'600 110'400 90'400 91'000
Gross profit per category Jan 12 Feb 12 Mrz 12 Apr 12 Mai 12 Jun 12 Jul 12 Aug 12 Sep 12 Okt 12 Nov 12 Dez 12 FY 2012 Q1 13 Q2 13 Q3 13 Q4 13 FY 2013 FY 2014 FY 2015 FY 2016
Standard sticker - - - 13'770 16'065 22'950 22'950 34'425 45'900 55'080 82'620 110'160 403'920 189'600 213'300 284'400 355'500 1'042'800 1'642'200 1'956'000 2'249'400
Customized sticker - - - 11'502 13'419 19'170 19'170 28'755 51'120 57'510 92'016 122'688 415'350 212'480 239'040 318'720 398'400 1'168'640 1'901'200 2'466'000 3'100'500
Other - - - - - - - - - - - - - - - - - - - - -
Total gross profit - - - 25'272 29'484 42'120 42'120 63'180 97'020 112'590 174'636 232'848 819'270 402'080 452'340 603'120 753'900 2'211'440 3'543'400 4'422'000 5'349'900
Sales growth Y1 Y2 Y3 Y4 Y5 CAGR
Standard sticker N/A 150% 55% 18% 15% 39%
Customized sticker N/A 162% 65% 29% 25% 47%
Other N/A N/A N/A N/A N/A N/A

Tornero™ Proprietary and Confidential Page 35
Plan Income Statement
Tornero - Lost. Found. Returned.Financial Plans (Income Statement, Balance Sheet and Cash Flows) for 2012 - 2016
Avg. commission to retail channel 50%
Tax 35%
Inflation 2%
Depreciation (t in Y) 3
Pro forma income statement Jan 12 Feb 12 Mrz 12 Apr 12 Mai 12 Jun 12 Jul 12 Aug 12 Sep 12 Okt 12 Nov 12 Dez 12 FY 2012 FY 2013 FY 2014 FY 2015 FY 2016
Revenue summary (per product sales plan)
Recovery sticker revenue - - - 27'552 32'144 45'920 45'920 68'880 105'820 122'790 190'476 253'968 893'470 2'328'040 3'653'800 4'512'400 5'440'900
Other revenue - - - - - - - - - - - - - - - - -
Total revenue - - - 27'552 32'144 45'920 45'920 68'880 105'820 122'790 190'476 253'968 893'470 2'328'040 3'653'800 4'512'400 5'440'900
Costs of goods sold
Variable product costs - - - 2'280 2'660 3'800 3'800 5'700 8'800 10'200 15'840 21'120 74'200 116'600 110'400 90'400 91'000
Sales comission - - - 13'776 16'072 22'960 22'960 34'440 52'910 61'395 95'238 126'984 446'735 1'164'020 1'826'900 2'256'200 2'720'450
Total COGS - - - 16'056 18'732 26'760 26'760 40'140 61'710 71'595 111'078 148'104 520'935 1'280'620 1'937'300 2'346'600 2'811'450
Gross margin - - - 11'496 13'412 19'160 19'160 28'740 44'110 51'195 79'398 105'864 372'535 1'047'420 1'716'500 2'165'800 2'629'450
Gross margin % N/A N/A N/A 42% 42% 42% 42% 42% 42% 42% 42% 42% 42% 45% 47% 48% 48%
Expenses (per operations plan)
Service and recovery operations salary & benefits - - - 2'917 2'917 2'917 2'917 2'917 2'917 2'917 2'917 2'917 26'250 90'000 120'000 135'000 135'000
Sticker sales and marketing salary & benefits 4'167 4'167 4'167 12'500 12'500 12'500 12'500 16'667 16'667 16'667 16'667 16'667 145'833 275'000 480'000 585'000 650'000
Management salary & benefits 5'833 5'833 5'833 5'833 5'833 5'833 5'833 5'833 5'833 5'833 5'833 5'833 70'000 105'000 160'000 180'000 200'000
General and administrative expenses 7'420 7'420 7'420 8'020 8'045 8'120 8'120 8'411 8'536 8'635 8'935 9'234 98'315 162'098 196'606 230'200 286'594
Depreciation & Amortization 2'222 2'222 2'222 2'222 2'222 2'222 2'222 2'222 2'222 2'222 2'222 2'222 26'667 68'333 78'333 65'000 40'000
Total expenses 19'642 19'642 19'642 31'492 31'517 31'592 31'592 36'050 36'175 36'274 36'574 36'873 367'065 700'431 1'034'939 1'195'200 1'311'594
Operating profit -19'642 -19'642 -19'642 -19'996 -18'105 -12'432 -12'432 -7'310 7'935 14'921 42'824 68'991 5'470 346'989 681'561 970'600 1'317'856
Profit margin % -73% -56% -27% -27% -11% 7% 12% 22% 27% 1% 15% 19% 22% 24%
Other gains (losses) - - - - - - - - - - - - - - - - -
Other income - - - - - - - - - - - - - - - - -
Total income -19'642 -19'642 -19'642 -19'996 -18'105 -12'432 -12'432 -7'310 7'935 14'921 42'824 68'991 5'470 346'989 681'561 970'600 1'317'856
Taxes -6'875 -6'875 -6'875 -6'999 -6'337 -4'351 -4'351 -2'558 2'777 5'222 14'988 24'147 1'915 121'446 238'546 339'710 461'250
Net income -19'642 -19'642 -19'642 -19'996 -18'105 -12'432 -12'432 -7'310 5'158 9'698 27'836 44'844 3'556 225'543 443'014 630'890 856'606
Tornero™ Proprietary and Confidential Page 36
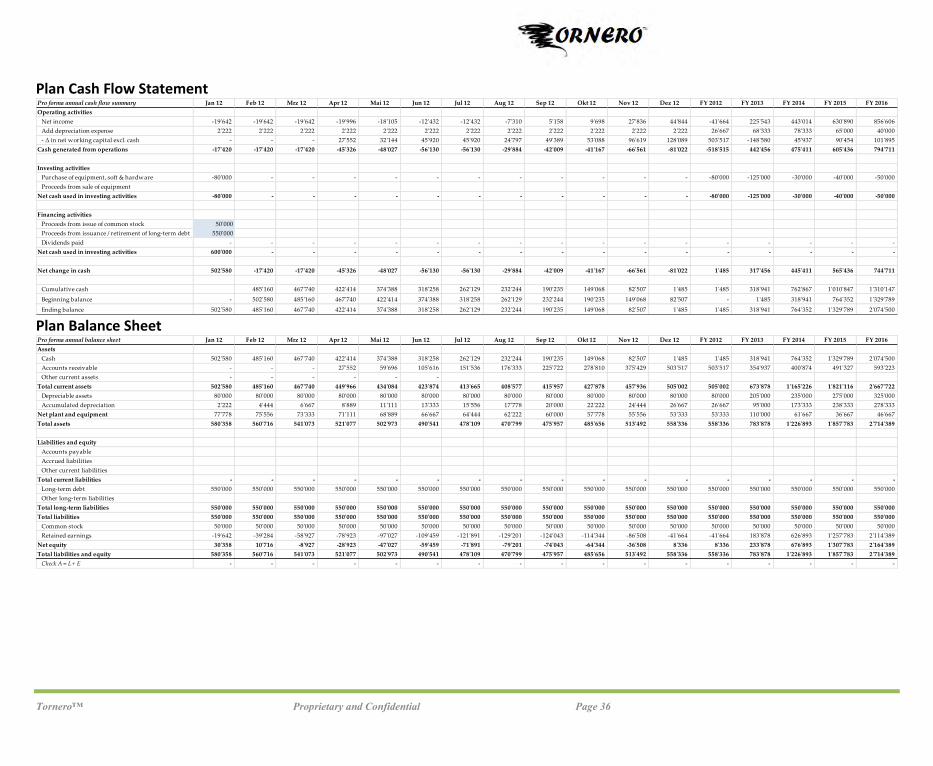
Plan Cash Flow Statement
Plan Balance Sheet
Pro forma annual cash flow summary Jan 12 Feb 12 Mrz 12 Apr 12 Mai 12 Jun 12 Jul 12 Aug 12 Sep 12 Okt 12 Nov 12 Dez 12 FY 2012 FY 2013 FY 2014 FY 2015 FY 2016
Operating activities
Net income -19'642 -19'642 -19'642 -19'996 -18'105 -12'432 -12'432 -7'310 5'158 9'698 27'836 44'844 -41'664 225'543 443'014 630'890 856'606
Add depreciation expense 2'222 2'222 2'222 2'222 2'222 2'222 2'222 2'222 2'222 2'222 2'222 2'222 26'667 68'333 78'333 65'000 40'000
- Δ in net working capital excl. cash - - - 27'552 32'144 45'920 45'920 24'797 49'389 53'088 96'619 128'089 503'517 -148'580 45'937 90'454 101'895
Cash generated from operations -17'420 -17'420 -17'420 -45'326 -48'027 -56'130 -56'130 -29'884 -42'009 -41'167 -66'561 -81'022 -518'515 442'456 475'411 605'436 794'711
Investing activities
Purchase of equipment, soft & hardware -80'000 - - - - - - - - - - - -80'000 -125'000 -30'000 -40'000 -50'000
Proceeds from sale of equipment
Net cash used in investing activities -80'000 - - - - - - - - - - - -80'000 -125'000 -30'000 -40'000 -50'000
Financing activities
Proceeds from issue of common stock 50'000
Proceeds from issuance / retirement of long-term debt 550'000
Dividends paid - - - - - - - - - - - - - - - - -
Net cash used in investing activities 600'000 - - - - - - - - - - - - - - - -
Net change in cash 502'580 -17'420 -17'420 -45'326 -48'027 -56'130 -56'130 -29'884 -42'009 -41'167 -66'561 -81'022 1'485 317'456 445'411 565'436 744'711
Cumulative cash 485'160 467'740 422'414 374'388 318'258 262'129 232'244 190'235 149'068 82'507 1'485 1'485 318'941 762'867 1'010'847 1'310'147
Beginning balance - 502'580 485'160 467'740 422'414 374'388 318'258 262'129 232'244 190'235 149'068 82'507 - 1'485 318'941 764'352 1'329'789
Ending balance 502'580 485'160 467'740 422'414 374'388 318'258 262'129 232'244 190'235 149'068 82'507 1'485 1'485 318'941 764'352 1'329'789 2'074'500
Pro forma annual balance sheet Jan 12 Feb 12 Mrz 12 Apr 12 Mai 12 Jun 12 Jul 12 Aug 12 Sep 12 Okt 12 Nov 12 Dez 12 FY 2012 FY 2013 FY 2014 FY 2015 FY 2016
Assets
Cash 502'580 485'160 467'740 422'414 374'388 318'258 262'129 232'244 190'235 149'068 82'507 1'485 1'485 318'941 764'352 1'329'789 2'074'500
Accounts receivable - - - 27'552 59'696 105'616 151'536 176'333 225'722 278'810 375'429 503'517 503'517 354'937 400'874 491'327 593'223
Other current assets - - - - - -
Total current assets 502'580 485'160 467'740 449'966 434'084 423'874 413'665 408'577 415'957 427'878 457'936 505'002 505'002 673'878 1'165'226 1'821'116 2'667'722
Depreciable assets 80'000 80'000 80'000 80'000 80'000 80'000 80'000 80'000 80'000 80'000 80'000 80'000 80'000 205'000 235'000 275'000 325'000
Accumulated depreciation 2'222 4'444 6'667 8'889 11'111 13'333 15'556 17'778 20'000 22'222 24'444 26'667 26'667 95'000 173'333 238'333 278'333
Net plant and equipment 77'778 75'556 73'333 71'111 68'889 66'667 64'444 62'222 60'000 57'778 55'556 53'333 53'333 110'000 61'667 36'667 46'667
Total assets 580'358 560'716 541'073 521'077 502'973 490'541 478'109 470'799 475'957 485'656 513'492 558'336 558'336 783'878 1'226'893 1'857'783 2'714'389
Liabilities and equity
Accounts payable
Accrued liabilities
Other current liabilities
Total current liabilities - - - - - - - - - - - - - - - - -
Long-term debt 550'000 550'000 550'000 550'000 550'000 550'000 550'000 550'000 550'000 550'000 550'000 550'000 550'000 550'000 550'000 550'000 550'000
Other long-term liabilities
Total long-term liabilities 550'000 550'000 550'000 550'000 550'000 550'000 550'000 550'000 550'000 550'000 550'000 550'000 550'000 550'000 550'000 550'000 550'000
Total liabilities 550'000 550'000 550'000 550'000 550'000 550'000 550'000 550'000 550'000 550'000 550'000 550'000 550'000 550'000 550'000 550'000 550'000
Common stock 50'000 50'000 50'000 50'000 50'000 50'000 50'000 50'000 50'000 50'000 50'000 50'000 50'000 50'000 50'000 50'000 50'000
Retained earnings -19'642 -39'284 -58'927 -78'923 -97'027 -109'459 -121'891 -129'201 -124'043 -114'344 -86'508 -41'664 -41'664 183'878 626'893 1'257'783 2'114'389
Net equity 30'358 10'716 -8'927 -28'923 -47'027 -59'459 -71'891 -79'201 -74'043 -64'344 -36'508 8'336 8'336 233'878 676'893 1'307'783 2'164'389
Total liabilities and equity 580'358 560'716 541'073 521'077 502'973 490'541 478'109 470'799 475'957 485'656 513'492 558'336 558'336 783'878 1'226'893 1'857'783 2'714'389
Check A = L + E - - - - - - - - - - - - - - - - -

Tornero™ Proprietary and Confidential Page 37
Endnotes 1 "FAQ—100 Wallets Deliberately Lost to Test Honesty." Lost Wallet Test: 100 Wallets Deliberately Lost to Test Honesty. Web. 2011. <http://www.wallettest.com/Lost_Wallet_Test/FAQ.html>. (Data
reflects the age range that characterizes our business traveler target persona)
2 "Number of Cell Phones Worldwide Hits 4.6B - CBS News." Breaking News Headlines: Business, Entertainment & World News - CBS News. Web. 2011. <http://www.cbsnews.com/stories/2010/02/15/business/main6209772.shtml>.
3 "Cell Phones Approach Total Penetration Globally, With Smartphones Moving Toward Market Dominance - MarketWatch." MarketWatch - Stock Market Quotes, Business News, Financial News. Web. 2011. <http://www.marketwatch.com/story/cell-phones-approach-total-penetration-globally-with-smartphones-moving-toward-market-dominance-2011-11-15>.
4 "Bridget Carey: The Digital Dish | Miami Is Top Ranked City for Lost Cellphones." Naked Politics | MiamiHerald.com. Web. 2011. <http://miamiherald.typepad.com/cache_carey/2011/02/miami-is-top-ranked-city-for-lost-cellphones.html>.
5 Surveys of 20 randomly selected airport travelers in Boston Logan (October 30, 2011) and Minneapolis International Airports (November 1, 2011).
6 Converse. Web. 2011. <http://www.converse.com/?CSID=44_kwid/>.
7 Salaway et. al. “The ECAR Study of Undergraduate Students and Information Technology.” 2007
8 (35 million business travelers * $4.99) + (2 million leisure travelers * $6.99) = 188,630,000
9 "League of American Bicyclists * Facts & Figures." League of American Bicyclists * Home. Web. 2011. <http://www.bikeleague.org/media/facts/>.
10 "FBI — Table 24." FBI — Homepage. Web. 2011. <http://www.fbi.gov/about-us/cjis/ucr/crime-in-the-u.s/2010/crime-in-the-u.s.-2010/tables/10tbl24.xls/>.
11 "Endowment Effect." Wikipedia. Web. 2011. <http://en.wikipedia.org/wiki/Endowment_effect>.
12 Huck, S., Kirchsteiger, G., and Oechssler, J. (2005). ‘Learning to Like What You Have: Explaining the Endowment Effect’, The Economic Journal, vol. 115, pp.689-702.
13 Ibid.
14 "Most Stolen Products: IPhones, Droids "Hot" Movers On Stolen Goods List | Special Features | Minyanville.com." Minyanville -- Stock Market, Investment, Finance, Money, Hoofy & Boo. Web. 2011. <http://www.minyanville.com/special-features/articles/shoplifting-shoplifting-statistics-most-stolen-retail/9/15/2010/id/30057>.
15 Ponemon, Larry. Airport Insecurity: The Case of Missing & Lost Laptops. Rep. Ponemon Institute, LLC, 2008. Print.
16 Ibid.
17 Power of Travel. U.S. Travel Answer Sheet. Rep. U.S. Travel Association, 2011. Print.
18 Delivering the Future Pocket Guide: Global Market Forecast 2011-2030. Blagnac Cedex, France: Airbus S.A.S., 2011. Print.
19 "LoJack for Laptops Anti Theft Software and LoJack SCI Supply Chain Integrity Solutions Extend LoJack's Premiere Tracking and Recovery Offerings." LoJack Security Systems for Stolen Vehicle Recovery, GPS Anti-Theft and Persons at Risk. Web. 15 Dec. 2011. <http://www.lojack.com/pages/laptop.aspx>.
20 “Near Field Communication.” Wikipedia. Web. 2011. <http://en.wikipedia.org/wiki/Near_field_communication>.