Business Update October 2017 - Edison International · PDF filebut are not limited to the: ......
50
October 31, 2017 Business Update October 2017
Transcript of Business Update October 2017 - Edison International · PDF filebut are not limited to the: ......
October 31, 2017
Business UpdateOctober 2017

October 31, 2017 1
Statements contained in this presentation about future performance, including, without limitation, operating results, capitalexpenditures, rate base growth, dividend policy, financial outlook, and other statements that are not purely historical, are forward-looking statements. These forward-looking statements reflect our current expectations; however, such statements involve risks and uncertainties. Actual results could differ materially from current expectations. These forward-looking statements represent our expectations only as of the date of this presentation, and Edison International assumes no duty to update them to reflect new information, events or circumstances. Important factors that could cause different results include, but are not limited to the:
• ability of SCE to recover its costs in a timely manner from its customers through regulated rates, including costs related to San Onofre and proposed spending on grid modernization;
• decisions and other actions by the CPUC, the FERC, the NRC and other regulatory authorities, including determinations of authorized rates of return or return on equity, the outcome of San Onofre CPUC proceedings, and the 2018 GRC and delays in regulatory actions;
• risks associated with higher rates for utility bundled service customers, caused by the authority of cities, counties and certain other public agencies to generate and/or purchase electricity for their local residents and businesses (known as Community Choice Aggregation or CCA), and other possible customer bypass or departure due to increased adoption of distributed energy resources or technological advancements in the generation, storage, transmission, distribution and use of electricity, and supported by public policy, government regulations and incentives;
• risks inherent in SCE’s transmission and distribution infrastructure investment program, including those related to project site identification, public opposition, environmental mitigation, construction, permitting, power curtailment costs (payments due under power contracts in the event there is insufficient transmission to enable acceptance of power delivery), and governmental approvals;
• ability to obtain sufficient insurance, including insurance relating to SCE's nuclear facilities and wildfire-related liability, and to recover the costs of such insurance or in the absence of insurance the ability to recover uninsured losses; and
• risks associated with the decommissioning of San Onofre, including those related to public opposition, permitting, governmental approvals, on-site storage of spent nuclear fuel, and cost overruns.
Other important factors are discussed under the headings “Risk Factors” and “Management’s Discussion and Analysis” in Edison International’s Form 10-K, most recent Form 10-Q, and other reports filed with the Securities and Exchange Commission, which are available on our website: www.edisoninvestor.com. These filings also provide additional information on historical and other factual data contained in this presentation.
Forward-Looking Statements
October 31, 2017 2
PageUpdated (U) from
July 2017 Business Update
EIX Shareholder Value 3 U
SCE Highlights, SCE Long-Term Growth Drivers, Regulatory Model 4-6
Capital Expenditures and Rate Base History and Forecast 7-9 U
2018 GRC Intervenor Testimony 10 U
Key Regulatory Proceedings 11 U
CPUC Cost of Capital 12 U
Distribution and Transmission Capital Expenditure Detail 13-17 U
Operational Excellence 18
EIX Responding to Industry Change 19
Edison Energy Group Summary 20 U
2017 Guidance 21 U
Annual Dividends Per Share 22
Appendix
2018 GRC Overview 24-25
EIX and SCE Tax Reform 26
Historical Capital Expenditures 27
Capital Expenditure and Rate Base Detailed Forecast 28 U
Power Grid of the Future, Grid Modernization 29-32
SCE Customer Demand Trends 33
California Energy Policy 34 U
SCE Bundled Revenue Requirement, System Average Rate Historical Growth 35-36
CCA Overview, Residential Rate Reform and Other 37-40 N,U
SCE Rates and Bills Comparison 41 U
Third Quarter and YTD 2017 Earnings Summary, MHI Award Accounting, Results of Operations, Non-GAAP Reconciliations 42-49 U
Table of Contents
October 31, 2017 3
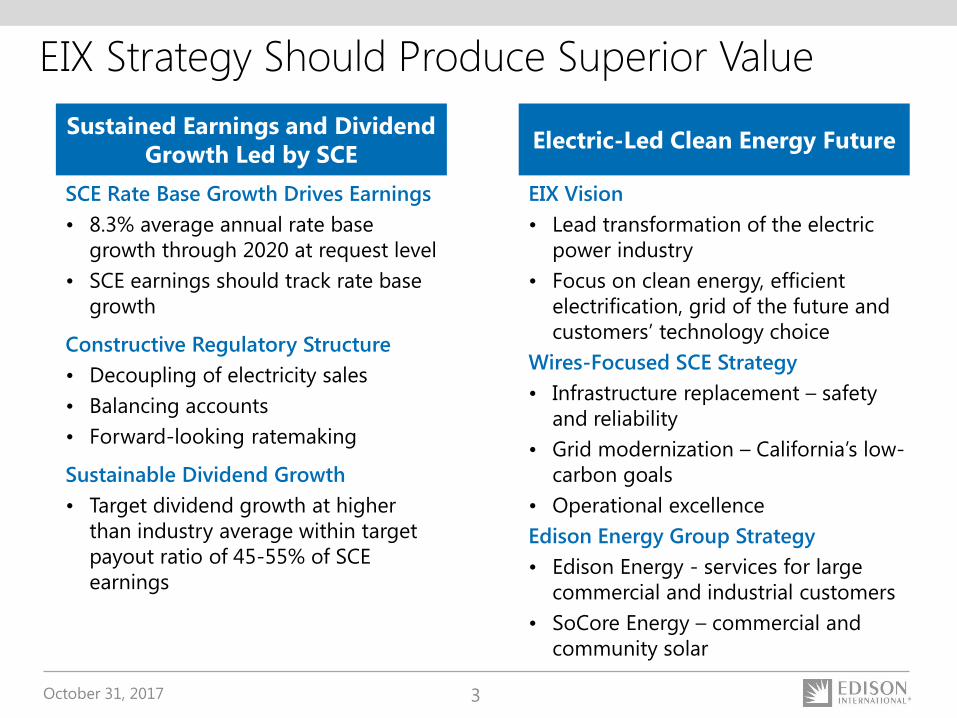
EIX Strategy Should Produce Superior Value
Sustained Earnings and Dividend
Growth Led by SCEElectric-Led Clean Energy Future
SCE Rate Base Growth Drives Earnings
• 8.3% average annual rate base
growth through 2020 at request level
• SCE earnings should track rate base
growth
Constructive Regulatory Structure
• Decoupling of electricity sales
• Balancing accounts
• Forward-looking ratemaking
Sustainable Dividend Growth
• Target dividend growth at higher
than industry average within target
payout ratio of 45-55% of SCE
earnings
EIX Vision
• Lead transformation of the electric
power industry
• Focus on clean energy, efficient
electrification, grid of the future and
customers’ technology choice
Wires-Focused SCE Strategy
• Infrastructure replacement – safety
and reliability
• Grid modernization – California’s low-
carbon goals
• Operational excellence
Edison Energy Group Strategy
• Edison Energy - services for large
commercial and industrial customers
• SoCore Energy – commercial and
community solar
October 31, 2017 4
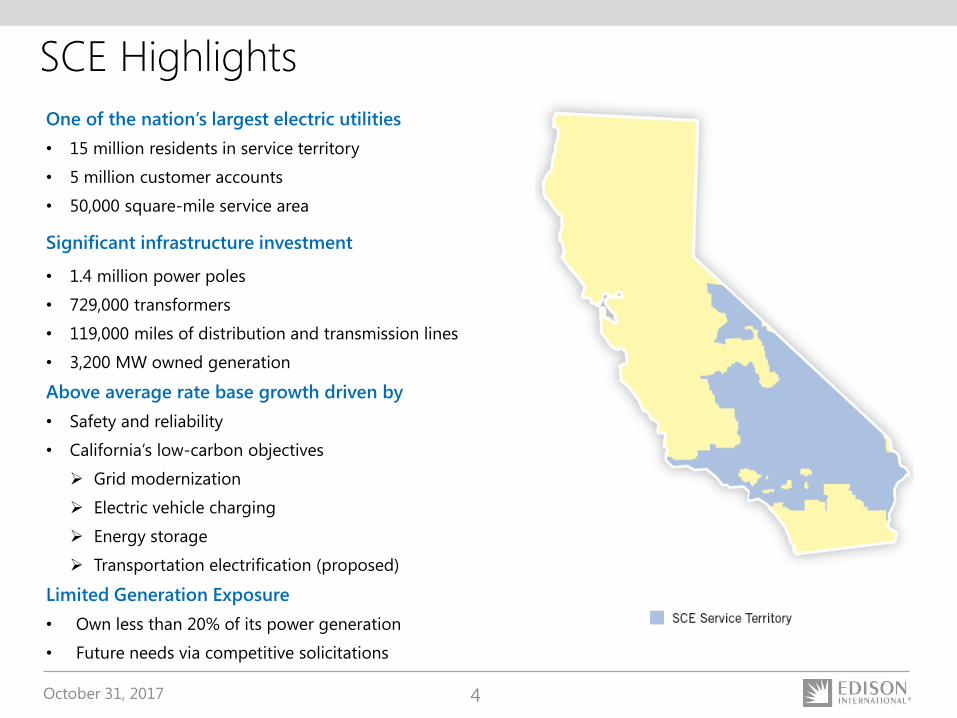
One of the nation’s largest electric utilities
• 15 million residents in service territory
• 5 million customer accounts
• 50,000 square-mile service area
Significant infrastructure investment
• 1.4 million power poles
• 729,000 transformers
• 119,000 miles of distribution and transmission lines
• 3,200 MW owned generation
Above average rate base growth driven by
• Safety and reliability
• California’s low-carbon objectives
Grid modernization
Electric vehicle charging
Energy storage
Transportation electrification (proposed)
Limited Generation Exposure
• Own less than 20% of its power generation
• Future needs via competitive solicitations
SCE Highlights

October 31, 2017 5
SCE Long-Term Growth DriversDescription Timeframe/Regulatory Process
Sustained level of infrastructure investment
required until equilibrium replacement rates
achieved and then maintained
• Ongoing - current and future GRCs
Accelerate circuit upgrades, automation,
communication, and analytics capabilities at
optimal locations to integrate distributed
energy resources
• Today – Grid modernization capital expenditures
included in traditional spend
• 2018-2020 - $1.8 billion capital request in 2018
GRC application
• 2025 – CPUC target to complete grid
modernization but may take longer
Future transmission needs to meet 50%
renewables mandate in 2030 and to support
reliability
• 2017-2022 – Multiple projects approved by CAISO
in permitting and/or construction
• 2021-2030 – Future needs largely driven by CAISO
planning process
SCE-owned investment opportunities under
existing CPUC proceedings
• Today – Most investments via contracts
• 2018-2020 - $60 million of capital requested in
2018 GRC application
• SCE’s storage portfolio – procurement target of 580
MW by 2020
Utility investment in programs to build and
support the expansion of transportation
electrification in passenger and light-,
medium- and heavy-duty vehicles and
potentially to support electrification of other
sectors of the economy
• 2016 – Charge Ready Phase I approved
• 2017 – Transportation Electrification plan filed
January 20
• 2018-2030 – Future Charge Ready Phase II and
other transportation electrification investments;
potential investments to support electrification of
other sectors of the economy
Infrastructure
Reliability
Grid Modernization
Electrification of
Transportation and
Other Sectors
Energy Storage
Transmission
October 31, 2017 6
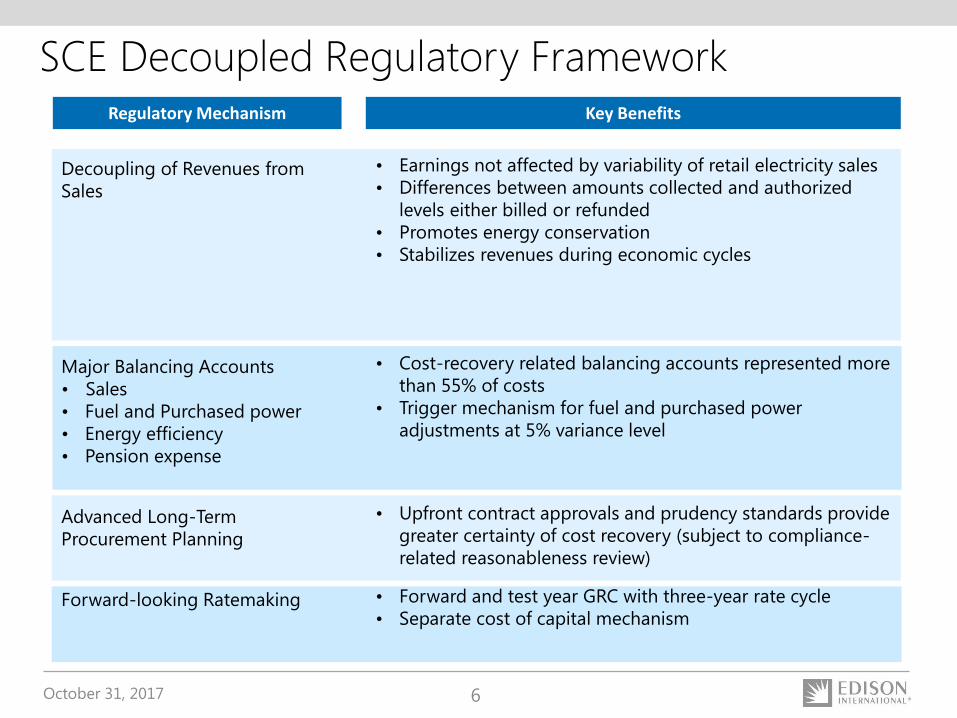
SCE Decoupled Regulatory Framework
Decoupling of Revenues from
Sales
Major Balancing Accounts
• Sales
• Fuel and Purchased power
• Energy efficiency
• Pension expense
Advanced Long-Term
Procurement Planning
Forward-looking Ratemaking
• Earnings not affected by variability of retail electricity sales
• Differences between amounts collected and authorized
levels either billed or refunded
• Promotes energy conservation
• Stabilizes revenues during economic cycles
• Cost-recovery related balancing accounts represented more
than 55% of costs
• Trigger mechanism for fuel and purchased power
adjustments at 5% variance level
• Upfront contract approvals and prudency standards provide
greater certainty of cost recovery (subject to compliance-
related reasonableness review)
• Forward and test year GRC with three-year rate cycle
• Separate cost of capital mechanism
Regulatory Mechanism Key Benefits

October 31, 2017 7
SCE Historical Rate Base and Core Earnings
Rate Base
Core Earnings
7%
5%
2011 – 2016 CAGR
($ billions)
Note: Recorded rate base, year-end basis. See SCE Core EPS Non-GAAP Reconciliations and Use of Non-GAAP Financial Measures. Since 2013, rate base excludes SONGS
$18.8
$21.0 $21.1
$23.3$24.6
$25.9
2011 2012 2013 2014 2015 2016
$4.20$4.68$3.33 $4.10 $3.88Core
EPS$4.22

October 31, 2017 8
SCE Capital Expenditure Forecast – Request Level
Note: Forecasted capital spending includes CPUC, FERC and other spending. 2018-2020 CPUC based on 2018 GRC request rebuttal testimony. See Capital Expenditure/Rate Base
Detailed Forecast for further information, including potential investment excluded in forecasts. Delta represents change from July 2017 Business Update.
1. 2016 and 2017 capital expenditures related to grid modernization are included in distribution capital expenditures
($ billions) $18.5 Billion Capital Program
for 2017-2020
• Capital expenditure forecast incorporates GRC, FERC and
non-GRC CPUC spending
Grid modernization spending of $1.8 billion during 2018
GRC period1
2017 traditional capital spending incorporates 2015 GRC
decision and FERC spending
Includes $107 million of non-GRC CPUC capital spending
for mobile home pilot program and charge ready pilot in
2017
Excludes transportation electrification and Charge Ready
Phase II
• Authorized/Actual may differ from forecast
Since the 2009 GRC, CPUC has approved 81%, 89%, and
92% of capital requested, respectively
SCE has no prior approval experience on grid
modernization capital spending and, therefore, prior
results may not be predictive
Forecasted FERC capital spending subject to timely
receipt of permitting, licensing, and regulatory approvals
$3.5$3.7
$4.9$5.0 $4.9
2016 (Actual) 2017 2018 2019 2020
Distribution Transmission Generation
Traditional Capital Spending:
Grid Modernization Capital Spending:
Grid Modernization
Prior Forecast $3.8 $4.9 $5.0 $4.9
Delta ($0.1) - - -
1
October 31, 2017 9
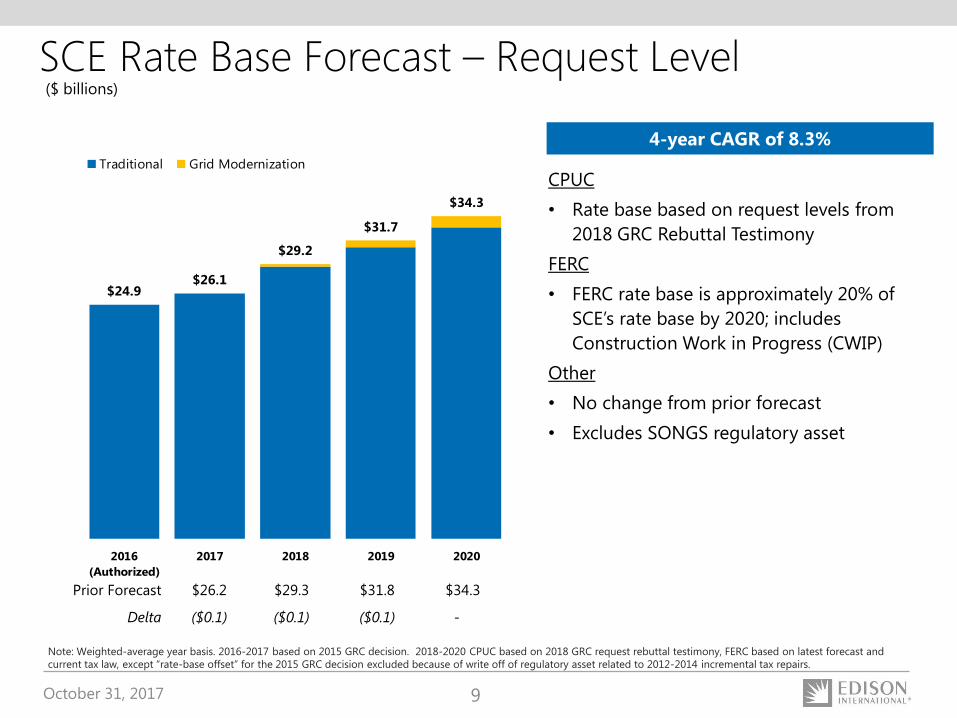
SCE Rate Base Forecast – Request Level
CPUC
• Rate base based on request levels from
2018 GRC Rebuttal Testimony
FERC
• FERC rate base is approximately 20% of
SCE’s rate base by 2020; includes
Construction Work in Progress (CWIP)
Other
• No change from prior forecast
• Excludes SONGS regulatory asset
($ billions)
Note: Weighted-average year basis. 2016-2017 based on 2015 GRC decision. 2018-2020 CPUC based on 2018 GRC request rebuttal testimony, FERC based on latest forecast and
current tax law, except “rate-base offset” for the 2015 GRC decision excluded because of write off of regulatory asset related to 2012-2014 incremental tax repairs.
4-year CAGR of 8.3%
$24.9$26.1
$29.2
$31.7
$34.3
2016
(Authorized)
2017 2018 2019 2020
Traditional Grid Modernization
Prior Forecast $26.2 $29.3 $31.8 $34.3
Delta ($0.1) ($0.1) ($0.1) -

October 31, 2017 10
SCE Rate Base Forecast Comparison to ORA and TURN – 2017-20204
($ in billions) 2016 2017 2018 2019 2020 CAGR
SCE’s Rebuttal Forecast $24.9 $26.1 $29.2 $31.7 $34.3 8.3%
SCE’s Request Level Forecast at ORA
Recommended Spending Levels$24.9 $26.1 $28.6 $30.4 $32.2 6.6%
Difference ($0.0) ($0.0) ($0.6) ($1.3) ($2.1)
SCE’s Request Level Forecast at TURN
Recommended Spending Levels and
Proposed Rate Base Adjustments5
$24.9 $26.1 $27.7 $29.5 $31.5 6.0%
Difference ($0.0) ($0.0) ($1.5) ($2.2) ($2.8)
ORA submitted testimony on April 7, 2017 – Key elements
• Proposed no Grid Modernization capital expenditures and ~90% of traditional
capital expenditures
• Other items similar to ORA’s 2015 GRC testimony, including incentive
compensation and traditional capital expenditures such as 4kV Cutovers and
Overhead Conductor Program
TURN and other intervenors submitted testimony on May 2, 2017 – Key TURN
elements3
• Proposed ~22% of Grid Modernization capital expenditures and ~85% of
traditional capital expenditures
• Proposed rate base adjustment for historical capital expenditures, including a
reduction of approximately $550 million related to certain distribution
infrastructure replacement programs
SCE Rebuttal filed June 16, 2017
General Rate Case Update – Intervenor Testimony
1. Relative to total rates
2. Includes $48 million one-time recovery of pre-2018 Balancing/Memorandum Accounts
3. Information has been updated to include any changes in positions from briefs and reply briefs filed in September 2017
4. Forecasting rate base considering the lower of ORA’s and TURN’s recommendations in each year would result in a lower rate base growth rate and revenue requirement
5. CAGR excluding rate base adjustments is 6.5%
Proposed Revenue Requirement Increases1
($ in millions)
2018
Increase
Post Test Year
2019 2020
SCE Rebuttal2 $196/2.5% 3.8% 5.1%
ORA $14/0.9% 2.7% 4.2%
TURN3 $108/1.7% -0.1% 3.3%

October 31, 2017 11
SCE Key Regulatory ProceedingsProceeding Description Next Steps
Key CPUC Proceedings
2018 General Rate Case
(A. 16-09-001)
Set CPUC base revenue requirement, capital
expenditures and rate base for 2018-2020
Ongoing workshops and data requests; intervenor and
rebuttal testimony submitted; Briefs and reply briefs
filed in September 2017
Cost of Capital
(A. 12-04-015)
CPUC capital structure, cost of capital, and return
on equity
CPUC approved petition for modification on July 13,
2017; Advice Letter setting cost of debt and preferred
filed September 29, 2017 and approved by CPUC
Distribution Resources Plan OIR
(R.14-08-013)
Power grid investments to integrate distributed
energy resources
Demo projects underway; Current focus is on policy
track, including grid modernization, deferral framework
and DER forecasting
Integrated Distributed Energy
Resources OIR (R. 14-10-003)
Creating consistent framework for guidance,
planning and evaluation of DERs
Proposed Resolution to be issued in October 2017 and
voted on November 30, 2017; Solicitation to launch
early December 2017
SONGS OII
(I.12-10-013)
OII resolved (December 2015); Proceeding record
reopened in May 2016
CPUC issued ruling on October 10, 2017 that
establishes next steps with an initial expedited
schedule with hearings tentatively scheduled to end in
early March 2018 with a commission decision to follow
Charge Ready Program
(A.14-10-014)
Implementation program for charger installations
and market education
Phase 1 pilot program approved January 2016; plan to
file Phase 1 report in May 2018; Phase 2 filing expected
in 2018
2017 Transportation
Electrification (A.17-01-021)
TE proposals to address SB 350 transportation
electrification objectives
Ongoing workshops and data requests; Proposed
decision for priority review projects in Q4 2017; final
decision for standard review projects in May 2018
Power Charge Indifference
Adjustment OIR (R.17-06-026)
Review, revise, and consider alternatives to the
PCIA
Scoping memo issued – Track 1 proposed decision in
April 2018 and Track 2 proposed decision in July 2018
Key FERC Proceedings
FERC Formula Rates Transmission rate setting with annual updates Settlement in place through December 2017;
replacement rate filed on October 27, 2017
October 31, 2017 12
3
4
5
6
7
10/1/12 10/1/13 10/1/14 10/1/15 10/1/16 10/1/17 10/1/18 10/1/19
Rate
(%
)
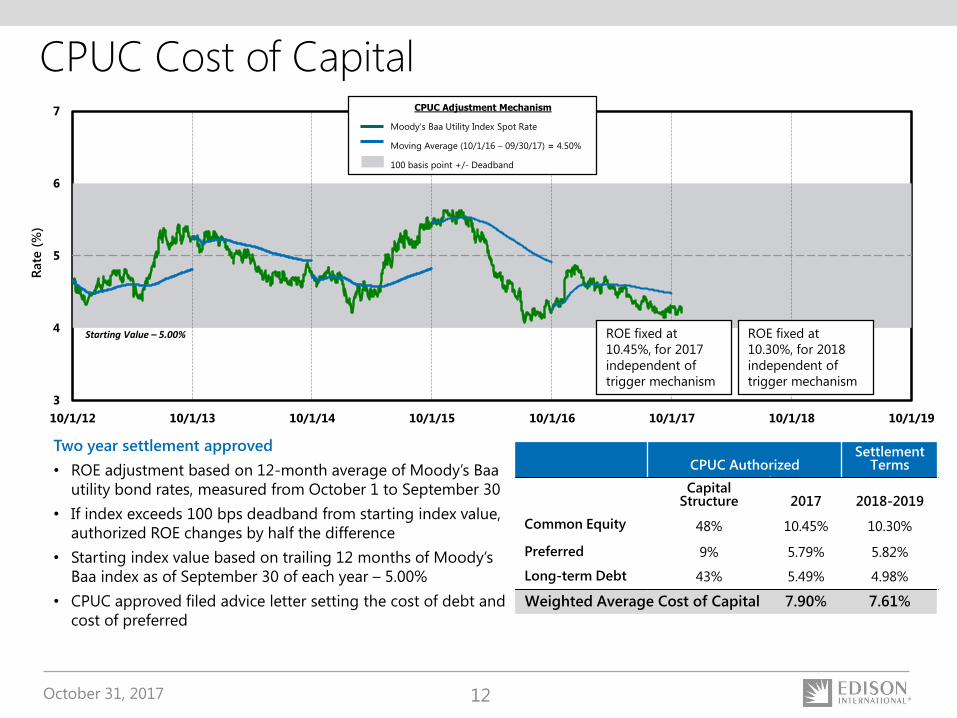
CPUC Cost of CapitalCPUC Adjustment Mechanism
Moody’s Baa Utility Index Spot Rate
Moving Average (10/1/16 – 09/30/17) = 4.50%
100 basis point +/- Deadband
Starting Value – 5.00%
Two year settlement approved
• ROE adjustment based on 12-month average of Moody’s Baa
utility bond rates, measured from October 1 to September 30
• If index exceeds 100 bps deadband from starting index value,
authorized ROE changes by half the difference
• Starting index value based on trailing 12 months of Moody’s
Baa index as of September 30 of each year – 5.00%
• CPUC approved filed advice letter setting the cost of debt and
cost of preferred
CPUC Authorized Settlement
Terms
CapitalStructure 2017 2018-2019
Common Equity 48% 10.45% 10.30%
Preferred 9% 5.79% 5.82%
Long-term Debt 43% 5.49% 4.98%
Weighted Average Cost of Capital 7.90% 7.61%
ROE fixed at
10.30%, for 2018
independent of
trigger mechanism
ROE fixed at
10.45%, for 2017
independent of
trigger mechanism

October 31, 2017 13
SCE Distribution System Investments
1. Other includes GRC energy storage, Charge Ready Phase I and mobile home pilot programs
Distribution Trends
• Continued focus on safety and reliability with
infrastructure replacement representing 44% of total
distribution capital spend, but not yet reaching
equilibrium replacement rate
Includes pole loading replacement program and
overhead conductor replacements
• Distribution grid requires upgrades to circuit
capacity, automation, and control systems to
support reliability as use of distributed energy
resources increases
• Includes grid modernization capital which is
expected to become a larger portion of spend
beyond 2017
2017 – 2020 Capital Spending Forecast
for Distribution1 – Request Level
$14.1 Billion
2018-2020 Capital Spending Drivers
• Automation of over 850 distribution circuits
• Over 2,000 miles of cable replacements
• 4kV cutovers/removals
• Distribution preventive maintenance
• Overhead conductor replacements
• Circuit breaker replacements/upgrades
Load
GrowthNew Service
Connections
Infrastructure
Replacement
General Plant
Grid
Modernization
Other
October 31, 2017 14
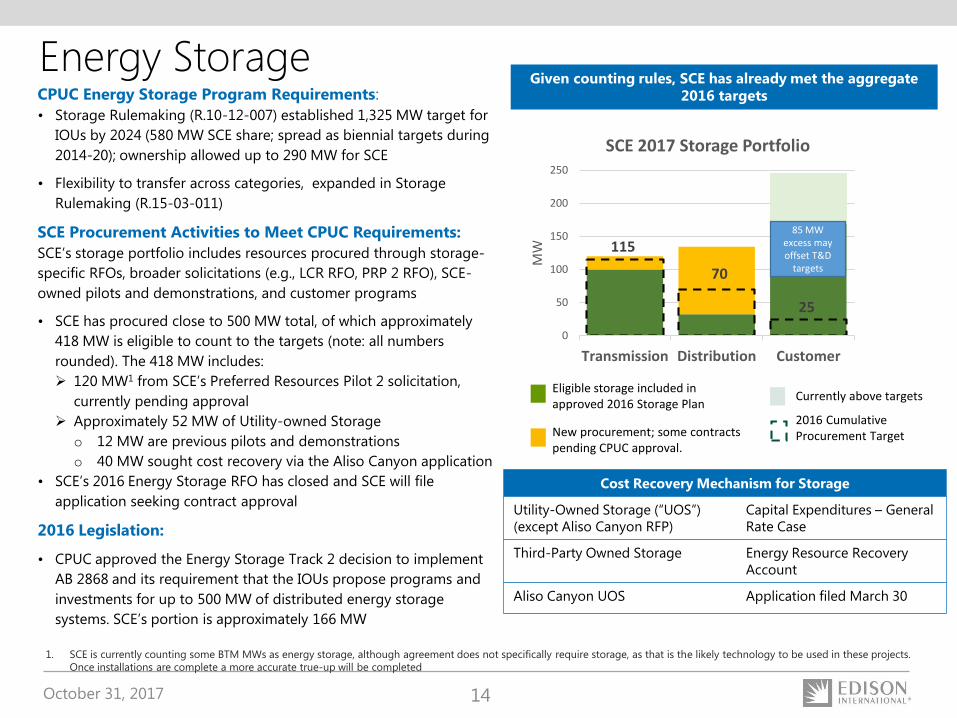
Energy StorageGiven counting rules, SCE has already met the aggregate
2016 targetsCPUC Energy Storage Program Requirements:
• Storage Rulemaking (R.10-12-007) established 1,325 MW target for
IOUs by 2024 (580 MW SCE share; spread as biennial targets during
2014-20); ownership allowed up to 290 MW for SCE
• Flexibility to transfer across categories, expanded in Storage
Rulemaking (R.15-03-011)
SCE Procurement Activities to Meet CPUC Requirements:
SCE’s storage portfolio includes resources procured through storage-
specific RFOs, broader solicitations (e.g., LCR RFO, PRP 2 RFO), SCE-
owned pilots and demonstrations, and customer programs
• SCE has procured close to 500 MW total, of which approximately
418 MW is eligible to count to the targets (note: all numbers
rounded). The 418 MW includes:
120 MW1 from SCE’s Preferred Resources Pilot 2 solicitation,
currently pending approval
Approximately 52 MW of Utility-owned Storage
o 12 MW are previous pilots and demonstrations
o 40 MW sought cost recovery via the Aliso Canyon application
• SCE’s 2016 Energy Storage RFO has closed and SCE will file
application seeking contract approval
2016 Legislation:
• CPUC approved the Energy Storage Track 2 decision to implement
AB 2868 and its requirement that the IOUs propose programs and
investments for up to 500 MW of distributed energy storage
systems. SCE’s portion is approximately 166 MW
Cost Recovery Mechanism for Storage
Utility-Owned Storage (“UOS”)
(except Aliso Canyon RFP)
Capital Expenditures – General
Rate Case
Third-Party Owned Storage Energy Resource Recovery
Account
Aliso Canyon UOS Application filed March 30
115
70
25
0
50
100
150
200
250
Transmission Distribution Customer
MW
SCE 2017 Storage Portfolio
85 MWexcess may offset T&D
targets
Eligible storage included in approved 2016 Storage Plan
New procurement; some contracts pending CPUC approval.
Currently above targets
2016 Cumulative Procurement Target
1. SCE is currently counting some BTM MWs as energy storage, although agreement does not specifically require storage, as that is the likely technology to be used in these projects.
Once installations are complete a more accurate true-up will be completed
October 31, 2017 15
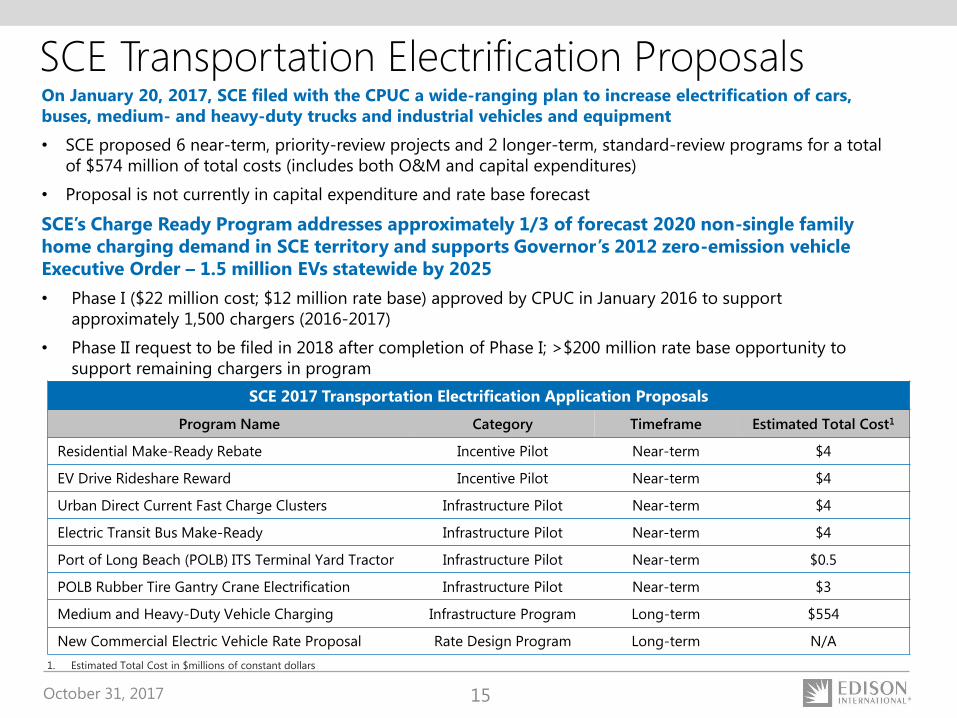
SCE Transportation Electrification ProposalsOn January 20, 2017, SCE filed with the CPUC a wide-ranging plan to increase electrification of cars,
buses, medium- and heavy-duty trucks and industrial vehicles and equipment
• SCE proposed 6 near-term, priority-review projects and 2 longer-term, standard-review programs for a total
of $574 million of total costs (includes both O&M and capital expenditures)
• Proposal is not currently in capital expenditure and rate base forecast
SCE’s Charge Ready Program addresses approximately 1/3 of forecast 2020 non-single family
home charging demand in SCE territory and supports Governor’s 2012 zero-emission vehicle
Executive Order – 1.5 million EVs statewide by 2025
• Phase I ($22 million cost; $12 million rate base) approved by CPUC in January 2016 to support
approximately 1,500 chargers (2016-2017)
• Phase II request to be filed in 2018 after completion of Phase I; >$200 million rate base opportunity to
support remaining chargers in program
SCE 2017 Transportation Electrification Application Proposals
Program Name Category Timeframe Estimated Total Cost1
Residential Make-Ready Rebate Incentive Pilot Near-term $4
EV Drive Rideshare Reward Incentive Pilot Near-term $4
Urban Direct Current Fast Charge Clusters Infrastructure Pilot Near-term $4
Electric Transit Bus Make-Ready Infrastructure Pilot Near-term $4
Port of Long Beach (POLB) ITS Terminal Yard Tractor Infrastructure Pilot Near-term $0.5
POLB Rubber Tire Gantry Crane Electrification Infrastructure Pilot Near-term $3
Medium and Heavy-Duty Vehicle Charging Infrastructure Program Long-term $554
New Commercial Electric Vehicle Rate Proposal Rate Design Program Long-term N/A
1. Estimated Total Cost in $millions of constant dollars
October 31, 2017 16
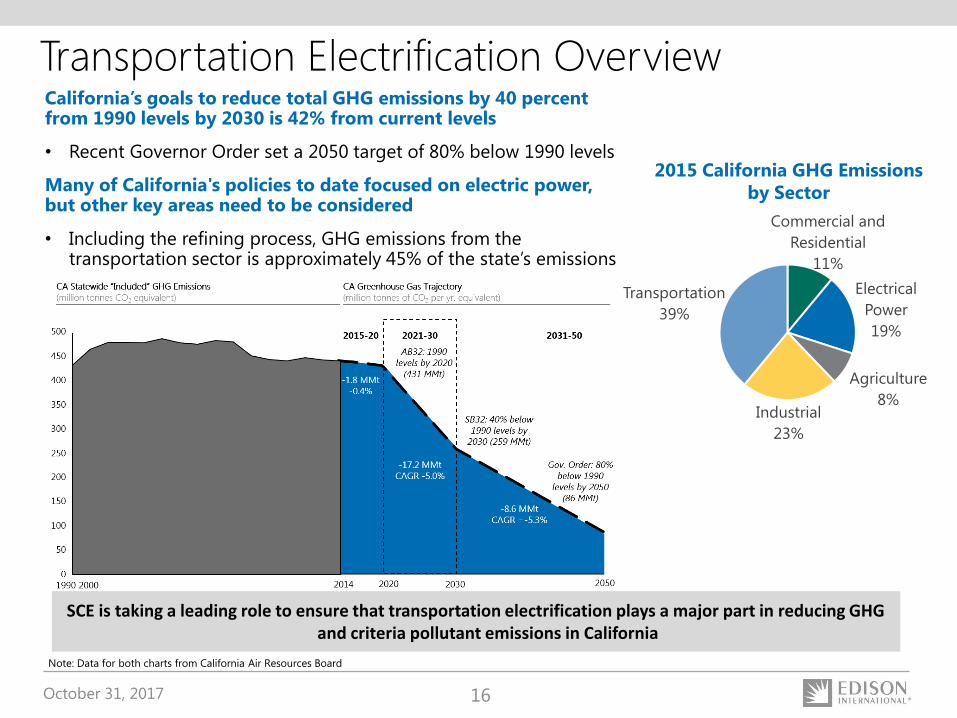
Transportation Electrification OverviewCalifornia’s goals to reduce total GHG emissions by 40 percent from 1990 levels by 2030 is 42% from current levels
• Recent Governor Order set a 2050 target of 80% below 1990 levels
Many of California's policies to date focused on electric power, but other key areas need to be considered
• Including the refining process, GHG emissions from the transportation sector is approximately 45% of the state’s emissions
Commercial and
Residential
11%
Electrical
Power
19%
Agriculture
8%Industrial
23%
Transportation
39%
SCE is taking a leading role to ensure that transportation electrification plays a major part in reducing GHG and criteria pollutant emissions in California
2015 California GHG Emissions
by Sector
Note: Data for both charts from California Air Resources Board
October 31, 2017 17
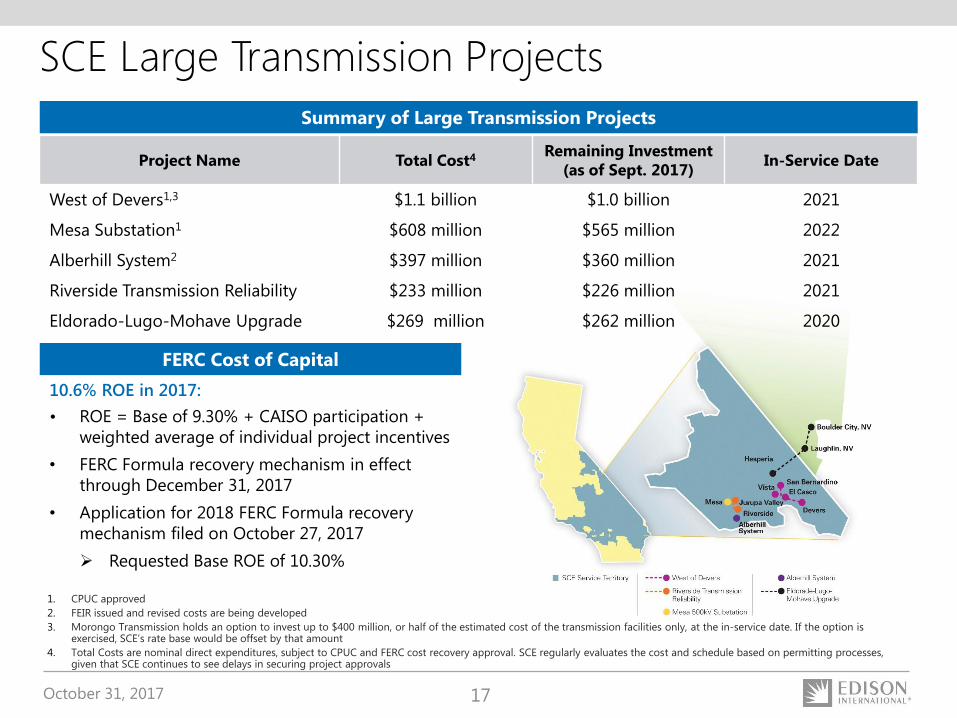
SCE Large Transmission Projects
1. CPUC approved
2. FEIR issued and revised costs are being developed
3. Morongo Transmission holds an option to invest up to $400 million, or half of the estimated cost of the transmission facilities only, at the in-service date. If the option is exercised, SCE’s rate base would be offset by that amount
4. Total Costs are nominal direct expenditures, subject to CPUC and FERC cost recovery approval. SCE regularly evaluates the cost and schedule based on permitting processes, given that SCE continues to see delays in securing project approvals
FERC Cost of Capital
10.6% ROE in 2017:
• ROE = Base of 9.30% + CAISO participation +
weighted average of individual project incentives
• FERC Formula recovery mechanism in effect
through December 31, 2017
• Application for 2018 FERC Formula recovery
mechanism filed on October 27, 2017
Requested Base ROE of 10.30%
Summary of Large Transmission Projects
Project Name Total Cost4 Remaining Investment
(as of Sept. 2017)In-Service Date
West of Devers1,3 $1.1 billion $1.0 billion 2021
Mesa Substation1 $608 million $565 million 2022
Alberhill System2 $397 million $360 million 2021
Riverside Transmission Reliability $233 million $226 million 2021
Eldorado-Lugo-Mohave Upgrade $269 million $262 million 2020

October 31, 2017 18
SCE Operational Excellence
Top Quartile
• Safety
• Reliability
• Customer service
• Cost efficiency
Optimize
• Capital productivity
• Purchased power cost
High performing, continuous
improvement culture
Defining Excellence Measuring Excellence
• Employee and public safety
metrics
• System performance and
reliability (SAIDI, SAIFI,
MAIFI)
• J.D. Power customer
satisfaction
• O&M cost per customer
• Reduce system rate growth
with O&M / purchased
power cost reductions
Ongoing
Operational
Excellence
Efforts
October 31, 2017 19
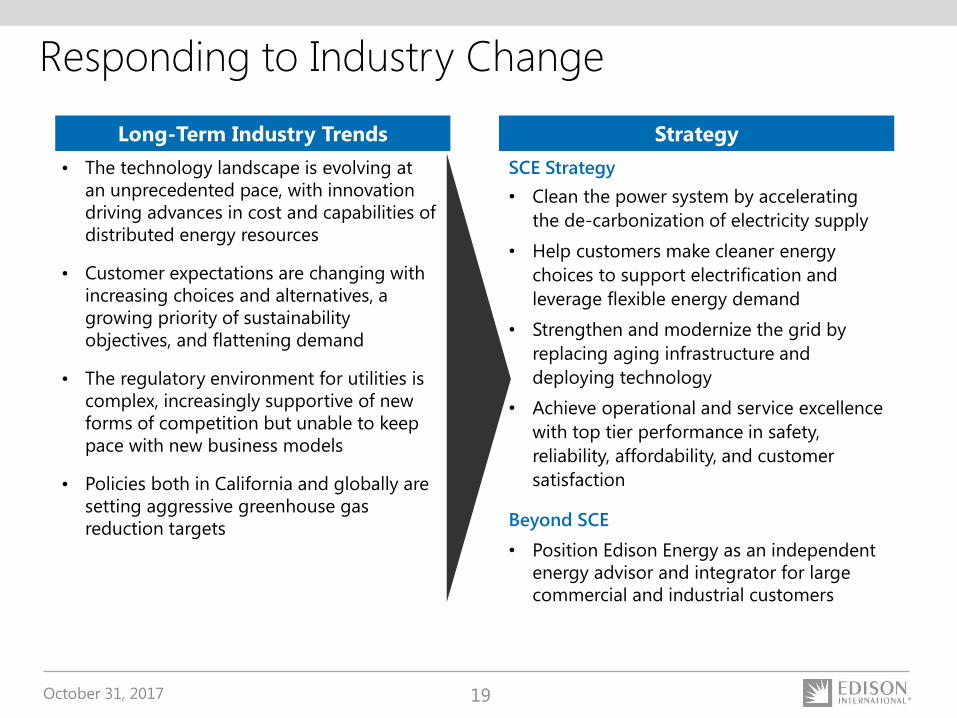
Responding to Industry Change
Long-Term Industry Trends Strategy
• The technology landscape is evolving at
an unprecedented pace, with innovation
driving advances in cost and capabilities of
distributed energy resources
• Customer expectations are changing with
increasing choices and alternatives, a
growing priority of sustainability
objectives, and flattening demand
• The regulatory environment for utilities is
complex, increasingly supportive of new
forms of competition but unable to keep
pace with new business models
• Policies both in California and globally are
setting aggressive greenhouse gas
reduction targets
SCE Strategy
• Clean the power system by accelerating
the de-carbonization of electricity supply
• Help customers make cleaner energy
choices to support electrification and
leverage flexible energy demand
• Strengthen and modernize the grid by
replacing aging infrastructure and
deploying technology
• Achieve operational and service excellence
with top tier performance in safety,
reliability, affordability, and customer
satisfaction
Beyond SCE
• Position Edison Energy as an independent
energy advisor and integrator for large
commercial and industrial customers

October 31, 2017 20
• Edison Energy is an advisory and services
company with the capabilities to develop and
integrate an array of energy solutions to help
commercial and industrial customers improve
management of their energy costs and risks
in dealing with increasingly complex tariff
and technology choices
• Edison Energy’s core advisory capabilities
were formed through Edison International’s
acquisition of three companies in December
2015: Altenex, Eneractive Solutions and Delta
Energy
• Edison International investment $101 million
as of September 30, 2017
Edison Energy
Edison Energy Group Summary
SoCore Energy
• Provider of distributed solar solutions
focused on the following segments:
Commercial & Industrial
Electric Cooperatives & Municipalities
Community Solar
Advanced Energy Solutions - commercial
and distributed energy storage
• 106 MW of commercial-scale solar systems
constructed and in operation as of
September 30, 2017
• Edison International investment $228 million
as of September 30, 2017; currently
evaluating sale opportunities for the business
The Opportunity: Trusted Advisor and Solution Integrator

October 31, 2017 21
$4.05 $4.32(0.11)0.38
SCE 2017 EPS from
Rate Base Forecast
SCE Variances EIX Parent
& Other
EIX 2017 Core EPS
Midpoint Guidance
• O&M,
financing and
other benefits
- $0.35
• Energy
efficiency -
$0.03
2017 Core Earnings Per Share Guidance –
Building from SCE Rate Base
• SCE authorized rate base $26.1 billion
• Authorized CPUC capital structure - 48%
equity and 10.45% ROE
• FERC ROE of 10.6% (including
incentives)
• Energy efficiency earnings $0.03 per
share
• SONGS settlement as currently
approved by CPUC
• YTD incremental tax benefits from
stock-based compensation and audit
and return true-ups included:
SCE: $0.04 per share
EIX Parent & Other: $0.18 per share
• No change in tax policy
• 325.8 million common shares
Key Assumptions
• Holding
Company -
($0.03)
• Edison Energy
Group - ($0.05)
• SoCore
Impairment –
($0.03)
2017 Earnings Per Share Guidance
2017 EIX Earnings Per Share Guidance
As of
July 27, 2017
As of
October 30, 2017
Low Mid High Low Mid High
EIX Basic EPS $4.13 $4.23 $4.33 $4.27 $4.32 $4.37
Less: Non-Core Items1 - - - - - -
EIX Core EPS2 $4.13 $4.23 $4.33 $4.27 $4.32 $4.37
1. There were $1 million of non-core items for the nine months ended September 30, 2017
2. See Earnings Non-GAAP Reconciliations and Use of Non-GAAP Financial Measures in Appendix
On track to realize operational and service excellence targets with additional improvement
attributable to tax benefits
October 31, 2017 22
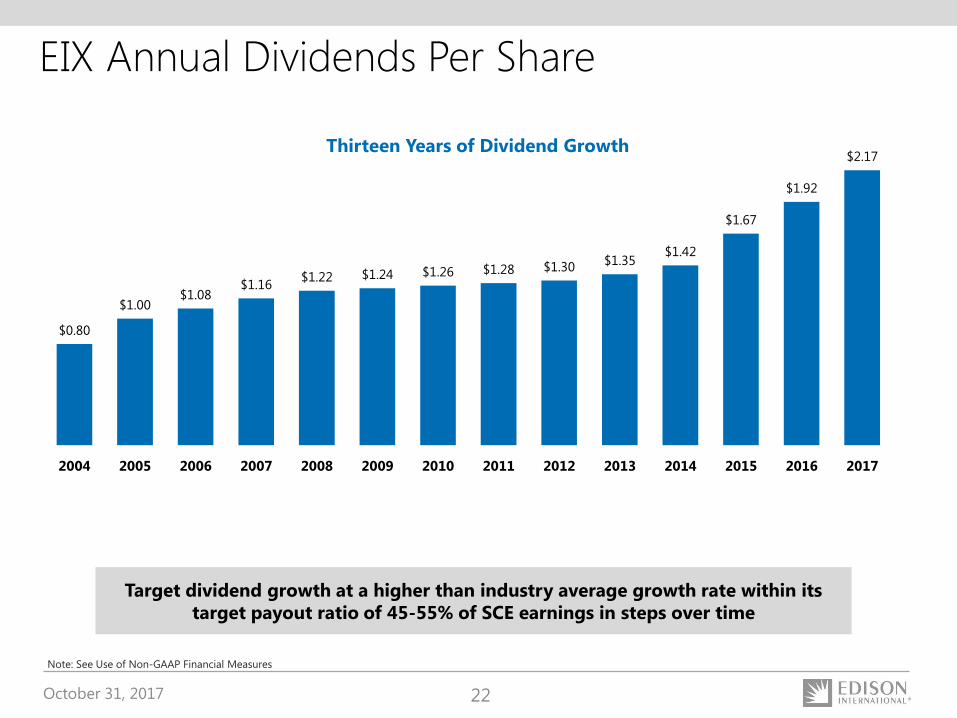
EIX Annual Dividends Per Share
$0.80
$1.00$1.08
$1.16$1.22 $1.24 $1.26 $1.28 $1.30
$1.35$1.42
$1.67
$1.92
$2.17
2004 2005 2006 2007 2008 2009 2010 2011 2012 2013 2014 2015 2016 2017
Note: See Use of Non-GAAP Financial Measures
Thirteen Years of Dividend Growth
Target dividend growth at a higher than industry average growth rate within its
target payout ratio of 45-55% of SCE earnings in steps over time
October 31, 2017 23
Appendix
October 31, 2017 24
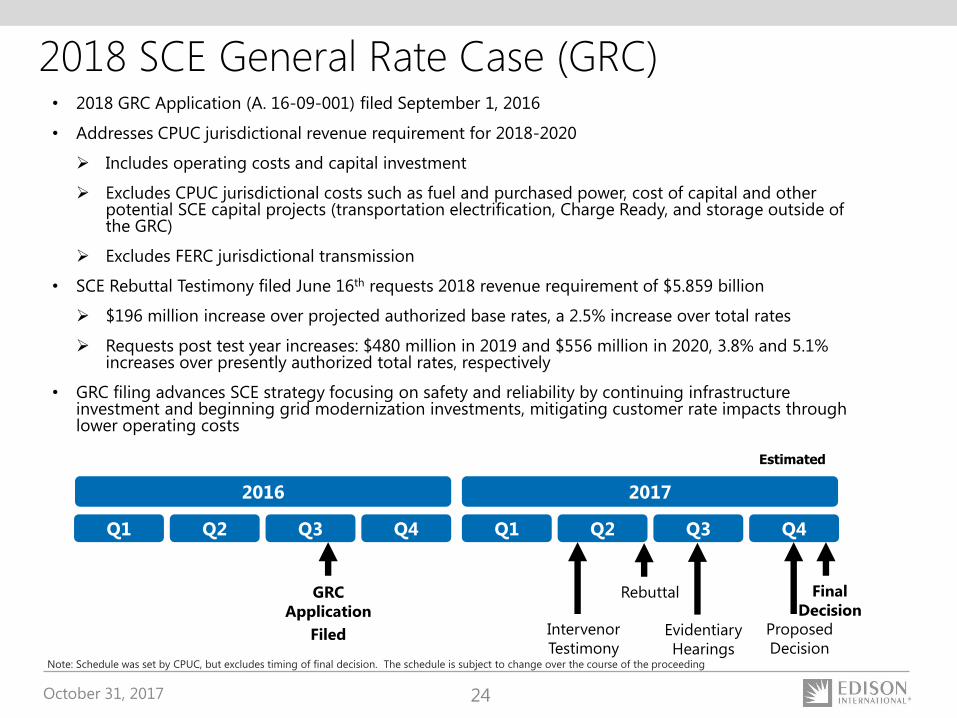
• 2018 GRC Application (A. 16-09-001) filed September 1, 2016
• Addresses CPUC jurisdictional revenue requirement for 2018-2020
Includes operating costs and capital investment
Excludes CPUC jurisdictional costs such as fuel and purchased power, cost of capital and other potential SCE capital projects (transportation electrification, Charge Ready, and storage outside of the GRC)
Excludes FERC jurisdictional transmission
• SCE Rebuttal Testimony filed June 16th requests 2018 revenue requirement of $5.859 billion
$196 million increase over projected authorized base rates, a 2.5% increase over total rates
Requests post test year increases: $480 million in 2019 and $556 million in 2020, 3.8% and 5.1% increases over presently authorized total rates, respectively
• GRC filing advances SCE strategy focusing on safety and reliability by continuing infrastructure investment and beginning grid modernization investments, mitigating customer rate impacts through lower operating costs
GRC
Application
Filed
Rebuttal Final
Decision
2016 2017
Q1 Q2 Q3 Q4 Q1 Q2 Q3 Q4
Estimated
Intervenor
Testimony
Proposed
Decision
2018 SCE General Rate Case (GRC)
Evidentiary
HearingsNote: Schedule was set by CPUC, but excludes timing of final decision. The schedule is subject to change over the course of the proceeding
October 31, 2017 25
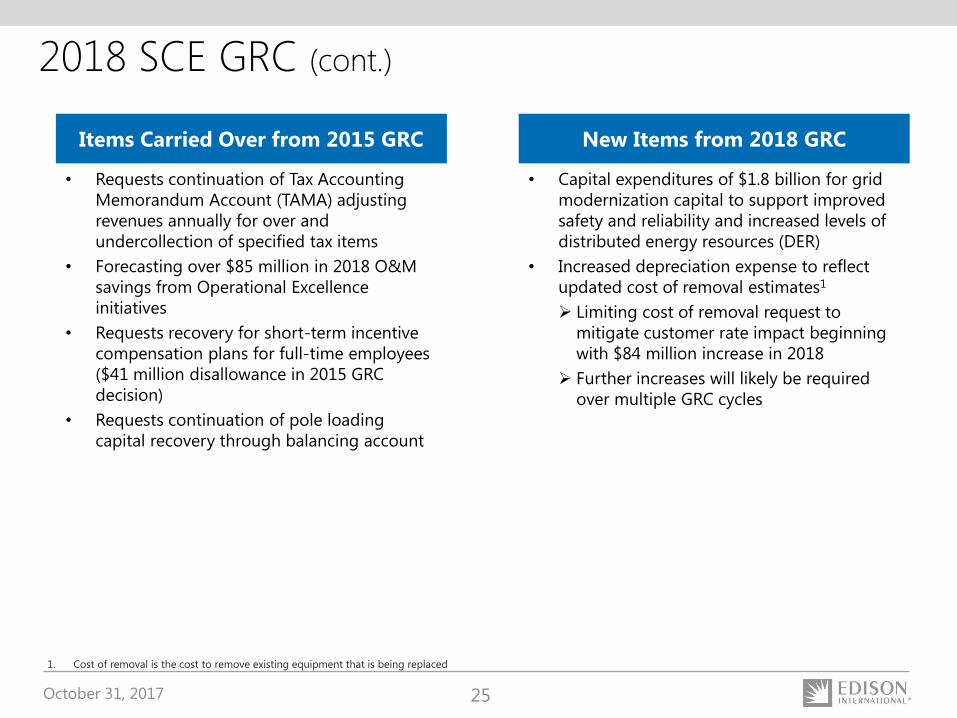
• Capital expenditures of $1.8 billion for grid
modernization capital to support improved
safety and reliability and increased levels of
distributed energy resources (DER)
• Increased depreciation expense to reflect
updated cost of removal estimates1
Limiting cost of removal request to
mitigate customer rate impact beginning
with $84 million increase in 2018
Further increases will likely be required
over multiple GRC cycles
Items Carried Over from 2015 GRC New Items from 2018 GRC
• Requests continuation of Tax Accounting
Memorandum Account (TAMA) adjusting
revenues annually for over and
undercollection of specified tax items
• Forecasting over $85 million in 2018 O&M
savings from Operational Excellence
initiatives
• Requests recovery for short-term incentive
compensation plans for full-time employees
($41 million disallowance in 2015 GRC
decision)
• Requests continuation of pole loading
capital recovery through balancing account
1. Cost of removal is the cost to remove existing equipment that is being replaced
2018 SCE GRC (cont.)

October 31, 2017 26
Key Reform
Considerations
Impact on
Customer / ShareholderComments
No interest deductibility Negative Negative
• Permanent increase in customer rates
(top concern)
• Costs passed through but lowers tax
shield
Lower tax rate (15%-20%) Positive
Negative at EIX
holding
company
• Lower customer rates
• Remeasurement of EIX holding
company tax assets and lower tax shield
100% capital expensing Mixed Mixed
• Timing benefit only
• Customer rates may be impacted by
treatment of property-related
deductions
Net Deferred Tax Liability / (Asset)
As of 12/31/2016; ($ in millions)SCE HoldCo
Property-related and other $9,798 ($165)
Operating loss / credit carryforward - (1,152)1
Net deferred tax liability / (asset) $9,798 ($1,317)1,2
1. Excludes $242 million of deferred tax assets allocated to third parties
2. Includes $58 million of state deferred tax assets
EIX and SCE Tax Reform

October 31, 2017 27
SCE Historical Capital Expenditures($ billions)
$3.9
$3.5
$4.0 $3.9
$3.5
2012 2013 2014 2015 2016
October 31, 2017 28
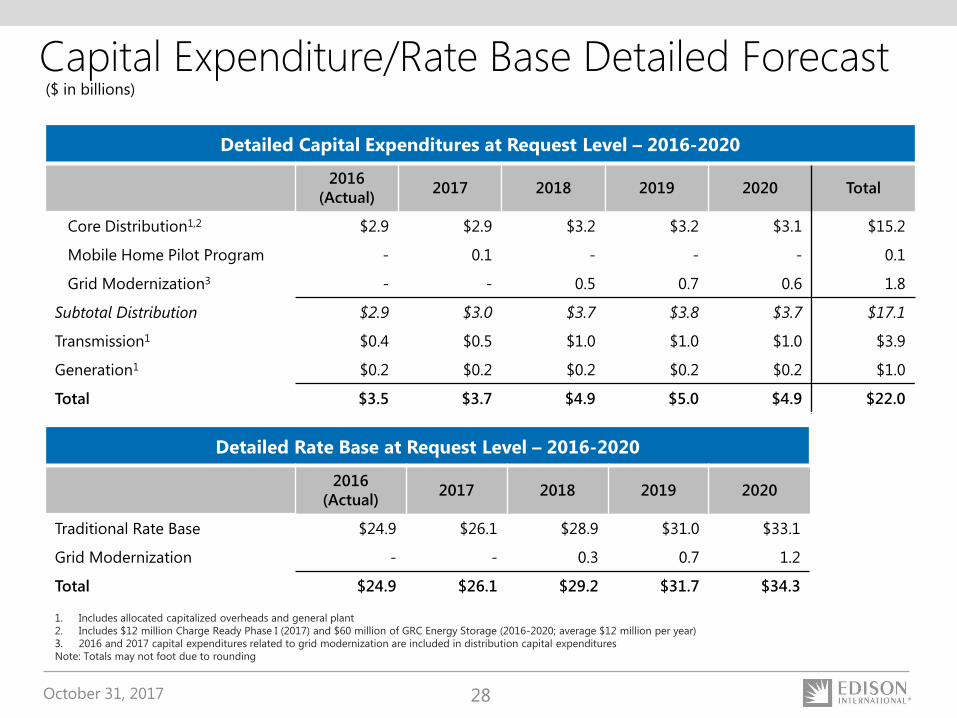
Detailed Capital Expenditures at Request Level – 2016-2020
2016
(Actual)2017 2018 2019 2020 Total
Core Distribution1,2 $2.9 $2.9 $3.2 $3.2 $3.1 $15.2
Mobile Home Pilot Program - 0.1 - - - 0.1
Grid Modernization3 - - 0.5 0.7 0.6 1.8
Subtotal Distribution $2.9 $3.0 $3.7 $3.8 $3.7 $17.1
Transmission1 $0.4 $0.5 $1.0 $1.0 $1.0 $3.9
Generation1 $0.2 $0.2 $0.2 $0.2 $0.2 $1.0
Total $3.5 $3.7 $4.9 $5.0 $4.9 $22.0
Capital Expenditure/Rate Base Detailed Forecast
Detailed Rate Base at Request Level – 2016-2020
2016
(Actual)2017 2018 2019 2020
Traditional Rate Base $24.9 $26.1 $28.9 $31.0 $33.1
Grid Modernization - - 0.3 0.7 1.2
Total $24.9 $26.1 $29.2 $31.7 $34.3
1. Includes allocated capitalized overheads and general plant
2. Includes $12 million Charge Ready Phase I (2017) and $60 million of GRC Energy Storage (2016-2020; average $12 million per year)
3. 2016 and 2017 capital expenditures related to grid modernization are included in distribution capital expenditures
Note: Totals may not foot due to rounding
($ in billions)

October 31, 2017 29
Distribution Power Grid of the Future
One-Way Electricity Flow
• System designed to distribute electricity
from large central generating plants
• Increasing penetration of distributed
energy resources
• Voltage centrally maintained
• Limited situational awareness and
visualization tools for power grid
operators
Renewable Generation Mandates
Subsidized Residential Solar
Limited Electric Vehicle Charging
Infrastructure
Variable, Two-Way Electricity Flow
• Distribution system at the center of the
power grid
• System designed to manage fluctuating
resources and customer demand
• Digital monitoring and control devices and
advanced communications systems to
improve safety and reliability, and integrate
DERs
• Improved data management and power
grid operations with cyber mitigation
• Modernize utility distribution planning with
distributed energy resources
Maximize Distributed Resources and
Electric Vehicle Adoption
• Distribution power grid infrastructure
design supports customer choice and
greater resiliency
Current State Future State
October 31, 2017 30
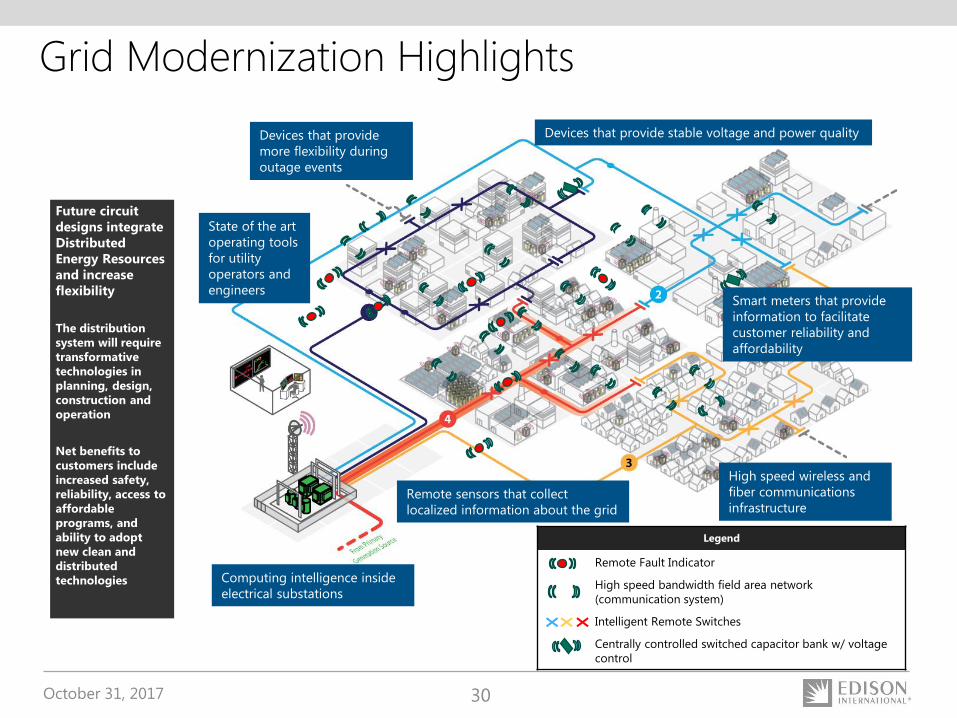
Computing intelligence inside
electrical substations
Future circuit
designs integrate
Distributed
Energy Resources
and increase
flexibility
The distribution
system will require
transformative
technologies in
planning, design,
construction and
operation
Net benefits to
customers include
increased safety,
reliability, access to
affordable
programs, and
ability to adopt
new clean and
distributed
technologies
State of the art
operating tools
for utility
operators and
engineers
Remote sensors that collect
localized information about the grid
Devices that provide
more flexibility during
outage events
Devices that provide stable voltage and power quality
High speed wireless and
fiber communications
infrastructure
Smart meters that provide
information to facilitate
customer reliability and
affordability
Grid Modernization Highlights
Legend
Remote Fault Indicator
High speed bandwidth field area network
(communication system)
Intelligent Remote Switches
Centrally controlled switched capacitor bank w/ voltage
control

October 31, 2017 31
$0.54
$0.65
$0.61
2018 2019 2020
Building next generation electric grid requires accelerating traditional Transmission and Distribution / Information Technology programs and investing in new capabilities
• Increased capacity: Upgrade portions of the grid (such as 4kV system) to increase capacity, improve reliability, and address technology obsolescence
• Advanced and Integrated Capabilities:
• Automation to monitor and control grid equipment in real-time and improve flexibility of grid operations
• Communication Networks: Expansion of fiber optic network and field area network for real-time data transfer
• Technology Platforms: Foundational tools for forecasting and planning; management systems to operate the distribution grid
Capital will be deployed to achieve two primary objectives
• Improving safety and reliability
Focus on worst performing circuits in conjunction with traditional infrastructure replacement activities
• Increase DER integration and enable advanced operations on circuits with high forecasted penetration or where DERs can provide grid services
1. 2018-2020 CPUC based on 2018 GRC request rebuttal testimony; conceded grid modernization capital expenditures are expected to be requested in future GRC applications 2. Forecast excludes capitalized overheads
SCE Grid Modernization – Request Level1($ billions)
$1.8 Billion Capital Request for 2018-20202
October 31, 2017 32
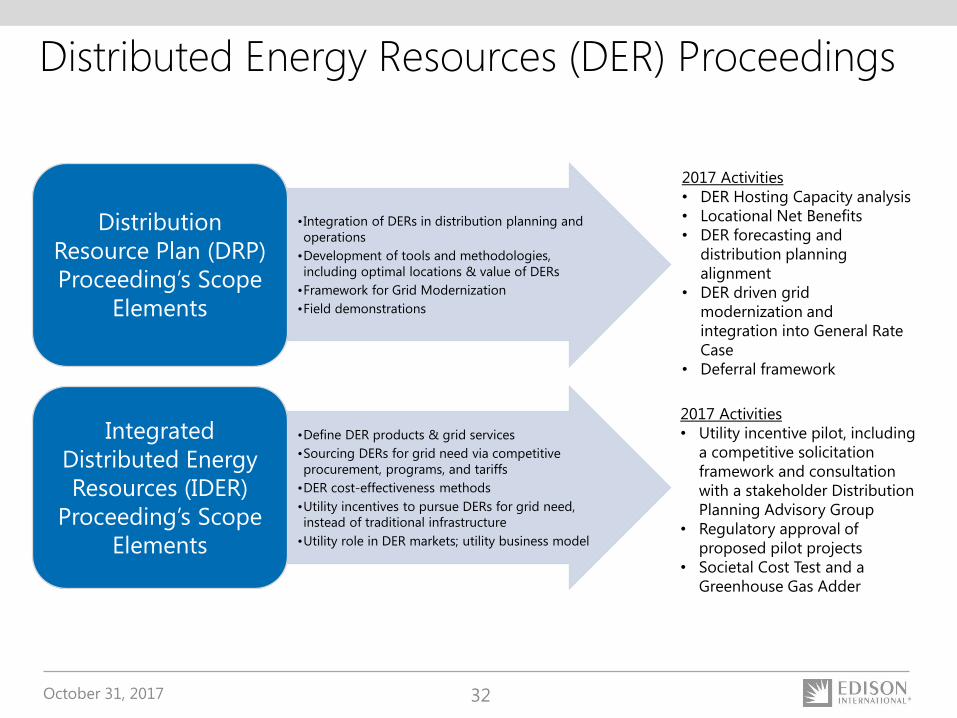
Distributed Energy Resources (DER) Proceedings
2017 Activities
• Utility incentive pilot, including
a competitive solicitation
framework and consultation
with a stakeholder Distribution
Planning Advisory Group
• Regulatory approval of
proposed pilot projects
• Societal Cost Test and a
Greenhouse Gas Adder
2017 Activities
• DER Hosting Capacity analysis
• Locational Net Benefits
• DER forecasting and
distribution planning
alignment
• DER driven grid
modernization and
integration into General Rate
Case
• Deferral framework
•Integration of DERs in distribution planning and
operations
•Development of tools and methodologies,
including optimal locations & value of DERs
•Framework for Grid Modernization
•Field demonstrations
Distribution
Resource Plan (DRP)
Proceeding’s Scope
Elements
•Define DER products & grid services
•Sourcing DERs for grid need via competitive
procurement, programs, and tariffs
•DER cost-effectiveness methods
•Utility incentives to pursue DERs for grid need,
instead of traditional infrastructure
•Utility role in DER markets; utility business model
Integrated
Distributed Energy
Resources (IDER)
Proceeding’s Scope
Elements
October 31, 2017 33
2016
29,141
41,565
7,056
4,645
1,776
84,183
1,794
85,977
4,417,340
565,222
10,445
46,133
21,233
133
22
5,060,528
38,076
23,091
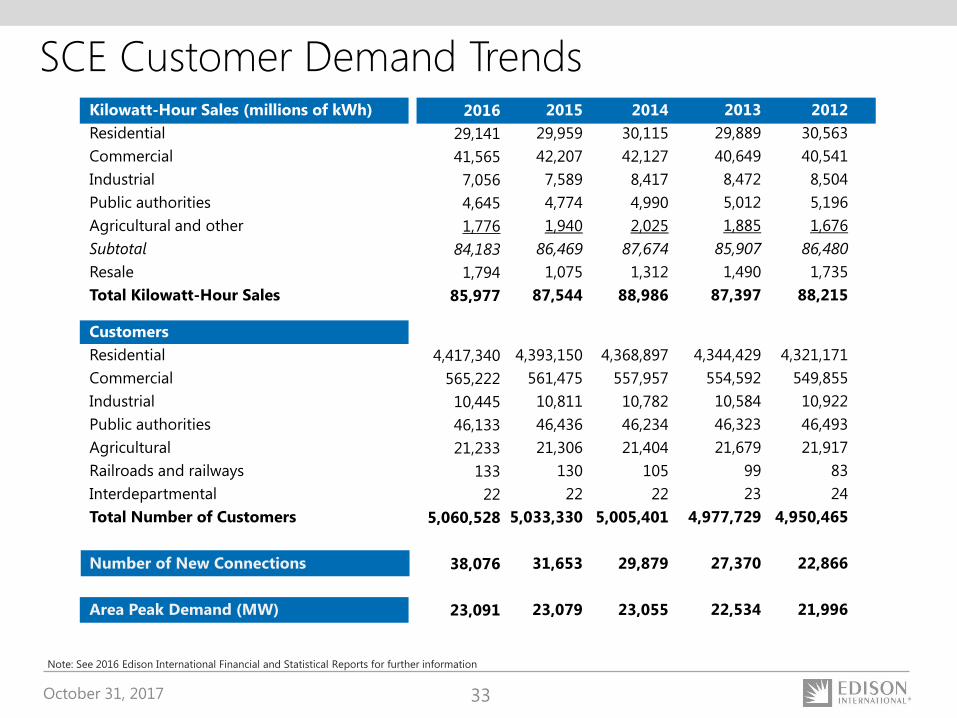
SCE Customer Demand TrendsKilowatt-Hour Sales (millions of kWh)
Residential
Commercial
Industrial
Public authorities
Agricultural and other
Subtotal
Resale
Total Kilowatt-Hour Sales
Customers
Residential
Commercial
Industrial
Public authorities
Agricultural
Railroads and railways
Interdepartmental
Total Number of Customers
Number of New Connections
Area Peak Demand (MW)
2012
30,563
40,541
8,504
5,196
1,676
86,480
1,735
88,215
4,321,171
549,855
10,922
46,493
21,917
83
24
4,950,465
22,866
21,996
2013
29,889
40,649
8,472
5,012
1,885
85,907
1,490
87,397
4,344,429
554,592
10,584
46,323
21,679
99
23
4,977,729
27,370
22,534
Note: See 2016 Edison International Financial and Statistical Reports for further information
2014
30,115
42,127
8,417
4,990
2,025
87,674
1,312
88,986
4,368,897
557,957
10,782
46,234
21,404
105
22
5,005,401
29,879
23,055
2015
29,959
42,207
7,589
4,774
1,940
86,469
1,075
87,544
4,393,150
561,475
10,811
46,436
21,306
130
22
5,033,330
31,653
23,079
October 31, 2017 34
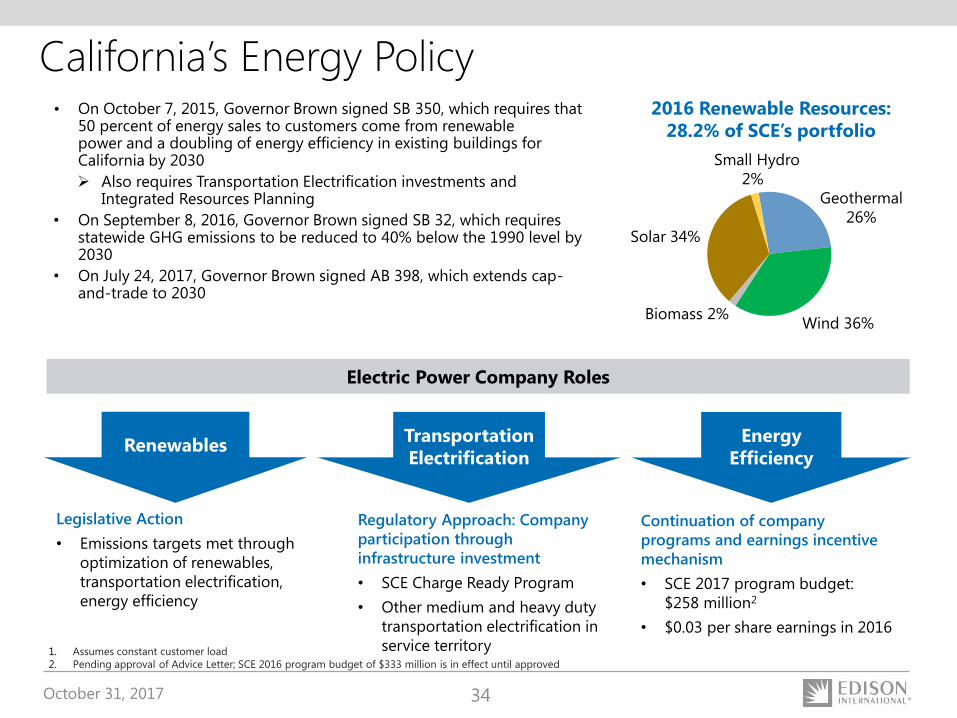
California’s Energy Policy• On October 7, 2015, Governor Brown signed SB 350, which requires that
50 percent of energy sales to customers come from renewable power and a doubling of energy efficiency in existing buildings for California by 2030
Also requires Transportation Electrification investments and Integrated Resources Planning
• On September 8, 2016, Governor Brown signed SB 32, which requires statewide GHG emissions to be reduced to 40% below the 1990 level by 2030
• On July 24, 2017, Governor Brown signed AB 398, which extends cap-and-trade to 2030
RenewablesTransportation
Electrification
Energy
Efficiency
Legislative Action
• Emissions targets met through
optimization of renewables,
transportation electrification,
energy efficiency
Regulatory Approach: Company
participation through
infrastructure investment
• SCE Charge Ready Program
• Other medium and heavy duty
transportation electrification in
service territory
Continuation of company
programs and earnings incentive
mechanism
• SCE 2017 program budget:
$258 million2
• $0.03 per share earnings in 2016
Electric Power Company Roles
Solar 34%
Small Hydro
2%
Geothermal
26%
Wind 36%
2016 Renewable Resources:
28.2% of SCE’s portfolio
Biomass 2%
1. Assumes constant customer load
2. Pending approval of Advice Letter; SCE 2016 program budget of $333 million is in effect until approved

October 31, 2017 35
SCE 2017 Bundled Revenue Requirement
Note: Rates in effect as of June 1, 2017. Represents bundled service which excludes Direct Access customers that do not receive generation services
SCE Systemwide Average Rate History (¢/kWh)
2010 2011 2012 2013 2014 2015 2016 2017
14.3 14.1 14.3 15.9 16.7 16.2 14.8 15.7
Fuel & Purchased Power
(45%)
Distribution
(39%)
Transmission (9%)
Generation
(9%)
Other (-2%)
2017 Bundled
Revenue
Requirement
$millions ¢/kWh
Fuel & Purchased Power – includes CDWR Bond Charge 5,130 7.1
Distribution – poles, wires, substations, service centers; Edison
SmartConnect®
4,386 6.1
Generation – owned generation investment and O&M 1,075 1.5
Transmission – greater than 220kV 1,064 1.5
Other – CPUC and legislative public purpose programs, system
reliability investments, nuclear decommissioning, and prior-
year over collections
(340) (0.4)
Total Bundled Revenue Requirement ($millions) $11,315
Bundled kWh (millions) 71,961
= Bundled Systemwide Average Rate (¢/kWh) 15.7¢
October 31, 2017 36
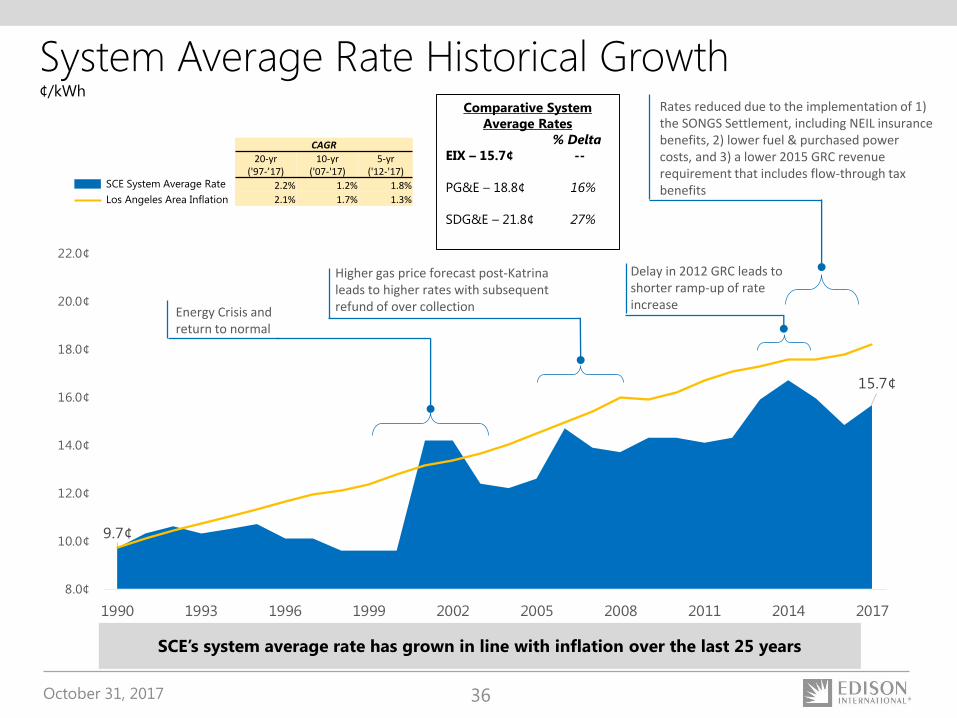
9.7¢
15.7¢
8.0¢
10.0¢
12.0¢
14.0¢
16.0¢
18.0¢
20.0¢
22.0¢
1990 1993 1996 1999 2002 2005 2008 2011 2014 2017
¢/kWh
System Average Rate Historical Growth
SCE’s system average rate has grown in line with inflation over the last 25 years
SCE System Average Rate
Los Angeles Area Inflation
Comparative System
Average Rates
% Delta
EIX – 15.7¢ --
PG&E – 18.8¢ 16%
SDG&E – 21.8¢ 27%
CAGR
20-yr('97-’17)
10-yr('07-'17)
5-yr('12-'17)
2.2% 1.2% 1.8%
2.1% 1.7% 1.3%
Energy Crisis and return to normal
Higher gas price forecast post-Katrina leads to higher rates with subsequent refund of over collection
Delay in 2012 GRC leads to shorter ramp-up of rate increase
Rates reduced due to the implementation of 1) the SONGS Settlement, including NEIL insurance benefits, 2) lower fuel & purchased power costs, and 3) a lower 2015 GRC revenue requirement that includes flow-through tax benefits

October 31, 2017 37
• An Order Instituting Rulemaking (OIR R.17-06-
026) was opened on June 29, 2017 to review,
revise, and consider alternatives to the “Power
Charge Indifference Adjustment” or PCIA
While not an impact on earnings, for every
1% of departing load, $6 million is shifted to
other customers remaining in the system
• Assembly Bill 1171 permits cities and counties or
a Joint Powers Agency (JPA) to act as CCAs to
purchase and sell electricity on behalf of the
utility customers within their jurisdiction
• Currently approximately 2% of SCE’s customer
load has submitted an implementation plan to
the CPUC for approval
1. AB 117 was introduced into the Assembly 1/22/2001 by Assembly member Migden, chaptered into law 9/24/2002
2. Track 1 refers to PCIA exemptions for care and medical baseline; Track 2 refers to evaluation and possible modification of the PCIA methodology
Investor-Owned Utility
(IOU)
Community Choice Aggregation
(CCA)
Track 12: Opening Briefs due
Track 22: Review current PCIA
Q4 2017 Q1 2018 Q2 2018 Q3 2018
Track 1: Reply briefs due
Track 2: File testimony
Track 1: Proposed decision
Track 2: File opening briefs Track 2: Proposed decision
Community Choice Aggregation (CCA) Overview
PCIA OIR Timeline (R. 17-06-026)
40-50 percent of SCE’s electric load could be part of a CCA by 2025
October 31, 2017 38
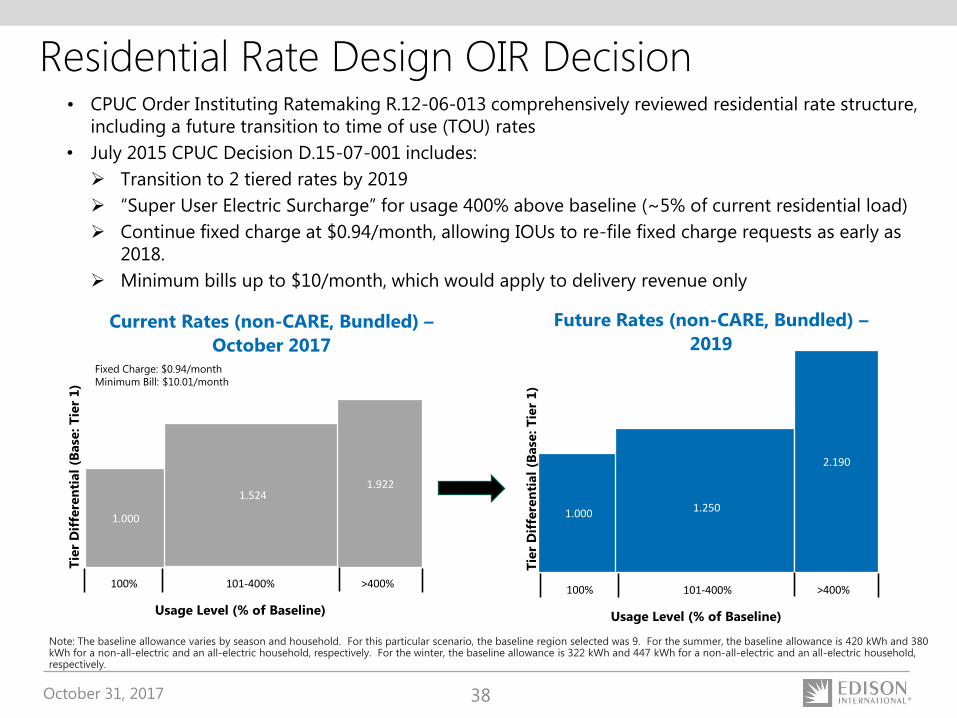
Residential Rate Design OIR Decision• CPUC Order Instituting Ratemaking R.12-06-013 comprehensively reviewed residential rate structure,
including a future transition to time of use (TOU) rates
• July 2015 CPUC Decision D.15-07-001 includes:
Transition to 2 tiered rates by 2019
“Super User Electric Surcharge” for usage 400% above baseline (~5% of current residential load)
Continue fixed charge at $0.94/month, allowing IOUs to re-file fixed charge requests as early as
2018.
Minimum bills up to $10/month, which would apply to delivery revenue only
Current Rates (non-CARE, Bundled) –
October 2017
Future Rates (non-CARE, Bundled) –
2019
Note: The baseline allowance varies by season and household. For this particular scenario, the baseline region selected was 9. For the summer, the baseline allowance is 420 kWh and 380 kWh for a non-all-electric and an all-electric household, respectively. For the winter, the baseline allowance is 322 kWh and 447 kWh for a non-all-electric and an all-electric household, respectively.
1.000
2.190
100% 101-400% >400%
1.250
Usage Level (% of Baseline)Usage Level (% of Baseline)
1.000
1.5241.922
100% 101-400% >400%
Tie
r D
iffe
ren
tial
(Base
: T
ier
1)
Fixed Charge: $0.94/month
Minimum Bill: $10.01/month
Tie
r D
iffe
ren
tial
(Base
: T
ier
1)

October 31, 2017 39
SCE Net Metering Rate StructureNEM Rate Developments:
• NEM allowed residential customers to receive full-retail rate credit
for exported generation and use these credits to offset energy
purchased from the electric power company, leading to a cost-shift
to non-NEM customers
Through tiered rate flattening, Residential Rate OIR decision
was expected to reduce subsidy by about 20%
• Current NEM tariff ended on July 1, 2017
Customers on current tariff grandfathered for 20 years
• In January 2016, CPUC voted (3-2) to adopt a successor to the
current NEM tariff
• PG&E, SDG&E, SCE, and TURN filed Applications for Re-hearing
(AFRs) on March 7, 2016; Solar Parties filed protest responses to the
AFRs on March 21, 2016; CPUC denied parties’ AFRs on September
22, 2016
SCE Net Energy Metering Statistics (September 2017):
• 242,198 combined residential and non-residential projects – 2,010
MW installed (of 2,240 MW cap)
99.7% solar
236,423 residential – 1,261 MW
5,775 non-residential – 748 MW
Approximately 3,664,152 MWh/year generated
7¢
22₵15₵
0
5
10
15
20
25
¢/kW
h
Solar Subsidies
(Illustrative)
Avoided
Generation(excludes RPS
Premium)
Subsidy Paid by
Residential
Ratepayers [1]
Equivalent
Solar Offset
1. Subsidy Paid by non-Residential Ratepayers estimated to be lower than that paid by Residential Ratepayers. For instance, the Equivalent Solar Offset, system-wide, is
approximately 15¢/kWh (a low ballpark figure), making the Subsidy Paid by non-NEM Ratepayers, system-wide, roughly 8¢/kWh. Exact figures pending analysis

October 31, 2017 40
Note: NEM solar installations in SCE service territory include projects with solar PV only less than 1 MW
Residential Solar Installations in SCE Territory
July 1, 2017
• Official start of NEM successor tariff; customers are subject to:
Mandatory Time-Of-Use rate
Non-bypassable charges
Application fees
July 31, 2017
• Residential customers who meet this deadline are grandfathered for current Time-of-use periods for maximum of 5 years (10 for non-residential)
September 9, 2017
• Smart Inverters required on all solar installations
2019
• Commission to revisit NEM Successor Tariff
Key DatesMonthly Installations and MW Installed
0
5
10
15
20
25
30
35
40
0
1000
2000
3000
4000
5000
6000
7000
2010 2011 2012 2013 2014 2015 2016 2017
MW
Inst
alle
d
Nu
mb
er o
f R
esid
enti
al I
nst
alla
tio
ns
Installations MW

October 31, 2017 41
SCE Rates and Bills Comparison
SCE’s average residential rates are above national average,
but residential bills are below national average due to lower usage
• SCE’s residential rates are above national average due, in part, to a cleaner fuel mix. Costs for low carbon energy are higher than those of high-carbon sources
• Average monthly residential bills are substantially lower than national average. Higher rate levels are offset by lower usage
Lower SCE residential customer usage than national average, from mild climate and higher energy efficiency building standards
Key FactorsKey Factors
Source: EIA's Form 826 Data Monthly Electric Utility Sales and Revenue Data for 12 months up through July 2017. https://www.eia.gov/electricity/data/eia861m/index.html
13.0 ₵
16.2 ₵
US Average SCE
25% Higher
2016-17 Average Residential Rates
(¢/kWh)
2016-17 Average Residential Bills
($ per Month)
$124
$92
US Average SCE
26% Lower

October 31, 2017 42
Third Quarter Earnings SummaryQ3
2017Q3
2016(*)Variance
Basic Earnings Per Share (EPS)
SCE $ 1.43 $ 1.34 $ 0.09
EIX Parent & Other 0.01 (0.05) 0.06
Discontinued Operations — — —
Basic EPS $ 1.44 $ 1.29 $ 0.15
Less: Non-core Items
SCE $ — $ — $ —
EIX Parent & Other — — —
Discontinued Operations — — —
Total Non-core $ — $ — $ —
Core Earnings Per Share (EPS)
SCE $ 1.43 $ 1.34 $ 0.09
EIX Parent & Other 0.01 (0.05) 0.06
Core EPS $ 1.44 $ 1.29 $ 0.15
Key SCE EPS Drivers
Revenue 1,2 $ 0.18
- CPUC - Escalation 0.11
- CPUC - Other 0.05
- Other operating revenue 0.02
Higher O&M (0.01)
Higher net financing costs (0.01)
- AFUDC (Equity & Debt) 0.02
- Interest Expense (0.03)
Income tax 2 (0.06)
Other (0.01)
- Property and Other Taxes (0.02)
- Other Income and Expenses 0.01
Total core drivers 0.09
Non-core items —
Total $ 0.09
Key EIX EPS Drivers
EIX parent — Income taxes and other $ 0.03
EEG — Income taxes and other 0.03
Total core drivers 0.06
Non-core items —
Total $ 0.06
(*) 2016 earnings was updated to reflect the implementation of the accounting standard for share-based payments effective January 1, 2016
1. Excludes San Onofre revenue of ($0.01) which was offset by property taxes of $0.01
2. Excludes higher income tax benefits for incremental tax repair deductions, pole-loading program-based cost of removal and tax accounting method changes : $0.41
October 31, 2017 43
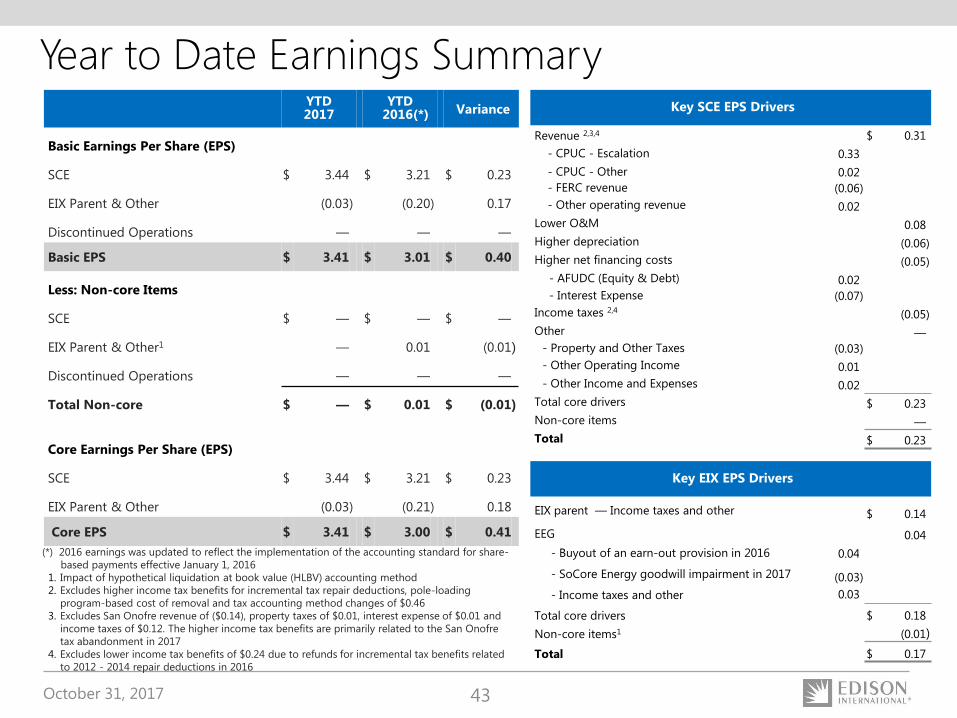
Year to Date Earnings SummaryYTD 2017
YTD 2016(*) Variance
Basic Earnings Per Share (EPS)
SCE $ 3.44 $ 3.21 $ 0.23
EIX Parent & Other (0.03) (0.20) 0.17
Discontinued Operations — — —
Basic EPS $ 3.41 $ 3.01 $ 0.40
Less: Non-core Items
SCE $ — $ — $ —
EIX Parent & Other1 — 0.01 (0.01)
Discontinued Operations — — —
Total Non-core $ — $ 0.01 $ (0.01)
Core Earnings Per Share (EPS)
SCE $ 3.44 $ 3.21 $ 0.23
EIX Parent & Other (0.03) (0.21) 0.18
Core EPS $ 3.41 $ 3.00 $ 0.41
Key SCE EPS Drivers
Revenue 2,3,4 $ 0.31
- CPUC - Escalation 0.33
- CPUC - Other 0.02
- FERC revenue (0.06)
- Other operating revenue 0.02
Lower O&M 0.08
Higher depreciation (0.06)
Higher net financing costs (0.05)
- AFUDC (Equity & Debt) 0.02
- Interest Expense (0.07)
Income taxes 2,4 (0.05)
Other —
- Property and Other Taxes (0.03)
- Other Operating Income 0.01
- Other Income and Expenses 0.02
Total core drivers $ 0.23
Non-core items —
Total $ 0.23
Key EIX EPS Drivers
EIX parent — Income taxes and other $ 0.14
EEG 0.04
- Buyout of an earn-out provision in 2016 0.04
- SoCore Energy goodwill impairment in 2017 (0.03)
- Income taxes and other 0.03
Total core drivers $ 0.18
Non-core items1 (0.01)
Total $ 0.17
(*) 2016 earnings was updated to reflect the implementation of the accounting standard for share-
based payments effective January 1, 2016
1. Impact of hypothetical liquidation at book value (HLBV) accounting method
2. Excludes higher income tax benefits for incremental tax repair deductions, pole-loading
program-based cost of removal and tax accounting method changes of $0.46
3. Excludes San Onofre revenue of ($0.14), property taxes of $0.01, interest expense of $0.01 and
income taxes of $0.12. The higher income tax benefits are primarily related to the San Onofre
tax abandonment in 2017
4. Excludes lower income tax benefits of $0.24 due to refunds for incremental tax benefits related
to 2012 - 2014 repair deductions in 2016

October 31, 2017 44
$6,305
—
1,977
1,915
334
—
4,226
2,079
(525)
64
1,618
507
1,111
113
$998
$5,180
4,266
913
—
—
—
5,179
1
(1)
—
—
—
—
—
$—
$11,485
4,266
2,890
1,915
334
—
9,405
2,080
(526)
64
1,618
507
1,111
113
$998
(370)
$1,368
SCE Annual Results of Operations• Earning activities – revenue authorized by CPUC and FERC to provide reasonable cost recovery and return on investment
• Cost-recovery activities – CPUC- and FERC-authorized balancing accounts to recover specific project or program costs, subject to reasonableness review or compliance with upfront standards
Earning
Activities
Cost-
Recovery
Activities
Total
Consolidated
2016
Earning
Activities
Cost-
Recovery
Activities
Total
Consolidated
2015
Operating revenue
Purchased power and fuel
Operation and maintenance
Depreciation, decommissioning and amortization
Property and other taxes
Impairment and other charges
Total operating expenses
Operating income
Interest expense
Other income and expenses
Income before income taxes
Income tax expense
Net income
Preferred and preference stock dividend
requirements
Net income available for common stock
Less: Non-core earnings
Core Earnings
Note: See Use of Non-GAAP Financial Measures
($ millions)
$6,504
—
1,939
1,998
351
—
4,288
2,216
(540)
79
1,755
256
1,499
123
$1,376
$5,326
4,527
798
—
—
—
5,325
1
(1)
—
—
—
—
—
$—
$11,830
4,527
2,737
1,998
351
—
9,613
2,217
(541)
79
1,755
256
1,499
123
$1,376
—
$1,376
October 31, 2017 45
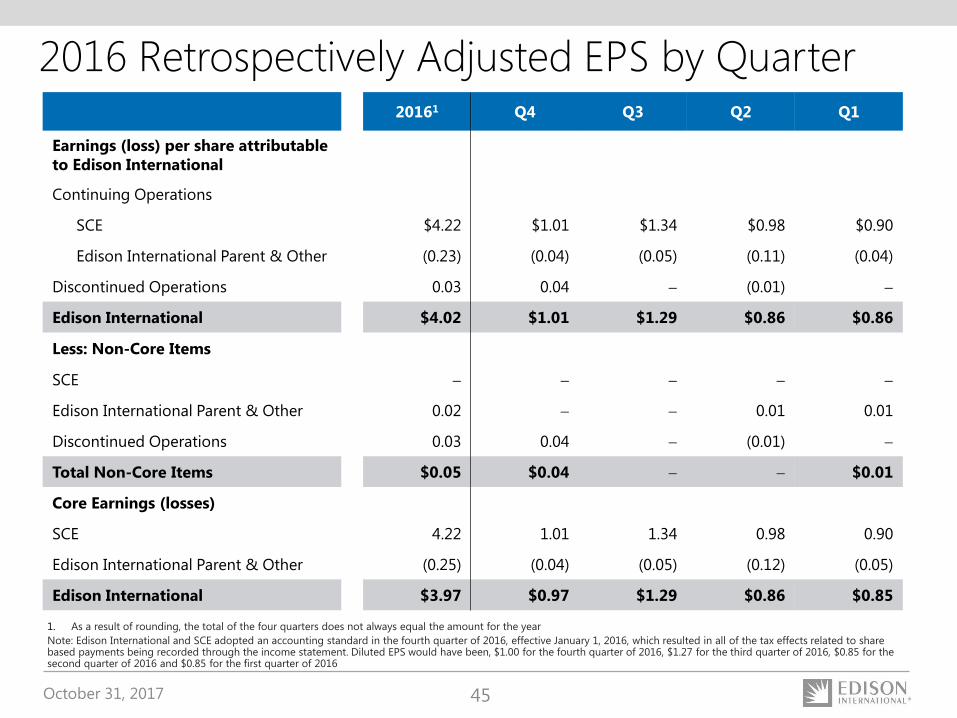
2016 Retrospectively Adjusted EPS by Quarter20161 Q4 Q3 Q2 Q1
Earnings (loss) per share attributable
to Edison International
Continuing Operations
SCE $4.22 $1.01 $1.34 $0.98 $0.90
Edison International Parent & Other (0.23) (0.04) (0.05) (0.11) (0.04)
Discontinued Operations 0.03 0.04 (0.01)
Edison International $4.02 $1.01 $1.29 $0.86 $0.86
Less: Non-Core Items
SCE
Edison International Parent & Other 0.02 0.01 0.01
Discontinued Operations 0.03 0.04 (0.01)
Total Non-Core Items $0.05 $0.04 $0.01
Core Earnings (losses)
SCE 4.22 1.01 1.34 0.98 0.90
Edison International Parent & Other (0.25) (0.04) (0.05) (0.12) (0.05)
Edison International $3.97 $0.97 $1.29 $0.86 $0.85
1. As a result of rounding, the total of the four quarters does not always equal the amount for the year
Note: Edison International and SCE adopted an accounting standard in the fourth quarter of 2016, effective January 1, 2016, which resulted in all of the tax effects related to share based payments being recorded through the income statement. Diluted EPS would have been, $1.00 for the fourth quarter of 2016, $1.27 for the third quarter of 2016, $0.85 for the second quarter of 2016 and $0.85 for the first quarter of 2016
October 31, 2017 46
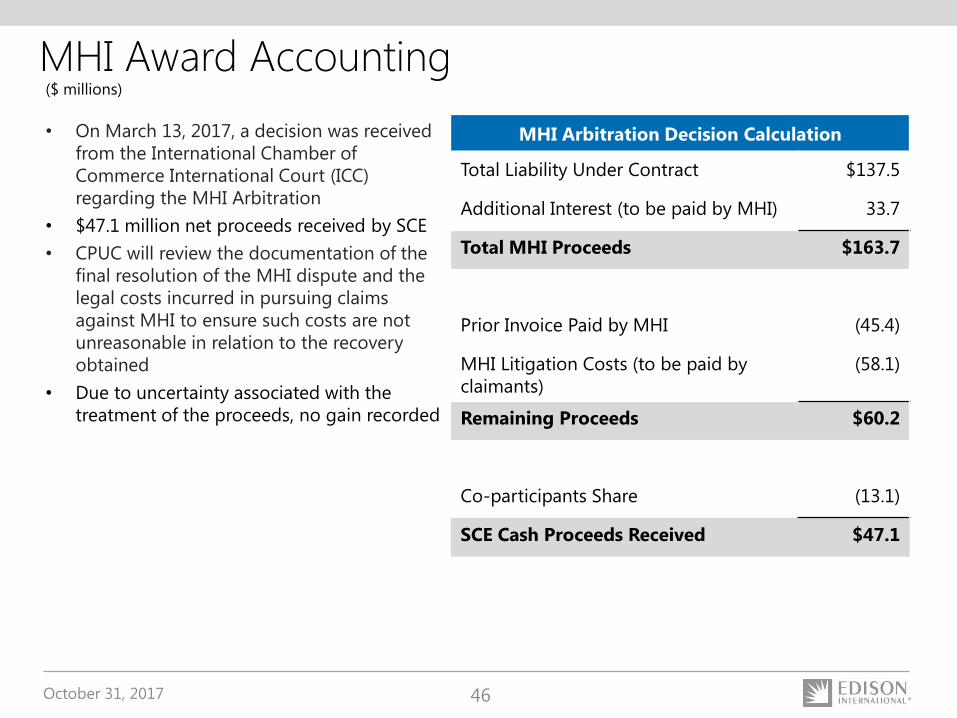
MHI Award Accounting
• On March 13, 2017, a decision was received
from the International Chamber of
Commerce International Court (ICC)
regarding the MHI Arbitration
• $47.1 million net proceeds received by SCE
• CPUC will review the documentation of the
final resolution of the MHI dispute and the
legal costs incurred in pursuing claims
against MHI to ensure such costs are not
unreasonable in relation to the recovery
obtained
• Due to uncertainty associated with the
treatment of the proceeds, no gain recorded
MHI Arbitration Decision Calculation
Total Liability Under Contract $137.5
Additional Interest (to be paid by MHI) 33.7
Total MHI Proceeds $163.7
Prior Invoice Paid by MHI (45.4)
MHI Litigation Costs (to be paid by
claimants)
(58.1)
Remaining Proceeds $60.2
Co-participants Share (13.1)
SCE Cash Proceeds Received $47.1
($ millions)
October 31, 2017 47
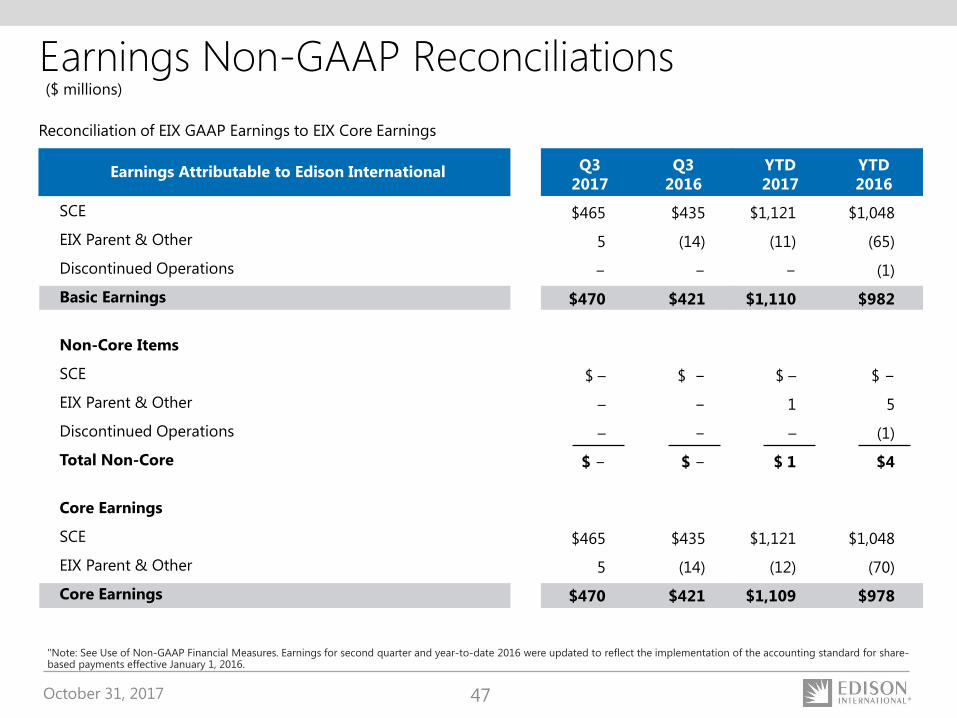
Earnings Non-GAAP Reconciliations
"Note: See Use of Non-GAAP Financial Measures. Earnings for second quarter and year-to-date 2016 were updated to reflect the implementation of the accounting standard for share-based payments effective January 1, 2016.
($ millions)
Reconciliation of EIX GAAP Earnings to EIX Core Earnings
SCE
EIX Parent & Other
Discontinued Operations
Basic Earnings
Non-Core Items
SCE
EIX Parent & Other
Discontinued Operations
Total Non-Core
Core Earnings
SCE
EIX Parent & Other
Core Earnings
Earnings Attributable to Edison International
$435
(14)
−
$421
$ −
−
−
$ −
$435
(14)
$421
$465
5
−
$470
$ –
–
–
$ −
$465
5
$470
Q3
2016
Q3
2017
$1,048
(65)
(1)
$982
$ −
5
(1)
$4
$1,048
(70)
$978
$1,121
(11)
−
$1,110
$ –
1
–
$ 1
$1,121
(12)
$1,109
YTD
2016
YTD
2017
October 31, 2017 48
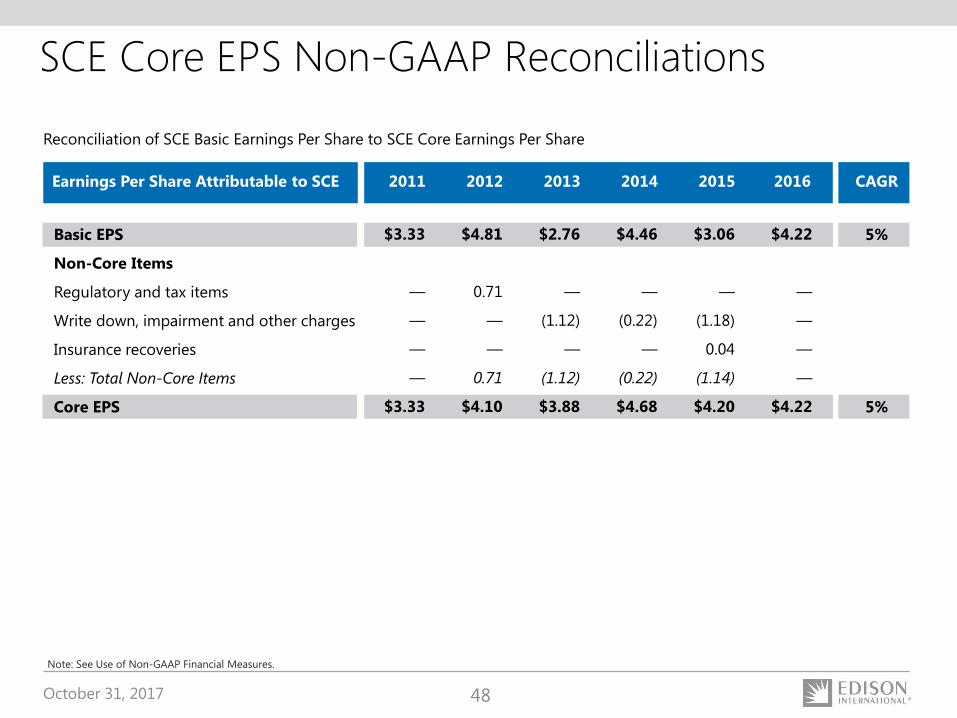
SCE Core EPS Non-GAAP Reconciliations
Basic EPS
Non-Core Items
Regulatory and tax items
Write down, impairment and other charges
Insurance recoveries
Less: Total Non-Core Items
Core EPS
Reconciliation of SCE Basic Earnings Per Share to SCE Core Earnings Per Share
5%
5%
$3.33
—
—
—
—
$3.33
$4.81
0.71
—
—
0.71
$4.10
$2.76
—
(1.12)
—
(1.12)
$3.88
Note: See Use of Non-GAAP Financial Measures.
$4.46
—
(0.22)
—
(0.22)
$4.68
$3.06
—
(1.18)
0.04
(1.14)
$4.20
Earnings Per Share Attributable to SCE CAGR2011 2012 2013 2014 2015
$4.22
—
—
—
—
$4.22
2016

October 31, 2017 49
Use of Non-GAAP Financial MeasuresEdison International's earnings are prepared in accordance with generally accepted accounting principles used in the United States. Management uses core earnings internally for financial planning and for analysis of performance. Core earnings are also used when communicating with investors and analysts regarding Edison International's earnings results to facilitate comparisons of the Company's performance from period to period. Core earnings are a non-GAAP financial measure and may not be comparable to those of other companies. Core earnings (or losses) are defined as earnings or losses attributable to Edison International shareholders less income or loss from discontinued operations and income or loss from significant discrete items that management does not consider representative of ongoing earnings, such as: exit activities, including sale of certain assets, and other activities that are no longer continuing; asset impairments and certain tax, regulatory or legal settlements or proceedings.
A reconciliation of Non-GAAP information to GAAP information is included either on the slide where the information appears or on another slide referenced in this presentation.
EIX Investor Relations Contact
Sam Ramraj, Vice President (626) 302-2540 [email protected]
Allison Bahen, Senior Manager (626) 302-5493 [email protected]