
Business Solutions Carbon Psychology report - Npower · Business Solutions Disclaimer Whilst ......
48
Business Solutions Quarterly report Summer 2015 Business Solutions
Transcript of Business Solutions Carbon Psychology report - Npower · Business Solutions Disclaimer Whilst ......

Business SolutionsQuarterly report
Summer 2015
BusinessSolutions

Business SolutionsQuarterly report
Summer 2015
BusinessSolutions
DisclaimerWhilst every effort has been made to ensure the accuracy of the material in this document, neither Centre for Economics and Business Research Ltd nor the report’s authors will be liable for any loss or damages incurred through the use of the report.
Authorship and acknowledgementsThis report has been produced by Cebr, an independent economics and business research consultancy established in 1992. The views expressed herein are those of the authors only and are based upon independent research by them.London,
September 2016
2
The Power of Carbon Psychology

Business SolutionsQuarterly report
Summer 2015
BusinessSolutions
Executive Summary ..................................................................................................................4
1 Introduction .................................................................................................................6
1.1 Background and aims of the study .......................................................................7
1.2 Structure of the report ..............................................................................................7
2 Scope ..............................................................................................................................8
2.1 Scope of the study and analysis ............................................................................9
2.2 Overview of approach and methodology ...........................................................9
3 Recent UK performance in energy intensity ................................................10
3.1 Comparing energy intensity across European countries..............................11
4 The UK record in promoting energy efficiency ..........................................16
4.1 R&D expenditure and energy efficiency .............................................................17
4.2 Energy policy ................................................................................................................19
5 Review of the evidence on behavioural change .........................................24
5.1 Behavioural change and energy savings ............................................................25
5.2 Combining technological changes with behavioural change ......................26
5.3 Behavioural change and the opportunity for businesses .............................27
5.4 Existing focus on behavioural change, households and SMEs ...................29
6 Business savings from behavioural change .................................................30
6.1 Overview of the methodology ................................................................................32
6.2 Results .............................................................................................................................33
Concluding remarks ..................................................................................................................38
Annex A: Potential business savings methodology ..................................................40
Contents
A Report for npower Business Solutions
3

Business SolutionsQuarterly report
Summer 2015
BusinessSolutions
Executive Summary
The Power of Carbon Psychology
4

Business SolutionsQuarterly report
Summer 2015
BusinessSolutions
Evidence suggests that businesses investing in energy efficiency do not just experience reductions in costs over the long run, but also help shield themselves against future uncertainties around energy prices. In addition, other potential benefits include greater profitability, higher retention of employees and stronger “green” credentials when seeking public sector contracts. In order to assess the UK’s record on energy efficiency and estimating savings from behavioural change, the study combines evidence and insights from macroeconomic and business-level data, policy evaluation information and academic literature. We have drawn upon data and insights from the former Department of Energy and Climate Change (DECC) and other bodies such as the European Energy Agency (EEA). We find that:
• Recent studies and evidence suggest that behavioural change can be effective in raising business energy efficiency. Whilst schemes such as the Energy Savings Opportunity Scheme (ESOS) and the roll-out of smart-meters are welcome, there is scope for greater promotion of behavioural change amongst larger businesses. Moreover, there is evidence to suggest that a combination of technological improvements and measures to promote behavioural change will be most successful in raising energy efficiency amongst UK businesses. Potential savings suggested by the literature could be as high as 20%, depending on the number and type of behavioural change measures used.
• In terms of promoting energy efficiency through Research and Development (R&D) expenditure, the UK has a mixed
record. As a share of its GDP, the UK is estimated to have spent 0.05% on energy efficiency R&D in 2013; this compares favourably to some countries such as Norway (0.01%) but less so with countries such as Finland (0.13%) and Germany (0.06%). The UK however performs more strongly if expenditure
on energy efficiency is expressed as a share of total energy R&D, committing around 30% if using this measure, against France (15%) and the US (21%).
• Using an approach based on the number of employees in UK businesses, we present a central esti-mate of just over £600 million of potential savings that could be achieved by UK businesses fostering behavioural change among their employees, of which over a third (£270 million) could be achieved by large businesses alone. As an upper limit, we estimate that potential business savings of just under
£860 million could be achieved, of which £460 million could be achieved by large businesses.
• To place these potential business savings in context, savings of £270 million equate to electricity sav-ings of just over 2,700 Gigawatt hours
(GWh), or a 0.5% reduction in total energy purchases by UK businesses. Potential savings from large businesses form a disproportionately high share of total savings under each of our scenarios.
• Within the potential business savings of £600 million, we estimate that the greatest scope for savings lies in the following sectors: Wholesale and Retail (£120 million), Manufacturing (£64 million), Administrative and Support services (£69 million) and the Professional, Scientific and Technical (£55 million).
Energy efficiency – the ability to deliver the same output or services with lower energy input – is increasingly a goal for governments, businesses and households. In an environment of rising and volatile energy costs, as well as increased uncertainty over the UK’s capacity of electricity generation over the next decade, the potential gains from energy efficiency have taken on even greater significance. This study focuses on the UK’s recent record in promoting energy efficiency, both through resources committed to Research and Development (R&D) expenditure, and policy designed to encourage behavioural change amongst businesses. Cebr and npower Business Solutions (nBS) believe that more could be done to promote energy efficiency through behavioural change, particularly amongst larger businesses. Therefore this study also seeks to quantify the potential monetary savings that larger businesses could achieve by promoting behavioural change amongst employees.
5
A Report for npower Business Solutions
Business SolutionsQuarterly report
Summer 2015
BusinessSolutions
6
Introduction
The Power of Carbon Psychology

Energy efficiency does not only have a role in reducing the UK’s energy usage over the coming years; it adds value in the real economy as well. In 2013 the former Department of Energy and Climate Change (DECC)1 estimated that the UK energy efficiency sector was worth more than £18 billion and supported 136,000 jobs across the UK.2 The UK Government has sought and implemented new policies to build on the UK’s strong position as one of the most developed nations in the world with regards to energy efficiency. Such policies include the Green Deal, the Energy Company Obligation (ECO), the establishment of the Green Investment Bank, as well as the wider roll-out of smart meters across Great Britain. The Government is actively seeking to promote the use of energy efficient plant, machinery and technology. An example of this is the Energy Technology List (ETL), a government-managed list of energy-efficient plant and machinery, the use of which enables businesses to claim tax breaks through Enhanced Capital Allowances (ECA).
However, evidence and insight from a variety of sources suggests that there is scope for UK businesses – particularly
larger businesses – to contribute to higher levels of energy efficiency by promoting behavioural change amongst employees. “Behavioural change” is defined here as non-technical changes which result in greater energy efficiency, for the most part consisting of employees changing their habits or behaviour. Changes can be induced through training and information, either through feedback delivered on energy use, or through concerted, company-led efforts and initiatives to change energy use habits. Whilst the mode of delivering behavioural change will vary from company to company across different industrial sectors, it could for example consist of:
• Better use of office and industrial equipment
• Reducing office room temperatures• Increased use of energy efficiency
dashboards, providing real-time data on energy use
• Introducing Knowledge Performance Indicators (KPIs) to track energy efficiency
• Greater use of performance management concerning energy use
• Switching-off idle office and industrial equipment
The primary objective of this study is to identify the energy savings that could result from behavioural change – in other words, the opportunity for the UK businesses across the UK.
A direct comparison of the energy efficiency savings that could be achieved through technology change versus behavioural change lies beyond the scope of this report. Investment in technology improvements will still be necessary to build on existing improvements in energy efficiency; but there are additional gains that could be achieved through behavioural change. Supporting this is an array of evidence to suggest that efficiency gains from technology change will be enhanced by behavioural change, and that energy efficiency measures are at their most effective when both measures are combined. Therefore the potential behavioural change savings that could be achieved by businesses – as estimated in this report to be substantial – are likely to be boosted further if combined with further technology improvements.
1.1 Background and aims of the study
1.2 Structure of the report
The Centre for Economics and Business Research (Cebr) and npower Business Solutions (nBS) have worked in partnership to produce this report, which examines the positive impact that behavioural change could have on businesses through energy savings. The primary objective of the report is to quantify the potential energy savings that UK businesses could achieve by successful embedding behavioural change amongst their employees.
The report is structured as follows:
• Section 2 sets out the scope of the report and analysis• Section 3 covers the UK record in energy intensity at a national, household and
industrial level• Section 4 examines the UK record in promoting energy efficiency through R&D
expenditure, as well as its policy record in implementing policy designed to elicit behavioural change
• Section 5 provides a review of the evidence concerning behavioural change and energy efficiency
• Section 6 examines the potential savings that UK businesses could make from promoting behavioural change amongst their employees.
• Annex A further details the approach and methodology used in Section 6.
Business SolutionsQuarterly report
Summer 2015
BusinessSolutions
7
A Report for npower Business Solutions
Business SolutionsQuarterly report
Summer 2015
BusinessSolutions
8
Scope
The Power of Carbon Psychology
Business SolutionsQuarterly report
Summer 2015
BusinessSolutions
Energy efficiency is an outcome in which a reduced amount of energy is needed to provide goods and services. The International Energy Agency (IEA) defines energy efficiency as “a way of managing and restraining the growth in energy consumption. Something is more energy efficient if it delivers more services for the same energy input, or the same services for less energy input.”3 In this context, it can be thought of as a business using less energy to provide the same level of output or service.4
There are many reasons for why different groups seek to promote
energy efficiency. For individuals, increasing energy efficiency by installing better insulation or using new Light Emitting Diode (LED) light bulbs can lower household energy bills. For businesses, reducing energy waste can also directly reduce their energy costs but is also linked with wider benefits such as increased cash flow and profitability, competitiveness and retention of employees. For governments, there are security and macroeconomic benefits as greater energy efficiency can help reduce reliance on energy imports and help control emissions.
To assess the UK’s record in promoting energy efficiency, the report draws upon macroeconomic and policy-level data from the IEA, the Office for National Statistics (ONS) and European-level sources. To examine the potential savings from behavioural change, the analysis also combines business-level data on businesses from the former Department for Business, Innovation and Skills (BIS), the former Department for Energy and Climate Change (DECC) and the Carbon Trust.
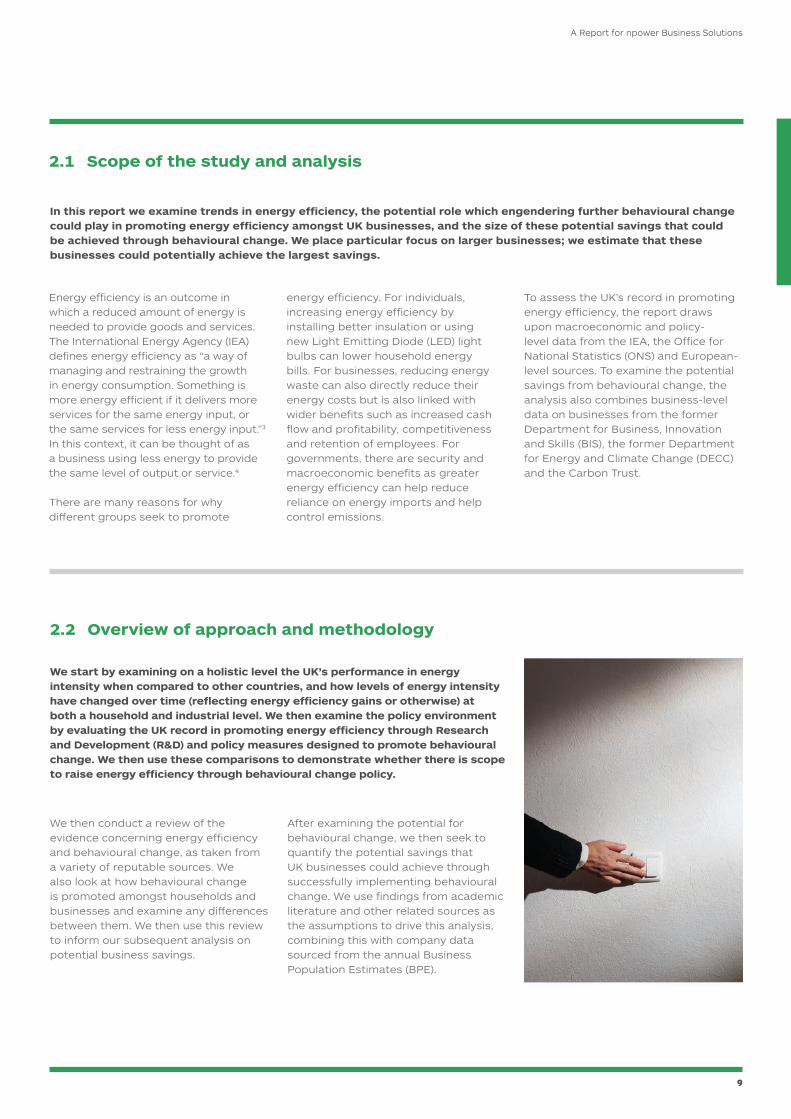
We then conduct a review of the evidence concerning energy efficiency and behavioural change, as taken from a variety of reputable sources. We also look at how behavioural change is promoted amongst households and businesses and examine any differences between them. We then use this review to inform our subsequent analysis on potential business savings.
After examining the potential for behavioural change, we then seek to quantify the potential savings that UK businesses could achieve through successfully implementing behavioural change. We use findings from academic literature and other related sources as the assumptions to drive this analysis, combining this with company data sourced from the annual Business Population Estimates (BPE).
We start by examining on a holistic level the UK’s performance in energy intensity when compared to other countries, and how levels of energy intensity have changed over time (reflecting energy efficiency gains or otherwise) at both a household and industrial level. We then examine the policy environment by evaluating the UK record in promoting energy efficiency through Research and Development (R&D) and policy measures designed to promote behavioural change. We then use these comparisons to demonstrate whether there is scope to raise energy efficiency through behavioural change policy.
2.1 Scope of the study and analysis
2.2 Overview of approach and methodology
In this report we examine trends in energy efficiency, the potential role which engendering further behavioural change could play in promoting energy efficiency amongst UK businesses, and the size of these potential savings that could be achieved through behavioural change. We place particular focus on larger businesses; we estimate that these businesses could potentially achieve the largest savings.
Business SolutionsQuarterly report
Summer 2015
BusinessSolutions
9
A Report for npower Business Solutions
Business SolutionsQuarterly report
Summer 2015
BusinessSolutions
10
Recent UK performance in
energy intensityIn this section we examine trends in energy intensity in
the UK at both a national and industrial level, comparing the UK position to that of other countries. This then
provides context for the remainder of the report, particularly for industrial energy efficiency.
The Power of Carbon Psychology

Headlines
Our analysis of energy intensity trends across European countries shows that:
3.1 Comparing energy intensity across European countries
• The UK has one of the lowest levels of energy intensity compared to other countries, comparing favourably to other countries such as France, Germany, Sweden and Italy. Total energy intensity across all sectors in the UK fell by around 30% between 2005 and 2014;
• However, the UK’s performance in reducing industrial energy intensity is more mixed. UK industrial energy intensity fell by 16% between 2005 and 2014, below the
European average of 18%. In addition, there is evidence to suggest the reductions in industrial energy intensity have slowed since 2007, particularly in the UK;
• The UK has experienced stronger performance in reducing household energy intensity, reducing this by 20% and only bettered by Belgium (34%) and far higher than the European average of 3%.
We start by identifying where the UK currently sits in terms of its energy intensity, as defined and measured
by gross consumption of energy divided by Gross Domestic Product (GDP). In Figure 1 below, we compare
rates of observed energy intensity across European countries between 2005 and 2014:
Figure 1: Gross inland consumption of energy divided by GDP (Kilowatt hour per €1,000) by European country
Source: Eurostat
> ! !
0
1000
2000
3000
4000
5000
6000
7000
Business SolutionsQuarterly report
Summer 2015
BusinessSolutions
11
2005 2014
A Report for npower Business Solutions
The UK has one of the lowest rates of energy intensity overall when compared to other European countries. In 2014 the UK consumed 1,112 Kilowatt (KWh) of energy for each €1,000 of GDP produced, with energy intensity having fallen from a rate of around 1,580 KWh in 2005. The UK position in 2014 compares favourably to that of countries such as Germany (1,330 KWh), France (1,400 KWh) and Finland (2,200 KWh); the least energy intense countries were Denmark (800 KWh) and Ireland (900 KWh). The UK has also experienced one of the highest reductions in energy intensity, a fall of 29.7% between 2005 and 2014; this compares to Ireland (27.4%), Germany (20.2%) and France (18.5%). The greatest reductions were in Lithuania (48.2%) and Slovakia (43.8%). The UK’s relatively low energy intensity is partly attributable to the UK’s greater reliance on services (as opposed to energy-intensive industry) but the IEA5 have also acknowledged improvements achieved in energy efficiency as a contributing factor.
The next step is to examine what has driven the improving UK trend in energy intensity during this period. Overall energy usage is typically
disaggregated into the sectors of industry, households, transport, and the tertiary sector (services). We examine country-by-country trends in energy intensity across the household and industrial sectors in the remainder of this section. For households, energy intensity can be measured by the average energy consumption per household (combining electricity and gas); this is the most commonly-used measure used by the EEA, the EIA and other bodies.
For industry, energy intensity can be measured by energy consumption per unit of Gross Value Added (GVA). GVA6 is a measure of the value from production in national accounts, representing the value of ‘industrial’ output less the value of the inputs used to produce that output. That is, it is the value of what is produced less the value of the intermediate goods and services used as inputs to produce it. So in this context, energy intensity broadly relates to the energy used to produce each additional unit of output.
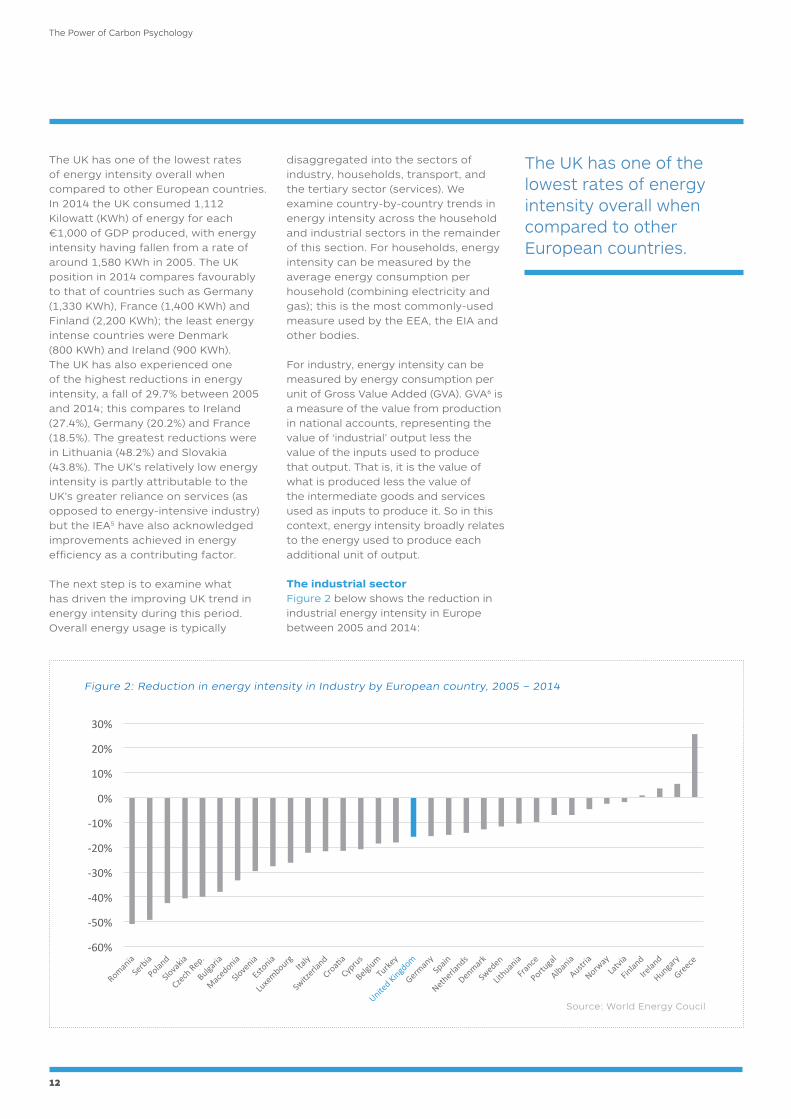
The industrial sectorFigure 2 below shows the reduction in industrial energy intensity in Europe between 2005 and 2014:
Figure 2: Reduction in energy intensity in Industry by European country, 2005 – 2014
Source: World Energy Coucil
-60%
-50%
-40%
-30%
-20%
-10%
0%
10%
20%
30%
The UK has one of the lowest rates of energy intensity overall when compared to other European countries.
12
The Power of Carbon Psychology

UK industrial energy intensity fell by around 16% in this period, comparable to Germany (15%) and Belgium (19%) but below the European average of approximately 18%. It is notable that not all countries have experienced a reduction in industrial energy intensity between 2005 and 2014; four countries – Finland, Ireland, Hungary and Greece – have actually experienced an increase in energy intensity (Greece in particular experienced a 26% rise in industrial energy intensity in this period).
The UK therefore appears to be in a relatively average position in terms of reductions in industrial energy intensity since 2005. There are however several factors that appear to have influenced the downward trend, not all of which relate to energy efficiency. BEIS7 have identified a shift in economic activity away from heavy, energy intensive
industries – particularly chemicals and iron and steel manufacturing – as a factor. In Europe, The French Environment and Energy Management Agency ADEME8, through its ODYYSEE MURE project, has identified a significant change in industrial energy intensity trends occurring in 2007. ADEME attribute this slowdown in the energy intensity of industry to contraction in construction activity across Europe. In addition, there has been an increase in the energy contribution of energy-intensive industry branches, particularly chemicals in the Netherlands and the UK.
Prior to 2007, industrial energy consumption across Europe was relatively stable as increased industrial activity was offset by energy savings. Since 2007, whilst energy consumption has fallen across all industrial branches, it is estimated that only around 25%
of the reduction in industrial energy consumption was related to energy savings; over half is instead attributed to a decrease in industrial activity following the so-called Great Recession. Reductions in industrial energy intensity have resulted from large equipment not operating to full capacity whilst consumption levels as a whole did not fall. As a result, energy savings are estimated to be 250% lower since 2007 than between 2000 and 2007. Figure 3 below shows trends across different countries in the pace of energy intensity reductions, split by the 2000 – 2007 and 2007 – 2013 periods. The UK is grouped in the category of countries in which reductions in energy intensity has been slower in recent years.
Figure 3: Trends in industry energy intensity across European countries, 2000-07 versus 2007-13
Source: World Energy Coucil
-8%
-6%
-4%
-2%
0%
2%
4%
%/y
ear
2000-2007 2007-2013
Rom
ania
Pola
ndBu
lgar
iaCr
oatia
Denm
ark
Port
ugal
Germ
any
Czec
h Re
p.Sl
ovak
iaSl
oven
ia UK
Belg
ium
Cypr
usIta
lyEs
tnia
Net
herla
nds
EUN
orw
aySp
ain
Lith
uani
aIre
land
Luxe
mbo
urg
Swed
enFr
ance
Aust
riaGr
eece
Hung
ary
Finl
and
Latv
iaAcceleration of energyintensity decrease
Slower intensitydecrease
Intensity increase
13
A Report for npower Business Solutions

The household sectorIn contrast to the industrial sector, the UK appears to have performed more strongly in comparison to other
countries in raising household energy efficiency in recent years. Figure 4 below shows the reduction in energy intensity
across households in different European countries between 2005 and 2014.
Average household use of energy in the UK fell by just over 20% in this period, comparable to Germany (15%) and Belgium (19%) and far in excess of the European average of approximately 3%. The European Environment Agency (EEA) estimate that half of the efficiency gains achieved through technological innovations in the household sector were offset by the increasing number of electrical appliances in use and larger homes.9 In its latest Energy Consumption in the UK publication, BEIS10 identify the increasing prevalence of energy efficient boilers and double glazing, as well as higher rates of cavity wall, solid wall and loft insulation, as factors driving downward pressure on household consumption and raising energy efficiency. Over the longer term, the gradual replacement of the older, poorly insulated housing stock with newer, more energy efficient homes is also expected to lower household consumption.
Behavioural change is also likely to have been a contributing factor to the reduction in household energy use; put simply, innovations such as LED bulbs
and more efficient boilers still need to be actively purchased by sufficient numbers of households (and used correctly) for efficiency gains to be realised. There is a wealth of evidence on the means by which households have and would be able to achieve savings through behavioural change. Using natural field experiments, Dolan and Metcalfe11 find that changing social “norms” can also change household energy behaviour. In one experiment in which households in Camden were shown their energy consumption compared against other households (a “descriptive norm”) and statement reporting on their energy use (an “injunctive norm”) as well as other information on their energy consumption. Social norms are found to reduce consumption 6% over a 15 month treatment period.
Separately, Abrahmse and Steg12 identify “perceived behavioural control” as being a key determinant of energy use and intention to reduce energy use. Perceive behavioural control is the extent to which households feel capable of conserving energy (for example, “I know how I can save energy”, or “I think it is
Figure 4: Reduction in average household energy usage by European country, 2005 – 2014
Source: World Energy Coucil
-40%
-30%
-20%
-10%
0%
10%
20%
30%
40%
14
The Power of Carbon Psychology
Smart meters and informative billing improve energy efficiency by empowering consumers to make better decisions and change behavior.
15
A Report for npower Business Solutions
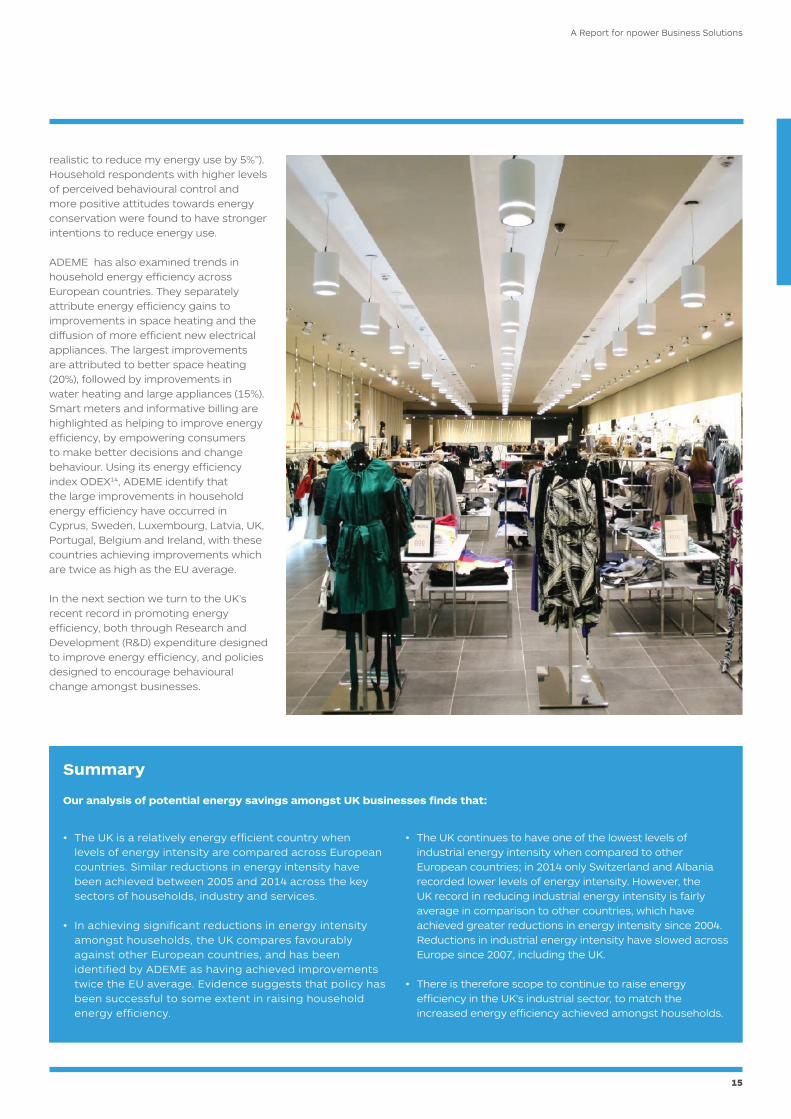
Summary
Our analysis of potential energy savings amongst UK businesses finds that:
• The UK is a relatively energy efficient country when levels of energy intensity are compared across European countries. Similar reductions in energy intensity have been achieved between 2005 and 2014 across the key sectors of households, industry and services.
• In achieving significant reductions in energy intensity amongst households, the UK compares favourably against other European countries, and has been identified by ADEME as having achieved improvements twice the EU average. Evidence suggests that policy has been successful to some extent in raising household energy efficiency.
• The UK continues to have one of the lowest levels of industrial energy intensity when compared to other European countries; in 2014 only Switzerland and Albania recorded lower levels of energy intensity. However, the UK record in reducing industrial energy intensity is fairly average in comparison to other countries, which have achieved greater reductions in energy intensity since 2004. Reductions in industrial energy intensity have slowed across Europe since 2007, including the UK.
• There is therefore scope to continue to raise energy
efficiency in the UK’s industrial sector, to match the increased energy efficiency achieved amongst households.
realistic to reduce my energy use by 5%”). Household respondents with higher levels of perceived behavioural control and more positive attitudes towards energy conservation were found to have stronger intentions to reduce energy use.
ADEME has also examined trends in household energy efficiency across European countries. They separately attribute energy efficiency gains to improvements in space heating and the diffusion of more efficient new electrical appliances. The largest improvements are attributed to better space heating (20%), followed by improvements in water heating and large appliances (15%). Smart meters and informative billing are highlighted as helping to improve energy efficiency, by empowering consumers to make better decisions and change behaviour. Using its energy efficiency index ODEX14, ADEME identify that the large improvements in household energy efficiency have occurred in Cyprus, Sweden, Luxembourg, Latvia, UK, Portugal, Belgium and Ireland, with these countries achieving improvements which are twice as high as the EU average.
In the next section we turn to the UK’s recent record in promoting energy efficiency, both through Research and Development (R&D) expenditure designed to improve energy efficiency, and policies designed to encourage behavioural change amongst businesses.
Business SolutionsQuarterly report
Summer 2015
BusinessSolutions
16
The UK recordin promoting
energy efficiencyHere we examine the UK’s record in promoting energy
efficiency. We have assessed the policy record through its Research and Development (R&D) expenditure
designed to raise energy efficiency, and the active policy measures designed to engender behavioural change
amongst businesses.
The Power of Carbon Psychology

Headlines
We have compared the UK record in promoting energy efficiency both through Research and Development (R&D) expenditure and policies designed to promote behavioural change. We find that:
4.1 R&D expenditure and energy efficiency
• The UK has committed an increasing share of its national output to R&D relating to energy efficiency. Based on the latest available data for 2013, the UK committed 0.03% of its Gross Domestic Product (GDP) in R&D expenditure relating to energy efficiency; this compares to an average of 0.03% across the 29 countries considered. This also compares favourably to the UK R&D commitment in 2006, which was only 0.01%. If R&D expenditure on energy efficiency is expressed as a share of all R&D expenditure relating to energy, the UK share was 30.1% in 2013 – higher than the 29-country average of 22.3%.
• Only a selection of European countries appear to have active policies designed to encourage behavioural change across industry and households, of which the UK is one. Within UK industry, expected energy savings by 2020 resulting from behavioural change policy (5,500 GWh) are dwarfed by expected saving from other measures (24,900 GWh).
• Far higher energy savings are expected amongst UK households (55,400 GWh), with behavioural change measures again only contributing to a small share of savings (6,800 GWh).
Here we examine how much the UK commits in R&D expenditure designed to promote energy efficiency each year. R&D expenditure data has been sourced from the International Energy Agency (IEA) Data Services database.15 In order to enable a comparison against other countries, R&D expenditure amounts have been expressed as a share of GDP. GDP figures have been sourced from the World Bank World Development Indicators (WDI). Figure 5 below compares the UK’s R&D expenditure share against those of comparable IEA member countries16 from 2006 to 2013, in addition to the country-by-country average; we have presented the most recent data available for all countries compared.
Business SolutionsQuarterly report
Summer 2015
BusinessSolutions
17
A Report for npower Business Solutions
We observe that between 2000 and 2013, the UK committed approximately 0.02% of its GDP to R&D expenditure targeting energy efficiency, with a peak of 0.05% in 2010. Whilst this appears to be a very small percentage share, this lies close to the average share of 0.03% across the 29 IEA member countries. Comparing the UK against the other IEA members, Finland – a notable outlier – ranks highest with 0.13% of its GDP in 2013 committed to raising energy efficiency through R&D, with this share having risen from 0.06% in 2005. The International Energy Agency (IEA) note that Finland’s energy-intensive industries and cold climate – resulting in high level of energy consumption per capita – makes energy security a significant policy concern. It explains Finland’s leadership in energy efficiency R&D, reflecting the Finnish Government’s strategy of improving energy security, and progression towards a decarbonised economy.

The UK’s share is close to that of Germany (0.04%) but lower than those of France (0.06%) and the US (0.04%). Out of the 22 IEA countries with recorded data in 2013, the UK ranked 11th in terms of R&D expenditure committed to energy efficiency, its second-highest ranking since 2010 (7th). The UK share now lies
close to the 29-country average of 0.03%, having been below for every year prior since 2000.
The IEA database provides data for all types of R&D expenditure relating to energy, in addition to that of energy efficiency. Other energy R&D expenditure
categories recorded by the IEA include power and storage technologies, fossil fuels, renewable energy sources, nuclear power, and hydrogen and fuel cells. Figure 6 below shows the share of total energy R&D expenditure committed to the category of energy efficiency, again with covering a selection of countries.
Figure 5: Energy efficiency R&D expenditure as a percentage of GDP
Figure 6: Total energy efficiency R&D expenditure as a share of total energy R&D expenditure
Source: World Energy Coucil
Source: World Energy Coucil
-
0.00%
0.02%
0.04%
0.06%
0.08%
0.10%
0.12%
0.14%
0.16%
0.18%
2006 2007 2008 2009 2010 2011 2012 2013
Sweden Switzerland UK 29 Country Average US Germany Canada France Finland
0%
10%
20%
30%
40%
50%
60%
70%
2006 2007 2008 2009 2010 2011 2012 2013
Canada France US 29 Country Average Germany Switzerland UK Sweden Finland
18
The Power of Carbon Psychology

19
A Report for npower Business Solutions
Between 2000 and 2013, the UK committed around 13.8% of its total energy R&D expenditure to energy efficiency. However, this average somewhat masks the increasingly higher shares committed to energy efficiency in recent years. In 2008, around 14.9% of the UK’s total energy R&D expenditure
was used to promote energy efficiency; in 2009 this share doubled to just fewer than 31.6%, and whilst the share had fallen to 30.1% in 2013, this represents a significant increase on the pre-2009 level. Comparing to the UK to other IEA members, in 2013 only four countries committed a greater share of energy
R&D expenditure to energy efficiency: Finland (49.9%), Sweden (42.4%), Austria (44.6%) and the Czech Republic (39.8%). Then UK share of 30.1% in 2013 compares favourably to Germany (23%), the US (21%) and France (15%).
We have chosen to only consider policy measures which are described as “Ongoing” – as opposed to “Completed” or “Proposed” – to capture measures which are continuing to affect energy efficiency. In addition, some policy measures have recorded household and industrial impact components. We have separated energy savings into household and industrial components for these measures.
In order to provide a representative comparison of policy measures within and across countries, we have only considered those policy measures for which MURE has recorded an associated impact evaluation. The impact evaluation provides the ex-ante and ex-post estimates for energy savings resulting from each policy, and typically focuses on energy savings achieved by 2010, 2016 and 2020. It is these savings which are examined in the remainder of this section, presented using the measure of Gigawatt hours (GWh).
Policy measures are also categories by their semi-quantitative impact within the MURE database. Impacts are based on quantitative impact evaluations or expert estimates.18 The categories of impact – Low, Medium or High – relate to the resulting effect on energy consumption or CO2 emissions:
• Low: less than 0.1% savings• Medium: Between 0.1% and 0.5%
savings• High: Greater than 0.5% savings
Setting criteria to identify policy measures
Within the MURE database, policy measures are broken down into the following areas:
• Household• Tertiary• Industry• Transport• General cross-cutting
MURE has also allowed us to identify policy measures by the following categories:
• Co-operative Measures• Cross-cutting with sector-specific
categories• Financial• Fiscal/Tariffs• Information/Education• Legislative/Informative• Legislative/Normative
We have identified “Information, Education or Training” as the policy category which most closely relates to promoting behavioural change (and is henceforth termed as such for the remainder of this section), as it includes the following policy subcategories listed below:
• Detailed energy/electrical bills aiming at energy efficiency improvement
• Information campaigns• Regional and local information centre on
energy efficiency• Voluntary labelling of buildings and
components
4.2 Energy policy
Here we examine the UK policy record in promoting energy efficiency through behavioural change, by investigating the level of energy savings by different policy measures. Policy information has been sourced from the ODYYSEE MURE Project database.17 The ODYYSEE database provides information on energy efficiency trends and indicators across Europe countries. MURE contains information on energy efficiency policy measures, including their impact, and covers around 2000 measures.
Applying the search criteria above yields the following results for UK policy measures in Table 1 below:
Carbon Trust Programmes
UK Smart Metering and billing (non-domestic)
Climate Change Agreements
EU Emission Trading Scheme
Climate Change Levy
Building Regulations (non-domestic)
Energy Performance Certificates
UK Energy Saving Trust
UK Smart Metering and billing (households)
Zero Carbon buildings
Reduction in VAT rate, Energy Saving Materials
Market Transformation Programme
Building Regulations (households)
Home Energy Efficiency Programmes (Scotland)
Industrial
Industrial
Industrial
Industrial
Industrial
Industrial
Industrial
Household
Household
Household
Household
Household
Household
Household
Information, Education or Training
Information, Education or Training
Co-operative measures, Fiscal/Tariffs
New Market-based Instruments
Cross-cutting
Legislative/Normative
Legislative/Informative
Information, Education or Training
Information, Education or Training
Information, Education or Training
Fiscal/Tariffs
Legislative/Normative
Legislative/Normative
Financial
Medium
High
High
High
High
High
Medium
Medium
High
Low
Low
High
High
Low
Table 1: Identified UK policy measures with estimated semi-quantitative impact
20
The Power of Carbon Psychology
Measure Category Type Impact
Source: ODYSSEE MURE, Cebr analysis
Source: ODYSSEE MURE, Cebr analysis
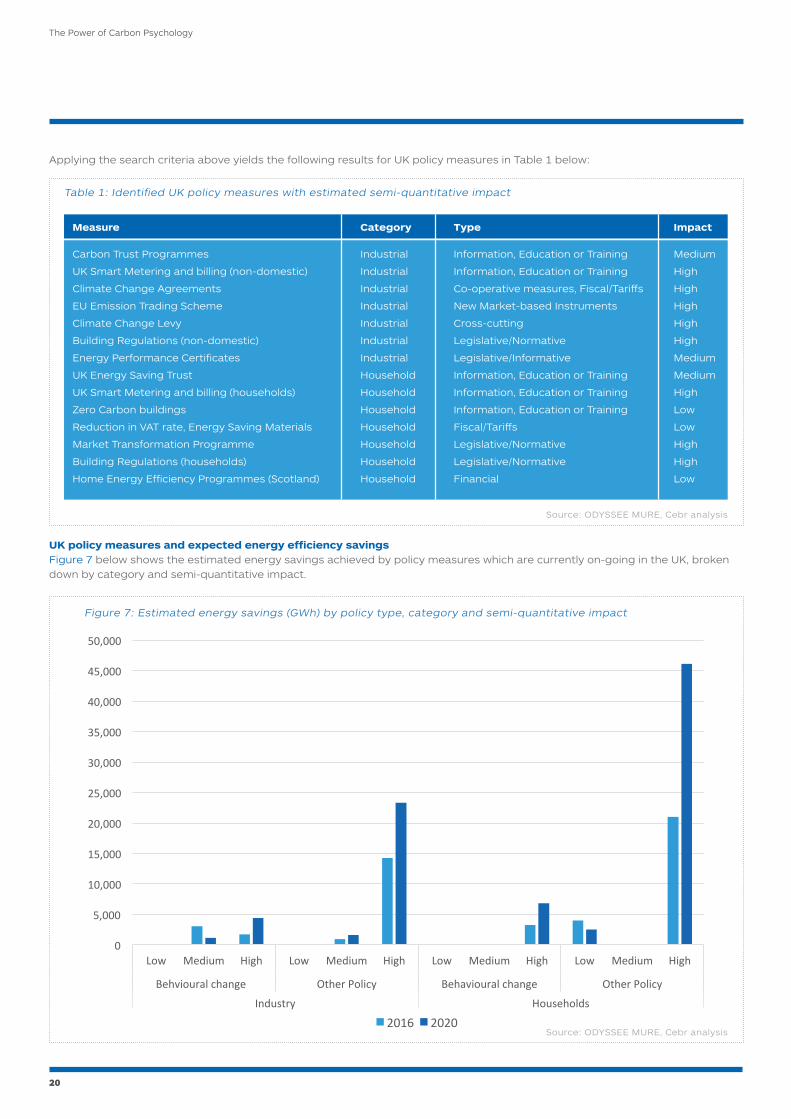
UK policy measures and expected energy efficiency savingsFigure 7 below shows the estimated energy savings achieved by policy measures which are currently on-going in the UK, broken down by category and semi-quantitative impact.
Figure 7: Estimated energy savings (GWh) by policy type, category and semi-quantitative impact
0
5,000
10,000
15,000
20,000
25,000
30,000
35,000
40,000
45,000
50,000
Low Medium High Low Medium High Low Medium High Low Medium High
Behvioural change Other Policy Behavioural change Other Policy
Industry Households
2016 2020
21
A Report for npower Business Solutions
Source: ODYSSEE MURE, Cebr analysis
Source: ODYSSEE MURE, Cebr analysis
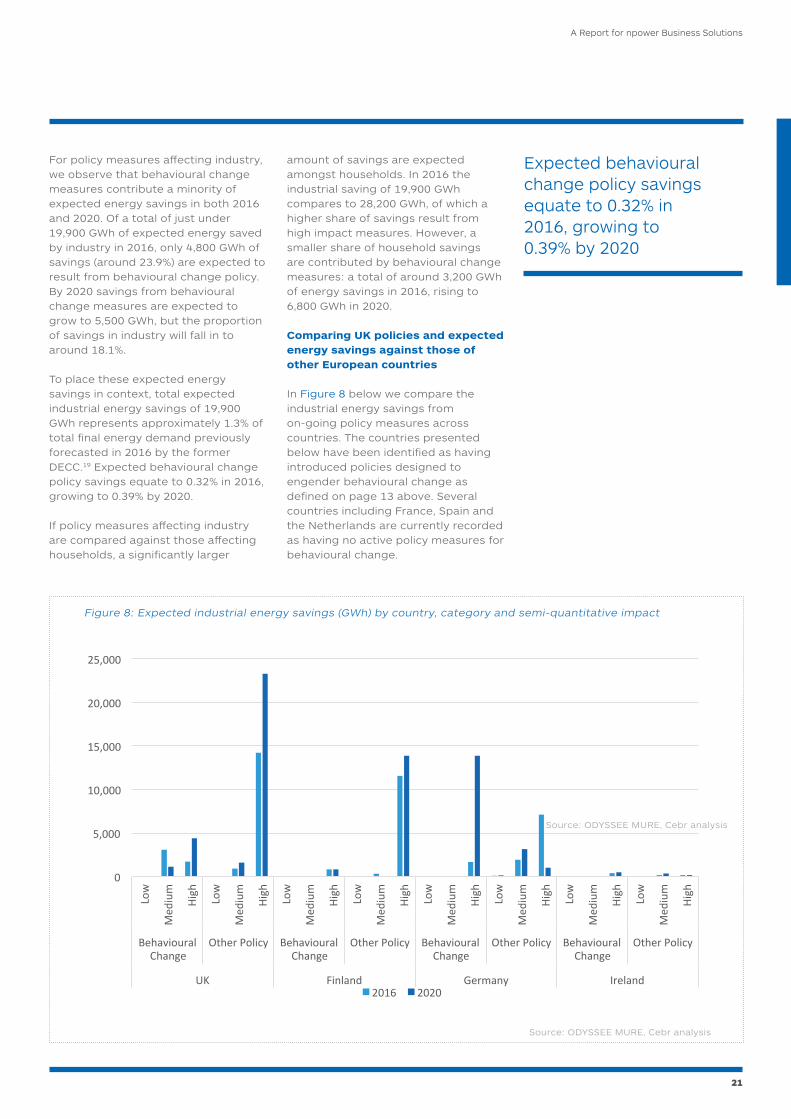
Figure 8: Expected industrial energy savings (GWh) by country, category and semi-quantitative impact
0
5,000
10,000
15,000
20,000
25,000
Low
Med
ium
High
Low
Med
ium
High
Low
Med
ium
High
Low
Med
ium
High
Low
Med
ium
High
Low
Med
ium
High
Low
Med
ium
High
Low
Med
ium
High
BehaviouralChange
Other Policy BehaviouralChange
Other Policy BehaviouralChange
Other Policy BehaviouralChange
Other Policy
UK Finland Germany Ireland2016 2020
For policy measures affecting industry, we observe that behavioural change measures contribute a minority of expected energy savings in both 2016 and 2020. Of a total of just under 19,900 GWh of expected energy saved by industry in 2016, only 4,800 GWh of savings (around 23.9%) are expected to result from behavioural change policy. By 2020 savings from behavioural change measures are expected to grow to 5,500 GWh, but the proportion of savings in industry will fall in to around 18.1%.
To place these expected energy savings in context, total expected industrial energy savings of 19,900 GWh represents approximately 1.3% of total final energy demand previously forecasted in 2016 by the former DECC.19 Expected behavioural change policy savings equate to 0.32% in 2016, growing to 0.39% by 2020.
If policy measures affecting industry are compared against those affecting households, a significantly larger
amount of savings are expected amongst households. In 2016 the industrial saving of 19,900 GWh compares to 28,200 GWh, of which a higher share of savings result from high impact measures. However, a smaller share of household savings are contributed by behavioural change measures: a total of around 3,200 GWh of energy savings in 2016, rising to 6,800 GWh in 2020.
Comparing UK policies and expected energy savings against those of other European countries
In Figure 8 below we compare the industrial energy savings from on-going policy measures across countries. The countries presented below have been identified as having introduced policies designed to engender behavioural change as defined on page 13 above. Several countries including France, Spain and the Netherlands are currently recorded as having no active policy measures for behavioural change.
Expected behavioural change policy savings equate to 0.32% in 2016, growing to 0.39% by 2020

A minority of European countries appear to rely more heavily on policy measures relating to behavioural change in order to achieve energy savings. Whilst Ireland currently has one active policy measure relating to behavioural change (targeting Small Medium Enterprises, or SMEs), this is expected to generate annual energy savings of around 400 GWh in 2016. This represents around 54% of total expected savings from policy measures. Meanwhile, Germany has introduced an Energy Efficiency Networks Initiative, involving energy audits and setting of energy targets across networks of companies. This measure is expected to lead to energy savings of 1,700 GWh in 2016, climbing dramatically to just under 14,000 in 2020, by which point this behavioural change measure will account for around 76.4% of total annual energy savings from policy measures. The UK’s position is closer to Finland,
where we estimate that a total of just over 12,700 GWh of energy savings are expected in 2016, with this expected saving rising to just over 14,700 GWh by 2020. However, only around 6.6% of total expected savings relate to policy measures designed to promote behavioural change. This share is expected to fall to 5.7% by 2020. The dominance of other policy types used to reduce energy use has been noted by the ADEME through the ODYYSEE MURE project. In their 2015 analysis20 ADEME note that “financial measures are the by far dominating measure type in industry in almost all EU Member States.”
In the next section we examine the evidence literature on the contribution that behavioural change could make to raising energy efficiency levels across businesses, and the other associated benefits for business competitiveness,
financial savings and staff engagement. We use this additional evidence to further support the case for BEIS to place greater focus on energy efficiency amongst businesses.
Summary
Our analysis shows that:
• The UK has devoted a greater share of its GDP to energy efficiency R&D expenditure in recent years. Whilst the UK’s R&D expenditure on energy efficiency lies close to the average of countries considered in the analysis, it has approximately trebled from an estimated 0.01% of GDP in 2000 to 0.03% in 2013.
• Since 2008 the UK has also committed significantly higher proportions of its energy R&D expenditure to energy efficiency over other forms of R&D (such as nuclear power), suggesting a marked change in R&D policy amongst UK businesses and the Government.
• Whilst the UK position in R&D expenditure has significantly improved, there is a sizeable difference between the energy savings expected to result from behavioural change policy versus other types of policy (such as financial or tariff measures). The UK does not appear to be alone in this
regard; few other countries have active behavioural change policies targeting industry.
• At around 5,500 GWh of energy saved, behavioural change measures account for only 18% of expected energy savings in UK industry by 2020. Behavioural change measures are expected to have a larger impact amongst households by this point, at around 6,800 GWh. There is potential scope for additional policy measures to increase energy savings that could be achieved through behavioural change – particularly in industry.
• Cebr and nBS therefore argue that there may be an opportunity for the new Department for Business, Energy and Industrial Strategy (BEIS) to introduce further policy to encourage behavioural change in UK industry. This should be part of a broader refocus on energy efficiency and engaging with businesses to achieve this.
22
The Power of Carbon Psychology

23
A Report for npower Business Solutions
There is an opportunity for BEIS to introduce further policy to encourage behavioural change in UK industry

Business SolutionsQuarterly report
Summer 2015
BusinessSolutions
24
Review of the evidence on
behavioural changeIn this section we provide a non-exhaustive review of the
literature and evidence concerning the role of behavioural change in promoting energy efficiency.
The Power of Carbon Psychology
Headlines
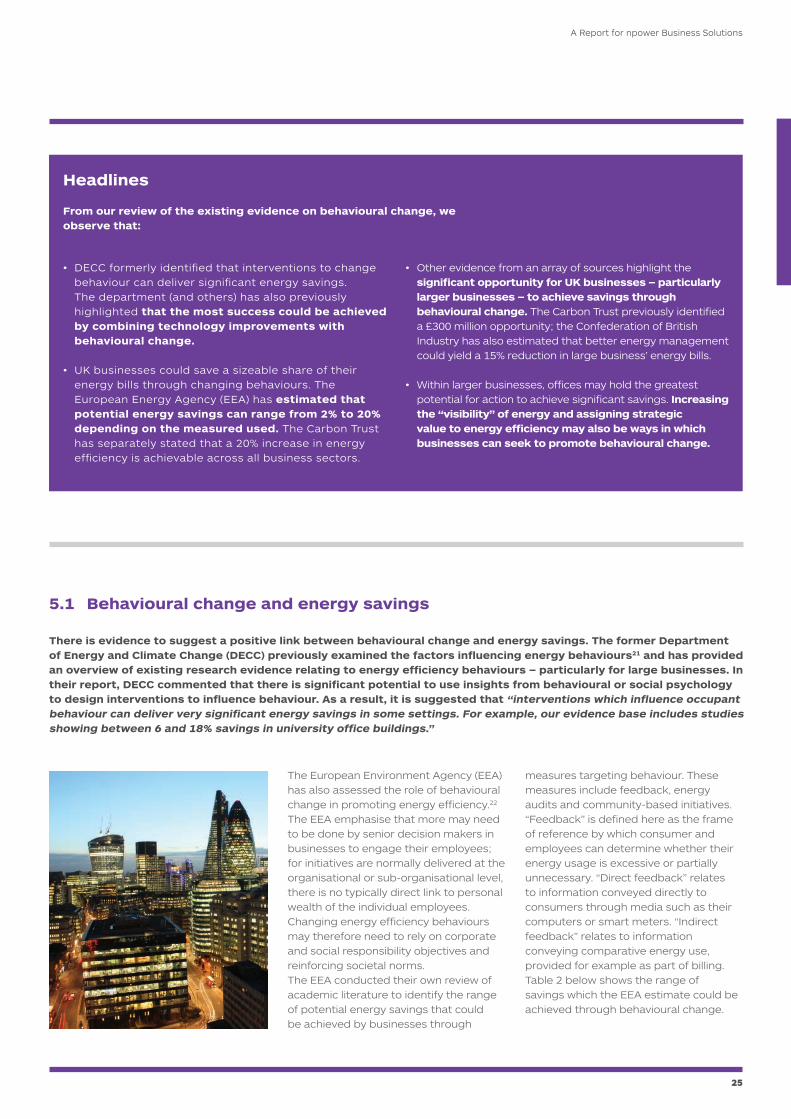
From our review of the existing evidence on behavioural change, we observe that:
5.1 Behavioural change and energy savings
• DECC formerly identified that interventions to change behaviour can deliver significant energy savings. The department (and others) has also previously highlighted that the most success could be achieved by combining technology improvements with behavioural change.
• UK businesses could save a sizeable share of their energy bills through changing behaviours. The European Energy Agency (EEA) has estimated that potential energy savings can range from 2% to 20% depending on the measured used. The Carbon Trust has separately stated that a 20% increase in energy efficiency is achievable across all business sectors.
• Other evidence from an array of sources highlight the significant opportunity for UK businesses – particularly larger businesses – to achieve savings through behavioural change. The Carbon Trust previously identified a £300 million opportunity; the Confederation of British Industry has also estimated that better energy management could yield a 15% reduction in large business’ energy bills.
• Within larger businesses, offices may hold the greatest potential for action to achieve significant savings. Increasing the “visibility” of energy and assigning strategic value to energy efficiency may also be ways in which businesses can seek to promote behavioural change.
There is evidence to suggest a positive link between behavioural change and energy savings. The former Department of Energy and Climate Change (DECC) previously examined the factors influencing energy behaviours21 and has provided an overview of existing research evidence relating to energy efficiency behaviours – particularly for large businesses. In their report, DECC commented that there is significant potential to use insights from behavioural or social psychology to design interventions to influence behaviour. As a result, it is suggested that “interventions which influence occupant behaviour can deliver very significant energy savings in some settings. For example, our evidence base includes studies showing between 6 and 18% savings in university office buildings.”
Business SolutionsQuarterly report
Summer 2015
BusinessSolutions
25
A Report for npower Business Solutions
The European Environment Agency (EEA) has also assessed the role of behavioural change in promoting energy efficiency.22 The EEA emphasise that more may need to be done by senior decision makers in businesses to engage their employees; for initiatives are normally delivered at the organisational or sub-organisational level, there is no typically direct link to personal wealth of the individual employees. Changing energy efficiency behaviours may therefore need to rely on corporate and social responsibility objectives and reinforcing societal norms.The EEA conducted their own review of academic literature to identify the range of potential energy savings that could be achieved by businesses through
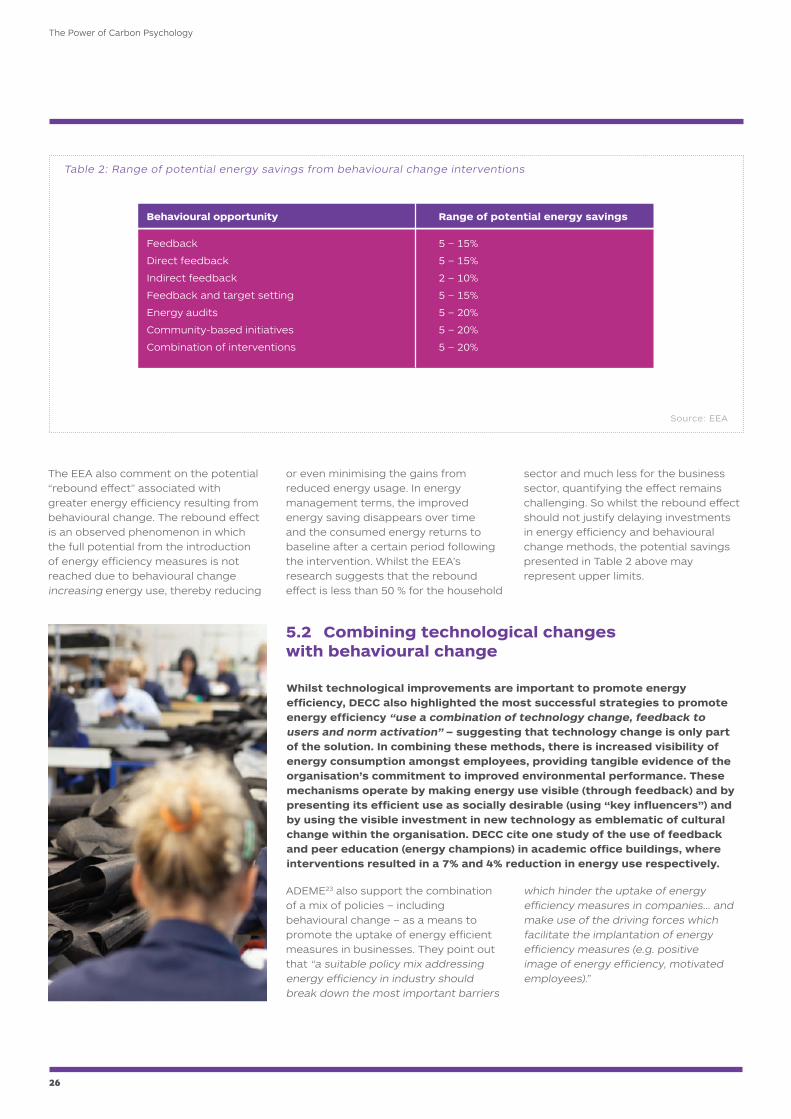
measures targeting behaviour. These measures include feedback, energy audits and community-based initiatives. “Feedback” is defined here as the frame of reference by which consumer and employees can determine whether their energy usage is excessive or partially unnecessary. “Direct feedback” relates to information conveyed directly to consumers through media such as their computers or smart meters. “Indirect feedback” relates to information conveying comparative energy use, provided for example as part of billing. Table 2 below shows the range of savings which the EEA estimate could be achieved through behavioural change.
Feedback
Direct feedback
Indirect feedback
Feedback and target setting
Energy audits
Community-based initiatives
Combination of interventions
5 – 15%
5 – 15%
2 – 10%
5 – 15%
5 – 20%
5 – 20%
5 – 20%
Table 2: Range of potential energy savings from behavioural change interventions
Behavioural opportunity Range of potential energy savings
Source: EEA
26
The Power of Carbon Psychology
The EEA also comment on the potential “rebound effect” associated with greater energy efficiency resulting from behavioural change. The rebound effect is an observed phenomenon in which the full potential from the introduction of energy efficiency measures is not reached due to behavioural change increasing energy use, thereby reducing
or even minimising the gains from reduced energy usage. In energy management terms, the improved energy saving disappears over time and the consumed energy returns to baseline after a certain period following the intervention. Whilst the EEA’s research suggests that the rebound effect is less than 50 % for the household
sector and much less for the business sector, quantifying the effect remains challenging. So whilst the rebound effect should not justify delaying investments in energy efficiency and behavioural change methods, the potential savings presented in Table 2 above may represent upper limits.
ADEME23 also support the combination of a mix of policies – including behavioural change – as a means to promote the uptake of energy efficient measures in businesses. They point out that “a suitable policy mix addressing energy efficiency in industry should break down the most important barriers
which hinder the uptake of energy efficiency measures in companies… and make use of the driving forces which facilitate the implantation of energy efficiency measures (e.g. positive image of energy efficiency, motivated employees).”
5.2 Combining technological changes with behavioural change
Whilst technological improvements are important to promote energy efficiency, DECC also highlighted the most successful strategies to promote energy efficiency “use a combination of technology change, feedback to users and norm activation” – suggesting that technology change is only part of the solution. In combining these methods, there is increased visibility of energy consumption amongst employees, providing tangible evidence of the organisation’s commitment to improved environmental performance. These mechanisms operate by making energy use visible (through feedback) and by presenting its efficient use as socially desirable (using “key influencers”) and by using the visible investment in new technology as emblematic of cultural change within the organisation. DECC cite one study of the use of feedback and peer education (energy champions) in academic office buildings, where interventions resulted in a 7% and 4% reduction in energy use respectively.

27
A Report for npower Business Solutions
The former DECC previously cited studies which suggest that the appointment of a dedicated energy or environmental manager (more likely to occur in larger businesses) is strongly associated with greater likelihood of having an energy or environmental strategy in place. Moreover, the closer the energy manager is in the business’ hierarchy to the CEO, the more energy management takes place. However, the appointment of energy managers in large businesses is less frequent than expected, suggesting that managers in larger companies are generally not attaching strategic value to energy use and efficiency. DECC also identified several behavioural-related implications and recommendations from their research:
• Interventions to occupant behaviour hold significant potential both in directly creating savings and indirectly via changing organisational culture and hence decision-making.
• Individuals and groups within larger businesses are often overlooked by Government policy.
• Energy efficiency is much more likely to become a strategic objective for businesses when energy consumption becomes salient. This means instituting monitoring and reporting practices and combining energy efficiency messaging with a broader efficiency agenda.
• When energy efficiency is targeted as having strategic value, access to finance becomes easier, particularly for larger businesses.
Altan24 analyses the responses of 23 university energy managers to a questionnaire about their energy efficiency interventions, finding that non-technical initiatives achieved significant energy savings at a modest cost. For example, training energy champions was implemented by a third of respondents, all of which reported that it cost less than £1,000, with two thirds reporting it a success achieving energy savings of up to 18%. Cox et al.25 find that there is “a clear view from employers that cutting carbon emissions has significant knock-on benefits, including building organisational reputation, being seen as a pro-environmental brand, improving sales/customer retention, recruiting and retaining high quality staff, reducing operating costs and meeting regulatory requirements.”
The Confederation of British Industry (CBI)26 has identified a large amount of untapped potential for UK businesses to increase their energy efficiency. The CBI suggests that both technological and behavioural changes continue to be overlooked by many businesses, pointing to estimates showing that some businesses are collectively paying £1.6 billion more than they need to on their energy bills due to a lack of onsite energy efficiency. Lack of energy awareness at all levels is cited as a common challenge and reason for this wastage. Large businesses in particular could benefit: CBI’s research suggests that better energy management could result in a 15% reduction in large business’ energy bills.
The CBI stress that more needs to be done to promote awareness amongst
employees at all levels: “Even where energy efficiency has been prioritised at the top, awareness is sometimes only found amongst the staff working directly on energy efficiency projects, and even then, staff can lack an understanding of the technologies and services available to help improve efficiency… more broadly, without company-wide understanding, basic behavioural changes to cut down on energy use, such as simply switching off lights and computers and using technology and processes properly, will also be missed.”
The Trades Union Congress (TUC)27 cites one survey of 279 business customers that showed that although around half of those surveyed had the ability to take energy conservation actions, a smaller percentage of the respondents actually performed the actions. The TUC stress that the key to supporting behavioural change is embedding knowledge of how to increase energy efficiency across society.
Similarly, the Institute of Directors (IoD)28 has previously stated that 20% improvement in energy efficiency was “achievable”, citing that SMEs were forgoing energy savings of up to £1 billion. The IoD also pointed to the importance of behaviours, stating that “at the heart of any energy efficiency endeavour are people and influencing the energy behaviours of an organisation’s people must form a central part of any plan to reduce energy use.” Through a survey, the IoD found that 30% of those organisations which did address energy use also reported energy savings on average of 8%.
5.3 Behavioural change and the opportunity for businesses
Further evidence from Government and third parties indicates that there is a clear opportunity for UK businesses to make substantial savings through behavioural change.
28
The Power of Carbon Psychology
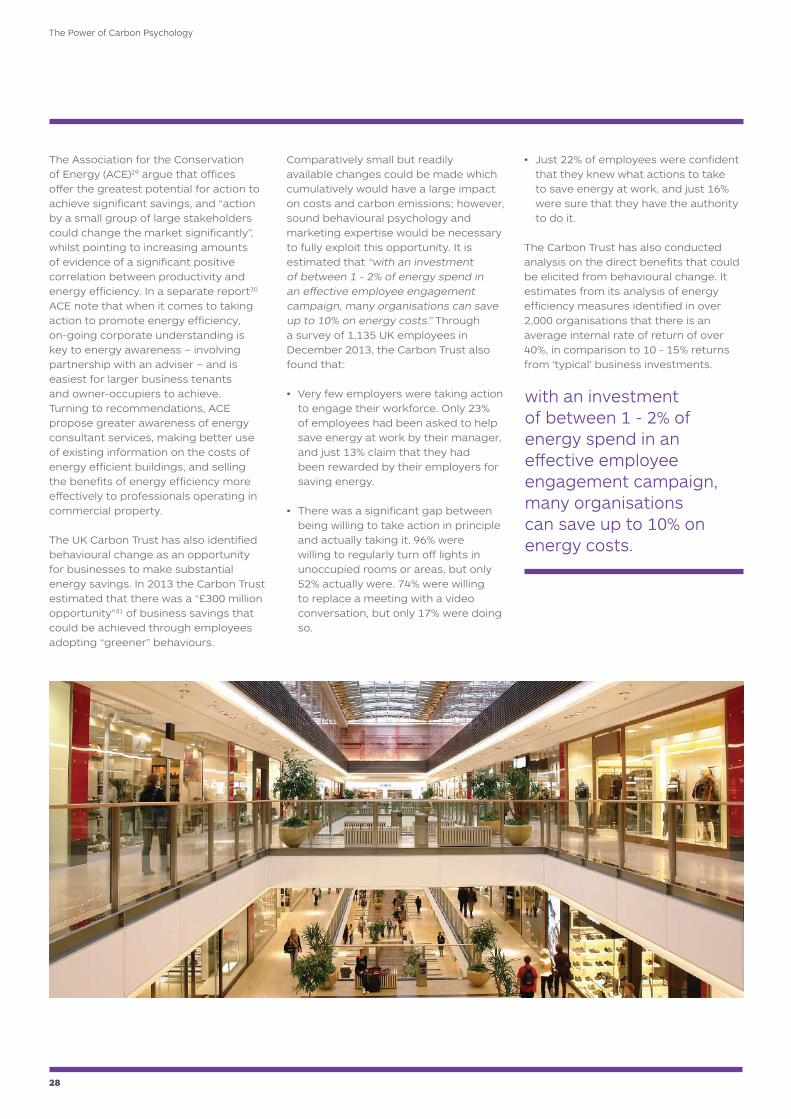
The Association for the Conservation of Energy (ACE)29 argue that offices offer the greatest potential for action to achieve significant savings, and “action by a small group of large stakeholders could change the market significantly”, whilst pointing to increasing amounts of evidence of a significant positive correlation between productivity and energy efficiency. In a separate report30 ACE note that when it comes to taking action to promote energy efficiency, on-going corporate understanding is key to energy awareness – involving partnership with an adviser – and is easiest for larger business tenants and owner-occupiers to achieve. Turning to recommendations, ACE propose greater awareness of energy consultant services, making better use of existing information on the costs of energy efficient buildings, and selling the benefits of energy efficiency more effectively to professionals operating in commercial property.
The UK Carbon Trust has also identified behavioural change as an opportunity for businesses to make substantial energy savings. In 2013 the Carbon Trust estimated that there was a “£300 million opportunity”31 of business savings that could be achieved through employees adopting “greener” behaviours.
Comparatively small but readily available changes could be made which cumulatively would have a large impact on costs and carbon emissions; however, sound behavioural psychology and marketing expertise would be necessary to fully exploit this opportunity. It is estimated that “with an investment of between 1 - 2% of energy spend in an effective employee engagement campaign, many organisations can save up to 10% on energy costs.” Through a survey of 1,135 UK employees in December 2013, the Carbon Trust also found that:
• Very few employers were taking action to engage their workforce. Only 23% of employees had been asked to help save energy at work by their manager, and just 13% claim that they had been rewarded by their employers for saving energy.
• There was a significant gap between being willing to take action in principle and actually taking it. 96% were willing to regularly turn off lights in unoccupied rooms or areas, but only 52% actually were. 74% were willing to replace a meeting with a video conversation, but only 17% were doing so.
• Just 22% of employees were confident that they knew what actions to take to save energy at work, and just 16% were sure that they have the authority to do it.
The Carbon Trust has also conducted analysis on the direct benefits that could be elicited from behavioural change. It estimates from its analysis of energy efficiency measures identified in over 2,000 organisations that there is an average internal rate of return of over 40%, in comparison to 10 - 15% returns from ‘typical’ business investments.
with an investment of between 1 - 2% of energy spend in an effective employee engagement campaign, many organisations can save up to 10% on energy costs.

29
A Report for npower Business Solutions
Summary
We have conducted a non-exhaustive review of the existing evidence on behavioural change and its potential to help save energy. In summary, it is found that:
• There are likely to be substantial gains to be made by businesses through behavioural change, both in terms of energy saved and reductions in costs. Potential savings will vary depending on the measures implemented and the success of management in engaging employees.
• There is evidence to suggest that more successful initiatives to raise energy efficiency in businesses will combine technological change with measures to engender behavioural change. There is scope within businesses to encourage employees to save energy, institute energy management and place strategic value on energy saving and efficiency.
• In terms of the Government engaging with energy users and promoting behavioural change, the focus so far appears to have been more on Small Medium Enterprises (SMEs) and households. Focus on the latter mirrors the significant reductions in household energy intensity identified earlier in this report.
• The combination of this evidence suggests that there is an opportunity for the new Department for Business, Energy and Industrial Strategy (BEIS) to target behavioural change amongst larger businesses, in the same way that the former DECC sought to encourage behavioural change amongst Small Medium Enterprises (SMEs) through the SME Energy Efficiency Guide.
more successful initiatives to raise energy efficiency in businesses will combine technological change with measures to engender behavioural change.
In a report for DECC, Cambridge Architectural Research32 examined the potential energy savings that could be achieved by households adopting 45 ‘behaviours’ defined by DECC, producing estimates for savings resulting from different behaviours (such as reducing thermostat temperatures, installing more efficient infrastructure in homes and delaying heating use). Another example of behavioural change recommendations focusing on households is a recent note produced by the Parliamentary Office of Science and Technology.33 Energy efficiency is often viewed as “invisible” (thereby emphasising the importance of feedback, for example as provided by smart meters) and given a low priority, measures to promote efficiency are perceived as expensive, and social norms often prevent implementation.
This note highlights how encouraging behavioural change amongst the UK public could contribute to the UK’s energy policy goals of energy security and affordability.
For smaller businesses, DECC previously published a SME Energy Efficiency Guide34 which outlines the various ways in which SMEs can promote energy efficiency and lower their energy bills. DECC identified that the promotion of energy efficiency – even through simple changes in behaviour amongst employees – can result in an array of benefits for small businesses. These benefits include increased competitiveness and profitability, higher staff retention and more comfortable working environments, improved cash flow and increase resilience against
energy price increases and price volatility expected by DECC over the next five years. DECC estimate that “for a company with a five percent profit margin over 3 years, a £500-a-year saving from energy efficiency makes the same profit as £30,000 of extra sales.”
5.4 Existing focus on behavioural change, households and SMEs
Other analysis previously commissioned for or produced by DECC focusing on the benefits of behavioural change heavily emphasises the benefits for households and smaller businesses.

Business SolutionsQuarterly report
Summer 2015
BusinessSolutions
30
Business savings from behavioural
changeHaving gathered evidence on the potential savings for
large businesses from behavioural change, in this section we estimate the amount of savings that could be achieved
by UK businesses through successful adoption and implementation of behavioural change. We firstly explain the methodology by which this analysis draws on, before
discussing the resulting estimates. We then estimate the potential savings that could be made by large UK
businesses versus small and medium-sized businesses.
The Power of Carbon Psychology

Headlines
From our analysis of potential energy savings amongst UK businesses, we find that:
• There are several different behavioural change measures which large businesses could implement in order to achieve significant business savings. Behavioural change measures range from smaller measures such as:
- Better use of heating equipment, such as encouraging employees to reduce office temperature settings
- More efficient use of mobile phone changers
- Turning off audio visual equipment when not in use
Through to larger scale behavioural change measures such as:
- Encouraging switch-off campaigns and more efficient use of office equipment, such as printers, faxes and photocopiers
- More efficient use of computers and monitors
• We have used two approaches to estimate potential business savings, firstly drawing upon the number of employees within businesses annual energy bills faced by businesses and secondly annual energy bills faced by businesses. Both approaches yield similar estimates for potential business energy savings, and suggest that savings could be worth hundreds of millions of pounds each year.
• Applying the first approach, we estimate that there are between £470 million and £860 million of potential business savings that could be achieved through behavioural change, with a mid-range estimate of £600 million. This equates to just under 6000 Gigawatt hours (GWh) saved.
• The majority of these potential savings are concentrated disproportionately amongst larger businesses. We estimate that large businesses could achieve between £190 million and £460 million of potential business savings, with a mid-range estimate of £270 million, or around 2,700 GWh.
Business SolutionsQuarterly report
Summer 2015
BusinessSolutions
31
A Report for npower Business Solutions
nBS has previously estimated that UK businesses could make significant savings through energy behaviour change, with each company potentially saving between 3 to 15 per cent35 – equating to an average saving of 9 per cent. Separately, the Carbon Trust estimates that a “comprehensive and well-run behavioural change campaign” can save a business around 10% of its energy bill. We have used these existing estimates, in addition to the evidence discussed in the Section 5, as a framework and guide for the analysis.
Approaches to estimate potential energy savingsOur analysis features two approaches to estimate the total potential savings that UK businesses could achieve through behavioural change. Further information on the methodology applied can be found in Annex A of this report.
• The first approach involved the estimation of potential savings by the number of employees recorded as working in small, medium and large businesses across the various industrial sectors. For example, the Carbon Trust estimate that a business employing 50 people could save £27 a year in energy costs by setting up a switch-off campaign for office equipment such as printers, faxes and photocopiers. With concentrations of firms of different sizes varying across different sectors and with potential savings linked to the number of employees, this represents a “bottom-up” approach.
• The second approach involved the estimation of the annual energy bills faced by small, medium and large businesses, based on their average gas and electricity usage and the recorded price per unit of gas and electricity. For example, the Carbon Trust estimate that a business with an annual energy bill of £1,000 could save £97 annually through undertaking a switch-off campaign for computers and monitors.
In both approaches we have then expressed the total estimated savings as a percentage of total electricity use by sector, to compare against the other existing evidence on behavioural change. This then acts as a “sense-check” against existing findings discussed in Section 5 earlier in this report.
We acknowledge that using the number of employees recorded in businesses is one of several ways in which business size can be measured (alongside turnover, capital investment, market share or capitalisation). It is not always exact method of measuring business size but in this context has enabled us to provide a UK-level extrapolation of the savings that could result from widespread behavioural change amongst businesses. However, the number of employees is the most appropriate measure to use as behavioural change manifests through employees.
It is difficult to ascertain what behavioural change measures businesses may already have introduced by UK businesses; some may have already achievable sizeable gains through internal energy efficiency campaigns and assign strategic value to energy. The results presented in this report therefore represent an approximation – an opportunity that could be realised through widespread implementation of behavioural change.
Data SourcesFor both approaches, we have utilised the Business Population Estimates (BPE) as previously provided by the former Department for Business, Innovation and Skills (BIS), which yield information on the number of companies disaggregated by size, sector and region.
For the first approach, we have utilised the Carbon Trust’s “Empower savings calculator”36, which provides estimates for potential savings from employee engagement in energy efficiency. The Empower calculator can be calibrated using either a business’ annual energy bill or the number of its employees, in order to yield the energy bill savings that could be gained from promoting energy efficiency, either through behavioural change or by introducing innovations such as smart meters.
Through using the BPE, the first approach enables us to examine savings across different industrial sectors, whereas the second approach is based on all-encompassing pricing data.
32
The Power of Carbon Psychology
6.1 Overview of methodology

Under our cautious scenario, there are around £470 million of potential savings that could be achieved through behavioural change, equating to 4,735 Gigawatt hours (GWh) of electricity saved, with approximately £190m (41%) of these savings attributable to large businesses. Savings from micro businesses (around £150 million) are
slightly higher than small and medium-sized businesses (£130 million) due to the vastly larger number of these businesses in the population.
Under the moderate scenario, the potential savings from large businesses climbs to £270 million, or around 45% of the total potential business savings.
This is attributable to the wider range of behavioural change measures that are assumed to be implemented. Under our most optimistic scenario, there are just under £860 million of potential savings that could be achieved, equating to around 8,400 GWh of electricity saved, with just over £460 million of savings achieved by large businesses.
Approach IFigure 9 below shows the potential business savings from behavioural change as estimated using the first approach described above.
33
A Report for npower Business Solutions
6.2 Results
Here we detail the results of the potential business savings analysis through both approaches. Savings are expressed in terms of the reduction in business energy bills and in Gigawatt hours (GWh) of energy used by businesses.
Source: ODYSSEE MURE, Cebr analysis
Figure 9: Estimated potential business savings by scenario and business size, using Approach I
0
50
100
150
200
250
300
350
400
450
500
Large Small andMedium
Micro Large Small and Medium
Micro Large Small and Medium
Micro
CAUTIOUS MODERATE OPTIMISTIC
Svings (m, LHS) Saving (GWh, RHS)
1,000
1,500
2,000
2,500
3,000
3,500
4,000
4,500
5,000

So we estimate that in each scenario, a disproportionately high share of potential savings could be achieved by large businesses. This is despite there being only around 7,000 such enterprises in 2015 as recorded in the Business Population Estimates (in comparison to a
total of just under 5,400,000 businesses in total).
Figure 10 below breaks down the £600 million of potential business savings estimated under the moderate scenario by industrial sector.
34
The Power of Carbon Psychology
Source: DECC, BIS, Carbon Trust, Cebr analysis
Figure 10: Share of estimated potential business savings, moderate scenario, by industrial sector
0%
5%
10%
15%
20%
25%
We observe that the largest shares of the potential savings could be achieved in the Wholesale and retail (19.9%), Administrative and Support (11.4%), and Manufacturing (10.8%) sectors. In order to demonstrate the relative size of these potential large business savings, it is useful to express them as a proportion of total energy purchases from businesses. In 2013 businesses consumed just under £52
billion of electricity in order to produce goods and services.37 Combining this information with the potential savings amounts described above, under the moderate scenario we estimate that behavioural change-related energy savings could reduce overall business energy purchases by around 1.2%. This saving increases to 1.6% if the optimistic scenario is assumed.

35
A Report for npower Business Solutions
Source: DECC, BIS, ONS, Carbon Trust, Cebr analysis
Figure 11: Potential total business savings as a proportion of total UK intermediate electricity consumption, using the moderate scenario
0%
2%
4%
6%
8%
10%
12%
14%
0%
1%
2%
3%
4%
5%
6%
7%
8%
In Figure 11 below we have expressed total potential energy savings by sector as a share of total energy purchases by sector, again using the moderate scenario described above. Total energy purchases by sector are proxied for by total intermediate consumption of goods and services from the energy sector, which are taken from the ONS Supply Use tables.38 This data can then be used to approximate the potential savings by sector resulting from behavioural change.
We observe from Figure 11 that the largest potential savings as a proportion of total electricity purchases could be achieved in the Accommodation and Food (9.3%), Professional Scientific and Technical (10.0%), and Administrative and Support Services (13.2%) sectors. Whilst these potential gains are quite large in comparison to some sectors, such as Financial and Insurance (2.9%) and Manufacturing (0.8%) they remain within the ranges suggested by the literature from Section 5.
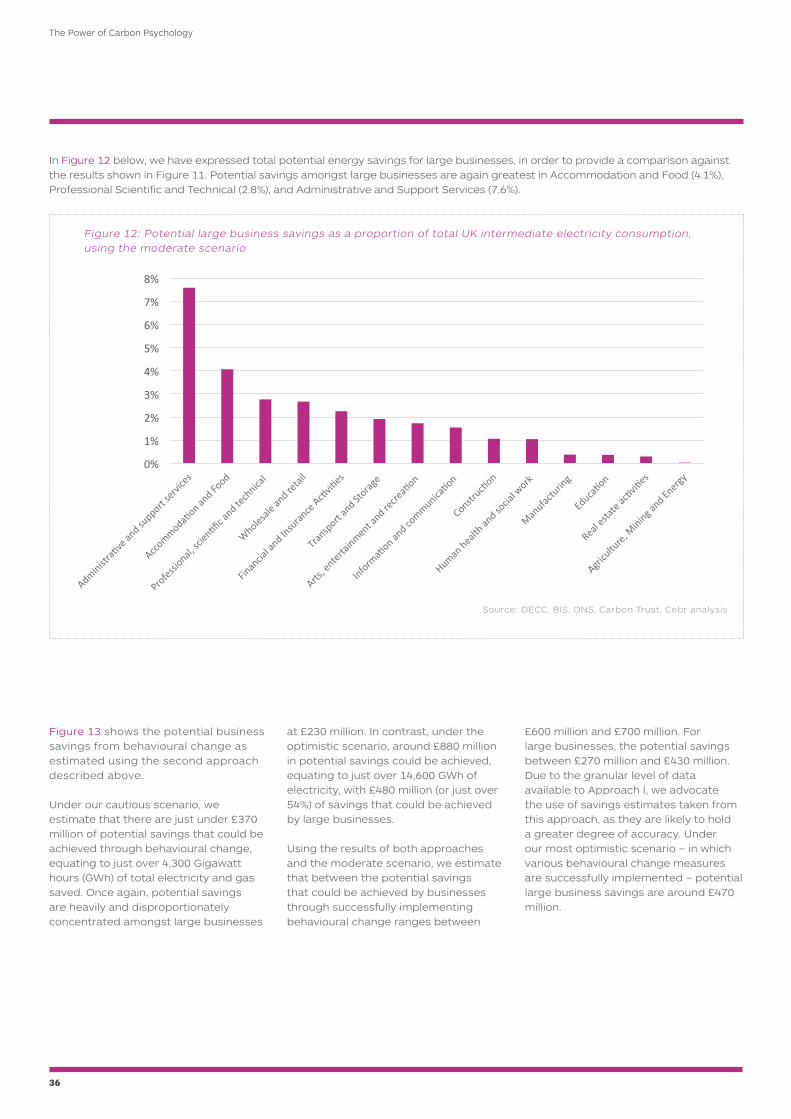
In Figure 12 below, we have expressed total potential energy savings for large businesses, in order to provide a comparison against the results shown in Figure 11. Potential savings amongst large businesses are again greatest in Accommodation and Food (4.1%), Professional Scientific and Technical (2.8%), and Administrative and Support Services (7.6%).
36
The Power of Carbon Psychology
Source: DECC, BIS, ONS, Carbon Trust, Cebr analysis
Figure 12: Potential large business savings as a proportion of total UK intermediate electricity consumption, using the moderate scenario
0%
2%
4%
6%
8%
10%
12%
14%
0%
1%
2%
3%
4%
5%
6%
7%
8%
Figure 13 shows the potential business savings from behavioural change as estimated using the second approach described above.
Under our cautious scenario, we estimate that there are just under £370 million of potential savings that could be achieved through behavioural change, equating to just over 4,300 Gigawatt hours (GWh) of total electricity and gas saved. Once again, potential savings are heavily and disproportionately concentrated amongst large businesses
at £230 million. In contrast, under the optimistic scenario, around £880 million in potential savings could be achieved, equating to just over 14,600 GWh of electricity, with £480 million (or just over 54%) of savings that could be achieved by large businesses.
Using the results of both approaches and the moderate scenario, we estimate that between the potential savings that could be achieved by businesses through successfully implementing behavioural change ranges between
£600 million and £700 million. For large businesses, the potential savings between £270 million and £430 million. Due to the granular level of data available to Approach I, we advocate the use of savings estimates taken from this approach, as they are likely to hold a greater degree of accuracy. Under our most optimistic scenario – in which various behavioural change measures are successfully implemented – potential large business savings are around £470 million.
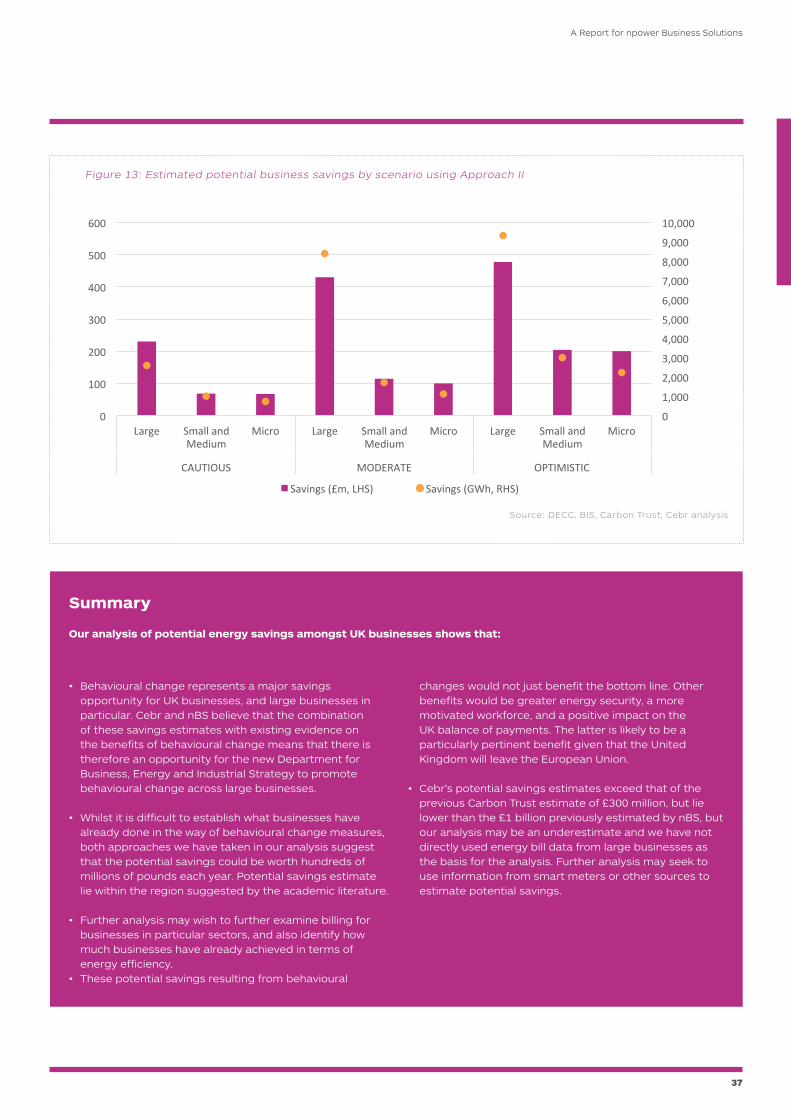
37
A Report for npower Business Solutions
Source: DECC, BIS, Carbon Trust, Cebr analysis
Figure 13: Estimated potential business savings by scenario using Approach II
0
1,000
2,000
3,000
4,000
5,000
6,000
7,000
8,000
9,000
10,000
0
100
200
300
400
500
600
Large Small andMedium
Micro Large Small andMedium
Micro Large Small andMedium
Micro
CAUTIOUS MODERATE OPTIMISTIC
Savings (£m, LHS) Savings (GWh, RHS)
Summary
Our analysis of potential energy savings amongst UK businesses shows that:
• Behavioural change represents a major savings opportunity for UK businesses, and large businesses in particular. Cebr and nBS believe that the combination of these savings estimates with existing evidence on the benefits of behavioural change means that there is therefore an opportunity for the new Department for Business, Energy and Industrial Strategy to promote behavioural change across large businesses.
• Whilst it is difficult to establish what businesses have already done in the way of behavioural change measures, both approaches we have taken in our analysis suggest that the potential savings could be worth hundreds of millions of pounds each year. Potential savings estimate lie within the region suggested by the academic literature.
• Further analysis may wish to further examine billing for businesses in particular sectors, and also identify how much businesses have already achieved in terms of energy efficiency.
• These potential savings resulting from behavioural
changes would not just benefit the bottom line. Other benefits would be greater energy security, a more motivated workforce, and a positive impact on the UK balance of payments. The latter is likely to be a particularly pertinent benefit given that the United Kingdom will leave the European Union.
• Cebr’s potential savings estimates exceed that of the previous Carbon Trust estimate of £300 million, but lie lower than the £1 billion previously estimated by nBS, but our analysis may be an underestimate and we have not directly used energy bill data from large businesses as the basis for the analysis. Further analysis may seek to use information from smart meters or other sources to estimate potential savings.

Business SolutionsQuarterly report
Summer 2015
BusinessSolutions
38
Concluding remarks
In this report we have examined the case for behavioural change and the role it could play in achieving major savings for UK businesses
– particularly for large businesses.
The Power of Carbon Psychology
Business SolutionsQuarterly report
Summer 2015
BusinessSolutions
39
A Report for npower Business Solutions
The UK is a relatively energy efficient country based on its relatively low levels of energy intensity; its performance based on recent trends compares favourably to that of other European countries. However, the UK appears to have performed more strongly in raising energy efficiency amongst households in comparison to industry, whilst improvements in industrial energy efficiency have slowed since 2007. So there is scope to achieve further improvements in energy efficiency – particularly in industry, with the promotion of behavioural change as a means to achieve this.
We have examined the recent policy environment relating to energy efficiency, focusing on two particular aspects of energy efficiency policy: Research and Development (R&D) expenditure on energy efficiency, and policy measures designed to engender behavioural change. In terms of the share of Gross Domestic Product (GDP) devoted to R&D expenditure in energy efficiency, the UK’s share now lies close to the average of comparable countries. In terms of the share of all R&D expenditure relating to energy which is devoted to energy efficiency, the UK now ranks considerably more highly now than in 2006. However, whilst R&D expenditure has increased, the UK’s record in wider policy measures is more mixed, despite it being one of the few countries with active policy measures targeting behavioural change. Policy measures targeting behavioural change in industry account for only 20% of expected energy savings by 2020. In addition, the energy savings expected to result from behavioural change-type measures is dwarfed by savings expected from other measures, both across households and industry.
The higher levels of R&D expenditure and other policy measures designed to raise energy efficiency are welcome; however, a review of the evidence on behavioural change suggests that the most successful energy efficiency strategies will combine both technological improvements with behavioural change amongst energy users and employees. Cebr and nBS therefore advocate that the new Department for Business, Energy and Industrial Strategy (BEIS) should continue to encourage businesses to increase energy efficiency, and seek to promote
greater behavioural change amongst large businesses in particular. This is supported by a review of the evidence and literature surrounding behavioural change, which suggests that there are potentially large savings that could be achieved by businesses. These benefits would not be limited solely to the bottom line for businesses; other benefits are likely to include higher staff engagement and morale, improvement in corporate reputation and competitiveness, and greater protection against future energy price volatility.
By combining evidence from a variety of reputable sources, we estimate that UK business could achieve hundreds of millions of pounds of potential savings from the successful implementation of behavioural change. Potential savings are dependent on the degree to which businesses have already fostered behavioural change amongst their employees, and the measures taken to so. However, our central estimate of £600 million in potential business savings lies within the confines of existing evidence. Notably, between 40% and 50% of these potential savings could be achieved by large businesses in the UK, despite large businesses making up less than one percent of the business population.
Based on the evidence gathered and the results of our analysis, Cebr and npower Business Solutions (nBS) believe that there is a major opportunity for the new Department of Business, Energy and Industrial Strategy (BEIS) to encourage behavioural change to achieve savings across businesses – and particularly for large businesses.
between 40% and 50% of potential savings could be achieved by large businesses in the UK

Defining businesses by sizeThe first step involves defining business categories by size, which is typically measured by the number of recorded employees. It should be stated that using the number of employees is one of several ways in which business size can be measured (alongside turnover, capital investment, market share or capitalisation); it is not always exact but in this context has enabled us to provide a UK-level extrapolation of the savings that could result from widespread behavioural change amongst businesses. Businesses are categorised as being either “Micro”, “Small”, “Medium” or “Large”. Whilst these categories are broad, they have enabled us to reflect the fact that in 2015 over 95% of businesses across all industries were Micro businesses, recorded as having fewer than 10 employees. In contrast, only 0.06% businesses had 500 employees or more.39
Business categories are shown in Table A.1 below:
Some registered and unregistered businesses are recorded as having no employees, but still have employment numbers associated with them within the business population. These businesses have been included in our study; to discard these would entail losing a large number of businesses from the analysis for which greater energy efficiency could also be beneficial.
Approach I: Combining the Empower Calculator and the Business Population EstimatesThe first approach we have used combines information from the Carbon Trust Empower calculator with the Business Population Estimates. The Empower calculator enables the estimation of potential business savings based on the inputted number of employees or the annual energy bill. We have used the former in combination with employment recorded in the Business Population Estimates to estimate savings.
The Carbon Trust Empower calculator incorporates 19 potential energy-saving measures, which are listed below in Table A.2 below. Not all of these measures relate to behavioural change, either relating instead to technological improvements or otherwise; we have therefore only retained those measures which involve campaigns, employees taking action and/or adapting behaviour.
Annex A: Potential business savings methodology
In this annex we explain in further detail the methodologies we have applied to estimate the potential savings that could result from behavioural change amongst businesses.
40
The Power of Carbon Psychology
Micro
Small
Medium
Large
0 - 9
10 - 49
50 - 249
250 or more
Category of business Number of employees
Source: ONS, BEIS
Table A.1: Business categories by size

41
A Report for npower Business Solutions
Travelling to
meetings
Computers and
monitors
Electric fan heaters
Paper recycling
Kettles
Office temperature
General recycling
Hand dryers
Lifts
Desk lamps and
electric fans
Water coolers
Office equipment
Dishwasher
Mobile phone
charger
Leaking taps
and showers
Fridges
Audio visual
equipment
Natural lighting
Office lighting
Set up tele or video-conferencing system and introduce a policy to use these
instead of driving to meetings;
Enable computer energy-saving settings; set up a switch-off campaign to switch off
monitors when away from their desks, and their computers at the end of the day;
Switch off electric fan heaters and encourage staff to wear warmer clothes;
Put up messaging to encourage employees to print double-sided or even two
pages per slide, and reuse paper where possible;
Put up signage to encourage employees to only fill the kettle as much as they
need for one drink;
Reduce the temperature in your office to 21 degrees.
Run a recycling campaign and put up signage to educate employees on what,
and how to recycle different materials;
Consider installing a modern high-speed hand-dryer in place of paper towels or
old style dryers;
Encourage your employees to be healthier and take the stairs instead of the lift;
Set up a switch-off campaign and remind employees to switch off electric fans
or desk lamps when away from their desks and at the end of the day;
Purchase a timer to automatically switch off the water cooler at the end of
the day;
Set up a switch-off campaign and remind employees to switch off printers,
faxes, and photocopiers at the end of the day;
Set dishwashers to economy setting and put signage to remind employees that
it’s more efficient to run the dishwasher when fully-loaded;
Set up a switch-off campaign and remind your employees to unplug their phone
chargers when they’re not in use;
Set up a water-saving campaign to remind your employees to make sure they
report leaky taps or showers;
Ensure fridges are set to 4 degrees Celsius, aren’t overstocked, and door seals
are clean and secure;
Set up a switch-off campaign and remind employees not to leave audio-visual
equipment switched on or on standby when not in use;
Switch off some or all of the artificial lighting in areas of the office that are
sufficiently lit by natural daylight;
Set up a switch off campaign to remind employees to switch off the lights in a
room that is empty, and at the end of day.
No
Yes
Yes
No
Yes
Yes
No
No
Yes
Yes
No
Yes
No
Yes
No
No
Yes
Yes
Yes
Table A.2: Carbon Trust business energy efficiency measures
Measure Description Behavioural change measure?
Source: Carbon Trust

42
The Power of Carbon Psychology
There are notable differences in the degree of savings that could be achieved through the different behavioural change measures identified in Table A.2 above. In Table A.3 below we rank behavioural change measures by potential savings, using the example of a business with 100 employees:
Not all of the behavioural change measures listed in Table A.2 above may be feasible across all businesses. For example, a micro business is unlikely to encourage staff to use the stairs instead of a lift within an office building; this measure is only likely to be achievable by medium or large businesses. At the
same time, it is reasonable to assume that all businesses should be capable of encouraging staff to efficiently use office equipment.
Table A.4 below sets out which measures are assumed to be feasible by business category:
Audio visual equipment
Mobile phone chargers
Office equipment
Desk lamps and electric fans
Lifts
Kettles
Natural lighting
Office temperature
Computers and monitors
Office lighting
£1
£5
£54
£74
£78
£275
£330
£413
£1,293
£1,716
Behavioural change measure Savings
Source: Carbon Trust
Source: Cebr analysis
Table A.1: Business categories by size
Table A.4: Behavioural change measures assumed to be feasible by business size
Computers and monitors
Kettles
Mobile phone chargers
Office equipment
Audio visual equipment
Desk lamps and electric fans
Office temperature
Lifts
Natural lighting
Office lighting
Yes
Yes
Yes
Yes
No
No
No
No
No
No
Yes
Yes
Yes
Yes
Yes
Yes
Yes
No
No
No
Yes
Yes
Yes
Yes
Yes
Yes
Yes
Yes
Yes
Yes
Yes
Yes
Yes
Yes
Yes
Yes
Yes
Yes
Yes
Yes
Behavioural change measure Micro Small Medium Large

43
A Report for npower Business Solutions
Finally, we have made assumptions to reflect the inherent uncertainty associated with the impact of behavioural change, we have attempted to accommodate this by basing our analysis on three different scenarios: “cautious”, “moderate” and “optimistic”. These scenarios assume varying levels of success in implementing behavioural change, ranging from relatively straightforward measures (such as efficient use of kettles and computers). The “optimistic” scenario assumes that all of the behavioural change measures listed in Table A.2 are successfully introduced across all of the UK businesses in which these measures can be feasibly implemented. Introducing these scenarios into our analysis is useful for two reasons: firstly, they reflect the strong likelihood that many UK businesses will have already
attempted to introduce or encourage some forms of behavioural change amongst their employees. Secondly, they provide a “sense check” in terms of feasible change that could be realistically achieved given variations in energy usage across sectors. The three scenarios are listed in Table A.5 below:
Approach II: Combining DECC pricing and consumption data with the Business Population Estimates Here we detail the methodology behind our second approach, which acts as a “sense-check” to the first approach above by drawing upon electricity and gas consumption and pricing data previously published by DECC, as well as alternative assumptions for the potential savings from behavioural change.
For the second approach, we have utilised existing DECC estimates for electricity and gas costs per size of business as determined by energy usage. These statistics are released as part of the DECC’s former statistical pricing series prior to the Department’s abolition.40 The prices per unit of
electricity and gas (measured by pounds per KWh), both of which are disaggregated by the different business categories shown in Table A.1 above.
The approximate price of electricity and gas by business size is then shown in Table A.6 below:
Source: DECC, Cebr analysis
Table A.6: Industrial energy prices, £ per Kilowatt hour (KWh)
Source: Cebr analysis
Table A.5: Different scenarios based and the behavioural change measures assumed to be introduced
Mobile phone chargers
Kettles
Computers and monitors
Electric fan heaters
Office temperature
Audio visual equipment
Office equipment
Natural lighting
Desk lamps and electric fans
Office lighting
Yes
Yes
Yes
Yes
No
No
No
No
No
No
Yes
Yes
Yes
Yes
Yes
Yes
Yes
Yes
No
No
Yes
Yes
Yes
Yes
Yes
Yes
Yes
Yes
Yes
Yes
Behavioural change measure Cautious Moderate Optimistic
Micro
Small
Medium
Large
£0.13
£0.12
£0.10
£0.10
£0.04
£0.03
£0.03
£0.02
Business size Electricity price per KWh Gas price per KWh
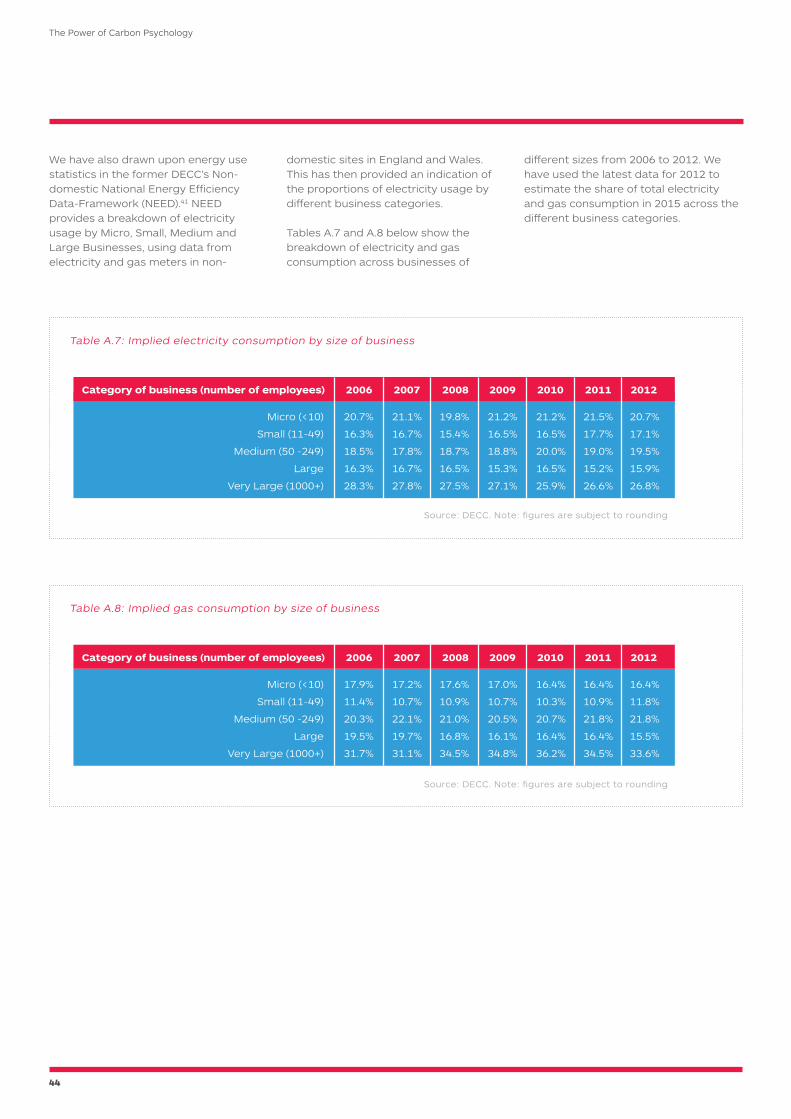
44
The Power of Carbon Psychology
We have also drawn upon energy use statistics in the former DECC’s Non-domestic National Energy Efficiency Data-Framework (NEED).41 NEED provides a breakdown of electricity usage by Micro, Small, Medium and Large Businesses, using data from electricity and gas meters in non-
domestic sites in England and Wales. This has then provided an indication of the proportions of electricity usage by different business categories.
Tables A.7 and A.8 below show the breakdown of electricity and gas consumption across businesses of
different sizes from 2006 to 2012. We have used the latest data for 2012 to estimate the share of total electricity and gas consumption in 2015 across the different business categories.
Source: DECC. Note: figures are subject to rounding
Source: DECC. Note: figures are subject to rounding
Table A.7: Implied electricity consumption by size of business
Table A.8: Implied gas consumption by size of business
Micro (<10)
Small (11-49)
Medium (50 -249)
Large
Very Large (1000+)
Micro (<10)
Small (11-49)
Medium (50 -249)
Large
Very Large (1000+)
20.7%
16.3%
18.5%
16.3%
28.3%
17.9%
11.4%
20.3%
19.5%
31.7%
21.2%
16.5%
20.0%
16.5%
25.9%
16.4%
10.3%
20.7%
16.4%
36.2%
19.8%
15.4%
18.7%
16.5%
27.5%
17.6%
10.9%
21.0%
16.8%
34.5%
20.7%
17.1%
19.5%
15.9%
26.8%
16.4%
11.8%
21.8%
15.5%
33.6%
21.1%
16.7%
17.8%
16.7%
27.8%
17.2%
10.7%
22.1%
19.7%
31.1%
21.5%
17.7%
19.0%
15.2%
26.6%
16.4%
10.9%
21.8%
16.4%
34.5%
21.2%
16.5%
18.8%
15.3%
27.1%
17.0%
10.7%
20.5%
16.1%
34.8%
Category of business (number of employees)
Category of business (number of employees)
2006
2006
2008
2008
2010
2010
2007
2007
2009
2009
2011
2011
2012
2012

45
A Report for npower Business Solutions
Finally, we have applied different assumptions for the potential savings that businesses of different size could achieve through behavioural change. As with the first approach, we have produced three different scenarios which reflect different levels of savings. These assumptions are informed by the
existing estimates of potential business savings sourced from nBS, DECC and the academic literature discussed earlier in this report. Potential savings are set to be higher for larger businesses in the Moderate and Optimistic scenarios to reflect their greater scope to foster behavioural change.
Table A.9 below sets out the savings assumptions applied:
Source: Cebr analysis
Table A.9: Behavioural change saving scenarios
Micro
Small
Medium
Large
2%
2%
3%
6%
6%
6%
9%
10%
3%
3%
6%
9%
Potential energy savings by category of business
Cautious OptimisticModerate

46
The Power of Carbon Psychology
References1 In July 2016 DECC merged with the Department of Business,
Innovation and Skills (BIS) to form the new Department of Business, Energy and Industrial Strategy (BEIS). The new department brings together responsibilities for business, industrial strategy, science, innovation, energy, and climate change. This report references insight and analysis produced by DECC and BIS prior to their merger.
2 DECC Energy Efficiency Strategy, 2013 Update
3 IEA, http://www.iea.org/topics/energyefficiency/
4 Whilst related, energy efficiency should not be confused with energy intensity; the latter is a broader concept which represents the quantity of energy required to produce each additional unit of Gross Domestic Product (GDP) or Gross Value Added (GVA)
5 IEA (2012). Energy Policies of IEA countries: The United Kingdom 2012 review
6 GVA is also commonly known as income from production and is distributed in three directions – to employees, to shareholders and to government. GVA tends to be used for measuring things like regional gross domestic product and other measures of economic output of entities that are smaller than the whole economy – therefore it is appropriate for use here to measure the economic contribution of industry.
7 BEIS (2016). Energy Consumption in the UK
8 ADEME (2015).”Energy Efficiency Trends and Policies in Industry: An Analysis Based on the ODYSSEE and MURE databases”
9 European Energy Agency (2016). Progress on Energy Efficiency in Europe
10 Ibid.
11 Dolan, P, and Metcalfe, R. (2015) "Neighbors, knowledge, and nuggets: two natural field experiments on the role of incentives on energy conservation." Becker Friedman Institute for Research in Economics Working Paper 2589269.
12 Abrahamse, W., & Steg, L. (2011). Factors Related to Household Energy Use and Intention to Reduce It: The Role of Psychological and Socio-Demographic Variables. Human Ecology Review, 18(1), pp.30-40.
13 ADEME (2015). “Energy Efficiency Trends and Policies in the Household and Tertiary Sectors: An Analysis Based on the ODYSSEE and MURE databases”
14 ODEX is an index weighting the energy efficiency progress by end-use/appliance measured from changes in specific consumption measured in different units, including heating, water heating, cooking, refrigerators, freezers, washing machines, dishwashers and TVs.
15 IEA Data Services (2016). http://data.iea.org/
16 Countries included in the IEA R&D expenditure dataset are Australia, Austria, Belgium, Canada, Czech Republic, Denmark, Estonia, Finland, France, Germany, Greece, Hungary, Ireland, Italy, Japan, South Korea, Luxembourg, Netherlands, New Zealand, Norway, Poland, Portugal, Slovakia, Spain, Sweden, Switzerland, Turkey, the UK and the US.
17 ADEME, ODYYSEE MURE project (2016). http://www.odyssee-mure.eu/
18 For more information, please see the following: http://www.measures-odyssee-mure.eu/MureScoreboardMethodology.pdf
19 DECC (2015). Updated energy and emissions projections
20 ADEME, ODYYSEE MURE (2015). “Synthesis: Energy Efficiency Trends and Policies in the EU”
21 DECC (2012). “What are the factors influencing energy behaviours and decision-making in the non-domestic sector?”
22 EEA (2013). “Achieving energy efficiency through behaviour change: what does it take?” Technical report 5/2013
23 Ibid.
24 Altan, H. (2010). “Energy efficiency interventions in UK higher education institutions.” Energy Policy, 38: 7722. Kidlington, United Kingdom.
25 Cox, A., Higgins, T., Gloster, R., Foley, B, Darnton, A. (2012). “The Impact of Workplace Initiatives on Low Carbon Behaviours.” Scottish Government Social Research.
26 CBI (2013). “Shining a light: Uncovering the business energy efficiency opportunity.”
27 TUC Touchstone Extras pamphlet #14. (2015) “Money to Burn? Driving energy efficiency in the commercial sector”
28 IoD Policy Paper (2008). “Energy Efficiency: Joining the useless energy generation”
29 The Association for the Conservation of Energy (2003). “Energy efficiency in offices: Assessing the situation”
30 The Association for the Conservation of Energy (2003). “Energy efficiency in offices: motivating action”
31 The Carbon Trust (2013). “Low Carbon Behaviour Change: the £300 million opportunity”
32 Cambridge Architectural Research (2012). “How much energy could be saved by changing everyday household behaviours?”
33 Parliamentary Office of Science and Technology (2012). “Energy Use Behavioural Change”
34 DECC (2015). SME Energy Efficiency Guide
35 Daily Telegraph (28th March 2016). “Business could save £1bn through energy behaviour change”
36 The Carbon Trust. Empower savings calculator, https://www.carbontrust.com/resources/tools/empower-savings-calculator
37 ONS Supply Use tables, intermediate consumption 2013.
38 Ibid.
39 BIS (now BEIS), Business Population Estimates 2015
40 DECC (2016). Gas and electricity prices in the non-domestic sector, Industrial Energy Price Statistics
41 DECC, https://www.gov.uk/government/statistics/the-non-domestic-national-energy-efficiency-data-framework-nd-need

47
A Report for npower Business Solutions
Notes

Business SolutionsQuarterly report
Summer 2015
BusinessSolutions