Business Review: August 1972
16
This publication was digitized and made available by the Federal Reserve Bank of Dallas' Historical Library ([email protected])
Transcript of Business Review: August 1972

This publication was digitized and made available by the Federal Reserve Bank of Dallas' Historical Library ([email protected])

Cotton Crop-
Prices Stimulating Output May Tend to Dampen Demand -fh~6~cts for cotton growers are Aft rIghtest in several decades. ti er years of chronic overproduc-
seon, they ended their 1970-71 ason 'th in 20 WI the smallest carryover
Car Years. And an even smaller 197?~ver is expected from the
13 - 2 se~son ended August l. dro Y.plantmg time this spring, the lrJ.a;k~ SU?ply had boosted average hi h t prICes more than 40 percent hi:h er than a year before-to the And ~st level since the Korean war. plans n r~sponse, growers made
But to Increase production. hein even as more acreage was sh g planted, the rise in prices and co~:tage of supply were eroding crea~? markets here and abroad, req .Ing the possibility that market o\Te~ments might eventually be agai en. If so, growers could lelrJ. n have to cope with the probing 100f Ov~rsupply and accompanythe W PrIces that have plagued
tn for years. es7~ o.u~l?ok-and even the faintlrJ.i h sSIbIlity that its brightness
g t fade in time-is vastly im-
portant in the Eleventh Federal Reserve District, where cotton is far and away the most important crop. With cotton accounting for nearly 40 percent of the gross farm income from crops in the District states (Arizona, Louisiana, New Mexico, Oklahoma, and Texas), prospects for cotton obviously affect the economic outlook for the whole region.
On the supply side, the future depends to a great extent on weather conditions and programs affecting plantings. But the supply of cotton is also sensitive to price changes. As in the current situation, a sharp increase in prices one year tends to increase production the next.
On the demand side, the future depends partly on such factors as the continued growth of the total fiber market, trends in fashions, and possible effects of the research and promotional efforts recently undertaken by the cotton industry. But again, price is an important factor.
....... ------------------------------Cotton t· . but ,s .'11 In Southeast
PrOd . ' uctlon areas drift westward
SOlJIlCE' .lJ .S . Department of Agriculture
............... ~~.~---------------------------------------
llless Review I August 1972
Substantial increases in cotton prices tend not only to increase production but also to reduce demand-an~ on two fronts. One is by encouragmg further substitution of synthetic fibers. The other is by encouraging further increases in foreign production, which has already been cutting into export demand for cotton.
Thus, despite the favorable outlook, growers are still left with the delicate problem of striking a balance between supply and demand. The task is still to produce a stable supply of cotton at prices that will provide an adequate return to labor, capital, and management without encouraging major shifts to alternative sources of fiber.
Causes of the short supply
Three main factors were at work in the reversal of the long-standing overproduction situation.
• Changes in Government programs-Designed t9, make cotton more competitive with other fibers by putting a ceiling on support prices, Government cotton programs of recent years have encouraged growers to cut production. Where 14 million acres were planted in 1965, only 9.4 million were planted two years later. And while planted acreage later increased, harvested acreage had still not exceeded 12 million acres in 1971.
• Several disappointing crop years-Lo~er yields combined with reduced acreage to hold production well below the levels originally intended. As a result, supplies shrunk from a record carryover of 17 million bales in 1965 to an estimated carryover of less than 3.5 million at the start of the 1972-73 season.
1
Nation's end-ot-season supplies help shape world cotton carryover
MILLION BALES
35-------------------------30-
20
5-
o 1 1 1 1 I I '40 '45 '50 '55 '60 '65 '70
1971 preliminary SOURCE: U.S. Department of Agriculture
Rise in productivity sharply cuts labor used to produce U.S. cotton
MAN HOURS PER BALE
200~---------------------
01 1 1 1 1 1 1 '40 '45 '50 '55 '60 '65 '70
SOURCE: U.S. Department of Agriculture
2
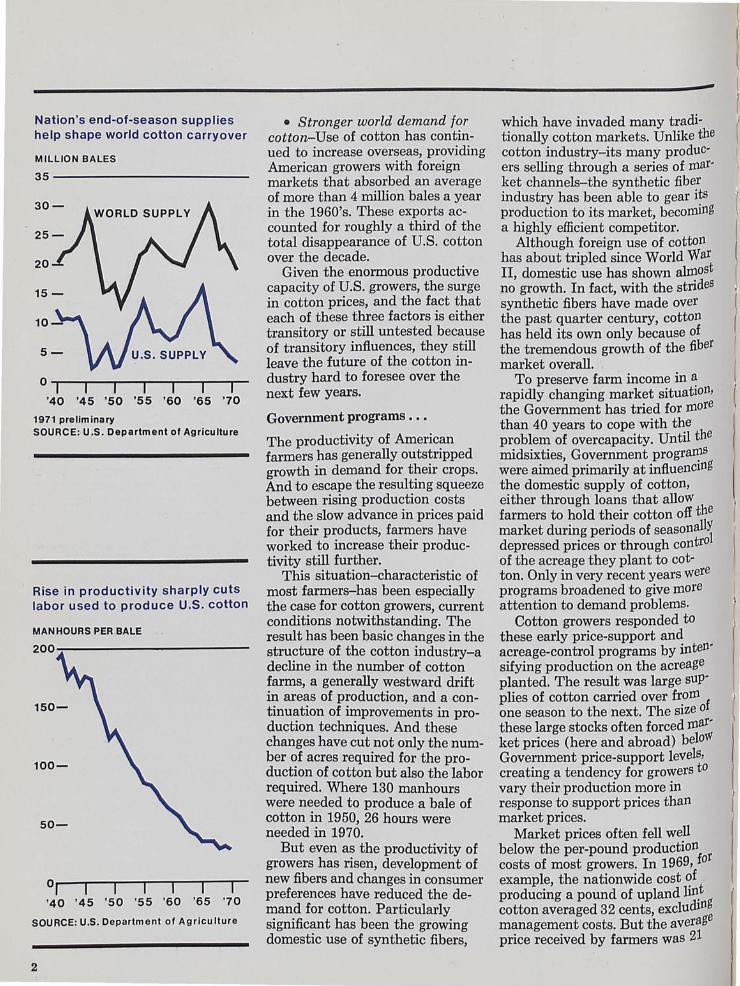
• Stronger world demand for cotton-Use of cotton has continued to increase overseas, providing American growers with foreign markets that absorbed an average of more than 4 million bales a year in the 1960's. These exports accounted for roughly a third of the total disappearance of U.S. cotton over the decade.
Given the enormous productive capacity of U.S. growers, the surge in cotton prices, and the fact that each of these three factors is either transitory or still untested because of transitory influences, they still leave the future of the cotton industry hard to foresee over the next few years.
Government programs ..•
The productivity of American farmers has generally outstripped growth in demand for their crops. And to escape the resulting squeeze between rising production costs and the slow advance in prices paid for their products, farmers have worked to increase their productivity still further.
This situation-characteristic of most farmers-has been especially the case for cotton growers, current conditions notwithstanding. The result has been basic changes in the structure of the cotton industry-a decline in the number of cotton farms, a generally westward drift in areas of production, and a continuation of improvements in production techniques. And these changes have cut not only the number of acres required for the production of cotton but also the labor required. Where 130 manhours were needed to produce a bale of cotton in 1950, 26 hours were needed in 1970.
But even as the productivity of growers has risen, development of new fibers and changes in consumer preferences have reduced the demand for cotton. Particularly significant has been the growing domestic use of synthetic fibers,
-which have invaded many traditionally cotton markets. Unlike the cotton industry-its many producers selling through a series of market channels-the synthetic fiber industry has been able to gear its production to its market, becoming a highly efficient competitor.
Although foreign use of cotton has about tripled since World War II, domestic use has shown almost no growth. In fact, with the strides synthetic fibers have made over the past quarter century, cotton has held its own only be'cause of the tremendous growth of the fiber market overall.
To preserve farm income in ~ rapidly changing market situatIOn, the Government has tried for more than 40 years to cope with the' problem of overcapacity. Until the midsixties, Government prograD?s were aimed primarily at influencIng the domestic supply of cotton, either through loans that alloW farmers to hold their cotton off the market during periods of seasonall) depressed prices or through contro of the acreage they plant to cotton. Only in very recent years were programs broadened to give more attention to demand problems.
Cotton growers responded to these early price-support and acreage-control programs by intensifying production on the acreage planted. The result was large supplies of cotton carried over from one season to the next. The size of these large stocks often forced market prices (here and abroad) beloW Government price'-support levels, creating a tendency for growers to vary their production more in response to support prices than market prices.
Market prices often fell well below the per-pound production
f r
costs of most growers. In 1969, 0
example, the nationwide cost ~f producing a pound of upland lin.t cotton averaged 32 cents, excluding management costs. But the aver~ge price received by farmers was 2
-AVERAGE COSTS OF PRODUCING A BALE OF U.S. UPLAND COTTON
-----------------------------------------------------------Item 1966 1969 ----------------~~------------------~-------------------
Per bale (500 pounds gross weight) Labor . .. .. ... ... . .. . .... . . . .... . ...... . Power and equipment .. .. ........... . ... .
$25.78 34.54 25.59
$23.20 44.84 29.38
4.44 Materials ....... . ...... ... .. .... .. . . . .. .
Seed .. . . ........ " .' . . " .. . ........ " 3.30 11 .74 3.45 5.95 .93
Fertilizer . . . ..... .. ............ .. .. .. . 11.51 4.81 7.17 1.24
Herbicides ... . ... . .. . ................ . Insecticides and fungicides . . .. . ... . . . .. . Defoliants ......... .. ..... . .... . ..... . Other chemicals ......... .. .. . .... . . .. . .23 .21
19.47 10.46 8.30 2.87
138.52
Ginning, bagging, and ties .. ... . ...... . ... . Custom services ... . . ......... ..... . .. . . .
18.36 8.25 8.51 2.12
Irrigation ..... . ........ . . . .. . .... . ..... . Interest on operating capital . .......... .. . .
Total direct costs . ... . ... .. .. . ...... . 123.17 22.65 12.96
158.78 -25.94 132.84
Land .. .. . . ......... .......... . ..... . .. . 24.40 14.40
177.32 -17.08 160.24
General overhead . ... . ............ . .. . .. . Total cost of lint and associated seed .. . Less value of seed produced ......... .
Cost of lint .... . .. . ... . .. . .. . ..... . Per pound of lint
Total cost .. . ... .. .... . . . .. . . . .. . ... . . . . 01 rect cost ........ . . ........... . . ..... . .
.266
.206
.305
.320
.250
.360 ___ Receipts' ..... . .. . .. . ... . ...... .. ...... .
~O~~ludes support payments In both 1966 and 1969 but excludes diversion payments In 1966 SOUR~ Details may not add to totals bacause of rounding.
E: U.S. Department of Agriculture
Cents. Under such circumstances, Cotton farmers had to rely on ~o~ernment programs to stay in
USlUess. In the midsixties, however, pro
grams began reflecting a newfound e~Phasis on efforts to counter the S eady erosion in demand for cotton.~y improving its competitive P?Sltlon. While attention was still ~l\Ten to the problems of overpro-.Uction, new programs were de~lgned to allow the price of cotton ° seek competitive levels at home
and abroad. p With the Cotton Research and {Ornotion Act of 1966, for examih e, active efforts were initiated for
l> e C?tton industry to reach for exthnSlon of its markets. And with e e Agricultural Act of 1970, new I fforts in acreage controls placed eSS ernphasis on rigid allotments.
... seek new directions
:ew directions in Government pro-19arns were apparent as early as th 64. The Agricultural Act passed
at Year eliminated subsidies on b\ts' lness Review I August 1972
foreign sales of cotton that had left domestic mills paying 6 to 9 cents a pound more for U.S. cotton than their counterparts overseas. Until then, programs concentrating on overproduction had created a situation that allowed foreign mills to ship their textiles into the United States at a considerable competitive advantage.
Although designed also to reduce the carryover, which had reached well over 14 million bales, the new program nevertheless reduced cotton acreage only slightly that year and the next. With increased yields, production held close to 15 million bales. Domestic use increased but exports declined, causing the carryover to climb to a record of nearly 17 million bales in August 1966. And since the Commodity Credit Corporation owned most of the stocks, costs of the cotton program rose.
Intended to make cotton more competitive with other fibers, the Agricultural Act of 1965 set a ceiling on loan rates at 90 percent of
the estimated world price of cotton. But to maintain farm income, the new program also provided for direct payments to cooperating producers on 65 percent of their basic cotton allotments.
This legislation marked the turning point in the buildup of the cotton carryover. Disappearance of cotton i~creased only slightly, but productIOn dropped sharply, reducmg the carryover more than 10 million bales in just two years.
The most direct Government effort to influence demand came with the Cotton Research and Promotion Act of 1966. By providing for the collection of $1 a bale from upland cotton producers to be used in research and promotion, this legislation established a program of self-help in the expansion of cotton markets. Principal areas of study under the program have been the costs of producing and marketing cotton and the improvement of cotton products.
The Agricultural Act of 1970 eliminated the old system of rigid crop-by-crop allotments. By giving farmers more freedom of decision in adjusting to projected demand for their cotton, the program provides new opportunities for the industry to become more competitive in production costs and to produce the amounts and varieties of cotton sought in foreign and domestic markets.
The supply situation
The imponderable in agriculture is, of course, the weather. And reductions in acreage combined with a series of unfavorable turns in the weather after 1965 to cause production to plummet, throwing cotton into increasingly short supply. From 30 million bales in 1965-a high that had been reached only once before-supplies fell to a low of less than 15 million in 1971.
Supplies had fluctuated widely over the years prior to 1965. But for 15 years, crops had averaged
3

about 14 million bales. Being typically more than enough to meet demand, production added steadily to the buildup in stocks-despite Government efforts to hold back production. During those years, acreage was cut in half. But with improvements in cultivation, yields almost doubled, reaching a record average of 527 pounds per acre in 1965.
Since 1966, however, crops have averaged less than 10 million bales. Where 14.2 million acres were planted in 1965, 12.4 million were planted in 1971. And where yields averaged 527 pounds per harvested acre in 1965, they averaged 438 in 1971. The net result was a drop in output from 15 million bales in 1965 to 10.5 million in 1971.
With estimates of mill use and exports totaling more than 11 million bales, stocks at the beginning of the 1972-73 season probably total a million bales less than the 4.3 million last August. Although a
Recent cotton crops reduced by lower acreages and yields
1947-49=100
200------------------------
150-
\. \.
" " ~'-'-50- 'I \~",
HARVESTED ACREAGE ~~
I I I '53 '59 '65 '71
1971 preliminary SOURCE: U.S. Department of ~griculture
4
new crop is coming on, this stock, in itself, would not be enough to meet foreign and domestic demand for more than four months.
Against this backdrop of short supply, cot ton prices have advanced sharply. Average spot market prices for upland cotton rose 5 cents a pound in the second half of 1971. And by early 1972, prices were 10 cents higher than a year before.
In response, farmers reported early this year that they intended to plant 13.5 million acres to cotton-10 percent more than in 1971. Even if yields are no more than the very low 1966-71 average, the upland harvest will be nearly 12 million bales. The largest crop since the 1965 season, this is very apt to be more than the disappearance.
The demand situation
Disappearance depends on sales to textile mills in this country and shipments of raw cotton abroad. In contrast to its once very rapid growth (a twofold increase from the early 1930's through the early 1940's), domestic mill use has been fairly stable since World War II, ranging from 8 million to 10 million bales a year. During that time, exports have fluctuated between 2 million and 7.6 million bales a year. In more recent years, however, the combined disappearance has been closer to 11 million bales.
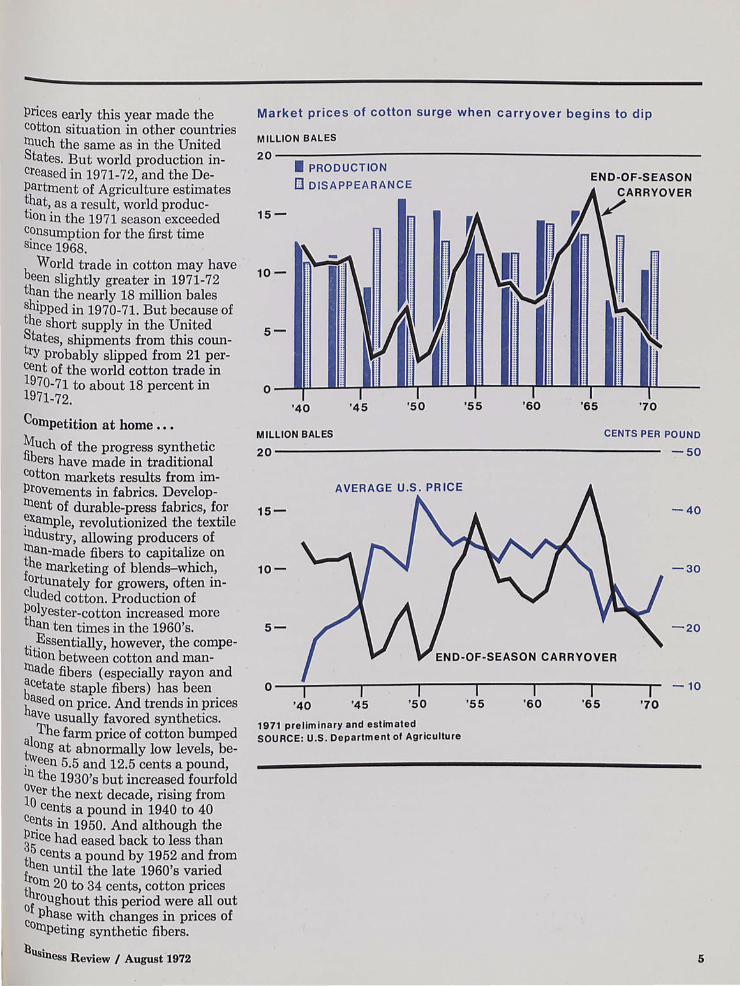
Still a major fiber, accounting for roughly two-fifths of the' domestic fiber market, cotton has, nevertheless, been losing ground to synthetics for many years. From the early depression years through the early years of the war, annual domestic consumption of all fibers increased from a little more than 3 billion pounds to nearly 7 billion. Consumption of cotton followed a similar trend, more than doubling from 1930 to 1942.
After the war, however, growth in domestic demand for cotton began to slow-eventually showing
-little change for the 1960's. Mill use of all fibers increased rapidly, climbing from 7.5 billion pounds (cotton equivalent) in 1961 to almost 15.3 billion in 1971. Although demand for cotton increased nearly a fourth in the first half of the decade, losses in the second half left the domestic market with only a nominal increase. Where mill demand totaled 4 billion pounds in 1961, it still was only 4.2 billion in 1971.
Despite intense competition from man-made fibers, however, cotton apparently held its own at mills in the season just ended-at le'ast in absolute terms and probably because of the popularity of two fabrics. Production of cotton denims and corduroy accounted for about 12 percent of the cotton industry's domestic market in the 1971 season, compared with 8 percent in the season before. The boost to cotton from demand for these fabrics may, however, no more than offset losses in other cotton markets, leaving total domestic consumption about the d same as the 8.1 million bales use in 1970-71.
Meanwhile, consumption of man-made fibers has continued to move ahead. Claiming an everincreasing share of the growing textile market, synthetics have left cotton with a mill market that, while fairly stable in absolute amount, has represented a shrinking share of the domestic fiber market overall.
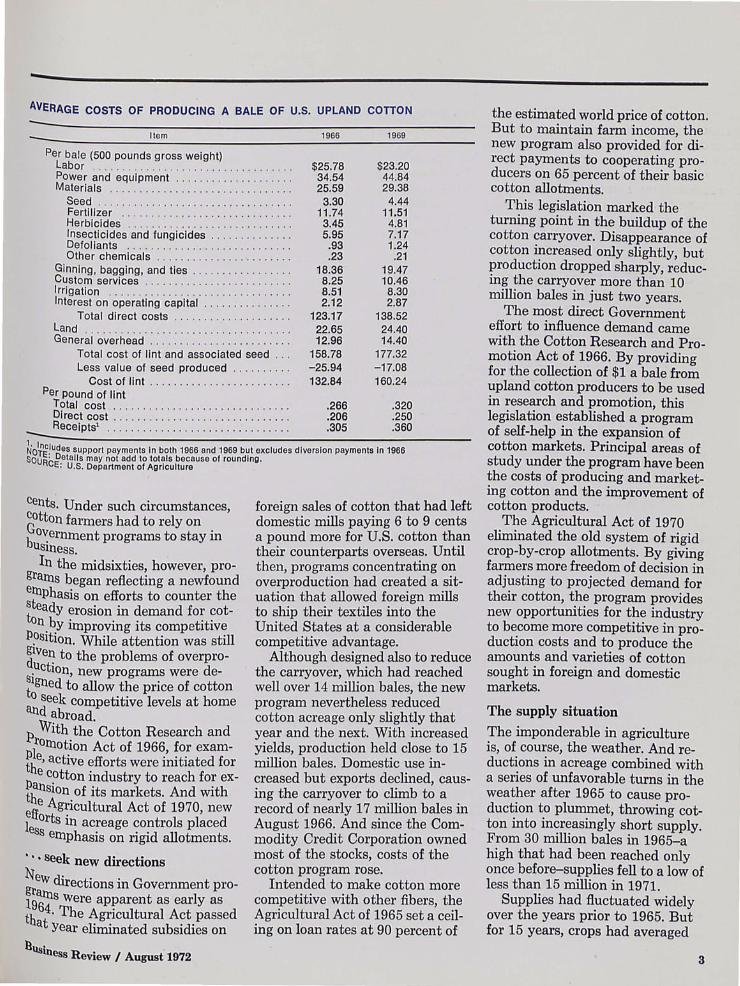
Important to the shift in shares of this market have been the relative prices of cotton and synthetics. For instance, while cotton prices were moving up sharply in 1971 and early 1972 as a result of the short supply of cotton, prices of man-made fibers were showing little change.
Competition in world cotton. markets also remains stiff, desPlte the recent increase in world demand. Tight supplies and high
-prices early this year made the cotton situation in other countries tnuch the same as in the United States. But world production increased in 1971-72, and the Department of Agriculture estimates t~at, as a result, world produc-hon in the 1971 season exceeded C?nsumption for the first time Slllce 1968.
World trade in cotton may have been slightly greater in 1971-72 th~n the nearly 18 million bales ~hhlpped in 1970-71. But because of
e short supply in the United States, shipments from this country probably slipped from 21 percent of the world cotton trade in 1970-71 to about 18 percent in 1971-72.
Competition at home ...
~uCh of the progress synthetic bers have made in traditional
cotton markets results from improvements in fabrics. Developtnent of durable-press fabrics, for ~Jrample, revolutionized the textile llldustry, allowing producers of lUau-made fibers to capitalize on the marketing of blends-which, fortunately for growers, often inclUded cotton. Production of iholyester-cotton increased more
an ten times in the 1960's. t. ~ssentially, however, the compe-Ihon between cotton and man
tnade fibers (especially rayon and bcetate staple fibers) has been h ased on price. And trends in prices
aVe usually favored synthetics. I The farm price of cotton bumped ~ng at abnormally low levels, be. een 5.5 and 12.5 cents a pound, tn the 1930's but increased fourfold ~~er the next decade, rising from
cents a pound in 1940 to 40 Cents in 1950. And although the ~~ce had eased back to less than th cents a pound by 1952 and from fr en until the late 1960's varied tl~rn 20 to 34 cents, cotton prices of Oughout this period were all out
phase with changes in prices of COtnpeting synthetic fibers.
llUs' lness Review I August 1972
Market prices of cotton surge when carryover begins to dip
• PRODUCTION
[] DISAPPEARANCE
15-
10-
5-
'40
MILLION BALES
20
15-
10-
5-
'45 '50 '55 '60
END-OF-SEASON CARRYOVER
'65 '70
CENTS PER POUND
-50
-40
-30
-20
END-OF-SEASON CARRYOVER
o--~----r----.-----r----I,-----rl ----.-, '40 '45 '50
1971 preliminary and estimated SOURCE: U.S . Department of Agriculture
'55 '60 '65 '70
-10
5
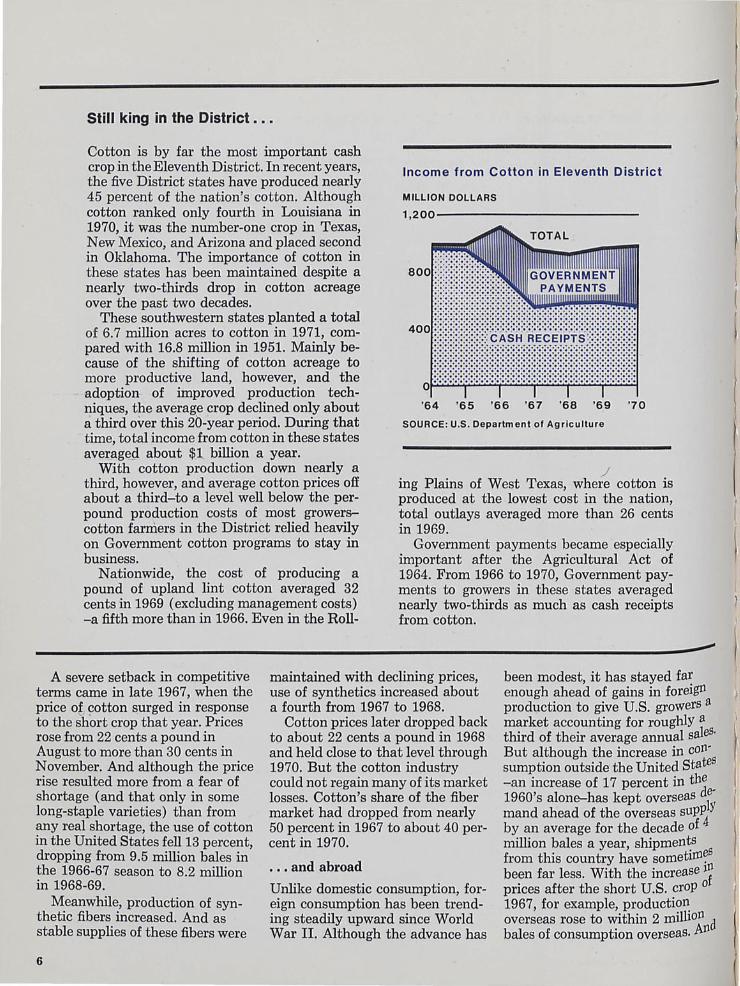
-Still king in the District . ..
Cotton is by far the most important cash crop in the Eleventh District. In recent years, the five District states have produced nearly 45 percent of the nation's cotton. Although cotton ranked only fourth in Louisiana in 1970, it was the number-one crop in Texas, New Mexico, and Arizona and placed second in Oklahoma. The importance of cotton in these states has been maintained despite a nearly two-thirds drop in cotton acreage over the past two decades.
Income from Cotton in Eleventh District
MILLION DOLLARS
These southwestern states planted a total of 6.7 million acres to cotton in 1971, compared with 16.8 million in 1951. Mainly because of the shifting of cotton acreage to more productive land, however, and the adoption of improved production techniques, the average crop declined only about a third over this 2b-year period. During that time, total income from cotton in these states aveI:ag~.d about $1 billion a year.
'64 '65 '66 '67 '68 '69 '70
SOURCE: U.S. Department of Agriculture
.J With cotton production down nearly a third, however, and average cotton prices off about a third-to a level well below the perpound production costs of most growers-cotton farmers in the District relied heavily on Government cotton programs to stay in business.
ing Plains of West Texas, where cotton is produced at the lowest cost in the nation, total outlays averaged more than 26 cents in 1969.
Nationwide, the cost of producing a pound of upland lint cotton averaged 32 cents in 1969 (excluding management costs) -a fifth more than in 1966. Even in the Roll-
Government payments became especially important after the Agricultural Act of 1964. From 1966 to 1970, Government payments to growers in these states averaged nearly two-thirds as much as cash receipts from cotton.
A severe setback in competitive terms came in late 1967, when the price ot cotton surged in response to the short crop that year. Prices rose from 22 cents a pound in August to more than 30 cents in November. And although the price rise resulted more from a fear of shortage (and that only in some long-staple varieties) than from any real shortage, the use of cotton in the United States fell 13 percent, dropping from 9.5 million bales in the 1966-67 season to 8.2 million in 1968-69.
Meanwhile, production of synthetic fibers increased. And as stable supplies of these fibers were
6
maintained with declining prices, use of synthetics increased about a fourth from 1967 to 1968.
Cotton prices later dropped back t<;> about 22 cents a pound in 1968 and held close to that level through 1970. But the cotton industry could not regain many of its market losses. Cotton's share of the fiber market had dropped from nearly 50 percent in 1967 to about 40 percent in 1970.
... and abroad
Unlike domestic consumption, foreign consumption has been trending steadily upward since' World War II. Although the advance has
been modest, it has stayed fa~ enough ahead of gains in foreIgn production to give U.S. growers a market accounting for roughly a third of their average annual saleS· But although the increase in con-s sumption outside the United State -an increase of 17 percent in the
de-1960's alone-has kept overseas ly mand ahead of the overseas sup~ by an average for the decade of million bales a year, shipment;s s from this country have sometIln~!l been far less. With the increase If prices after the short U.S. crop a 1967, for example, production overseas rose to within 2 million d bales of consumption overseas. An

-
.........
... and especially in Texas
Texas alone produces nearly a third of the nation's cotton-and on little more than 3 percent of the state's land. Forty years ago, ahnost a tenth of the area of the state was taken up in cotton.
With the shrinkage in the acreage assigned to cotton has also come a shift in its location. Three-fourths of the state's cotton is now grown in West Texas. A century ago, all the cotton was grown in East Texas.
Cotton production in Texas has been moving westward since the turn of the century. The movement has been spurred in recent years by technological advances that lend themselves to large farms and by the development of irrigated areas in West Texas, particularly on the High Plains. Meanwhile, marginal land has been retired from cotton production in East Texas, where much of agriculture has been converted to the production of beef cattle, once primarily a product of West Texas. West Texas grew only 9 percent of the state's cotton at the turn of the century and little more than half the crop at midcentury.
The largest crop produced in Texas was in the 1949-50 season. More than 6 million bales were harvested that season from just over 11 million acres. That made an average yield of 261 pounds per acre. Improved cultural practices pushed yields to 410 pounds per acre in 1968, but setbacks from weather and other adverse growing conditions have since held yields below that level. Yields averaged 282 pounds per acre in the 1971-72 season. Reflected in this recent drop were drouth conditions that impacted on dryland crops and a late, cool spring in the irrigated High Plains that combined with an early, wet fall to cut yields there.
The average price received by Texas farmers for cotton has varied widely. It was 39 cents a pound in 1950 but by 1966 had slipped to slightly more than 17 cents, the lowest price since 1941. There was a sharp comeback in 1971, however, when the price ranged from 26 to 30 cents a pound most of the harvest season.
It has been estimated that the basic dollar originating from the production of cotton and cottonseed generates 3.5 times
nUs' Iness Review I August 1972
Acres Planted to Cotton
MILLION
30----------~--------------------
UNITED STATES
o I I I I I I '40 '45 '50 '55 '60 '65 '70
SOURCE : U.S. Department of Agriculture
Average Yield Per Harvested Acre
POUNDS
600----------------------~------
o I I '40 '45 '50 '55 '60 '65 '70
1971 preliminary SOURCE: U.S. Department of Agriculture
that amount in related agribusiness. On that basis, the Texas cotton crop in 1970, with cash receipts of $355 million, excluding Government payments, generated in excess of $12 billion in agribusiness. Receipts of $547 million for all five District states generated nearly $2 billion .
7
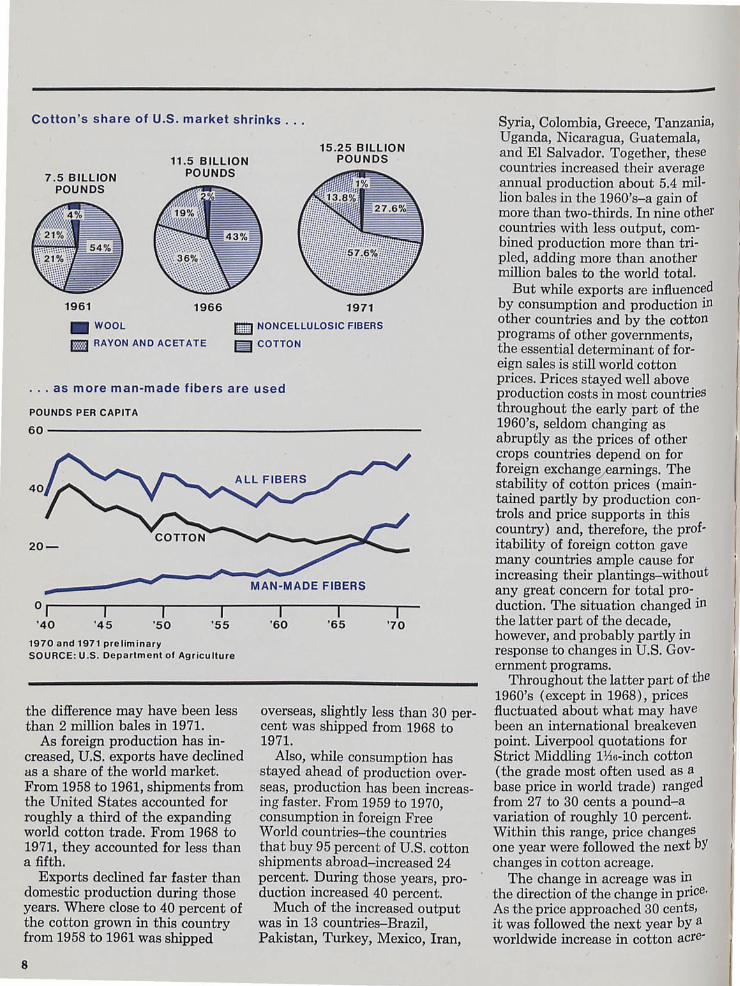
Cotton's share of U.S. market shrinks ...
7.5 BILLION POUNDS
1961
_WOOL
11.5 BILLION POUNDS
1966
15.25 BILLION POUNDS
• RAYON AND ACETATE
1971
[[] NONCELLULOSIC FIBERS
~ COTTON
... as more man-made fibers are used
POUNDS PER CAPITA
60---------------------------------------------
40
.-__ --------~~----~~~M~A~N~-M~ADEFIBERS 0'1 ----~Ir---~I-----,I-----,I----~I----~I--'40 '45 '50 '55 '60 '65 '70
1970 and 1971 preliminary SOURCE: U.S. Department of Agriculture
the difference may have been less than 2 million bales in 1971.
As foreign production has increased, U.S. exports have declined as a share of the world market. From 1958 to 1961, shipments from the United States accounted for roughly a third of the expanding world cotton trade. From 1968 to 1971, they accounted for less than a fifth.
Exports declined far faster than domestic production during those years. Where close to 40 percent of the cotton grown in this country from 1958 to 1961 was shipped
8
overseas, slightly less than 30 percent was shipped from 1968 to 1971.
Also, while consumption has stayed ahead of production overseas, production has been increasing faster. From 1959 to 1970, consumption in foreign Free World countries-the countries that buy 95 percent of U.S. cotton shipments abroad-increased 24 percent. During those years, production increased 40 percent.
Much of the increased output was in 13 countries-Brazil, Pakistan, Turkey, Mexico, Iran,
-Syria, Colombia, Greece, Tanzania, Uganda, Nicaragua, Guatemala, and EI Salvador. Together, these countries increased their average annual production about 5.4 million bales in the 1960's-a gain of more than two-thirds. In nine other countries with less output, combined product jon more than tripled, adding more than another million bales to the world total.
But while exports are influenced by consumption and production in other countries and by the cotton programs of other governments, the essential determinant of foreign sales is still world cotton prices. Prices stayed well above production costs in most countries throughout the early part of the 1960's, seldom changing as abruptly as the prices of other crops countries depend on for foreign exchang~arnings. The stability of cotton prices (maintained partly by production controls and price supports in this country) and, therefore, the profitability of foreign cotton gave many countries ample cause for increasing their plantings-without any great concern for total production. The situation changed in the latter part of the decade, however, and probably partly in response to changes in U.S. Government programs.
Throughout the latter part of the 1960' s (except in 1968), prices fluctuated about what may have been an international breakeven point. Liverpool quotations for Strict Middling H16-inch cotton (the grade most often used as a base price in world trade) ranged from 27 to 30 cents a pound-a variation of roughly 10 percent. Within this range, price changes one year were followed the next bY changes in cotton acreage.
The change in acreage was in the direction of the change in price. As the price approached 30 cents, it was followed the next year by a worldwide increase in cotton acre-

-age. As it dropped below 28 cents, the enthusiasm for cotton production was dampened.
In 1971, the average price broke through this range to hit 34 cents. That price' is apparently more than enough to stimulate increased ",:orld plantings, and with a posslbly severe impact on the U.S. cotton industry.
Department of Agriculture ~tudies, for example, suggest that, rom 1959 to 1970, 10-percent ch~ges in the price of U.S. Strict Mlddling Hlo-inch cotton at LiverPool usually resulted in 20 to 25-Percent changes in U.S. shipments
DeCline in cotton's share Of U.S. fiber market persists
PERCENT
60_~~ __ ~ ____________ ~
o_ j
'55
1971 pr I' .
I '60
I '65
I '70
/oj e Imlnary sg~E: Based on cotton-equivalent pounds
RCE: U.S. Department of Agriculture
......
nUs' Iness Review I August 1972
the following year-the change being in the opposite direction. This pattern indicates changes of 300,000 to 350,000 bales in response to I-cent changes in the U.S. price. If such a change occurs this season, U.S. cotton exports could be drastically cut.
Increases in foreign production are almost certain to continueespecially since policies of many cotton-producing countries are, unlike U.S. Government programs, aimed primarily at developing cotton production. World production rose 9 percent in 1971-72, and production outside the United States probably contributed about 4 million bales to this increase. Although foreign consumption also probably increased, the world supply available for export doubtlessly expanded, probably by more than 1. 5 million bales.
World markets may have absorbed most of this increase, leaving little or no effect on U.S. exports. If consumption overseas continued its modest expansion and foreign importers increased their generally low stocks even moderately, U.S. shipments easily reached the more than 3 million bales estimated for the 1971-72 season. Although some 500,000 bales less than in 1970-71, such a volume would still have been moderately good.
Implications for the future
The bright prospects for cotton, then, depend on the expected upturn in production this year. Continuation of those prospects depends, however, not only on an end to the decline in stocks but also on an easing in prices to a level that will allow cotton to compete more effectively with synthetic fibers. Clearly, it is the proper interplay of supply and demand that keeps stocks adequate and prices competitive. And as stocks rise over the next few seasons-as they seem bound to do-
the industry needs to watch for the earliest warnings that supplies are again becoming burdensome.
On the supply side, continued efforts to support production guidelines flexible enough for quick adjustment to changes in demand are essential to the maintenance of stocks at working levels. Some industry experts suggest a carryover of 6 to 7 million bales is needed to cushion against shortages. The growers' situation is entirely different from that of their principal competitor. Unlike synthetic fibers, which are produced under comparatively stable con-
Nation's cotton harvest often exceeds domestic use ...
MILLION BALES
20----------------______ ___
PRODUCTION
MILL USE
5 I I I I I I I '40 '45 '50 '55 '60 '65 '70
. .. but consumption overseas continues ahead of production
MILLION BALES
50----------------______ __
'40 '45 '50 '55 '60 '65 '70
1971 preliminary
SOURCE: U.S. Department of Agriculture
9
ditions, cotton is produced by a multitude of individual growers facing great uncertainties in their growing and marketing conditions. For that reason, the all-important supply problem is hard to plan foras has been pointed up in the decline in stocks since 1965. The abnormality of weather conditions since then, in fact, leaves unclear the extent of achievements that might have been realized from the new directions in Government programs.
On the demand side, efforts to slow the decline in cotton's share of the total fiber market complement efforts to control production. Growth of the fiber market clearly
10
provides the industry its greatest opportunity for achieving growth and stability in demand for cotton. Since competition from synthetic fibers cannot be expected to subside, the industry's renewed interest in supporting market development and promotion seems vital to its welfare.
Regarding export demand, U.S. shipments are still restricted by the sluggishness of growth in total foreign consumption. Although the very existence of these shipments is due mainly to cotton consumption overseas being greater than production, increases in consumption are not keeping up with the growth in production. And as in
-the domestic market, the lag in export demand results primarily from competition from man-made fibers.
To maintain stocks at levels that will allow growers, on the one hand, to compete more effectively with the highly productive synthetic fiber industry and, on the other, earn enough return to capital to stay in business, continued efforts must be made to bring supply and demand into line with each other. In probably no other way can the industry achieve the stability needed to project its bright outlook far into the future.
-Carl G. Anderson, Jr.
/
-
.....
New member bank
The Town North National Bank, Farmers Branch, Texas, a newly organized institution located in the territory served by the Head Office of the Federal Reserve Bank of Dallas, opened for business June 26, 1972, as a member of the Federal Reserve System. The new member bank has capital of $400,000, surplus of $400,000, and undivided profits of $200,000. The officers are: Ronald G. Steinhart, Chairman of the Board; E. Fred Ferguson, Jr., President; Bob Camp Senior Vice President; and Lois M. Pierce, Cashier. '
New par banks
The Coupland State Bank, Coupland, Texas, an insured nonmember bank located in the territory served by the Head Office of the Federal Reserve Bank of Dallas, was added to the Par List on July 1, 1972. The officers are: C. W. Pfluger, Jr., President; Theodore Wittliff, Vice President; Miss Lydia Etzel, Cashier; and Mrs. Rosalie Goetz, Assistant Cashier.
The Mid-County Bank, Port Neches, Texas, an insured nonmember bank located in the territory served by the Houston Branch of the .Federal Reserve Bank of Dallas, was added to the Par List on its opening date, July 10, 1972. The officers are: Weldon T. Peters, President; James E. Green, Vice President and Cashier; and Al McKay, Inactive Vice President.
The First State Bank, Magnolia, Texas, an insured nonmember bank located in the territory served by the Houston Branch of the Federal Reserve Bank of Dallas, was added to the Par List on its opening date, July 15, 1972. The officers are: L. A. Hill, Jr., President; Richard Hereford, Cashier; and Mrs. Dorothy Shivers, Assistant Cashier .
liUs• lness Review I August 1972 11
Federal Reserve Bank of Dallas
August 1972
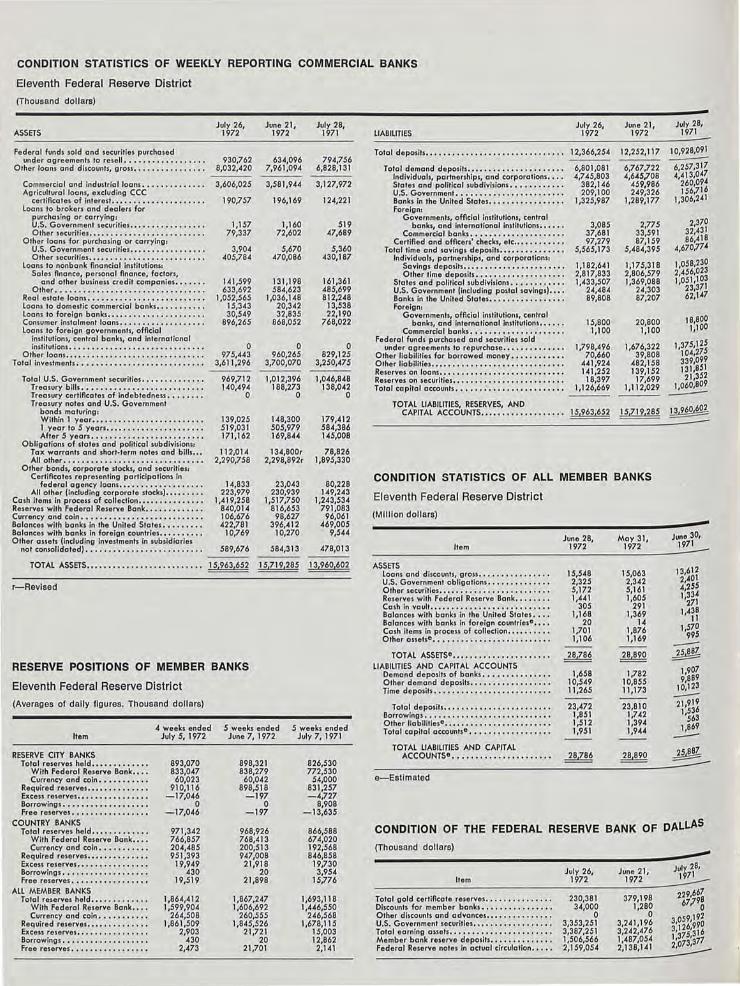
Statistical Supplement to the Business Review -Total credit at weekly reporting banks in the Eleventh District declined slightly in the five weeks e~ded JUly 26, as a rapid expanSIon in loans was more than offset by an even sharper decline in bank holdings of Government and mu~icipal securities. Total deposits Increased moderately, and banks reduced their net purchases of Federal funds.
An abnormal rise in business loans paced the growth in total loans and probably reflected further improvements in District ecol10Inic activity. Consumer loans and the highly volatile loans to l10nbanlr financial institutions also registered unusual strength.
The expansion in total deposits ~eSuIted from larger inflows of both elUand and time and savings
deposits. The volume of largedenolUination CD's outstanding ~ose lUoderately, and bank borrow~g from nondeposit sources was VirtUally unchanged.
Jhe s.easonally adjusted Texas inl~stnal production index rose to J 3.7 percent of its 1967 base in t> Une. All three sectors of industrial . rOduction-manufacturing, min~~g, and utilities-contributed to t> e adVance, pushing the index 11 thrcent higher than at the first of itne Year. Mining provided the main t> Petus, however, advancing 2.4 cercent Over the previous month. crrude petroleum production in-t> eased 3.1 percent to a level 11.7 o~~cent ~~he~ than a year before'. Slllallr lnIn~ng mdustries showed
I er gams. , du 11 lUanufacturing, output of
ce~able goods increased 0.8 per-th ~ OVer the previous month, with l>e~ argest gains being the 2.0-
cent advances in transportation
equipment and stone, clay, and glass products. Two related industries-primary metals and fabricated metal products-showed declines in June but were still well ahead of their outputs a year before, as were all manufacturing industries. Manufacturing of nondurable goods increased only 0.4 percent, in spite of substantial gains in two industries-textiles and paper and allied products. Utilities advanced 0.5 percent in June. Increases were shown in the distribution of both electricity and natural gas.
Re'gistrations of new passenger automobiles in Dallas, Fort Worth, Houston, and San Antonio rose 3 percent in June. Total registrations were 11 percent higher than in June 1971. Cumulative registrations through the first six months of this year were 12 percent higher than in the same period last year. All four metropolitan centers showed increases in cumulative registrations. The advances ranged from 11 percent in Houston to 17 percent in Fort Worth.
Seasonally adjusted total employment in the five southwestern states fell slightly in June. As a result of a sharp decline in the number of people looking for jobs, however, the unemployment rate continued its gradual decline started last October, falling to 4.3 percent of the labor force in these states, compared with 4.7 percent in June 1971.
Employment fell below monthearlier levels in most categories of both manufacturing and nonmanufacturing. Finance, up 0.2 percent, was the only major reporting industry group to show a rise in
employment. All other industries ~howed de'Cl~es, the largest being m constructIOn, down 1.4 percent, an.d. t!ansportation and pUblic utIlitIes, down 1.0 percent. In spite of the June drop, however all industries continued to sh~w yearto-year gains with the exception of mining, which was down 0.1 percent from June 1971.
The winter wheat crop in states of the Eleventh District is expected to reach 152 million bushels this year-29 percent more than in the below-average 1971 season. The projection, revised upward July 1 is based on yields that appear ' better than previously expected.
A total of 7.1 million acres was planted to cotton in these states this year-7 percent more than last season. Although acreage was up only 2 percent in New Mexico, it surged 26 percent in Louisiana, and Oklahoma and Arizona re'ported sharp gains of 17 percent and 14 percent, respectively. In Texas, the increase totaled only 4 percent.
Texas fe'edlots had a record 2.1 million head of cattle on feed at midyear-a fourth more than a year before. Feedlots with capacities for more than 1,000 head averaged an unusually high occupancy rate of 79 percent.
Higher prices for meat animals boosted the index of prices received by Texas farmers and ranchers in the month ended at mid-June 18 percent higher than a year earlier. The index of livestock prices rose moderately over the preceding month to a point 23 percent higher than a year before. Wool and mohair prices were up sharply from a year earlier, further sup(Continued on back page)
CONDITION STATISTICS OF WEEKLY REPORTING COMMERCIAL BANKS
Eleventh Federal Reserve District
(Thousand dollars)
ASSETS
Federal funds sold and securities purchased under agreements to resell •.. .. ... •. .. • .....
Other loans and d iscounts, gross •... ..••.. • ...•.
Commercial and industrial loans • ........•.... Agricultural loans, excluding CCC
certificates of interest . . . .... ..... ... ... . . . loans to brokers and dealers for
purchasing or carrying: U.S. Government securities . •. .... ....... ... Other securities .... ....•• •. ... •......•.•.
Other loans for purchasing or carrying: U.S. Government securities . .. •.........•.• . Other securities .... ....•.•.•••...... ...• .
loans to nonbank financial institutions: Sales finance, personal finance, factors,
and other business credit companies • . . .... Other •.••.•••••••••••.•.•••.•••••.•.•.
Real estate loans . . . . ....... .. . . . ... ...•... Loans to dom estic commercial bonks . . . ..... . . . Loans to foreign banks .•••. . ...... . .... . ... . Consumer instalment loans ... . . . ...••...... . . Loans to foreign governments, official
institutions, central bonks, and international institutions .. ......................... .. .
Other loans •••• ...............•.. ... ...... Total investments .. ..•.........• • ..•. ••.. ....
Total U.S. Government securities .. ... • . . ... .. . Treasury bills ••• •. •••• •.• • •••••••••••.•• Treasury certificates of indebtedness •• .•.... Treasury notes and U.S. Government
bonds maturing: Within 1 year ••••.•.••.. •.••..• . ••..•• 1 year to 5 years . • .... ..•.•...••...... After 5 years •••••..••••••.•••••.•.•••
Obligations of states and political subdivisions: Tax warrants and short-term notes and bills ... All other •••••••••••••••.•.•••••••••••••
Other bonds, corporate stocks, and securitiesl Certiflcates representing participations in
federal agency loans .•. .•.•• ........... All other (Including corporate stocks) . ..• . ....
Cosh items in process of collection •••• ..••....•.• Reserves with Federal Reserve Bank • .. ......•... Currency and coin •••. .. •• .. ... ............. . Balances with banks in the United States •.• .••... Balances with banks in foreign countries • • ........ Other assets (Including investments in subsidiaries
not consolidated) ••..•••••.•••••••• • ••...••
July 26, 1972
930,762 8,032,420
3,606,025
190,757
1,157 79,337
3,904 405,784
141,599 633,692
1,052,565 15,343 30,549
896,265
0 975,443
3,611,296
969,712 140,494
0
139,025 519,031 171,162
112,014 2,290,758
14,833 223,979
1,419,258 840,014 106,676 422,781
10,769
589,676
June 21, July 28, 1972 1971
634,096 794,756 7,961,094 6,828,131
----3,58 1,944 3,127,972
196,169 124,221
1,160 519 72,602 47,689
5,670 5,360 470,086 430,187
131,198 161,361 584,623 485,699
1,036,148 812,248 20,342 13,538 32,835 22,190
868,052 768,022
0 0 960,265 829,125
3,700,070 3,250,475 ---- ----
1,012,396 1,046,848 188,273 138,042
0 0
148,300 179,412 505,979 584,386 169,844 145,008
134,800r 78,826 2,298,892r 1,895,330
23,043 80,228 230,939 149,243
1,517,750 1,243,534 816,653 791,083
98,627 96,061 396,412 469,005
10,270 9,544
584,313 478,013
TOTAL ASSETS ••••••••.• •••••••••• . •••• • 15,963,652 15,719,285 13,960,602
r-Revlsed
RESERVE POSITIONS OF MEMBER BANKS
Eleventh Federal Reserve District
(Averages of dally fIgures. Thousand dollars)
4 week, ended 5 weeks ended Item July 5, 1972 June 7, 1972
RESERVE CITY BANKS Total reserves held ... ....•...•. 893,070 898,321
With Federal Reser.e Bank •• •• 833,047 838,279 Currency and coin •• • .. •• .... 60,023 60,042
Required reserves •••• •.•....•.. 910,116 898,518 Excess reserves ••. • • •.•.•••••• • -17,046 -197 Borrowings • •.••••••.•••.. . • .• 0 0 Free reserves •• ..... • ... •.• • •• -17,046 -197
5 weeks ended July 7, 1971
826,530 772,530
54,000 831,257 -4,727
8,908 -13,635
July 26, June 21# LIABIlITIES 1972 1972
Tota l de posits •• • .• •••••••••• •••••. •.••.• . ••• 12,366,254 12,252,117 ----
Total demand deposits .•... ......... . . . . ... . 6,801,081 6,767,722 Individuals, partnerships, and corporations . ... 4,745,803 4,645,708 States and political subdivisions . . . ... . ... . . 382,146 459,986 U.S. Government . . . . .... . . . .. ........... 209,100 249,326 Bonks in the United States •• .••..•.......•. 1,325,987 1,289,177 Foreignl
Governments, official institutions, central banks, and international Institutions •• .. • . 3,085 2,775
Commercial banks ... • . . •....• .•••. . •• . 37,681 33,59 1 Ce rtifie d and ofAcers' checks, etc .... .••. .... 97,279 87,159
Total time and savings deposits . •.. . . .. .• .. ... 5,565,173 5,484,395 Individuals, partnerships, and corporations:
Savings deposits . .. . .. ....... ..•.... .. . 1,182,641 1,175,318 Other time deposits • . ..•.•.•...... . ..•. 2,817,833 2,806,579
States and political subdivisions • •••.. ...••. 1,433,507 1,369,088 U.S. Government {including postal savings) • ••. 24,484 24,303 80nks in the United States • •• ••••• •••• . •• • • 89,808 87,207 Foreign:
Governments, official institutions, central banks, and international Institutions •...• . 15,800 20,800
Commercial bonks • • • . .•...•.•.•••.•••. 1,100 1,100 Federal funds purchased and securities sold
1,798,496 1,676,322 under agreements to repurchase • •.....••. •• •. Other lia bilities for borrowed money . •. • • .• . •.•. 70,660 39,808 Other liabilities ••••••• •• ••• • ••••••• • •••••• ••• 441,924 482,158 Reserves on loans ••... ..••...... . • .••• • •• • ••• 141,252 139,152 Reserves on securities .• •. •. . •• • • •.• • ...•.••• •. 18,397 17,699 Total capital accounts •••• • . •. •.•.•••.•.•••... 1,126,669 1,112,029
---- ----TOTAL liABILITIES, RESERVES, AND
CAPITAL ACCOUNTS •••••. ••••.•••.• • •. 15,963,652 15,719,285
CONDITION STATISTICS OF ALL MEMBER BANKS
Eleventh Federal Reserve District
(Million dollars)
June 28, May 31, Item 1972 1972
ASSETS Loans and d iscounts, gross •. . . . ....... ...• 15,548 15,063 U.S. Governm ent obligations . .....•.• • .... 2,325 2,342 Other securities .• .. •.•.....•... . • ..... . . 5,172 5,16 1 Reserves with Federal Reserve Bank • .. . .... 1,441 1,605 Ca sh in vault . •• •... ...•...• .• .•...... .. 305 291 Balances with bonks in the U"ited States . . . • 1,168 1,369 Balances with bonks In foreign countriese • • . . 20 14 Cosh items in process of collection •••• •.•.•• 1,701 1,876 Other assetse • • ••. . •.• .•• • .• ••• • ••• .. .. 1,106 1,169
TOTAL ASSETSe ••• •••••••••••• • • •••.• 28,786 28,890 liABIlITIES AND CAPITAL ACCOUNTS
Demand deposits of banks ..•. •.•.•...... 1,658 1,782 Other demand deposits • •. • • •••••• •. •• ••• 10,549 10,855 Time deposits •. •...... . .•.......•.•.•.• 11,265 11,173
Total deposits • •• • •.•••• • .•• • .••• ••••• 23,472 23,8 10 Borrowings . ...•.•.••.••••.•••...•....• 1,851 1,742 Other lie bilitiese • • ••... .• . . .... ••••••••• 1,512 1,394 Total capitol accountse • •.. ••• . •••••. • •• . 1,951 1,944
TOTAL LIABILITIES AND CAPITAL ACCOUNTSe ••••••••• • ••• • •••• .• •• 28,786 28,890
e-Estlmated
-July 28,
1971
10,928,091 -6,257,317 4,413,047
260,094 156,716
1,306,241
2,370 32,431 86,418
4,670,774
1 058,230 2;456,023 1051 ,103 ' 23,371
62,1A7
18,800 1,100
1375,125 '104,275 339,099 131,851 21,352
1,060,809 -lM~ -
-June 30, 1971 -13,612 2,401 4,255 1 334 '271
1,4~~ 1,570
995 -...wg =-
1,907 9,889
10,123 -21,91~ 1,53
563 1,869 -~ =::::::.-
COUNTRY BANKS Total reserves held ••••. ..•..... 971,342 968,926 866,588 CONDITION OF THE FEDERAL RESERVE BANK OF DALLAS
With Federal Reserve Bank ••.• 766,857 768,413 674,020 Currency and coin . •. ..• ..... 204,485 200,513 192,568
Required reserves ••••. • . •.•..•. 951,393 947,008 846,858 Excess reserves • •... . ....... ..• 19,949 21,918 19,730 Borrowings • •..•....•...••••.• 430 20 3,954 Free reserves . ..............•• 19,5 19 21,898 15,776
All MEMBER BANKS Total reserves hel d .•• . ..... " .• 1,864,412 1,867,247 1,693,118
With Federal Reser.e Bank •••• 1,599,904 1,606,692 1,446,550 Currency and coin ••• ........ 264,508 260,555 246,568
Required reserves .•.•. . .. ..•... 1,861,509 1,845,526 1,678,115 Excess reserves • •.............. 2,903 21,721 15,003 Borrowings •• .... .. .. .... •.. . • 430 20 12,862 Free reserves ••.. •.........•• • 2,473 21,701 2,141
(Thousand dollars)
Item
Total gold certiflcate reserves •. . ..•.. • ..•... Discounts for member banks •. •.....• . ..•.•. Other discounts and advances ••. . .•.... . . .. . U.S. Government securities ••• . . .. . •......... Total earning assets •• • ..•..••••........... Member bonk reserve deposits •.. .. •• .• .. ... Federal Reserve notes in actual circulation . •.•.
July 26, 1972
230,381 34,000
o 3,353,251 3,387,251 1,506,566 2,159,054
June 21, 1972
379,198 1,280
0 3,241,196 3,242,476 1,487,054 2,138,141
~
July 28, 1971 .-:.--229,667
67 ,79~
3,059,1 ~~ 3,126,9
16 1,375,377 2,073,3 ---- ' I

BANK DEBITS, END-OF-MONTH DEPOSITS, AND DEPOSIT TURNOVER
SMSA's In Eleventh Federal Reserve District
(Dollar a mounts In thousands, seasonally adjusted) -DE81TS TO DEMAND DEPOSIT ACCOUNTS'
Percent change
Juno June 1972 from 1972 6 months,
Standard metropolitan (Annual. rate May June 1972 from statistical area basis ) 1972 1971 1971
ARIZONA, Tucson ••.• • ••• . •. . • • ...•••••• ...• •. •• ••• • $9,704,280 -1% 32% 26% LOUISIANA, Monroe • • •.•••. ... ••.. ..•....•••• . .••.•. 4,255,872 10 31 20
NEW Shreveport •.... . .•.•. . • •. •••. ... ••••.•.. 13,840,380 - I 17 19
MEXICO, Roswell ' ... ..................... ...... 986,820 1 1 7 TEXAS, Abilene •• ...• • .••• •• •. • •• . ••••• . •.••. . ••...• 2,629,236 3 16 13
Amarillo . •••..................•.••.. . . . .. .... 8,362,308 7 40 17 Austin . . . •........•. . ......... . ....•. . ....... 12,187,644 1 0 18 Bea umont,Port Arthur. Orange .. .. •• ...... .•....• 7,092,744 6 5 4 Brownsville-Harlingen-Son Benito •• ............... 2,491,380 -7 14 16 Bryan·Caliege Station .••••••••••• ••••.• .• ••. •• 1,309,862 0 21 23 Corpus Christl . ..... .. ............• .... .. .. ... 7,302,144 3 17 15 Corsicana' . ... . .. ..... .. . .. , ..... .... .. .... . . 608,604 29 13 -I Dallas ••..•.• ...• • .....•.•..••••••....•.•. •• 154, 162,092 4 12 II EI Paso •• . ••••••.••.....••.•• • • ••.. ••.. ...•• 9,460,872 2 4 14 Fort Worth .. . .... .... .. .... ................. 32,857,920 20 15 8 Galveston-Texas City ..... . ..... . .... . .. ...... . 3,108,888 5 7 0 Houston • .• •...••••.••••••••..••••.. .. ••.. •.• 142,468,8 12 8 28 23 laredo ..• . ............. . ....... . . .. ... .. .... 1,142,352 6 3 8 Lubbock .•• •. • •. ..• ••.. .•• • ••••..•• ••• ••••••• 5,425,308 -4 -3 14 McAllen·Pharr·Edinburg •..••••• ••• ••••••.•.•••• 2,394,408 I 27 30 Midland •• •• ••• •.. .. • • ••..•• •• .•..•••• • •• • ••• 2,536,956 17 25 8 Odessa . ... . .............. .... .. .... .... ... . 1,924,704 6 9 11
~~~ ~~~o~rl~·.·.:: : : : : : : : : : : : : : : : : : : : : : : : : : : : : : : 1,742,256 13 20 11 21,857,892 1 4 8
Sherman· Denison • • • ••••••• ••• ••••• •••• •• •• •••• 1,297,128 12 3 10 Texarkana (Texas.Arkansas) . .. . ......•... .. ... . 1,953,708 13 18 14 Tyler ••.. ••. .• • •.••••..••••••••..•• •••• ••..• 2,767,572 10 16 12 Waco . ... .. .... .. ..... .. .. ................. 4,2 I 2,216 5 17 17 Wichita Falls ••..••••.. • ••••• ••• •...••• • • .•••• 2,999,220 6 29 15
Total_29 centers ••.••• .•••..•••• •. •••••• • •••••..••• $463,083,578 6% 17% 15%
1. Deposits of Individua ls, partnerships and corporations and of states and political subdivisions 2. County basis
WINTER WHEAT
BUILDING PERMITS
June 30, 1972
$3 15,456 106,2 11 288,327 42, 172
120,192 190,101 482,578 269,505 99,244 53,808
26B,944 34,943
2,704,39B 314,445 773,851 118,602
3,036,468 50,577
186,402 137,090 148,709 105,950 78,369
824,570 74,898 85,083
115,480 141,434 132,986
$ 11,300,793
ACREAGE (Thousand acres)
.... For harvest Harvested
DEMAND DEPOSITS'
Annual rate of turnover
June May June 1972 1972 1971
32.0 33.3 27.0
39.3 35.1 35.0 46.6 45.8 43.6 23.4 22.7 24.5
21.8 21.9 21.3 43.0 40.8 36.2 26.9 30.7 32.5 25.9 24.1 26.8 24.8 27.3 25.2 24.7 26.4 23 .8 27.0 26.7 22.4 17.7 14.0 16.2 55.5 53.1 57.9 30.7 32.1 36.3 41.9 34.8 40.9 25.5 24.1 25.9 45.7 42.0 40.3 22.6 21.8 25.1 28.7 29.4 32.0 17.0 16.9 17.4 17.0 14.4 14.6 17.9 16.9 17.9 21.9 19.4 19.1 26.5 26.5 29.1 17.2 15.8 18.3 23.1 19.9 21.7 23.8 21.8 22.1 29.3 27.7 27.0 22.2 21.3 18.9
40.4 38.4 39.3
PRODUCTION (Thousand bushels)
VALUATION (Dollar amounts in thousands) Crop of Crap of Crop of Crop of 19721 C;9~t C;9~00f
Area 1972 1971 1970 Percent change
173 150 11,390 11,764 10,350 170
June 1972 Arizona •........
40 45 33 960 1,035 957 louis iana .... .. . . 184 4,628 4,000 5,152
NUMBER from New Mexico .... . 178 160 6 months, 3,950 3,475 3,777 90,850 69,500 98,202
Oklahoma .... ... 44,000 31,416 54,408 June 6 mos. June 6 mos. May June 1972 from Texas ..... · ··· . 2,000 1,496 2,267
Area 1972 1972 1972 1972 1972 1971 1971 6,411 151,828 117,715 169,069
Total •••••.• • • 6,338 5,349
ARIZONA Tucson .. .. . . .• 692 4,743 $ I 8,428 $ 106,161
LOUISIANA 63% 68% 101% 1. Indicated July 1
SOURCE: U.S. Department of Agriculture
Monroe-West Monrae •. ... 67 702 1,034 16,485 -28 -60 43
Shreve port • ••• 455 2,829 5,593 31,944 - 19 0 II TEXAS
Abilene ••. •• • • 64 424 931 8,933 -28 -67 31 Amarillo . .. ... 213 1,048 2,24 1 13,414 -3 53 -6 Austin . ..... .. 546 3,309 31,532 131,350 76 108 70 GROSS DEMAND AND TIME DEPOSITS OF MEMBER BANKS Beaumont . . 222 1,266 3,322 15,579 1 109 149 Brownsville •••• 137 649 1,264 6,975 -10 236 117 Corpus Christi .. 335 2,489 3,367 34,549 -33 -35 2 Eleventh Federal Reserve District Dalla ....... .. 2,057 10,396 64,395 249, 105 101 188 74 Denison ... . . .. 31 194 358 1,818 77 298 -2 (Ave rages of dally figures. Million dollars ) EI Paso •••.••• 525 3,468 16,495 99,296 7 54 64 Fort Worth • •. • 450 2,634 7,23 1 38,580 -19 -55 -41 Galveston .... . 80 451 475 7,415 -78 -4 -2 GROSS DEMAND DEPOSITS TIME DEPOSITS Houston . . .. ... 4,969 23,952 60,497 326,524 14 -26 -6 Laredo ••••••• 46 281 4,185 9,410 684 501 100 Reserve Country Reserve Country
Lubbock •••• • . 208 1,165 6,927 29,343 27 -46 -17 Date Total city banks banks Total city banks bank.
Midland •• • ..• 80 587 706 10,895 - 18 -1 57 Odessa •..... . 106 546 680 16,975 -66 10 303 4,748 5,517 7,391 2,651 4,740 Port Arthur ••.• 87 552 369 3,162 -71 18 -2 1970. June •• • • •• 10,265
San Angela •• • • 70 435 637 3,885 -8 -44 -31 1971. June ••• •• • 11,354 5,224 6,130 9,573 3,691 5,882
San Antonio . . . 1,514 9,118 21,518 118,759 58 51 93 1972. January .... 12,313 5,580 6,733 10,607 4,179 6,428
Sherman ..... . 51 303 309 4,268 -3 53 15 11,983 5,419 6,564 10,864 4,249 6,615
Texarkana .. . . 66 311 471 4,667 -48 -20 - 17 February . .. 12,118 5,563 6,555 10,978 4,255 6,723
March •••.• Waco .... .. .. 264 1,406 4,374 17,879 63 51 22
April • • ••. • 12,407 5,676 6,731 10,938 4,180 6,758
Wichita Falls ••• 86 523 1,594 7,606 75 96 -32 12,268 5,652 6,616 11,075 4,262 6,813 ------- May .... ..
12,320 5,689 6,631 11,233 4,323 6,910 TQtal_26 cities .. . 13,421 73,781 $258,933 $ 1,3 I 4,977 35% 22% 29% June .... ,. -

LABOR FORCE, EMPLOYMENT, AND UNEMPLOYMENT
Five Southwestern States'
(Seasonally adjusted)
Thousands of persons
June May June Item 1972p 1972 1971r
Civilian labor force ... .....• 8,411.0 8,464.3 8,255.4 Total e mployment • • • . . ...... 8,052.4 8,090.9 7,866.4 Total unemployment . . ....•.. 358.5 373.3 389.0 Unemployment rate . . . . • . . •. 4.3% 4.4% 4.7% Total nonagricultural wage
and sa lary employment . ••• 6,563.4 6,586.2 6,357.3 Manufacturing . . . . . . •.• • . 1,148.3 1,1 54.6 1,125.6
Durabl ................ 622.5 623.7 608.9 Nondurable .. .. . . •.. .. 525.8 530.8 516.7
Nonmanufacturing •• •• . .. . 5,4 15.2 5,431.7 5,231.7 Mining • • . .•. .. .... . .. . 225.5 227.3 225.8 Construction .. . . .. ... . . 427.2 433.1 399.3 Transportation and
public utilities • .. . .... 451.8 456.4 446.9 Trad •• • •••• ••• • •• •• . • 1,559.3 1,559.0 1,501.2 Finance . .. • •.. •• • ••• • • 351.5 350.8 334.2 Service .... ..•.•.••... 1,062.4 1,063.7 1,026.2 Government • • • ••• • .•• . 1,337.5 1,341.3 1,298.2
1. Arizona, Louisi ana, New Mexico, Ok lahoma, and Texas 2. Actual change p-Prellminary r-Revlsed NOTE : Details may not add to totals because of roundi ng. SOURCES: State employment agenCies
Federal Reserve Bank of Dallas (seasonal adjustment)
porting the increase in the index. Crop prices, although averaging slightly lower for the month, were still 8 percent higher than in the same month of 1971. The index of prices paid by U.S. farmers moved up slightly from a month earlier to a level 5 percent higher than a year before.
Department store sales in the Eleventh District were 9 percent greater in the four weeks ended July 29 than in the corresponding period last year. Cumulative sales through that date were 10 percent higher than in the comparable period a year before.
Percent chango Juno 1972 from
May June 1972 1971
-0.6% 1.9% - .5 2.4
-4.0 -7.8 '-.1 ' -.4
-.3 3.2 -.5 2.0 -.2 2.2 - .9 1.8 -.3 3.5 - .8 -.1
-1.4 7.0
-1.0 1.1 .0 3.9 .2 5.2
-.1 3.5 - .3% 3.0%
DAILY AVERAGE PRODUCTION OF CRUDE OIL
(Th ousand barre ls) -Percent change fro~
Area
FOUR SOUTHWESTERN ST~TES .. ... ... . . .. .. •.. LOuisiana ••• . • •... . •...•. Ne w Mex ico . . . .. . . .. .•. . Oklahoma .......... . .. . . Texas . . ....... . .. . . . .. .
Gulf Coast •. •.. ... . . •. West Texas .......... . East Toxas (prop. r) • .. .. Panhandl . .... ........ . Rest of stote •. .•• . • ••. .
UNITED STATES ........... .
r-Revised
Jun e 1972
7,25 1.1 2,605.0
310.0 572.3
3,763.8 739.5
1,856.8 244.8 74.9
847.8 9,871.1
May 1972
7,125.9 2,505.8
310.0 585.1
3,725.0 712 .2
1,865.4 233.2 n .8
836.4 9,756.9
SOURCES: American Petrol eum Institute U.S. Bureau of Mines Federa l Reserve Bank of Da llas
June 1971r
6,993.7 2,660.4
329.0 605.6
3,398.7 676.9
1,653.3 201.5 72 .1
794.9 9,670.9
VALUE OF CONSTRUCTION CONTRACTS
(Mi ll ion dollars)
May 1972
1.8% 4.0
.0 -2.2
1.0 3.8
- .5 5.0
-3.7 1.4 1.2%
June 1971
3.7% _ 2.1 _5.B _5.5
10.7 9.2
12.3 21.5
3.9 6.7 2.1 %
-June May April
January-Jun~
Area and type 1972 1972 1972
FIVE SOUTHWESTERN STATES' .. . ... .. ........ 1,076 1,256 1,153 Residentia l building . . . . . . . 567 518 498 Nonresidential bui lding . .. . 338 343 273 Nonb uilding construction .... 171 396 38 1
UNITED STATES .. . .. .. ... . . 8,478 9,098 8,100 Resid entia l building . . . . ... 4,375 4,428 3,971 Nonresidentia l building . . . • 2,447 2,908 2,182 Nonbuilding construction . . .• 1,655 1,762 1,947
1. Arizona, Louisiana, New Mexico, Oklahoma, and Texas r-Revi sed
1972 1971r -5,950 4,339 2,867 2,150 1,621 1,416 1,461 773
44,705 39,02 1 21,730 16,003 13,194 12,576 9,782 10,442 -
NOTE : Details may not add to totals because of round ing. SOURCE: F. W. Dodge Division , McGraw-HIli Information Systems Company
INDUSTRIAL PRODUCTION
(Seasonally adjusted Indexes, 1967= 100)
Area and type of index
TEXAS Totol industria l production .... ..
Manufacturing .. . . .. ..• .. .. . . . . Durable •• . •• •• . . . •..••.• • . •• Nondurab le . . ... .. .. . . . . . . ...
Mining . .•..........•......... . Utilities •• . . ...•.......•.••••• .
UNITED STATES Total industrial production •• . ••.
Manufacturing • • .. . ••.• . .•• •... Durable . . ...... . . ..... ... ... Nondurable . . . .........•.....
A~ining • •••••••••••• ••• • • •• • ••• Utilities . . . . ... .. . ••... ..•.• .. .
p-Prellmlnary r- Revlsed
June 1972p
133.7 134.7 144.7 127.4 125.5 155.6
112.7 111.4 105.4 11 9.9 10B.2 140.5
May April 1972 1972
132 .3 129.4r 133.9 130.5r 143.6 141.9 126.9 122.3r 122 .6 119.3r 154.9 158 .8r
11 2.4 11 2.1 r 111.3 11 1.0r 105.4 105.1r 11 9.9 11 9.6r 106.5 108 .9 143.0 I 41.6r
SOU RCES: Board of Governors of the Federal Reserve System Federal Reserve Bank o f Da llas
-June 197 1 -122.1 122.3 131.6 11 5.6 115.0 146.8
107.4 106.0 100.7 11 3.7 108.6 133.8 ---