Business Results for FY2009 ended March 31, 2010, Tasks ... · PDF fileTasks and Projection...
45
1 Business Results for FY2009 ended March 31, 2010, Tasks and Projection for FY2010 ending March 31, 2011 and New Mid-Range Management Plan “Global Teamwork for Tomorrow” April 27, 2010 Corporate Planning Division Komatsu Ltd.
Transcript of Business Results for FY2009 ended March 31, 2010, Tasks ... · PDF fileTasks and Projection...

1
Business Results for FY2009 ended March 31, 2010,
Tasks and Projection for FY2010 ending March 31, 2011
and
New Mid-Range Management Plan
“Global Teamwork for Tomorrow”
April 27, 2010
Corporate Planning Division
Komatsu Ltd.

2
1. Sales and profits
While both sales and profits declined year-on-year basis, they improved solidly on quarterly basis.
Outline of FY2009 ended March 31, 2010
2. Review of two business segments
- Construction, Mining and Utility Equipment
For the full year, sales and segment profit declined by 27.3% and 54.0%, respectively. On quarterly basis, both sales
and profits increased steadily against the backdrop of market recovery in emerging economies centering on China.
Fourth quarter sales and segment profit (Jan.-Mar. 2010) expanded by 20.5% and 66.8%, respectively, from the previous
quarter.
- Industrial Machinery and Others
Automobile manufacturing and other industries continued the restraint of capital investment, and sales and segment
profit declined by 41.1% and 76.7%, respectively.
3. Cash dividends
Year-end cash dividends: 8 yen per share. Annual dividends: 16 yen per share including interim dividends of 8 yen
per share. (To be proposed to the 141th ordinary general meeting of shareholders.)
Net sales 1,431.5 billion yen, down 29.2 %
Operating income 67.0 billion yen, down 55.9 %
Operating income ratio 4.7 %, down 2.8 points
Net income* 33.5 billion yen, down 57.4 %
* Net income is comparable to net income attributable to Komatsu Ltd. as defined in the FASB Accounting Standards Codification (ASC) 810.

3
1. FY2009 Fourth Quarter Results (Three Months ended March 31, 2010)

4
Jan. - Mar.,2009(A)
1USD=95yen1EUR=123yen1RMB=13.9yen
Oct. - Dec., 2009(B)
1USD =90yen1EUR=133yen1RMB=13.2yen
Jan. - Mar., 2010(C)
1USD =91yen1EUR=124yen1RMB=13.3yen
Vs. Jan. - Mar., 2009(C-A)
Vs. Oct. - Dec., 2009(C-B)
Increase (decrease) %
Increase (decrease) %
Net sales 379.0 357.9 427.6 48.5 12.8% 69.6 19.5%
Construction, Mining & Utility Equipment
Industrial Machinery & Others
[316.0] 317.0
[62.9] 70.4
[316.8] 317.5
[41.0] 44.0
[382.0] 382.7
[45.5] 49.8
[66.0] 65.6
[(17.4)] (20.5)
[20.9%] 20.7%
[(27.7)%] (29.2)%
[65.2] 65.2
[4.4] 5.8
[20.6%] 20.5%
[10.9%] 13.3%
Elimination ( 8.4 ) ( 3.5 ) ( 4.9 ) 3.4 - ( 1.4 ) -
Segment profit (loss) ( 12.3 ) 20.8 38.5 50.8 - 17.7 85.1%
Construction, Mining & Utility Equipment
Industrial Machinery & Others
( 7.6 )
( 3.4 )
23.3
( 1.3 )
38.9
0.7
46.5
4.1
-
-
15.5
2.1
66.8%
-
Corporate & elimination ( 1.2 ) ( 1.1 ) ( 1.1 ) 0.1 - ( 0.0 ) -
Other operating income (expenses)
( 35.9 )*1 ( 4.4 ) *2 ( 7.5 ) *3 28.3 - ( 3.0 ) -
Operating income (loss) ( 48.2 ) 16.3 30.9 79.1 - 14.6 89.7%
Other income (expenses)
( 1.0 ) ( 0.0 ) ( 0.6 ) 0.4 - ( 0.5 ) -
Net income (loss) before income taxes
( 49.3 ) 16.2 30.2 79.6 - 14.0 86.6%
Net income (loss) *4 ( 34.5 ) 10.1 15.2 49.7 - 5.0 49.7%
( 2.4 )%
( 4.8 )%
( 3.2 )%
7.4%
( 3.2 )%
5.8%
4.6%(12.7)%
Sales and Profits for the Three Months ended March 31, 2010
10.2%
1.5%
9.0%
7.2%
% Profit ratio [ ]:Sales after elimination of inter-segment transactions Billions of yen
*1 Including structural reform expense of 32.3 billion yen. *2 Including structural reform expense of 4.3 billion yen. *3 Including structural reform expense of 5.1 billion yen.
*4 Upon adoption of the FASB Accounting Standards Codification (ASC) 810 (formerly SFAS No.160), “Net income” is equivalent to “Net income attributable to Komatsu Ltd.”

5
30.916.3
8.2-48.2
40.5
79.6 83.3 78.491.4 83.2
76.3
11.5
7.2%4.6%2.6%
14.7% 15.5%14.3% 14.9% 13.7% 12.6%
9.4%
-12.7%
3.5%
-50
0
50
100
FY07/1Q 2Q 3Q 4Q FY08/1Q 2Q 3Q 4Q FY09/1Q 2Q 3Q 4Q
-15
0
15
30Operating income
Operating income ratio
503.1 489.2 501.7 560.6 535.4 517.4379.3
317.0 285.4 285.5 317.5382.7
43.5 56.9 53.363.8 78.7 95.3
58.8
39.7 44.944.0
49.8
-4.9-3.5-4.9-4.8-8.4-6.8-8.3-7.4-10.4-6.9-5.8 -6.1
70.4
-100
0
100
200
300
400
500
600
FY07/1Q 2Q 3Q 4Q FY08/1Q 2Q 3Q 4Q FY09/1Q 2Q 3Q 4Q
Industrial Machinery & OthersConstruction, Mining & Utility EquipmentElimination
Quarterly Sales and Operating Income
Quarterly salesQuarterly sales
Quarterly operating incomeQuarterly operating income
Billions
of yen
07/1Q 2Q 3Q 4Q
122yen 117yen 113yen 104yen
164yen 162yen 165yen 158yen
15.9yen 15.5yen 15.3yen 14.6yen
08/1Q 2Q 3Q 4Q
105yen 107yen 95yen 95yen
165yen 159yen 126yen 123yen
15.2yen 15.7yen 13.9yen 13.9yen
1USD
1EUR
1RMB
540.8 539.1548.9
613.9 606.8 604.4
431.4
320.4379.0
Exchange
rates
Billions
of yen %
325.5
09/1Q 2Q 3Q 4Q
97yen 93yen 90yen 91yen
133yen 133yen 133yen 124yen
14.2yen 13.6yen 13.2yen 13.3yen
427.6357.9
*
* Including structural reform expense of 32.3 billion yen

6
83.4 89.2 100.8 97.2 80.0 81.3 84.4 64.1 51.7 54.7 60.5 61.3
92.1 80.7 69.6 80.069.9 72.6 55.0
50.035.5 32.3 31.6 35.9
91.7 82.8 79.3 86.881.1 54.4
24.623.9
22.1 20.7 22.9 24.4
42.4 44.9 46.154.3
60.866.4
47.939.2
37.3 38.0 44.6 50.5
18.2 19.7 25.123.0
26.730.4
22.4
9.49.9 5.9
7.2 8.5
45.631.9 41.3
62.562.4
39.1
23.953.6
55.4 49.055.5
84.4
79.177.6
87.8
84.195.0
99.3
50.154.3 62.9
73.5
91.0
48.960.5
50.1
70.557.7
72.3
54.6
25.418.1 20.8
20.7
25.7
65.1
0.0
100.0
200.0
300.0
400.0
500.0
600.0
FY07/1Q 2Q 3Q 4Q FY08/1Q 2Q 3Q 4Q FY09/1Q 2Q 3Q 4Q
Japan
North
America
CIS
China
Asia &
Oceania
Middle East &
Africa
501.8 487.6 500.4
558.7534.0
Europe
516.1
Construction, Mining & Utility Equipment: Quarterly Sales (To Outside Customers) by Region
378.4
316.0
284.6
Billions
of yen
Exchange
rates
105yen 107yen 95yen 95yen
165yen 159yen 126yen 123yen
15.2yen 15.7yen 13.9yen 13.9yen
97yen 93yen 90yen 91yen
133yen 133yen 133yen 124yen
14.2yen 13.6yen 13.2yen 13.3yen
1USD
1EUR
1RMB
122yen 117yen 113yen 104yen
164yen 162yen 165yen 158yen
15.9yen 15.5yen 15.3yen 14.6yen
284.9
316.8
382.0
Latin
America
FY2009 Fourth Quarter
Sales by Region
Emerging economies : 68 %
Japan, North America and Europe : 32 %

7
2. Results for FY2009 ended March 31, 2010
8
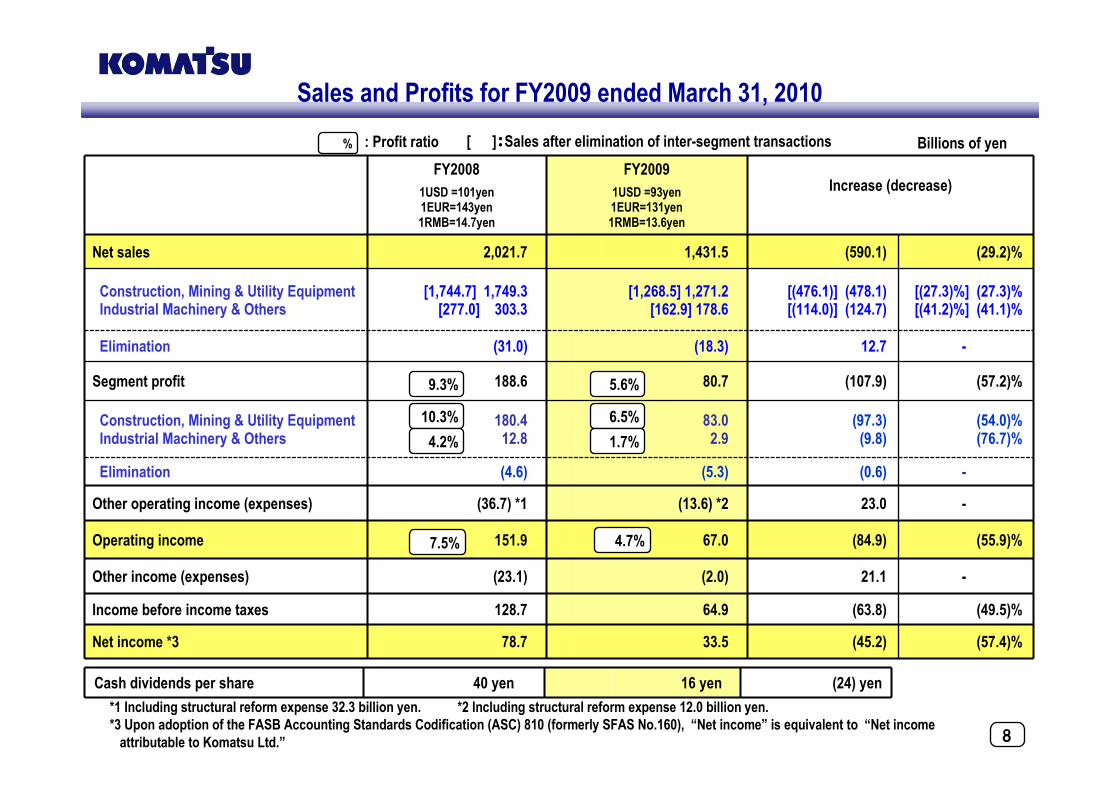
FY2008
1USD =101yen1EUR=143yen1RMB=14.7yen
FY2009
1USD =93yen1EUR=131yen 1RMB=13.6yen
Increase (decrease)
Net sales 2,021.7 1,431.5 (590.1) (29.2)%
Construction, Mining & Utility EquipmentIndustrial Machinery & Others
[1,744.7] 1,749.3[277.0] 303.3
[1,268.5] 1,271.2[162.9] 178.6
[(476.1)] (478.1) [(114.0)] (124.7)
[(27.3)%] (27.3)%[(41.2)%] (41.1)%
Elimination (31.0) (18.3) 12.7 -
Segment profit 188.6 80.7 (107.9) (57.2)%
Construction, Mining & Utility EquipmentIndustrial Machinery & Others
180.412.8
83.02.9
(97.3)(9.8)
(54.0)%(76.7)%
Elimination (4.6) (5.3) (0.6) -
Other operating income (expenses) (36.7) *1 (13.6) *2 23.0 -
Operating income 151.9 67.0 (84.9) (55.9)%
Other income (expenses) (23.1) (2.0) 21.1 -
Income before income taxes 128.7 64.9 (63.8) (49.5)%
Net income *3 78.7 33.5 (45.2) (57.4)%
6.5%
1.7%
5.6%
4.7%
Sales and Profits for FY2009 ended March 31, 2010
Cash dividends per share 40 yen 16 yen (24) yen
Billions of yen% [ ]::::Sales after elimination of inter-segment transactions: Profit ratio
10.3%
4.2%
9.3%
7.5%
*1 Including structural reform expense 32.3 billion yen. *2 Including structural reform expense 12.0 billion yen.
*3 Upon adoption of the FASB Accounting Standards Codification (ASC) 810 (formerly SFAS No.160), “Net income” is equivalent to “Net income
attributable to Komatsu Ltd.”

9
Japan
18%
North
America
11%
Latin
America
13%
CIS
3%
Asia &
Oceania
22%
Middle
East &
Africa
7%
China
19%
Europe
7%
370.7 309.8 228.5
322.6247.8
135.5
340.8
184.1
90.2
214.5
170.5
86.1
89.1
31.7
179.2
244.5
328.7
309.7
281.8
230.1
210.2
85.5
187.8
181.4
0
500
1,000
1,500
2,000
Apr.07-Mar.08 Apr.08-Mar.09 Apr.09-Mar.10
Middle East & Africa
Asia & Oceania
China
CIS
Latin America
Europe
North America
Japan
Billions of yen
¥93/USD
¥131/EUR
¥13.6/RMB
¥114/USD
¥162/EUR
¥15.3/RMB
¥101/USD
¥143/EUR
¥14.7/RMB
1,744.7
Sales by region (to outside customers)Sales by region (to outside customers)
2,048.7
Japan
18%
North
America
14%
Latin
America
12%
CIS
5%
Asia &
Oceania
18%
Middle
East &
Africa
12%
Europe
11%
China
10%
Apr.08-Mar.09
Apr.09-Mar.10
BreakdownBreakdown
Japan, North
America and
Europe
36%
Emerging
economies
64%
Emerging
economies
57%
Japan, North
America and
Europe
43%
Rate of growth
Rate of growth (year-on-year basis)
JapanNorth America
EuropeLatin
AmericaCIS China
Asia & Oceania
Middle East & Africa
Total
Apr.08-Mar.09 (16.4)% (23.2)% (46.0)% +14.2% +3.4% (1.2)% (5.8)% (8.7)% (14.8)%
Apr.09-Mar.10 (26.3)% (45.3)% (51.0)% (20.5)% (64.4)% +36.4% (9.0)% (59.3)% (27.3)%
-14.8%
-27.3%
1,268.5
Construction, Mining & Utility Equipment: Sales (To Outside Customers) by Region
< Twelve months from April through December, 2009 >
10
Billions
of yen
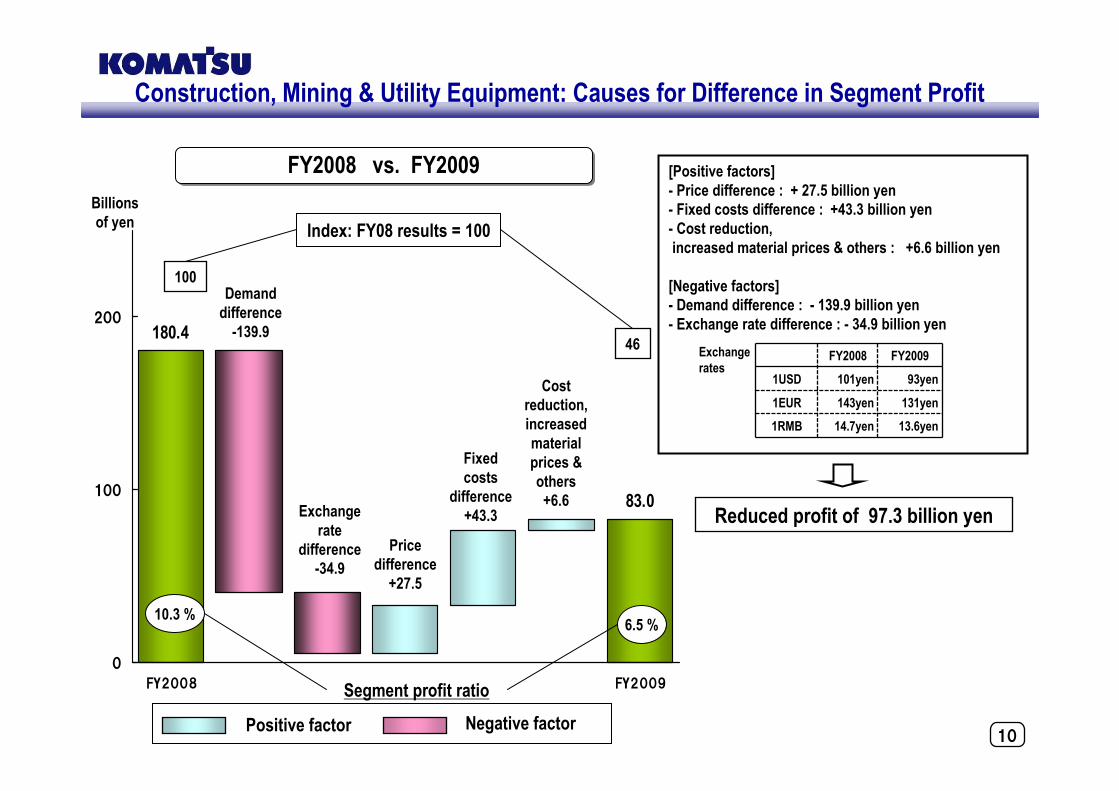
[Positive factors]
- Price difference : + 27.5 billion yen
- Fixed costs difference : +43.3 billion yen
- Cost reduction,
increased material prices & others : +6.6 billion yen
[Negative factors]
- Demand difference : - 139.9 billion yen
- Exchange rate difference : - 34.9 billion yen
Reduced profit of 97.3 billion yen
FY2008 vs. FY2009 FY2008 vs. FY2009
Construction, Mining & Utility Equipment: Causes for Difference in Segment Profit
Positive factor Negative factor
FY2008 FY2009
1USD 101yen 93yen
1EUR 143yen 131yen
1RMB 14.7yen 13.6yen
Exchange
rates
83.0
180.4
0
100
200
FY2008 FY2009
6.5 %
Demand
difference
-139.946
100
Segment profit ratio
Index: FY08 results = 100
10.3 %
Exchange
rate
difference
-34.9
Price
difference
+27.5
Fixed
costs
difference
+43.3
Cost
reduction,
increased
material
prices &
others
+6.6

11
217.6 178.6
303.3
0
100
200
300
400
FY2007 FY2008 FY2009
Billions
of yen
19.9
2.9
12.8
0
10
20
30
FY2007 FY2008 FY2009
0
5
10
15
1.7%
%
4.2%
9.2%
Industrial Machinery & Others : Sales and Segment Profit
SalesSales Segment profitSegment profitBillions
of yen
Segment profit ratio
Billions of yen
Breakdown of sales and segment profit(FY2008 v.s. FY2009)
Breakdown of sales and segment profit(FY2008 v.s. FY2009)
Sales Segment profit
FY2008 FY2009 Increase(decrease)
FY2008 FY2009 Increase(decrease)
Large presses & Komatsu Industries 76.9 42.7 ( 34.2 ) 3.2 ( 3.0 ) ( 6.2 )
Komatsu NTC 93.1 51.2 ( 41.9 ) 4.5 2.2 ( 2.3 )
Consolidation adjustment of Komatsu NTC 15.6 2.9 ( 12.7 ) ( 1.5 ) ( 0.7 ) 0.8
Others 117.7 81.8 ( 35.9 ) 6.6 4.4 ( 2.2 )
Total< Allowance for doubtful receivables >
303.3 178.6 ( 124.7 ) 12.8< ( 3.6 ) >
2.9< 2.6 >
( 9.8 )

12
Mar. 31, 20091USD=98yen1EUR=130yen1RMB=14.4yen
Mar. 31, 20101USD=93yen1EUR=125yen1RMB=13.6yen
Increase(decrease)
Cash & deposits (Incl. time deposit) [a]Accounts receivable (Incl. long-term trade receivable)<Excl. accounts receivable of consolidated retail finance subsidiaries>
InventoriesTangible fixed assets
Other assets
90.6476.8
<308.1>507.3525.4368.7
83.5598.6
<338.1>396.4525.1355.3
(7.0)+121.7<+30.0>(110.9)(0.3)(13.4)
Total assets 1,969.0 1,959.0 (10.0)
Accounts payable 214.3 207.0 (7.3)
Interest-bearing debt [b] 599.8 586.3 (13.4)
<Excl. interest-bearing debt of consolidated retail finance subsidiaries> <450.7> <351.1> <(99.5)>
Other liabilities 306.4 288.8 (17.6)
Total liabilities 1,120.7 1,082.2 (38.4)
[% of total assets]Shareholders’ equity
[41.4%]
814.9[42.6%]
833.9[+1.2points]
+19.0
Noncontrolling interests (Minority interests) 33.3 42.8 +9.4
Liabilities & shareholders’ equity 1,969.0 1,959.0 (10.0)
Interest-bearing debt, net [b-a] 509.2 502.8 (6.4)
Net D/E ratio excluding cash and interest-bearing debt of
consolidated retail finance subsidiaries
0.600.62
0.360.48
Consolidation
effects of
Komatsu
Australia
Corporate
Finance
Pty. Ltd.
[+37.4]
[+14.2]
[+46.3]
Consolidated Balance Sheets
Net D/E ratio Billions of yen
13
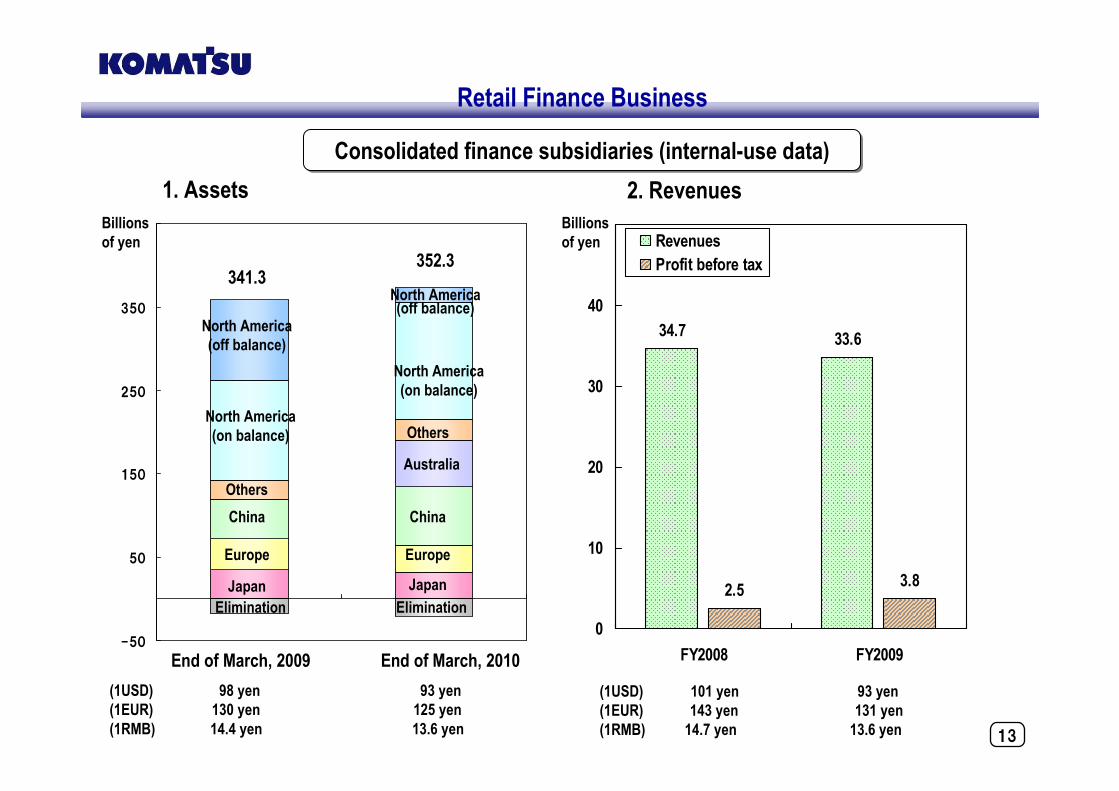
1. Assets
34.733.6
2.53.8
0
10
20
30
40
50
FY2008 FY2009
Revenues
Profit before tax
2. Revenues
Consolidated finance subsidiaries (internal-use data)Consolidated finance subsidiaries (internal-use data)
End of March, 2009 End of March, 2010
(1USD) 98 yen 93 yen
(1EUR) 130 yen 125 yen
(1RMB) 14.4 yen 13.6 yen
(1USD) 101 yen 93 yen
(1EUR) 143 yen 131 yen
(1RMB) 14.7 yen 13.6 yen
Retail Finance Business
Billions
of yen
-50
50
150
250
350
450
341.3352.3
North America
(off balance)
North America
(on balance)
Others
China
Europe
Japan
Elimination
Others
China
Europe
Japan
Elimination
Australia
Billions
of yen
North America(off balance)
North America
(on balance)

14
3. Review of the Last Mid-Range Management Plan
(FY2007-2009)

15
“Global Teamwork for 15” Mid-Range Management Plan in Figures
Target items Target figures for FY 09 FY06 FY07 FY08 FY09
1 Operating income ratio 15% or above 12.9% 14.8% 7.5% 4.7%
2 ROE To maintain 20% level. 23.5% 25.1% 9.3% 4.1%
3 Net debt-to-equity ratio 0.2 or below 0.33 0.39 0.62 0.60
Excl. debt of finance subsidiaries →→→→ 0.22 0.29 0.48 0.36
4 Consolidated payout ratio*[ ]:Excl. structural reform expenses
20% or above 20.1% 20.5% [ 40% ] [ 38% ]
* Based on net income from continuing operations
Items of assumption Guidelines for FY09 FY06 FY07 FY08 FY09
1 Net sales (Billions of yen) 2,400.0 (+/- 100.0) 1,893.3 2,243.0 2,021.7 1,431.5
2 FOREX JPY/USD 110 117 114 101 93
JPY/EUR 145 151 162 143 131
<Assumptions of mid-range management plan and results>
Target figures and results of the mid-range management plan (FY07-09)
Target figures were practically achieved in FY2007, but the business environment drastically changed in and after the second half of FY2008.

16
Billions of yen21%
17%14%14%
0
100
200
300
400
FY06 FY07 FY08 FY09
0%
10%
20%
Main activities Results
1 Development of DANTOTSU products 1) Introduced the Hybrid hydraulic excavator on the market as a pioneer.
- April 09 in Japan
- March 10 in China
2) Komatsu equipment with KOMTRAX
exceeded 160 thousand units.
3) Expanded the introduction of the Autonomous
Haulage System (AHS) and ensured stable operation.
2 Further enhancement of market
position in Greater Asia
1) Improved market share.
2) Expanded local manufacturing.- New factory of Komatsu Shantui (March 09)- New factory of Bangkok Komatsu (August 07)- New factory of Komatsu Indonesia (January 09)
3 Business expansion in the entire value
chain
1) Reinforced the parts business.
2) Reinforcement of retail finance business.- Coverage of major markets and mining customers by 8 companies(Consolidated Komatsu Australia Corporate Finance in May, 09)
Review of Main Activities of the Mid-Range Management Plan (FY07-09) - 1
Sales amount & ratio of parts business
10%
20%
30%
FY03 FY04 FY05 FY06 FY07 FY08 FY09
0
100
200
(1,000 units)Demand Share in Greater Asia
Share in China Worldwide share

17
Main activities Results
4 Establishment of flexible manufacturing
operations
( 1st stage : Up through 1H of FY08 )
Expanded production capacity in emerging countries
Expanded cross sourcing
( 2nd stage : Since 2H of FY08 )
Reformation of manufacturing operation & inventory reduction- Japan : 8 to 5 factories, - North America : 8 to 3 factories
5 Expansion of utility equipment business Structural reforms & fixed cost reduction of Komatsu Utility- Closed the Kawagoe Plant and transferred production to the Tochigi Plant (Feb, 09)
- Consolidated 9 distributors to 1 in Japan (Oct, 09)
- Acquired distributor in Australia (Apr, 09)
6 Reinforcement of industrial machinery
business
( 1st stage : Up through 1H of FY08 )
Intensive marketing of large
AC servo presses and wire saws
( 2nd stage : Since 2H of FY08 )
Structural reforms in Japan- Closed the Komatsu Plant and transferred production to the Kanazawa Plant
- Consolidated large press operation to Komatsu Industries
7 Continuous reduction of fixed costs ( 1st stage : Up through 1H of FY08 )
Invested in production and R&D corresponding to increasing demand
( 2nd stage : Since 2H of FY08 )
Reduced fixed costs by promoting structural reform activities:
approx. 50 billion yen for FY09 (the same level as FY03) from FY08
Review of Main Activities of the Mid-Range Management Plan (FY07-09) - 2

180
2,500
5,000
7,500
10,000
1980 1990 2000 2005 2010FC 2015FC
OthersIndiaChinaEuropeN.AmericaJapan
Changes in the Business Environment - 1
JPY/USD
0
20
40
60
80
100
120
140
160
J-95
J-96
J-97
J-98
J-99
J-00
J-01
J-02
J-03
J-04
J-05
J-06
J-07
J-08
J-09
J-10
JPY/EUR
0
20
40
60
80
100
120
140
160
180
J-95
J-96
J-97
J-98
J-99
J-00
J-01
J-02
J-03
J-04
J-05
J-06
J-07
J-08
J-09
J-10
JPY/CNY
02468
101214161820
J-95
J-96
J-97
J-98
J-99
J-00
J-01
J-02
J-03
J-04
J-05
J-06
J-07
J-08
J-09
J-10
JPY/AUD
0
20
40
60
80
100
120
J-95
J-96
J-97
J-98
J-99
J-00
J-01
J-02
J-03
J-04
J-05
J-06
J-07
J-08
J-09
J-10
JPY/RUB
0
1
2
3
4
5
6
J-99 J-00 J-01 J-02 J-03 J-04 J-05 J-06 J-07 J-08 J-09 J-10
JPY/ZAR
0
5
10
15
20
25
J-99 J-00 J-01 J-02 J-03 J-04 J-05 J-06 J-07 J-08 J-09 J-10
<JPY/USD> <JPY/RMB> <JPY/EUR>
<JPY/AUD>>>>> <JPY/RUB> <JPY/ZAR>
0
50
100
150
200
250
300
350
'00 '01 '02 '03 '04 '05 '06 '07 '08 '09 10e 11e 12e
Copper (USD/lb)Dubai crude price (USD/barrel)Iron ore (USD/ton)Steam coal (USD/ton)
0
500
1,000
1,500
2,000
'04 '05 '06 '07 '08 '09 '10e '11e '12e
China India, Brazil Others
< Crude Steel Production >< Commodity Prices >
Foreign exchange rates
< World Population > < Urbanization Rates >
Millions of metric tons
Strategic markets
Traditional markets
Commodity prices & crude steel production World population & urbanization rates
20%
30%
40%
50%
60%
70%
80%
90%
100%
1980 1990 2000 2005 2010FC2015FC
USAJapanChinaIndia

190
1,000
2,000
3,000
4,000
5,000
6,000
FY03 FY04 FY05 FY06 FY07 FY08 FY09 FY10e FY11e FY12e
Middle East, AfricaAustraliaAsiaChinaEurope, CISL.AmericaN.America
0
50,000
100,000
150,000
200,000
250,000
300,000
350,000'82
'83
'84
'85
'86
'87
'88
'89
'90
'91
'92
'93
'94
'95
'96
'97
'98
'99
'00
'01
'02
'03
'04
'05
'06
'07
'08
'09
'10e
'11e
'12e
China
Others
Europe
N America
Japan
FY
0
50,000
100,000
150,000
200,000
FY03 FY04 FY05 FY06 FY07 FY08 FY09 FY10e FY11e FY12e
Europe
N.America
Japan
0
50,000
100,000
150,000
200,000
250,000
FY03 FY04 FY05 FY06 FY07 FY08 FY09 FY10e FY11e FY12e
L.America, Africa, OceaniaAsia, CIS, Middle EastChina
Traditional markets Strategic marketsUnits
Traditional
markets(Japan, N.America,
Europe)
Strategic markets(China, Asia, CIS, Middle
East, Latin America.
Africa, Oceania)
Estimates
Region Annual growth rate from FY09 to FY12
Traditional markets +10%
Strategic markets +16%
Worldwide +14%
< Estimated demand growth rate >
Changes in the Business Environment - 2
Demand for 7 major construction products
Mining equipment Units
Units
Units

20
0
200000
400000
600000
800000
FY03 FY04 FY05 FY06 FY07 FY08 FY09 FY10e FY11e FY12e
Others
China
Europe
N.America
Japan
Demand for compact construction equipment Demand for compact construction equipment Units
0
100,000
200,000
300,000
400,000
FY03 FY04 FY05 FY06 FY07 FY08 FY09 FY10e FY11e FY12e
Others
China
Europe
N.America
Japan
-5
0
5
10
15
20
25
30
'08/1Q
'08/10
'08/12
'09/2
'09/4
'09/6
'09/8
'09/10
'09/12
'10/2
-200%
-100%
0%
100%
200%
300%
400%
500%Sheet metal machinesPressesRate of growth
0
30
60
90
120
150
'08/1
Q
'08/3
Q
'08/1
1
'09/1
'09/3
'09/5
'09/7
'09/9
'09/1
1
'10/1
'10/3
-100%
0%
100%
200%
300%
400%
500%ExportJapanRate of growth
Changes in the Business Environment - 3
Demand for forklift trucks (class 1,4,5) Demand for forklift trucks (class 1,4,5) Units
Orders received for press and sheet metal
machines ( major Japanese makers)
Orders received for press and sheet metal
machines ( major Japanese makers)Orders received for machine tools
(major Japanese makers)
Orders received for machine tools
(major Japanese makers)
Billions of yen
per month
Billions of yen
per month
0
20,000
40,000
60,000
80,000
100,000
'01 '03 '05 '07 '09 '11 '13
Japan & Korea N.America
Europe & CIS China
Others
Automobile production by regionAutomobile production by regionUnits

21
- 44 manufacturing bases worldwide (12 in Japan, 7 in Americas, 8 in
Europe & CIS, 9 in Asia, 8 in China)
- Cross sourcing of machines & components
- Transferring technologies, skills and standards from “mother”
plants to “child” plants
Komatsu’s Strengths
1. Unique and competitive products 2. Global sales and service network
In-house component technologies( Engines, hydraulics, electric motors, electronic controls, etc. )
3. Flexible manufacturing operationInter-divisional collaboration and Kaizen
Sales &
service
R & DProduction- ”Build in quality”
- OX activities
- QC circles
- Skill training
Suppliers
Simultaneous
development
KaizenSales & Production Planning-Thorough inventory management
-Culture of daily efforts
-Global manufacturing operation
Up to the present Now on
Fuel efficien
cy
Hydraulic
excavator
Wheel loader
Dump truck
Bulldozer
Forklift truck
Industrial
machinery
IT
Small size : electronic controlled HST
KOMTRAX Plus
Biodiesel fuel
Small size : battery type
Middle size : HST
Hybrid excavator
Small size : electronic controlled HST
KOMTRAX、、、、KOMTAX Plus
IT-guided construction
Autonomous haulage system
Wire saw
AC servo press
Super large electric dump truck
: Countries with
Komatsu dealers
: Countries without
Komatsu dealers
205 dealers in 148 countries
covering areas with 99% of worldwide demand

22
4. New Mid-Range Management Plan
“Global Teamwork for Tomorrow”

23
9.5% 9.8%8.8%
12.8% 13.2%12.3%
14.9%
3.5%
7.2%
9.5%9.4%
2.6%
12.3% 13.3%
14.7%15.5%
14.3%
12.6%13.7%
4.6%
15.0%
0
200
400
600
800
FY05 1Q 2Q 3Q 4Q
FY06 1Q 2Q 3Q 4Q
FY07 1Q 2Q 3Q 4Q
FY08 1Q 2Q 3Q 4Q
FY09 1Q 2Q 3Q 4Q
FY10e(average)
FY11e(average)
FY12e(average)
0%
5%
10%
15%
20%
Operating profit operating profit ratio
FY05 '06 '07 '08 '09 '10 '11 '12
60
70
80
90
FY05 1Q 2Q 3Q 4Q
FY06 1Q 2Q 3Q 4Q
FY07 1Q 2Q 3Q 4Q
FY08 1Q 2Q 3Q 4Q
FY09 1Q 2Q 3Q 4Q
FY10e(average)
FY11e(average)
FY12e(average)
Consolidated sales & operating profit ratios
Fixed costs
Stance on Targets of “Global Teamwork for Tomorrow”
Continuously keep fixed costs low
1st stage 2nd stage
New mid-range management planGlobal Teamwork for 15
Actions for short-term tasks
Further reinforcement of profit structure
Margin ratio
Billions
of yen
-12.7%
Move The World
1 USD = 110 yen
Billions
of yen
[90] [90] [90]104 105 107117 113 95 95 97 93 90 91117 118 119 122114117118112108USD / JPY
USD rate 114yen 93yen 90yen
- 2007 - 2009 - 2012
Demand North America ◎→○ × △→○Europe ◎ × △China ○ △→○ ◎Asia &
resource countries○ △→○ ◎
Minig & parts ◎ ○ ◎Products Dantotsu ratio ○ ○→◎ ◎FOREX Traditional markets ◎ △ △
Strategic markets ○ △ △→○Sales price ○ ○ ○Costs Cost reduction ○ ○ ◎
Steel prices △ × △Capacity utilization ◎ × ○
Structural Productivity ○ △→○ ◎reform Fixed cost ratio ○ △ ○
24
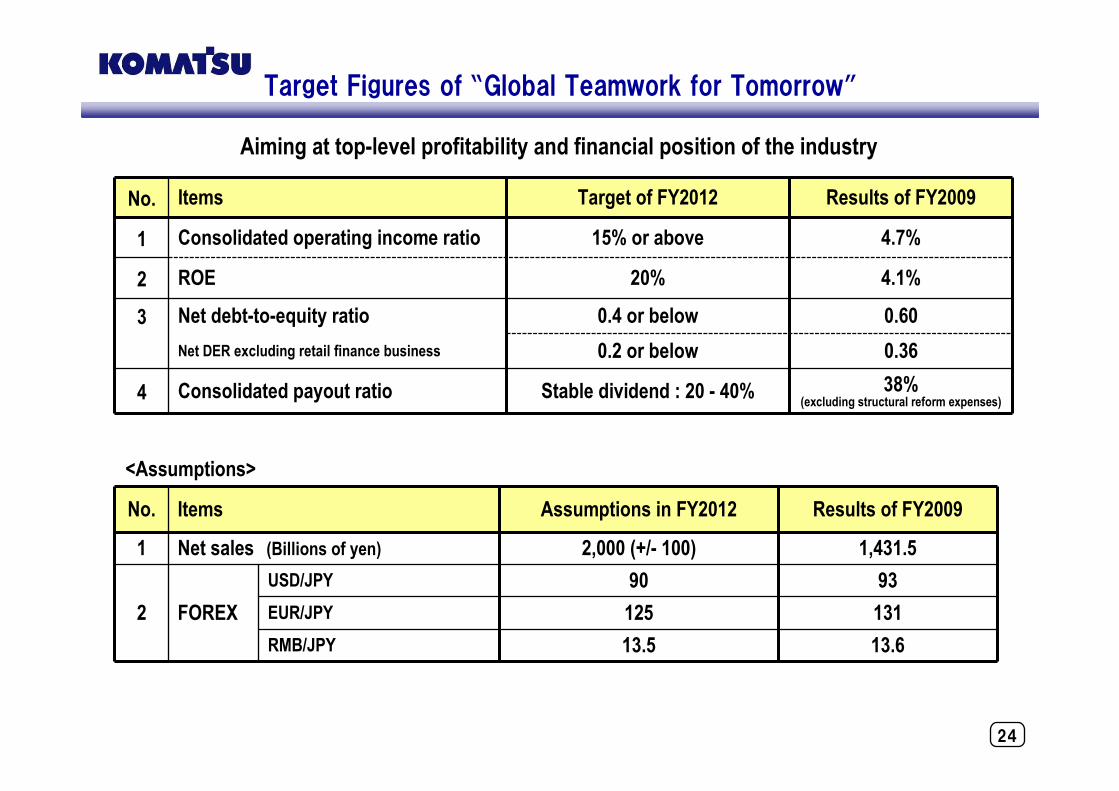
Aiming at top-level profitability and financial position of the industry
Target Figures of “Global Teamwork for Tomorrow”
No. Items Target of FY2012 Results of FY2009
1 Consolidated operating income ratio 15% or above 4.7%
2 ROE 20% 4.1%
3 Net debt-to-equity ratio 0.4 or below 0.60
Net DER excluding retail finance business 0.2 or below 0.36
4 Consolidated payout ratio Stable dividend : 20 - 40% 38%(excluding structural reform expenses)
No. Items Assumptions in FY2012 Results of FY2009
1 Net sales (Billions of yen) 2,000 (+/- 100) 1,431.5
2 FOREX
USD/JPY 90 93
EUR/JPY 125 131
RMB/JPY 13.5 13.6
<Assumptions>

2525
Main Activities of “ Global Teamwork for Tomorrow”
No. Activities Aims
1Promotion of IT Applications to Products
and Parts■■■■ To enhance added value of products by applying IT.
2Product Development for Improved
Environmental Friendliness and Safety
■■■■ To upgrade our environmental responses with next-generation
technologies as an industry-leading company.
3Expansion of Sales and Service Operations
in Strategic Markets
■■■■ To further reinforce operations in growth markets to meet the
structural change of market demand.
4Promotion of Continuous Improvement by
Strengthening Workplace Capability
■■■■ To sustain and improve organizational capability for persistent
improvement in order to win the global competition.
2. Main activities of business operation
1. Main activities of management
No. Activities Aims
1 Promotion of Brand Management Activities
■■■■ To develop human resources through activities designed to build
and strengthen relationships with customers and the Komatsu Group
(Komatsu and distributors).
2Total Quality Management in Strategic
Markets (especially in China)
■■■■ To promote the growth of national staff members so that they will
become able to manage operations independently in growth markets.

26
5. Projection for FY2010 ending March 31, 2011

27
Outline of Projection for FY2010 ending March 31, 2011
2. Outlook of two business segments
- Construction, Mining and Utility Equipment
In addition to market demand increase in emerging markets, such as China and Asia, market demand should
gradually improve in North America and Europe. We project net sales will improve by 18.0% and segment profit
will double from FY2009.
- Industrial Machinery and Others
Market will remain challenging. We project sales will be up 0.8%, almost same as FY2009, but segment profit
will be down, because there were special factors in FY2009, such as reversal of allowance for doubtful receivables.
3. Cash dividends
- Annual cash dividends of 28 yen per share are projected.
(Consolidated payout ratio should translate into 30%
of net income)
Net sales 1,660.0 billion yen, up 16.0%
Operating income 157.0 billion yen, up 134.2%
Operating income ratio 9.5%, up 4.8 points
Income before income tax 149.0 billion yen, up 129.3%
Net income * 90.0 billion yen, up 168.2%
FY2009 FY2010 Increase
(decrease)
Interim 8 yen 14 yen * 6 yen *
Year-end 8 yen* 14 yen* 6 yen*
Total 16 yen* 28 yen* 12 yen*
* Projected
1. Sales and profits : Both sales and profits should improve from FY2009.
* Net income is comparable to net income attributable to Komatsu Ltd. as defined in the FASB Accounting Standards Codification (ASC) 810.

28
FY2009 1USD =93yen1EUR=131yen 1RMB=13.6yen
FY2010 Projection1USD = 90yen1EUR= 125yen1RMB= 13.5yen
Increase (decrease)
Net sales 1,431.5 1,660.0 228.4 16.0%
Construction, Mining & Utility EquipmentIndustrial Machinery & Others
[1,268.5] 1,271.2[162.9] 178.6
[1,496.0] 1,500.0 [164.0] 180.0
[227.5] 228.7[1.1] 1.3
[17.9%] 18.0%[0.7%] 0.8 %
Elimination (18.3) (20.0) (1.6) -
Segment profit 80.7 165.0 84.2 104.4%
Construction, Mining & Utility EquipmentIndustrial Machinery & Others
83.02.9
170.01.0
86.9(1.9)
104.7%(66.6)%
Corporate & elimination (5.3) (6.0) (0.6) -
Other operating income (expenses) (13.6) *1 (8.0)*2 5.6 -
Operating income 67.0 157.0 89.9 134.2%
Other income (expenses) (2.0) (8.0) (5.9) -
Income before income taxes 64.9 149.0 84.0 129.3%
Net income *3 33.5 90.0 56.4 168.2%
6.5%
1.7%
5.6%
Cash dividends per share 16 yen 28 yen 12 yen
11.3%
0.6%
9.9%
9.5%4.7%
Projection for FY2010 ending March 31, 2011
% : Profit ratio Billions of yen[ ] : Sales after elimination of inter-segment transactions
*1 Including structural reform expense of 12.0 billion yen. *2 Including structural reform expense of 4.0 billion yen.
*3 Upon adoption of the FASB Accounting Standards Codification (ASC) 810 (formerly SFAS No.160), “Net income” is equivalent to “Net income
attributable to Komatsu Ltd.”

29
20%
-21%-20%
15%
13%
16%
13%
22%
0
100,000
200,000
300,000
400,000
500,000
600,000
FY03
FY04
FY05
FY06
FY07
FY08
FY09
FY10est
-30%
-20%
-10%
0%
10%
20%
30%Japan N.America EuropeChina Others Growth ratio
309.8 228.5 225.0
247.8
135.5 155.0
184.1
90.2 95.0
214.5
170.5 185.0
89.1
31.755.0
179.2
244.5320.0
309.7
281.8
360.0
210.2
85.5
101.0
0
500
1,000
1,500
2,000
FY08 FY09 FY10est
ME & Africa
Asia & Oceania
China
CIS
L.America
Europe
N.America
Japan
Billions
of yen
1,744.7
CIS
4%
China
21%
Asia &
Oceania
24%
Latin
Amer ica
12%
ME &
Afr ica
7%
Japan
15%Nor th
Amer ica
11%
Europe
6%China
19% CIS
3%
Latin
Amer ica
13%
Europe
7%
Nor th
Amer ica
11%
Japan
18%Asia &
Oceania
22%
ME &
Afr ica
7%
FY09
Sales breakdownSales breakdown
Strategic
Markets
68%
Strategic
Markets
64%
Traditional
markets
32%
Traditional
markets
36%
::::Growth ratio
FY10est
100
113
131
148
170
136
Units
107
128
+18%-27%
1,268.5
1,496.0
[Demand breakdown] FY08 FY09 FY10e
Traditional markets : 47% 33% 29%
Strategic markets : 53% 67% 71%
Construction, Mining & Utility Equipment : Sales by Region and Segment Profit
Sales by region (To outside customers)Sales by region (To outside customers)Demand for 7 major products by regionDemand for 7 major products by region
Index : FY03 = 100

30
170.0
83.0
0
50
100
150
200
250
FY2009 FY2010
Projection
Exchange
rate
difference
-10.0
Fixed
costs
difference
0.0
11.3%
Selling price,
cost reduction,
material price
and others
25.9
Positive factor
205
Billions
of yen
Segment profit ratio
Index : FY2009 results = 100
Profit increase of 86.9 billion yen
Volume
difference
71.0
100
6.5%
[Positive factors]
- Volume difference : +71.0 billion yen
- Selling price, cost reduction, material price
and others : + 25.9 billion yen
- Fixed costs difference : +/- 0.0 billion yen
[Negative factor]
- Exchange rate difference : - 10.0 billion yen
FY2008 FY2009
1USD 93 yen 90 yen
1EUR 131 yen 125 yen
1RMB 13.6 yen 13.5 yen
Exchange
rates
Construction, Mining & Utility Equipment: Causes for Difference in Segment Profit
Negative factor

31
0
1,000
2,000
3,000
4,000
5,000
6,000
FY03 FY04 FY05 FY06 FY07 FY08 FY09 FY10e
ME & Africa
Australia
Asia
China
Europe&CIS
L.America
N.America
0
250
500
750
'08.3
'09.3
'09.6
'09.9
'09.12
'10.3
0
250
500
750
'08.3
'09.3
'09.6
'09.9
'09.12
'10.3
0
250
500
750
'08.3
'09.3
'09.6
'09.9
'09.12
'10.3
Units
0
1,000
2,000
3,000
4,000
5,000
FY03 FY04 FY05 FY06 FY07 FY08 FY09 FY10e
Millions
of USD+3%
+19%
+12%
+52%
+67%
- 33%+15%
-4%+6%
6mos 4mos 12mos 6mos 12mos 10mos
Construction, Mining & Utility Equipment : Mining Equipment Business
Demand by region Demand by region Sales of mining equipmentSales of mining equipment
* Incl. sales of parts and service
(Internal-use data)
Backlog ordersBacklog orders
[Applicable products]・・・・Dump trucks: 75t ((((HD785)))) and larger・・・・Bulldozers: 525HP ((((D375)))) and larger ・・・・Hydraulic excavators: 150t ((((PC1600)))) and larger・・・・Wheel loaders: 500HP ((((WA700)))) and larger ・・・・Motor graders: 280HP ((((GD825)))) and larger
* Finished products only. Excl. parts and service Lead-time from order to shipment
Komatsu Ltd. (non-consolidated)Mining equipment related
Komatsu America Corp. Mining Div.
Komatsu Mining Germany GmbHMillions
of USDMillions
of EUR
Billions
of yen

32
303.3
178.6 180.0
0
100
200
300
FY2008 FY2009 FY2010 Projection
12.8
1.02.9
0
10
20
30
FY2008 FY2009 FY2010 Projection
0
6
12
18
4.2 %
Sales
FY2009 FY2010 Projection Increase (decrease)
Komatsu Industries* 42.7 33.6 (9.1)
Komatsu NTC 51.2 62.3 11.1
Consolidation adjustment of Komatsu NTC 2.9 0.0 (2.9)
Others 81.8 84.1 2.3
Total 178.6 180.0 1.4
0.6 %
1.7 %
Industrial Machinery & Others : Sales and Segment Profit
%
Breakdown of sales (FY2009 vs. FY2010 Projection)Breakdown of sales (FY2009 vs. FY2010 Projection)
Segment profitSegment profitBillions
of yen
Billions
of yen
Billions of yen
SalesSales
Segment profit ratio
* Komatsu Industries succeeded to Komatsu’s large press business by means of corporate split effective April 1, 2010.

33
-50
50
150
250
350
450
0
10
20
30
40
50
FY2009 FY2010 Projection
Rvenues
Profit before tax352.3 351.1
33.6
6.1
3.8
35.2North America(off balance)
North America
(on balance)
Others
China
Europe
Japan
Elimination
Others
China
Europe
Japan
Elimination
Australia
North America(off balance)
North America
(on balance)
Australia
Billions
of yen
Billions
of yen
1. Assets 2. Revenues
Consolidated retail finance subsidiaries (internal-use data)Consolidated retail finance subsidiaries (internal-use data)
Retail Finance Business
End of March, 2010 End of March, 2011
(1USD) 93 yen 90 yen (1EUR) 125 yen 125 yen (1RMB) 13.6 yen 13.5 yen
(1USD) 93 yen 90 yen(1EUR) 131 yen 125 yen (1RMB) 13.6 yen 13.5 yen

34
47.0 38.0 41.3
6.06.2
6.7
2.9%3.1%
2.7%
0
50
100
FY2008 FY2009 FY2010
Projection
-2.0%
0.0%
2.0%
4.0%
Industrial Machinery & OthersConstruction, Mining & Utility EquipmentR&D expenses ratio
101.5
61.150.4
1.8
8.6
2.8 57.4
55.354.1
0
50
100
150
FY2008 FY2009 FY2010
Projection
Industrial Machinery & Others
Construction, Mining & Utility Equipment
Depreciation
110.1
63.9
53.7
52.247.6
44.1
* Excluding investment in
rental assets
16%19% 17%
0
100
200
300
400
500
FY2008 FY2009 FY2010
Projection
-100%-98%-96%-94%-92%-90%-88%-86%-84%-82%-80%-78%-76%-74%-72%-70%-68%-66%-64%-62%-60%-58%-56%-54%-52%-50%-48%-46%-44%-42%-40%-38%-36%-34%-32%-30%-28%-26%-24%-22%-20%-18%-16%-14%-12%-10%-8%-6%-4%-2%0%2%4%6%8%10%12%14%16%18%20%22%24%26%28%30%
Fixed costs Fixed costs ratio
Capital Expenditures, Depreciation, R&D Expenses and Fixed Costs
Investment in production and
other facilities,* and
depreciation
Investment in production and
other facilities,* and
depreciation
Billions
of yen
R&D expensesR&D expenses
Billions
of yen
Fixed costsFixed costs
Billions
of yen
35
6. Activities of Importance in “Global Teamwork for Tomorrow”

36
1. Evolution of KOMTRAX1. Evolution of KOMTRAX
2. Evolution of Autonomous Haulage System2. Evolution of Autonomous Haulage System
1) KOMTRAX
2) KOMTRAX Plus (formerly VHMS)
Expanding applications to parts & service operations for
mining equipment
i) Unification of Machine Management
- Unified management of VHMS-installed machines on KOMTRAX display
ii) Prediction and management of maintenance timing
(Management of parts, UC, GET)
Evolution of uses by distributors and customers
-- Making operation “visible”
i) Business expansion
ii) Application to large-scale fleet
Activities of Importance (1): IT Applications to Products and Parts
3) Application of KOMRAX to Forklift Trucks
and Expansion of Industrial Machinery-
version KOMTRAX-installed Machines
Internet
Data server
Web server
Customers

37
Activities of Importance (2): Product Development for Improved Environmental Friendliness and Safety
To expand the model range of hybrid construction
equipment and their sales.
- 30-ton hydraulic excavator
- Wheel loaders, etc.
Timely introduction of Tier4-certified models
Variable Geometry Turbo
Charger
DPF
(Diesel Particulate Filter)
Achievement in reducing both toxic substances and fuel consumption
Outstanding reduction of black smoke and noise
Tier4-certified engine (developed)
(1) To reduce CO2 emissions.
- Promotion of the biodiesel fuel project
(2) To develop safety technology.
- Surrounding area monitoring, detection of
drowsy driving, collision detection, etc.
3. Reduction of CO2 emissions from mining
equipment and safety technology
3. Reduction of CO2 emissions from mining
equipment and safety technology
4. Development of environment-friendly forklift
trucks
4. Development of environment-friendly forklift
trucks
5. Development of environment-friendly
industrial machinery
5. Development of environment-friendly
industrial machinery
(1) Small: Next-generation electric models
(2) Medium-sized: Hydrostatic transmission-equipped
models
(1) To develop and launch next-generation AC
Servo presses.
(2) To meet growing demand for clean energy
by improving the performance of wire saws.
1. Reduction of CO2 emissions
from construction equipment
1. Reduction of CO2 emissions
from construction equipment
2. Meeting Tier4 emission regulations2. Meeting Tier4 emission regulations
38
(1) Introduction of distributor management system.(China ���� Extending to other regions)
(2) Development of key managers of distributors. (Continuation of the Global Training Institute)
(3) Development of global engineers at the KomatsuH.R.D. Center (Philippines).
(4) Improvement of service engineer training.
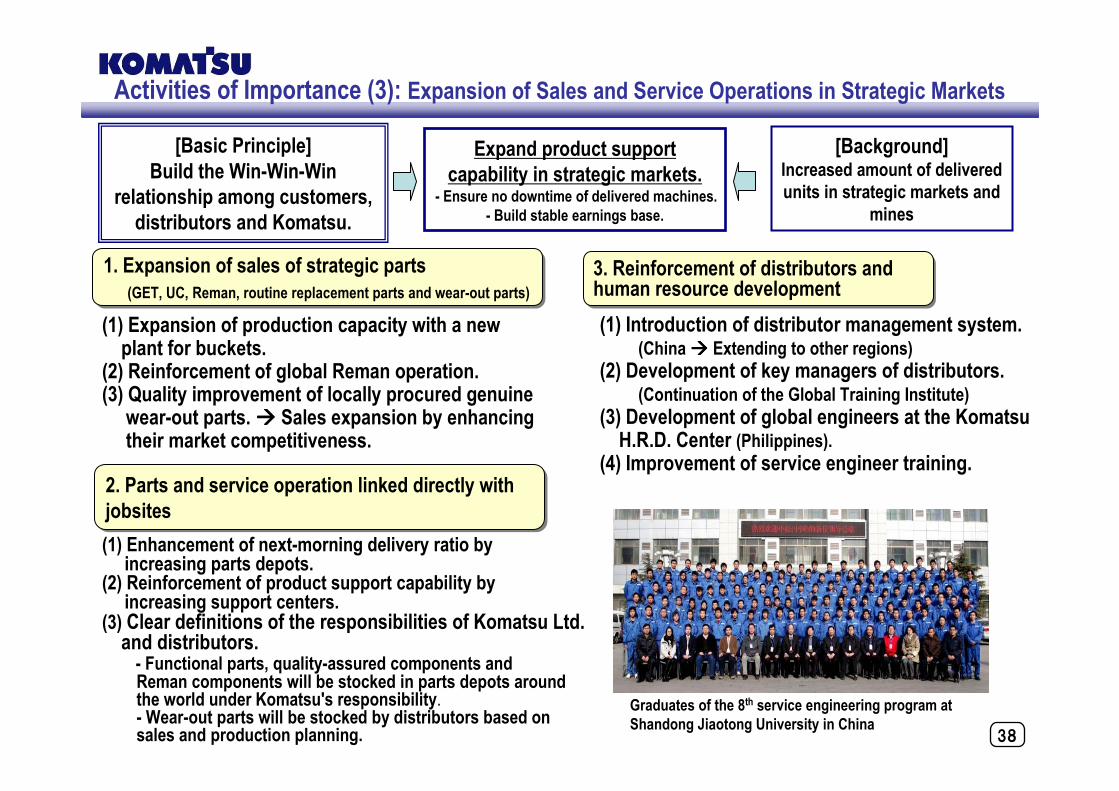
Activities of Importance (3): Expansion of Sales and Service Operations in Strategic Markets
[Background]Increased amount of delivered
units in strategic markets and
mines
Expand product support
capability in strategic markets.- Ensure no downtime of delivered machines.
- Build stable earnings base.
1. Expansion of sales of strategic parts
(GET, UC, Reman, routine replacement parts and wear-out parts)
1. Expansion of sales of strategic parts
(GET, UC, Reman, routine replacement parts and wear-out parts)
(1) Expansion of production capacity with a new plant for buckets.
(2) Reinforcement of global Reman operation.(3) Quality improvement of locally procured genuine wear-out parts. ���� Sales expansion by enhancingtheir market competitiveness.
2. Parts and service operation linked directly with
jobsites
2. Parts and service operation linked directly with
jobsites
(1) Enhancement of next-morning delivery ratio byincreasing parts depots.
(2) Reinforcement of product support capability by increasing support centers.
(3) Clear definitions of the responsibilities of Komatsu Ltd. and distributors.- Functional parts, quality-assured components and Reman components will be stocked in parts depots around the world under Komatsu's responsibility.- Wear-out parts will be stocked by distributors based on sales and production planning.
3. Reinforcement of distributors and human resource development3. Reinforcement of distributors and human resource development
[Basic Principle]
Build the Win-Win-Win
relationship among customers,
distributors and Komatsu.
Graduates of the 8th service engineering program at
Shandong Jiaotong University in China

39
Activities of Importance (4): Promotion of Continuous Improvement by Strengthening Workplace Capability
“Workplace capability” = Group’s continuous Kaizen capability by discovering issues and solving them
[ Attitude ]- Never be content with
the status quo but define
tasks.
[ Methods ]- Making it “visible”
- Cross-organizational
teamwork
[ Aim ]- Human resource
development
1. Stance
2. Activities
No. Items Contents
1
Further promotion of flexible
global manufacturing
operation
(1) Global cross-sourcing of products and parts
(2) Making all phases “visible” from production and inventory to sales.
(3) Optimization of logistics (packing, transportation efficiency, utilization of
port-adjacent plants)
2Promotion of DANTOTSU
reduction of production costs
(1) Concentrated reduction of production costs of strategic models
(2) Manpower shift from conventional to strategic markets
3Reduction of fixed costs by
reforming administrative work
(1) Work reforms by applying IT
(2) Consolidation of systems

40
<<<<Appendix>>>>

41
FY2008 FY2009 Increase (decrease)
Net salesSegment
profitNet sales
Segment
profitNet sales
Segment
profit
Japan 959.3 26.4 565.5 (21.6) (393.8) (48.1)
Americas 494.8 51.8 344.1 33.9 (150.6) (17.8)
Europe & CIS 293.3 22.1 161.8 10.4 (131.4) (11.7)
Others 472.9 60.0 482.0 59.3 9.0 (0.6)
Total 2,220.5 160.5 1,553.6 82.0 (666.9) (78.4)
Elimination (471.1) 19.9 (282.3) 0.9 188.7 (18.9)
Consolidated 1,749.3 180.4 1,271.2 83.0 (478.1) (97.3)
Construction, Mining & Utility Equipment : Sales and Segment Profit by Region (Geographic Origin)
Billions of yen

42
81.4 80.3 78.7
94.0
81.6 77.7
41.5
-12.3
8.412.9
20.8
38.5
9.0%
5.8%4.0%
2.6%
-3.2%
9.6%
12.9%13.5%
15.3%14.3%
14.9%15.1%
-20
0
20
40
60
80
100
120
1Q 2Q 3Q 4Q 1Q 2Q 3Q 4Q 1Q 2Q 3Q 4Q
-5%
0%
5%
10%
15%
20%
25%
30%Segment profitSegment profit ratio
Billions
of yen
Quarterly Segment Profit: Total
Exchange
rates
105yen 107yen 95yen 95yen
165yen 159yen 126yen 123yen
15.2yen 15.7yen 13.9yen 13.9yen
97yen 93yen 90yen 91yen
133yen 133yen 133yen 124yen
14.2yen 13.6yen 13.2yen 13.3yen
1USD
1EUR
1RMB
122yen 117yen 113yen 104yen
164yen 162yen 165yen 158yen
15.9yen 15.5yen 15.3yen 14.6yen
FY ended March 2008 FY ended March 2009 FY ended March 2010

43
38.9
23.3
7.4
-7.639.3
78.2 74.5 74.7
90.378.3
70.3
13.3
10.2%
13.6%14.6%
16.1%14.9%15.2%15.6%
10.4%
7.4%4.7%
2.6%
-2.4%-20
0
20
40
60
80
100
120
FY07/1Q FY07/2Q FY07/3Q FY07/4Q FY08/1Q FY08/2Q FY08/3Q FY08/4Q FY09/1Q FY09/2Q FY09/3Q FY09/4Q -3%
0%
3%
6%
9%
12%
15%
18%Segment profit
Segment profit ratio
382.7317.5285.5285.4317.0
379.3
517.4535.4560.6501.7489.2503.1
0
100
200
300
400
500
600
FY07/1Q FY07/2Q FY07/3Q FY07/4Q FY08/1Q FY08/2Q FY08/3Q FY08/4Q FY09/1Q FY09/2Q FY09/3Q FY09/4Q
Construction, Mining & Utility Equipment: Quarterly Sales and Segment Profit
Quarterly salesQuarterly sales
Quarterly segment profitQuarterly segment profit
Billions
of yen
07/1Q 07/2Q 07/3Q 07/4Q
122yen 117yen 113yen 104yen
164yen 162yen 165yen 158yen
15.9yen 15.5yen 15.3yen 14.6yen
08/1Q 08/2Q 08/3Q 08/4Q
105yen 107yen 95yen 95yen
165yen 159yen 126yen 123yen
15.2yen 15.7yen 13.9yen 13.9yen
1USD
1EUR
1RMB
Exchange
rates
Billions
of yen
09/1Q 09/2Q 09/3Q 09/4Q
97yen 93yen 90yen 91yen
133yen 133yen 133yen 124yen
14.2yen 13.6yen 13.2yen 13.3yen

44
0.7-1.32.8-3.42.3
3.86.4
4.9 4.7 4.7
9.1
0.7
1.5%
9.6%
6.1%7.5%
9.2%
11.4%
8.7%
4.0%
-3.2%
1.8%
7.2%
-4.8%-5
0
5
10
15
FY07/1Q FY07/2Q FY07/3Q FY07/4Q FY08/1Q FY08/2Q FY08/3Q FY08/4Q FY09/1Q FY09/2Q FY09/3Q FY09/4Q
-5%
0%
5%
10%
15%Segment profit
Segment profit ratio
49.844.044.939.7
58.8
95.3
78.7
63.853.356.9
43.5
70.4
0
25
50
75
100
FY07/1Q FY07/2Q FY07/3Q FY07/4Q FY08/1Q FY08/2Q FY08/3Q FY08/4Q FY09/1Q FY09/2Q FY09/3Q FY09/4Q
Industrial Machinery & Others : Quarterly Sales and Operating Income
Quarterly salesQuarterly sales
Quarterly segment profitQuarterly segment profit
07/1Q 07/2Q 07/3Q 07/4Q
122yen 117yen 113yen 104yen
164yen 162yen 165yen 158yen
15.9yen 15.5yen 15.3yen 14.6yen
08/1Q 08/2Q 08/3Q 08/4Q
105yen 107yen 95yen 95yen
165yen 159yen 126yen 123yen
15.2yen 15.7yen 13.9yen 13.9yen
1USD
1EUR
1RMB
Exchange
rates09/1Q 09/2Q 09/3Q 09/4Q
97yen 93yen 90yen 91Yen
133yen 133yen 133yen 124yen
14.2yen 13.6yen 13.2yen 13.3yen
Billions
of yen
Billions
of yen

45
Cautionary Statement
This presentation sheets contain forward-looking statements that reflect management’s views and assumptions in the light of information
currently available with respect to certain future events, including expected financial position, operating results and business strategies. These
statements can be identified by the use of terms such as ”will,” “believes,” “should,” “projects,” “plans,” “expects,” and similar terms and
expressions that identify future events or expectations. Actual results may differ materially from those projected, and the events and results of
such forward-looking assumptions cannot be assured. Any forward-looking statements speak only as of the date of this presentation sheets, and
Komatsu assumes no duty to update such statements.
Factors that may cause actual results to differ materially from those predicted by such forward-looking statements include, but are not limited
to, unanticipated changes in demand for the Company’s principal products, owing to changes in the economic conditions in the Company’s
principal markets; changes in exchange rates or the impact of increased competition; unanticipated costs or delays encountered in achieving the
Company’s objectives with respect to globalized product sourcing and new information technology tools; uncertainties as to the results of the
Company’s research and development efforts and its ability to access and protect certain intellectual property rights; the impact of regulatory
changes and accounting principles and practices; and the introduction, success and timing of business initiatives and strategies.
CORPORATE PLANNING, KOMATSU LTD.
TEL: +81-3-5561-2687
FAX: +81-3-3582-8332
E-MAIL: [email protected]
http://www.komatsu.com/
PC200-8 hybrid hydraulic excavator
operating in China