Business Results Announcement For the Third Quarter of ...
24
1 February 7, 2006 Business Results Announcement For the Third Quarter of Fiscal Year Ending March 2006 Toray Industries, Inc.
Transcript of Business Results Announcement For the Third Quarter of ...

1
February 7, 2006
Business Results AnnouncementFor the Third Quarter of
Fiscal Year Ending March 2006
Toray Industries, Inc.

2
Contents
I. Business Results for the 3Q of Fiscal Year Ending March 2006 (Consolidated Basis)Summary (Profits of nine months from ’05/4 to ’05/12) (P4)Summary (Third Quarter) (P5)Non-operating Income and Expenses (Third Quarter) (P6)Special Credits and Charges (Third Quarter) (P7)
Summary (Financial Position) (P8)Capital Expenditures, Depreciation (P9)
Results by Business Segment (P10-17)Income Variance Factor Analysis (P18)
II. Business Forecast for the Fiscal Year Ending March 2006 (Consolidated Basis) Forecast Summary (P20)Forecast by Business Segment (P21)
III. Business Forecast for the Fiscal Year Ending March 2006 (Non-consolidated Basis)Forecast Summary (P23)
3
I. Business Results for the3Q of Fiscal Year
Ending March 2006(Consolidated Basis)

4
Summary (Profits of nine months from ’05/4 to ’05/12)
Billion ¥
FY Mar/05 FY Mar/06
Operating Income(Apr.-Dec.) 50.2 57.8Year-end Operating IncomeFY Mar/05 is ActualFY Mar/06 is Forecast
81.1 92.0
Percentage of Achievement(Apr.-Dec.) 62.0% 62.9%
Percentage of Achievement ofYear-end Operating Income Forecast
Excluding Chori and Suido Kiko 1st Half Effects
Apr-Dec ofFY Mar/05
Apr-Dec ofFY Mar/06
Apr-Dec ofFY Mar/05
Apr-Dec ofFY Mar/06
Net Sales 911.9 1,026.5 +114.6 (+12.6%) 911.9 923.5 +11.6 (+1.3%)
Gross Profit 191.4 213.5 +22.2 (+11.6%) 191.4 203.3 +12.0 (+6.2%)(Gross Profit to Net Sales) 21.0% 20.8% -0.2 points 21.0% 22.0% +1.0 points
Operating Income 50.2 57.8 +7.6 (+15.2%) 50.2 56.9 +6.7 (+13.3%)(Operating Income to Net Sales) 5.5% 5.6% +0.1 points 5.5% 6.2% +0.7 pointsNon-operating Incomeand Expenses, net ▲ 1.8 ▲ 3.7 -1.9 ( - )
Ordinary Income 48.4 54.2 +5.7 (+11.8%)Special Credits andCharges, net ▲ 6.1 ▲ 4.8 +1.2 ( - )
Income before IncomeTaxes 42.4 49.3 +7.0 (+16.4%)
Net Income 26.8 28.0 +1.2 (+4.6%)
Changes Changes
*Consolidated business results are the sums of Apr–Dec business results in companies whose FY ends on March 31, andJan–Sep business results in companies whose FY ends on December 31.

5
Summary (Third Quarter)
Billion ¥3Q FY Mar/05 3Q FY Mar/06
Net Sales 336.2 347.7 +11.6 (+3.4%)
Gross Profit 64.3 71.5 +7.2 (+11.2%)
(Gross Profit to Net Sales) 19.1% 20.6% +1.4 points
Operating Income 14.6 19.0 +4.4 (+30.0%)
(Operating Income to Net Sales) 4.4% 5.5% +1.1 points
Non-operating Income andExpenses, net ▲ 1.0 ▲ 1.7 - 0.7 ( - )
Ordinary Income 13.6 17.3 +3.7 (+27.1%)Special Credits andCharges, net ▲ 1.9 1.1 +3.0 ( - )
Income before IncomeTaxes 11.7 18.5 +6.7 (+57.5%)
Net Income 7.0 11.2 +4.3 (+61.3%)
Changes
*Consolidated business results are the sums of Oct–Dec business results in companies whose FY ends on March 31, andJul–Sep business results in companies whose FY ends on December 31.
6
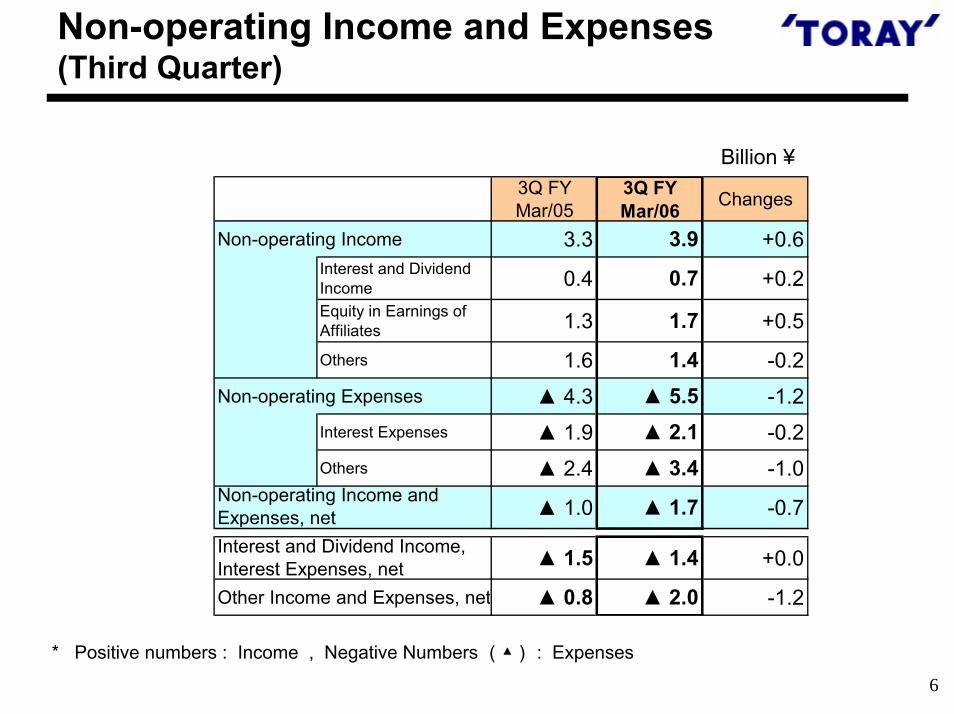
Non-operating Income and Expenses(Third Quarter)
Billion ¥3Q FYMar/05
3Q FYMar/06 Changes
Non-operating Income 3.3 3.9 +0.6Interest and DividendIncome 0.4 0.7 +0.2Equity in Earnings ofAffiliates 1.3 1.7 +0.5
Others 1.6 1.4 -0.2Non-operating Expenses ▲ 4.3 ▲ 5.5 -1.2
Interest Expenses ▲ 1.9 ▲ 2.1 -0.2Others ▲ 2.4 ▲ 3.4 -1.0
▲ 1.0 ▲ 1.7 -0.7
▲ 1.5 ▲ 1.4 +0.0
Other Income and Expenses, net ▲ 0.8 ▲ 2.0 -1.2
Non-operating Income andExpenses, netInterest and Dividend Income,Interest Expenses, net
* Positive numbers : Income , Negative Numbers (▲) : Expenses

7
Special Credits and Charges (Third Quarter)
Billion ¥3Q FYMar/05
3Q FYMar/06 Changes Comments
Special Credits 0.2 2.4 +2.2Gain on Sales of Property,Plant and Equipment 0.0 0.3 +0.3Gain on Sales of Investmentsin Securities 0.1 2.1 +2.0 Selling of insignificant stocks
Special Charges ▲ 2.1 ▲ 1.3 +0.8Loss on Sales or Disposal ofProperty, Plant and Equipment ▲ 0.7 ▲ 0.8 -0.0Restructuring Expenses ▲ 1.3 ▲ 0.5 +0.9 Decrease of losses and expenses of equipment
for fibers & textiles, and plastics & chemicals,t
Others ▲ 0.0 ▲ 0.1 -0.0▲ 1.9 1.1 +3.0Special Credits and Charges, net
* Positive numbers : Income , Negative Numbers (▲) : Expenses

8
Summary (Financial Position)
Billion ¥End ofSep/05
End ofDec/05 Changes Comments End of Mar/05
<FYI>
Total Assets 1,422.6 1,491.1 +68.5 1,402.3Current Assets 623.9 656.2 +32.3 Increase of cash and cash equivalents, etc. 644.4Tangible Fixed Assets 535.8 555.9 +20.1 Increase of capital expenditures, etc. 532.0Intangible Assets 11.2 11.0 -0.2 10.8Investments andOther Assets 251.7 267.9 +16.2 Increase of investments in securities, etc. 215.1
End ofSep/05
End ofDec/05 Changes Comments End of Mar/05
<FYI>
889.2 935.1 +45.9 896.4Current Liabilities 505.6 526.6 +21.0 523.7Other Liabilities 383.5 408.5 +24.9 Increase of long-term debts, etc. 372.7
49.0 50.9 +1.9 53.3
484.4 505.1 +20.7 452.5
459.5 486.1 +26.6 466.8
0.95 0.96 +0.01 1.03D/E ratio
Minority Interests inConsolidated Subsidiaries
Total Stockholders' Equity
Total Liabilities
Interest-bearing Debts

9
Capital Expenditures, Depreciation
Billion ¥<Apr-Dec of FY Mar/06>Apr-Dec ofFY Mar/05
Apr-Dec ofFY Mar/06 Changes Comments FY Mar/06
Forecast
38.4 61.2 +22.8 Toray : 21.3, Japan : 8.2, Overseas : 31.7 95.047.7 46.5 -1.2 Toray : 19.1, Japan : 7.3, Overseas : 20.1 64.0
▲ 0.2 9.2 +9.4
▲ 9.5 23.9
<3Q FY Mar/ 06>3Q FYMar/05
3Q FYMar/06 Changes Comments
15.0 29.4 +14.4 Toray : 11.5, Japan : 4.4, Overseas : 13.6
16.2 16.1 -0.1 Toray : 6.7, Japan : 2.5, Overseas : 6.9
3.0 6.9 +3.9
1.8 20.1
Changes in TangibleFixed Assets
Capital Expenditures
Depreciation - )
Transfer, Disposal, etc.
Capital Expenditures
Depreciation - )
Transfer, Disposal, etc.
Changes in TangibleFixed Assets
<Japan>Toray : Reconstruction of PET film production facilities Operation will start in Sep/06
: PP film production facilities Operation will start in Apr/06 <Overseas>
CFA : Carbon fiber production facilities (US) Operation started in Jan/06PFR : PET film production facilities (Malaysia) Operation will start in Sep/06
Major Capital Expenditures
10
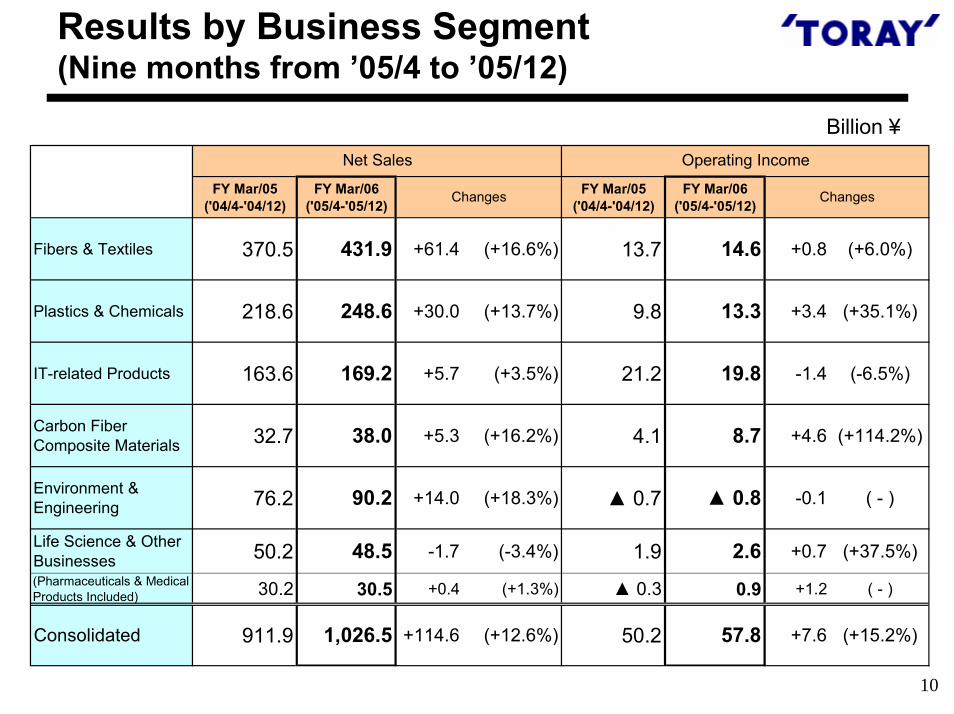
Results by Business Segment(Nine months from ’05/4 to ’05/12)
Billion ¥
FY Mar/05('04/4-'04/12)
FY Mar/06('05/4-'05/12)
FY Mar/05('04/4-'04/12)
FY Mar/06('05/4-'05/12)
Fibers & Textiles 370.5 431.9 +61.4 (+16.6%) 13.7 14.6 +0.8 (+6.0%)
Plastics & Chemicals 218.6 248.6 +30.0 (+13.7%) 9.8 13.3 +3.4 (+35.1%)
IT-related Products 163.6 169.2 +5.7 (+3.5%) 21.2 19.8 -1.4 (-6.5%)
Carbon FiberComposite Materials 32.7 38.0 +5.3 (+16.2%) 4.1 8.7 +4.6 (+114.2%)
Environment &Engineering 76.2 90.2 +14.0 (+18.3%) ▲ 0.7 ▲ 0.8 -0.1 ( - )
Life Science & OtherBusinesses 50.2 48.5 -1.7 (-3.4%) 1.9 2.6 +0.7 (+37.5%)(Pharmaceuticals & MedicalProducts Included) 30.2 30.5 +0.4 (+1.3%) ▲ 0.3 0.9 +1.2 ( - )
Consolidated 911.9 1,026.5 +114.6 (+12.6%) 50.2 57.8 +7.6 (+15.2%)
Net Sales Operating Income
Changes Changes

11
Results by Business Segment(Third Quarter)
Billion ¥
3Q FY Mar/05 3Q FY Mar/06 3Q FY Mar/05 3Q FY Mar/06
Fibers & Textiles 146.3 143.2 -3.1 (-2.1%) 3.7 4.2 +0.5 (+14.4%)
Plastics & Chemicals 83.8 89.8 +6.0 (+7.2%) 3.8 4.6 +0.9 (+23.0%)
IT-related Products 55.1 58.1 +3.0 (+5.4%) 6.2 6.7 +0.5 (+7.9%)
Carbon FiberComposite Materials 11.2 13.6 +2.4 (+21.2%) 1.3 2.8 +1.6 (+124.3%)
Environment &Engineering 24.2 28.3 +4.1 (+16.7%) ▲ 1.0 0.4 +1.4 ( - )
Life Science & OtherBusinesses 15.5 14.8 -0.8 (-4.9%) 0.6 0.6 -0.0 (-2.3%)
(Pharmaceuticals & MedicalProducts Included) 9.9 10.2 +0.3 (+2.6%) 0.0 0.3 +0.2 (+800.0%)
Consolidated 336.2 347.7 +11.6 (+3.4%) 14.6 19.0 +4.4 (+30.0%)
Net Sales Operating Income
Changes Changes
12
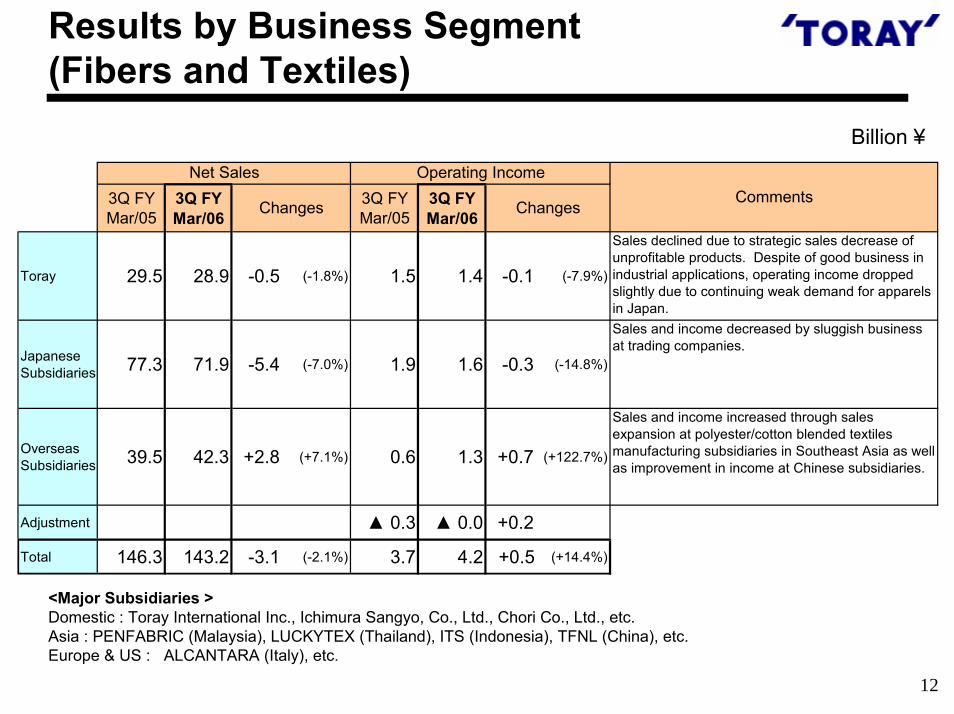
Results by Business Segment (Fibers and Textiles)
Billion ¥
3Q FYMar/05
3Q FYMar/06
3Q FYMar/05
3Q FYMar/06
Toray 29.5 28.9 -0.5 (-1.8%) 1.5 1.4 -0.1 (-7.9%)
Sales declined due to strategic sales decrease ofunprofitable products. Despite of good business inindustrial applications, operating income droppedslightly due to continuing weak demand for apparelsin Japan.
JapaneseSubsidiaries 77.3 71.9 -5.4 (-7.0%) 1.9 1.6 -0.3 (-14.8%)
Sales and income decreased by sluggish businessat trading companies.
OverseasSubsidiaries 39.5 42.3 +2.8 (+7.1%) 0.6 1.3 +0.7 (+122.7%)
Sales and income increased through salesexpansion at polyester/cotton blended textilesmanufacturing subsidiaries in Southeast Asia as wellas improvement in income at Chinese subsidiaries.
Adjustment ▲ 0.3 ▲ 0.0 +0.2
Total 146.3 143.2 -3.1 (-2.1%) 3.7 4.2 +0.5 (+14.4%)
Changes Changes
Net Sales Operating IncomeComments
<Major Subsidiaries >Domestic : Toray International Inc., Ichimura Sangyo, Co., Ltd., Chori Co., Ltd., etc.Asia : PENFABRIC (Malaysia), LUCKYTEX (Thailand), ITS (Indonesia), TFNL (China), etc.Europe & US : ALCANTARA (Italy), etc.

13
Results by Business Segment (Plastics and Chemicals)
Billion ¥
3Q FYMar/05
3Q FYMar/06
3Q FYMar/05
3Q FYMar/06
Toray 20.5 19.3 -1.3 (-6.1%) 0.1 0.6 +0.5 (+451.4%)
Plastics businesses were good mainly forautomobile applications, however, sales droppeddue to increase of inter-company elimination causedby transfer of China-related sales businesses fromexternal trading companies to our subsidiary. Asfilms businesses expanded sales in industrialapplications, Toray's income as total increased.
JapaneseSubsidiaries 35.3 36.6 +1.3 (+3.6%) 1.7 2.3 +0.6 (+34.0%)
Sales and income increased by sales expansion attrading companies and good business of industrialapplications at film processing subsidiary.
OverseasSubsidiaries 27.9 33.9 +6.0 (+21.5%) 1.5 1.7 +0.2 (+12.1%)
Sales and income increased through strong plasticsand films businesses at subsidiaries in Malaysia aswell as incorporating China-related plastics salesbusinesses from external trading companies to ourHong Kong subsidiary.
Adjustment 0.5 0.1 -0.4
Total 83.8 89.8 +6.0 (+7.2%) 3.8 4.6 +0.9 (+23.0%)
Changes Changes
Net Sales Operating IncomeComments
<Major Subsidiaries>Domestic : Toray Advanced Film Co., Ltd., Toray Fine Chemicals Co., Ltd., Soda Aromatic Co., Ltd., Chori Co., Ltd., etc.Overseas : TPA (US), TPM (Malaysia), TPEu (France), TSI (Korea), etc.

14
Results by Business Segment (IT-related Products)
Billion ¥
3Q FYMar/05
3Q FYMar/06
3Q FYMar/05
3Q FYMar/06
Toray 19.4 23.8 +4.5 (+23.2%) 3.5 3.0 -0.5 (-13.4%)
Sales increased through sales expansion of IT-relatedplastics & films, circuit materials, and semiconductingmaterials. Operating income dropped due to increase indevelopment costs for capacity increase preparations offilms, and sales price decrease of color filters byintensive competition in LCD market for mobile phone.
JapaneseSubsidiaries 23.9 20.7 -3.2 (-13.6%) 2.3 2.4 +0.2 (+8.3%)
Sales decreased due to decline of demand for slit coaterswhich was strong in the previous fiscal year. Meanwhile,sales and income increased at a film processingsubsidiary by sales expansion of films for FPDs andcircuit materials. As total, sales decreased but incomeincreased.
OverseasSubsidiaries 11.9 13.6 +1.7 (+14.6%) 0.4 1.2 +0.8 (+213.6%)
Sales and income increased through sales expansion offilms for FPDs and good circuit materials-relatedbusinesses at Korean subsidiaries.
Adjustment 0.1 ▲ 0.0 -0.1
Total 55.1 58.1 +3.0 (+5.4%) 6.2 6.7 +0.5 (+7.9%)
Net Sales Operating Income
Changes ChangesComments
<Major Subsidiaries>Domestic : Toray Engineering Co., Ltd., Toray Advanced Film Co., Ltd., etc.Overseas : TPA (US), TPEu (France), TSI (Korea), etc.
15
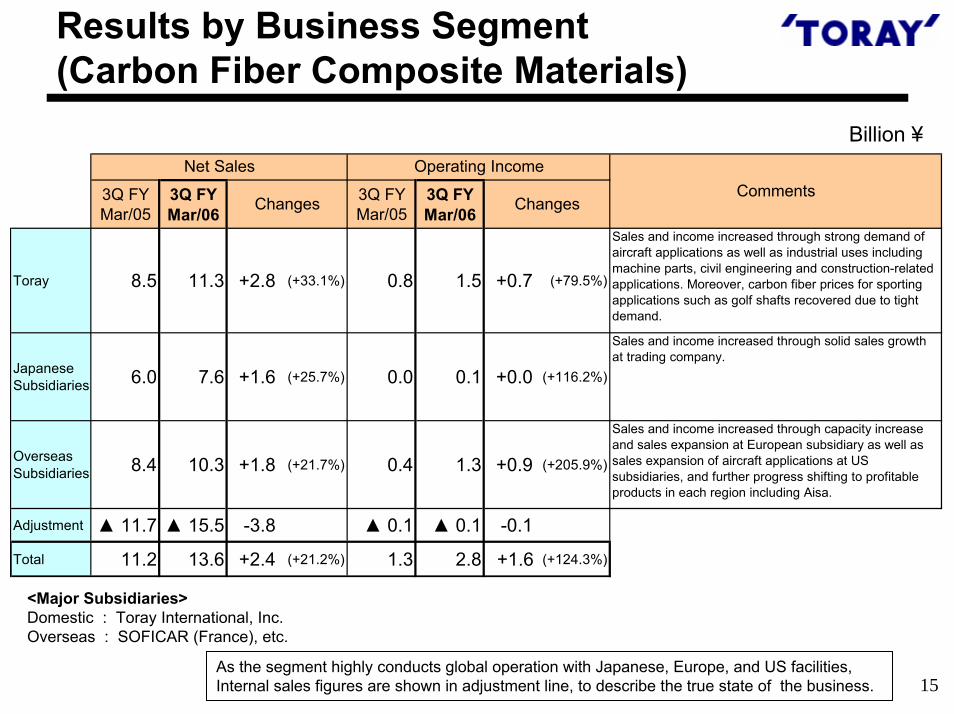
Results by Business Segment (Carbon Fiber Composite Materials)
Billion ¥
3Q FYMar/05
3Q FYMar/06
3Q FYMar/05
3Q FYMar/06
Toray 8.5 11.3 +2.8 (+33.1%) 0.8 1.5 +0.7 (+79.5%)
Sales and income increased through strong demand ofaircraft applications as well as industrial uses includingmachine parts, civil engineering and construction-relatedapplications. Moreover, carbon fiber prices for sportingapplications such as golf shafts recovered due to tightdemand.
JapaneseSubsidiaries 6.0 7.6 +1.6 (+25.7%) 0.0 0.1 +0.0 (+116.2%)
Sales and income increased through solid sales growthat trading company.
OverseasSubsidiaries 8.4 10.3 +1.8 (+21.7%) 0.4 1.3 +0.9 (+205.9%)
Sales and income increased through capacity increaseand sales expansion at European subsidiary as well assales expansion of aircraft applications at USsubsidiaries, and further progress shifting to profitableproducts in each region including Aisa.
Adjustment ▲ 11.7 ▲ 15.5 -3.8 ▲ 0.1 ▲ 0.1 -0.1
Total 11.2 13.6 +2.4 (+21.2%) 1.3 2.8 +1.6 (+124.3%)
CommentsNet Sales Operating Income
Changes Changes
<Major Subsidiaries>Domestic : Toray International, Inc.Overseas : SOFICAR (France), etc.
As the segment highly conducts global operation with Japanese, Europe, and US facilities, Internal sales figures are shown in adjustment line, to describe the true state of the business.
16
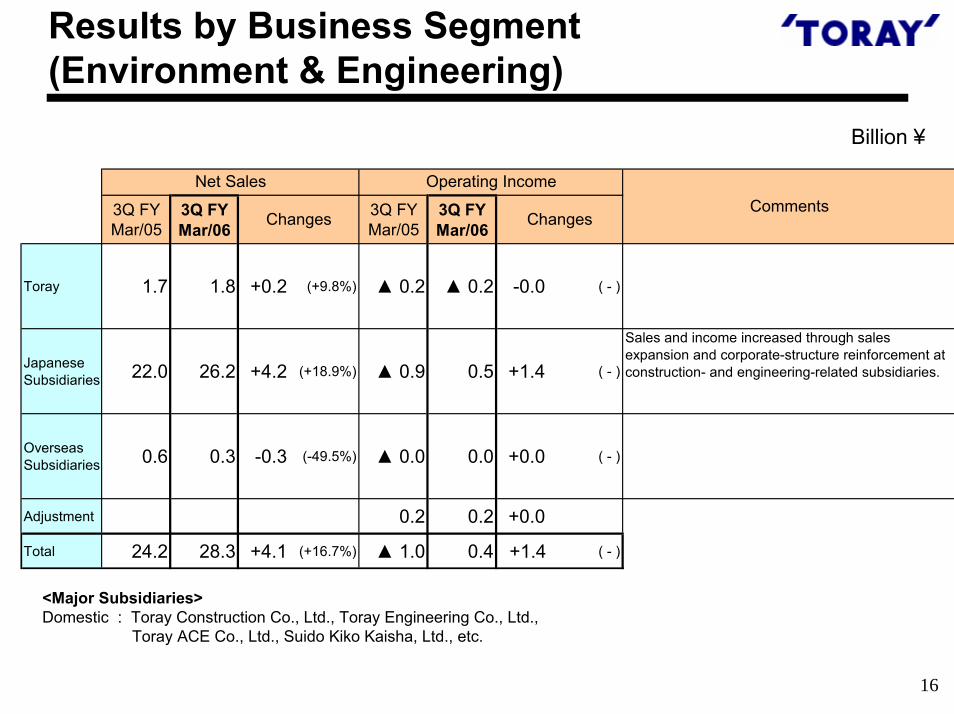
Results by Business Segment(Environment & Engineering)
Billion ¥
3Q FYMar/05
3Q FYMar/06
3Q FYMar/05
3Q FYMar/06
Toray 1.7 1.8 +0.2 (+9.8%) ▲ 0.2 ▲ 0.2 -0.0 ( - )
JapaneseSubsidiaries 22.0 26.2 +4.2 (+18.9%) ▲ 0.9 0.5 +1.4 ( - )
Sales and income increased through salesexpansion and corporate-structure reinforcement atconstruction- and engineering-related subsidiaries.
OverseasSubsidiaries 0.6 0.3 -0.3 (-49.5%) ▲ 0.0 0.0 +0.0 ( - )
Adjustment 0.2 0.2 +0.0
Total 24.2 28.3 +4.1 (+16.7%) ▲ 1.0 0.4 +1.4 ( - )
Changes Changes
Net Sales Operating IncomeComments
<Major Subsidiaries>Domestic : Toray Construction Co., Ltd., Toray Engineering Co., Ltd.,
Toray ACE Co., Ltd., Suido Kiko Kaisha, Ltd., etc.
17
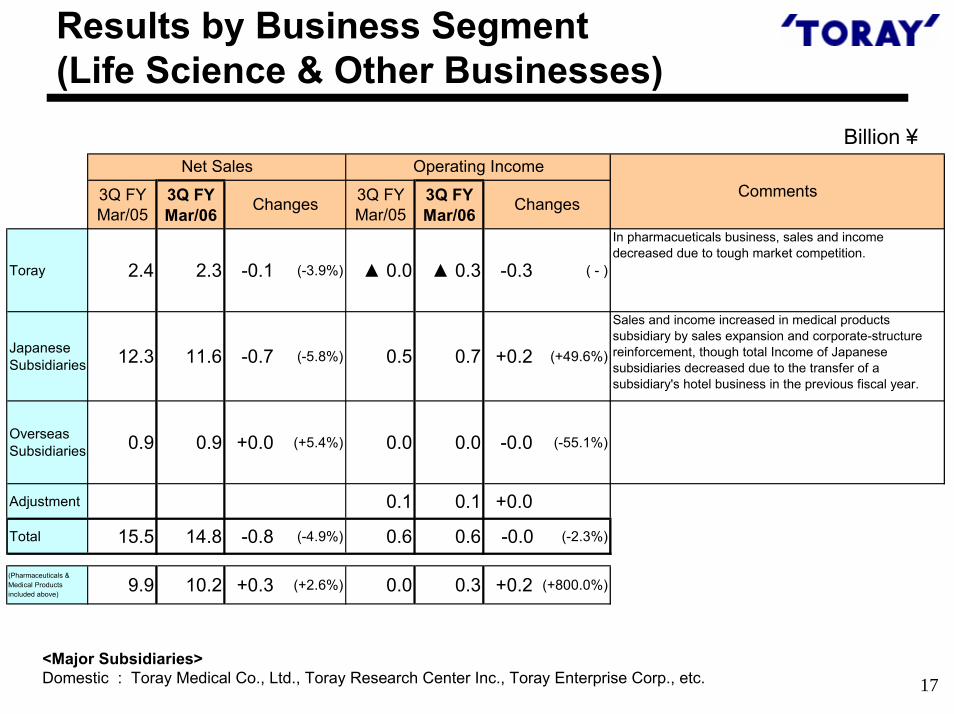
Results by Business Segment(Life Science & Other Businesses)
Billion ¥
3Q FYMar/05
3Q FYMar/06
3Q FYMar/05
3Q FYMar/06
Toray 2.4 2.3 -0.1 (-3.9%) ▲ 0.0 ▲ 0.3 -0.3 ( - )
In pharmacueticals business, sales and incomedecreased due to tough market competition.
JapaneseSubsidiaries 12.3 11.6 -0.7 (-5.8%) 0.5 0.7 +0.2 (+49.6%)
Sales and income increased in medical productssubsidiary by sales expansion and corporate-structurereinforcement, though total Income of Japanesesubsidiaries decreased due to the transfer of asubsidiary's hotel business in the previous fiscal year.
OverseasSubsidiaries 0.9 0.9 +0.0 (+5.4%) 0.0 0.0 -0.0 (-55.1%)
Adjustment 0.1 0.1 +0.0
Total 15.5 14.8 -0.8 (-4.9%) 0.6 0.6 -0.0 (-2.3%)
(Pharmaceuticals &Medical Productsincluded above)
9.9 10.2 +0.3 (+2.6%) 0.0 0.3 +0.2 (+800.0%)
CommentsNet Sales Operating Income
Changes Changes
<Major Subsidiaries>Domestic : Toray Medical Co., Ltd., Toray Research Center Inc., Toray Enterprise Corp., etc.
180
20.0
40.0
0
20.0
40.0
60.0
80.0
100.0
120.0
’04/4-12 ’05/4-12
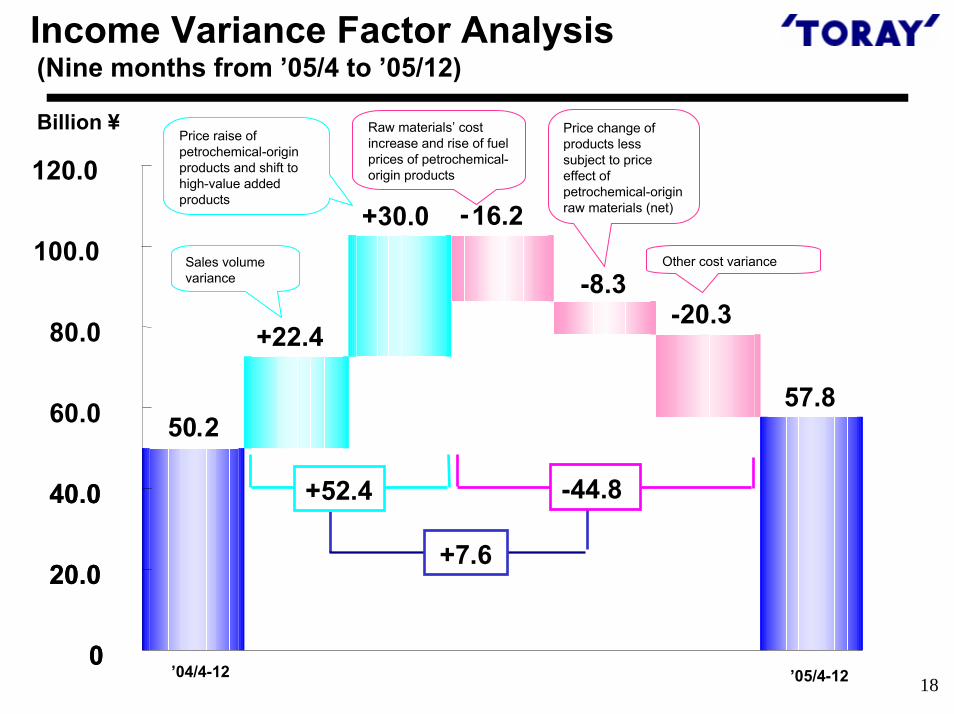
Income Variance Factor Analysis(Nine months from ’05/4 to ’05/12)
Billion ¥
+22.4
+30.0 -16.2
-8.3
50.2
-20.3
Other cost variance
57.8
Raw materials’ cost increase and rise of fuel prices of petrochemical-origin products
Price raise of petrochemical-origin products and shift to high-value added products
Price change of products less subject to price effect of petrochemical-origin raw materials (net)
Sales volume variance
+52.4 -44.8
+7.6

19
II. Business Forecast for the Fiscal YearEnding March 2006
(Consolidated Basis)
20
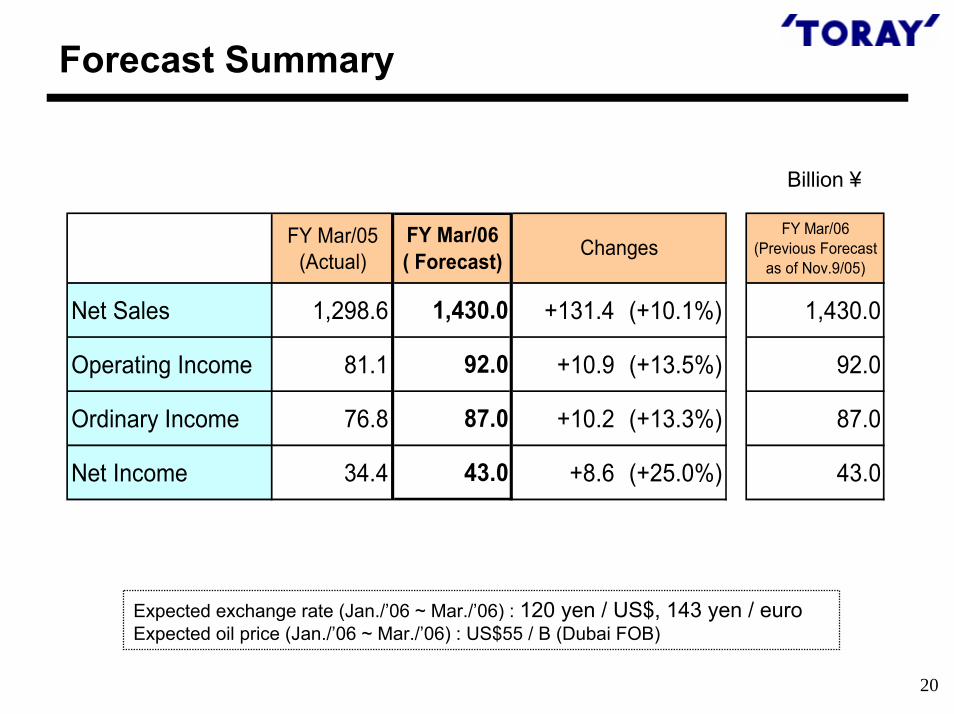
Forecast Summary
Billion ¥
FY Mar/05(Actual)
FY Mar/06( Forecast)
FY Mar/06(Previous Forecast
as of Nov.9/05)
Net Sales 1,298.6 1,430.0 +131.4 (+10.1%) 1,430.0
Operating Income 81.1 92.0 +10.9 (+13.5%) 92.0
Ordinary Income 76.8 87.0 +10.2 (+13.3%) 87.0
Net Income 34.4 43.0 +8.6 (+25.0%) 43.0
Changes
Expected exchange rate (Jan./’06 ~ Mar./’06) : 120 yen / US$, 143 yen / euroExpected oil price (Jan./’06 ~ Mar./’06) : US$55 / B (Dubai FOB)

21
Forecast by Business Segment
Billion ¥
FY Mar/05(Actual)
FY Mar/06( Forecast)
FY Mar/05(Actual)
FY Mar/06(Forecast)
Fibers & Textiles 513.4 580.0 +66.6 (+13.0%) 20.9 21.0 +0.1 (+0.6%)Sales and income are expected to increase byraising price and promoting value-added productswhile effected by hovering raw materials and fuelcosts.
Plastics &Chemicals 300.4 330.0 +29.6 (+9.9%) 15.7 17.5 +1.8 (+11.8%)
Sales and income are expected to increase bypromoting plastics for automotives and films forpackaging and industrials, as well as raising price tooffset high costs of raw materials and fuels.
IT-related Products 219.1 240.0 +20.9 (+9.5%) 28.3 31.5 +3.2 (+11.4%)With IT-related product market recovering, salesand income are expected to increase throughgrowing sales of FPD related films, processingfilms, and circuit materials.
Carbon FiberComposite Materials 44.7 50.0 +5.3 (+11.9%) 5.6 11.0 +5.4 (+96.6%)
Sales and income are expected to increase due tostrong demand for all applications such as aircrafts,industrials, and sports as well as the contribution ofcapacity increase at SOFICAR in France.
Environment &Engineering 148.7 160.0 +11.3 (+7.6%) 4.3 5.0 +0.7 (+16.4%)
Sales are expected to increase mainly due toconsolidation of Suido Kiko. Income is expected toincrease mainly due to good business conditions ofconstruction-related and engineering-relatedsubsidiaries.
Life Science &Other Businesses 72.3 70.0 -2.3 (-3.2%) 6.5 6.0 -0.5 (-7.2%)
(Pharmaceuticals & MedicalProducts Included) 44.4 45.0 +0.6 (+1.5%) 2.9 3.0 +0.1 (+5.2%)
Consolidated 1,298.6 1,430.0 +131.4 (+10.1%) 81.1 92.0 +10.9 (+13.5%)
Income is estimated to fall due to the transfer of asubsidiary's hotel business in the previous fiscalyear.
CommentsNet Sales Operating Income
Changes Changes

22
III. Business Forecast for the Fiscal Year Ending March 2006
(Non-consolidated Basis)
23
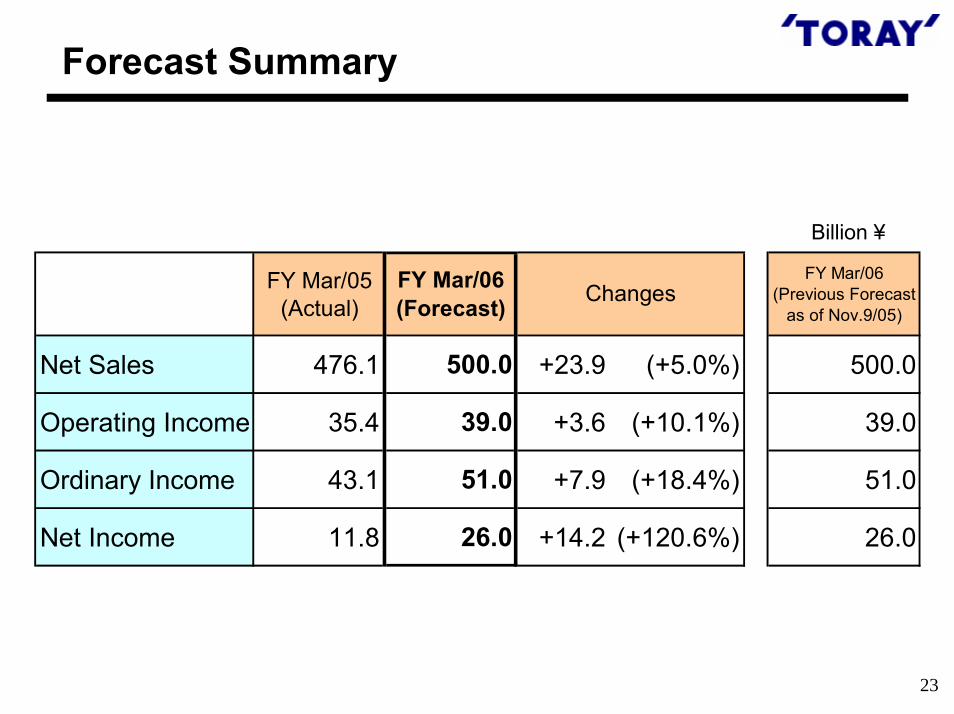
Forecast Summary
Billion ¥
FY Mar/05(Actual)
FY Mar/06(Forecast)
FY Mar/06(Previous Forecast
as of Nov.9/05)
Net Sales 476.1 500.0 +23.9 (+5.0%) 500.0
Operating Income 35.4 39.0 +3.6 (+10.1%) 39.0
Ordinary Income 43.1 51.0 +7.9 (+18.4%) 51.0
Net Income 11.8 26.0 +14.2 (+120.6%) 26.0
Changes

24
Descriptions of forecasted business results, estimates, expectations, and business plans for the Fiscal Year ending March 2006 contained in this material are based on predictive forecasts of the future business environment made at the present time.
The material in this presentation is not a guarantee of the Company’s future business performance.