BUSINESS RESEARCH METHODS - University of...
98
BUSINESS RESEARCH METHODS CORE COURSE V SEMESTER B Com/BBA (2011 Admission) UNIVERSITY OF CALICUT SCHOOL OF DISTANCE EDUCATION Calicut university P.O, Malappuram Kerala, India 673 635. 313
Transcript of BUSINESS RESEARCH METHODS - University of...
BUSINESS RESEARCH METHODSCORE COURSE
V SEMESTER
B Com/BBA
(2011 Admission)
UNIVERSITY OF CALICUTSCHOOL OF DISTANCE EDUCATION
Calicut university P.O, Malappuram Kerala, India 673 635.
313
School of Distance Education
Business Research Methods 2
UNIVERSITY OF CALICUT
SCHOOL OF DISTANCE EDUCATIONSTUDY MATERIAL
Core Course
V Semester
B Com/BBA
BUSINESS RESEARCH METHODS
Prepared by : 1. Smt. U. Sreevidya,Assistant Professor,Govt. College Malappuram,(Module I, II, & III, ).
&2. Smt. Sunitha. K,
Assistant Professor,Govt. College Malappuram,(Module IV &V).
Scrutinized by: Dr. K. Venugopalan,Associate Professor,Department of Commerce,Govt. College, Madappally
Layout: Computer Section, SDE
©Reserved
School of Distance Education
Business Research Methods 3
CONTENTS PAGE
CHAPTER -1 BUSINESS RESEARCH 5
CHAPTER -2 PLANNING OF RESEARCH ANDRESEARCH PROCESS
13
CHAPTER -3 RESEARCH DESIGN 20
CHAPTER -4 MEASUREMENT AND SCALING 42
CHAPTER -5 DATA PROCESSIING 59
CHAPTER -6 RESEARCH REPORT 85

School of Distance Education
Business Research Methods 4
School of Distance Education
Business Research Methods 5
CHAPTER -1
BUSINESS RESEARCH
The word research is composed of two syllables, re and search. The dictionary defines theformer as a prefix meaning again, anew or over again and the latter as a verb meaning to examineclosely and carefully, to test and try, or to probe. Together they form a noun describing a careful,systematic, patient study and investigation in some field of knowledge, undertaken to establish factsor principles.
According to Robert Ross, “research is essentially an investigation, a recording and ananalysis of evidence for the purpose of gaining knowledge.” It can generally be defined as asystematic method of finding solutions to problems.
A research need not lead to ideal solution but it may give rise to new problems which mayrequire further research. In other words research is not an end to a problem since every researchgives birth to a new question. It is carried on both for discovering new facts and verification of oldones.
Features of Research
It means the discovery of new knowledge
Is essentially an investigation
Is related with the solution of a problem
It is based on observation or experimental evidences.
It demands accurate observation or experimentation.
In research, the researchers try to find out answers for unsolved questions
It should be carefully recorded and reported
Business Research
Business research refers to systematic collection and analysis of data with the purpose offinding answers to problems facing management. It can be carried out with the objective to explore,to describe or to diagnose a phenomenon. It involves establishing objectives and gathering relevantinformation to obtain the answer to a business issue and it can be conducted to answer a business-related question, such as: What is the target market of my product? Business research can also beused to solve a business-related problem, such as determining how to decrease the amount ofexcess inventory on hand.
School of Distance Education
Business Research Methods 6
When deciding whether business research is to be conducted or not, the firm keeps in mindfactors like the availability of data, time constraints and the value of the research information to thecompany. Adequate planning and information-gathering are essential to derive results for business.
Social Research
Social research refers to research conducted by social scientists. It is the scientificinvestigation conducted in the field of social sciences and also in the behavioral sciences. Socialresearch methods can generally vary along a quantitative/qualitative dimension. While variousmethods may sometimes be classified as quantitative or qualitative, most methods contain elementsof both. Social scientists employ a range of methods in order to analyse a vast breadth of socialphenomena; from census survey data derived from millions of individuals, to the in-depth analysisof a single agents' social experiences; from monitoring what is happening on contemporary streets,to the investigation of ancient historical documents.
The social science research is a systematic method of exploring, analyzing andconceptualizing social life in order to expand, correct or verify knowledge whether that knowledgeaids in the construction of theory or in the practice of an art.
Educational Research
Educational Research is that activity which is directed towards development of a science ofbehaviour in educational situations. The ultimate aim of this research is to provide knowledge thatwill permit the educator to achieve his goals by most effective methods. Educational research refersto a variety of methods, in which individuals evaluate different aspects of education including:“student learning, teaching methods, teacher training, and classroom dynamics”.
Educational researchers have come to the consensus that, educational research must beconducted in a rigorous and systematic way although what this implies is often debated. There are avariety of disciplines which are each present to some degree in educational research. These includepsychology, sociology, anthropology, and philosophy. The overlap in disciplines creates a broadrange from which methodology can be drawn. The findings of educational research also need to beinterpreted within the context in which they were discovered as they may not be applicable in everytime or place.
Need For Research (Importance of Research)
The main importance of research is to produce knowledge that can be applied outside aresearch setting. Research also forms the foundation of program development and policieseverywhere around the universe. It also solves particular existing problems of concern. Research isimportant because we are able to learn more about things, people, and events. In doing research, weare able to make smart decisions.
Marketing research is important because it allows consumers and producers to become morefamiliar with the products, goods, and services around them. Research is important to societybecause it allows us to discover more and more that might make are lives easier, more comfortable,
School of Distance Education
Business Research Methods 7
and safer. It presents more information for investigation. This allows for improvements based ongreater information and study. It is very important. Research encourages interdisciplinaryapproaches to find solution to problems and to make new discoveries. Research is a basicingredient for development and therefore serves as a means for rapid economic development.
The main importance or uses may be listed as under:
It provides basis for government policies
Helps in solving various operational and planning problems of business and industry
Research helps in problem solving
Is useful to students, professionals, philosophers, literary men, analysts and intellectuals.
Purpose / Aims / Objectives of Research
1. To find out the truth which is hidden and which has not been discovered so far.
2. Aims at advancing systematic knowledge and formulating basic theories about the forcesinfluencing the relation between groups as well as those acting on personality developmentand is adjustment with individuals.
3. Try to improve tools of analysis or to test these against the complex human behaviour andinstitutions.
4. To understand social life and thereby to gain a greater measure of control over socialbehaviour.
5. To provide an educational program in the accumulated knowledge of group dynamics, inskills of research, in techniques of training leaders and in social action.
Qualities / Characteristics of A Good Research
A good research must be systematic
A good research must be logical
A good research must be empirical
A good research must be verifiable
As far as possible common concepts must be used
Procedure followed in research must be sufficiently described
Research procedure should be so described that objective of research can be achieved.
Limitations of Research
Conclusions in research are based upon data collected. Therefore when the data collectedare not valid or adequate, the conclusion will not be conclusive or appropriate.
School of Distance Education
Business Research Methods 8
Research results in theory
Activities in a society are influenced by various internal and external factors
Small organizations cannot afford to have research on various issues
Many people in society depend on customs, traditions, routines and practices for takingdecision; instead of going for research.Research is usually based on sample studies. But in many cases samples are not truerepresentatives. Therefore the research reports based on these samples may not be accurate.
Theory and Concept
Theory is defined as a set of systematically interrelated concepts, definitions and propositions thatare advanced to explain and predict a phenomenon. It may also specify causal relationship amongvariables. A theory is an integrated body of definitions, assumptions, and general propositionscovering a given subject matter from which a comprehensive and consistent set of specific andtestable principles can be deducted logically. This theory provides a basis for studying consumerbehaviour and formulating appropriate marketing strategies.
Requisites (Criteria) of Theory
Theory starts out as ideas. The criteria to be met by the set of ideas are:
They must be logically consistent.
They must be interrelated.
The statements must be exhaustive.
The propositions should be mutually exclusive.
They must be capable of being tested through research.
Role of Theory in Research
1. Theory narrows the range of facts to be studied
2. Theory provides a conceptual framework for a study
3. Summarizes concisely what is already known about the object of study.
4. Theory states a general uniformity beyond the immediate observations.
5. Theoretical generalization can be used to predict further facts.
General Principles Regarding the Use of Theory in Research
1. Knowledge of the existing theory in one’s area of research is essential for conductingresearch.
2. Concepts are crucial components of theory and so their clear definitions are essential to thedesigning of the study.
School of Distance Education
Business Research Methods 9
3. One should view theory as hypothetical proposition and not as conclusive fact.
4. One should pay attention to all odd and puzzling unexpected observations in one’s researchand enquire into them. They may be a source for new theoretical approaches.
Methods of Formation of Theory
Deduction: It is one of the important methods employed in theory building. It is a process ofdrawing generalizations, through a process of reasoning on the basis of certain assumptions whichare either self evident or based on observation. By deduction, is meant reasoning or inference fromthe general to particular or from the universal to the individual.Eg., All men are mortal (Major Premise)
A is a man (Minor premise)
Therefore A is mortal (Conclusion)
The conclusion follows from the two premises logically. Therefore it is valid. The deductionis the logical conclusion obtained by deducting it from the statements, called premise of theargument. The argument is so constructed that if the premises are true, conclusion must also betrue. The logical deduction derives only conclusions from given premises and it cannot affirm thetruth of given statements. It serves in connecting different truths and thus logical derivation is nota means to find ultimate truth.
Induction: It is the process of reasoning from a part to the whole, from particular to general orfrom the individual to the universal. It gives rise to empirical generalizations. It is a passage fromobserved to unobserved. It involves two processes namely observation and generalization.Induction may be regarded as a method by means of which material truth of the premises isestablished. Generating ideas from empirical observation is the process of induction. As a matterof fact, concepts can be generated from experience which justifies the description of particularsituations towards theory- building. It is generally observed that experience is regarded as a sum ofindividual observations held together by the loose tie of association and constantly extended by theidea of inductive inferences.
It is generally stated that knowledge is based on the foundations of particular facts. Inempirical sciences, we start from the consideration of a single case, go on to prove many cases.Consider the following illustration.
“I saw a raven in black colour. Other revens seen by me were also black in colour”.
“All ravens are therefore black”.
Inductive method is classified into two types- enumerative induction and analytical induction.
Retroduction: It is a technique of successive approximation by which, the concepts andassumptions of theories are brought into closer alignment with relevant evidence. At the same timeit maintains the logical consistency required of deductive systems.
School of Distance Education
Business Research Methods 10
The purpose of theory is to systematize the data of every experience. The three methods-deduction induction and retroduction based on the relationships among the observed data, conceptsand theoretical assumptions are adopted for generating theory.
Concept
A concept symbolizes a phenomenon and helps to communicate its finding. For instancelabour is a concept. Concepts are logical constructs created from sense impression or complexexperiences. It symbolizes the empirical relationship and phenomena which are indicated by facts.Thus, concepts and facts are not the same. A fact is a logical construct of concepts. The process ofconceptualization arises out of abstraction and generalization of sense impression.
Types of concepts
On the basis of origin, concepts may be classified into two categories:
1) Postulational Concepts: It has meaning only with reference to some deductively postulatedtheory. Its meaning will be different when it will be used in some other context or theories.For instance, the concept ‘function’ has one meaning in Economics and another meaning inPhysics.
2) Intuitive Concepts: It has a particular meaning. The meaning is never changed by thepeople who use it. This type of concept denotes something, which is immediatelyunderstood. For example, ‘black’ as a colour, its meaning is abstracted from a wider andempirical context.
Intuitive concepts are divided into two forms (a) those by sensation and (b) those byintrospection. Similarly, Postulational concepts are divided into (a)those by imagination and(b)those by intellection. However, for the matter of social science research, such classification doesnot convey any special significance.
Requisites of a concept
In every field of study, concepts are used to convey special meaning.
Concepts should be precise, comprehensive and clear. There should be no misunderstandingabout them.
Concepts must not have multiple meaning. It is possible that different terms may refer to thesame phenomenon; and there may be danger of overlapping of meaning.
Concepts should be well understood. A concept may have a very complex series ofreferences. Ultimately there may be an empirical reference. If one empirical reference is notimmediate then the concepts will less well be understood.
How to use concepts
In research, the proper concept has to be carefully chosen and its usage should be explainedthoroughly. The meaning of a concept does not remain fixed all the time. The meaning of theconcept is modified with the accumulation of knowledge. In course of time, some concepts maybecome outmoded and irrelevant, and therefore, they are to be discarded.
School of Distance Education
Business Research Methods 11
Theory is a statement of the meaningful relation between concepts. Therefore the first stagein the development of a theory is concept formation. A scientific theory is a statement of a specifictype of invariance in the conceptual representation of a phenomenon. Therefore, the choice wemake in the representation of phenomenon is a critical step in the development of scientific theory.
Theory implies an explanatory relationship. The development and validity of a theory isdependent on the conceptual apparatus used. Concepts are the medium of scientific explanations.Conceptual definition and theory formulation are two major requirements of unified process ofscientific explanation. Formulation of concepts is therefore a major step of one unified process ofcomplex scientific inquiry towards theory building.
Types of Research
Research may be broadly classified as (1) Fundamental and Applied Research (2)Descriptive and Analytical Research or (3) Quantitative and Qualitative Research or (4) Conceptualand Empirical Research
Fundamental (or Basic) and Applied Research
Fundamental research is mainly concerned with generalization with the formulation of atheory. It is a research concerning principles or laws or rules. It aims at the achievement ofknowledge and truth. Research studies concentrating on some natural phenomenon or relating topure mathematics are examples of fundamental research. It aims at some theoretical conclusions. Itmay verify the old theory or establish a new one. It tries to explain the cause and effect relationshipin social phenomena. It is essentially positive and not normative. That is, it explains the phenomenaas they are and not as they should be.
Applied research is concerned with the solution of particular problems. It aims at finding asolution for an immediate problem facing a society or an industrial organization. It is empirical andpractical. It is concerned with applied aspects of life. Research to identify social, economic orpolitical trends that may affect a particular institution or the marketing research are examples ofapplied research.
Descriptive Research and Analytical Research
Descriptive research includes survey and fact finding enquiries of different kinds. Itdescribes the state of affairs as it exists at present. The researcher has no control over the variables.He can only report what has happened or what is happening.
In Analytical research one has to use facts or information already available and analysethese to make a critical evaluation of the material.
School of Distance Education
Business Research Methods 12
Quantitative Research and Qualitative Research
Quantitative research is applicable to phenomena that are measurable so that they can beexpressed in terms of quantity.
Qualitative research is concerned with qualitative phenomenon. Research designed to findout how people feel or what they think about a particular subject is a qualitative research.Qualitative research is especially important in the behavioural sciences where the aim is to discoverunderlying motives of human behaviour.
Conceptual Research and Empirical Research
Conceptual research is that related to some abstract ideas or theory. It is generally used byphilosophers and thinkers to develop new concepts or to interpret existing ones.
Empirical research relies on experience or observation alone. It is data based researchcoming up with conclusions capable of being verified by observation or experiment. It can beexperiment research. In empirical research, the researcher has to first set up a hypothesis or guessas to the probable results. He then works out to get enough facts to prove or disprove hishypothesis.
Empirical studies have a great potential for they lead to inductions and deductions. Thusresearch enables one to develop theories and principles and to arrive at generalizations. As researchis based on observations and empirical evidences it improves knowledge and understanding as wellas decision making skill and ability.
School of Distance Education
Business Research Methods 13
CHAPTER-2
PLANNING OF RESEARCH AND RESEARCH PROCESS
Planning of research means deciding the question to be studied, setting the objectives of thestudy and determining the means of achieving those objectives. Planning research refers todetermining, in advance, various steps to be followed in a research.
1. Identifying, Evaluating and Formulating the Research Problems-:
After creating interest in a research work, a researcher has to think about formulating theproblem related to his research work. Choosing a correct problem for study is the mostimportant step in the entire research process. After selecting the problem, the researcher hasto formulate the problem.
2. Extensive Literature Survey:-
Before formulating the research it is desirable that researcher examines all availableliterature, both conceptual and empirical. The conceptual literature is one which deals withconcepts and theories. Empirical literature is that which contains studies made earlier and soit consists of many facts and figures observed in the earlier studies.
3. Writing a Primary Synopsis:-
After formulating the problems a brief summary of it should be written down. A researchworker has to write a synopsis of the topic selected for research work mentioning thesummary of what is going to be done under his research.
4. Indentifying and Labeling Variables: -
In any research the problem under study deals with relation between variables. Thevariables whose change has affected the other variable, is called independent variable.Therefore there is a cause and effect relation between the variables. The research problemmust be formulated in such a manner that it highlights the nature, extent and implications ofrelation existing between the variables. It is only through this process of establishing theeffective relation between variables that meaningful conclusions are derived from the study.
5. Setting Up Of Hypothesis: -
Specification of working hypothesis is a basic step in the research process. A hypothesis is atentative conclusion logically drawn. The research work is conducted to test the truth of thishypothesis.
School of Distance Education
Business Research Methods 14
6. Preparing the Research Design:-
A research design is a plan that specifies the sources and types of information relevant tothe research problem. It is a strategy which approach will be used for gathering andanalyzing the data. It includes the time and cost budgets since most studies are done underthese two constraints. A research design provides a rational approach to research enablingone to decide in advance what to do, how to do, in investigating the subjects.
7. Determining the Sample Design:-
A sample design is a definite plan determined before any data are actually collected forobtaining a sample from a given universe.Sample design refers to the technique or theprocedure which the researcher would adopt in selecting some sampling units from theuniverse for drawing inferences about the universe. If the proper procedure is followed toselect the sample, definitely the sample will give all dependable information.
8. Collecting of Data: -
There are several ways of collecting the appropriate data. Some of the methods of collectingprimary data are (1) Observation method. (2) Direct personal interview method. (3)Telephone interview method. (4) Questionnaire method. (5) Schedule method. A choice ofone of these methods.
9. Execution of the Project: -
The researcher has to see that the project is executed in a systematic manner and in time. Heshould make necessary preparations for successful conduct of the project.
10. Processing, Analysis and Interpretation of Data by Statistical Methods: - Theprocessing of data consists of classification, tabulation and coding. By classification andtabulation the unwieldy data can be condense into few manageable and purposeful groupsand tables so that further analysis becomes simple. Coding converts the data into symbolsand small figures so that the data can be dealt with in an easy manner. Editing improves thequality of the data since it is at this stage that data which is irrelevant can be dropped.Analysis and interpretation of data results in observation, analysis, conclusion, inductionand deduction. For this various statistical measures are computed.
11. Testing of Hypothesis: - Depending upon the nature of data and conclusions to bearrived one or two of these tests can be applied. Testing of hypothesis will results in eitheraccepting or rejecting the hypothesis. Testing of hypothesis may prove or disprove a theoryand a theory facilitates formulating of a further hypothesis. Testing of hypothesis will resultin contribution to existing theory or the generation of a new theory.
School of Distance Education
Business Research Methods 15
12. Preparation of the Report or Thesis:-
A report is a detailed description of what has been done and how it has been done withrespect to a particular area or topic. The report should contain the preliminary section, themain body and the end matter. The preliminary section contains only titles, data,acknowledgement foreword and table of contents. The important section of a report is itsmain body. It carries introduction, methodology, statements of findings, conclusions andrecommendations. The end matter includes appendix, literature selected and bibliography.The appendix includes letters, questions or other tools used. Bibliography is the list ofbooks, journals. Reports, bulletins etc. used for reference.
Selection and Formulation of Research Problems
Research Problem
Problem means a question or an issue to be examined. A research problem refers to some kind ofproblem which a researcher experiences or observes in the context of either a theoretical orpractical situation. The researcher has to find out suitable course of action by which the objectivecan be attained optimally in the context of given environment. Thus, selection of research problemhas high value to the society and the researcher must be able to identify those problems that need anurgent solution.
Requisites or Characteristics of a Good Research Problem
clear and unambiguous
logical and systematic
empirical
relation between variables
verifiable
interesting
Various Aspects of a Research Problem
For an effective formulation of the problem following aspects of the problem are to be consideredby the researcher.
• Definition of the problem: - Before one takes up a problem for the study one needs to define itproperly. The issues for inquiry are to be identified clearly and specified in details. If anyexisting theoretical framework is tested, the particular theorem or theories must be identified.Similarly if there are any assumptions made and terms used the meaning of them must be madeclear. As far as possible the statement of the problem should not give any scope for ambiguity.
• Scope of the problem: - The research scholar has to fix up the four walls of the study. Theresearcher must identify which of the aspects he is trying to prove. Taking the example of
School of Distance Education
Business Research Methods 16
sickness he should specify. (1) Whether his study extends to all types of small scale industries,or limited to only few of them. (2) Whether the study is limited to find cause for sickness oralso to prescribe certain prescriptions etc.
• Justification of the problem: - Many a time research studies are put to the test of justificationor relevance. In the scientific curiosity of the problems, th problem that needs urgent solutionmust be given preference.
• Feasibility of the problem: - Although a problem needs urgent attention and is justifiable inseveral respects, one has to consider the feasibility of the same. Feasibility means the possibilityof conducting the study successfully. The elements of time, data, Cost is to be taken intoconsideration before a topic is selected for study.
• Originality of the problem: - In social sciences, particularly in commerce and management,there is no systematic compilation of the works already done or on hand. Two people may bedoing a work more or less on similar topic. In such situations it is not advisable to continuework in the same manner. What is advisable is that, each of them should try to focus ondifferent aspects, so that they could enrich the field of knowledge with their studies. Anotherproblem faced by a researcher is that a problem which he intends to do is already worked out.Should he repeat the same or not? This depends upon the situation or circumstances whichengage his attention.
Defining and Formulating a Research Problem
A research is to be defined along with the bounds in which it is to be studied. Therefore defining aproblem involves the task of laying down boundaries within which a researcher shall study theproblem with a predetermined objective in view. Defining a research problem and clearly is acrucial part of a research study and must in no case be accomplished hurriedly.
Steps for Defining and Formulating a Research Problem
(1) Stating the problem in a general way: - The researcher should state the problem in generalterms, keeping in view either some practical concern or some scientific or intellectual interest.Often the guides put forth the problem in geneal terms and researcher narrows down theproblem and phrase the problem in operational terms. The problem stated generally maycontain various ambiguities which must be resolved by proper thinking and rethinking over theproblem. There are two ways of stating a problem by way of posing questions and by way ofmaking statements.
(2) Understanding the nature of the problem: - For understanding the nature of the problem in abetter way, the researcher has to hold discussions with those who have Knowledge of theproblem.
(3) Surveying the available literature:- This is necessary because only through such a survey, aresearcher can understand the relevant theories, reports etc.studies on related problems areuseful for knowing the type of difficulties that may encounter in the present study.
School of Distance Education
Business Research Methods 17
(4) Developing the ideas through discussions: - A researcher must discuss his problem with hiscolleagues and those who have enough experience in the same area or in working on similarproblems. People with experience can enlighten the researcher on various aspects of his study.
(5) Rephrasing the research problem: - A researcher must rephrase the research problems into aworking proposition. The researcher puts the research problem in as specific terms as possibleso that it may become operationally viable and may help in the development of workinghypothesis.
Terms defined
Relevant Variables
A variable is a measurable concept such as height, age, income etc. it takes quantitativevalues. It may vary from individuals to individuals or groups to groups. When there are twovariables in a study such that the values of one variable change in response to the change in thevalues of the other variable, then the former is said to be depending variable and latter is said to beindependent variable. A variable may be discrete or continuous. When a variable assumes onlycertain specified values in an interval, it is called discrete variable. But a continuous variable is onewhich can assume any number of values in an interval.
Extraneous variables: Besides the independent variable, a dependent variable can beinfluenced by other variables, which are not part of the study. They are called extraneous variable.They are variables working from outside.
Unit of analysis: A variable can be measured and analyzed by statistical units. Thestatistical units used for analysis and interpretation are known as units of analysis. Rationspercentages, coefficients etc are such units. They can be used for the purpose of comparison.
Hypothesis
Hypothesis is a tentative statement showing the relationship between two or more variables, thereliability and validity of which is to be tested and verified. It expresses the nature and degree ofrelationship between variables. Hypotheses are -
• Assumptions
• Tentative statements
• Propositions
• Answering the questions
• Proposed solution to a problem
• Statements which are to be tested
• To be accepted of rejected
• To be verified empirically on the basis of sample
School of Distance Education
Business Research Methods 18
Why Hypothesis
• Gives the direction of research
• Specifies the sources of data
• Determines the data needs
• Type of research
• Appropriate techniques of research
• Contributes to the development of theory
Role of Hypothesis
• It guides the direction of the study
• It identifies facts that are relevant and those that are not
• It suggests which form of research design is likely to be most appropriate
• It provides a frame work for organising the conclusions that result
Sources of Hypothesis
• Observation –based on the behavior pattern
• Relation between price and demand is hypothesized,
• the sales and ad may be hypothesized
• Analogies casual observations in nature
• Poor people buy more lottery
• Intuitions and personal experiences –
• The story of Newton and falling of apple,
• The wisdom of Budha under the banyan tree
• A sparking in our mind at particular occasions
• Findings of studies
• State of Knowledge – the theorems may be modified
• Culture –castes, beliefs, habits, behaviour
• Contribution of research – the rejection of certain hypothesis may lead to further research
• Theory –large concerns earn more profit, return on capital is an index of business success
Different Types of Hypothesis
Descriptive Hypothesis – Describing the characteristics of a variable (may be an object, person,organisation, event, and situation)
School of Distance Education
Business Research Methods 19
• Eg. Employment opportunity of commerce graduates is more than the arts students.
Relational Hypothesis – Establishes relationship between two variables. It may be positive,negative or nil relationship.
• Eg. High income leads to high savings
Causal Hypothesis – The change in one variable leads to change in another variable i.e. Dependentand independent variables, one variable is a cause and the other one is the effect
Statistical Hypothesis – association or difference between two variables are hypothesized
Null Hypothesis – it points out there is no difference between two populations in respect of sameproperty.
Alternative Hypothesis- when we reject the null hypothesis, we accept another hypothesis knownas alternate hypothesis.
Working Hypothesis
Complex Hypothesis
How to test
• State the two hypotheses - null and alternative
• Decide the test statistic t, Z, F, Chi-square
• Fix the level of significance
• Make the computations
• Take the decision
• Type 1 error and Type 11 error
• Degree of freedom ( based on probability, distribution)
School of Distance Education
Business Research Methods 20
CHAPTER 3
RESEARCH DESIGN
A research design is a “Blue Print” for collection, measurement and analysis of data. Itoutlines how the research will be carried out. It is like glue which sticks together the entire processof research. It provides answers to various questions like - What techniques will be used to gatherdata. What kind of sampling will be used? How time and cost constraints be dealt with? Etc.
Essentials of Research Design
1. The design should be an activity and time based plan
2. It is always based on research question
3. It guides the selection of sources and types of information
4. It indicates a framework for specifying the relationship among the study’s variables
5. Outlines procedures for every research activity
6. It must be appropriate, efficient and economical
7. It should be flexible
8. It must be adequate
Types of Research Design
“You cannot put the same shoe on every foot” - Syrus
Although every problem and research objective may seem unique, there are usually enoughsimilarities among problems and objectives to allow decisions to be made in advance about the bestplan to resolve the problem. There are some basic research designs that can be successfullymatched to given problems and research objectives.
Three traditional categories of research design:
• Exploratory
• Descriptive
• Causal
The choice of the most appropriate design depends largely on the objectives of the researchand how much is known about the problem and these objectives. The overall research design for aproject may include one or more of these three designs as part(s) of it.
Further, if more than one design is to be used, typically we progress from Exploratorytoward Causal.
School of Distance Education
Business Research Methods 21
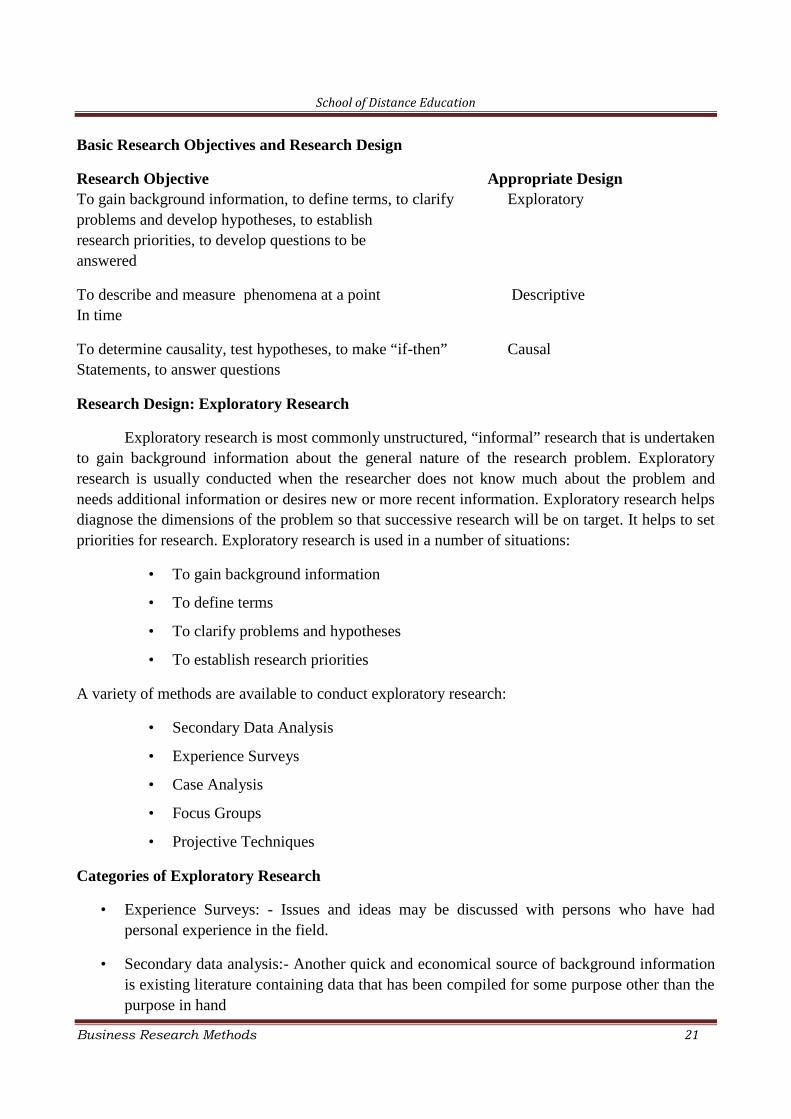
Basic Research Objectives and Research Design
Research Objective Appropriate DesignTo gain background information, to define terms, to clarify Exploratoryproblems and develop hypotheses, to establishresearch priorities, to develop questions to beanswered
To describe and measure phenomena at a point DescriptiveIn time
To determine causality, test hypotheses, to make “if-then” CausalStatements, to answer questions
Research Design: Exploratory Research
Exploratory research is most commonly unstructured, “informal” research that is undertakento gain background information about the general nature of the research problem. Exploratoryresearch is usually conducted when the researcher does not know much about the problem andneeds additional information or desires new or more recent information. Exploratory research helpsdiagnose the dimensions of the problem so that successive research will be on target. It helps to setpriorities for research. Exploratory research is used in a number of situations:
• To gain background information
• To define terms
• To clarify problems and hypotheses
• To establish research priorities
A variety of methods are available to conduct exploratory research:
• Secondary Data Analysis
• Experience Surveys
• Case Analysis
• Focus Groups
• Projective Techniques
Categories of Exploratory Research
• Experience Surveys: - Issues and ideas may be discussed with persons who have hadpersonal experience in the field.
• Secondary data analysis:- Another quick and economical source of background informationis existing literature containing data that has been compiled for some purpose other than thepurpose in hand
School of Distance Education
Business Research Methods 22
• Case Study method: -obtains information from one or a few situations that are similar to theproblem situation. Primary advantage is that an entire organisation or entity can beinvestigated in depth and with meticulous attention to detail.
• Pilot Studies are used in different types of designs. - Within the context of exploratoryresearch it covers some part of the research on a small scale. Major categories of pilot studyinclude focus group interviews, projective techniques, and depth interviews.
Categories of Pilot Studies
• Focus Group interviews: - Unstructured, free flowing, group dynamic sessions that allowindividuals the opportunity to initiate the topics of discussion. There is synergistic andspontaneous interaction among the respondents. Found to be highly advantageous.
• Projective techniques; - An indirect means of questioning the respondents. Uses wordassociation tests, sentence completion test, third person test, role playing technique andThematic Apperception Test.
• Depth interviews:- unstructured,, extensive interviews that encourage an individual to talkfreely and in depth about a topic
Historical Research
History, the meaningful record of human achievement, helps us to understand the present and tosome extent, to predict the future.
• Used to “prevent reinventing the wheel” every few years.
• It is the application of scientific method to the description and analysis of past events
Descriptive Research
Descriptive research is undertaken to provide answers to questions of who, what, where, when, andhow – but not why.
Two basic classifications:
• Cross-sectional studies
• Longitudinal studies
Research Design
Descriptive Research -Cross-sectional Studies
• Cross-sectional studies measure units from a sample of the population at only one point intime.
School of Distance Education
Business Research Methods 23
• Sample surveys are cross-sectional studies whose samples are drawn in such a way as to berepresentative of a specific population.
• On-line survey research is being used to collect data for cross-sectional surveys at a fasterrate of speed.
Descriptive Research -Longitudinal Studies
• Longitudinal studies repeatedly draw sample units of a population over time.
• One method is to draw different units from the same sampling frame.
• A second method is to use a “panel” where the same people are asked to respondperiodically.
• On-line survey research firms recruit panel members to respond to online queries.
Research Design: Causal Research
• Causality may be thought of as understanding a phenomenon in terms of conditionalstatements of the form “If x, then y.”
• Causal relationships are typically determined by the use of experiments, but other methodsare also used.
Experiments
An experiment is defined as manipulating (changing values/situations) one or more independentvariables to see how the dependent variable(s) is/are affected, while also controlling the affects ofadditional extraneous variables.
– Independent variables: - that over which the researcher has control and wishes to manipulate i.e.package size, ad copy, price.
– Dependent variables: - that over which the researcher has little to no direct control, but has astrong interest in testing i.e. sales, profit, market share.
– Extraneous variables: - those that may affect a dependent variable but are not independentvariables.
Experimental Design
An experimental design is a procedure for devising an experimental setting such that a change inthe dependent variable may be solely attributed to a change in an independent variable.
Symbols of an experimental design:
• O = measurement of a dependent variable
• X = manipulation, or change, of an independent variable
• R = random assignment of subjects to experimental and control groups
• E = experimental effect
School of Distance Education
Business Research Methods 24
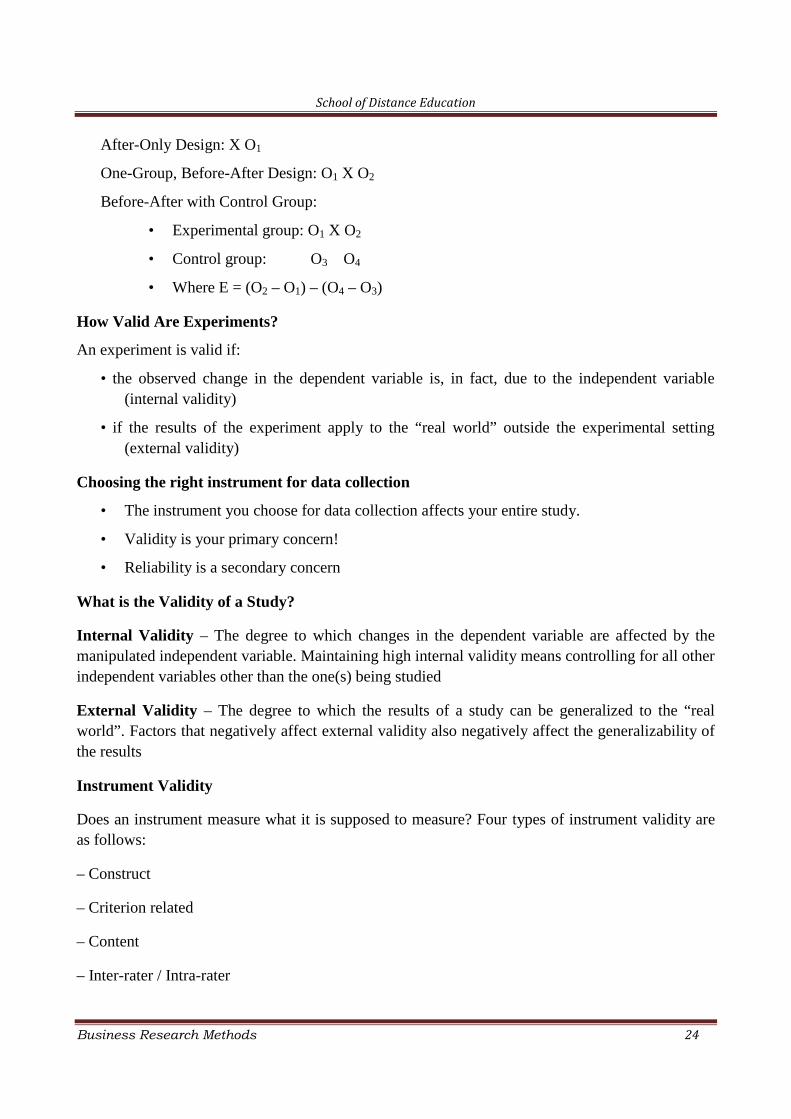
After-Only Design: X O1
One-Group, Before-After Design: O1 X O2
Before-After with Control Group:
• Experimental group: O1 X O2
• Control group: O3 O4
• Where E = (O2 – O1) – (O4 – O3)
How Valid Are Experiments?
An experiment is valid if:
• the observed change in the dependent variable is, in fact, due to the independent variable(internal validity)
• if the results of the experiment apply to the “real world” outside the experimental setting(external validity)
Choosing the right instrument for data collection
• The instrument you choose for data collection affects your entire study.
• Validity is your primary concern!
• Reliability is a secondary concern
What is the Validity of a Study?
Internal Validity – The degree to which changes in the dependent variable are affected by themanipulated independent variable. Maintaining high internal validity means controlling for all otherindependent variables other than the one(s) being studied
External Validity – The degree to which the results of a study can be generalized to the “realworld”. Factors that negatively affect external validity also negatively affect the generalizability ofthe results
Instrument Validity
Does an instrument measure what it is supposed to measure? Four types of instrument validity areas follows:
– Construct
– Criterion related
– Content
– Inter-rater / Intra-rater
School of Distance Education
Business Research Methods 25
Construct Validity
It is the most important type of validity. Construct validity is the degree to which theinstrument actually measures whether or not an underlying construct is being measured.
For example, does a math test actually measure math achievement? Does a personality testactually measure personality?
Criterion Related Validity
Criterion Related Validity is of two types:-
• Concurrent validity – Degree to which scores on one test are correlated with scores onanother test administered at the same time. Only one group is used.
• Predictive validity – Degree to which scores on one test predicts scores on a testadministered in the future. Only one group is used.
Reliability
Reliability is the consistency with which an instrument measures the construct or contentarea it is intended to measure. Reliability is established using such techniques as
• split-half,
• rationale equivalence and inter-rater
Reliability is reported as a coefficient ranging from 0.00 (low) to +1.00 (high). Anything above .70is considered sufficient for most cases
Measures of Reliability
• Stability (test / re-test)
• Equivalence (alternate forms)
• Equivalence and Stability Combined
• Internal consistency
• Scorer / Rater
Internal Consistency
Questions on tests should be equally difficult throughout entire instrument
Split-half – Used with dichotomous tests
Kuder-Richardson 20 / 21 – Improvement on split-half
Cronbach’s Alpha – Only used with instruments with more than two scores (e.g., LikertScales)
School of Distance Education
Business Research Methods 26
Sampling Design
Sampling is concerned with the selection of a subset of individuals from within a statisticalpopulation to estimate characteristics of the whole population. Two advantages of sampling are thatthe cost is lower and data collection is faster than measuring the entire population. A Sample designis a definite plan for obtaining a sample from a given population
Definition
According to Gerald Hursh “a Sample Design is the theoretical basis and the practicalmeans by which we infer the characteristics of some population by generalizing from thecharacteristics of relatively few of the units comprising the population
Steps in Sampling Design
1. Define the population or universe
2. State the sampling frame
3. Identify the sampling unit
4. State sampling method
5. Determine the sample size
6. Spell out the sampling plan
7. Select the sample
Population Definition
Successful statistical practice is based on focused problem definition. In sampling, thisincludes defining the population from which our sample is drawn. A population can be defined asincluding all people or items with the characteristic one wish to understand. Because there is veryrarely enough time or money to gather information from everyone or everything in a population,the goal becomes finding a representative sample (or subset) of that population.
Sometimes that which defines a population is obvious. For example, a manufacturer needsto decide whether a batch of material from production is of high enough quality to be released tothe customer, or should be sentenced for scrap or rework due to poor quality. In this case, the batchis the population.
Although the population of interest often consists of physical objects, sometimes we need tosample over time, space, or some combination of these dimensions. For instance, an investigationof supermarket staffing could examine checkout line length at various times, or a study onendangered penguins might aim to understand their usage of various hunting grounds over time.For the time dimension, the focus may be on periods or discrete occasions.
School of Distance Education
Business Research Methods 27
In other cases, our 'population' may be even less tangible. For example, JosephJagger studied the behaviour of roulette wheels at a casino in Monte Carlo, and used this to identifya biased wheel. In this case, the 'population' Jagger wanted to investigate was the overall behaviourof the wheel (i.e. the probability distribution of its results over infinitely many trials), while his'sample' was formed from observed results from that wheel. Similar considerations arise whentaking repeated measurements of some physical characteristic such as the electricalconductivity of copper.
This situation often arises when we seek knowledge about the cause system of whichthe observed population is an outcome. In such cases, sampling theory may treat the observedpopulation as a sample from a larger 'super population'. For example, a researcher might study thesuccess rate of a new 'quit smoking' program on a test group of 100 patients, in order to predict theeffects of the program if it were made available nationwide. Here the super population is"everybody in the country, given access to this treatment" - a group which does not yet exists, sincethe program isn't yet available to all.
Note also that the population from which the sample is drawn may not be the same as thepopulation about which we actually want information. Often there is large but not complete overlapbetween these two groups due to frame issues etc. (see below). Sometimes they may be entirelyseparate - for instance, we might study rats in order to get a better understanding of human health,or we might study records from people born in 2008 in order to make predictions about people bornin 2009.
Time spent in making the sampled population and population of concern precise is oftenwell spent, because it raises many issues, ambiguities and questions that would otherwise have beenoverlooked at this stage.
Sampling Frame
In the most straightforward case, such as the sentencing of a batch of material fromproduction (acceptance sampling by lots), it is possible to identify and measure every single item inthe population and to include any one of them in our sample. However, in the more general casethis is not possible. Where voting is not compulsory, there is no way to identify which people willactually vote at a forthcoming election (in advance of the election). These imprecise populations arenot amenable to sampling in any of the ways below and to which we could apply statistical theory.
As a remedy, we seek a sampling frame which has the property that we can identify everysingle element and include any in our sample. The most straightforward type of frame is a list ofelements of the population (preferably the entire population) with appropriate contact information.For example, in an opinion poll, possible sampling frames include an electoral register anda telephone directory.
Problem Related With Sampling Frame
1. Non coverage and incompleteness.
2. Appearance of cluster of element.
3. Inclusion of foreign element in the list.
School of Distance Education
Business Research Methods 28
Probability and Non-Probability Sampling
A probability sampling is one in which every unit in the population has a chance (greaterthan zero) of being selected in the sample, and this probability can be accurately determined. Thecombination of these traits makes it possible to produce unbiased estimates of population totals, byweighting sampled units according to their probability of selection.
Example: We want to estimate the total income of adults living in a given street. We visiteach household in that street, identify all adults living there, and randomly select one adult fromeach household. (For example, we can allocate each person a random number, generated froma uniform distribution between 0 and 1, and select the person with the highest number in eachhousehold). We then interview the selected person and find their income. People living on theirown are certain to be selected, so we simply add their income to our estimate of the total. But aperson living in a household of two adults has only a one-in-two chance of selection. To reflect this,when we come to such a household, we would count the selected person's income twice towards thetotal. (The person who is selected from that household can be loosely viewed as also representingthe person who isn't selected.)
In the above example, not everybody has the same probability of selection; what makes it aprobability sample is the fact that each person's probability is known. When every element in thepopulation does have the same probability of selection, this is known as an 'equal probability ofselection' (EPS) design. Such designs are also referred to as 'self-weighting' because all sampledunits are given the same weight.
Probability sampling includes: Simple Random Sampling, Systematic Sampling, StratifiedSampling, Probability Proportional to Size Sampling, and Cluster or Multistage Sampling. Thesevarious ways of probability sampling have two things in common:
1. Every element has a known nonzero probability of being sampled and
2. Involves random selection at some point.
Non Probability Sampling ; - Non Probability Sampling is any sampling method where someelements of the population have no chance of selection (these are sometimes referred to as 'out ofcoverage'/'under covered'), or where the probability of selection can't be accurately determined. Itinvolves the selection of elements based on assumptions regarding the population of interest, whichforms the criteria for selection. Hence, because the selection of elements is nonrandom, nonprobability sampling does not allow the estimation of sampling errors. These conditions give riseto exclusion bias, placing limits on how much information a sample can provide about thepopulation. Information about the relationship between sample and population is limited, making itdifficult to extrapolate from the sample to the population.
Example: We visit every household in a given street, and interview the first person to answer thedoor. In any household with more than one occupant, this is a nonprobability sample, because somepeople are more likely to answer the door (e.g. an unemployed person who spends most of their
School of Distance Education
Business Research Methods 29
time at home is more likely to answer than an employed housemate who might be at work when theinterviewer calls) and it's not practical to calculate these probabilities.
Non probability sampling methods include accidental sampling, quotasampling and purposive sampling. In addition, non response effects may turn any probability designinto a non probability design if the characteristics of non response are not well understood, sincenon response effectively modifies each element's probability of being sampled.
Sampling Methods
Within any of the types of frame identified above, a variety of sampling methods can beemployed, individually or in combination. Factors commonly influencing the choice between thesedesigns include:
Nature and quality of the frame
Availability of auxiliary information about units on the frame
Accuracy requirements, and the need to measure accuracy
Whether detailed analysis of the sample is expected
Cost/operational concerns
Simple Random Sampling
In a simple random sample (SRS) of a given size, all such subsets of the frame are given anequal probability. Each element of the frame thus has an equal probability of selection: the frame isnot subdivided or partitioned. Furthermore, any given pair of elements has the same chance ofselection as any other such pair (and similarly for triples, and so on). This minimises bias andsimplifies analysis of results. In particular, the variance between individual results within thesample is a good indicator of variance in the overall population, which makes it relatively easy toestimate the accuracy of results.
However, SRS can be vulnerable to sampling error because the randomness of the selectionmay result in a sample that doesn't reflect the makeup of the population. For instance, a simplerandom sample of ten people from a given country will on average produce five men and fivewomen, but any given trial is likely to over represent one sex and under represent the other.Systematic and stratified techniques, discussed below, attempt to overcome this problem by usinginformation about the population to choose a more representative sample.
SRS may also be cumbersome and tedious when sampling from an unusually large targetpopulation. In some cases, investigators are interested in research questions specific to subgroups ofthe population. For example, researchers might be interested in examining whether cognitive abilityas a predictor of job performance is equally applicable across racial groups. SRS cannotaccommodate the needs of researchers in this situation because it does not provide subsamples ofthe population. Stratified sampling, which is discussed below, addresses this weakness of SRS.
School of Distance Education
Business Research Methods 30
Simple random sampling is always an EPS design (equal probability of selection), but notall EPS designs are simple random sampling.
Systematic Sampling
Systematic sampling relies on arranging the study population according to some orderingscheme and then selecting elements at regular intervals through that ordered list. Systematicsampling involves a random start and then proceeds with the selection of every kth element fromthen onwards. In this case, k = (population size/sample size). It is important that the starting point isnot automatically the first in the list, but is instead randomly chosen from within the first to the kthelement in the list. A simple example would be to select every 10th name from the telephonedirectory (an 'every 10th' sample, also referred to as 'sampling with a skip of 10').
As long as the starting point is randomized, systematic sampling is a type of probabilitysampling. It is easy to implement and the stratification induced can make it efficient, ifthe variableby which the list is ordered is correlated with the variable of interest. 'Every 10th' sampling isespecially useful for efficient sampling from databases.
For example, suppose we wish to sample people from a long street that starts in a poor area(house No. 1) and ends in an expensive district (house No. 1000). A simple random selection ofaddresses from this street could easily end up with too many from the high end and too few fromthe low end (or vice versa), leading to an unrepresentative sample. Selecting (e.g.) every 10th streetnumber along the street ensures that the sample is spread evenly along the length of the street,representing all of these districts. (Note that if we always start at house #1 and end at #991, thesample is slightly biased towards the low end; by randomly selecting the start between #1 and #10,this bias is eliminated.
However, systematic sampling is especially vulnerable to periodicities in the list. Ifperiodicity is present and the period is a multiple or factor of the interval used, the sample isespecially likely to be unrepresentative of the overall population, making the scheme less accuratethan simple random sampling.
For example, consider a street where the odd-numbered houses are all on the north(expensive) side of the road, and the even-numbered houses are all on the south (cheap) side. Underthe sampling scheme given above, it is impossible to get a representative sample; either the housessampled will all be from the odd-numbered, expensive side, or they will all be from the even-numbered, cheap side.
Another drawback of systematic sampling is that even in scenarios where it is more accuratethan SRS, its theoretical properties make it difficult to quantify that accuracy. (In the two examplesof systematic sampling that are given above, much of the potential sampling error is due tovariation between neighbouring houses - but because this method never selects two neighbouringhouses, the sample will not give us any information on that variation.)
School of Distance Education
Business Research Methods 31
As described above, systematic sampling is an EPS method, because all elements have thesame probability of selection (in the example given, one in ten). It is not 'simple random sampling'because different subsets of the same size have different selection probabilities - e.g. the set {4, 14,24,..., 994} has a one-in-ten probability of selection, but the set {4,13,24,34,...} has zero probabilityof selection.
Systematic sampling can also be adapted to a non-EPS approach; for an example, seediscussion of PPS samples below.
Stratified Sampling
Where the population embraces a number of distinct categories, the frame can be organizedby these categories into separate "strata." Each stratum is then sampled as an independent sub-population, out of which individual elements can be randomly selected. There are several potentialbenefits to stratified sampling.
First, dividing the population into distinct, independent strata can enable researchers to drawinferences about specific subgroups that may be lost in a more generalized random sample.
Second, utilizing a stratified sampling method can lead to more efficient statistical estimates(provided that strata are selected based upon relevance to the criterion in question, instead ofavailability of the samples). Even if a stratified sampling approach does not lead to increasedstatistical efficiency, such a tactic will not result in less efficiency than would simple randomsampling, provided that each stratum is proportional to the group's size in the population.
Third, it is sometimes the case that data are more readily available for individual, pre-existing strata within a population than for the overall population; in such cases, using a stratifiedsampling approach may be more convenient than aggregating data across groups (though this maypotentially be at odds with the previously noted importance of utilizing criterion-relevant strata).
Finally, since each stratum is treated as an independent population, different samplingapproaches can be applied to different strata, potentially enabling researchers to use the approachbest suited (or most cost-effective) for each identified subgroup within the population.
There are, however, some potential drawbacks to using stratified sampling. First, identifyingstrata and implementing such an approach can increase the cost and complexity of sample selection,as well as leading to increased complexity of population estimates. Second, when examiningmultiple criteria, stratifying variables may be related to some, but not to others, furthercomplicating the design, and potentially reducing the utility of the strata. Finally, in some cases(such as designs with a large number of strata, or those with a specified minimum sample size pergroup), stratified sampling can potentially require a larger sample than would other methods(although in most cases, the required sample size would be no larger than would be required forsimple random sampling.
School of Distance Education
Business Research Methods 32
A stratified sampling approach is most effective when three conditions are met
1. Variability within strata are minimized
2. Variability between strata are maximized
3. The variables upon which the population is stratified are strongly correlated with the desireddependent variable.
Advantages over other sampling methods
1. Focuses on important subpopulations and ignores irrelevant ones.
2. Allows use of different sampling techniques for different subpopulations.
3. Improves the accuracy/efficiency of estimation.
4. Permits greater balancing of statistical power of tests of differences between strata bysampling equal numbers from strata varying widely in size.
Disadvantages
1. Requires selection of relevant stratification variables which can be difficult.
2. Is not useful when there are no homogeneous subgroups.
3. Can be expensive to implement.
Poststratification
Stratification is sometimes introduced after the sampling phase in a process called"poststratification". This approach is typically implemented due to a lack of prior knowledge of anappropriate stratifying variable or when the experimenter lacks the necessary information to createa stratifying variable during the sampling phase. Although the method is susceptible to the pitfallsof post hoc approaches, it can provide several benefits in the right situation. Implementation usuallyfollows a simple random sample. In addition to allowing for stratification on an ancillary variable,poststratification can be used to implement weighting, which can improve the precision of asample's estimates.
Oversampling
Choice-based sampling is one of the stratified sampling strategies. In choice-basedsampling, the data are stratified on the target and a sample is taken from each stratum so that therare target class will be more represented in the sample. The model is then built on this biasedsample. The effects of the input variables on the target are often estimated with more precision withthe choice-based sample even when a smaller overall sample size is taken compared to a randomsample. The results usually must be adjusted to correct for the oversampling.
Probability-Proportional-To-Size Sampling
In some cases the sample designer has access to an "auxiliary variable" or "size measure",believed to be correlated to the variable of interest, for each element in the population. These data
School of Distance Education
Business Research Methods 33
can be used to improve accuracy in sample design. One option is to use the auxiliary variable as abasis for stratification, as discussed above.
Another option is probability-proportional-to-size ('PPS') sampling, in which the selectionprobability for each element is set to be proportional to its size measure, up to a maximum of 1. In asimple PPS design, these selection probabilities can then be used as the basis for Poisson sampling.However, this has the drawback of variable sample size, and different portions of the populationmay still be over- or under-represented due to chance variation in selections. To address thisproblem, PPS may be combined with a systematic approach.
Example: Suppose we have six schools with populations of 150, 180, 200, 220, 260,and 490 students respectively (total 1500 students), and we want to use student population as thebasis for a PPS sample of size three. To do this, we could allocate the first school numbers 1 to 150,the second school 151 to 330 (= 150 + 180), the third school 331 to 530, and so on to the last school(1011 to 1500). We then generate a random start between 1 and 500 (equal to 1500/3) and countthrough the school populations by multiples of 500. If our random start was 137, we would selectthe schools which have been allocated numbers 137, 637, and 1137, i.e. the first, fourth, and sixthschools.
The PPS approach can improve accuracy for a given sample size by concentrating sampleon large elements that have the greatest impact on population estimates. PPS sampling is commonlyused for surveys of businesses, where element size varies greatly and auxiliary information is oftenavailable - for instance, a survey attempting to measure the number of guest-nights spent in hotelsmight use each hotel's number of rooms as an auxiliary variable. In some cases, an oldermeasurement of the variable of interest can be used as an auxiliary variable when attempting toproduce more current estimates.
Cluster Sampling
Sometimes it is more cost-effective to select respondents in groups ('clusters'). Sampling isoften clustered by geography, or by time periods. (Nearly all samples are in some sense 'clustered'in time - although this is rarely taken into account in the analysis.) For instance, if surveyinghouseholds within a city, we might choose to select 100 city blocks and then interview everyhousehold within the selected blocks.
Clustering can reduce travel and administrative costs. In the example above, an interviewercan make a single trip to visit several households in one block, rather than having to drive to adifferent block for each household.
It also means that one does not need a sampling frame listing all elements in the targetpopulation. Instead, clusters can be chosen from a cluster-level frame, with an element-level framecreated only for the selected clusters. In the example above, the sample only requires a block-levelcity map for initial selections, and then a household-level map of the 100 selected blocks, ratherthan a household-level map of the whole city.
School of Distance Education
Business Research Methods 34
Cluster sampling generally increases the variability of sample estimates above that ofsimple random sampling, depending on how the clusters differ between themselves, as comparedwith the within-cluster variation. For this reason, cluster sampling requires a larger sample thanSRS to achieve the same level of accuracy - but cost savings from clustering might still make this acheaper option.
Cluster sampling is commonly implemented as multistage sampling. This is a complex formof cluster sampling in which two or more levels of units are embedded one in the other. The firststage consists of constructing the clusters that will be used to sample from. In the second stage, asample of primary units is randomly selected from each cluster (rather than using all unitscontained in all selected clusters). In following stages, in each of those selected clusters, additionalsamples of units are selected, and so on. All ultimate units (individuals, for instance) selected at thelast step of this procedure are then surveyed. This technique, thus, is essentially the process oftaking random subsamples of preceding random samples.
Multistage sampling can substantially reduce sampling costs, where the completepopulation list would need to be constructed (before other sampling methods could be applied). Byeliminating the work involved in describing clusters that are not selected, multistage sampling canreduce the large costs associated with traditional cluster sampling.
Quota Sampling
In quota sampling, the population is first segmented into mutually exclusive sub-groups,just as in stratified sampling. Then judgement is used to select the subjects or units from eachsegment based on a specified proportion. For example, an interviewer may be told to sample 200females and 300 males between the age of 45 and 60.
It is this second step which makes the technique one of non-probability sampling. In quotasampling the selection of the sample is non-random. For example interviewers might be tempted tointerview those who look most helpful. The problem is that these samples may be biased becausenot everyone gets a chance of selection. This random element is its greatest weakness and quotaversus probability has been a matter of controversy for several years.
Accidental Sampling
Accidental sampling (sometimes known as grab, convenience or opportunity sampling) is atype of non probability sampling which involves the sample being drawn from that part of thepopulation which is close to hand. That is, a population is selected because it is readily availableand convenient. It may be through meeting the person or including a person in the sample when onemeets them or chosen by finding them through technological means such as the internet or throughphone. The researcher using such a sample cannot scientifically make generalizations about thetotal population from this sample because it would not be representative enough. For example, ifthe interviewer were to conduct such a survey at a shopping center early in the morning on a givenday, the people that he/she could interview would be limited to those given there at that given time,which would not represent the views of other members of society in such an area, if the survey
School of Distance Education
Business Research Methods 35
were to be conducted at different times of day and several times per week. This type of sampling ismost useful for pilot testing. Several important considerations for researchers using conveniencesamples include:
1. Are there controls within the research design or experiment which can serve to lessen theimpact of a non-random convenience sample, thereby ensuring the results will be morerepresentative of the population?
2. Is there good reason to believe that a particular convenience sample would or shouldrespond or behave differently than a random sample from the same population?
3. Is the question being asked by the research one that can adequately be answered using aconvenience sample?
In social science research, snowball sampling is a similar technique, where existing studysubjects are used to recruit more subjects into the sample. Some variants of snowball sampling,such as respondent driven sampling, allow calculation of selection probabilities and are probabilitysampling methods under certain conditions.
4. Duplication.
Sample Size
Sample size is the number of items to be selected from the universe. It should be optimum.Formulas, tables, and power function charts are well known approaches to determine sample size.
Steps for Using Sample Size Tables
1. Postulate the effect size of interest, α, and β.
2. Check sample size table
1. Select the table corresponding to the selected α
2. Locate the row corresponding to the desired power
3. Locate the column corresponding to the estimated effect size.
4. The intersection of the column and row is the minimum sample size required.
The Factors Considering While Deciding The Size Of The Sample
a) Nature of the population.
b) Complexity of tabulation.
c) Problem relate with collection of data.
d) Type of sampling.
e) Basic information.
f) Degree of accuracy required for the study.
School of Distance Education
Business Research Methods 36
Characteristics of Good Sample Design
a. Representative.
b. Viable.
c. The selected sample design should not cause more errors.
d. A good sample design able to control systematic bias efficiently.
e. If the sample is well design and selected, decision makers can use this info withconfidence.
Criteria of Selecting a Sampling Procedure
1. Nature of the problem.
2. Goal of researchers.
3. Geographical area covered by the survey.
4. Size of the population under study.
5. Extent of fact available about population.
6. Availability of funds
7. Available time for study.
8. Desired reliability of the result.
Criteria Used For Selecting Sampling Techniques
The purpose of the survey.
Measurability.
Degree of precision.
Information about population.
The nature of the population.
The geographical area covered by the survey.
Fund availability.
Time.
Economy.
Errors in Sample Surveys
Survey results are typically subject to some error. Total errors can be classified into sampling errorsand non-sampling errors. The term "error" here includes systematic biases as well as random errors.
School of Distance Education
Business Research Methods 37
Sampling Errors and Biases
Sampling errors and biases are induced by the sample design. They include:
1. Selection Bias: When the true selection probabilities differ from those assumed incalculating the results.
2. Random Sampling Error: Random variation in the results due to the elements in thesample being selected at random.
Sampling Bias
Sampling analysis involve to type of cost namely cost of collecting data and cost of anincorrect inference resulting from the data. They are to causes for incorrect inference resultingfrom data. They are
i. Systematic bias
ii. Sampling errors
Causes of systematic bias
Unsuitable sample frame or source list.
Faulty measuring device.
Non respondent
Indeterminacy principle.
Usual bias in reporting data.
Sampling errors
The errors which arise due to the use of sampling survey are known as sampling errors. These arerandom variation in the sample estimate around the true population parameters.
Type of sampling errors
Biased errors: These errors are occurring due to the faulty selection of sampling method due to theprejudice of the researchers.
Unbiased errors: This type of bias is occurring due to chance difference between the itemsincluded in the sample.
Causes of bias
Bias may arise due to,
1. Faulty process selection.
2. Faulty work during the collection of information.
3. Faulty method of analysis.
School of Distance Education
Business Research Methods 38
Non-Sampling Error
Non-sampling errors are other errors which can impact the final survey estimates, caused byproblems in data collection, processing, or sample design. They include:
1. Over coverage: Inclusion of data from outside of the population.
2. Under coverage: Sampling frame does not include elements in the population.
3. Measurement error: e.g. when respondents misunderstand a question, or find it difficult toanswer.
4. Processing error: Mistakes in data coding.
5. Non-response: Failure to obtain complete data from all selected individuals.
After sampling, a review should be held of the exact process followed in sampling, rather thanthat intended, in order to study any effects that any divergences might have on subsequent analysis.A particular problem is that of non-response.
Two major types of non-response exist: unit non-response (referring to lack of completion ofany part of the survey) and item non-response (submission or participation in survey but failing tocomplete one or more components/questions of the survey). In survey sampling, many of theindividuals identified as part of the sample may be unwilling to participate, not have the time toparticipate (opportunity cost), or survey administrators may not have been able to contact them. Inthis case, there is a risk of differences, between respondents and non respondents, leading to biasedestimates of population parameters. This is often addressed by improving survey design, offeringincentives, and conducting follow-up studies which make a repeated attempt to contact theunresponsive and to characterize their similarities and differences with the rest of the frame. Theeffects can also be mitigated by weighting the data when population benchmarks are available or byimputing data based on answers to other questions.
Non-response is particularly a problem in internet sampling. Reasons for this problem includeimproperly designed surveys,] over-surveying (or survey fatigue), and the fact that potentialparticipants hold multiple e-mail addresses, which they don't use anymore or don't check regularly.
Sampling and Data Collection
Good data collection involves:
Following the defined sampling process
Keeping the data in time order
Noting comments and other contextual events
School of Distance Education
Business Research Methods 39
Methods of Data Collection
1. Primary data collection
2. Secondary data collection
Collection of Primary Data
Primary data are those data which are collected for the first time and these are in originalin character.
Methods of Collecting Primary Data
1. Observation
2. Interview
3. Questionnaire
4. Schedule
5. Experimentation
6. Simulation
7. Use of telephone
8. Panel method
9. Mail survey
10. Projective technique
11. Sociometry
12. Focus group discussion
13. Content analysis
Observation
Observation is the systematic viewing of specific phenomenon in its proper setting for thespecific purpose of gathering data for a particular study.
Features of observation
• Physical & mental activity
• Selective
• Purposive & not informal
• Grasps the significant events & occurrences
• Should be exact & based on standardized tools of research
School of Distance Education
Business Research Methods 40
Types of observation
1. Simple and systematic
2. Subjective and objective
3. Casual and scientific
4. Intra subjective and inter subjective
5. Factual and inferential
6. Direct and indirect
7. Participant and non participant
8. Structured and unstructured
Advantages
• Actual or habits of person are observed
• Obtain information from those who are unable to effectively communicate in written or oralform
• No better way to gather information than through observation
• Most reliable method of data collection
Disadvantages
• Result of observation depends on the skill of the observer
• Options and attitudes cannot be obtained by observation
• It should be expensive to tie up personnel in such tasks
• The researcher’s findings are limited to those observed
Component of process of observation
1. Sensation
2. Attention
3. perception
Experimental method
it is the least used method for collecting primary data. This method is commonly usedby marketers in test marketing.
Types;
1. Laboratory experiments
2. Field experiments
School of Distance Education
Business Research Methods 41
Laboratory experiment
A laboratory experiment is an investigation conducted in situation created specifically for thatpurpose
Field experiment
This is an experiment conducted in real life situation in which the experiments manipulate anindependent variable in order to test a hypothesis
Advantages of experimental method
• the power to determine the causal relationship between variables is more compared withother methods
• The human errors can be reduced to the minimum
• It helps to produce exact measurement
Limitations of experimental method
• Difficult to establish comparable control & experimental group
• Limited scope
• Lacks realism
• Cannot be used for future study
• Not used for determine opinion ,motive & intention of individual
Simulation
Simulation is a recent research technique. It is a realistic enactment of roles in an imaginedsituation. There are three uses;
1. Assessment of a situation
2. Understanding a situation
3. Decision making in a situation
Types of Simulation
1. Computer simulation
2. Man simulation
3. Man computer simulation
School of Distance Education
Business Research Methods 42
CHAPTER-4
MEASUREMENT AND SCALING
The word scale or scaling is generally used for indicating measurements or measuringsomething. Many aspects of social phenomena like emotion, attitude, faiths etc. are not measurabledirectly. They are not quantitative in nature. In social phenomena there are two types of variables-quantitative and qualitative. Measurement or scaling implies conversion of qualitative data intoquantitative data and then measuring them. Various kinds of statistical measurements are used forthis purpose. Scaling is an attempt to bring about greater accuracy which is desired in both physicaland social sciences.
Essentials of Scaling (Criteria for Good Scaling)
Continuum means judging the scalability of the phenomenon under study.
Reliability means that it should consistently produce the same result when applied to thesame design.
Validity implies correct measurement. A scale is valid if it measures correctly what isexpected to measure.
Weighting items means proper weights are to be provided to the attributes involved in thestudy because they are not of equal importance.
Equality of units is a desirable characteristic but not essential for sound scientific procedure.In order to make the units equal, sometimes subtraction or addition can be made.
Measurement
Measurement is a systematic way of assigning numbers or names to objects and their attributes. It iseasy to assign numbers in respect of properties of some objects, properties like weight, height.
Why Measurement?
“When you can measure what you are talking about and express it in numbers, you knowsomething about it” Lord Kelvin
Rules of Measurement
• A rule is a guide which instructs us to do.
• Operational definitions help us to specify the rules for assigning the numbers.
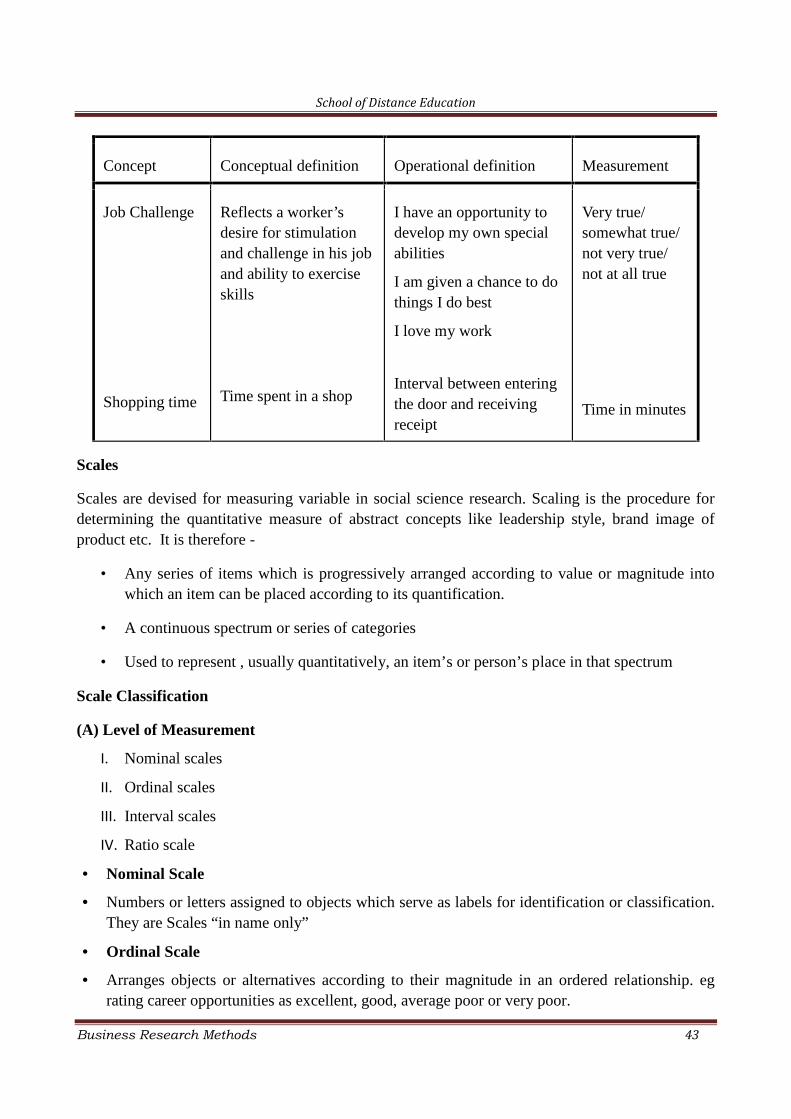
School of Distance Education
Business Research Methods 43
Concept Conceptual definition Operational definition Measurement
Job Challenge
Shopping time
Reflects a worker’sdesire for stimulationand challenge in his joband ability to exerciseskills
Time spent in a shop
I have an opportunity todevelop my own specialabilities
I am given a chance to dothings I do best
I love my work
Interval between enteringthe door and receivingreceipt
Very true/somewhat true/not very true/not at all true
Time in minutes
Scales
Scales are devised for measuring variable in social science research. Scaling is the procedure fordetermining the quantitative measure of abstract concepts like leadership style, brand image ofproduct etc. It is therefore -
• Any series of items which is progressively arranged according to value or magnitude intowhich an item can be placed according to its quantification.
• A continuous spectrum or series of categories
• Used to represent , usually quantitatively, an item’s or person’s place in that spectrum
Scale Classification
(A) Level of Measurement
I. Nominal scales
II. Ordinal scales
III. Interval scales
IV. Ratio scale
• Nominal Scale
• Numbers or letters assigned to objects which serve as labels for identification or classification.They are Scales “in name only”
• Ordinal Scale
• Arranges objects or alternatives according to their magnitude in an ordered relationship. egrating career opportunities as excellent, good, average poor or very poor.
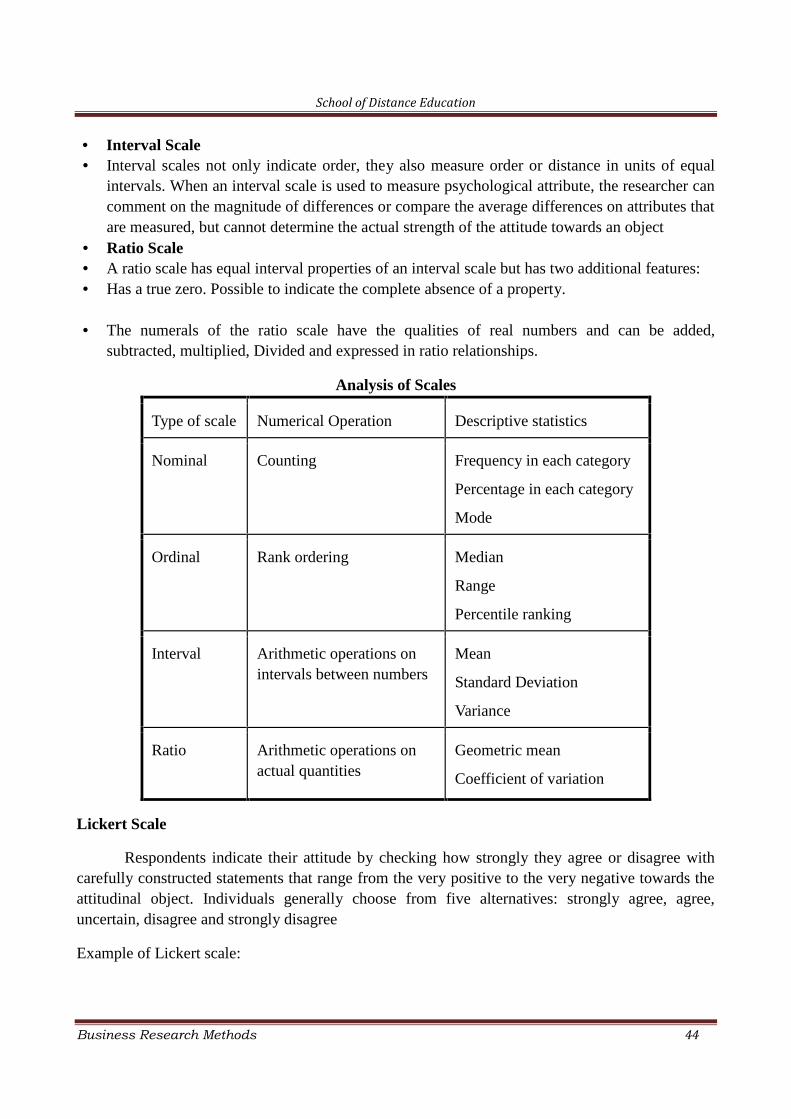
School of Distance Education
Business Research Methods 44
• Interval Scale• Interval scales not only indicate order, they also measure order or distance in units of equal
intervals. When an interval scale is used to measure psychological attribute, the researcher cancomment on the magnitude of differences or compare the average differences on attributes thatare measured, but cannot determine the actual strength of the attitude towards an object
• Ratio Scale• A ratio scale has equal interval properties of an interval scale but has two additional features:• Has a true zero. Possible to indicate the complete absence of a property.
• The numerals of the ratio scale have the qualities of real numbers and can be added,subtracted, multiplied, Divided and expressed in ratio relationships.
Analysis of Scales
Type of scale Numerical Operation Descriptive statistics
Nominal Counting Frequency in each category
Percentage in each category
Mode
Ordinal Rank ordering Median
Range
Percentile ranking
Interval Arithmetic operations onintervals between numbers
Mean
Standard Deviation
Variance
Ratio Arithmetic operations onactual quantities
Geometric mean
Coefficient of variation
Lickert Scale
Respondents indicate their attitude by checking how strongly they agree or disagree withcarefully constructed statements that range from the very positive to the very negative towards theattitudinal object. Individuals generally choose from five alternatives: strongly agree, agree,uncertain, disagree and strongly disagree
Example of Lickert scale:
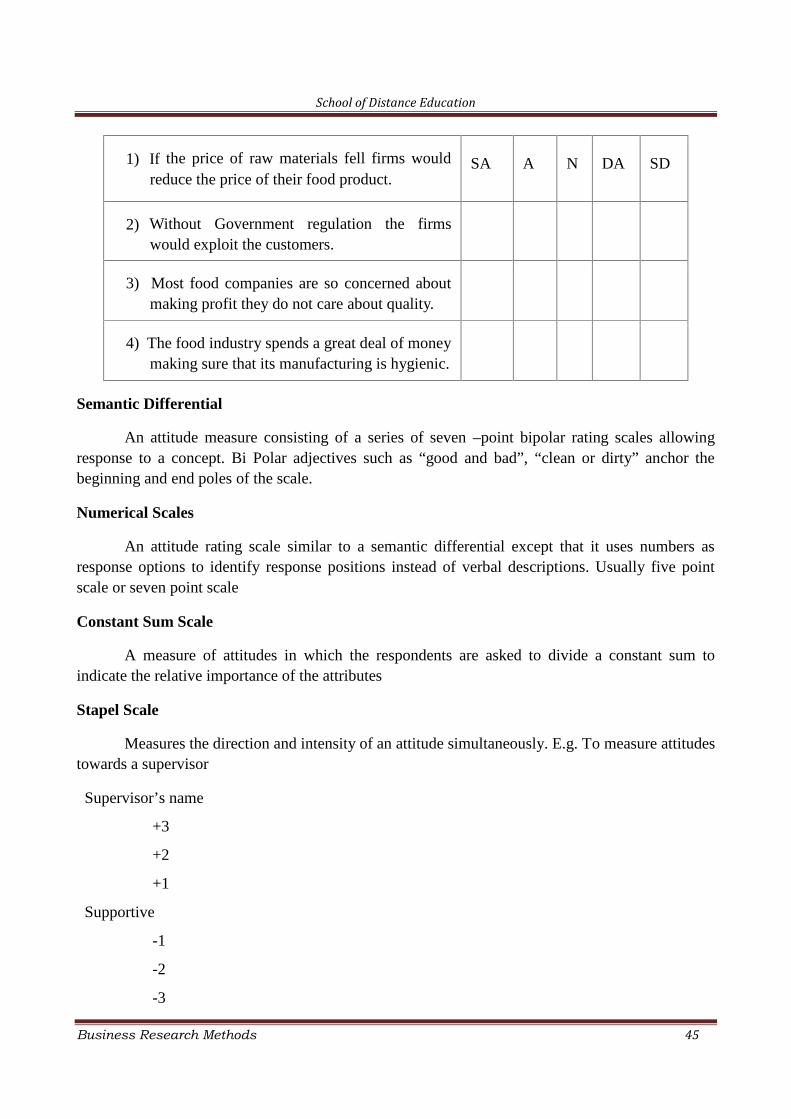
School of Distance Education
Business Research Methods 45
1) If the price of raw materials fell firms wouldreduce the price of their food product.
SA A N DA SD
2) Without Government regulation the firmswould exploit the customers.
3) Most food companies are so concerned aboutmaking profit they do not care about quality.
4) The food industry spends a great deal of moneymaking sure that its manufacturing is hygienic.
Semantic Differential
An attitude measure consisting of a series of seven –point bipolar rating scales allowingresponse to a concept. Bi Polar adjectives such as “good and bad”, “clean or dirty” anchor thebeginning and end poles of the scale.
Numerical Scales
An attitude rating scale similar to a semantic differential except that it uses numbers asresponse options to identify response positions instead of verbal descriptions. Usually five pointscale or seven point scale
Constant Sum Scale
A measure of attitudes in which the respondents are asked to divide a constant sum toindicate the relative importance of the attributes
Stapel Scale
Measures the direction and intensity of an attitude simultaneously. E.g. To measure attitudestowards a supervisor
Supervisor’s name
+3
+2
+1
Supportive
-1
-2
-3
School of Distance Education
Business Research Methods 46
Scaling Techniques
Some of the important scaling techniques are as follows:
Rating Scale: It means measuring an attribute by judgement in a continuum.For eg. Students are rated by their teachers. In rating three elements are taken intoconsideration namely judges, continuum and subjects. Judges must be impartial. Continuummust accommodate the attributes realistically. Subjects should be amenable to rating. Ratingscales are generally used for measuring the attitudes and the intensity of attitudes.
Ranking Scales: Ranking scales are identical to rating scales. In ranking scales,we make relative the score will place judgements against other similar objects. There aretwo generally used approaches of ranking scales namely.
1. Method of Paired Comparison where the respondent can express his attitudeby making a choice between two objects.
2. Method of Ranking Order where the respondents are asked to rank theirchoices.
Attitude Scales: In this type of scale, the attitude of an individual towards amatter can be known from the score of his responses given on a questionnaire. The scorewill place him in a scale. He simply expresses his likes or dislikes, agreement ordisagreement with the issue involved as given in the forms of questions. On the basis ofreply, he is assigned a score which indicates his position. In the attitude scale some relevantstatements are to be considered by the respondents. The statements are found in such a wayas to be intimately related to the attribute which is sought to be measured.
Factor Scaling: This is a type of scaling in which multi dimensions of acomplex attitude is identified.
Sources of Error in Measurement
a) Response Error – sometimes the respondent may be reluctant to express strong negativefeelings or they may have very little knowledge about various aspects but he will not admithis ignorance. The figure, boredom, anxiety etc of the respondents may limit the ability ofthe respondent to express his response accurately. In these situations the researcher has tomake guesses in interviews. These guesses may sometimes be erroneous, thus resulting intowrong measurement.
b) Situational Error – situational factors also cause error in measurement. If somethinghappens at the time of interview which places a strain on the interview that will have seriouseffects on the response from the respondent. For example, if somebody is present at the timeof interview the respondent may not reveal facts correctly.
c) Errors Due To Faulty Instruments – Use of complex words, ambiguous meanings, poorprinting, inadequate space for replies etc may result in measurement errors.
School of Distance Education
Business Research Methods 47
Pilot Study
Pilot study is a standard scientific tool for 'soft' research, allowing scientists to conduct apreliminary analysis before committing to a full-blown study or experiment. A small chemistryexperiment in a college laboratory, for example, costs very little, and mistakes or validity problemseasily rectified. At the other end of the scale, a medical experiment taking samples from thousandsof people from across the world is expensive, often running into the millions of dollars.
• Finding out that there was a problem with the equipment or with the statistics used isunacceptable, and there will be dire consequences.
• A field research project in the Amazon Basin costs a lot of time and money, so finding outthat the electronics used do not function in the humid and warm conditions is too late.
• To test the feasibility, equipment and methods, researchers will often use a pilot study, asmall-scale rehearsal of the larger research design. Generally, the pilot study techniquespecifically refers to a smaller scale version of the experiment, although equipment tests arean increasingly important part of this sub-group of experiments.
• For example, the medical researchers may conduct a smaller survey upon a hundred people,to check that the protocols are fine.
• Pilot studies are also excellent for training inexperienced researchers, allowing them to makemistakes without fear of losing their job or failing the assignment.
• Logistical and financial estimates can be extrapolated from the pilot study, and the researchquestion, and the project can be streamlined to reduce wastage of resources and time.
• Pilots can be an important part of attracting grants for research as the results can be placedbefore the funding body.
• Generally, most funding bodies see research as an investment, so are not going to dole outmoney unless they are certain that there is a chance of a financial return.
• Unfortunately, there are seldom paper reporting the preliminary pilot study, especially ifproblems were reported, is often stigmatized and sidelined. This is unfair, and punishesresearchers for being methodical, so these attitudes are under a period of re-evaluation
• Discouraging researchers from reporting methodological errors, as found in pilot studies,means that later researchers may make the same mistakes.
• The other major problem is deciding whether the results from the pilot study can be includedin the final results and analysis, a procedure that varies wildly between disciplines.
• Pilots are rapidly becoming an essential pre-cursor to many research projects, especially whenuniversities are constantly striving to reduce costs. Whilst there are weaknesses, they areextremely useful for driving procedures in an age increasingly dominated by technology,much of it untested under field conditions.
School of Distance Education
Business Research Methods 48
Survey and Questionnaire Method
The survey research design is often used because of the low cost and easy accessible information.
Introduction
Conducting accurate and meaningful surveys is one of the most important facets of marketresearch in the consumer driven 21st century. Businesses, governments and media spend billions ofdollars on finding out what people think and feel. Accurate research can generate vast amounts ofrevenue; bad or inaccurate research can cost millions, or even bring down governments. The surveyresearch design is a very valuable tool for assessing opinions and trends. Even on a small scale,such as local government or small businesses, judging opinion with carefully designed surveys candramatically change strategies. Television chat-shows and newspapers are usually full of facts andfigures gleaned from surveys but often no information is given as to where this information comesfrom or what kind of people were asked.
When you decide to enter this minefield and design a survey, how do you avoid falling intothe trap of inaccuracy and bias? How do you ensure that your survey research design reflects theviews of a genuine cross-section of the population? The simple answer is that you cannot; evenwith unlimited budget, time and resources, there is no way of achieving 100% accuracy. Opinions,on all levels, are very fluid and can change on a daily or even hourly basis.
Despite this, surveys are still a powerful tool and can be an extremely powerful researchtool. As long as you design your survey well and are prepared to be self-critical, you can still obtainan accurate representation of opinion.
Establishing the Aims of Your Research
This is the single most important step of your survey research design and can make or breakyour research; every single element of your survey must refer back to this design or it will befatally flawed. If your research is too broad, you will have to ask too many questions; too narrowand you will not be researching the topic thoroughly enough.
Researching and Determining Your Sample Group
This is the next crucial step in determining your survey and depends upon many factors.The first is accuracy; you want to try and interview as broad a base of people as possible. Quantityis not always the answer; if you were researching a detergent, for example, you would want totarget your questions at those who actually use such products.
For a political or ethical survey, about which anybody can have a valid opinion, you want totry and represent a well balanced cross section of society. It is always worth checking beforehandwhat quantity and breadth of response you need to provide significant results or your hard workmay be in vain.
School of Distance Education
Business Research Methods 49
Methodology
How do you make sure that your questionnaire reaches the target group? There are manymethods of reaching people but all have advantages and disadvantages. For a college or universitystudy it is unlikely that you will have the facilities to use internet, e-mail or phone surveying so wewill concentrate on only the likely methods you will use.
Face to Face
This is probably the most traditional method of the survey research design. It can be veryaccurate. It allows you to be selective about to whom you ask questions and you can explainanything that they do not understand. In addition, you can make a judgment about who you think iswasting your time or giving stupid answers. There are a few things to be careful of with thisapproach; firstly, people can be reluctant to give up their time without some form of incentive.Another factor to bear in mind is that is difficult to ask personal questions face to face withoutembarrassing people. It is also very time consuming and difficult to obtain a representative sample.Finally, if you are going to be asking questions door-to-door, it is essential to ensure that you havesome official identification to prove who you are.
This does not necessarily mean using the postal service; putting in the legwork anddelivering questionnaires around a campus or workplace is another method. This is a good way oftargeting a certain section of people and is excellent if you need to ask personal or potentiallyembarrassing questions.
The problems with this method are that you cannot be sure of how many responses you willreceive until a long time period has passed. You must also be wary of collecting personal data;most countries have laws about how much information you can keep about people so it is alwayswise to check with somebody more knowledgeable.
Questionnaire
Questionnaire is a document containing a list of questions designed to solicit informationfrom respondents appropriate for analysis.
Questionnaire Objectives
• Translate the information needed into a set of specific questions
• Motivate, and encourage the respondent to become involved in the interview, to cooperate,and to complete the interview.
• Minimize response error.
School of Distance Education
Business Research Methods 50
Structuring and Designing the Questionnaire
The design of your questionnaire depends very much upon the type of survey and the targetaudience. If you are asking questions face to face it is easy to explain if people are unsure of aquestion. On the other hand, if your questionnaire is going to include many personal questions thenmailing methods are preferable (but may violate local legislation). You must keep yourquestionnaire as short as possible; people will either refuse to fill in a long questionnaire or getbored halfway through. If you do have lots of information then it may be preferable to offermultiple-choice or rating questions to make life easier.
Cover Note
It is also polite, especially with mailed questionnaires, to send a short cover note explainingwhat you are doing and how the subject should return the surveys to you. You should introduceyourself; explain why you are doing the research, what will happen with the results and who tocontact if the subject has any queries.
Developing a Questionnaire
There are no hard and fast rules, only guidelines can be provided in developing a questionnaire.
Major Decisions
What
How
Sequence
Questionnaire Layout
Pretested and Revised?
Question Content
• Should this question be asked?
• Is the question of proper scope and coverage?
• Can the participant adequately answer this question, as asked?
• Will the participant willingly answer this question, as asked?
Type of Questions
Open-Ended questions
• The respondent is asked to provide his or her own answers.
• Open-ended questions must be coded before they can be processed for computer analysis.
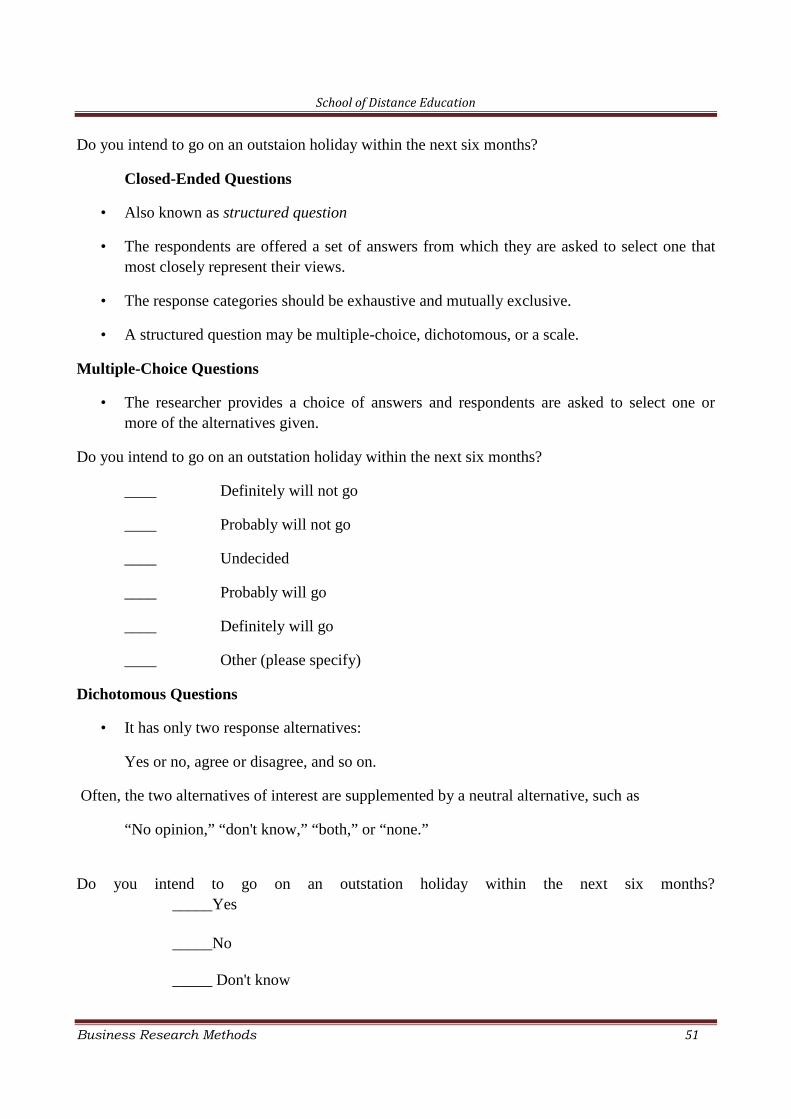
School of Distance Education
Business Research Methods 51
Do you intend to go on an outstaion holiday within the next six months?
Closed-Ended Questions
• Also known as structured question
• The respondents are offered a set of answers from which they are asked to select one thatmost closely represent their views.
• The response categories should be exhaustive and mutually exclusive.
• A structured question may be multiple-choice, dichotomous, or a scale.
Multiple-Choice Questions
• The researcher provides a choice of answers and respondents are asked to select one ormore of the alternatives given.
Do you intend to go on an outstation holiday within the next six months?
____ Definitely will not go
____ Probably will not go
____ Undecided
____ Probably will go
____ Definitely will go
____ Other (please specify)
Dichotomous Questions
• It has only two response alternatives:
Yes or no, agree or disagree, and so on.
Often, the two alternatives of interest are supplemented by a neutral alternative, such as
“No opinion,” “don't know,” “both,” or “none.”
Do you intend to go on an outstation holiday within the next six months?_____Yes
_____No
_____ Don't know
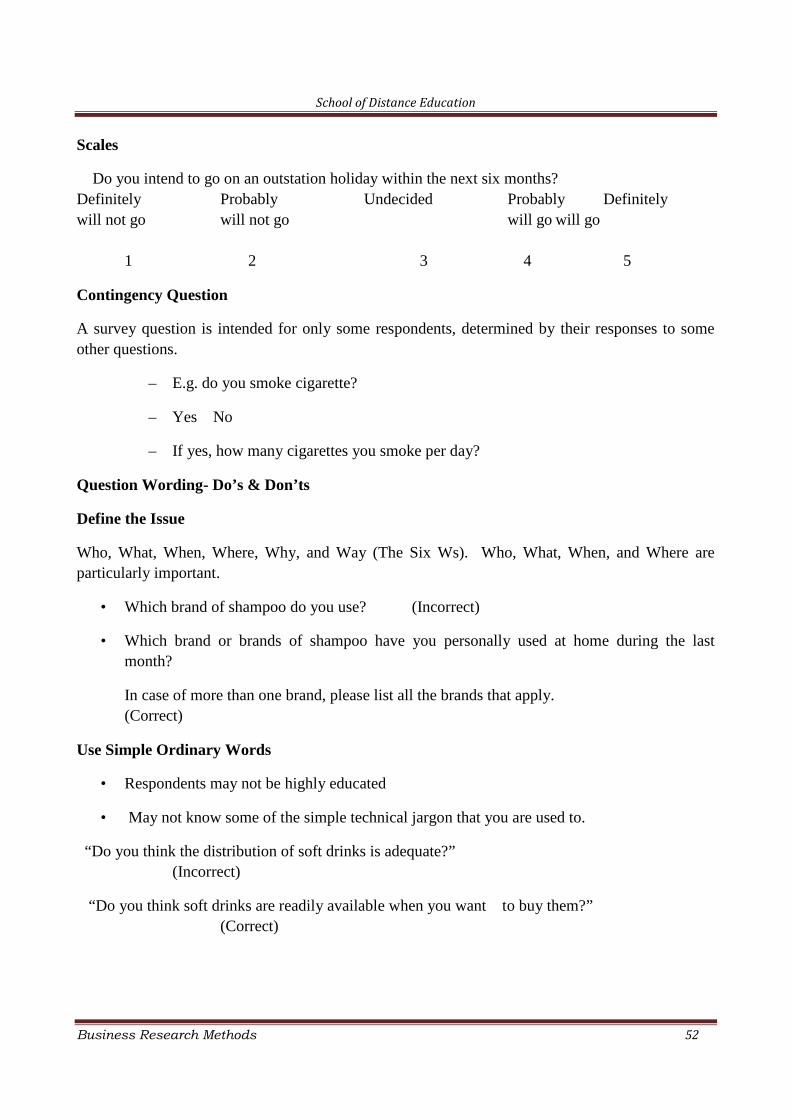
School of Distance Education
Business Research Methods 52
Scales
Do you intend to go on an outstation holiday within the next six months?Definitely Probably Undecided Probably Definitelywill not go will not go will go will go
1 2 3 4 5
Contingency Question
A survey question is intended for only some respondents, determined by their responses to someother questions.
– E.g. do you smoke cigarette?
– Yes No
– If yes, how many cigarettes you smoke per day?
Question Wording- Do’s & Don’ts
Define the Issue
Who, What, When, Where, Why, and Way (The Six Ws). Who, What, When, and Where areparticularly important.
• Which brand of shampoo do you use? (Incorrect)
• Which brand or brands of shampoo have you personally used at home during the lastmonth?
In case of more than one brand, please list all the brands that apply.(Correct)
Use Simple Ordinary Words
• Respondents may not be highly educated
• May not know some of the simple technical jargon that you are used to.
“Do you think the distribution of soft drinks is adequate?”(Incorrect)
“Do you think soft drinks are readily available when you want to buy them?”(Correct)
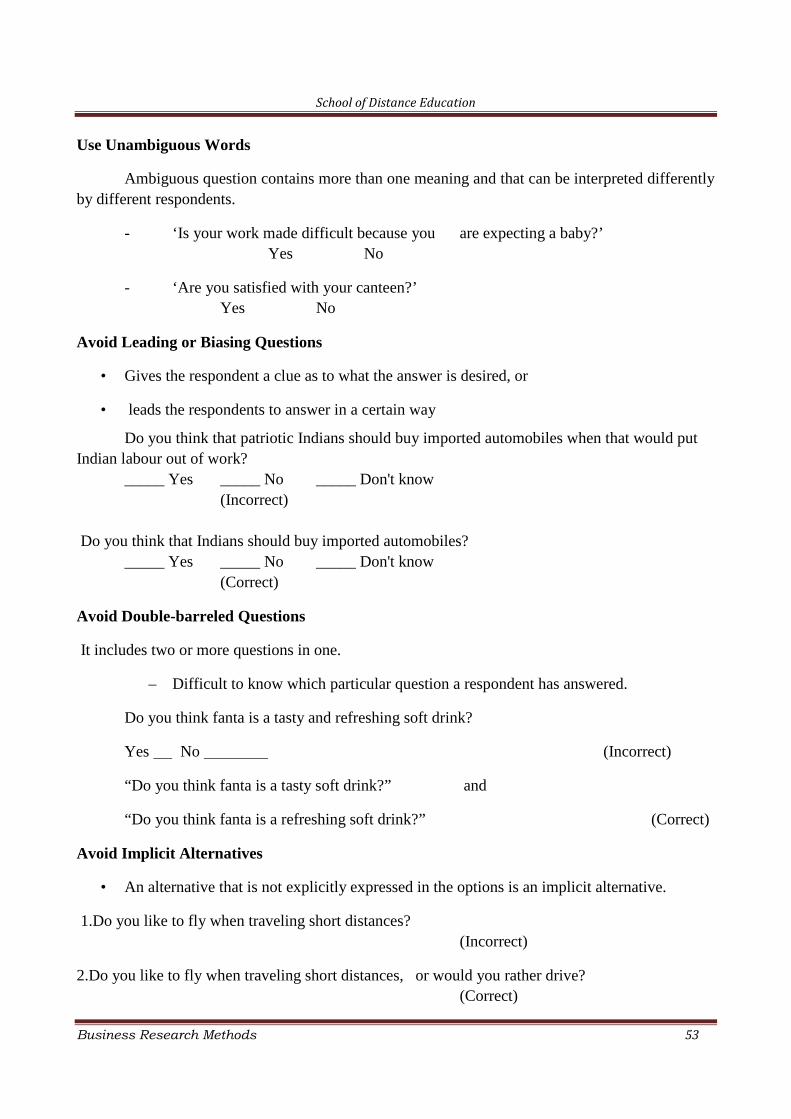
School of Distance Education
Business Research Methods 53
Use Unambiguous Words
Ambiguous question contains more than one meaning and that can be interpreted differentlyby different respondents.
- ‘Is your work made difficult because you are expecting a baby?’Yes No
- ‘Are you satisfied with your canteen?’Yes No
Avoid Leading or Biasing Questions
• Gives the respondent a clue as to what the answer is desired, or
• leads the respondents to answer in a certain way
Do you think that patriotic Indians should buy imported automobiles when that would putIndian labour out of work?
_____ Yes _____ No _____ Don't know(Incorrect)
Do you think that Indians should buy imported automobiles?_____ Yes _____ No _____ Don't know
(Correct)
Avoid Double-barreled Questions
It includes two or more questions in one.
– Difficult to know which particular question a respondent has answered.
Do you think fanta is a tasty and refreshing soft drink?
Yes No (Incorrect)
“Do you think fanta is a tasty soft drink?” and
“Do you think fanta is a refreshing soft drink?” (Correct)
Avoid Implicit Alternatives
• An alternative that is not explicitly expressed in the options is an implicit alternative.
1.Do you like to fly when traveling short distances?(Incorrect)
2.Do you like to fly when traveling short distances, or would you rather drive?(Correct)
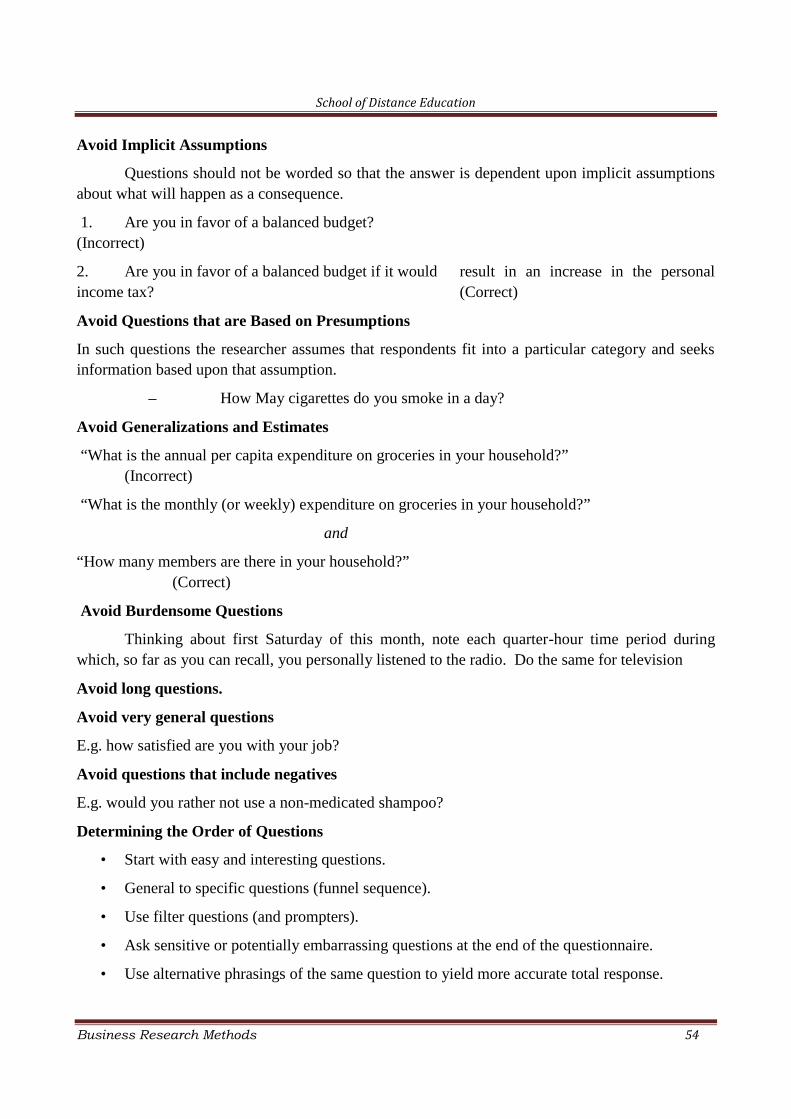
School of Distance Education
Business Research Methods 54
Avoid Implicit Assumptions
Questions should not be worded so that the answer is dependent upon implicit assumptionsabout what will happen as a consequence.
1. Are you in favor of a balanced budget?(Incorrect)
2. Are you in favor of a balanced budget if it would result in an increase in the personalincome tax? (Correct)
Avoid Questions that are Based on Presumptions
In such questions the researcher assumes that respondents fit into a particular category and seeksinformation based upon that assumption.
– How May cigarettes do you smoke in a day?
Avoid Generalizations and Estimates
“What is the annual per capita expenditure on groceries in your household?”(Incorrect)
“What is the monthly (or weekly) expenditure on groceries in your household?”
and
“How many members are there in your household?”(Correct)
Avoid Burdensome Questions
Thinking about first Saturday of this month, note each quarter-hour time period duringwhich, so far as you can recall, you personally listened to the radio. Do the same for television
Avoid long questions.
Avoid very general questions
E.g. how satisfied are you with your job?
Avoid questions that include negatives
E.g. would you rather not use a non-medicated shampoo?
Determining the Order of Questions
• Start with easy and interesting questions.
• General to specific questions (funnel sequence).
• Use filter questions (and prompters).
• Ask sensitive or potentially embarrassing questions at the end of the questionnaire.
• Use alternative phrasings of the same question to yield more accurate total response.
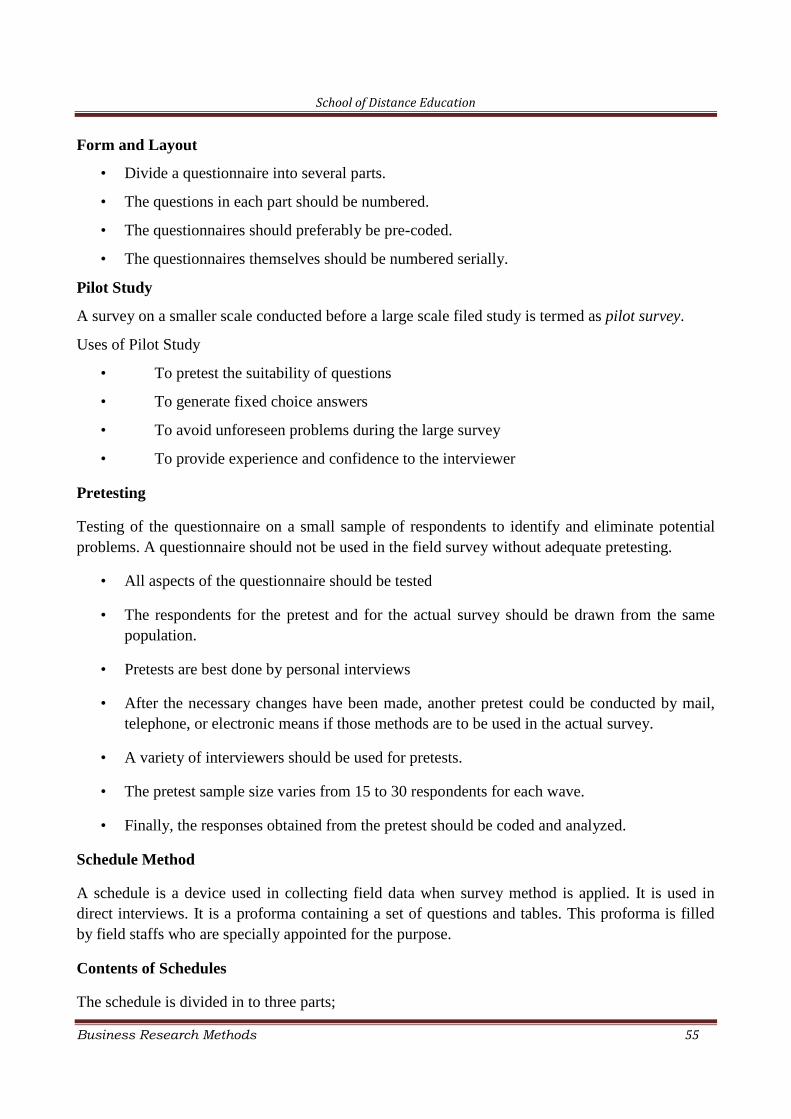
School of Distance Education
Business Research Methods 55
Form and Layout
• Divide a questionnaire into several parts.
• The questions in each part should be numbered.
• The questionnaires should preferably be pre-coded.
• The questionnaires themselves should be numbered serially.
Pilot Study
A survey on a smaller scale conducted before a large scale filed study is termed as pilot survey.
Uses of Pilot Study
• To pretest the suitability of questions
• To generate fixed choice answers
• To avoid unforeseen problems during the large survey
• To provide experience and confidence to the interviewer
Pretesting
Testing of the questionnaire on a small sample of respondents to identify and eliminate potentialproblems. A questionnaire should not be used in the field survey without adequate pretesting.
• All aspects of the questionnaire should be tested
• The respondents for the pretest and for the actual survey should be drawn from the samepopulation.
• Pretests are best done by personal interviews
• After the necessary changes have been made, another pretest could be conducted by mail,telephone, or electronic means if those methods are to be used in the actual survey.
• A variety of interviewers should be used for pretests.
• The pretest sample size varies from 15 to 30 respondents for each wave.
• Finally, the responses obtained from the pretest should be coded and analyzed.
Schedule Method
A schedule is a device used in collecting field data when survey method is applied. It is used indirect interviews. It is a proforma containing a set of questions and tables. This proforma is filledby field staffs who are specially appointed for the purpose.
Contents of Schedules
The schedule is divided in to three parts;
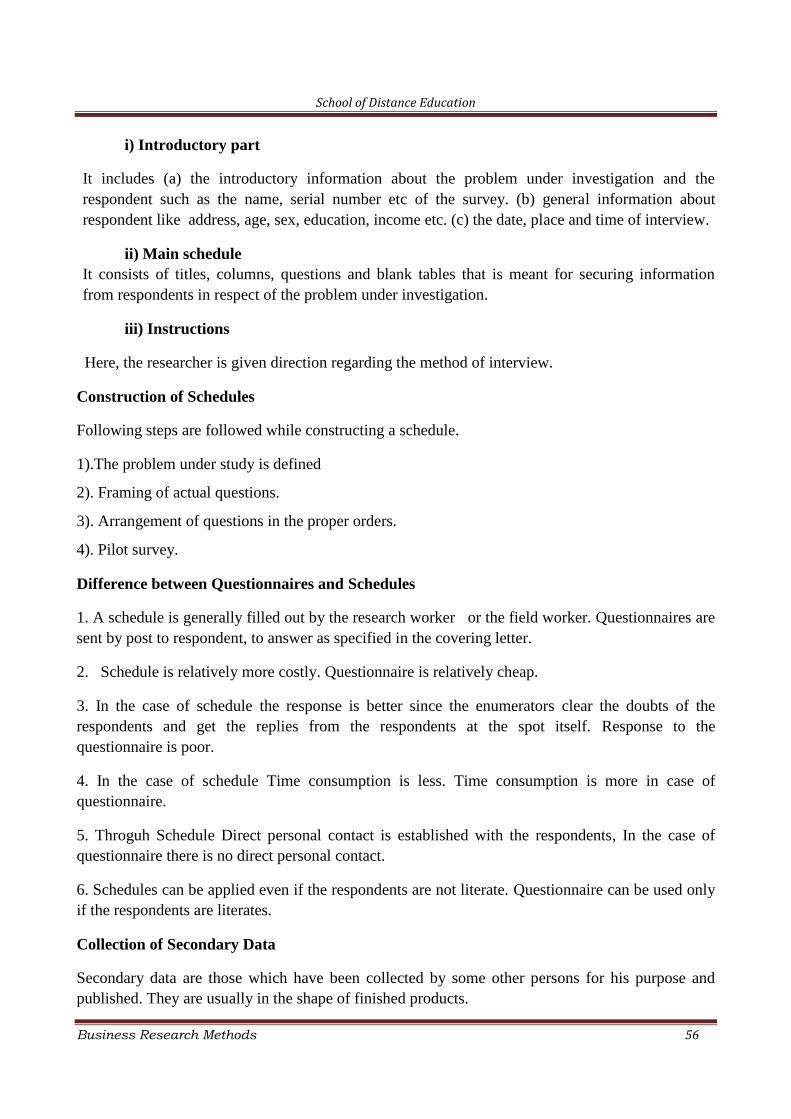
School of Distance Education
Business Research Methods 56
i) Introductory part
It includes (a) the introductory information about the problem under investigation and therespondent such as the name, serial number etc of the survey. (b) general information aboutrespondent like address, age, sex, education, income etc. (c) the date, place and time of interview.
ii) Main scheduleIt consists of titles, columns, questions and blank tables that is meant for securing informationfrom respondents in respect of the problem under investigation.
iii) Instructions
Here, the researcher is given direction regarding the method of interview.
Construction of Schedules
Following steps are followed while constructing a schedule.
1).The problem under study is defined
2). Framing of actual questions.
3). Arrangement of questions in the proper orders.
4). Pilot survey.
Difference between Questionnaires and Schedules
1. A schedule is generally filled out by the research worker or the field worker. Questionnaires aresent by post to respondent, to answer as specified in the covering letter.
2. Schedule is relatively more costly. Questionnaire is relatively cheap.
3. In the case of schedule the response is better since the enumerators clear the doubts of therespondents and get the replies from the respondents at the spot itself. Response to thequestionnaire is poor.
4. In the case of schedule Time consumption is less. Time consumption is more in case ofquestionnaire.
5. Throguh Schedule Direct personal contact is established with the respondents, In the case ofquestionnaire there is no direct personal contact.
6. Schedules can be applied even if the respondents are not literate. Questionnaire can be used onlyif the respondents are literates.
Collection of Secondary Data
Secondary data are those which have been collected by some other persons for his purpose andpublished. They are usually in the shape of finished products.
School of Distance Education
Business Research Methods 57
Advantages of Secondary data
1. The information can be collected by incurring least cost.
2. The time requires for obtaining the information is very less.
3. Most of the secondary data are those published by big institutions. So they contain largequantity of information..
Disadvantages of Secondary data
1. Since the secondary data is a result of some other person’s attempt, it need not be suitablefor a researcher, who makes use of it.
2. It may be inaccurate and unreliable.
3. It may contain certain errors.
Precautions to be Taken before Using Secondary Data
1. Suitability: - The investigator should satisfy him that the data available are suitable for theenquiry on hand.
2. Adequacy: - the adequacy of the data should be tested by studying the items covered by theoriginal enquiry and the items to be covered by the enquiry.
3. Reliability:- The reliability of secondary data should be tested
Sources of Secondary Data
There are varieties of published sources from which one can get information for his research work.The important such sources are;
1. Official report of the central, state and local government.
2. Official publications of the foreign governments and international bodies like UNO and itssubordinate bodies.
3. Reports and publications of Trade Associations, Banks, Cooperative Societies and SimilarSemi Government and Autonomous Organizations.
4. Technical journals, News papers, Books, Periodicals, etc
5. Publications of research Organizations, Centers, Institutes, and reports submitted byEconomists, Research scholars etc.
Difference between Primary data and Secondary data
1. Primary data is Original in character. Secondary data is Not original
2. Collection of data is expensive in the case of primary data. Collection of secondary data isless expensive.
3. Primary data is in the shape of raw materials. Secondary data is the shape of finishedproducts.
School of Distance Education
Business Research Methods 58
4. Primary data is adequate and suitable. Secondary data need no be ample and apposite.
Choice between Primary and Secondary Method
The following factors are to be considered while choosing between primary and secondarymethods.
1. Nature and scope of enquiry
2. Availability of time and money
3. Degree of accuracy desired.
4. Status of the investigator
Case Study
Case study is a method of exploring and analyzing the life of a social unit, the social unit may be aperson or a family or an institution or an organization or even a community. It is a method ofcollecting information and its analysis. It is a way of organizing social data so as to preserve theunitary character of the social object, being studied.
Sources of Case Study
The sources from which information are collected in a case study are;
1) Personal documents
They contain the description of the remarkable events of the life of the narrator as well as hisreactions towards them. Therefore from these personal documents, one can study the writer’spersonality, social relationship and philosophy of life.
2) Life history
Through interviews with a respondent, his life history can be known. This is an objective studyin which various events of respondent’s life are studied with an attempt to find theirsignificance for the society.
Phases of Case Study
1. The researcher has to select the problem had to study the problem.
2. The researcher ha to describe the course of events.
3. Materials about each of the units or aspects are collected.
4. There are certain factors which are responsible for every event. They must be identified andstudied.
5. The role of the factors responsible for the events is analyzed and conclusions are drawnabout the effect of the factors.
School of Distance Education
Business Research Methods 59
CHAPTER-5
DATA PROCESSIING
Data continues to be in raw form, unless and until they are processed and analyzed.Processing is a statistical method by which the collected data is so organized the further analysisand interpretation of data become easy. It is an intermediary stage between the collection of dataand their analysis and interpretation.
Processing stages
There are four important stages in the processing of data. They are;
1. Editing
2. Coding
3. Classification
4. tabulation
Editing
As soon as the researcher receives the data, he should screen it for accuracy. Editing is theprocess of examining the data collected through various methods to detect errors and omissions andcorrect them for further analysis. Though editing, it is ensured that the collected data are accurate,consistent with other facts gathered, uniformly entered and well arranged so that further analysis ismade easier
Practical guidelines for editing
While editing care has to be taken to see that the data are as accurate and complete as possible.The following points are to be noted;
1. The editor should familiarize with the copy of instructions given to the interviewers.
2. The original entry, if found incorrect, should not be destroyed or erased. On the other hand,it should be crossed out in such a manner that it is still eligible.
3. Any, modification to the original entry by the editor must be specifically indicated.
4. All completed schedules must bear signature of the editor an d the date.
5. Incorrect answer to the questions can be corrected only if the editor is absolutely sure of theanswer, otherwise leave it as such.
6. Inconsistent, incomplete or missing answers should not be used.
7. Sere that all numerical answers are converted to same units.
School of Distance Education
Business Research Methods 60
Coding
Coding is the process by which r response categories are summarized by numerals or othersymbols to carry out subsequent operations of data analysis. This process of assigning numerals orsymbols to the responses is called coding. It facilitates efficient analysis of the collected data andhelps in reducing several replies to a small number of classes which contain the critical informationrequired for analysis. In general it reduces the huge amount of information collected in to a formthat is amenable to analysis.
Steps in coding
1. Study the answers carefully.
2. Develop a coding frame by listing the answers and by aligning codes to each of them.
3. Prepare a coding manual with the detail of variable names, codes and instructions.
4. If the coding manual has already been prepared before the collection of the data, make therequired additions for the open ended and partially coded questions.
Coding rules
1. Give each respondent a code number for identification.
2. Provide code number for each question.
3. All responses including ‘don’t know’, ‘no opinion’. Etc is to be coded.
4. Assign additional codes to partially coded questions.
Classification
Classification is the process of reducing large mass of data in to homogeneous groups formeaningful analysis. It converts data from complex to understandable and unintelligible tointelligible forms. It divides data in to different groups or classes according to their similarities anddissimilarities. When the data are classified, they give summary of whole information.
Objectives of classification
1. To organize data in to concise, logical and intelligible form.
2. To take the similarities and dissimilarities s between various classes clear.
3. To facilitate comparison between various classes of data.
4. To help the researcher in understanding the significance of various classes of data.
5. To facilitate analysis and formulate generalizations.
School of Distance Education
Business Research Methods 61
Types of classification
A. Classification according to external characteristics
In this classification, data may be classified either on geographical basis or periodical basis.
Classification on geographical basis
In this type of classification, the data that are collected from different places are placed in differentclasses.
Classification on periodical basis (chronological classification)
In this type of classification, the data belonging to a particular time or period are put under oneclass. This type of classification is based on period.
B. Classification according to internal characteristics
Data may be classified either according to attributes or according to the magnitude of variables
Classification according to Attributes
In this type data are classified on the basis of some attributes an characteristics.
Simple Classification
If the classification is based on one particular attribute only it is called simple classification.
Eg; classification on the basis of sex.
Manifold Classification
If the classification is based on more than one or several attributes it is called manifold or multipleclassifications. in this data are classified in several groups.
C. Classification according variables
Here the data are classified to some characteristics that can be measured. Data are classified onthe basis of quantitative characteristics such as age, height; weight etc. quantitative variables aregrouped in to two
a) Discrete variableIf the variables can take only exact value, it is called discrete variable.
b) Continuous variableThe variables that can take any numerical value within a specified range are calledcontinuous variable.
School of Distance Education
Business Research Methods 62
Characteristics of an ideal classification
1. Unambiguity- Classification should be unambiguous. The various classes should be definedproperly.
2. Stable- it should not change from enquiry to enquiry
3. Flexibility- classification should have the capacity of adjustment to new situations andcircumstances.
4. Homogeneity- each class should contain homogenous items.
5. Suitability- it should be suitable to objects of any statistical enquiry.
6. Exhaustiveness- there should be no item which does not find a class.
Tabulation
Tabulation is the next step to classification. It is an orderly arrangement of data in rows andcolumns. It is defined as the “measurement of data in columns and rows”. Data presented in tabularform is much easier to read and understand than the data presented in the text the main purpose oftabulation is to prepare the data for final analysis. It is a stage between classification of data andfinal analysis.
Objectives of Tabulation
1. To clarify the purpose of enquiry
2. To make the significance of data clear.
3. To express the data in least possible space.
4. To enable comparative study.
5. To eliminate unnecessary data
6. To help in further analysis of the data.
Types of Tables
Simple Table
Here the data are presented only for one variable or characteristic. Any frequency distribution of asingle variable is simple table
Complex table
In complex table, two or more characteristics are shown. If the study is related to more than twovariables, it is called multivariate analysis. They may be of the following tables.
School of Distance Education
Business Research Methods 63
(a) One- way table
In this type of table, data of only one characteristic will be shown. It means that when one type ofinformation is secured about different groups or individuals, it can be displayed with the help ofone- way table
(b) Two- way table
When mutually related attributes of a phenomenon are to be displayed, two way tables are used. Inother words, this table shows two types of characteristics.
(c) Three-way table
It displays three types of attributes. It is used when three inter- related or mutually related attributesor characteristics of a phenomenon are to be displayed,.
(d) Manifold tables
When information about different mutually attributes or characteristics of a phenomenon are to bedisplayed, manifold table is used. Such tables display information about various characteristics orattributes.
Parts of a statistical table
Following are the important parts of a statistical table.
1. Title of the table
The title of the table is placed above the table. If there are more than one table in a research, eachshould bear a number for easy reference.
2. Caption or title of the column
It is also termed as “box head”. There may be sub- captions under the main caption.
3. Stub (row heading)
Stub refers to the title given to rows
4. Body (main data)
This is the main body of information needed for the research work.
5. End note (foot note)
This is placed below the table to convey the expansions of abbreviations to caption, stub or mainbody.
6. Source note
If the table is based on outside information, it should be mentioned in the source note below.
School of Distance Education
Business Research Methods 64
Descriptive Analysis under Different Types of Measurement
A good understanding of the concepts related to scale so measurement of variable is imperativeas it is the sole base on which decision about the choice of statistical tools for analysis rests.Separate tools of analysis need to be applied depending upon how the variables are measurednamely, nominal, ordinal, interval, and ratio scales.
1. Nominal Measurement
These are the variable that is measured only nominally. In nominal measurement the numericalvalues just "name" the attribute uniquely. No ordering of the cases is implied. The nominal type,sometimes also called the qualitative type, differentiates between items or subjects based only ontheir names and categories and other qualitative classifications they belong to. Examples includegender, nationality, ethnicity, language, genre, style, biological species, visual pattern, and form(gestalt)....
2. Ordinal Measurement
In ordinal measurement the attributes can be rank-ordered. Here, distances between attributesdo not have any meaning. The ordinal type allows for rank order (1st, 2nd, 3rd, etc.) by which datacan be sorted, but still does not allow for relative degree of difference between them. Herecomparisons of greater and less than can be made, in addition to equality and inequality.
3. Interval Measurement
In interval measurement the distance between attributes does have meaning. For example,when we measure temperature (in Fahrenheit), the distance from 30-40 is same as distance from70-80. The interval between values is interpretable. Because of this, it makes sense to compute anaverage of an interval variable, where it doesn't make sense to do so for ordinal scales. But note thatin interval measurement ratios don't make any sense - 80 degrees is not twice as hot as 40 degrees(although the attribute value is twice as large).
4. Ratio Measurement
Practically all quantitative data is recorded on the ratio level of measurement. The ratio level isthe “highest” level of measurement. It has all the characteristics of the interval level, but inaddition, the 0 point is meaningful and the ratio between two numbers is meaningful. Examples ofthe ratio scale of measurement include wages, units of production, weight, changes in stock prices,distance between branch offices, and height.
Common Descriptive Techniques
The most common descriptive statistics used in research consist of percentages and frequencytables
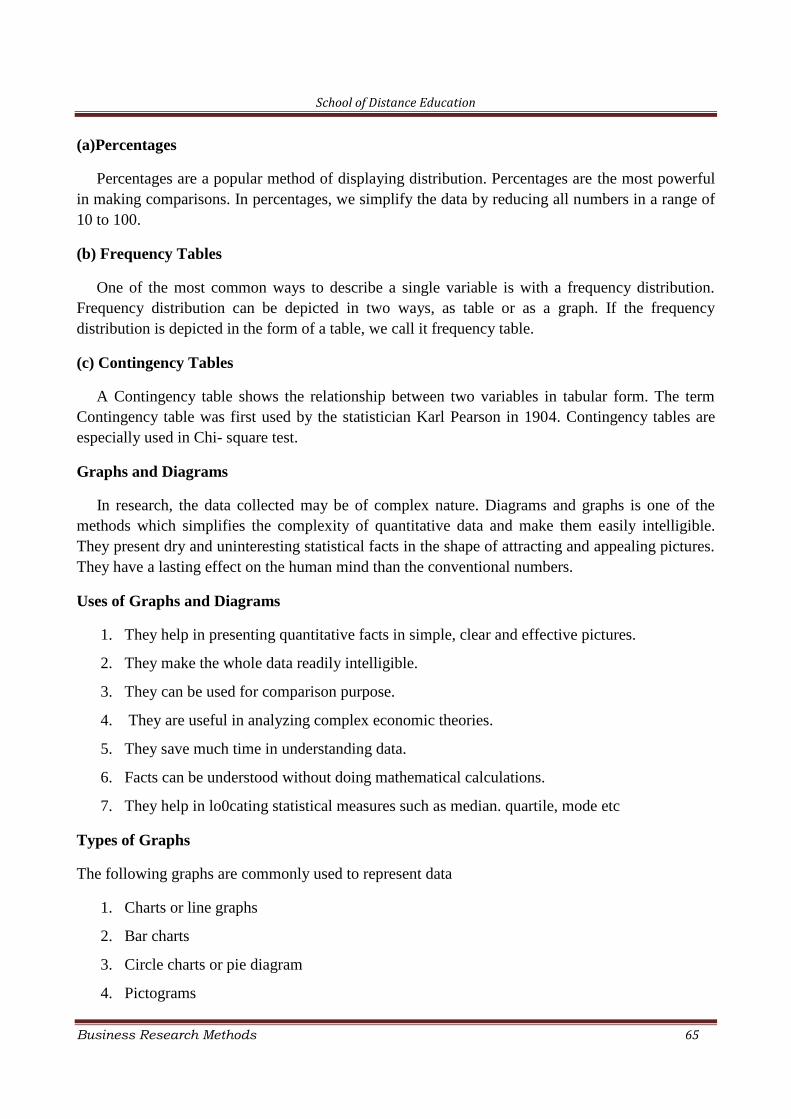
School of Distance Education
Business Research Methods 65
(a)Percentages
Percentages are a popular method of displaying distribution. Percentages are the most powerfulin making comparisons. In percentages, we simplify the data by reducing all numbers in a range of10 to 100.
(b) Frequency Tables
One of the most common ways to describe a single variable is with a frequency distribution.Frequency distribution can be depicted in two ways, as table or as a graph. If the frequencydistribution is depicted in the form of a table, we call it frequency table.
(c) Contingency Tables
A Contingency table shows the relationship between two variables in tabular form. The termContingency table was first used by the statistician Karl Pearson in 1904. Contingency tables areespecially used in Chi- square test.
Graphs and Diagrams
In research, the data collected may be of complex nature. Diagrams and graphs is one of themethods which simplifies the complexity of quantitative data and make them easily intelligible.They present dry and uninteresting statistical facts in the shape of attracting and appealing pictures.They have a lasting effect on the human mind than the conventional numbers.
Uses of Graphs and Diagrams
1. They help in presenting quantitative facts in simple, clear and effective pictures.
2. They make the whole data readily intelligible.
3. They can be used for comparison purpose.
4. They are useful in analyzing complex economic theories.
5. They save much time in understanding data.
6. Facts can be understood without doing mathematical calculations.
7. They help in lo0cating statistical measures such as median. quartile, mode etc
Types of Graphs
The following graphs are commonly used to represent data
1. Charts or line graphs
2. Bar charts
3. Circle charts or pie diagram
4. Pictograms
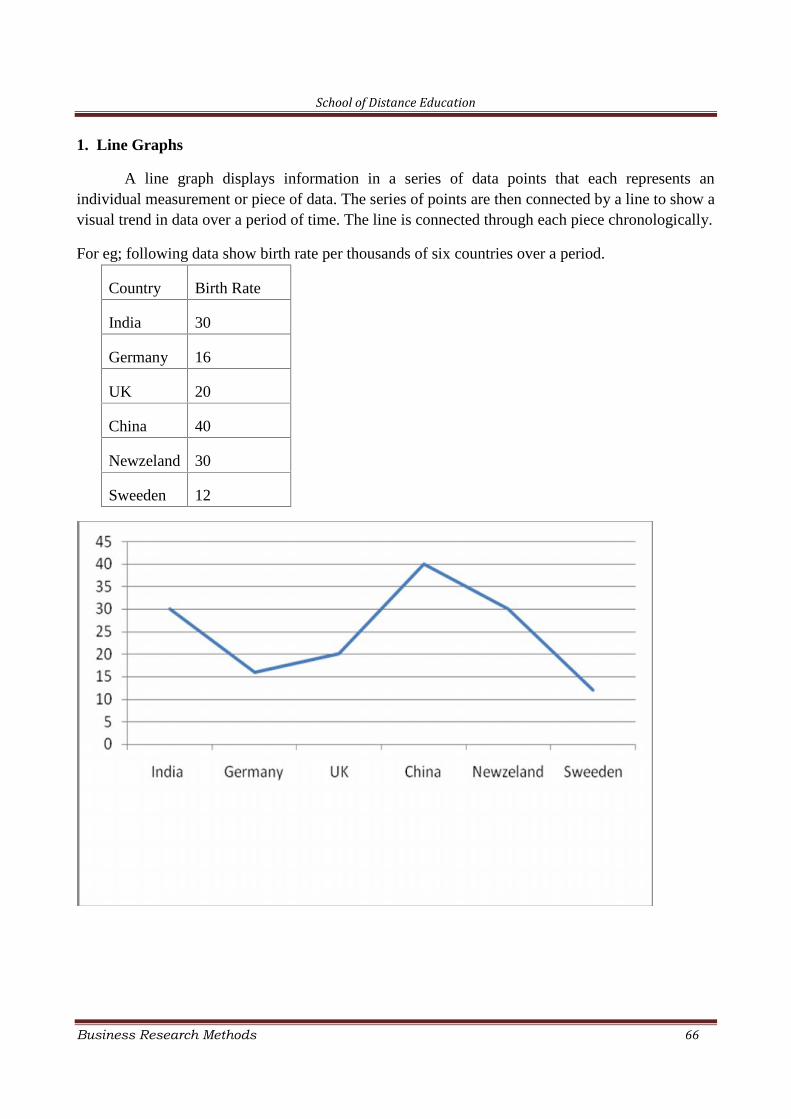
School of Distance Education
Business Research Methods 66
1. Line Graphs
A line graph displays information in a series of data points that each represents anindividual measurement or piece of data. The series of points are then connected by a line to show avisual trend in data over a period of time. The line is connected through each piece chronologically.
For eg; following data show birth rate per thousands of six countries over a period.
Country Birth Rate
India 30
Germany 16
UK 20
China 40
Newzeland 30
Sweeden 12
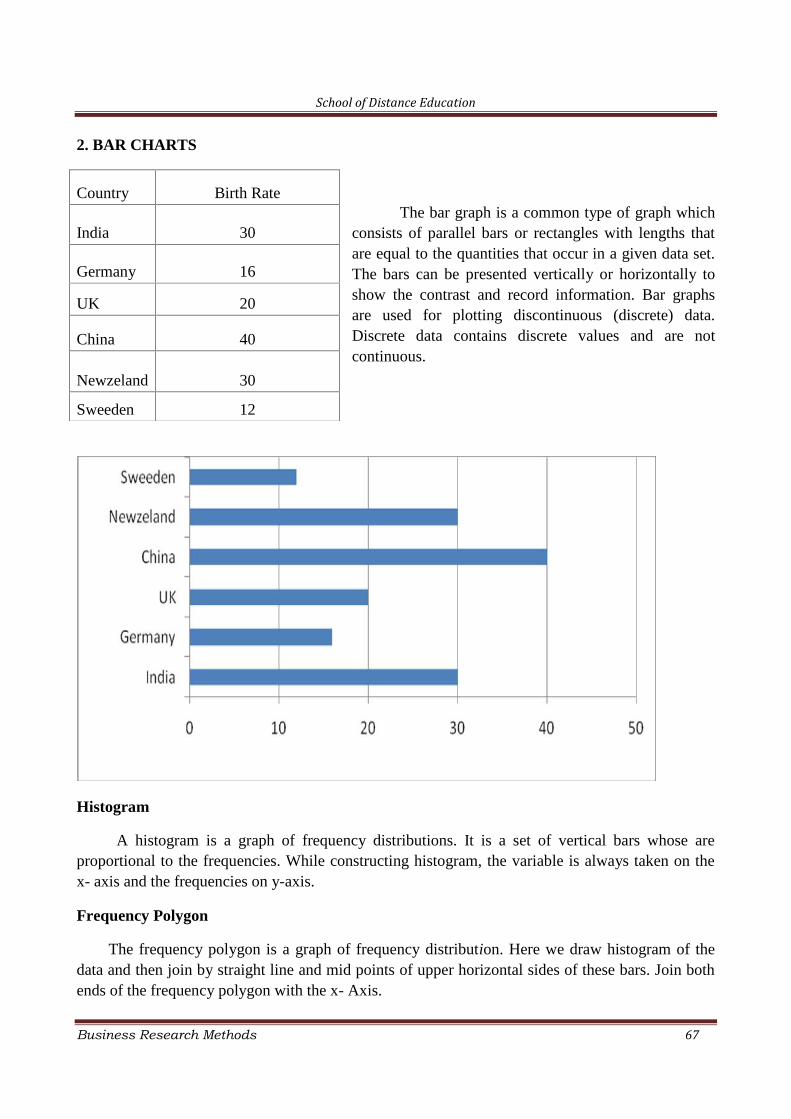
School of Distance Education
Business Research Methods 67
2. BAR CHARTS
The bar graph is a common type of graph whichconsists of parallel bars or rectangles with lengths thatare equal to the quantities that occur in a given data set.The bars can be presented vertically or horizontally toshow the contrast and record information. Bar graphsare used for plotting discontinuous (discrete) data.Discrete data contains discrete values and are notcontinuous.
Histogram
A histogram is a graph of frequency distributions. It is a set of vertical bars whose areproportional to the frequencies. While constructing histogram, the variable is always taken on thex- axis and the frequencies on y-axis.
Frequency Polygon
The frequency polygon is a graph of frequency distribution. Here we draw histogram of thedata and then join by straight line and mid points of upper horizontal sides of these bars. Join bothends of the frequency polygon with the x- Axis.
Country Birth Rate
India 30
Germany 16
UK 20
China 40
Newzeland 30
Sweeden 12
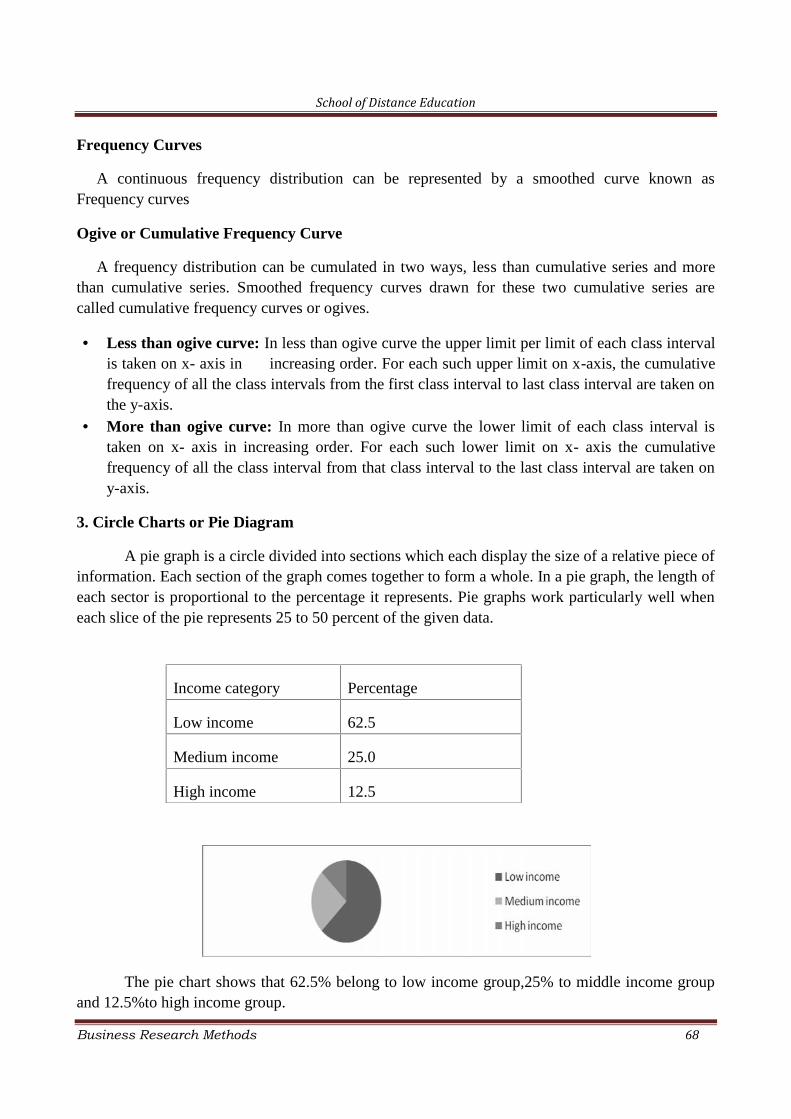
School of Distance Education
Business Research Methods 68
Frequency Curves
A continuous frequency distribution can be represented by a smoothed curve known asFrequency curves
Ogive or Cumulative Frequency Curve
A frequency distribution can be cumulated in two ways, less than cumulative series and morethan cumulative series. Smoothed frequency curves drawn for these two cumulative series arecalled cumulative frequency curves or ogives.
Less than ogive curve: In less than ogive curve the upper limit per limit of each class intervalis taken on x- axis in increasing order. For each such upper limit on x-axis, the cumulativefrequency of all the class intervals from the first class interval to last class interval are taken onthe y-axis.
More than ogive curve: In more than ogive curve the lower limit of each class interval istaken on x- axis in increasing order. For each such lower limit on x- axis the cumulativefrequency of all the class interval from that class interval to the last class interval are taken ony-axis.
3. Circle Charts or Pie Diagram
A pie graph is a circle divided into sections which each display the size of a relative piece ofinformation. Each section of the graph comes together to form a whole. In a pie graph, the length ofeach sector is proportional to the percentage it represents. Pie graphs work particularly well wheneach slice of the pie represents 25 to 50 percent of the given data.
The pie chart shows that 62.5% belong to low income group,25% to middle income groupand 12.5%to high income group.
Income category Percentage
Low income 62.5
Medium income 25.0
High income 12.5
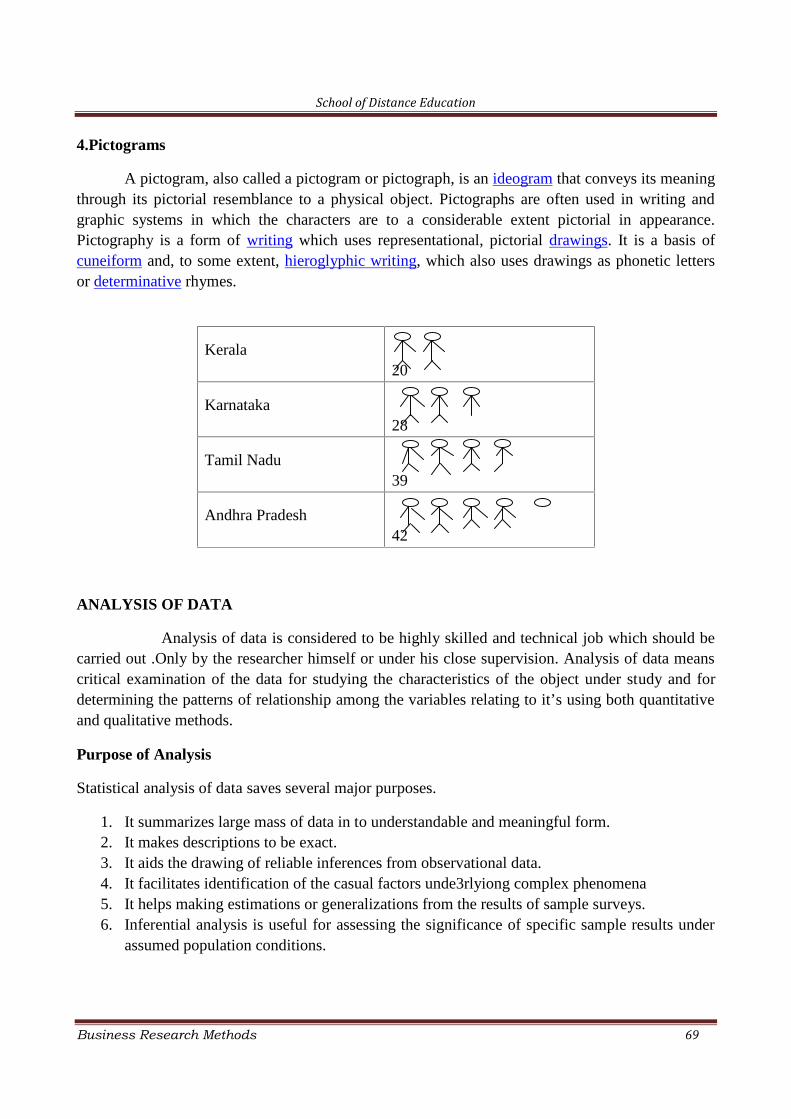
School of Distance Education
Business Research Methods 69
4.Pictograms
A pictogram, also called a pictogram or pictograph, is an ideogram that conveys its meaningthrough its pictorial resemblance to a physical object. Pictographs are often used in writing andgraphic systems in which the characters are to a considerable extent pictorial in appearance.Pictography is a form of writing which uses representational, pictorial drawings. It is a basis ofcuneiform and, to some extent, hieroglyphic writing, which also uses drawings as phonetic lettersor determinative rhymes.
Kerala20
Karnataka28
Tamil Nadu39
Andhra Pradesh42
ANALYSIS OF DATA
Analysis of data is considered to be highly skilled and technical job which should becarried out .Only by the researcher himself or under his close supervision. Analysis of data meanscritical examination of the data for studying the characteristics of the object under study and fordetermining the patterns of relationship among the variables relating to it’s using both quantitativeand qualitative methods.
Purpose of Analysis
Statistical analysis of data saves several major purposes.
1. It summarizes large mass of data in to understandable and meaningful form.2. It makes descriptions to be exact.3. It aids the drawing of reliable inferences from observational data.4. It facilitates identification of the casual factors unde3rlyiong complex phenomena5. It helps making estimations or generalizations from the results of sample surveys.6. Inferential analysis is useful for assessing the significance of specific sample results under
assumed population conditions.
School of Distance Education
Business Research Methods 70
Steps in Analysis
Different steps in research analysis consist of the following.
1. The first step involves construction of statistical distributions and calculation of simplemeasures like averages, percentages, etc.
2. The second step is to compare two or more distributions or two or more subgroups within adistribution.
3. Third step is to study the nature of relationships among variables.
4. Next step is to find out the factors which affect the relationship between a set of variables
5. Testing the validity of inferences drawn from sample survey by using parametric tests ofsignificance.
Types of Analysis
Statistical analysis may broadly classified as descriptive analysis and inferential analysis
Descriptive Analysis
Descriptive statistics are used to describe the basic features of the data in a study. Theyprovide simple summaries about the sample and the measures. Descriptive statistics is thediscipline of quantitatively describing the main features of a collection of data or the quantitativedescription itself. In such analysis there are univariate analysis bivariate analysis and multivariateanalysis.
• Univariate analysis
• Univariate analysis involves describing the distribution of a single variable, including its centraltendency (including the mean, median, and mode) and dispersion (including the range andquartiles of the data-set, and measures of spread such as the variance and standard deviation). Theshape of the distribution may also be described via indices such as skewness and kurtosis.Characteristics of a variable's distribution may also be depicted in graphical or tabular format,including histograms and stem-and-leaf display.
• Bivariate analysis
• Bivariate analysis is one of the simplest forms of the quantitative (statistical) analysis. It involvesthe analysis of two variables (often denoted as X, Y), for the purpose of determining the empiricalrelationship between them. Common forms of bivariate analysis involve creating a percentagetable or a scatter plot graph and computing a simple correlation coefficient
• Multivariate analysis.
• In multivariate analysis multiple relations between multiple variables are examined simultaneously.Multivariate analysis (MVA) is based on the statistical principle of multivariate statistics, whichinvolves observation and analysis of more than one statistical outcome variable at a time. In designand analysis, the technique is used to perform trade studies across multiple dimensions whiletaking into account the effects of all variables on the responses of interest
School of Distance Education
Business Research Methods 71
Inferential Analysis
Inferential statistics is concerned with making predictions or inferences about a population fromobservations and analyses of a sample. That is, we can take the results of an analysis using a sampleand can generalize it to the larger population that the sample represents. Ther are two areas ofstatistical inferences (a) statistiacal estimation and (b) the testing of hypothesis.
Tools and Statistical Methods For Analysis
The tools and technique of statistics can be studied under two divisions of statistics.
(A)Descriptive Statistics
In descriptive statistics we develop certain indices and measures of raw data. They are;
1. Measures of Central Tendency
2. Measures of Dispersion
3. Measures of skeweness and kurtosis
4. Measures of correlation
5. Regression analysis
6. Index numbers
7. Time series analysis
8. Coefficient of association1. Measures of Central Tendency.
The central tendency of a distribution is an estimate of the "center" of a distribution ofvalues. There are different types of estimates of central tendency such as mean, median, mode,geometric mean, and harmonic mean.
2. Measures of Dispersion.
Dispersion refers to the spread of the values around the central tendency. There are twocommon measures of dispersion, the range and the standard deviation. It can be used to comparethe variability in two statistical series
3. Measures of skewness and kurtosis
A fundamental task in many statistical analyses is to characterize the location andvariability of a data set. A further characterization of the data includes skewness and kurtosis.Skewness is a measure of symmetry, or more precisely, the lack of symmetry. A distribution, ordata set, is symmetric if it looks the same to the left and right of the center point. Kurtosis is ameasure of whether the data are peaked or flat relative to a normal distribution. That is, data setswith high kurtosis tend to have a distinct peak near the mean, decline rather rapidly, and have heavytails.
School of Distance Education
Business Research Methods 72
4. Measures of correlation
Correlation refers to any of a broad class of statistical relationships involving dependence.When there are two variables, the correlation between them is called simple correlation. Whenthere are more than two variables and we want to study relation between two of them only, treatingthe others as constant, the relation is called partial correlation. When there are more than twovariables and we want to study relation of one variable with all other variables together, the relationis called multiple correlations.
5. Regression analysis
Regression analysis is a statistical process for estimating the relationships among variables.It includes many techniques for modeling and analyzing several variables, when the focus is on therelationship between a dependent variable and one or more independent variables.
6. Index numbers
An index is a statistical measure of changes in a representative group of individual datapoints. Index numbers are designed to measure the magnitude of economic changes over time.Because they work in a similar way to percentages they make such changes easier to compare.
7. Time series analysis
A time series is a sequence of data points, measured typically at successive points in timespaced at uniform time intervals. Time series analysis comprises methods for analyzing time seriesdata in order to extract meaningful statistics and other characteristics of the data./
8. Coefficient of association
Coefficient of association like, Yule’s coefficient, measures the extent of associationbetween two attributes.
(B) Inferential Statistics
Inferential statistics deals with forecasting, estimating or judging some results of theuniverse based on some units selected from the universe. This process is called Sampling. Itfacilitates estimation of some population values known as parameters. It also deals with testing ofhypothesis to determine with what validity the conclusions are drawn.
Ratios, percentages and averages
In statistical analysis Ratios, percentages and weighted averages play a very important role.Ratios show the relation of one figure to another. For example, if the total number of students in aschool is 2000, and total number of teachers if\s 250, then the ratio between teachers and students is250:2000. To make it percentage, multiply by 100.
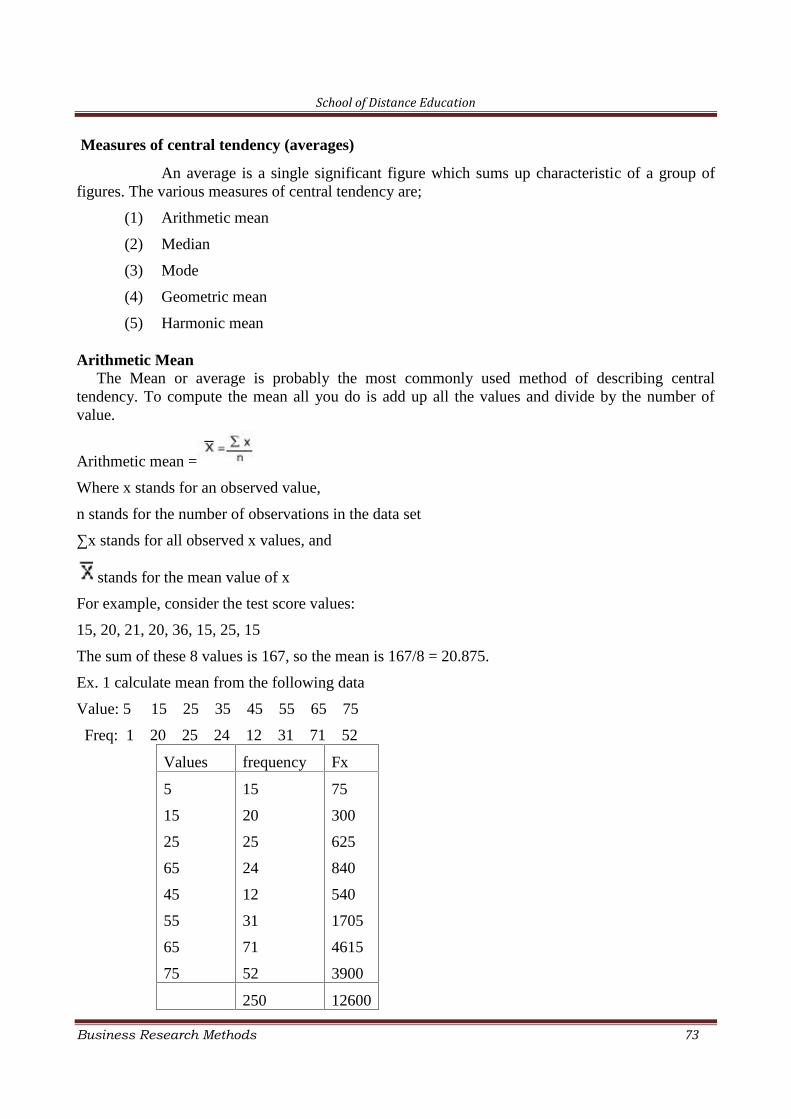
School of Distance Education
Business Research Methods 73
Measures of central tendency (averages)
An average is a single significant figure which sums up characteristic of a group offigures. The various measures of central tendency are;
(1) Arithmetic mean
(2) Median
(3) Mode
(4) Geometric mean
(5) Harmonic mean
Arithmetic MeanThe Mean or average is probably the most commonly used method of describing central
tendency. To compute the mean all you do is add up all the values and divide by the number ofvalue.
Arithmetic mean =
Where x stands for an observed value,
n stands for the number of observations in the data set
∑x stands for all observed x values, and
stands for the mean value of x
For example, consider the test score values:
15, 20, 21, 20, 36, 15, 25, 15
The sum of these 8 values is 167, so the mean is 167/8 = 20.875.
Ex. 1 calculate mean from the following data
Value: 5 15 25 35 45 55 65 75
Freq: 1 20 25 24 12 31 71 52
Values frequency Fx
5
15
25
65
45
55
65
75
15
20
25
24
12
31
71
52
75
300
625
840
540
1705
4615
3900
250 12600
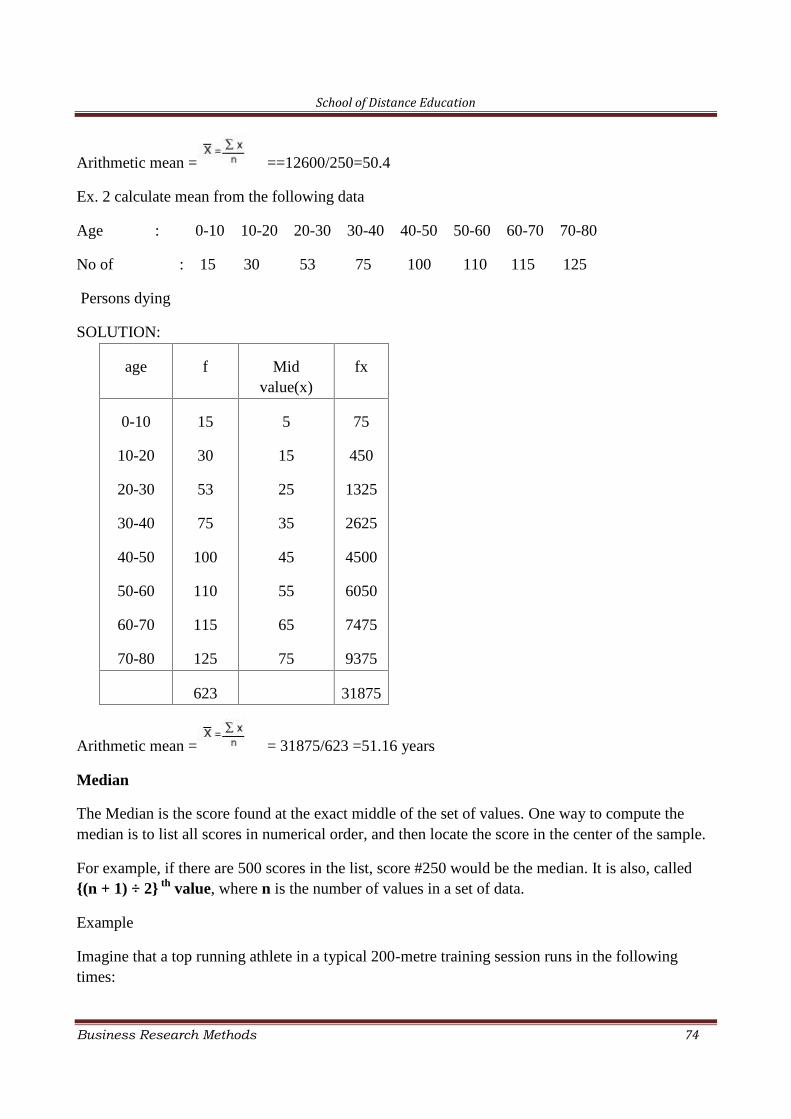
School of Distance Education
Business Research Methods 74
Arithmetic mean = ==12600/250=50.4
Ex. 2 calculate mean from the following data
Age : 0-10 10-20 20-30 30-40 40-50 50-60 60-70 70-80
No of : 15 30 53 75 100 110 115 125
Persons dying
SOLUTION:
age f Midvalue(x)
fx
0-10
10-20
20-30
30-40
40-50
50-60
60-70
70-80
15
30
53
75
100
110
115
125
5
15
25
35
45
55
65
75
75
450
1325
2625
4500
6050
7475
9375
623 31875
Arithmetic mean = = 31875/623 =51.16 years
Median
The Median is the score found at the exact middle of the set of values. One way to compute themedian is to list all scores in numerical order, and then locate the score in the center of the sample.
For example, if there are 500 scores in the list, score #250 would be the median. It is also, called{(n + 1) ÷ 2} th value, where n is the number of values in a set of data.
Example
Imagine that a top running athlete in a typical 200-metre training session runs in the followingtimes:
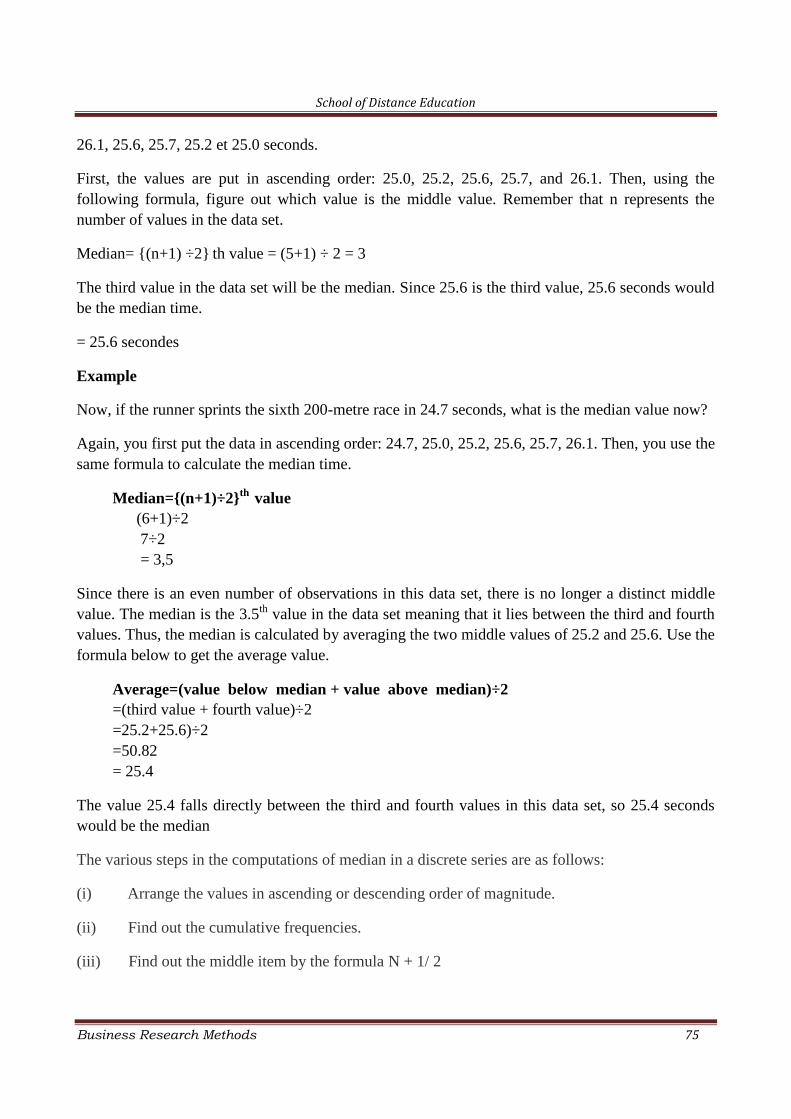
School of Distance Education
Business Research Methods 75
26.1, 25.6, 25.7, 25.2 et 25.0 seconds.
First, the values are put in ascending order: 25.0, 25.2, 25.6, 25.7, and 26.1. Then, using thefollowing formula, figure out which value is the middle value. Remember that n represents thenumber of values in the data set.
Median= {(n+1) ÷2} th value = (5+1) ÷ 2 = 3
The third value in the data set will be the median. Since 25.6 is the third value, 25.6 seconds wouldbe the median time.
= 25.6 secondes
Example
Now, if the runner sprints the sixth 200-metre race in 24.7 seconds, what is the median value now?
Again, you first put the data in ascending order: 24.7, 25.0, 25.2, 25.6, 25.7, 26.1. Then, you use thesame formula to calculate the median time.
Median={(n+1)÷2}th value(6+1)÷27÷2= 3,5
Since there is an even number of observations in this data set, there is no longer a distinct middlevalue. The median is the 3.5th value in the data set meaning that it lies between the third and fourthvalues. Thus, the median is calculated by averaging the two middle values of 25.2 and 25.6. Use theformula below to get the average value.
Average=(value below median + value above median)÷2=(third value + fourth value)÷2=25.2+25.6)÷2=50.82= 25.4
The value 25.4 falls directly between the third and fourth values in this data set, so 25.4 secondswould be the median
The various steps in the computations of median in a discrete series are as follows:
(i) Arrange the values in ascending or descending order of magnitude.
(ii) Find out the cumulative frequencies.
(iii) Find out the middle item by the formula N + 1/ 2
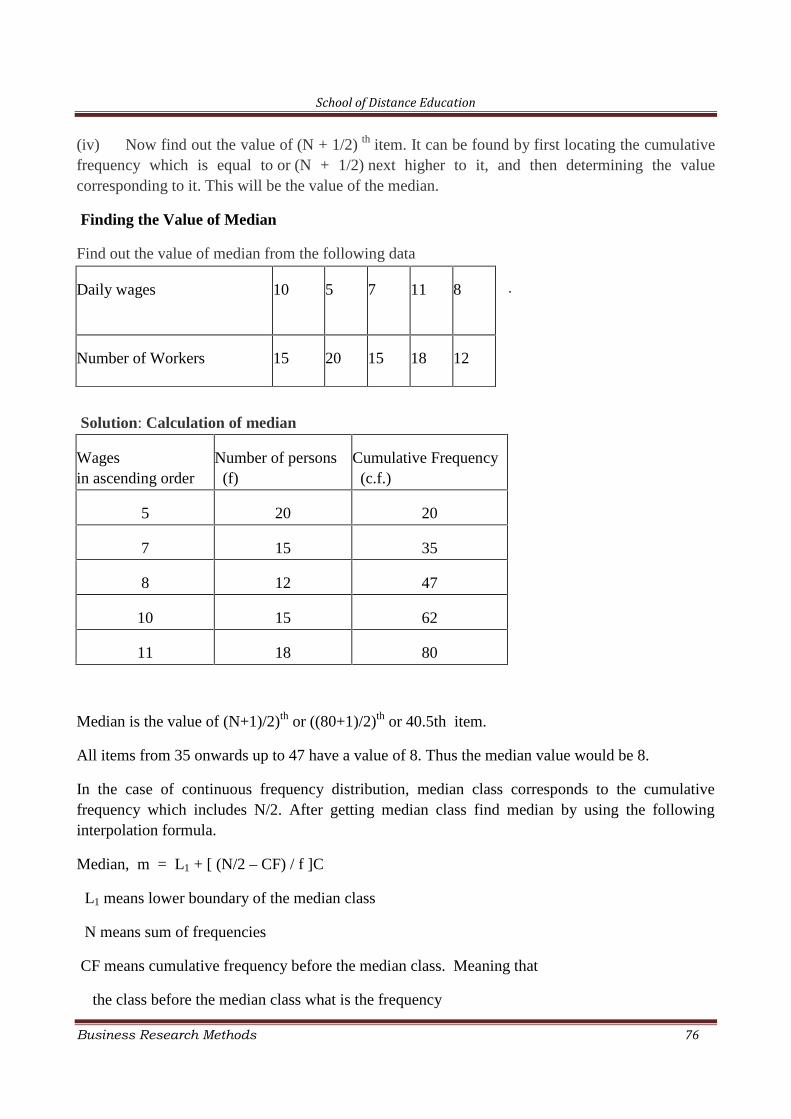
School of Distance Education
Business Research Methods 76
(iv) Now find out the value of (N + 1/2) th item. It can be found by first locating the cumulativefrequency which is equal to or (N + 1/2) next higher to it, and then determining the valuecorresponding to it. This will be the value of the median.
Finding the Value of Median
Find out the value of median from the following data
.
Solution: Calculation of median
Wagesin ascending order
Number of persons(f)
Cumulative Frequency(c.f.)
5 20 20
7 15 35
8 12 47
10 15 62
11 18 80
Median is the value of (N+1)/2)th or ((80+1)/2)th or 40.5th item.
All items from 35 onwards up to 47 have a value of 8. Thus the median value would be 8.
In the case of continuous frequency distribution, median class corresponds to the cumulativefrequency which includes N/2. After getting median class find median by using the followinginterpolation formula.
Median, m = L1 + [ (N/2 – CF) / f ]C
L1 means lower boundary of the median class
N means sum of frequencies
CF means cumulative frequency before the median class. Meaning that
the class before the median class what is the frequency
Daily wages 10 5 7 11 8
Number of Workers 15 20 15 18 12
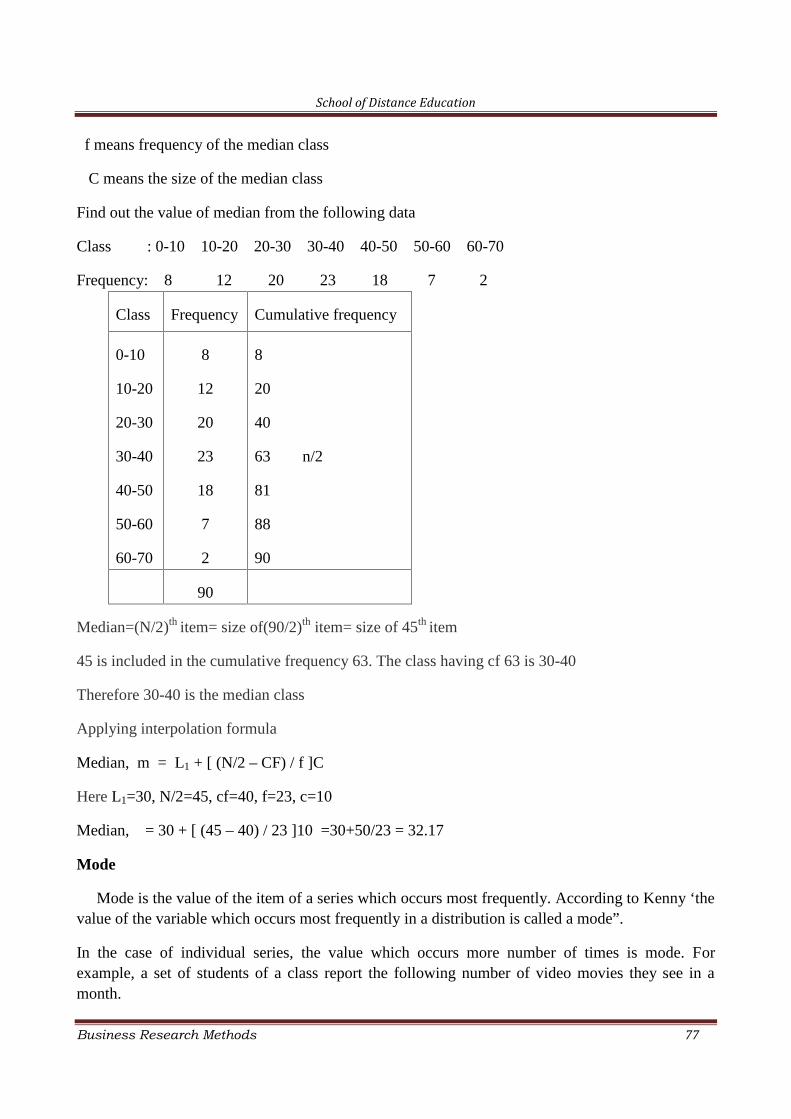
School of Distance Education
Business Research Methods 77
f means frequency of the median class
C means the size of the median class
Find out the value of median from the following data
Class : 0-10 10-20 20-30 30-40 40-50 50-60 60-70
Frequency: 8 12 20 23 18 7 2
Class Frequency Cumulative frequency
0-10
10-20
20-30
30-40
40-50
50-60
60-70
8
12
20
23
18
7
2
8
20
40
63 n/2
81
88
90
90
Median=(N/2)th item= size of(90/2)th item= size of 45th item
45 is included in the cumulative frequency 63. The class having cf 63 is 30-40
Therefore 30-40 is the median class
Applying interpolation formula
Median, m = L1 + [ (N/2 – CF) / f ]C
Here L1=30, N/2=45, cf=40, f=23, c=10
Median, = 30 + [ (45 – 40) / 23 ]10 =30+50/23 = 32.17
Mode
Mode is the value of the item of a series which occurs most frequently. According to Kenny ‘thevalue of the variable which occurs most frequently in a distribution is called a mode”.
In the case of individual series, the value which occurs more number of times is mode. Forexample, a set of students of a class report the following number of video movies they see in amonth.
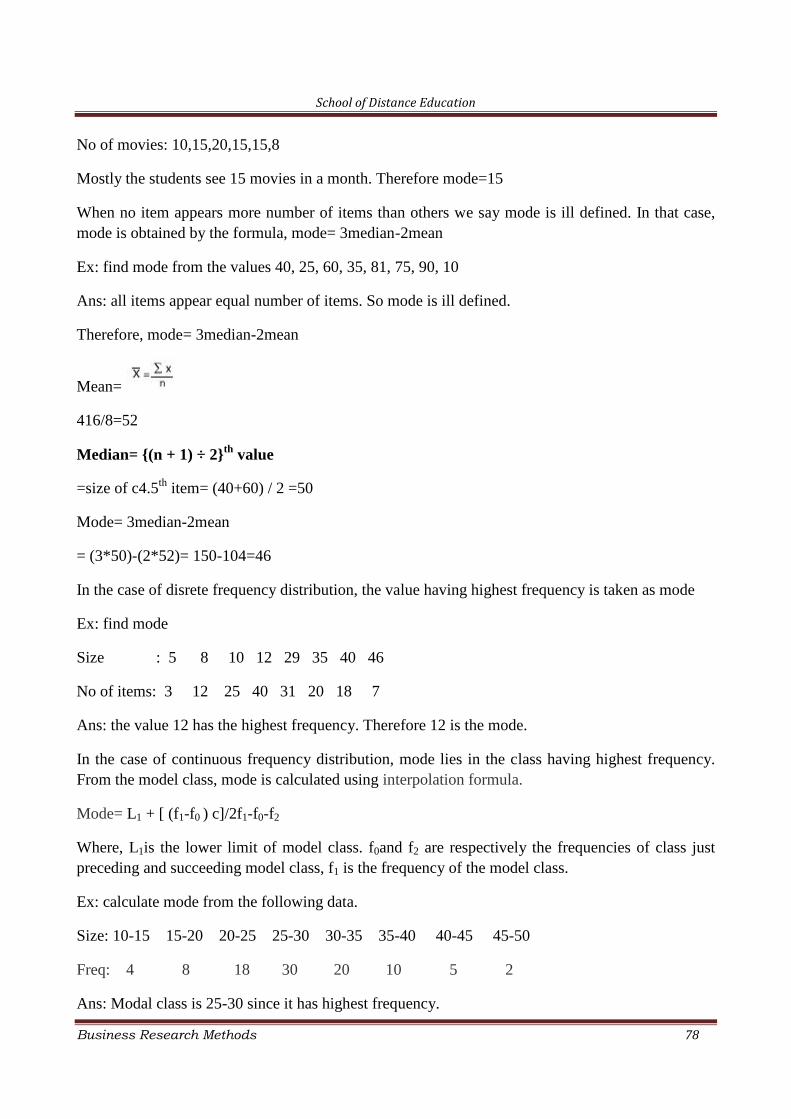
School of Distance Education
Business Research Methods 78
No of movies: 10,15,20,15,15,8
Mostly the students see 15 movies in a month. Therefore mode=15
When no item appears more number of items than others we say mode is ill defined. In that case,mode is obtained by the formula, mode= 3median-2mean
Ex: find mode from the values 40, 25, 60, 35, 81, 75, 90, 10
Ans: all items appear equal number of items. So mode is ill defined.
Therefore, mode= 3median-2mean
Mean=
416/8=52
Median= {(n + 1) ÷ 2}th value
=size of c4.5th item= (40+60) / 2 =50
Mode= 3median-2mean
= (3*50)-(2*52)= 150-104=46
In the case of disrete frequency distribution, the value having highest frequency is taken as mode
Ex: find mode
Size : 5 8 10 12 29 35 40 46
No of items: 3 12 25 40 31 20 18 7
Ans: the value 12 has the highest frequency. Therefore 12 is the mode.
In the case of continuous frequency distribution, mode lies in the class having highest frequency.From the model class, mode is calculated using interpolation formula.
Mode= L1 + [ (f1-f0 ) c]/2f1-f0-f2
Where, L1is the lower limit of model class. f0and f2 are respectively the frequencies of class justpreceding and succeeding model class, f1 is the frequency of the model class.
Ex: calculate mode from the following data.
Size: 10-15 15-20 20-25 25-30 30-35 35-40 40-45 45-50
Freq: 4 8 18 30 20 10 5 2
Ans: Modal class is 25-30 since it has highest frequency.
School of Distance Education
Business Research Methods 79
Mode= L1 + [ (f1-f0 ) c]/2f1-f0-f2
= 25 + [ (30-18 ) 5]/260-18-20 =25+60/22 =27.73
Index Numbers
Index numbers are designed to measure the magnitude of economic changes over time. Astatistic which assigns a single number to several individual statistics in order to quantify trends.Index numbers are the indicators of the various trends in an economy. Price index numbers indicatethe position of prices whether they are rising or falling and at what rate. Similarly, index numbersregarding agricultural production indicates the trend of change whether it is rising or falling at whatrate over a period of time. An index number is an economic data figure reflecting price or quantitycompared with a standard or base value. The base usually equals 100 and the index number isusually expressed as 100 times the ratio to the base value. For example, if a commodity costs twiceas much in 1970 as it did in 1960, its index number would be 200 relative to 1960. Index numbersare used especially to compare business activity, the cost of living, and employment.
An index number is specialized average. Index numbers may be simple or weighteddepending on whether we assign equal importance to every commodities or different importance todifferent commodities according to the percentage of income spent on them or on the basis of someother criteria. In this chapter, we shall discuss both simple and weighted index numbers.
Simple and weighted index numbers
Simple index numbers are those in the calculation of which all the items are treated asequally important. Here items are not given any weight. Weighted index numbers are those in thethose in the calculation of which each item is assigned a particular weight.
Price Index Numbers
Price index numbers measure changes in the price of a commodity for a given period in comparisonwith another period.
Various methods used for construction of Price index numbers
1) Simple Aggressive Method
This is the simplest method. The prices for base year and current year are only required. Theaggregate of current year price is divided by aggregate of base year price and multiplied by 100.
i.e. ∑p1÷ ∑p0 *100 where, p1 is the aggregate of price in the current year and p0 is theaggregate no of prices in the base year.
Ex: for the data given below calculate simple index number
Commodities: A B C D E
Price in 2008 5 8 12 25 3
Price in 2010 7 9 15 24 4
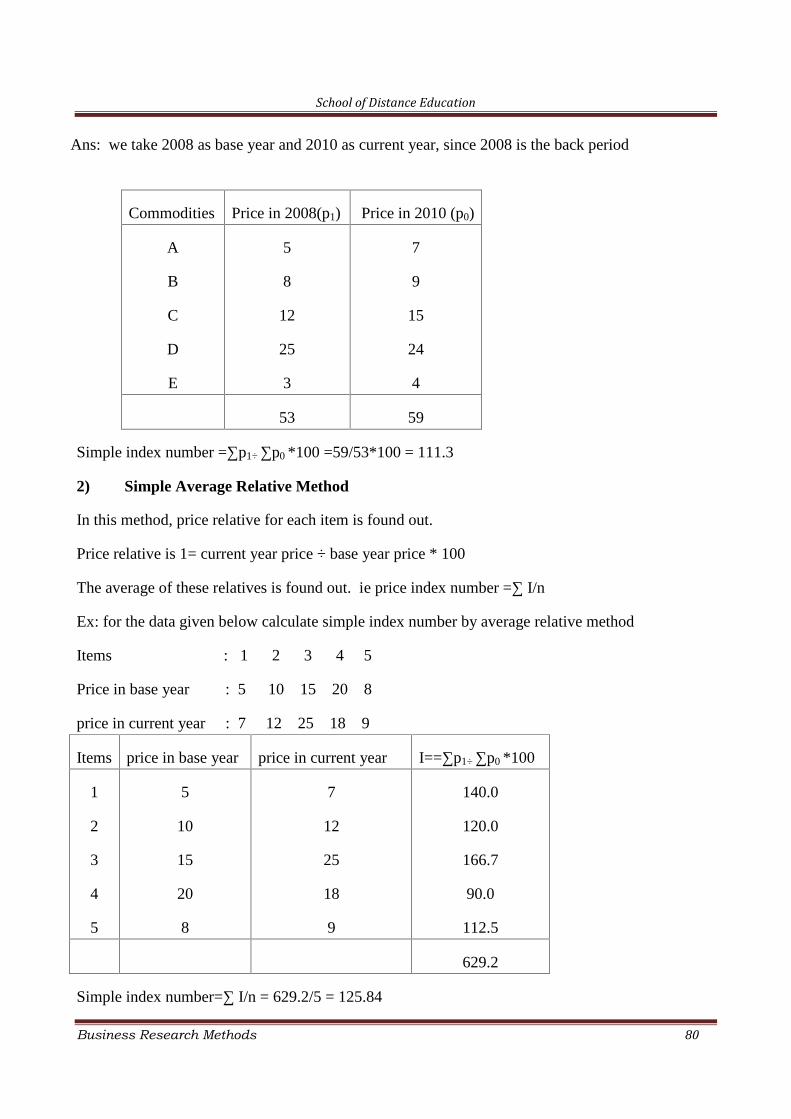
School of Distance Education
Business Research Methods 80
Ans: we take 2008 as base year and 2010 as current year, since 2008 is the back period
Commodities Price in 2008(p1) Price in 2010 (p0)
A
B
C
D
E
5
8
12
25
3
7
9
15
24
4
53 59
Simple index number =∑p1÷ ∑p0 *100 =59/53*100 = 111.3
2) Simple Average Relative Method
In this method, price relative for each item is found out.
Price relative is 1= current year price ÷ base year price * 100
The average of these relatives is found out. ie price index number =∑ I/n
Ex: for the data given below calculate simple index number by average relative method
Items : 1 2 3 4 5
Price in base year : 5 10 15 20 8
price in current year : 7 12 25 18 9
Items price in base year price in current year I==∑p1÷ ∑p0 *100
1
2
3
4
5
5
10
15
20
8
7
12
25
18
9
140.0
120.0
166.7
90.0
112.5
629.2
Simple index number=∑ I/n = 629.2/5 = 125.84
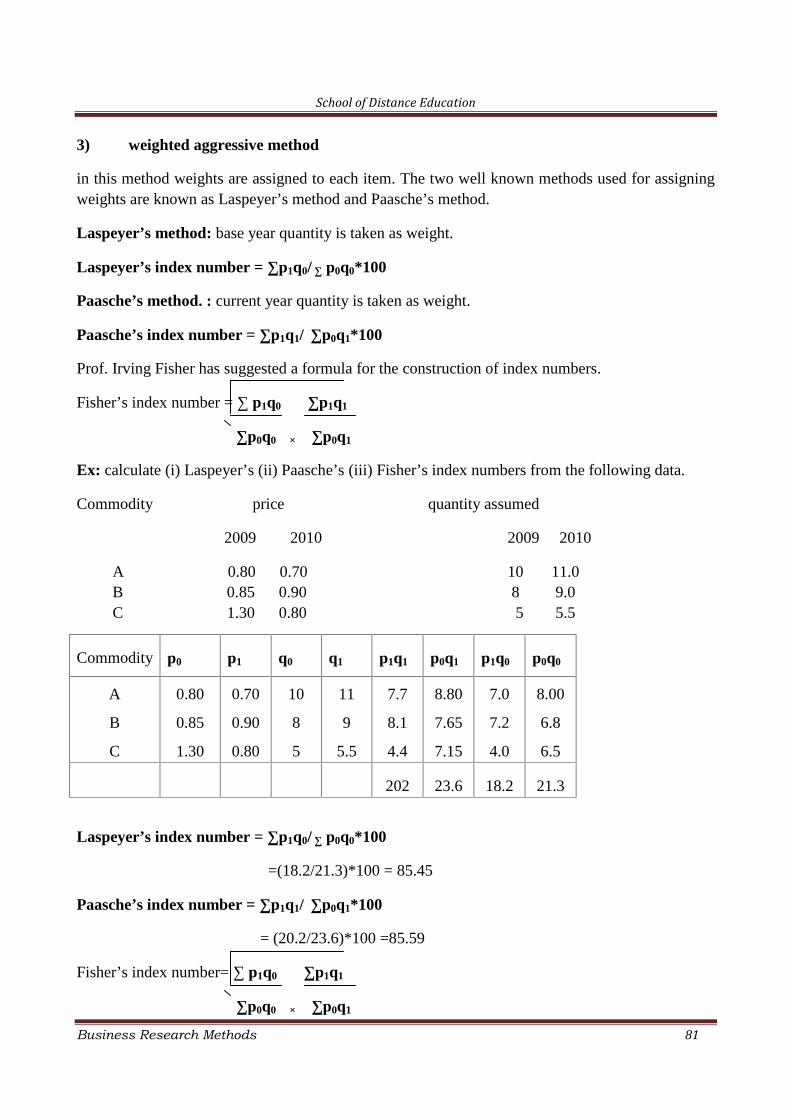
School of Distance Education
Business Research Methods 81
3) weighted aggressive method
in this method weights are assigned to each item. The two well known methods used for assigningweights are known as Laspeyer’s method and Paasche’s method.
Laspeyer’s method: base year quantity is taken as weight.
Laspeyer’s index number = ∑p1q0/ ∑ p0q0*100
Paasche’s method. : current year quantity is taken as weight.
Paasche’s index number = ∑p1q1/ ∑p0q1*100
Prof. Irving Fisher has suggested a formula for the construction of index numbers.
Fisher’s index number = ∑ p1q0 ∑p1q1
∑p0q0 × ∑p0q1
Ex: calculate (i) Laspeyer’s (ii) Paasche’s (iii) Fisher’s index numbers from the following data.
Commodity price quantity assumed
2009 2010 2009 2010
A 0.80 0.70 10 11.0B 0.85 0.90 8 9.0C 1.30 0.80 5 5.5
Laspeyer’s index number = ∑p1q0/ ∑ p0q0*100
=(18.2/21.3)*100 = 85.45
Paasche’s index number = ∑p1q1/ ∑p0q1*100
= (20.2/23.6)*100 =85.59
Fisher’s index number= ∑ p1q0 ∑p1q1
∑p0q0 × ∑p0q1
Commodity p0 p1 q0 q1 p1q1 p0q1 p1q0 p0q0
A
B
C
0.80
0.85
1.30
0.70
0.90
0.80
10
8
5
11
9
5.5
7.7
8.1
4.4
8.80
7.65
7.15
7.0
7.2
4.0
8.00
6.8
6.5
202 23.6 18.2 21.3
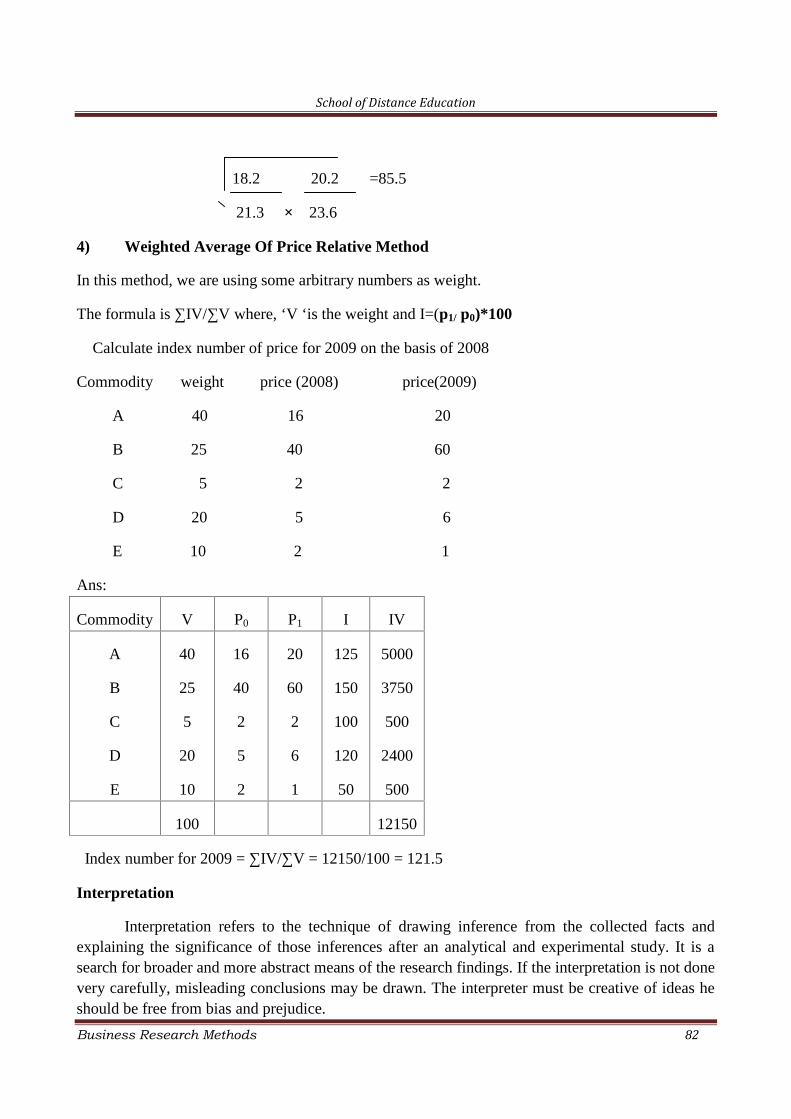
School of Distance Education
Business Research Methods 82
18.2 20.2 =85.5
21.3 × 23.6
4) Weighted Average Of Price Relative Method
In this method, we are using some arbitrary numbers as weight.
The formula is ∑IV/∑V where, ‘V ‘is the weight and I=(p1/ p0)*100
Calculate index number of price for 2009 on the basis of 2008
Commodity weight price (2008) price(2009)
A 40 16 20
B 25 40 60
C 5 2 2
D 20 5 6
E 10 2 1
Ans:
Commodity V P0 P1 I IV
A
B
C
D
E
40
25
5
20
10
16
40
2
5
2
20
60
2
6
1
125
150
100
120
50
5000
3750
500
2400
500
100 12150
Index number for 2009 = ∑IV/∑V = 12150/100 = 121.5
Interpretation
Interpretation refers to the technique of drawing inference from the collected facts andexplaining the significance of those inferences after an analytical and experimental study. It is asearch for broader and more abstract means of the research findings. If the interpretation is not donevery carefully, misleading conclusions may be drawn. The interpreter must be creative of ideas heshould be free from bias and prejudice.
School of Distance Education
Business Research Methods 83
Fundamental principles of interpretation
1. Sound interpretation involves willingness on the part of the interpreter to see what is in thedata.
2. Sound interpretation requires that the interpreter knows something more than the merefigures.
3. Sound interpretation demands logical thinking.
4. Clear and simple language is necessary for communicating the interpretation
Need for interpretation (importance of interpretation.)
1. It is through interpretation that the interpreter is able to know the abstract principles lying inhis conclusions.
2. On the basis of the principles underlying his findings, a researcher can make variouspredictions about the various other events which are unrelated to his area of findings.
3. Interpretation leads to the establishment of explaining concepts.
4. A researcher can appreciate only through interpretation, why his findings are and what theyare.
5. The interpretation of the findings of exploratory research study usually results in tohypothesis for experimental research.
Steps involved in the technique of interpretation
1. Researcher must give reasonable explanations of the relations he have found. He must beable to see uniformity in diversified research findings so that generalization of findings ispossible.
2. If any extraneous information is collected during the study, it must be considered whileinterpreting the final result of research study.
3. The researcher can consult with those having insight in to the study who can point out theomission and errors in logical arguments.
4. The researcher must consider all relevant factors affecting the problem at the time ofinterpretation.
5. The conclusions appearing correct at the beginning may prove to be inaccurate later. Soresearcher must not be in a hurry while interpreting.
Errors of interpretation
The errors of interpretation can be classified into two groups.
School of Distance Education
Business Research Methods 84
1. Errors due to false generalizations
Errors occur when (i) unwarranted conclusions are drawn from the facts available. (ii)Drawing conclusions from an argument running from effect to cause. (iii) Comparingbetween two sets of data with unequal base. (iv) Conclusions are drawn from data irrelevantto the problem. (v) False generalizations and faulty statistical methods are made.
2. Errors due to misuse of statistical measures
When (i) conclusions are based on what is true, on an average. (ii) Percentages are used forcomparisons, when total numbers are different. (iii) Index numbers are used without propercare. (iv) Casual correlation is used as real correlation.
School of Distance Education
Business Research Methods 85
CHAPTER-6
RESEARCH REPORT
A report is a detailed description of what has been done and how it has been done withrespect to a particular area or topic. The purpose of the written report is to present the results ofyour research, but more importantly to provide a persuasive argument to readers of what you havefound. It is the end product of a research activity. It is highly skilled work it is the final stage of theresearch work.
Need For Research Report
The aim of research is the search for knowledge. A research report is needed to evolve a theory or a principle. Reporting is a process through which a basic ground is prepared for exchange of ideas or
thoughts. Reporting helps the researcher to make specific recommendation for course of action. The research ability of a candidate is revealed through the final report he presents. A research report is highly useful for policy formulators, practitioners, general public and
others.
Functions of Research Report
Research report serves as a means for presenting the problem studied, methods and techniquesused, findings, conclusions and recommendation in an organised manner.
It serves as a reference material for future use in the same or related area. It serves as a means for judging the quality of the research project. It is a means for evaluating research ability. It provides systematic knowledge on problems and issues analysed.
Qualities of a Good Report
• Clarity
• Continuity
• Consistency
• Brevity
• Readability
• Interest and Appeal
• Judicious Selection of Materials
• Avoiding personal opinion
• Concentrate on Central Ideas
• Proper Reference
School of Distance Education
Business Research Methods 86
Steps in Report Writing
They are to be completed through a number of steps.
• Plan the project in advance; fix the target and final date of completing the report.
• The time of report writing should be planned in advance.
• Arrange the data, documents, bibliography etc. in conformity with the structure of the report.
• The outline should be based on all main points and sub points.
• Prepare a rough report of what one has done in his studies. He has to write down the procedureadopted by him in collecting the material, the technique or analysis adopted by him, the broadfindings and generalizations and his suggestions.
• Keep the rough report for few days for careful reading and then revising it on the basis ofthinking and discussing with others. it is appropriate to get help of some experienced andknowledgeable person at this stage.
• Rewrite the report on the basis of the revision made and corrections effected on the report.
• Prepare final bibliography. Bibliography may contain two parts, first containing name of thebooks and pamphlets, second containing the names of magazines and newspaper articles.
• The last step in report writing is the writing of a final draft of the report. The final draft shouldbe written in a concise and objective style and in simple language.
Parts/Components Of A Research Report
1. Prefatory Items
2. Introductory Part
3. Body/Text/Content/Results of the Work
4. Concluding Part/End Items/Terminal Items
I Prefatory Items
1. Title Page
2. Researcher’s Declaration
3. Certificate of the Research Guide (and Head of the Dept. in the case of Project)
4. Acknowledgements
5. Contents
6. List of Abbreviations
7. List of Tables
8. List of Figures
9. List of Appendices/Appendixes
School of Distance Education
Business Research Methods 87
Title Page
The contents of Title Page
• The title of the research study
• The name of the faculty/subject
• Institution to which the report is to be submitted
• The degree for which report is to be submitted
• The name of the researcher
• The name of the supervising teacher & his address
• The month & Year of submission of the Report
These items are centered between the margin of the page and no terminal punctuation is used.
Researcher’s Declaration
The researcher has to declare that it is a bonafide Research work done by him/her and thatno part of the Thesis/Dissertation is presented for the award of any degree, diploma, associateship,fellowship or other similar title before.
Certificate of the Research Guide
The Guide has to state that the thesis is a record of bonafide research work carried out by theresearcher under his supervision and no part of the thesis is submitted for any degree, diploma,associateship, fellowship or other similar title before. He/she is permitted to submit the thesis.
Acknowledgements
• This page is largely a matter of courtesy
• The researcher acknowledges the following persons/Institutions for the assistance
- Guide
- Other academicians and Professionals who rendered assistance
- Authorities of Libraries
- Respondents of questionnaire/Schedule
- Persons from administrative assistance is received
- Any other individuals who assisted in the research work.
School of Distance Education
Business Research Methods 88
Contents
• This page gives the readers a bird’s eye-view of the Report
• It enables the reader to locate quickly each section of it.
• It includes the chapter headings, major sub divisions of the chapters
• All the titles of Chapters appear in the exact words.
• Correct page number is shown against the title.
List of Abbreviations
In this page the list of Abbreviations used in the Thesis is presented in the alphabetical order.Examples
1. ICSSR - Indian Council of Social Science Research
2. MLA - Modern Language Association of America.
3. KAU - Kerala Agricultural UniversityKSFE
4. KSFE - Kerala State Financial Enterprises Ltd
5. KSIDC - Kerala State Industrial Development Corporation
6. KSRTC - Kerala State Road Transport Corporation
List of Tables and Figures
In this Page a list of Tables and Figures, if any, is shown.The full titles of Tables & Figures asshown in the text are shown with corresponding Page numbers. Examples
1.1. List of RPTCs and their areas of Operation 13
1.2. District-wise Classification of Rubber Holdings in Kerala 16
1.3. Selection of Sample Member Rubber Producers’ Societies 18
1.4. Selection of Sample Societies and Small Rubber Growers 19
2.1. World Production of Natural Rubber (in ‘000 tonnes) 47
2.2. Area Under Rubber Cultivation in the World (in ‘000 hectares) 49
List of Appendixes/Appendices
• In this page a list of appendixes given at the end of the Thesis/Dissertation is shown.
• Examples
School of Distance Education
Business Research Methods 89
• Appendix 1. Interview Schedule for the Retail Entrepreneurs - 312
• Appendix 2. Interview Schedule for the Customers - 316
• Appendix 3. Interview Schedule for the Employees - 320
• Appendix 4. List of FMCG Companies in India - 324
• Appendix 4. Profile of Kerala State - 330
II. Introductory Part
1. Introduction A brief explanation of the beginning of the problem
2. Statement of the Research Problem
3. Significance of the Study
4. Review of Previous Studies
5. Scope and Area of the Study
6. Objectives of the Study
7. Hypotheses to be tested
8. Operational Definitions of Concepts
9. Methodology and Data Base
o Type of Method of Study Eg., Descriptive, Analytical
o Secondary Data – Sources
o Primary Data - Sources
o Sampling
1. Define the Population Method
2. Identify the sample frame
3. Specify the sampling Units
4. Specify the sampling method
5. Determine the sample size
6. Specify the sampling plan
7. Select the final sample
School of Distance Education
Business Research Methods 90
Tools for Data Collection Interview Schedule Questionnaire Observation
Method adopted for the analysis of the Data
Period of Reference/study
Tools for the analysis- Mathematical and Statistical
Scheme of Presentation of the Study
Time Frame and Resource Requirements
Limitations of the Study
III. Body/Text/Results of The Work
Designing of chapters based on the objectives of the Study
Use of Tables/Graphs/Diagrams for effective representation - Title, Source etc
Presentation style – Simple & Lucid Style with the help of apt Mathematical & StatisticalTools.
Testing of Hypotheses
Objectives of the Study
The main objective of the present investigation is to conduct an in-depth analysis on theHRM practices of the Public Sector Financial Enterprise (ie.,KSFE) in comparison with that offinancial enterprises operating in the private sector in the State of Kerala. To achieve this mainobjective, the following specific objectives have been set forth.
1. To study the training practices of the KSFE.
2. To assess the extent of satisfaction of the employees of the KSFE in respect of theircompensation.
3. To examine the quality of work life of the employees of the KSFE and the Private SectorFinancial Enterprises.
4. To evaluate the job satisfaction of the employees of KSFE and Private Sector FinancialEnterprises and
5. To analyze the industrial relations of the KSFE and the Private Sector Financial Enterprises.
School of Distance Education
Business Research Methods 91
Designing of chapters based on the objectives of the Study-
Chapter Titles
1. Training
2. Compensation
3. Quality of Work Life
4. Job Satisfaction
5. Industrial Relations
Hypothesis -example
In line with the objective stated above, the following hypotheses were developed and tested.
1. There is no significant difference among the three levels of employees of the KSFE inrespect of the training practices imparted.
2. There is significant difference among the employees at the three levels of KSFE in respectof their compensation for the services.
3. In respect of quality of work life, the employees of KSFE are more satisfied compared tothat of PSFE.
4. The job satisfaction of the employees of KSFE is better than that of PSFE.
5. The industrial relation in the KSFE is better in comparison with PSFE.
Testing of Hypothesis No. 4
In order to evaluate the level of satisfaction of the employees of KSFE in comparison withPSFE towards their job and job related aspects, 20 variables have been identified and analyzed.The analysis reveals that in case of 16 variables the performance of employees of KSFE is foundbetter compared to that of PSFE. Of these 16 variables, statistically significant difference is seen incase of 13 variables. The performance of PSFE is found better in case of only 4 variables ie.,communication system, support and co-operation from subordinates, toilet and bathroom facilitiesand hygiene. Significant variation is observed in respect of 3 variables. Thus, it is clear that thelevel of satisfaction of the employees of KSFE is significantly better compared to that of PSFEemployees. Therefore, the fourth hypothesis that the job satisfaction of the employees of KSFE isbetter than that of PSFE stands accepted.
Testing of Hypothesis No. 5
In order to conduct a comparative study on the industrial relations of KSFE and PSFE atotal of 10 variables have been identified and analysed. These variables are -
School of Distance Education
Business Research Methods 92
1. Relationship between management and employees
2. Method adopted for maintaining discipline
3. Attitude of the management in settling grievances of employees
4. Grievance Redressal cell
5. System of handling grievances of employees
6. Approach of management towards indiscipline
7. Response of the management in initiating corrective action
8. Participation of employees in the management of organization.
9. Regularity in the convening of staff meetings
10.Information sharing in the working of the organization.
Out of these 10 variables analyzed, the performance of KSFE is found better in the case ofall the 10 variables. Moreover, out of the 10 variables subjected to statistical test, significantdifference is witnessed in the case of 9 variables. Thus it is clear that the industrial relationsexisting in the KSFE is better compared to that of the PSFE. Therefore, the discussion on theindustrial relations can be concluded by accepting the last hypothesis that industrial relations in theKSFE is better than that of the PSFE.
Iv. Concluding Part / End Items/Terminal Items
Re-caption of the Work Done
Summary of Chapters
Findings
Conclusions
Recommendations/Suggestions
Scope for further studies
Appendices/Appendixes
Bibliography
Re caption of the work done
Human Resources are one of the vital ingredients for the successful functioning of everyenterprise. Management of Human Resources is a dynamic and challenging function. The qualityof human resources can be ensured only through effective Human Resource Management. This
School of Distance Education
Business Research Methods 93
research work is an attempt to study the Human Resource Management practices of the KeralaState Financial Enterprises Ltd. in comparison with that of the Private Sector Financial Enterprisesin Kerala.
In the State of Kerala from the very beginning chit business were under the control ofregistered non-banking companies in the private sector. These chit companies exploited the smallincome groups and failed to cater the financial needs of lower and middle level people of the State.Under these circumstances, the Govt. of Kerala formed an agency in the public sector by name theKerala State Financial Enterprises Ltd. (KSFE) in the year 1969. The main objective behind theestablishment of the KSFE Ltd. was to release the common man from the clutches of theunscrupulous private chit groups. Currently, KSFE is the dominant foremen in the chit business inthe State. However, the KSFE failed to achieve its avowed objectives due to the deficiency inHRM. The KSFE paid little care to human resources and in equipping them to withstand thechallenges of the current environment. The company failed to impart adequate and regular trainingto its employees. The employees are not satisfied with compensation and they work without jobsatisfaction. The employees enjoy only poor quality of work life. Moreover, the industrial relationis not a cordial one but a strained one. Thus, HRM is still a neglected area in the KSFE.
This lapse of the KSFE in the area of HRM provided ample scope for Financial Enterprisesfunctioning in the private sector to register a success in the HRM related aspects and to achieve aremarkable progress in their business initiatives. In this background, an investigation on the HRMof the KSFE with that of private sector financial enterprises in Kerala is quite relevant and useful.The present study seeks to fulfill this. The specific objectives of the present study are recapitulatedbelow:
1. To study the training practices of the KSFE.
2. To assess the extent of satisfaction of the employees of the KSFE in respect of compensation.3. To examine the quality of work life of the employees of the KSFE and private sector financialenterprises.
4. To evaluate the job satisfaction of the employees of the KSFE and the private sector financialenterprises.
5. To analyze the industrial relations of the KSFE and the private sector financial enterprises.
The Design and Methodology
This is an empirical study based on the survey method. Data have been collected from bothprimary and secondary sources. The primary data have been collected from the employees of theKSFE and private sector financial enterprises with the help of a pre-tested interview schedule andthrough discussions. The selection of the sample employees of the KSFE and PSFE has been doneby following simple random sampling method. A total of 600 sample employees, consisting of 400employees from the KSFE and 200 employees from the PSFE has been selected for the intensivestudy. The secondary data have been collected from the published and unpublished reports, office
School of Distance Education
Business Research Methods 94
records, Memorandum of Association, Articles of Association etc of KSFE Ltd., unpublishedreports and records of the PSFE published and unpublished research dissertations in the field,books, periodicals, journals, magazines, and websites of the KSFE and PSFE.
The review of training practices of the KSFE has been done by analyzing various practicesadopted by the KSFE for imparting training to the employees at the three levels. The assessment ofthe satisfaction of employees of KSFE towards their compensation has been done with the help ofselected variables for the purpose. For conducting a comparative study on the quality of work lifeof the employees of KSFE and PSFE, the important variables affecting the QWL have beenidentified and analysed. The comparative analysis of job satisfaction and industrial relations hasbeen done with the help of selected variables affecting these factors in both the KSFE and PSFE.Mathematical tools like averages and percentages and statistical tools like standard deviation, Chi-square test, ‘F’ test, ‘Z’ test, have been suitably employed for the analysis.
The present chapter is devoted to summaries the important findings of the precedingchapters, conclusions drawn from the study and recommendations made on the basis of the findingsand conclusions. For the purpose of discussion, the chapter is divided into three sections. Section Acontains summary of the entire study and its findings at a glance. Section B contains conclusionsand section C presents recommendations and scope for future research in the field
Smmary of Chapters
The first chapter presents the introduction and methodological design of the research.
The second chapter deals with the literature and related studies on different aspects of HRMand KSFE.
In the third chapter an overview of KSFE and HRM has been done in detail.In the fourth chapter the training practices followed by the KSFE are discussed.
In the fifth chapter an attempt has been made to assess the level of satisfaction of theemployees of KSFE in respect of their compensation.
In the sixth chapter a comparative review on the level of satisfaction of the employees ofKSFE and PSFE in respect of QWL has been done.
In the seventh chapter an attempt has been made to analyze the job satisfaction of theemployees of KSFE and PSFE on a comparative fashion.
Eight chapters conduct a comparative evaluation on the industrial relations of KSFE andPSFE.
In the present chapter the major findings of the study, conclusions and recommendationsand scope for future research in the field have been presented.
Scope for Further Research
On the basis of the present investigation, the following topics are found relevant for furtherresearch studies in the field.
School of Distance Education
Business Research Methods 95
1. A Study on employee engagement and commitment in the KSFE.
2. Customer Satisfaction on the services of the KSFE and the Private Sector FinancialEnterprises – A Comparative Study.
3. Marketing Practices of the Kerala State Financial Enterprises Ltd.
4. Role of the Kerala State Financial Enterprises Ltd in mobilizing the savings of thehousehold sector in Kerala.
Bibliography
Books
Reports and other Official Publications
Journals and Periodicals
Research Dissertations., PhD, M.Phil etc
Websites/Electronic Sources
Seminar/Conference Papers, Working Papers etc.
Style of Listing the Sources – Books
(Surname of Author, Name, Title, Place of Publication, Publisher, Year of Publication) -Examples
Agarwal, A.N, Indian Economy, New Delhi: Vikas Publishing House, 1994. Amarchand, D, Ed. Research Methods in Commerce, Madras: Emerald, 1987. Anderson, J, Thesis and Assignment Writing, New Delhi: Wiley Eastern Limited, 1970. Baker, M. J, Marketing – Theory and Practice, London: MacMillan, 1983. Banerjee, Mrityunjoy. Essentials of Modern Marketing, 2nd ed. New Delhi: Oxford IBH
Publishing Pvt Ltd, 1988. Chakravarthi, Hrishikesh, Advanced Accounting, Standard Publishers , Kolkata, 1982. Barlow, C, Jayasuriya, S, and Tan, C.S, The World Rubber Industry, London: Rout ledge,
1994. Nair, Padmanabhan, K.G, Co-operation – Principles and History,
Thiruvananthapuram: State Institute of Language, 1989.
Oommen, M.A, ed, Kerala Economy Since Independence, New Delhi : Oxford
and IBH Publishing Pvt Ltd, 1979.
School of Distance Education
Business Research Methods 96
Pillai, Vijayachandran B, HRM in Public Sector Enterprises, Sonali Publishers, New Delhi,2012.
Style of Listing- Reports and other Official Publications
(Name of the Agency, Title of the publication,Place and Year) - Examples.
Government of India, Annual Reports. (Various Issues), Ministry of Health and FamilyWelfare, New Delhi
Planning Commission, Report on General Hospital, New Delhi, 1964. Department of Science and Technology, Report of the Health Care Panel on Technology
Forecast for 2020, New Delhi, 1996. Government of Kerala, Database of Kerala Economy, Thiruvananthapuram: Dept. of
Economic and Statistics, 1983.
Style of Listing the Sources – Research Articles
For a Journal
(Surname of the Author, Name, Title, Name of Periodical, Volume, No., Year in Brackets &Page)
Ajimon George, “Natural Rubber Industry in India”, Economic and Political Weekly, 41.15, (2002), 23-24.
Budiman, “If India wants to export, it must go in for TSR”, Rubber Asia, January February,(2003), 25-27.
George, K.T, “Role of Government and Structural Changes in Rubber Plantation Industry inIndia”, Economic and Political Weekly, 12.6 (1988).
Haridasan,V, “World Energy Crisis and Rubber”, Southern Economist, 12.5. (1973) 61. Jayasree, K.R, Jessy, M.D, Nair, A.N,S, and Punnoose, K.I, “Intercropping and Its Effect
on Growth of Young Rubber”, Rubber Board Bulletin, 28.1, (2005), 2-5.
For a Newspaper
(Name of Paper, Place of edition, month, day, Year)
Editorial, Thiruvananthapuram,The Hindu, May 16, 2010, 6.
Style of Listing – Research Dissertations., PhD, M.Phil
Ajitha, S. “Human Resource Management Issues in Public Enterprises in Kerala”. Ph.D.Diss. University of Kerala, Thiruvananthapuram, 2005.
Baburaj, K.R.“A Study on the Working, Acheivements and Prospects of KSFE, Ltd”. Ph.D.Diss. University of Kerala, Thiruvananthapuram, 1999.
School of Distance Education
Business Research Methods 97
Dayanandan, R. “HRM in Co-operative Banks”, Ph.D. Diss. , University of Kerala,Thiruvananthapuram, 1997.
George, M.M. “HRM in Commercial Taxes Department of Kerala”, Ph.D. Diss., MahatmaGandhi University, Kottayam, 2002.
Jacob, K.K. “Industrial Relations in the Public Sector in Kerala”, Ph.D. Diss. University ofKerala, Thiruvananthapuram, 2002.
Pillai, Soman, K. “HRM in Kerala Minerals and Metals Ltd., Chavara”, M.Phil. Diss.,University of Kerala, Thiruvananthapuram, 1993.
Pillai, Prakash, R. “Learning Orientation of Employees and HRD Climate in Banks”, Ph.D.Diss. University of Kerala, Thiruvananthapuram, 2002.
Style of Listing – Websites/Electronic Sources
• www.ksfe.com
• www.chitfund.org
• www.gokulamchits.com
• www.muthoot.com
• www.manappuram.com
• www.kosamattom.com
Style of Listing – Seminar/Conference Papers/Working Papers
Seminar Papers
Alcala,E.A, and Eleazar N.P, “Evaluation of Exploitation Techniques and Management inRubber Smallholders Area”, Paper presented at Ninth Seminar, ANRPC, Kuala Lumpur,2006.
Cyriac,P.C, “The progress and development of Rubber small holders- India”, Paperpresented at VI Seminar ANRPC, Palambang (Indonesia), 1986.
Geevergees, P.V, James Mathew, T, and Achuthankutty, P, “Impact of Processing andMarketing of Natural Rubber through Rubber Producers’ Societies”, Rubber Planters’Conference India, Rubber Board, Kottayam, 2002.
Working Papers
Chandrasekhar, S.F. and M. Ramesh, Job Characteristics Survey at a Private Hospital,Working Paper, Apollo Institute of Hospital Administration, Hyderabad, 1998.
School of Distance Education
Business Research Methods 98
Chandrasekhar, S.F. Service Orientation and Continuance in Work: A Study of CorporateHospital Employees, Working Paper, Apollo Institute of Hospital Administration,Hyderabad, 1998.
Research Proposal/Synopsis – Contents
• Title Page
• Introduction
• Research Problem
• Objectives of the Study
• Related Previous Studies
• Research Methodology - Method of Study, sampling design, Source of Data, Tools forCollection and analysis of Data, period of reference etc.
• Time Frame work and Cost estimates
• Chapter Scheme of the Report
• Conclusion
• References
&&&&&&&&