business Process control-Flow complexity - Jorge … · Organizations are increasingly faced with...
28
International Journal of Web Services Research, 5(2), 49-76, April-June 2008 49 Copyright © 2008, IGI Global. Copying or distributing in print or electronic forms without written permission of IGI Global is prohibited. ABSTRACT Organizations are increasingly faced with the challenge of managing business processes, workflows, and recently, Web processes. One important aspect of business processes that has been overlooked is their complexity. High complexity in processes may result in poor understandability, errors, defects, and excep- tions, leading processes to need more time to develop, test, and maintain. Therefore, excessive complexity should be avoided. Business process measurement is the task of empirically and objectively assigning numbers to the properties of business processes in such a way so as to describe them. Desirable attributes to study and measure include complexity, cost, maintainability, and reliability. In our work, we will focus on investigating process complexity. We present and describe a metric to analyze the control-flow complexity of business processes. The metric is evaluated in terms of Weyuker’s properties in order to guarantee that it qualifies as good and comprehensive. To test the validity of the metric, we describe the experiment we have carried out for empirically validating the metric. Keywords: business processes, complexity metrics, Web processes, workflows, software engineering. INTRODUCTION Business process management systems (BPMS) (Smith & Fingar, 2003) provide a fundamental infrastructure to define and manage business processes. BPMS, such as Workflow Manage- ment Systems (WfMS) (Cardoso, Bostrom & Sheth, 2004), have become a serious competitive factor for many organizations that are increas- ingly faced with the challenge of managing e- business applications, workflows, Web services, and Web processes. Business processes, such as Web processes (WS-BEPL, 2005) promise to ease several current infrastructure challenges, such as data, application, and process integra- tion. With the emergence of Web services, a workflow management system becomes es- sential to support, manage, and enact processes, both among enterprises and within the enterprise (Sheth, van der Aalst & Arpinar, 1999). A vast amount of work done so far in the business process field has targeted the development of WfMS, including models (e.g., Petri nets), modeling languages (BPML, 2004; BPMN, 2005; Leymann, 2001; Menzel, Business Process Control-Flow Complexity: Metric, Evaluation, and Validation Jorge Cardoso, University of Madeira, Portugal
Transcript of business Process control-Flow complexity - Jorge … · Organizations are increasingly faced with...
International Journal of Web Services Research, 5(2), 49-76, April-June 2008 49
Copyright © 2008, IGI Global. Copying or distributing in print or electronic forms without written permission of IGI Global is prohibited.
AbstrAct
Organizations are increasingly faced with the challenge of managing business processes, workflows, and recently, Web processes. One important aspect of business processes that has been overlooked is their complexity. High complexity in processes may result in poor understandability, errors, defects, and excep-tions, leading processes to need more time to develop, test, and maintain. Therefore, excessive complexity should be avoided. Business process measurement is the task of empirically and objectively assigning numbers to the properties of business processes in such a way so as to describe them. Desirable attributes to study and measure include complexity, cost, maintainability, and reliability. In our work, we will focus on investigating process complexity. We present and describe a metric to analyze the control-flow complexity of business processes. The metric is evaluated in terms of Weyuker’s properties in order to guarantee that it qualifies as good and comprehensive. To test the validity of the metric, we describe the experiment we have carried out for empirically validating the metric.
Keywords: business processes, complexity metrics, Web processes, workflows, software engineering.
IntroductIonBusiness process management systems (BPMS) (Smith & Fingar, 2003) provide a fundamental infrastructure to define and manage business processes. BPMS, such as Workflow Manage-ment Systems (WfMS) (Cardoso, Bostrom & Sheth, 2004), have become a serious competitive factor for many organizations that are increas-ingly faced with the challenge of managing e-business applications, workflows, Web services, and Web processes. Business processes, such as Web processes (WS-BEPL, 2005) promise to
ease several current infrastructure challenges, such as data, application, and process integra-tion. With the emergence of Web services, a workflow management system becomes es-sential to support, manage, and enact processes, both among enterprises and within the enterprise (Sheth, van der Aalst & Arpinar, 1999).
A vast amount of work done so far in the business process field has targeted the development of WfMS, including models (e.g., Petri nets), modeling languages (BPML, 2004; BPMN, 2005; Leymann, 2001; Menzel,
business Process control-Flow complexity:
Metric, Evaluation, and ValidationJorge Cardoso, University of Madeira, Portugal
50 International Journal of Web Services Research, 5(2), 49-76, April-June 2008
Copyright © 2008, IGI Global. Copying or distributing in print or electronic forms without written permission of IGI Globalis prohibited.
Mayer, & Edwards, 1994; Singh, 1995; van der Aalst, 1998; van der Aalst & Hofstede, 2003), and execution environments (Alonso, Mohan, Guenthoer, Agrawal, El Abbadi, & Kamath, 1994; Canós, Penadés, & Carsí, 1999; Jablonski, 1994; Kochut, Sheth, & Miller, 1999; Miller, Palaniswami, Sheth, Kochut, & Singh, 1998; Wodtke, Weissenfels, Weikum, & Dittrich, 1996). Work has also been carried out to develop methods to analyze processes in order to verify their correctness, testing the existence of livelocks and deadlocks (van der Aalst, 1998).
Recently, a new field of research for pro-cesses has emerged. This new field—termed process measurement—presents a set of approaches to the quantification of specific properties of processes. Important properties to analyze include the estimation of complexity, defects, process size, effort of testing, effort of maintenance, understandability, time, resources, and quality of service. Process measurement is still in its infancy, and much work has yet to be undertaken.
The effective management of any process requires modeling, measurement, and quan-tification. Process measurement is concerned with deriving a numeric value for attributes of processes. Measures, such as Quality of Service measures (Cardoso, Miller, Sheth, Arnold, & Kochut, 2004), can be used to improve process productivity and quality.
Designing and improving processes is a key aspect in order for businesses to stay com-petitive in today’s marketplace. Organizations have been forced to improve their business processes because customers are demanding better products and services. When an organiza-tion adopts a process management philosophy, process improvement can take place. Indepen-dently of the approach taken, which can be a Continuous Process Improvement (Harrington, 1993), a Business Process Redesign (Wastell, White, & Kawalek, 1994), or a Business Process Reengineering (Ould, 1995) approach, methods need to be available to analyze the processes undergoing improvements. To achieve an ef-fective management, one fundamental area of
research that needs to be explored is the com-plexity analysis of processes.
A business process is composed of a set of activities, tasks, or services put together to achieve a final goal. As the complexity of a process increases, it can lead to poor quality and be difficult to reengineer. High complexity in a process may result in limited understandability and more errors, defects, and exceptions, leading processes to need more time to develop, test, and maintain. For example, in software engineer-ing, it has been found that program modules with high-complexity indices have a higher frequency of failures (Lanning & Khoshgoftaar, 1994). Therefore, excessive complexity should be avoided. For instance, critical processes in which failure can result in the loss of human life require a unique approach to development, implementation, and management. For these types of processes, typically found in healthcare applications (Anyanwu, Sheth, Cardoso, Miller, & Kochut, 2003), the consequences of failure are severe. The ability to produce processes of higher quality and less complexity is a matter of endurance.
Surprisingly, in spite of the fact that there is a vast amount of literature on software measurement of complexity (Zuse, 1997), no significant research on process measurement of complexity has yet been carried out. Analyzing the complexity at all stages of process design and development helps avoid the drawbacks associ-ated with high-complexity processes. Currently, organizations have not adopted complexity metrics as part of their process management projects. As a result, simple processes may be designed in a complex way.
This article integrates and expands our previous work (Cardoso, 2005c; 2005d; 2005f) and discusses the complexity of processes. In the first main section, we present the Control-Flow Complexity (CFC) metric (Cardoso, 2005d) in order to measure the degree of complex-ity of business processes from a control-flow perspective. As Lord William Thomson Kelvin (1824–1907) said, “If you cannot measure it, you cannot improve it.” The use of the CFC metric allows designers to improve processes,
International Journal of Web Services Research, 5(2), 49-76, April-June 2008 51
Copyright © 2008, IGI Global. Copying or distributing in print or electronic forms without written permission of IGI Global is prohibited.
thus reducing the time spent reading and under-standing processes in order to remove faults or adapt them to changed requirements. The CFC metric can be used to analyze the complexity of business processes, as well as workflows and Web processes. In the second main section, we evaluate the Control-Flow Complexity metric in terms of Weyuker’s properties (Weyuker, 1988). Weyuker’s properties give an important basis to classify a complexity measure in order to deter-mine if it can be categorized as good, structured, and comprehensive (Cardoso, 2005c). Finally, the last main section describes the experiment that we have carried out for empirically validat-ing the proposed metric (Cardoso, 2006). Such an experiment plays a fundamental role in our work, since the experimentation is a crucial part of the evaluation of new metrics and is critical for the success of any measurement activity (Zelkowitz & Wallace, 1998). Through empirical validation, we demonstrate with real evidence that the measure we proposed serves the purpose for which it was defined.
MotIVAtIonIn this section, we describe a scenario in order to explain and illustrate the need for Control-Flow Complexity (CFC) analysis during the design and aging of a process. A major bank has realized that in order to be competitive and efficient, it must adopt a new, modern information system infrastructure. Therefore, a first step was taken in that direction with the adoption of a workflow management system to support its business processes. Since the bank supplies several services to its customers, the adoption of a WfMS has enabled the logic of bank processes to be captured in schema. As a result, part of the services available to customers
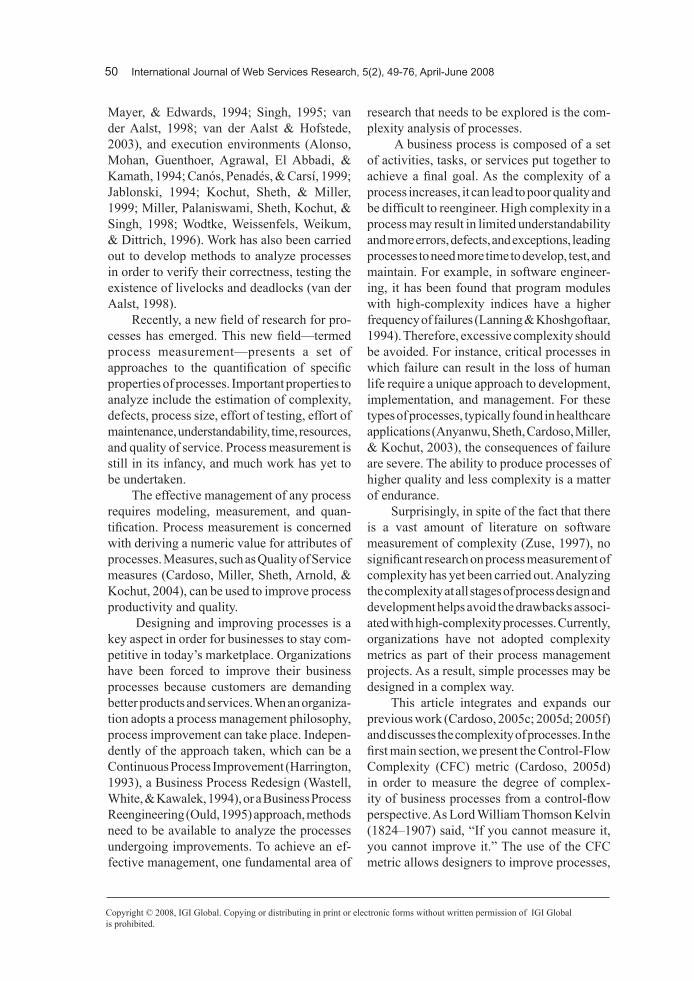
is stored and executed under the supervision of the workflow system. One of the services sup-plied by the bank is the loan process depicted in Figure 1.
This very simple process is composed of only four activities. The Fill Loan Request ac-tivity allows clients to request a loan from the bank. In this step, the client is asked to fill out an electronic form with personal information and data describing the loan being requested. The second activity, Check Educational Loan, determines if the loan request should be accepted or rejected. When the result of a loan application is known, it is e-mailed to the client using the Notify Educational Loan Client activity. Finally, the Archive Application activity creates a report and stores the loan application data in a database record. A complete description of this process is described in Cardoso (2005e).
This first workflow application gains ac-ceptance within the bank since it improves service to customers at several levels, allows significant cost savings, and improves com-munication among employees; the managers of the bank decide to add more services to be supported by the loan process. It was decided to support not only educational loans but also home and car loans.
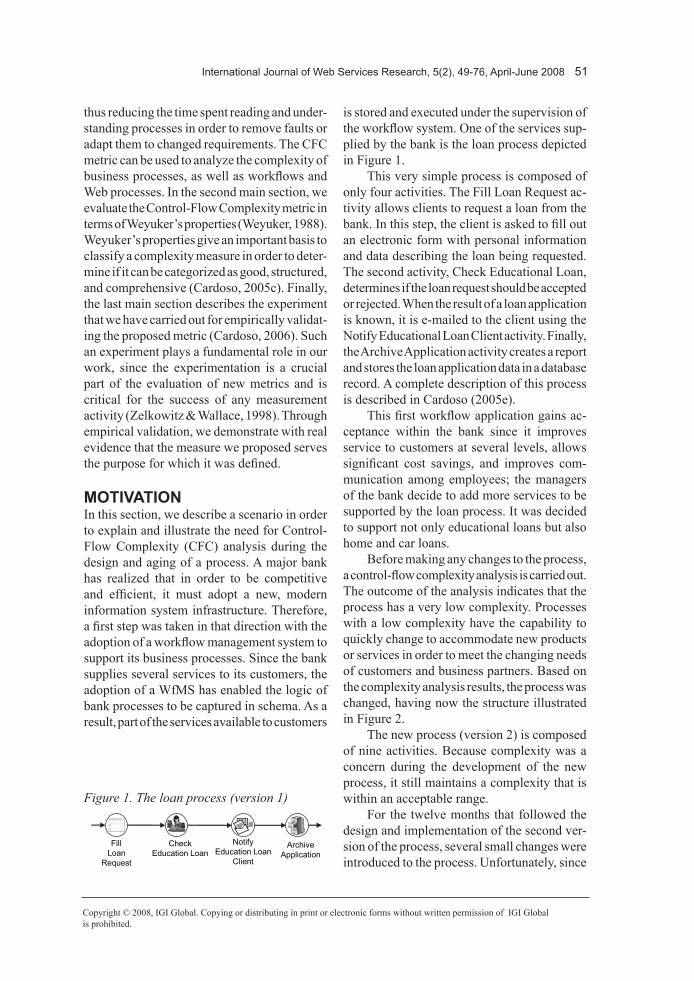
Before making any changes to the process, a control-flow complexity analysis is carried out. The outcome of the analysis indicates that the process has a very low complexity. Processes with a low complexity have the capability to quickly change to accommodate new products or services in order to meet the changing needs of customers and business partners. Based on the complexity analysis results, the process was changed, having now the structure illustrated in Figure 2.
The new process (version 2) is composed of nine activities. Because complexity was a concern during the development of the new process, it still maintains a complexity that is within an acceptable range.
For the twelve months that followed the design and implementation of the second ver-sion of the process, several small changes were introduced to the process. Unfortunately, since
Figure 1. The loan process (version 1)
Fill
LoanRequest
CheckEducation Loan
Archive Application
NotifyEducation Loan
Client
52 International Journal of Web Services Research, 5(2), 49-76, April-June 2008
Copyright © 2008, IGI Global. Copying or distributing in print or electronic forms without written permission of IGI Globalis prohibited.
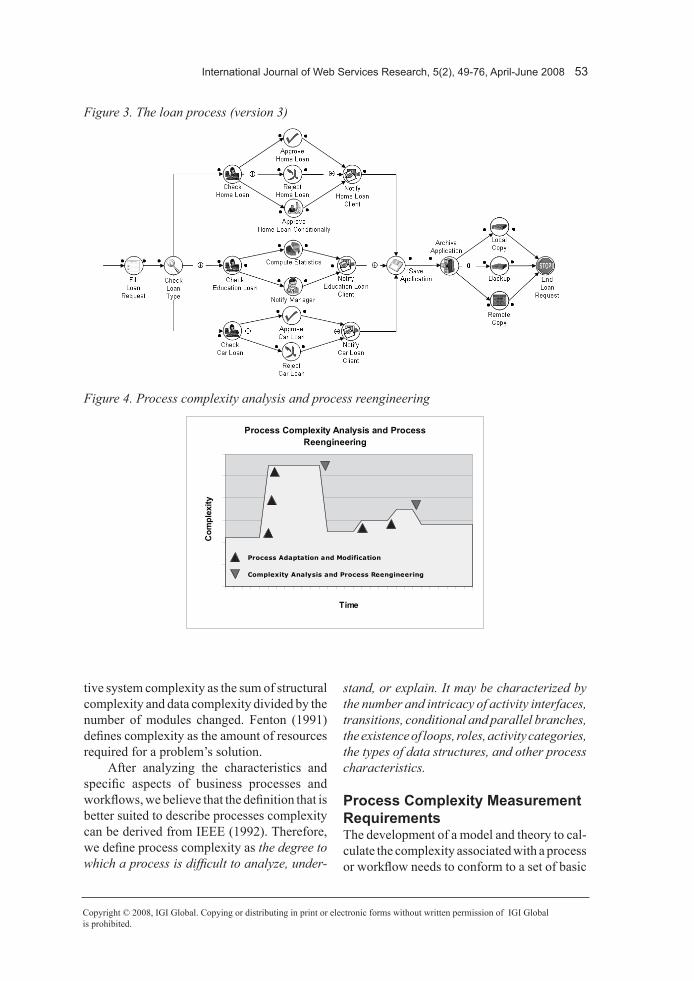
the changes were done incrementally and each one had a small impact on the structure of the process, complexity analysis was not carried out during the process redesign. As a result, the process structure is the following (Figure 3).
The process has evolved over time by modi-fication and may have become fragile with age. Therefore, it is necessary to use techniques such as complexity analysis to assess the system’s condition. A high complexity may be the sign of a brittle, nonflexible, or high-risk process. If high complexity is identified, the process may need to be redesigned to reduce its complexity. Redesign may involve breaking the process into subprocesses or simplifying the way the business process is carried out.
Let us consider again the process from Figure 3. Imagine that the designers are study-ing alternatives to extend the process to handle exceptions. The designers have identified three ways to implement an exception-handling mechanism, and they are undecided about which one to select. In such a scenario, the CFC measure can be effectively used to help the designers in their decision. A “what-if analysis” can be carried out. For each alternative, the CFC can be analyzed, and the alternative that
entails a lower complexity for the process can be selected and implemented.
Analyzing the complexity at all stages of process design and development helps avoid the drawbacks associated with high-complexity processes. Currently, organizations have not implemented complexity limits as part of their business process management projects. The use of complexity analysis will aid in constructing and deploying processes and workflows that are more simple, reliable, and robust.
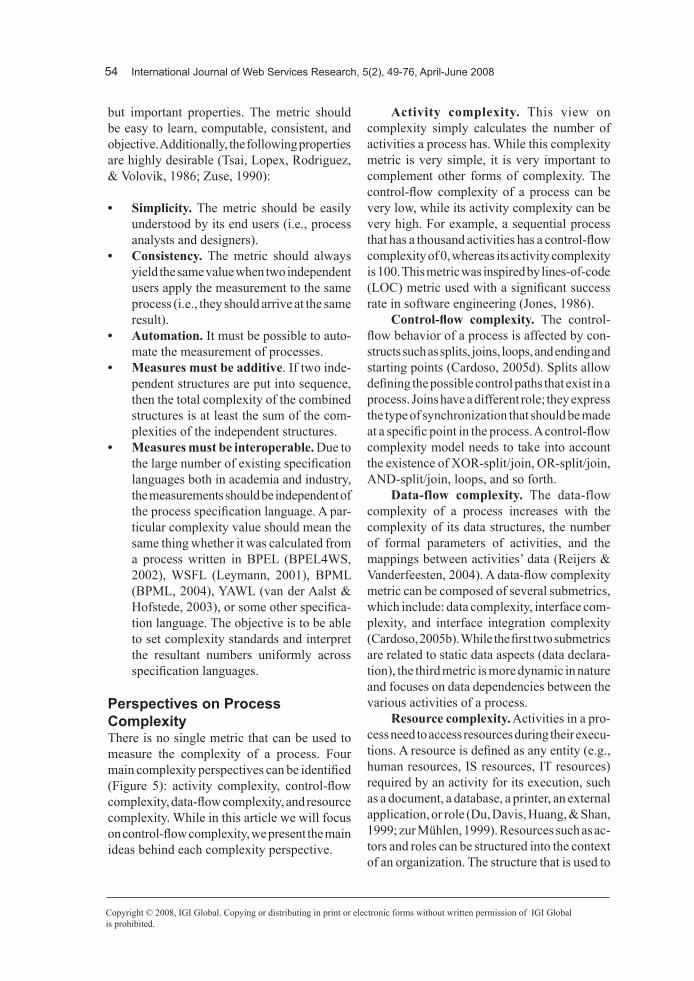
Processes are not static applications. They are constantly undergoing revision, adaptation, change, and modification to meet end users’ needs. The complexity of these processes and their continuous evolution make it very difficult to assure their stability and reliability. In-depth analysis is required for fixing defects in portions of processes of high complexity (Figure 4.).
ProcEss coMPlExItySeveral definitions have been given to describe the meaning of software complexity. For ex-ample, Curtis (1980) states that complexity is a characteristic of the software interface that influences the resources another system will expend or commit while interacting with the software. Card and Agresti (1988) define rela-
Figure 2. The loan process (version 2)
International Journal of Web Services Research, 5(2), 49-76, April-June 2008 53
Copyright © 2008, IGI Global. Copying or distributing in print or electronic forms without written permission of IGI Global is prohibited.
tive system complexity as the sum of structural complexity and data complexity divided by the number of modules changed. Fenton (1991) defines complexity as the amount of resources required for a problem’s solution.
After analyzing the characteristics and specific aspects of business processes and workflows, we believe that the definition that is better suited to describe processes complexity can be derived from IEEE (1992). Therefore, we define process complexity as the degree to which a process is difficult to analyze, under-
stand, or explain. It may be characterized by the number and intricacy of activity interfaces, transitions, conditional and parallel branches, the existence of loops, roles, activity categories, the types of data structures, and other process characteristics.
Process complexity Measurement requirementsThe development of a model and theory to cal-culate the complexity associated with a process or workflow needs to conform to a set of basic
Figure 3. The loan process (version 3)
Figure 4. Process complexity analysis and process reengineering
Process complexity Analysis and Process reengineering
0
10
20
30
40
50
60
1 3 5 7 9 11 13 15 17 19 21 23 25 27 29time
com
plex
ity
Complexity Analysis and Process Reengineering
Process Adaptation and Modification
54 International Journal of Web Services Research, 5(2), 49-76, April-June 2008
Copyright © 2008, IGI Global. Copying or distributing in print or electronic forms without written permission of IGI Globalis prohibited.
but important properties. The metric should be easy to learn, computable, consistent, and objective. Additionally, the following properties are highly desirable (Tsai, Lopex, Rodriguez, & Volovik, 1986; Zuse, 1990):
• Simplicity. The metric should be easily understood by its end users (i.e., process analysts and designers).
• Consistency. The metric should always yield the same value when two independent users apply the measurement to the same process (i.e., they should arrive at the same result).
• Automation. It must be possible to auto-mate the measurement of processes.
• Measuresmustbeadditive. If two inde-pendent structures are put into sequence, then the total complexity of the combined structures is at least the sum of the com-plexities of the independent structures.
• Measuresmustbeinteroperable. Due to the large number of existing specification languages both in academia and industry, the measurements should be independent of the process specification language. A par-ticular complexity value should mean the same thing whether it was calculated from a process written in BPEL (BPEL4WS, 2002), WSFL (Leymann, 2001), BPML (BPML, 2004), YAWL (van der Aalst & Hofstede, 2003), or some other specifica-tion language. The objective is to be able to set complexity standards and interpret the resultant numbers uniformly across specification languages.
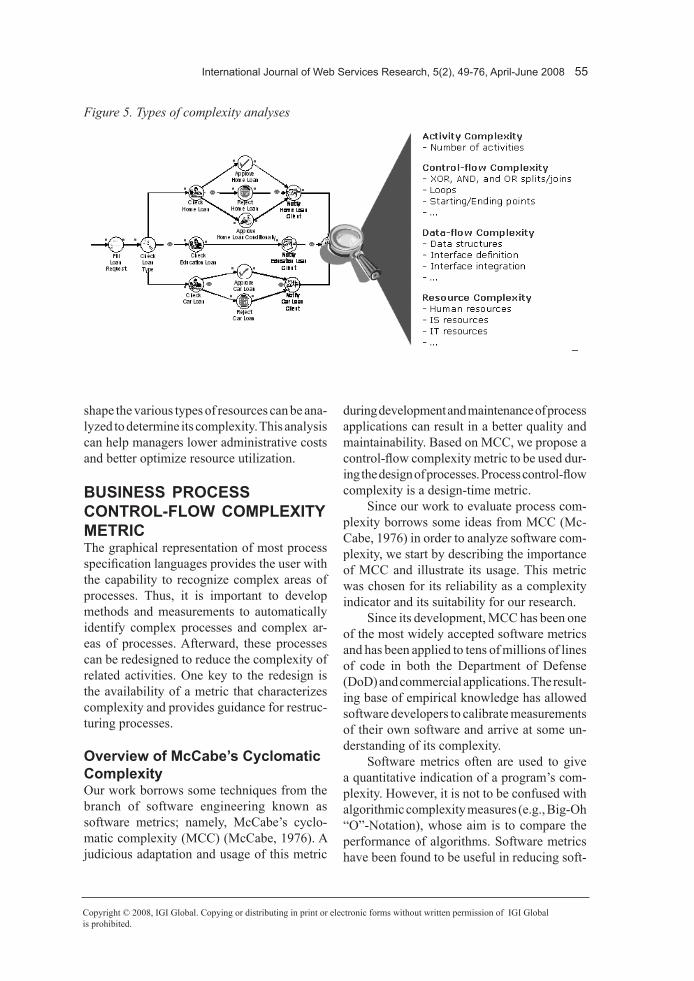
Perspectives on Process complexityThere is no single metric that can be used to measure the complexity of a process. Four main complexity perspectives can be identified (Figure 5): activity complexity, control-flow complexity, data-flow complexity, and resource complexity. While in this article we will focus on control-flow complexity, we present the main ideas behind each complexity perspective.
Activity complexity. This view on complexity simply calculates the number of activities a process has. While this complexity metric is very simple, it is very important to complement other forms of complexity. The control-flow complexity of a process can be very low, while its activity complexity can be very high. For example, a sequential process that has a thousand activities has a control-flow complexity of 0, whereas its activity complexity is 100. This metric was inspired by lines-of-code (LOC) metric used with a significant success rate in software engineering (Jones, 1986).
Control-flow complexity. The control-flow behavior of a process is affected by con-structs such as splits, joins, loops, and ending and starting points (Cardoso, 2005d). Splits allow defining the possible control paths that exist in a process. Joins have a different role; they express the type of synchronization that should be made at a specific point in the process. A control-flow complexity model needs to take into account the existence of XOR-split/join, OR-split/join, AND-split/join, loops, and so forth.
Data-flow complexity. The data-flow complexity of a process increases with the complexity of its data structures, the number of formal parameters of activities, and the mappings between activities’ data (Reijers & Vanderfeesten, 2004). A data-flow complexity metric can be composed of several submetrics, which include: data complexity, interface com-plexity, and interface integration complexity (Cardoso, 2005b). While the first two submetrics are related to static data aspects (data declara-tion), the third metric is more dynamic in nature and focuses on data dependencies between the various activities of a process.
Resourcecomplexity. Activities in a pro-cess need to access resources during their execu-tions. A resource is defined as any entity (e.g., human resources, IS resources, IT resources) required by an activity for its execution, such as a document, a database, a printer, an external application, or role (Du, Davis, Huang, & Shan, 1999; zur Mühlen, 1999). Resources such as ac-tors and roles can be structured into the context of an organization. The structure that is used to
International Journal of Web Services Research, 5(2), 49-76, April-June 2008 55
Copyright © 2008, IGI Global. Copying or distributing in print or electronic forms without written permission of IGI Global is prohibited.
shape the various types of resources can be ana-lyzed to determine its complexity. This analysis can help managers lower administrative costs and better optimize resource utilization.
busInEss ProcEss control-Flow coMPlExIty MEtrIcThe graphical representation of most process specification languages provides the user with the capability to recognize complex areas of processes. Thus, it is important to develop methods and measurements to automatically identify complex processes and complex ar-eas of processes. Afterward, these processes can be redesigned to reduce the complexity of related activities. One key to the redesign is the availability of a metric that characterizes complexity and provides guidance for restruc-turing processes.
overview of Mccabe’s cyclomatic complexityOur work borrows some techniques from the branch of software engineering known as software metrics; namely, McCabe’s cyclo-matic complexity (MCC) (McCabe, 1976). A judicious adaptation and usage of this metric
during development and maintenance of process applications can result in a better quality and maintainability. Based on MCC, we propose a control-flow complexity metric to be used dur-ing the design of processes. Process control-flow complexity is a design-time metric.
Since our work to evaluate process com-plexity borrows some ideas from MCC (Mc-Cabe, 1976) in order to analyze software com-plexity, we start by describing the importance of MCC and illustrate its usage. This metric was chosen for its reliability as a complexity indicator and its suitability for our research.
Since its development, MCC has been one of the most widely accepted software metrics and has been applied to tens of millions of lines of code in both the Department of Defense (DoD) and commercial applications. The result-ing base of empirical knowledge has allowed software developers to calibrate measurements of their own software and arrive at some un-derstanding of its complexity.
Software metrics often are used to give a quantitative indication of a program’s com-plexity. However, it is not to be confused with algorithmic complexity measures (e.g., Big-Oh “O”-Notation), whose aim is to compare the performance of algorithms. Software metrics have been found to be useful in reducing soft-
Figure 5. Types of complexity analyses
56 International Journal of Web Services Research, 5(2), 49-76, April-June 2008
Copyright © 2008, IGI Global. Copying or distributing in print or electronic forms without written permission of IGI Globalis prohibited.
ware maintenance costs by assigning a numeric value to reflect the ease or difficulty with which a program module may be understood.
MCC is a measure of the number of linearly independent paths in a program. It is intended to be independent of language and language format (McCabe & Watson, 1994). MCC is an indication of a program module’s control flow complexity. Derived from a module’s control graph representation, MCC has been found to be a reliable indicator of complexity in large software projects (Ward, 1989). This metric is based on the assumption that a program’s complexity is related to the number of control paths through the program. For example, a 10-line program with 10 assignment statements is easier to understand than a 10-line program with 10 if-then statements.
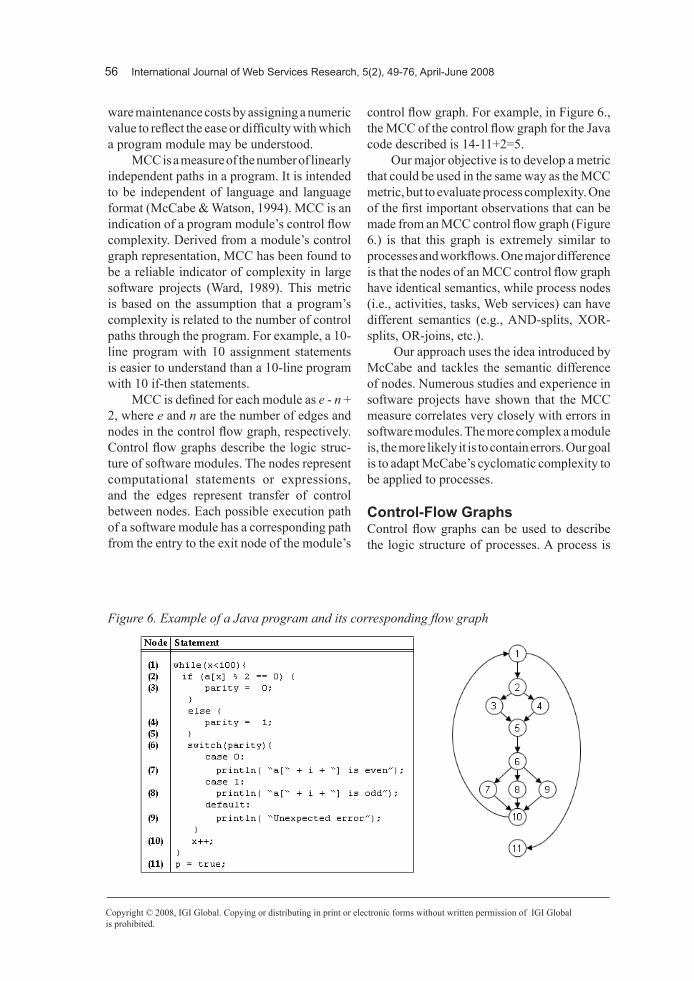
MCC is defined for each module as e - n + 2, where e and n are the number of edges and nodes in the control flow graph, respectively. Control flow graphs describe the logic struc-ture of software modules. The nodes represent computational statements or expressions, and the edges represent transfer of control between nodes. Each possible execution path of a software module has a corresponding path from the entry to the exit node of the module’s
control flow graph. For example, in Figure 6., the MCC of the control flow graph for the Java code described is 14-11+2=5.
Our major objective is to develop a metric that could be used in the same way as the MCC metric, but to evaluate process complexity. One of the first important observations that can be made from an MCC control flow graph (Figure 6.) is that this graph is extremely similar to processes and workflows. One major difference is that the nodes of an MCC control flow graph have identical semantics, while process nodes (i.e., activities, tasks, Web services) can have different semantics (e.g., AND-splits, XOR-splits, OR-joins, etc.).
Our approach uses the idea introduced by McCabe and tackles the semantic difference of nodes. Numerous studies and experience in software projects have shown that the MCC measure correlates very closely with errors in software modules. The more complex a module is, the more likely it is to contain errors. Our goal is to adapt McCabe’s cyclomatic complexity to be applied to processes.
control-Flow GraphsControl flow graphs can be used to describe the logic structure of processes. A process is
Figure 6. Example of a Java program and its corresponding flow graph
International Journal of Web Services Research, 5(2), 49-76, April-June 2008 57
Copyright © 2008, IGI Global. Copying or distributing in print or electronic forms without written permission of IGI Global is prohibited.
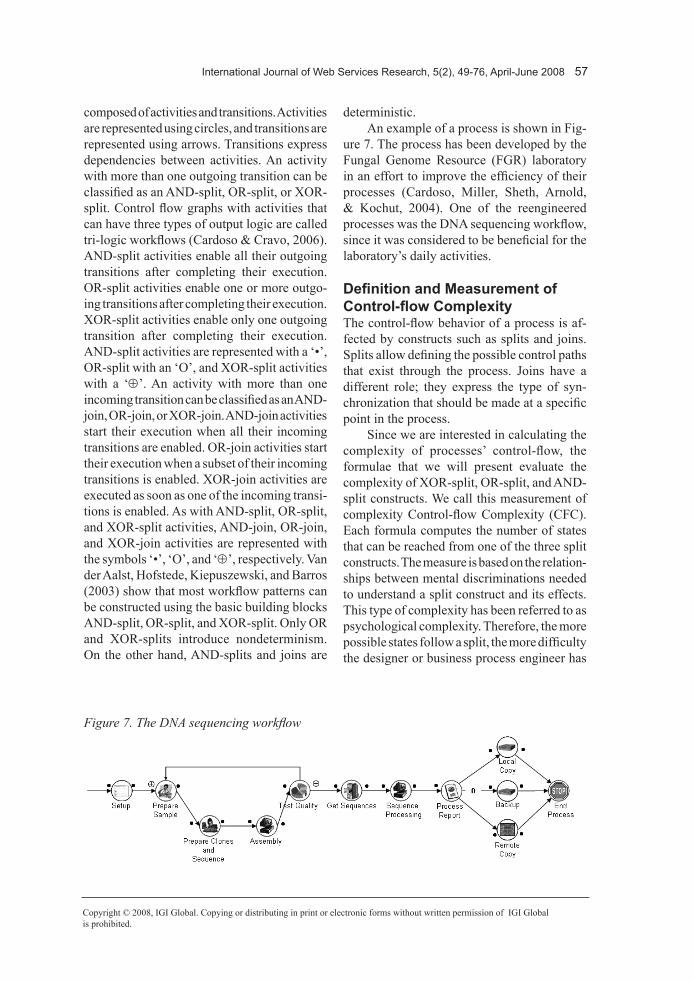
composed of activities and transitions. Activities are represented using circles, and transitions are represented using arrows. Transitions express dependencies between activities. An activity with more than one outgoing transition can be classified as an AND-split, OR-split, or XOR-split. Control flow graphs with activities that can have three types of output logic are called tri-logic workflows (Cardoso & Cravo, 2006). AND-split activities enable all their outgoing transitions after completing their execution. OR-split activities enable one or more outgo-ing transitions after completing their execution. XOR-split activities enable only one outgoing transition after completing their execution. AND-split activities are represented with a ‘•’, OR-split with an ‘O’, and XOR-split activities with a ‘⊕’. An activity with more than one incoming transition can be classified as an AND-join, OR-join, or XOR-join. AND-join activities start their execution when all their incoming transitions are enabled. OR-join activities start their execution when a subset of their incoming transitions is enabled. XOR-join activities are executed as soon as one of the incoming transi-tions is enabled. As with AND-split, OR-split, and XOR-split activities, AND-join, OR-join, and XOR-join activities are represented with the symbols ‘•’, ‘O’, and ‘⊕’, respectively. Van der Aalst, Hofstede, Kiepuszewski, and Barros (2003) show that most workflow patterns can be constructed using the basic building blocks AND-split, OR-split, and XOR-split. Only OR and XOR-splits introduce nondeterminism. On the other hand, AND-splits and joins are
deterministic.An example of a process is shown in Fig-
ure 7. The process has been developed by the Fungal Genome Resource (FGR) laboratory in an effort to improve the efficiency of their processes (Cardoso, Miller, Sheth, Arnold, & Kochut, 2004). One of the reengineered processes was the DNA sequencing workflow, since it was considered to be beneficial for the laboratory’s daily activities.
Definition and Measurement of Control-flow ComplexityThe control-flow behavior of a process is af-fected by constructs such as splits and joins. Splits allow defining the possible control paths that exist through the process. Joins have a different role; they express the type of syn-chronization that should be made at a specific point in the process.
Since we are interested in calculating the complexity of processes’ control-flow, the formulae that we will present evaluate the complexity of XOR-split, OR-split, and AND-split constructs. We call this measurement of complexity Control-flow Complexity (CFC). Each formula computes the number of states that can be reached from one of the three split constructs. The measure is based on the relation-ships between mental discriminations needed to understand a split construct and its effects. This type of complexity has been referred to as psychological complexity. Therefore, the more possible states follow a split, the more difficulty the designer or business process engineer has
Figure 7. The DNA sequencing workflow
58 International Journal of Web Services Research, 5(2), 49-76, April-June 2008
Copyright © 2008, IGI Global. Copying or distributing in print or electronic forms without written permission of IGI Globalis prohibited.
to understand the section of a processes and, thus, the process itself.
In processes, the MCC cannot be used suc-cessfully since the metric ignores the semantics associated with nodes of the graph. While the nodes (i.e., activities) of processes have distinct semantics associated, the nodes of a program’s flow graph are undifferentiated.
We now introduce several definitions that will constitute the basis for CFC measure-ment.
Definition 1 (Process): A process is a collec-tion of activities that takes one or more kinds of input and creates an output that is of value to the customer (Hammer & Champy, 1993). A process is a specific ordering of activities across time and place, with a beginning, an end, and clearly identified inputs and outputs (Davenport, 1993).
Definition 2 (Process Property): A property is a feature, characteristic, or attribute of a process such as complexity, maintainability, cost, reliability, and so forth. Process properties can be evaluated and quantified using suitable models, methods, and algorithms.
Definition 3 (Process Measure): A process measure is an empirical assignment of num-bers (or symbols) to processes in order to characterize a specific property. Let P be a set of processes. Let N be a set of formal objects, such as numbers. A measure m is defined to be a mapping, m: P→N. This guarantees that every process has a measure, and every process has only one measure. However, it does not require that every number (in set N) be the measure of some process in set P.
Definition 4 (Process Metric): Process metric is any type of measurement related to a process. Process metrics allows attributes of processes to be quantified.
Definition 5 (Activity Fan-out): Fan-out is the number of transitions going out of an activity.
The fan-out is computed using function fan-out(a), where a is an activity.
Definition 6 (Control-flow-induced Mental State): A mental state is a state that has to be considered when a designer is developing a process. Splits introduce the notion of mental states in processes. When a split (XOR, OR, or AND) is introduced in a process, the business process designer has to mentally create a map or structure that accounts for the number of states that can be reached from the split.
The notion of mental state is important since there are certain theories (Miller, 1956) that prove that complexity beyond a certain point defeats the human mind’s ability to perform accurate symbolic manipulations and, hence, results in error.
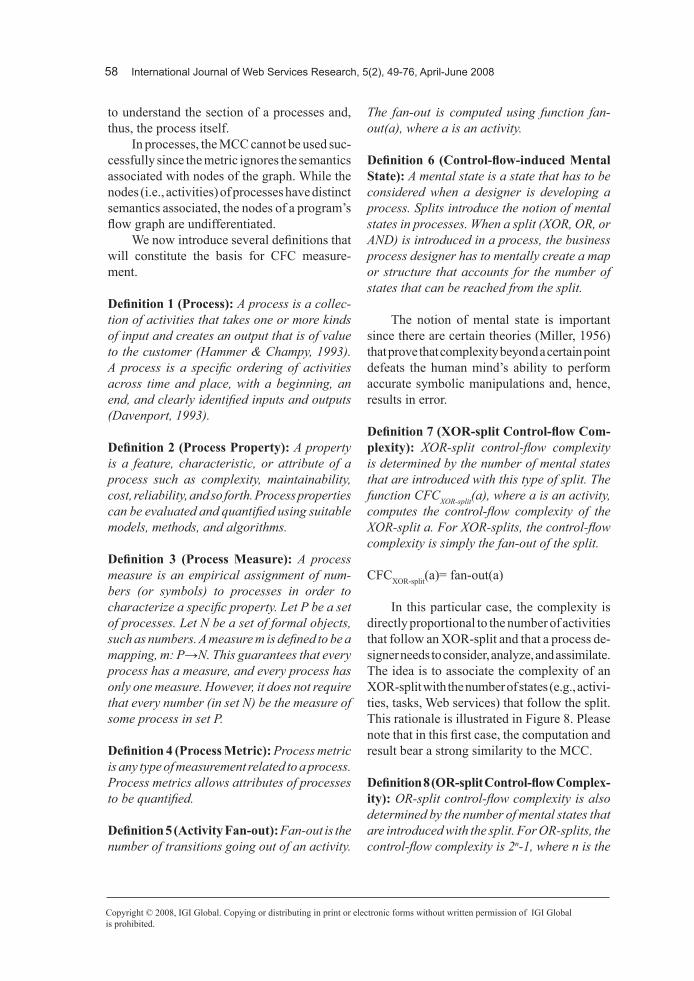
Definition 7 (XOR-split Control-flow Com-plexity): XOR-split control-flow complexity is determined by the number of mental states that are introduced with this type of split. The function CFCXOR-split(a), where a is an activity, computes the control-flow complexity of the XOR-split a. For XOR-splits, the control-flow complexity is simply the fan-out of the split.
CFCXOR-split(a)= fan-out(a)
In this particular case, the complexity is directly proportional to the number of activities that follow an XOR-split and that a process de-signer needs to consider, analyze, and assimilate. The idea is to associate the complexity of an XOR-split with the number of states (e.g., activi-ties, tasks, Web services) that follow the split. This rationale is illustrated in Figure 8. Please note that in this first case, the computation and result bear a strong similarity to the MCC.
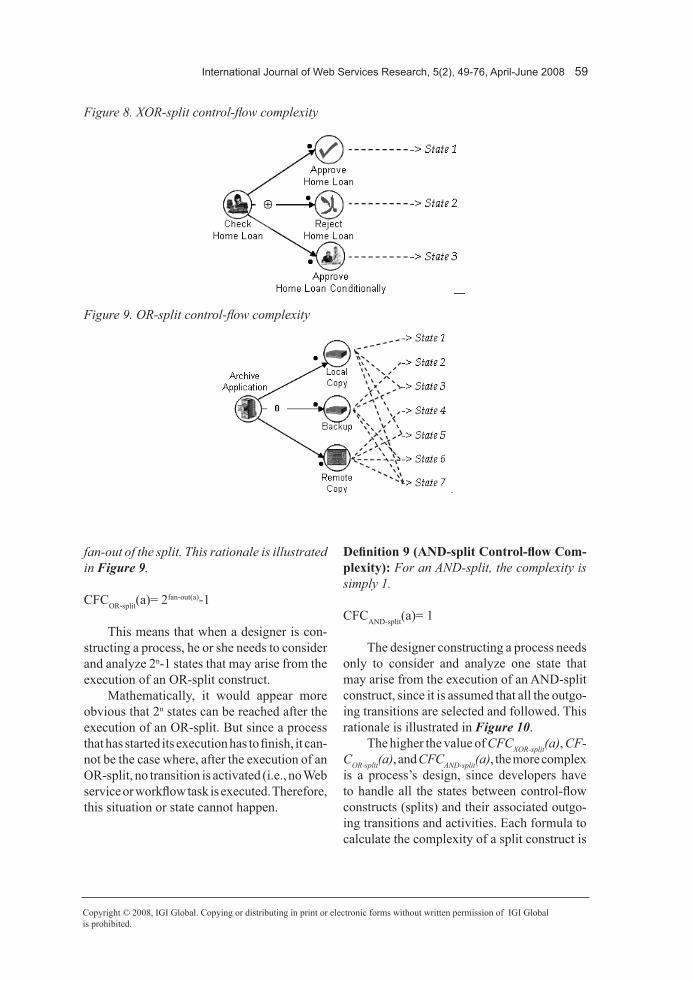
Definition 8 (OR-split Control-flow Complex-ity): OR-split control-flow complexity is also determined by the number of mental states that are introduced with the split. For OR-splits, the control-flow complexity is 2n-1, where n is the
International Journal of Web Services Research, 5(2), 49-76, April-June 2008 59
Copyright © 2008, IGI Global. Copying or distributing in print or electronic forms without written permission of IGI Global is prohibited.
fan-out of the split. This rationale is illustrated in Figure 9.
CFCOR-split(a)= 2fan-out(a)-1
This means that when a designer is con-structing a process, he or she needs to consider and analyze 2n-1 states that may arise from the execution of an OR-split construct.
Mathematically, it would appear more obvious that 2n states can be reached after the execution of an OR-split. But since a process that has started its execution has to finish, it can-not be the case where, after the execution of an OR-split, no transition is activated (i.e., no Web service or workflow task is executed. Therefore, this situation or state cannot happen.
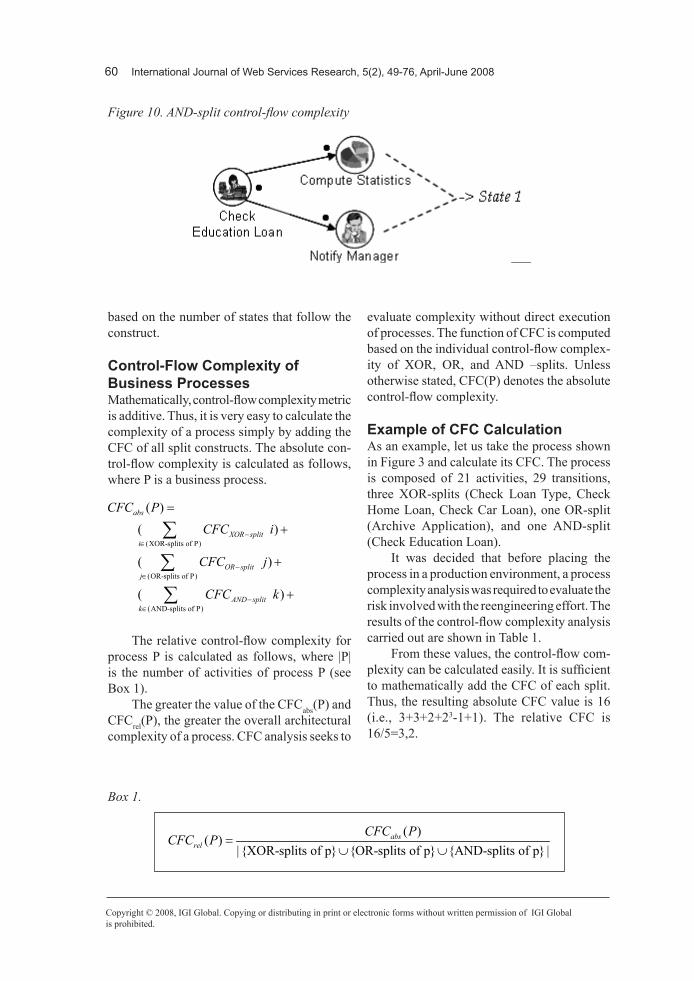
Definition 9 (AND-split Control-flow Com-plexity): For an AND-split, the complexity is simply 1.
CFCAND-split(a)= 1
The designer constructing a process needs only to consider and analyze one state that may arise from the execution of an AND-split construct, since it is assumed that all the outgo-ing transitions are selected and followed. This rationale is illustrated in Figure 10.
The higher the value of CFCXOR-split(a), CF-COR-split(a), and CFCAND-split(a), the more complex is a process’s design, since developers have to handle all the states between control-flow constructs (splits) and their associated outgo-ing transitions and activities. Each formula to calculate the complexity of a split construct is
Figure 8. XOR-split control-flow complexity
Figure 9. OR-split control-flow complexity
60 International Journal of Web Services Research, 5(2), 49-76, April-June 2008
Copyright © 2008, IGI Global. Copying or distributing in print or electronic forms without written permission of IGI Globalis prohibited.
based on the number of states that follow the construct.
control-Flow complexity of business ProcessesMathematically, control-flow complexity metric is additive. Thus, it is very easy to calculate the complexity of a process simply by adding the CFC of all split constructs. The absolute con-trol-flow complexity is calculated as follows, where P is a business process.
(XOR-splits of P)
(OR-splits of P)
(AND-splits of P)
( ) ( )
( )
( )
abs
XOR spliti
OR splitj
AND splitk
CFC PCFC i
CFC j
CFC k
−∈
−∈
−∈
=
+
+
+
∑
∑
∑
The relative control-flow complexity for process P is calculated as follows, where |P| is the number of activities of process P (see Box 1).
The greater the value of the CFCabs(P) and CFCrel(P), the greater the overall architectural complexity of a process. CFC analysis seeks to
evaluate complexity without direct execution of processes. The function of CFC is computed based on the individual control-flow complex-ity of XOR, OR, and AND –splits. Unless otherwise stated, CFC(P) denotes the absolute control-flow complexity.
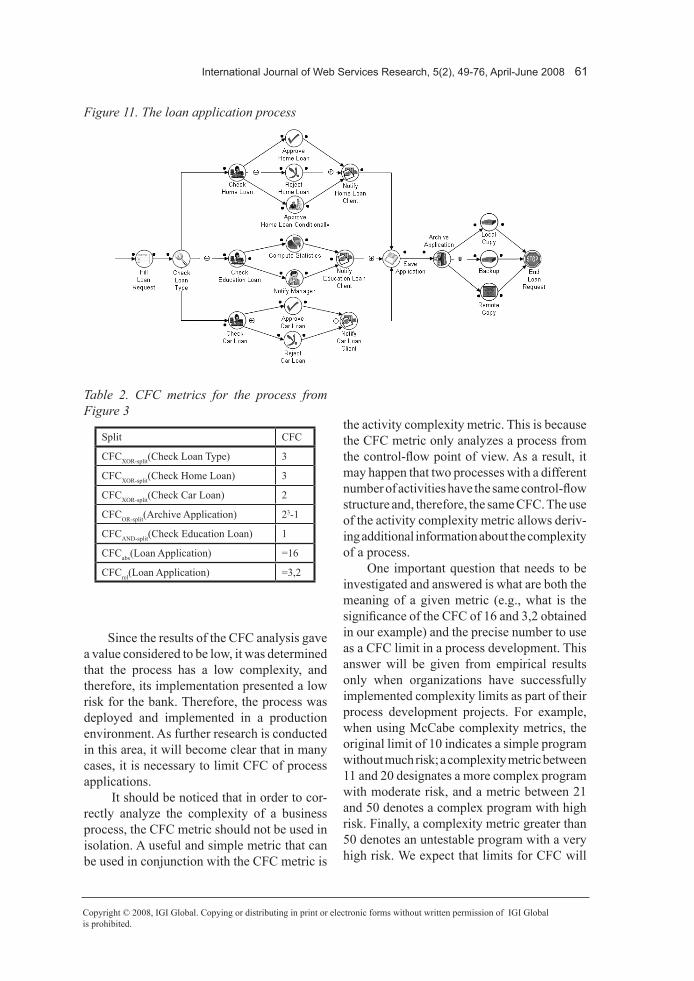
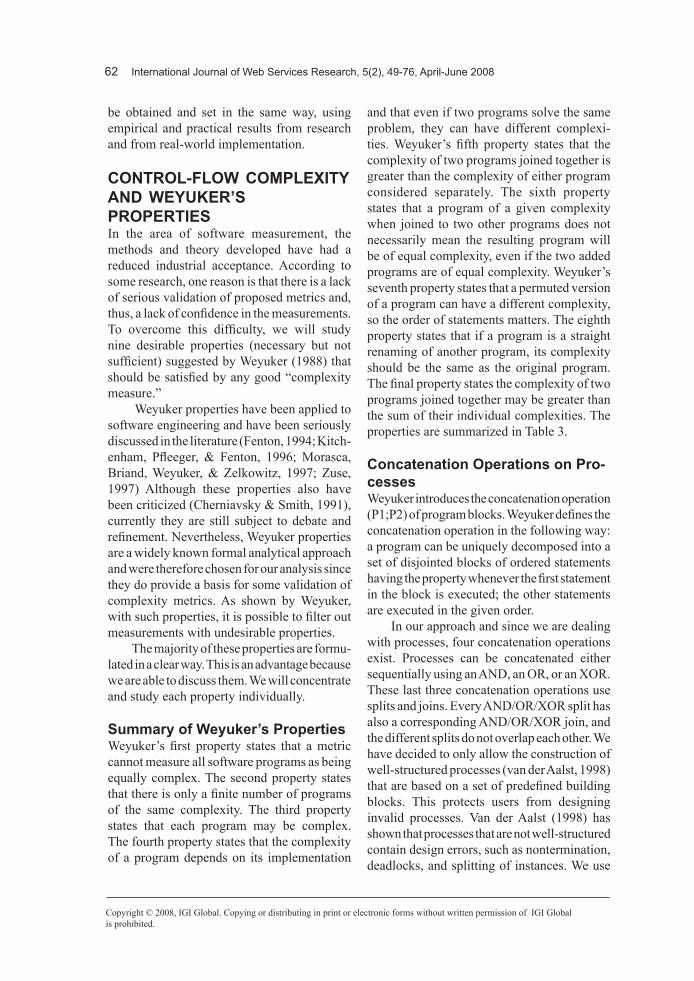
Example of cFc calculationAs an example, let us take the process shown in Figure 3 and calculate its CFC. The process is composed of 21 activities, 29 transitions, three XOR-splits (Check Loan Type, Check Home Loan, Check Car Loan), one OR-split (Archive Application), and one AND-split (Check Education Loan).
It was decided that before placing the process in a production environment, a process complexity analysis was required to evaluate the risk involved with the reengineering effort. The results of the control-flow complexity analysis carried out are shown in Table 1.
From these values, the control-flow com-plexity can be calculated easily. It is sufficient to mathematically add the CFC of each split. Thus, the resulting absolute CFC value is 16 (i.e., 3+3+2+23-1+1). The relative CFC is 16/5=3,2.
Figure 10. AND-split control-flow complexity
Box 1.
( )( )
| {XOR-splits of p} {OR-splits of p} {AND-splits of p} |abs
relCFC P
CFC P =∪ ∪
International Journal of Web Services Research, 5(2), 49-76, April-June 2008 61
Copyright © 2008, IGI Global. Copying or distributing in print or electronic forms without written permission of IGI Global is prohibited.
Since the results of the CFC analysis gave a value considered to be low, it was determined that the process has a low complexity, and therefore, its implementation presented a low risk for the bank. Therefore, the process was deployed and implemented in a production environment. As further research is conducted in this area, it will become clear that in many cases, it is necessary to limit CFC of process applications.
It should be noticed that in order to cor-rectly analyze the complexity of a business process, the CFC metric should not be used in isolation. A useful and simple metric that can be used in conjunction with the CFC metric is
the activity complexity metric. This is because the CFC metric only analyzes a process from the control-flow point of view. As a result, it may happen that two processes with a different number of activities have the same control-flow structure and, therefore, the same CFC. The use of the activity complexity metric allows deriv-ing additional information about the complexity of a process.
One important question that needs to be investigated and answered is what are both the meaning of a given metric (e.g., what is the significance of the CFC of 16 and 3,2 obtained in our example) and the precise number to use as a CFC limit in a process development. This answer will be given from empirical results only when organizations have successfully implemented complexity limits as part of their process development projects. For example, when using McCabe complexity metrics, the original limit of 10 indicates a simple program without much risk; a complexity metric between 11 and 20 designates a more complex program with moderate risk, and a metric between 21 and 50 denotes a complex program with high risk. Finally, a complexity metric greater than 50 denotes an untestable program with a very high risk. We expect that limits for CFC will
Figure 11. The loan application process
Split CFC
CFCXOR-split(Check Loan Type) 3
CFCXOR-split(Check Home Loan) 3
CFCXOR-split(Check Car Loan) 2
CFCOR-split(Archive Application) 23-1
CFCAND-split(Check Education Loan) 1
CFCabs(Loan Application) =16
CFCrel(Loan Application) =3,2
Table 2. CFC metrics for the process from Figure 3
62 International Journal of Web Services Research, 5(2), 49-76, April-June 2008
Copyright © 2008, IGI Global. Copying or distributing in print or electronic forms without written permission of IGI Globalis prohibited.
be obtained and set in the same way, using empirical and practical results from research and from real-world implementation.
control-Flow coMPlExIty And wEyukEr’s ProPErtIEsIn the area of software measurement, the methods and theory developed have had a reduced industrial acceptance. According to some research, one reason is that there is a lack of serious validation of proposed metrics and, thus, a lack of confidence in the measurements. To overcome this difficulty, we will study nine desirable properties (necessary but not sufficient) suggested by Weyuker (1988) that should be satisfied by any good “complexity measure.”
Weyuker properties have been applied to software engineering and have been seriously discussed in the literature (Fenton, 1994; Kitch-enham, Pfleeger, & Fenton, 1996; Morasca, Briand, Weyuker, & Zelkowitz, 1997; Zuse, 1997) Although these properties also have been criticized (Cherniavsky & Smith, 1991), currently they are still subject to debate and refinement. Nevertheless, Weyuker properties are a widely known formal analytical approach and were therefore chosen for our analysis since they do provide a basis for some validation of complexity metrics. As shown by Weyuker, with such properties, it is possible to filter out measurements with undesirable properties.
The majority of these properties are formu-lated in a clear way. This is an advantage because we are able to discuss them. We will concentrate and study each property individually.
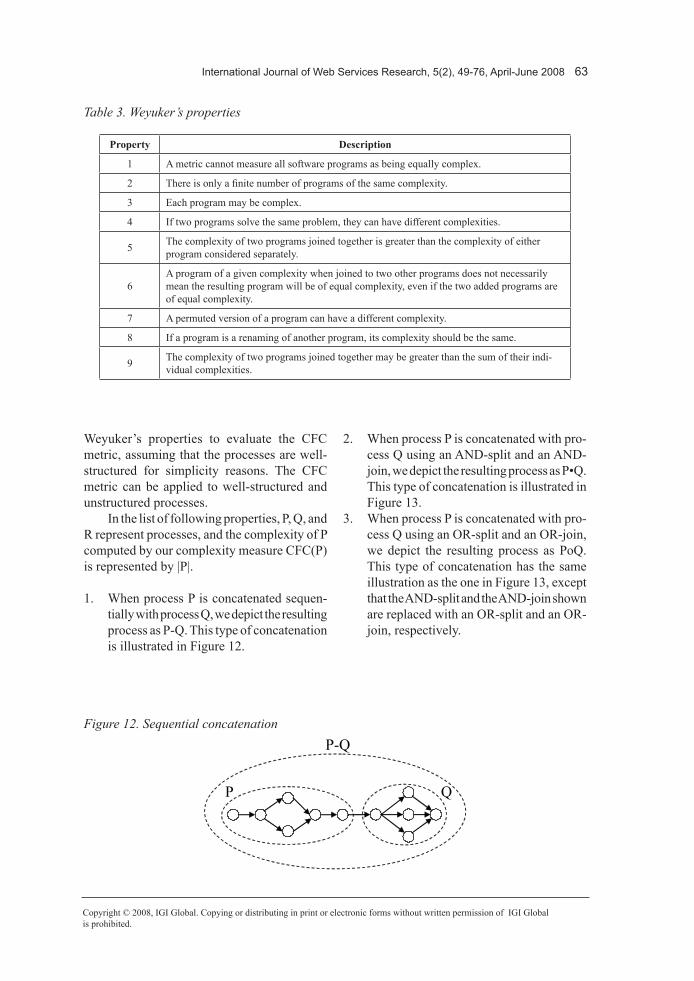
summary of weyuker’s Properties Weyuker’s first property states that a metric cannot measure all software programs as being equally complex. The second property states that there is only a finite number of programs of the same complexity. The third property states that each program may be complex. The fourth property states that the complexity of a program depends on its implementation
and that even if two programs solve the same problem, they can have different complexi-ties. Weyuker’s fifth property states that the complexity of two programs joined together is greater than the complexity of either program considered separately. The sixth property states that a program of a given complexity when joined to two other programs does not necessarily mean the resulting program will be of equal complexity, even if the two added programs are of equal complexity. Weyuker’s seventh property states that a permuted version of a program can have a different complexity, so the order of statements matters. The eighth property states that if a program is a straight renaming of another program, its complexity should be the same as the original program. The final property states the complexity of two programs joined together may be greater than the sum of their individual complexities. The properties are summarized in Table 3.
concatenation operations on Pro-cessesWeyuker introduces the concatenation operation (P1;P2) of program blocks. Weyuker defines the concatenation operation in the following way: a program can be uniquely decomposed into a set of disjointed blocks of ordered statements having the property whenever the first statement in the block is executed; the other statements are executed in the given order.
In our approach and since we are dealing with processes, four concatenation operations exist. Processes can be concatenated either sequentially using an AND, an OR, or an XOR. These last three concatenation operations use splits and joins. Every AND/OR/XOR split has also a corresponding AND/OR/XOR join, and the different splits do not overlap each other. We have decided to only allow the construction of well-structured processes (van der Aalst, 1998) that are based on a set of predefined building blocks. This protects users from designing invalid processes. Van der Aalst (1998) has shown that processes that are not well-structured contain design errors, such as nontermination, deadlocks, and splitting of instances. We use
International Journal of Web Services Research, 5(2), 49-76, April-June 2008 63
Copyright © 2008, IGI Global. Copying or distributing in print or electronic forms without written permission of IGI Global is prohibited.
Weyuker’s properties to evaluate the CFC metric, assuming that the processes are well-structured for simplicity reasons. The CFC metric can be applied to well-structured and unstructured processes.
In the list of following properties, P, Q, and R represent processes, and the complexity of P computed by our complexity measure CFC(P) is represented by |P|.
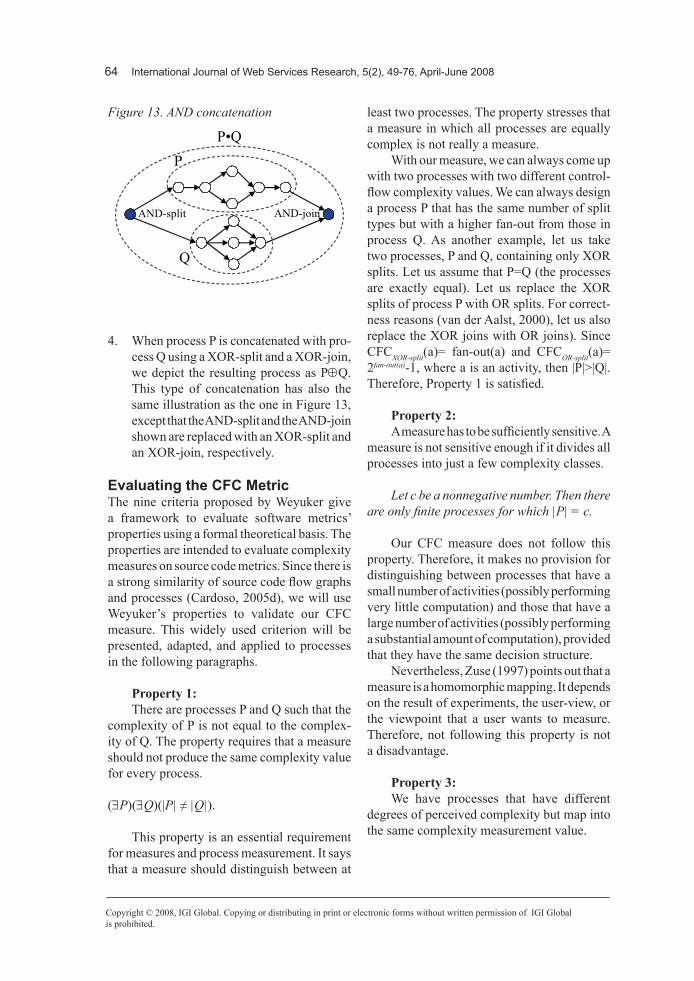
1. When process P is concatenated sequen-tially with process Q, we depict the resulting process as P-Q. This type of concatenation is illustrated in Figure 12.
2. When process P is concatenated with pro-cess Q using an AND-split and an AND-join, we depict the resulting process as P•Q. This type of concatenation is illustrated in Figure 13.
3. When process P is concatenated with pro-cess Q using an OR-split and an OR-join, we depict the resulting process as PoQ. This type of concatenation has the same illustration as the one in Figure 13, except that the AND-split and the AND-join shown are replaced with an OR-split and an OR-join, respectively.
Property Description
1 A metric cannot measure all software programs as being equally complex.
2 There is only a finite number of programs of the same complexity.
3 Each program may be complex.
4 If two programs solve the same problem, they can have different complexities.
5 The complexity of two programs joined together is greater than the complexity of either program considered separately.
6A program of a given complexity when joined to two other programs does not necessarily mean the resulting program will be of equal complexity, even if the two added programs are of equal complexity.
7 A permuted version of a program can have a different complexity.
8 If a program is a renaming of another program, its complexity should be the same.
9 The complexity of two programs joined together may be greater than the sum of their indi-vidual complexities.
Table 3. Weyuker’s properties
Figure 12. Sequential concatenation
QP
P-Q
64 International Journal of Web Services Research, 5(2), 49-76, April-June 2008
Copyright © 2008, IGI Global. Copying or distributing in print or electronic forms without written permission of IGI Globalis prohibited.
4. When process P is concatenated with pro-cess Q using a XOR-split and a XOR-join, we depict the resulting process as P⊕Q. This type of concatenation has also the same illustration as the one in Figure 13, except that the AND-split and the AND-join shown are replaced with an XOR-split and an XOR-join, respectively.
Evaluating the cFc MetricThe nine criteria proposed by Weyuker give a framework to evaluate software metrics’ properties using a formal theoretical basis. The properties are intended to evaluate complexity measures on source code metrics. Since there is a strong similarity of source code flow graphs and processes (Cardoso, 2005d), we will use Weyuker’s properties to validate our CFC measure. This widely used criterion will be presented, adapted, and applied to processes in the following paragraphs.
Property 1:There are processes P and Q such that the
complexity of P is not equal to the complex-ity of Q. The property requires that a measure should not produce the same complexity value for every process.
(∃P)(∃Q)(|P| ≠ |Q|).
This property is an essential requirement for measures and process measurement. It says that a measure should distinguish between at
least two processes. The property stresses that a measure in which all processes are equally complex is not really a measure.
With our measure, we can always come up with two processes with two different control-flow complexity values. We can always design a process P that has the same number of split types but with a higher fan-out from those in process Q. As another example, let us take two processes, P and Q, containing only XOR splits. Let us assume that P=Q (the processes are exactly equal). Let us replace the XOR splits of process P with OR splits. For correct-ness reasons (van der Aalst, 2000), let us also replace the XOR joins with OR joins). Since CFCXOR-split(a)= fan-out(a) and CFCOR-split(a)= 2fan-out(a)-1, where a is an activity, then |P|>|Q|. Therefore, Property 1 is satisfied.
Property 2:A measure has to be sufficiently sensitive. A
measure is not sensitive enough if it divides all processes into just a few complexity classes.
Let c be a nonnegative number. Then there are only finite processes for which |P| = c.
Our CFC measure does not follow this property. Therefore, it makes no provision for distinguishing between processes that have a small number of activities (possibly performing very little computation) and those that have a large number of activities (possibly performing a substantial amount of computation), provided that they have the same decision structure.
Nevertheless, Zuse (1997) points out that a measure is a homomorphic mapping. It depends on the result of experiments, the user-view, or the viewpoint that a user wants to measure. Therefore, not following this property is not a disadvantage.
Property 3:We have processes that have different
degrees of perceived complexity but map into the same complexity measurement value.
Figure 13. AND concatenation
P
Q
P•Q
AND-split AND-join
International Journal of Web Services Research, 5(2), 49-76, April-June 2008 65
Copyright © 2008, IGI Global. Copying or distributing in print or electronic forms without written permission of IGI Global is prohibited.
There are distinct processes P and Q such that |P|=|Q|.
A measure that assigns a distinct value to every process is not much of a measure. It would go against the principle of measurements, which requires that the number of objects that can be measured be greater than the range of the values of the measure.
Our measure clearly satisfies this property. Let us take two processes, P and Q. Let us as-sume that P has an AND-split at activity a with a fan-out(a) of two. Let us construct process Q exactly in the same way as process P, but with a fan-out(a) of four at the AND-split activity a. Since CFCAND-split(a)= 1, the complexity of P is equal to the complexity of Q (i.e., |P|=|Q|), but the processes are distinct.
Property 4:There exist processes P and Q such that P
is equivalent to Q, but the complexity of P is not equal to the complexity of Q.
(∃P)(∃Q)(P ≡ Q|P| ≠ |Q|).
Even though two processes may have the same functionality, it is the details of the design that determine the process’s complex-ity. There are different process designs for the same functionality. For example, let us take a business process that makes the backup of a file system composed of four activities that save files at various locations. Two designs (processes P and Q) with the same functionality of the business process can be constructed. Process P carries out the four activities sequentially, while process Q uses an AND-split and an AND-join to reduce the time it takes to complete a file system backup. As a result, |P|=0, and |Q| =1 (i.e., |P|≠|Q|). Therefore, this property is satis-fied by our metric.
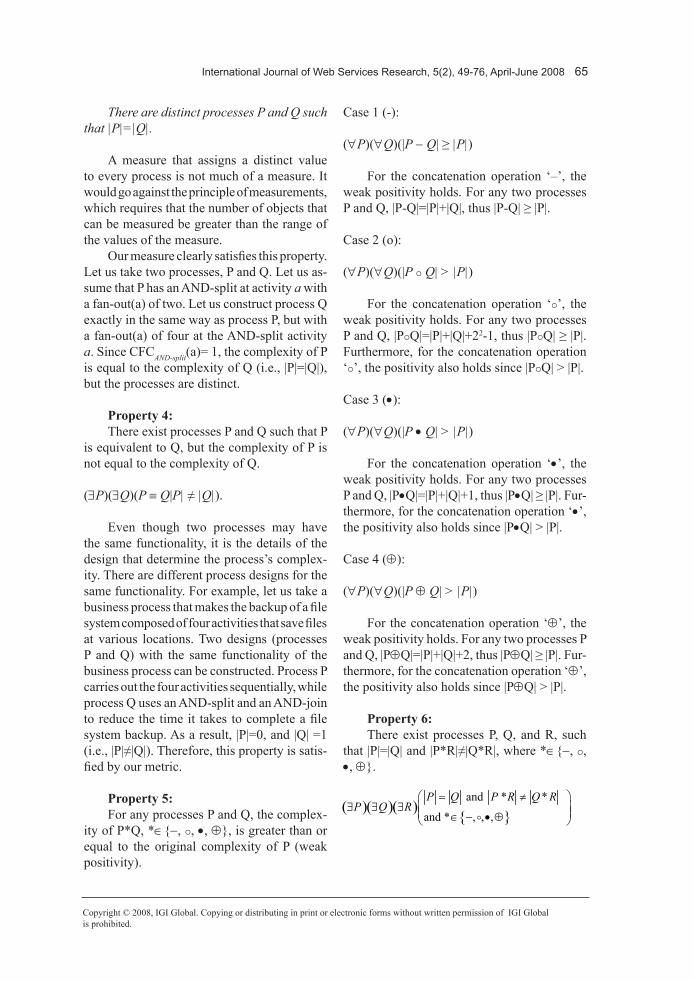
Property 5:For any processes P and Q, the complex-
ity of P*Q, *∈{−, , •, ⊕}, is greater than or equal to the original complexity of P (weak positivity).
Case 1 (-):
(∀P)(∀Q)(|P − Q| ≥ |P|)
For the concatenation operation ‘–’, the weak positivity holds. For any two processes P and Q, |P-Q|=|P|+|Q|, thus |P-Q| ≥ |P|.
Case 2 (o):
(∀P)(∀Q)(|P Q| > |P|)
For the concatenation operation ‘’, the weak positivity holds. For any two processes P and Q, |PQ|=|P|+|Q|+22-1, thus |PQ| ≥ |P|. Furthermore, for the concatenation operation ‘’, the positivity also holds since |PQ| > |P|.
Case 3 (•):
(∀P)(∀Q)(|P • Q| > |P|)
For the concatenation operation ‘•’, the weak positivity holds. For any two processes P and Q, |P•Q|=|P|+|Q|+1, thus |P•Q| ≥ |P|. Fur-thermore, for the concatenation operation ‘•’, the positivity also holds since |P•Q| > |P|.
Case 4 (⊕):
(∀P)(∀Q)(|P ⊕ Q| > |P|)
For the concatenation operation ‘⊕’, the weak positivity holds. For any two processes P and Q, |P⊕Q|=|P|+|Q|+2, thus |P⊕Q| ≥ |P|. Fur-thermore, for the concatenation operation ‘⊕’, the positivity also holds since |P⊕Q| > |P|.
Property 6:There exist processes P, Q, and R, such
that |P|=|Q| and |P*R|≠|Q*R|, where *∈{−, , •, ⊕}.
= ≠( )( )( )
{ } and * *
and * , , ,
P Q P R Q RP Q R∃ ∃ ∃ ∈ − • ⊕
66 International Journal of Web Services Research, 5(2), 49-76, April-June 2008
Copyright © 2008, IGI Global. Copying or distributing in print or electronic forms without written permission of IGI Globalis prohibited.
As with property 5, this property has four distinct cases.
Case 1 (−): |P−R|=|P|+|R| and |Q−R|=|Q|+|R|, since |P|=|Q|, it holds that |P−R|= |Q|+|R|, thus |P−R| = |Q−R|.
Case 2 ( ) : |PoR|=|P|+|R|+22-1 and |QR|=|Q|+|R|+22-1, since |P|=|Q|, it holds that |PR|= |Q|+|R|+22-1, thus |PR| = |QR|.
Case 3 (•): |P•R|=|P|+|R|+1 and |Q•R|=|Q|+|R|+1, since |P|=|Q|, it holds that |P•R|= |Q|+|R|+1, thus |P•R| = |Q•R|.
Case 4 (⊕ ) : |P⊕R|= |P |+ |R |+2 and |Q⊕R|=|Q|+|R|+2, since |P|=|Q|, it holds that |P⊕R|= |Q|+|R|+2, thus |P⊕R| = |Q⊕R|.
As a result, it is clear that our measurement does not follow Weyuker’s property 6 in any of the cases presented.
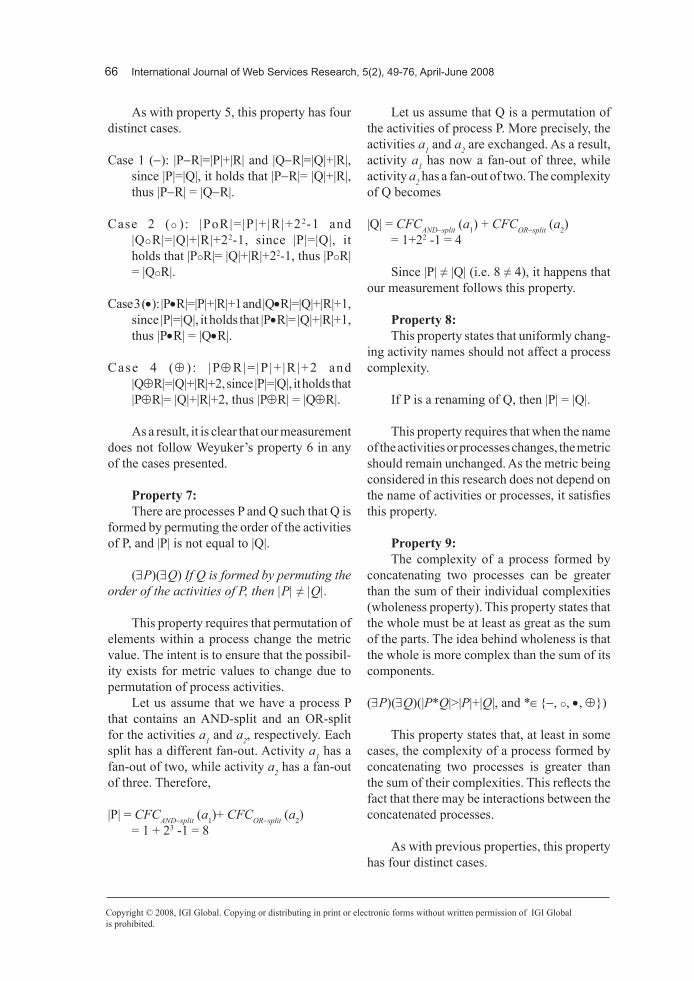
Property 7:There are processes P and Q such that Q is
formed by permuting the order of the activities of P, and |P| is not equal to |Q|.
(∃P)(∃Q) If Q is formed by permuting the order of the activities of P, then |P| ≠ |Q|.
This property requires that permutation of elements within a process change the metric value. The intent is to ensure that the possibil-ity exists for metric values to change due to permutation of process activities.
Let us assume that we have a process P that contains an AND-split and an OR-split for the activities a1 and a2, respectively. Each split has a different fan-out. Activity a1 has a fan-out of two, while activity a2 has a fan-out of three. Therefore,
|P| = CFCAND−split (a1)+ CFCOR−split (a2) = 1 + 23 -1 = 8
Let us assume that Q is a permutation of the activities of process P. More precisely, the activities a1 and a2 are exchanged. As a result, activity a1 has now a fan-out of three, while activity a2 has a fan-out of two. The complexity of Q becomes
|Q| = CFCAND−split (a1) + CFCOR−split (a2) = 1+22 -1 = 4
Since |P| ≠ |Q| (i.e. 8 ≠ 4), it happens that our measurement follows this property.
Property 8:This property states that uniformly chang-
ing activity names should not affect a process complexity.
If P is a renaming of Q, then |P| = |Q|.
This property requires that when the name of the activities or processes changes, the metric should remain unchanged. As the metric being considered in this research does not depend on the name of activities or processes, it satisfies this property.
Property 9:The complexity of a process formed by
concatenating two processes can be greater than the sum of their individual complexities (wholeness property). This property states that the whole must be at least as great as the sum of the parts. The idea behind wholeness is that the whole is more complex than the sum of its components.
(∃P)(∃Q)(|P*Q|>|P|+|Q|, and *∈{−, , •, ⊕})
This property states that, at least in some cases, the complexity of a process formed by concatenating two processes is greater than the sum of their complexities. This reflects the fact that there may be interactions between the concatenated processes.
As with previous properties, this property has four distinct cases.
International Journal of Web Services Research, 5(2), 49-76, April-June 2008 67
Copyright © 2008, IGI Global. Copying or distributing in print or electronic forms without written permission of IGI Global is prohibited.
Case 1 (-): |P-Q|=|P|+|Q|, thus |P-Q| ≥ |P|+|Q|.
Case 2 (o): |PoQ|=|P|+|Q|+22−1, thus |PoQ| > |P|+|Q|.
Case 3 (•): |P•Q|=|P|+|Q|+1, thus |P•Q| > |P|+|Q|.
Case 4 (⊕): |P⊕Q|=|P|+|Q|+2, thus |P⊕Q| > |P|+|Q|.
As a result, our measurement follows property 9 for case 2, 3, and 4. Case 1 follows a variation of the wholeness property, called the weak wholeness property.
(∃P)(∃Q)(|P − Q| ≥ | P |+|Q|)
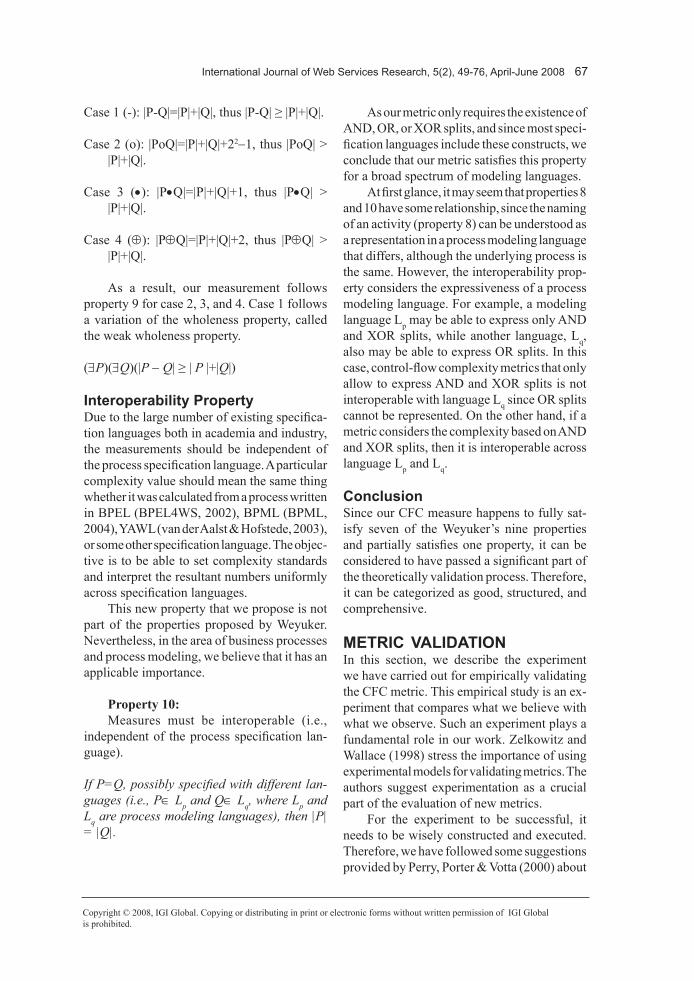
Interoperability PropertyDue to the large number of existing specifica-tion languages both in academia and industry, the measurements should be independent of the process specification language. A particular complexity value should mean the same thing whether it was calculated from a process written in BPEL (BPEL4WS, 2002), BPML (BPML, 2004), YAWL (van der Aalst & Hofstede, 2003), or some other specification language. The objec-tive is to be able to set complexity standards and interpret the resultant numbers uniformly across specification languages.
This new property that we propose is not part of the properties proposed by Weyuker. Nevertheless, in the area of business processes and process modeling, we believe that it has an applicable importance.
Property 10:Measures must be interoperable (i.e.,
independent of the process specification lan-guage).
If P=Q, possibly specified with different lan-guages (i.e., P∈ Lp and Q∈ Lq, where Lp and Lq are process modeling languages), then |P| = |Q|.
As our metric only requires the existence of AND, OR, or XOR splits, and since most speci-fication languages include these constructs, we conclude that our metric satisfies this property for a broad spectrum of modeling languages.
At first glance, it may seem that properties 8 and 10 have some relationship, since the naming of an activity (property 8) can be understood as a representation in a process modeling language that differs, although the underlying process is the same. However, the interoperability prop-erty considers the expressiveness of a process modeling language. For example, a modeling language Lp may be able to express only AND and XOR splits, while another language, Lq, also may be able to express OR splits. In this case, control-flow complexity metrics that only allow to express AND and XOR splits is not interoperable with language Lq since OR splits cannot be represented. On the other hand, if a metric considers the complexity based on AND and XOR splits, then it is interoperable across language Lp and Lq.
conclusionSince our CFC measure happens to fully sat-isfy seven of the Weyuker’s nine properties and partially satisfies one property, it can be considered to have passed a significant part of the theoretically validation process. Therefore, it can be categorized as good, structured, and comprehensive.
MEtrIc VAlIdAtIonIn this section, we describe the experiment we have carried out for empirically validating the CFC metric. This empirical study is an ex-periment that compares what we believe with what we observe. Such an experiment plays a fundamental role in our work. Zelkowitz and Wallace (1998) stress the importance of using experimental models for validating metrics. The authors suggest experimentation as a crucial part of the evaluation of new metrics.
For the experiment to be successful, it needs to be wisely constructed and executed. Therefore, we have followed some suggestions provided by Perry, Porter & Votta (2000) about
68 International Journal of Web Services Research, 5(2), 49-76, April-June 2008
Copyright © 2008, IGI Global. Copying or distributing in print or electronic forms without written permission of IGI Globalis prohibited.
the structure and the components of a suitable empirical study. To perform an experiment, several steps have to be taken in a certain order. An experiment can be divided into the following main activities (Perry et al., 2000): research context, hypotheses, experimental design, threats to validity, data analysis and presentation, results and conclusions.
In the remainder of this section, we explain how we have performed each of the activities described previously.
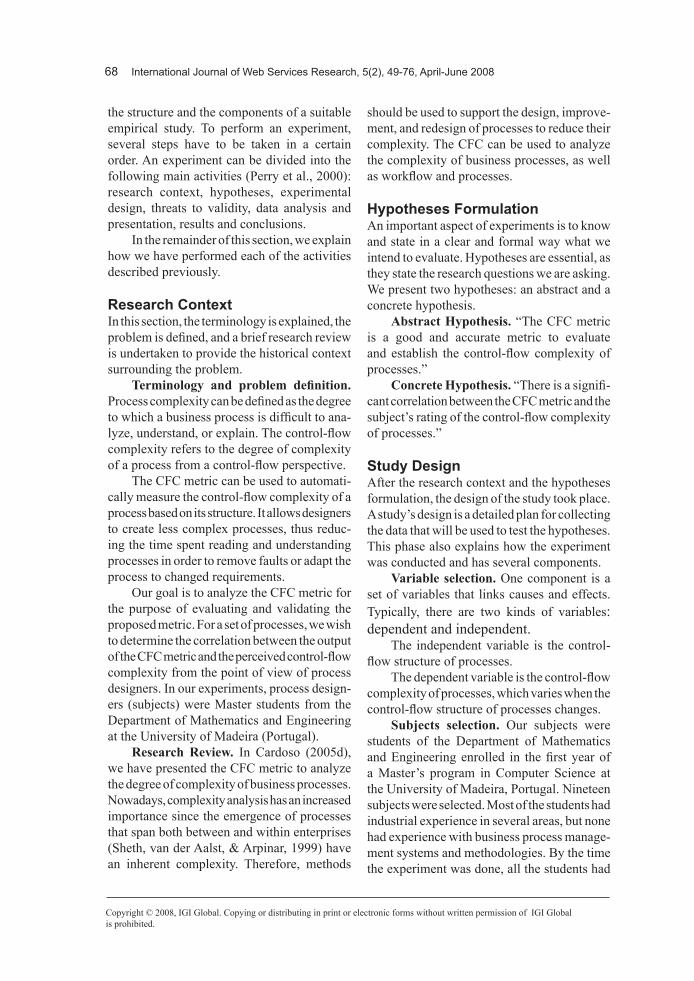
research contextIn this section, the terminology is explained, the problem is defined, and a brief research review is undertaken to provide the historical context surrounding the problem.
Terminology and problem definition. Process complexity can be defined as the degree to which a business process is difficult to ana-lyze, understand, or explain. The control-flow complexity refers to the degree of complexity of a process from a control-flow perspective.
The CFC metric can be used to automati-cally measure the control-flow complexity of a process based on its structure. It allows designers to create less complex processes, thus reduc-ing the time spent reading and understanding processes in order to remove faults or adapt the process to changed requirements.
Our goal is to analyze the CFC metric for the purpose of evaluating and validating the proposed metric. For a set of processes, we wish to determine the correlation between the output of the CFC metric and the perceived control-flow complexity from the point of view of process designers. In our experiments, process design-ers (subjects) were Master students from the Department of Mathematics and Engineering at the University of Madeira (Portugal).
Research Review. In Cardoso (2005d), we have presented the CFC metric to analyze the degree of complexity of business processes. Nowadays, complexity analysis has an increased importance since the emergence of processes that span both between and within enterprises (Sheth, van der Aalst, & Arpinar, 1999) have an inherent complexity. Therefore, methods
should be used to support the design, improve-ment, and redesign of processes to reduce their complexity. The CFC can be used to analyze the complexity of business processes, as well as workflow and processes.
Hypotheses FormulationAn important aspect of experiments is to know and state in a clear and formal way what we intend to evaluate. Hypotheses are essential, as they state the research questions we are asking. We present two hypotheses: an abstract and a concrete hypothesis.
AbstractHypothesis. “The CFC metric is a good and accurate metric to evaluate and establish the control-flow complexity of processes.”
ConcreteHypothesis. “There is a signifi-cant correlation between the CFC metric and the subject’s rating of the control-flow complexity of processes.”
study designAfter the research context and the hypotheses formulation, the design of the study took place. A study’s design is a detailed plan for collecting the data that will be used to test the hypotheses. This phase also explains how the experiment was conducted and has several components.
Variableselection. One component is a set of variables that links causes and effects. Typically, there are two kinds of variables: dependent and independent.
The independent variable is the control-flow structure of processes.
The dependent variable is the control-flow complexity of processes, which varies when the control-flow structure of processes changes.
Subjects selection. Our subjects were students of the Department of Mathematics and Engineering enrolled in the first year of a Master’s program in Computer Science at the University of Madeira, Portugal. Nineteen subjects were selected. Most of the students had industrial experience in several areas, but none had experience with business process manage-ment systems and methodologies. By the time the experiment was done, all the students had
International Journal of Web Services Research, 5(2), 49-76, April-June 2008 69
Copyright © 2008, IGI Global. Copying or distributing in print or electronic forms without written permission of IGI Global is prohibited.
taken a 50-hour course in Business Process Management (BPM) and, therefore, gained experience in the design and development of business processes.
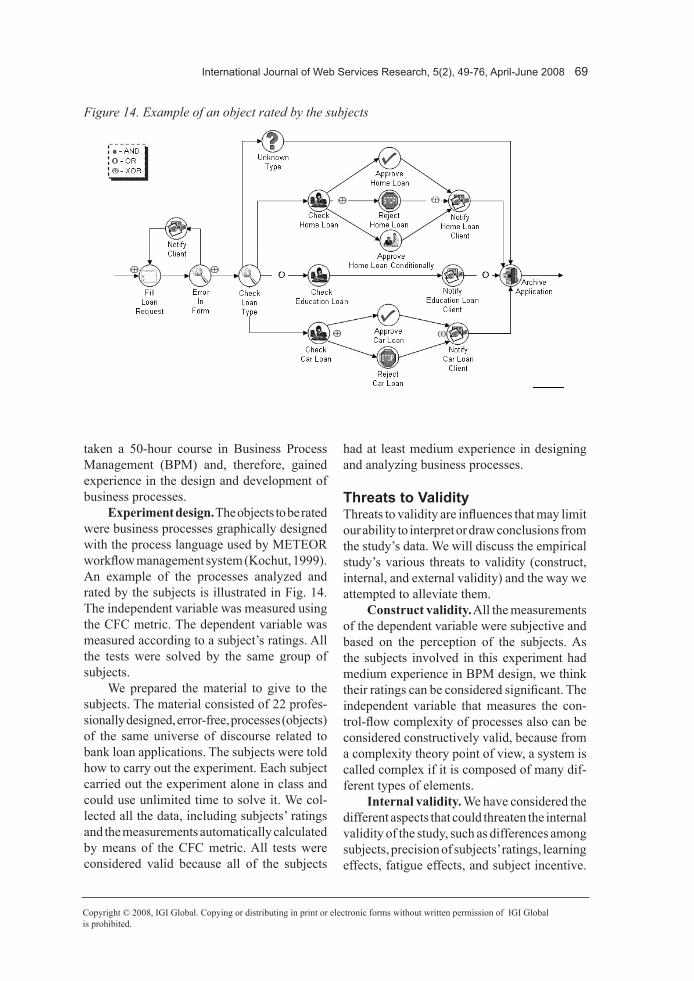
Experimentdesign. The objects to be rated were business processes graphically designed with the process language used by METEOR workflow management system (Kochut, 1999). An example of the processes analyzed and rated by the subjects is illustrated in Fig. 14. The independent variable was measured using the CFC metric. The dependent variable was measured according to a subject’s ratings. All the tests were solved by the same group of subjects.
We prepared the material to give to the subjects. The material consisted of 22 profes-sionally designed, error-free, processes (objects) of the same universe of discourse related to bank loan applications. The subjects were told how to carry out the experiment. Each subject carried out the experiment alone in class and could use unlimited time to solve it. We col-lected all the data, including subjects’ ratings and the measurements automatically calculated by means of the CFC metric. All tests were considered valid because all of the subjects
had at least medium experience in designing and analyzing business processes.
threats to ValidityThreats to validity are influences that may limit our ability to interpret or draw conclusions from the study’s data. We will discuss the empirical study’s various threats to validity (construct, internal, and external validity) and the way we attempted to alleviate them.
Constructvalidity. All the measurements of the dependent variable were subjective and based on the perception of the subjects. As the subjects involved in this experiment had medium experience in BPM design, we think their ratings can be considered significant. The independent variable that measures the con-trol-flow complexity of processes also can be considered constructively valid, because from a complexity theory point of view, a system is called complex if it is composed of many dif-ferent types of elements.
Internalvalidity. We have considered the different aspects that could threaten the internal validity of the study, such as differences among subjects, precision of subjects’ ratings, learning effects, fatigue effects, and subject incentive.
Figure 14. Example of an object rated by the subjects
70 International Journal of Web Services Research, 5(2), 49-76, April-June 2008
Copyright © 2008, IGI Global. Copying or distributing in print or electronic forms without written permission of IGI Globalis prohibited.
Subjects were knowledgeable concerning the evaluation issues. Analyzing the results of the experiment, we can empirically observe the ex-istence of a correlation between the independent and the dependent variable.
Externalvalidity. One threat to external validity has been identified: subject selection. This threat can limit the ability to generalize the results to settings outside the study. The subjects were Master students that had recently taken a 50-hour course on BPM, gaining an in-depth experience in the design and development of business processes. In order to extract a final conclusion that can be generalized, it is neces-sary to replicate this experiment with a more diversified number of subjects, including prac-titioners and designers with less experience.
data Analysis and PresentationTwo main approaches to presenting and analyzing data can be chosen: quantitative and qualitative analysis. Since our subjects rated processes using a numerical scale from 0 to 100, we have selected a quantitative analysis to draw conclusions from our data. The quali-tative analysis was done in conjunction with a statistical analysis.
As we have said previously, our goal is to determine if any correlation exists between subjects’ ratings and the CFC metric proposed in Cardoso (2005d) and briefly described in Section 3. Since the data collected in the experi-ment is distribution-free, the Spearman Rank-Difference Correlation Coefficient (Siegel & Castellan, 1988), rS, was used to determine the correlation of the data collected in the ex-periment. The Spearman rS is a nonparametric statistic used to show the relationship between two variables that are expressed as ranks (the ordinal level of measurement). The correlation coefficient is a measure of the ability of one variable to predict the value of another variable. Using Spearman’s correlation coefficient, the CFC metric was correlated separately to the dif-ferent subject’s rates of control-flow complexity. In our experiment, the null hypothesis was:
H0: “there is no correlation between the CFC metric and the subject’s rating of control-flow complexity.”
The probability that the null hypothesis would be erroneously rejected was controlled with two confidence levels: α1=0.005 and α2=0.05. The decision rules for rejecting the null hypothesis were:
For α1: reject H0 if rS >= 0.586; For α2: reject H0 if rS >= 0.425
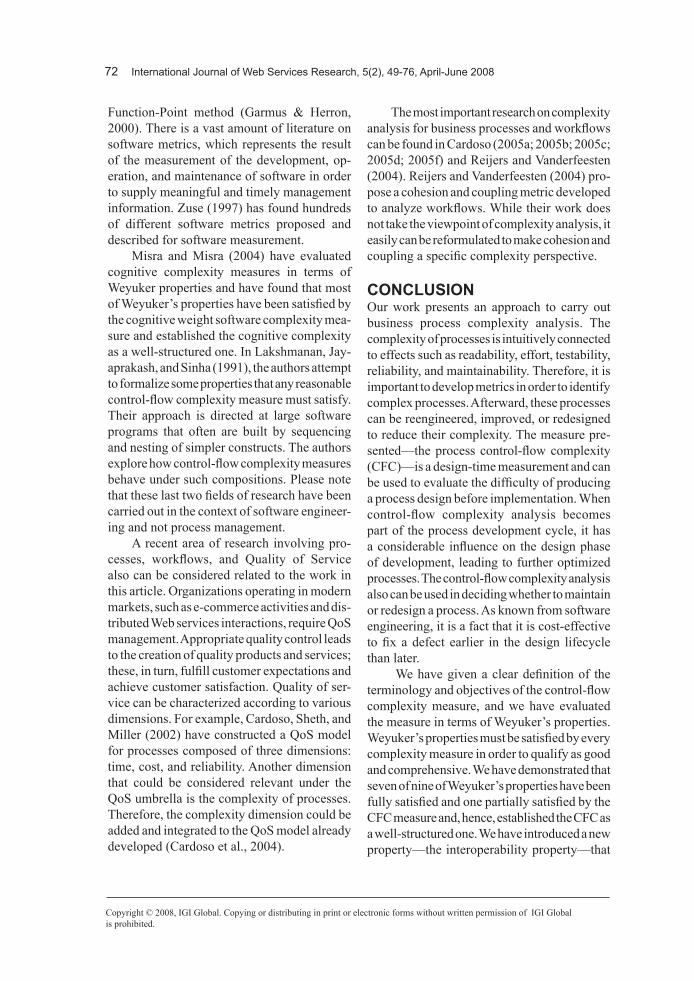
results and conclusionThe analysis performed on the collected data led to some interesting results. shows summary statistics describing the Spearman rank-differ-ence correlation coefficient between subjects’ ratings and the values given by the CFC metric. For each subject, the correlation coefficient rS is given.
Based on data from and taking into consid-eration α1, the values of rS are greater than 0.586 for 84% of the subjects; therefore, we reject the null hypothesis. Taking into consideration α2, all the values of rS are greater than 0.425; therefore, we also reject the null hypothesis. For α1, our confidence level is 95%, and for α2, our confidence level is 99.5%.
After analyzing the data we gathered, we concluded that the obtained results reveal that there exists a high correlation between the CFC metric and the subject’s rating of control-flow complexity. This leads us back to our original goal, which was to demonstrate that the CFC metric serves the purpose for which it was de-fined: to measure the control-flow complexity of processes. The results obtained are believable, and there are no ambiguities in our interpreta-tion. We also believe that no external elements have influenced our results. The diffusion of the experimental results and the way they are presented are relevant so that they are really put into use. Therefore, we published our findings in this article, and we also are planning to develop a Web-based system to allow other researchers to replicate our experiment.
International Journal of Web Services Research, 5(2), 49-76, April-June 2008 71
Copyright © 2008, IGI Global. Copying or distributing in print or electronic forms without written permission of IGI Global is prohibited.
Our results recommend the use of the CFC metric in order to create less complex processes, thus reducing the time spent reading and under-standing processes in order to remove faults or adapt the processes to changed requirements. The complexity measurement enables process managers and administrators to calculate the complexity of processes generated by others. Process designers can analyze the complexity of a particular process in development. Process consultants can contribute with new process components needing methods to analyze the complexity of the proposed solutions. End-users can inquire about the complexity of processes before starting process instances.
rElAtEd workWhile a significant amount of research on the complexity of software programs has been done in the area of software engineering, the work
found in the literature on complexity analysis for business processes is almost nonexistent. Since the research on process complexity is almost nonexistent, in this section we will dis-cuss the progress made in the area of software complexity.
The last 30 years has seen a large amount of research aimed at determining measurable properties to capture the notions of software complexity. The earliest measures were based on analysis of software code, the most funda-mental being a basic count of the number of Lines of Code (LOC). Despite being widely criticized as a measure of complexity, it con-tinues to have widespread popularity, mainly due to its simplicity (Azuma & Mole, 1994). Research in software engineering has produced other important measurements for software. Among others are Halstead’s measure (Halstead, 1977), McCabe’s measure (McCabe, 1977), the COCOMO model (Boehm, 1981), and the
Table 5. Correlation coefficients
72 International Journal of Web Services Research, 5(2), 49-76, April-June 2008
Copyright © 2008, IGI Global. Copying or distributing in print or electronic forms without written permission of IGI Globalis prohibited.
Function-Point method (Garmus & Herron, 2000). There is a vast amount of literature on software metrics, which represents the result of the measurement of the development, op-eration, and maintenance of software in order to supply meaningful and timely management information. Zuse (1997) has found hundreds of different software metrics proposed and described for software measurement.
Misra and Misra (2004) have evaluated cognitive complexity measures in terms of Weyuker properties and have found that most of Weyuker’s properties have been satisfied by the cognitive weight software complexity mea-sure and established the cognitive complexity as a well-structured one. In Lakshmanan, Jay-aprakash, and Sinha (1991), the authors attempt to formalize some properties that any reasonable control-flow complexity measure must satisfy. Their approach is directed at large software programs that often are built by sequencing and nesting of simpler constructs. The authors explore how control-flow complexity measures behave under such compositions. Please note that these last two fields of research have been carried out in the context of software engineer-ing and not process management.
A recent area of research involving pro-cesses, workflows, and Quality of Service also can be considered related to the work in this article. Organizations operating in modern markets, such as e-commerce activities and dis-tributed Web services interactions, require QoS management. Appropriate quality control leads to the creation of quality products and services; these, in turn, fulfill customer expectations and achieve customer satisfaction. Quality of ser-vice can be characterized according to various dimensions. For example, Cardoso, Sheth, and Miller (2002) have constructed a QoS model for processes composed of three dimensions: time, cost, and reliability. Another dimension that could be considered relevant under the QoS umbrella is the complexity of processes. Therefore, the complexity dimension could be added and integrated to the QoS model already developed (Cardoso et al., 2004).
The most important research on complexity analysis for business processes and workflows can be found in Cardoso (2005a; 2005b; 2005c; 2005d; 2005f) and Reijers and Vanderfeesten (2004). Reijers and Vanderfeesten (2004) pro-pose a cohesion and coupling metric developed to analyze workflows. While their work does not take the viewpoint of complexity analysis, it easily can be reformulated to make cohesion and coupling a specific complexity perspective.
conclusIon Our work presents an approach to carry out business process complexity analysis. The complexity of processes is intuitively connected to effects such as readability, effort, testability, reliability, and maintainability. Therefore, it is important to develop metrics in order to identify complex processes. Afterward, these processes can be reengineered, improved, or redesigned to reduce their complexity. The measure pre-sented—the process control-flow complexity (CFC)—is a design-time measurement and can be used to evaluate the difficulty of producing a process design before implementation. When control-flow complexity analysis becomes part of the process development cycle, it has a considerable influence on the design phase of development, leading to further optimized processes. The control-flow complexity analysis also can be used in deciding whether to maintain or redesign a process. As known from software engineering, it is a fact that it is cost-effective to fix a defect earlier in the design lifecycle than later.
We have given a clear definition of the terminology and objectives of the control-flow complexity measure, and we have evaluated the measure in terms of Weyuker’s properties. Weyuker’s properties must be satisfied by every complexity measure in order to qualify as good and comprehensive. We have demonstrated that seven of nine of Weyuker’s properties have been fully satisfied and one partially satisfied by the CFC measure and, hence, established the CFC as a well-structured one. We have introduced a new property—the interoperability property—that
International Journal of Web Services Research, 5(2), 49-76, April-June 2008 73
Copyright © 2008, IGI Global. Copying or distributing in print or electronic forms without written permission of IGI Global is prohibited.
has significant importance in the context of process complexity analysis.
In order to demonstrate that our CFC metric serves the purpose for which it was defined, we have carried out an empirical validation by means of a controlled experiment. Our experi-ment involved 19 graduate students in Computer Science as part of a research project, and tested if the control-flow complexity of a set of 22 business processes could be predicted using the CFC metric. Analyzing the collected data using statistical methods, we have concluded that the CFC metric is highly correlated with the control-flow complexity of processes. This metric, therefore, can be used by business pro-cess analysts and process designers to analyze the complexity of processes and, if possible, develop simpler processes.
rEFErEncEs Alonso, G., Mohan, C., Guenthoer, R., Agrawal, D., El Abbadi, A., & Kamath, M. (1994). Exotica/FMQM: A persistent message-based architecture for distributed workflow management. Proceedings of the IFIP WG8.1 Working Conference on Infor-mation Systems for Decentralized Organizations, Trondheim, Norway.
Anyanwu, K., Sheth, A., Cardoso, J., Miller, J.A., & Kochut, K.J. (2003). Healthcare enterprise process development and integration. Journal of Research and Practice in Information Technology, Special Issue in Health Knowledge Management, 35(2), 83–98.
Azuma, M., & Mole, D. (1994). Software mana-gement practice and metrics in the European com-munity and Japan: Some results of a survey. Journal of Systems and Software, 26(1), 5–18.
Boehm, B. (1981). Software engineering economics. Englewood Cliffs, NJ: Prentice Hall.
BPEL4WS. (2002). Web services. Retrieved from http://www-106.ibm.com/developerworks/web-services/
BPML. (2004). Business process modeling language. Retrieved from http://www.bpmi.org/
BPMN. (2005). Business process modeling notation. Retrieved from http://www.bpmn.org/
Canós, J.H., Penadés, M.C., & Carsí, J.Á. (1999). From software process to workflow process: the workflow lifecycle. Proceedings of the International Process Technology Workshop, Grenoble, France.
Card, D., & Agresti, W. (1988). Measuring software design complexity. Journal of Systems and Software, 8, 185–197.
Cardoso, J. (2005a). About the complexity of team-work and collaboration processes. Proceedings of the IEEE International Symposium on Applications and the Internet (SAINT 2005), Trento, Italy.
Cardoso, J. (2005b). About the data-flow complexity of Web processes. Proceedings of the 6th International Workshop on Business Process Modeling, Develop-ment, and Support: Business Processes and Support Systems: Design for Flexibility, Porto, Portugal.
Cardoso, J. (2005c). Control-flow complexity measurement of processes and Weyuker’s properties (accepted for publication). Proceedings of the 6th International Enformatika Conference (IEC 2005), Budapest, Hungary.
Cardoso, J. (2005d). Evaluating workflows and Web process complexity. In L. Fischer (Ed.), Workflow handbook 2005 (pp. 284–290). Lighthouse Point, FL: Future Strategies Inc.
Cardoso, J. (2005e). Path mining in Web processes using profiles. In J. Wang (Ed.), Encyclopedia of data warehousing and mining (pp. 896–901). Hershey, PA: Idea Group Inc.
Cardoso, J. (2005f). Process control-flow complexity metric: An empirical validation (submitted). Pro-ceedings of the 1st International Conference on Management Systems for Process Improvement, Karlsruhe, Germany.
Cardoso, J. (2006). Process control-flow complexity metric: An empirical validation. Proceedings of the IEEE International Conference on Services Compu-ting (IEEE SCC 06), Chicago.
Cardoso, J., Bostrom, R.P., & Sheth, A. (2004). Workflow management systems and ERP systems: Differences, commonalities, and applications. In-formation Technology and Management Journal. Special issue on Workflow and E-Business, 5(3-4), 319–338.
Cardoso, J., & Cravo, C. (2006). Verifying the logical termination of workflows. Proceedings of the 5th Annual Hawaii International Conference on
74 International Journal of Web Services Research, 5(2), 49-76, April-June 2008
Copyright © 2008, IGI Global. Copying or distributing in print or electronic forms without written permission of IGI Globalis prohibited.
Statistics, Mathematics and Related Fields, Hono-lulu, Hawaii.
Cardoso, J., Miller, J., Sheth, A., Arnold, J., & Kochut, K. (2004). Modeling quality of service for workflows and Web service processes. Web Semantics: Science, Services and Agents on the World Wide Web Journal, 1(3), 281–308.
Cardoso, J., Sheth, A., & Miller, J. (2002). Workflow quality of service. Proceedings of the International Conference on Enterprise Integration and Modeling Technology and International Enterprise Modeling Conference (ICEIMT/IEMC’02), Valencia, Spain.
Cherniavsky, J.C., & Smith, C.H. (1991). On Weyuker’s axioms for software complexity measu-res. IEEE Transactions on Software Engineering, 17(6), 636–638.
Curtis, B. (1980). Measurement and experimentation in software engineering. Proceedings of the IEEE, 68(9), 1144–1157.
Davenport, T. (1993). Process innovation: Reengine-ering work through information technology. Harvard Business School Press.
Du, W., Davis, J., Huang, Y., & Shan, M. (1999). En-terprise workflow resource management. Proceedings of the International Workshop on Research Issues in Data Engineering, Sydney, Australia.
Fenton, N. (1991). Software metrics: A rigorous ap-proach. London: Chapman & Hall, 1991.Garmus, D., & Herron, D. (2000). Function point analysis: Measurement practices for successful software projects. Boston, MA: Addison Wesley.
Fenton, N. (1994). Software measurement: A neces-sary scientific basis. IEEE Transactions on Software Engineering, 20(3).
Halstead, M.H. (1977). Elements of software science, operating, and programming systems series (Vol. 7). New York: Elsevier.
Hammer, M., & Champy, J. (1993). Re-engineering the corporation. A manifesto for business revolution. New York: Harper Collins.
Harrington, H. (1993). Process breakthrough: Business process improvement. Journal of Cost Management (Fall), 30–43.
IEEE. (1992). IEEE 610, standard glossary of soft-ware engineering terminology. New York: Institute of Electrical and Electronic Engineers.
Jablonski, S. (1994). MOBILE: A modular work-flow model and architecture. Proceedings of the 4th International Working Conference on Dynamic Modelling and Information Systems, Noordwijker-hout, Netherlands.
Jones, T.C. (1986). Programming productivity. New York: McGraw-Hill.
Kitchenham, B., Pfleeger, S.L., & Fenton, N. (1996). Toward a framework for measurement validation. IEEE Transactions of Software Engineering, 21(12), 929–944.
Kochut, K.J. (1999). METEOR model version 3. Athens, GA: Large Scale Distributed Information Systems Lab, Department of Computer Science, University of Georgia.
Kochut, K.J., Sheth, A.P., & Miller, J.A. (1999). ORBWork: A CORBA-based fully distributed, sca-lable and dynamic workflow enactment service for METEOR. Athens, GA: Large Scale Distributed Information Systems Lab, Department of Computer Science, University of Georgia.
Lakshmanan, K.B., Jayaprakash, S., & Sinha, P.K. (1991). Properties of control-flow complexity mea-sures. IEEE Transactions on Software Engineering Archive, 17(12), 1289–1295.
Lanning, D.L., & Khoshgoftaar, T.M. (1994). Modeling the relationship between source code complexity and maintenance difficulty. Computer, 27(9), 35–41.
Leymann, F. (2001). Web services flow language (WSFL 1.0). Retrieved from http://www-4.ibm.com/software/solutions/webservices/pdf/WSFL.pdf
McCabe, T. (1976). A complexity measure. IEEE Transactions of Software Engineering, SE-2(4), 308–320.
McCabe, T.J. (1977). A complexity measure. Transactions on Software Engineering, 13(10), 308–320.
McCabe, T.J., & Watson, A.H. (1994). Software complexity. Crosstalk, Journal of Defense Software Engineering, 7(12), 5–9.
Menzel, C., Mayer, R.J., & Edwards, D.D. (1994). IDEF3 process descriptions and their semantics. In C.H. Dagli & A. Kusiak (Eds.), Intelligent systems in design and manufacturing (pp. 172-212). New York: ASME.
International Journal of Web Services Research, 5(2), 49-76, April-June 2008 75
Copyright © 2008, IGI Global. Copying or distributing in print or electronic forms without written permission of IGI Global is prohibited.
Miller, G. (1956). The magical number seven, plus or minus two: Some limits on our capacity for processing information. The Psychological Review.
Miller, J.A., Palaniswami, D., Sheth, A.P., Kochut, K.J., & Singh, H. (1998). WebWork: METEOR2’s Web-based workflow management system. Journal of Intelligence Information Management Systems: Integrating Artificial Intelligence and Database Technologies (JIIS), 10(2), 185–215.
Misra, S., & Misra, A.K. (2004). Evaluating cog-nitive complexity measure with Weyuker proper-ties. Proceedings of the Third IEEE International Conference on Cognitive Informatics (ICCI’04), Victoria, Canada.
Morasca, S., Briand, L., Weyuker, E., & Zelkowitz, M. (1997). Comments on ”towards a framework for software measurement validation.”. IEEE Transac-tions on Software Engineering, 23(3), 187–188.
Ould, M.A. (1995). Business processes: Modelling and analysis for re-engineering and improvement. Chichester, England: John Wiley & Sons.
Perry, D.E., Porter, A.A., & Votta, L.G. (2000). Empirical studies of software engineering: A road-map. In A. Finkelstein (Ed.), The future of software engineering: ACM Press.
Reijers, H.A., & Vanderfeesten, I.T.P. (2004). Co-hesion and coupling metrics for workflow process design. In J. Desel, B. Pernici, & M. Weske (Eds.), BPM 2004 (LNCS 3080) (Vol. LNCS 3080, pp. 290–305). Berlin: Springer-Verlag.
Sheth, A.P., van der Aalst, W., & Arpinar, I.B. (1999). Processes driving the networked economy. IEEE Concurrency, 7(3), 18–31.
Siegel, S., & Castellan, J. (1988). Nonparametric sta-tistics for the behavioral sciences: McGraw-Hill.
Singh, M.P. (1995). Semantical considerations on workflows: An algebra for intertask dependencies. Proceedings of the Fifth International Workshop on Database Programming Languages, Umbria, Italy.
Smith, H., & Fingar, P. (2003). Business process management (BPM): The third wave. Meghan-Kif-fer Press.
Tsai, W.T., Lopex, M.A., Rodriguez, V., & Volovik., D. (1986). An approach measuring data structure complexity. Proceedings of the COMPSAC 86.
van der Aalst, W.M.P. (1998). The application of petri nets to workflow management. The Journal of Circuits, Systems and Computers, 8(1), 21–66.
van der Aalst, W.M.P. (2000). Workflow verification: Finding control-flow errors using petri-net-based techniques. In W.M.P. van der Aalst, J. Desel, & A. Oberweis (Eds.), Business process management: Models, techniques, and empirical studies (Vol. 1806, pp. 161–183). Berlin: Springer-Verlag.
van der Aalst, W.M.P., & Hofstede, A.H.M. (2003). YAWL: Yet another workflow language (revised ver-sion). (QUT Technical report No. FIT-TR-2003-04). Brisbane: Queensland University of Technology.
van der Aalst, W.M.P., Hofstede, A.H.M., Kiepus-zewski, B., & Barros, A.P. (2003). Workflow patterns. Distributed and Parallel Databases, 14(3), 5–51.
Ward, W. (1989). Software defect prevention using McCabe’s complexity metric. Hewlett Packard Journal, 40(2), 64–69.
Wastell, D., White, P., & Kawalek, P. (1994). A methodology for business process re-design: Expe-riences and issues. Journal of Strategic Information Systems, 3(1), 23–40.
Weyuker, E.J. (1988). Evaluating software com-plexity measures. IEEE Transactions on Software Eng., 14(9), 1357–1365.
Wodtke, D., Weissenfels, J., Weikum, G., & Dittrich, A.K. (1996). The MENTOR project: Steps towards enterprise-wide workflow management. Proceedings of the IEEE International Conference on Data Engi-neering, New Orleans, LA.
WS-BEPL. (2005). Business process execution language for Web services.
Zelkowitz, M.V., & Wallace, D.R. (1998). Expe-rimental models for validating technology. IEEE Computer, 31(5), 23–31.
zur Mühlen, M. (1999). Resource modeling in workflow applications. Proceedings of the Workflow Management Conference, Muenster, Germany.
Zuse, H. (1990). Software complexity measures and models. New York: de Gruyter & Co.
Zuse, H. (1997). A framework of software measure-ment. Berlin: Walter de Gruyter Inc.
76 International Journal of Web Services Research, 5(2), 49-76, April-June 2008
Copyright © 2008, IGI Global. Copying or distributing in print or electronic forms without written permission of IGI Globalis prohibited.
Sami Bhiri is a postdoctoral researcher at DERI - the National University of Ireland, Galway, where he is involved in managing several EU projects. Before joining DERI, he was a research and teaching as-sistant in the University of Nancy 1 and in the ECOO team of the LORIA-INRIA research laboratory. His research interests are in the area of applying semantics to B2B integration, service oriented computing and business process management.
Walid Gaaloul is a postdoctoral researcher at the National University of Ireland, Galway, where he is involved in several EU projects. Before joining DERI, he was a research in the ECOO team of the LORIA-INRIA research laboratory and teaching assistant in the University of Nancy 1. His research interests lie in the area of business process management, process intelligence, process reliability, service oriented computing and semantics for B2B integration.
Claude Godart is full time professor at Nancy University, France and scientific director of the INRIA ECOO project. His centre of interest concentrates on the consistency maintenance of the data mediating the cooperation between several partners. This encompasses advanced transaction models, user centric workflow and web services composition models. He has been implicated in several transfer projects with industries (France, Europe, and Japan) for a wide range of applications including e-commerce, software processes and e-learning.