Business model, businesses & strategy - GlobeNewswire
67
Business model, businesses & strategy February 2021
Transcript of Business model, businesses & strategy - GlobeNewswire

Business model, businesses & strategy
February 2021

Important notice
This presentation is being made only to, and is only directed at, persons to whom such presentation may lawfully be communicated (’relevant persons’). Any person who is not a relevant person should not act or rely on this presentation or any of its contents.
This presentation does not constitute an offering of securities or otherwise constitute an invitation or inducement to any person to underwrite, subscribe for or otherwise acquire securities in any company within the Borregaard Group. The release, publication or distribution of this presentation in certain jurisdictions may be restricted by law, and therefore persons in such jurisdictions into which this presentation is released, published or distributed should inform themselves about, and observe, such restrictions.
This presentation includes and is based, inter alia, on forward-looking information and contains statements regarding the future in connection with the Borregaard Group’s growth initiatives, profit figures, outlook, strategies and objectives. All forward-looking information and statements in this presentation are based on current expectations, estimates and projections about global economic conditions, the economic conditions of the regions and industries that are major markets for the Borregaard Group and its lines of business. These expectations, estimates and projections are generally identifiable by statements containing words such as “expects”, “believes”, “estimates” or similar expressions.
Important factors may lead to actual profits, results and developments deviating substantially from what has been expressed or implied in such statements. Although Borregaard believes that its expectations and the presentation are based upon reasonable assumptions, it can give no assurance that those expectations will be achieved or that the actual results will be as set out in the presentation.
Borregaard is making no representation or warranty, expressed or implied, as to the accuracy, reliability or completeness of the presentation, and neither Borregaard nor any of its directors, officers or employees will have any liability to you or any other persons resulting from your use.
Information contained herein will not be updated. The slides should also be read and considered in connection with the information given orally during the presentation.
This presentation is subject to Norwegian law, and any dispute arising in respect of this presentation is subject to the exclusive jurisdiction of Norwegian courts.
2

Borregaard is a global leader in biochemicals
High value added through full raw materials utilisationBorregaard’s biochemicals are sustainable and environmentally
friendly substitutes for petrochemicals
Business model & strategy
3

Operates one of the world’s most advanced biorefineries Integration models:
Own integratedPartner integrated
Independent
End markets 2020Integrated production system serving diverse markets
Business model & strategy
S P E C I A L I T Y C E L L U L O S EConstruction materialsFiltersInks and coatingsCasings Food/pharma/personal careTextiles
B I O P O L Y M E R SConcrete additivesAnimal feedAgrochemicalsBatteriesBriquettingSoil conditioning
B I O V A N I L L I NFood and beveragesPerfumesPharmaceuticals
B I O E T H A N O LBiofuel DisinfectantsPharmaceutical industryHome and personal care productsPaint/varnishCar care
C E L L U L O S E F I B R I L SAdhesivesCoatingsAgricultural chemicalsPersonal careHome careConstruction
28%
Agriculture
Chemical/OthersConstruction
Food & pharma19%
Chemicals/other33%
Construction27%
Agriculture21%
4

Global niche player with a market driven organisation
Largest supplier, technology leader in lignin-based biopolymers with global markets, only producer of
wood-based vanillin
Leading global speciality cellulose supplier, pioneer in cellulose fibrils
Leading producer of fine chemical intermediates for contrast agents, significant
producer of 2nd generation bioethanol
Market driven organisation
~120 FTEs strong sales/technical service organisation
Dedicated sales force for each business unit
~90% of sales handled through own organisation
Business model & strategy
Sales distribution(2020)
28%
Agriculture
Chemical/OthersConstruction
RoW1%
Europe 52%
Asia 20%
Americas2
27%
1) Segment revenue as a % of total revenue 20202) USA/Canada 22%, rest of Americas 5%5
BioMaterials(33%¹)
Fine Chemicals(10%¹)
BioSolutions(57%¹)

The specialisation strategy
Specialisation in global niches
Markets with high barriers to entry
Leading market positions through application knowledge and proximity to markets
Diversified market strategy and global market positions secure maximum flexibility
Strong innovation efforts and continuous improvement
Business driven innovation model that involves the entire organisation
Continuous productivity improvement through more efficient organisation, competence development and smart use of technology
Competence is the main competitive advantage
Competence differentiates Borregaard from the competitors
Combination of competences in sales & marketing, R&D and production
Business model & strategy
6
Strategic priorities
Specialisation and diversification within BioSolutions
Specialisation through innovation and market development
Balance market risk through diversification of product portfolio
Timing of further volume expansion guided by demand development and profitability
Increased value added from the unique Sarpsborg biorefinery
Leverage high-value lignin raw material base in biopolymers and biovanillin
Enhance product mix in speciality cellulose and bioethanol
Strong focus on innovation and productivity efforts
Development of the cellulose fibrils business
Continued market development across multiple applications and geographies
Timing of second step expansion guided by demand development
Sustainability
Continued emphasis on ESG aspects along entire value chain
7
Business model & strategy

Completed and ongoing strategic projects
Specialisation, diversification and growth within BioSolutions
Florida plant (1st phase) started up mid 2018
Upgrade and increased specialisation in Sarpsborg (2019)
Develop the unique biorefinery asset in Sarpsborg
High-end bioethanol expansion started up in Q1-18
Ice Bear capacity expansion completed end 2018
Lignin upgrade/specialisation in operation from July 2019
Wood based vanillin capacity expansion, completion 1H-21
Establish cellulose fibrils as a new business area
Commercial-scale production facility completed in Q4-16
Exilva market introduction ongoing
8
Business model & strategy

Alignment with UN’s Sustainable Development Goals
9
THE SIX PRIORITISED SUSTAINABLE DEVELOPMENT GOALS FOR BORREGAARD
Contribution to market growth
Variety of green solutions
Alignment with long-term global goals
Sustainability
SUSTAINABLE RAW MATERIAL
Cxvcxvcxvcxv
SUSTAINABLE BIOREFINERY
SUSTAINABLE RAW MATERIAL
SUSTAINABLE PRODUCTION
SUSTAINABLE INDUSTRY
SUSTAINABLE BUSINESS
SUSTAINABLE FOOD PRODUCTION

Integral part of market offering
10
P R O C E S S E S P R O D U C T SR A W M A T E R I A L S
Natural, renewable, sustainable raw materials
Efficient and sustainable production and value chain
Sustainable biochemicals
Sustainable and certified wood
Documentation
PEFC1) and FSC1) standards
Lignin raw materials from certified forests
Reduced emissions improve LCA2)
Target based CO2-reductions Energy conservations New/green energy sources
Reduced emissions to water and air
“Greener” logistical solutions
Products add sustainability value to customers
Climate: LCA2) shows favourable GHG footprint
Biobased: Natural raw materials preferred
EHS3): Non-toxic, harmless products
1) PEFC: Programme for the Endorsement of Forest Certification, FSC: Forest Stewardship Council2) Life Cycle Analysis3) Environment, Health and Safety
Sustainability

Climate change – targets and rating
Science Based Targets for GHG emissions approved by CDP¹
Targeted reductions in greenhouse gas emissions:
53% by 2030
100% by 2050
Base year = 2009
Targets are in line with the ambitions in the Paris Agreement and the Norwegian Climate Law
Borregaard maintained a CDP ‘A’ rating in 2020
Highlighted as a global leader in corporate climate action
Achieved a place on the CDP Climate Change ‘A List’
9,600 companies reported to CDP in 2020
270 (2.8%) were awarded an ‘A’ rating
11¹ CDP: Global non-profit organisation that drives companies and governments to reducetheir greenhouse gas emissions, safeguard water resources and protect forests
Sustainability

BioSolutions
Market position Largest supplier of lignin Only supplier of wood based vanillin Unique technical and application expertise
Production Norway, USA, South Africa*, Germany, Spain*, Czech Republic, UK
Applications Concrete admixtures Gypsum board Ceramics Animal feed Agro chemicals Soil conditioner Oil field chemicals Batteries Flavours & fragrances Personal care and pharmaceuticals
Key attractions A sustainable and broad product portfolio
Large and diverse customer base
High barriers to entry
*⁾ Currently not in operation12

Biopolymers: Lignin – a sustainable and flexible raw material
Product performance depends on the pulping process and the raw material
Sulphite pulping process
Versatile lignin used in a variety of products/applications
Quality depends on the chemicals base
Water soluble
Limited number of sulphite mills
Softwood (pine/spruce) vs hardwood and straw
Softwood lignin has superior modification potential
Kraft (sulfate) pulping process
Lignin is normally incinerated to recover energy and chemicals
Not in water soluble form from the pulp mill
Pulp producers are exploring potential for industrial use of kraft lignin
13
Fibres45 %
Sugar/other25 %
Lignin30 %
IncinerationBioenergy
Biochemicals
Discharge
BioSolutions

Diversity: Around 620 products to 3,000 customers
14
BioSolutions properties
Binding agent
Crystal growthcontrol
Dispersing agent/rheology control
Functionaladditive
Ceramics Dust solutions Feed Granulation aid
Batteries Oil field chemicals Water treatment
Carbon black and pigments Concrete admixtures Dyestuffs Metals and minerals Micronutrients Plant protection and plant nutrition
Antioxidants Complexing agent Phenol replacement SoftAcid Soil conditioner UV protection
Properties Applications
Flavours andfragrances
Food Fragrances Personal care Pharmaceuticals
Revenues by end-market and region1)
0%
10%
20%
30%
40%
50%
2009 2010 2011 2012 2013 2014 2015 2016 2017 2018 2019 2020
Top 3 Top 10
Top 10 and top 3 customers in % of revenues
Construction23%
Chemicals/ food/other
42%
Agriculture35%
Americas41%
RoW 2%
Asia22%
Europe35%
Sales distribution (2020)Revenue by end-market (2020)
1) Includes LignoTech South Africa sales
BioSolutions

Current global lignin supply
15
By sales volume
Borregaard Domsjø RYAM Sappi
Burgo Nippon Russia Others
Borregaard manufacturing facilities OthersSource: Borregaard estimates
Global lignin supply ~1 million mtds in 2021 (assuming South Africa and Spain not operating; Florida ramp-up)
BioSolutions

Implications of reduced lignin raw material supply
Lost volume is hardwood-based with limited potential for specialisation
Construction and Industrial low-end markets affected
Construction – a cyclical market with increasing use of oil-based alternatives to lignin, reinforced by a low oil price
Lignin offered in markets where its value is recognised
Value-based diversification in Industrial markets
Speciality markets not affected
16
468 470
0
50
100
150
200
250
300
350
400
450
500
2018 2019 2020 2021-23
Sales volume - BioSolutionsKmtds¹⁾
400-425375-400
BioSolutions
1) Metric tonne dry solid (thousand)
Strategic priorities – key considerations
0%
10%
20%
30%
40%
50%
60%
2009 2010 2011 2012 2013 2014 2015 2016 2017 2018 2019 2020
Volume split 2009-2020
Construction Industrial Specialities
New supply situation - an opportunity to sharpen strategy
Optimise value of biopolymers portfolio
Reduce exposure to low-end and cyclical markets
Diversify based on value-added
Focus on advanced applications with high value-added, stable growth and preference for sustainable solutions
Specialise through innovation and market development
Drive value growth based on expertise and sustainable solutions with unique performance
17
BioSolutions
Kmtds¹⁾
1) Metric tonne dry solid (thousand)

Industrial and Specialities
Industrial
Significant global volume growth since 2015 across a wide range of applications
Demonstrates capabilities in innovation, market development and sales
Robust and growing customer and application base
1) Metric tonne dry solid (thousand)18
-10
20
50
80
110
140
170
200
2009 2010 2011 2012 2013 2014 2015 2016 2017 2018 2019 2020
Industrial sales volume
Industrial
Kmtds1)
0
20
40
60
80
100
2009 2010 2011 2012 2013 2014 2015 2016 2017 2018 2019 2020
Specialities sales volume
Specialities sales volume
Kmtds1)
Specialities
Growth based on capabilities in innovation, application development and sales
Lead acid batteries for automotive and industrial applications on steady growth path
Increasing use of green alternatives in agrochemical applications, flavours and fragrances
BioSolutions

Lignin applications, functionality and substitutes
19
Application Functionality Competing technologies
Value proposition:
Green Cost/valuealternative vs. synthetics
BatteriesCrystal growth control
Few ✓ ✓
Oil field chemicals Dispersant and binder Synthetics ✓ ✓
Plant protection Dispersant Synthetic surfactants ✓ ✓
Plant nutritionSoil conditioner /complexing agent
Humic acid, ethylenediaminetetraacetic acid (EDTA) ✓ ✓
Animal feed pellets BinderStarch residues, bentonite and mechanical
compacting ✓
Concrete admixtures PlasticiserNaphthalene and melamine sulfonates,
polycarboxylic acids✓ ✓
BioSolutions

Lignin in agriculture
20
BioSolutions
Plant nutrition Plant protection
Micro-nutrients( Zn, Fe, Cu, Mn)
Soil conditioners(source of organic carbon)
Macro-nutrients(N, P, K, S)
Pesticides(dispersant)
Complexing agent Nutrient use efficiency Basic nutrients Water-based Solvent-based
✓ ✓ × ✓ ×
Binder for feed, granulation aid forlimestone and fertilisers

Lignin in lead acid batteries
21
Conventional vehicle Micro-hybrid Hybrid Electric vehicle
Flooded battery as start battery
Absorbent Glass Mat (AGM) and Enhanced Flooded
Battery (EFB) as start/stop battery
AGM and EFB as start/stop battery
Flooded battery for hotel function1)
Fuel for motion Fuel for motion Fuel/NiMH/lithium ion for motion
Lithium ion for motion
Oth
er:
Au
tom
oti
ve:
1) Heating, ventilation, air conditioning, lighting, radio, gauges, etc.
BioSolutions

Concrete admixture formulation preferences
22
LigninSynthetics Admixture market diverse, lignin competes
with captive synthetic products
Regional and local formulation preferences
Climate influences formulation
North America
Asia
Middle East
Southern Europe
Northern Europe
South America
Sources: Global Cement Magazine, www.statista.com, www.polygongroup.com, Chemistry World, www.grandviewresearch.com, Deutsche Bauchemie, Association of Building Chemistry Producers, European Federation of Concrete Admixtures Associations, www.futuremarketinsights.com, Borregaard estimates
BioSolutions

Sustainability - competitive edge
23
Capitalise on Borregaard’s biorefinery model and biobased solutions
Replace fossil raw materials
Documented favourable environmental footprint
Wood-based biopolymers
2nd generation feedstock
LCA - Life Cycle Analysis
EPD - Environmental Product Declarations
BioSolutions

Sustainability - competitive edge in use
Plant nutrition – favourable environmental footprint
Borregaard's biopolymers - the sustainable alternative to synthetics for formulating micronutrients
High efficiency, lower dosage
90% reduction in CO2 emissions compared to synthetics
Resins – sustainable replacement for petrochemicals
Significantly increases the renewable content in resins
>65 % reduction CO2 emissions per feedstock unit
Animal feed additives – alternative to antibiotics
Alternative to antibiotic growth promotors
Less corrosive and safer to handle than organic acids in pure form
Patented SoftAcid® technology
24
0
0,5
1
1,5
2
2,5
3
3,5
Borregaard biopolymer Phenol
kg C
O2
eq
v.
Resins
0
5
10
15
20
25
30
35
Borregaard biopolymer (3.2 kg/ha) Synthetic competitor (7.7 kg/ha)
kg C
O2
eq
v.
Plant nutrition
BioSolutions

Innovation strategy
Priorities
Specialisation and diversification
High value applications
Unique, tailor-made solutions
Increase value of Florida product portfolio
Competitive edge
Unique competence base
Diverse raw material base and advanced technology
Sustainability
25
BioSolutions

Innovation - introducing novel products
1) Absorbent Glass Mat2) Enhanced Flooded Batteries26
Plant protection – opportunities in water-based formulations
New products for water-based formulations, the fastest growing segment in plant protection
Batteries – unique product performance
New organic expander for improved charging commercialised
Proven performance in existing (AGM1) and new (EFB2) battery technology, including automotive start/stop function
Oil field chemicals - launch of the BioDrill product line
New, high performing, sustainable product for water-based drilling muds
BioSolutions

LignoTech Florida
The venture
Located at Rayonier Advanced Materials’ (RYAM) Fernandina Beach softwood sulphite pulp mill
Borregaard (55%) and RYAM (45%) ownership
Borregaard’s know-how and technology
Expansion project in two phases
Phase one (2018) represents 100,000 mtds capacity, investment USD 110 mill.
Phase two will give additional 50,000 mtds, investment USD 25 mill.
New plant officially opened 26 June 2018
Investment completed on time and cost
Production commenced in June
Commercialisation
Diversified product and application portfolio established
Sales volume developing according to plan
27
BioSolutions

Update on Sarpsborg lignin investment programme
28
500 mNOK capex, 70% expansion/30% replacement
Additional dryer with packaging capacity
Tanks for storage of liquid materials
Improved solutions for logistics, infrastructure and energy
In operation from July 2019
Capex ≈10% below budget
Several benefits
Further specialisation on a unique raw material base
Reduced exposure to cyclical market segments
Optimisation of production campaigns, internal and outbound logistics
Substantial environmental and safety benefits
Annual cost savings >40 mNOK expected
Gradual realisation through 2020
Full impact from 2021
BioSolutions

Positive trend for Borregaard’s wood-based vanillin
1) Company estimates2) Cured vanilla pods contain around 1-2% vanillin, corresponding to around 25 – 50 MT on pure vanillin basis29
Raw material Beans Ferulic acid from
bran/straw
Eugenol from clove
Lignin from wood
Guaiacol from creosote/tar
Guaiacol Guethol
Key selling pointsNatural/
flavour profilePlant based/natural raw material/sustainability /flavour profile Price
Sales volume (MT)¹⁾ ≈2400²⁾ ≈2000 ≈15 000 ≈5 000
Indicative price level USD/kg¹⁾
≈350 ≈400 25 - 100 10 - 15
# of manufacturers¹⁾ 1000+ 5 4 1 3 3 - 5 5
Growth¹⁾ ≈10% ≈1%
Plant based vanillinOil based
vanillin & ethyl vanillinVanilla beans
BioSolutions

Biovanillin - well positioned for growth
Strong demand growth for plant-based vanillin
Consumer preferences
Sustainability
Competitive edge
Global market leader in plant-based vanillin
Attractive flavour profile
Unique raw material base
Certified spruce wood, sustainable forestry
>90% reduced carbon footprint vs oil-based vanillin
Cost competitive technology
Capacity expansion ongoing
30
0
20
40
60
80
100
Wood vanillin Oil-based vanillin
90% reduced carbon footprint (as CO2 eq)%
BioSolutions

Capacity increase for wood based vanillin
31
Capacity increase at least 250 tonnes
Part of the increase will be gradually realised during construction phase
Construction started 2H 2019, completion 1H 2021
Debottlenecking of existing facility
Capex NOK 130 million
BioSolutions

Speciality cellulose
Market position
Strong positions in Europe and Asia within high-end niches
Production
Sarpsborg, Norway with capacity of 160,000 mt
32
Focused applications Market growth1)
Ethers 3-4%
Acetate -2-0%
Nitrocellulose 0%
Casings 3-4%
High quality speciality cellulose with strong niche positions
1) Source: Celco market reports and Borregaard estimates
BioMaterials

The speciality cellulose market - 2020
Source: Borregaard estimates, Celco market reports, RISI 2020All figures in cellulose tonnes – wood pulp and cotton linter pulp/refined cotton. Dissolving pulp figures do not include fluff and (modified) paper pulp
Speciality cellulose market ~1.6 MMT
Recent trends
Total speciality cellulose market relatively unchanged
Viscose (textile) market growth 8.4% annually last 5 years. Textile impacted by coronavirus pandemic – demand for textiles temporarily reduced in 2020
Industry restructuring
Total global cellulose market
Specialitycellulose
Viscose(textile)
Dissolvingpulp
Commodity market pulp 58MMT
6 to7 MMT¹⁾
Incr
easi
ng
spec
ialis
atio
n
Fluff 6 MMT
28%
Agriculture
Chemical/Others
Construction
Speciality paper 4%
Acetate35%
Ethers 30%
Tire cord 4%
NC 8%
MCC 11%
Cellophane 4%Casings 3%
Sponges 1%
BioMaterials
33
1) Million metric tonnes

Speciality cellulose market
34
Segments Applications
Market size ‘000 mt (2019)
Annual growth
2019-2023
Hig
hly
sp
ecia
lised
Acetate Cigarette filters, plastics, LCD, yarn
550 -2-0%
Ethers²) Construction, coatings, food, pharma, personal care
480 3-4%
Speciality paper Automotive filtration, bank notes
60 1-2%
Tire cord High-performance tire cords 60 3-4%
Oth
er s
pec
ialit
ies
Nitrocellulose (NC)
Coatings, printing inks, nail varnish, energetic grades
125 0%
Microcrystalline cellulose (MCC)
Food, pharma 180 3-4%
Cellophane Food packaging 55 0-1%
Casings Sausage casings 55 3-4%
Sponges Sponge cloths 20 1-2%
Speciality cellulosedemand 2019 (1.6 million mt1))
28%
Agriculture
Chemical/Others
Construction
Speciality paper 4%
Acetate35%
Ethers 30%
Tire cord 4%
NC 8%
MCC 11%
Cellophane 4%
Casings 3%Sponges 1%
Source: Celco market reports, RISI and Borregaard estimates1)Metric tonne2)Cellulose ether capacity excl. technical grade CMC
BioMaterials

Speciality cellulose suppliers
12 players supplying 1.6 million mt speciality cellulose
Top 4 players (Rayonier Advanced Materials, G-P Cellulose, Bracell and Borregaard) have 90%¹⁾ market share
Top 4 players use textile and fluff markets as capacity filler
Limited volumes from viscose pulp producers into speciality segments due to barriers to entry
35
Cosmo
Rayonier A.M.Temiscaming
Rayonier A.M.Fernandina
Rayonier A.M.Jesup
G-P CelluloseFoley
G-P CelluloseMemphis
Southern CellChattanooga
Bracell (RGE)
Sappi Saiccor
Borregaard
Domsjö
Rayonier A.M.Tartas
Misc Chinesecotton linter pulp
Nippon Paper
Owned by viscose fibre producersKraft Sulphite Cotton linter pulp
1)Source: Celco market reports and Borregaard estimates
BioMaterials

Speciality cellulose industry
Speciality cellulose market is approximately 1.6 million mt
Top 4 speciality cellulose producers have 90% market share and use hardwood and softwood as raw material
In addition, there are a few cotton linter pulp producers supplying this market
Main end-uses for speciality cellulose include acetate and ether, accounting for more than 60% of the market
36
Hardwood/kraft
Softwood/kraft
Hardwood/sulphite
Softwood/ sulphite
Rayonier AM ✓ ✓ ✓
Georgia-Pacific ✓
Bracell ✓
Borregaard ✓
Top 4 speciality cellulose producers by wood species and pulping process
Georgia Pacific
Speciality cellulose sales volume by producer
Rayonier AM
Borregaard
Bracell
Others
BioMaterials
Source: Borregaard estimates and Celco market reports
Cellulose ethers overview
Borregaard supplies speciality cellulose wood pulp to cellulose ether producers
The three main products manufactured by the ether producers are:
Methyl cellulose derivatives (MC, MHEC, MHPC)
Carboxy methyl cellulose (CMC)
Hydroxy ethyl cellulose (HEC)
Almost all products are used as additives to modify the rheological properties of water-based systems
37
Speciality cellulose
wood pulp or CLP
Cellulose ether
producer
CMC
MC-derivatives
Others
Coating
Pharma
Personal care
Construction
Food
HEC
BioMaterials

Cellulose ethers – solid growth and attractive opportunities
38
Others
ChinaTop 6
Construction
Coatings
Food
Pharma/ personal care
Others
Cellulose ether industry structure (total 480 kt ether pulp)
BioMaterials
In 2015-19, demand for ether pulp grew > 4% annually, expected at 3-4% going forward
Solid growth in all segments – temporary setback due to Covid-19
Top 6 cellulose ether producers represent approx. 50 % of global capacity
Major players are Dow, SE Tylose, DuPont, Ashland, Lotte and Nouryon
High concentration of producers and growth in Europe and Asia
1/3 of global capacity is in China, mainly using cotton linters pulp and refined cotton as a cellulose source, except for non-GMO regulated products for Europe
New cellulose ether capacity under construction in Europe and Asia
Industry consolidation ongoing
Borregaard well positioned for growth and further specialisationin close cooperation with key customers
Source: Borregaard estimates and Celco market reports

Cellulose acetate overview
Top 5 acetate flake producers represent >90% of global capacity (Celanese, Eastman, Daicel, Cerdia and NCFC)
Borregaard supplies speciality cellulose wood pulp to acetate flake producers. In 2015-19, demand for acetate pulp declined 2% annually, expected at -2-0% going forward
Global cigarette consumption declining, China is the key market
‘Heat-not-burn’ cigarettes (e.g. PMI IQOS) becoming popular, still small share
Growing concern for waste issues related to cigarette filters
Ice Bear is an enabler for entering non-filter tow applications
39
Speciality cellulose
wood pulp or CLP
Acetate flake
producer Cellulose diacetate
Cellulose triacetate
Films
Fibres
Fibres
Films
Plastic
Coatings
Filter tow475’ mt
Yarn 35’ mt
Triacetate LCD 22’ mt
Coatings, plastics and film 30’ mt
BioMaterials
Source: Borregaard estimates and Celco market reports
Ice bear – continued growth and new applications
40
Strategic initiative defending existing market positions and enabling
further specialisation and flexibility within acetate
Ramp-up based on market demand and customer qualification
Further growth projected in 2021-23 within several specialityapplications
Stricter regulations and issues with fossil-based plastics driven by consumer trends creates opportunities for Ice Bear
Acetate yarn and plastics are plant-based products
End products can be tailored for biodegradability
Joint product development with key customers
Further opportunities in ethers and tire cord
BioMaterials

Speciality cellulose – sustainability driving growth
Increasing demand for wood certification and sustainability assessments driven by current consumer trends
Customers active in consumer goods applications (food, pharma and personal care) are very committed to sustainable sourcing of renewable or biodegradable raw materials – growing interest in all segments
Water based paints with ether-based thickeners gained share over the last 20 years at the expense of solvent based paints driven by reduction of volatile organic carbons emissions by law
Cotton is becoming increasingly controversial
41
BioMaterials

Cotton linter pulp vs. speciality wood pulp
42
Cotton linter pulp (CLP), a by-product from cotton farming, is an alternative raw material for cellulose based products like ethers and acetate
Used "as is" or in blends with fluff pulp
Where GMO-free is a must, CLP cannot be used
Cotton’s use of land, pesticides and water is increasingly controversial
CLP has a significantly larger environmental footprint compared to speciality wood pulp
Growing environmental concern among consumers may favour speciality cellulose produced from wood
BioMaterials

Exilva cellulose fibrils
43
Global leader in micro-/nanofibrils
Competitors in pilot plant or captive use phase
Large scale plant with 1000 tonnes dry capacity
Use cellulose as raw material
Zero emissions
Embryonic but fast-growing market
Product is a network of micro and nano fibrils with large surface area
1 gram covers a tennis court
Key benefits
Improve and control flow
Create a barrier or a film
More than 30 application areas
From pharma to concrete
BioMaterials

Cellulose fibrils – Exilva
44
Microfibrillar cellulose (MFC) is cellulose fibers defibrillated into millions of tiny fibrils (100,000 times thinner than hair)
Exilva is Borregaard’s brand name for microfibrillar cellulose used in industrial applications
Exilva is a sustainable biobased material with multifunctional properties
Improves flow, stability, flexibility and strength in industrial formulations and materials
Enables customers to develop new and improved products
BioMaterials

Nanocellulose landscape
45
Three main product categories, with significant variations within each product group, few standards exist
NCC/CNC - nano cellulose crystals
NFC/MFC - nano/microfibrillated cellulose
CNF - ionic cellulose nano fibrils
Typically more complementary than competing in use, some overlaps
Crystals and ionic fibrils classified as nano by EU and USA (EPA), while NFC/MFC are not as they form micro clusters
One commercial size plant exists in each category
NCC/CNC - Celluforce, Canada
NFC/MFC - Exilva, Norway
CNF - Nippon Paper, Japan
Many pilot plants with 5-30 mt capacity
NCC/CNC –strength focus
NFC/MFC –rheology focus
CNF –composites focus
BioMaterials

Exilva – growing pipeline and customer base
50+ regular customers
Sales doubling year on year
Good growth with key customers
More than 2000 active prospects
Classified as a prospect when a sample is sent
Net increase (adjusted for closed/lost) +50 per month
>100 in plant trial phase
Positive from lab trials + 400
Long lead times/feedback; varies from 1-5 years, with 3 years average
Approx 650 prospects closed/lost
No clear trends on technologies or applications
<10% lost due to cost issues
46
0
20
40
60
80
100
120
01.06.2016 01.06.2017 01.06.2018 01.06.2019 01.06.2020
Customers and plant trials development
regular customers
plant trials
0
500
1000
1500
2000
2500
01.06.2016 01.06.2017 01.06.2018 01.06.2019 01.06.2020
Active prospects development
BioMaterials

Sustainability and performance driving demand
47
Moving from solvent based to water-based
Exilva enables some coatings and adhesives to be reformulated to water-based systems without reducing performance
Replacing carbomers
Carbomers are versatile acrylic copolymers used amongst other in personal and home
care products
Exilva can replace these in certain formulations
Removing or reducing the use of boron compounds
Borons are classified as Substances of Very High Concern
Exilva can replace boron in certain applications like adhesives for corrugated board
Enhancing strength of bioplastics
Product strength is the main challenge
Exilva can increase strength in some of these polymers
BioMaterials

0
10
20
30
40
50
60
70
80
90
100
Highly specialised Other
Volume split % Geographical split (sales revenues)
Customer base and concentration(sales revenues)
Sales distribution 2020
Borregaard is positioned in high-end segments in Europe and Asia, with strong and long-lasting customer relationships
48
43%
83%
0%
20%
40%
60%
80%
100%
Top 3 Top 101)
Europe68%
Asia27%
RoW5%
Source: Borregaard estimates1) Acetate, ether and tire cord grades
BioMaterials

Fine Chemicals
Market position
Leading producer of intermediates for contrast agents
Production
Sarpsborg, Norway
Products
C3 aminodiols
Intermediates for pharmaceutical products
Applications
Contrast agents for medical imaging
Medicines
Market growth¹⁾
5-7%
49
Market position
Leading producer of second-generation bioethanol
Production
Sarpsborg, Norway
Products
Pure and denatured bioethanol
Applications
Biofuel, disinfectant, pharmaceutical industry, home and personal care products, paint/varnish, car care
Capacity
20 million liters
Fine chemical intermediates Bioethanol
1) Source: Borregaard estimates
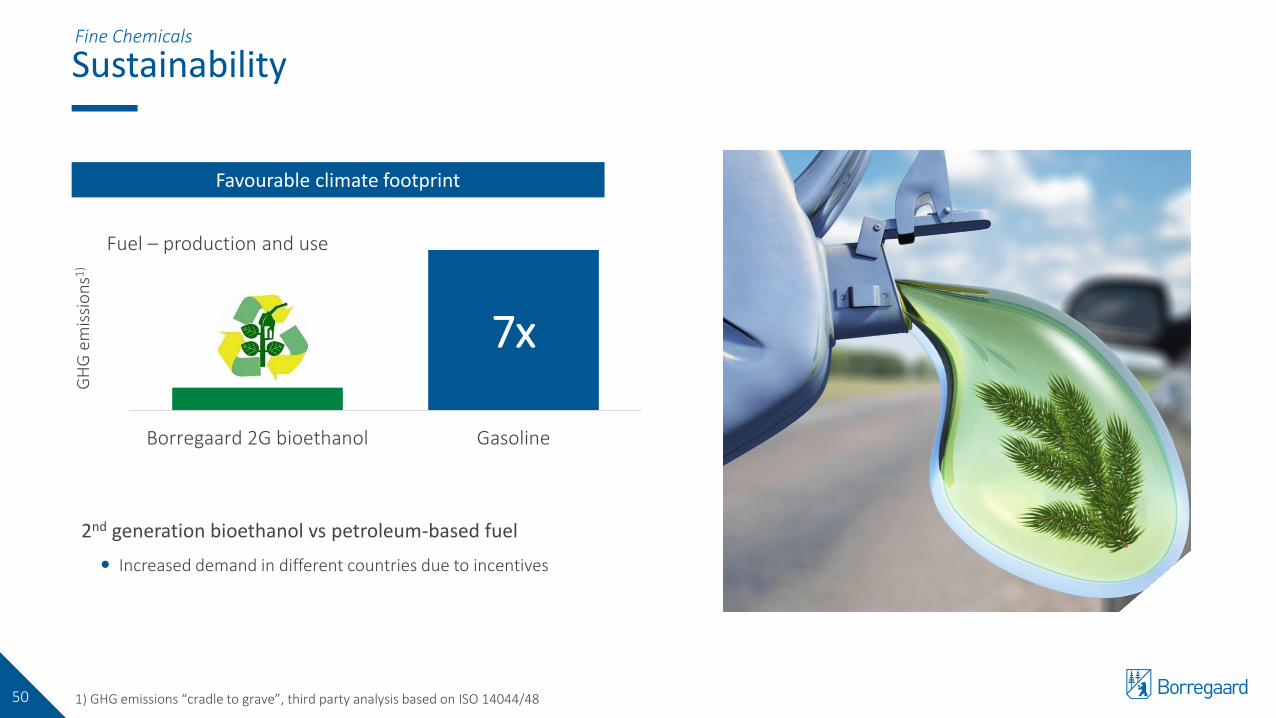
Sustainability
1) GHG emissions “cradle to grave”, third party analysis based on ISO 14044/48 50
7x
Borregaard 2G bioethanol Gasoline
GH
G e
mis
sio
ns1
)
Fuel – production and use
Favourable climate footprint
Fine Chemicals
2nd generation bioethanol vs petroleum-based fuel
Increased demand in different countries due to incentives

Research & development
1) Average last 5 years. 13% in 20192) Launched the last 5 years3) Includes R&D centres, operation of BALI/Exilva pilots and market/application innovations51
~18%1) of Borregaard’s revenues come from new products2)
Innovation Management Teams
~90 employees in R&D – of which 67 at the research centre in Sarpsborg – 28 have a PhD
R&D and innovation spending 3.6% of revenues in 20203)
IP strategies for each BU and major innovation projects
Cellulose Fibrils: Exilvamicrofibrillar cellulose
Continuous specialisation and improved products
«BALI»: Utilisation of various biomasses for lignin products
Innovation management

Business driven innovation model
52
Idea database
Ideas from sales, technical application, R&D, production, external partners
Innovation Management Teams (IMT)
Inter disciplinary development work
Scale-up and commercialisation
IMT• Chaired by head of
business unit• Cross functional team of
line managers• Gatekeepers at
important milestones Co-work with (when required): • Universities • Research institutes • Consultants
Co-work with (when possible):• Customers
Innovation management

Financial objectives and dividend policy
53
Financial objectives
ROCE²⁾ >15% pre-tax over a business cycle
IRR >15% pre-tax for expansion capex
Average net working capital at 20% of operating revenues
Replacement capex at depreciation level
Maintain key financial ratios corresponding to an investment grade rated company
Leverage ratio1) targeted between 1.0 and 2.25 over time
Borregaard’s dividend policy
To pay regular and progressive dividends reflecting Borregaard’s expected long term earnings, free cash flows and expansion capex
Annual dividend is targeted between 30% and 50% of net profit for the preceding fiscal year
1) Net interest-bearing debt divided by last twelve months’ EBITDA adj.²⁾2) Alternative performance measure – see Appendix
Financial objectives

Value creation since IPO
0
2 000
4 000
6 000
8 000
10 000
12 000
14 000
16 000
18 000
mNOK
Net debt Market capitalisation Accumulated dividend
CAGR
Share price, including reinvestment of dividend1) 30.1%
Enterprise value = market cap + net debt
22.5%
54
Financials
1) Dividend for 2020 based on the Board’s proposal to the AGM

Key figures 2015 – 2020
4164
44924618
47855063
5328
0
1 000
2 000
3 000
4 000
5 000
2015 2016 2017 2018 2019 2020
mNOK
Operating revenues
758
1 0211 055
903
1 007
1 132
0
4
8
12
16
20
24
0
250
500
750
1 000
1 250
1 500
2015 2016 2017 2018 2019 2020
%mNOK
EBITDA1) & EBITDA1) %
55
15,6
21,7
19,1
12,7
10,511,4
3,86
5,55 5,66
4,764,17 4,36
0
3
6
9
12
15
0
5
10
15
20
25
2015 2016 2017 2018 2019 2020
NOK%
ROCE1) and EPS2)
ROCE %
EPS
Financials
1) Alternative performance measures – see Appendix2) Earnings per share

Key segment figures 2015 – 2020
1) Alternative performance measures - see Appendix56
509
605
545
499
647 632
21,0
23,6
21,0
18,0
21,720,5
0
5
10
15
20
25
30
35
0
100
200
300
400
500
600
700
800
2015 2016 2017 2018 2019 2020
%mNOKBioSolutions
EBITDA1) & EBITDA %1)
188
321
414
312
234
318
13,1
20,4
24,8
18,8
13,7
18,4
0
5
10
15
20
25
30
35
0
100
200
300
400
500
600
700
800
2015 2016 2017 2018 2019 2020
%mNOKBioMaterials
EBITDA & EBITDA %
6195 96 92
126
182
19,4
25,8 25,924,6
31,0
33,5
0
5
10
15
20
25
30
35
0
100
200
300
400
500
600
700
800
2015 2016 2017 2018 2019 2020
%mNOKFine ChemicalsEBITDA & EBITDA %

• Chemicals1) and other raw materials like lignin raw material
• Internal production of caustic soda
• Contract manufacturing of petrochemical-based vanillin
• Change in inventories
• Most products sold delivered customer
• Logistical optimisation important, especially for Performance Chemicals
Key cost items 2016-2020
Total costs in 2020 close to 4.2 billion NOK
4.9% CAGR from 2016 to 2020
Main cost components’ share of total costs relatively stable over time
1) Main chemicals are caustic soda, salt, sulphur, epichlorohydrine and guethol57
16% 16% 16% 17% 16%
25% 26% 25% 25% 26%
10% 11% 11% 11% 13%
28% 25% 25% 24% 26%
11% 12% 11% 11% 8%
10% 10% 12% 13% 11%
0%
20%
40%
60%
80%
100%
2016 2017 2018 2019 2020
% of total cost
Other expenses Payroll expenses Distribution costs
Other CoM Energy Wood
• 75%-85% sourced from Norway, the rest mainly from Sweden
• Annual price and volume contracts, mid-year adjustments occur
• Includes inbound logistics, ~30% of wood cost
Wo
od
Ener
gyD
istr
ibu
tio
n
cost
sP
ayro
ll ex
pen
ses
• Energy consumption: Heat energy 2/3, electricity 1/3
• Heat energy: Base load mainly covered by renewable energy sources,peak-load mainly covered by LNG and spot electricity
• Electricity: Long term contract to 2029 for substantial part of needed volume
• Continuous productivity improvement, including de-manning and cost reduction activities
Oth
er
exp
ense
s
• Repair and maintenance, external services, rental/leasing and other operating expenses
Oth
er C
oM
Financials

Sensitivity on EBITDA¹⁾
Global presence, diversified product portfolio and GDP-driven demand reduce market risk
Oil price affects demand and competition in certain markets, but main effect historically has been on NOK FX rate
Significant FX exposure, softened by FX hedging²⁾ in the medium term
No major single component in other cost of materials
Distribution costs: Most products sold “delivered customer”
Other expenses are repair and maintenance, external services, rental/leasing etc.
1) Alternative performance measure – see appendix2) Hedging based on expected net cash flow (EBITDA)- Base hedge - 75%/50% on a rolling basis for 6/9 months for major currencies- Extended hedge - 75%/50% of the next 24/36 months if USD and EUR are above predefined levels58
Financials
0 5 10 15 20 25 30
Other expenses
Payroll expenses
Distribution costs
Other cost of materials
Energy cost
Wood cost
FX incl hedging
FX ex hedging
Sales price BioMaterials
Sales price BioSolutions
MNOK
Sensitivity of 1% change(based on 2020)

FX impact and policy
Purpose is to delay effects of currency fluctuations and secure competitiveness Hedging based on expected net cash flow (EBITDA1) 2)
Base hedge - 75%/50% on a rolling basis for 6/9 months for major currencies Extended hedge - 75%/50% of the next 24/36 months if USD and EUR are
above defined levels EUR; gradually increased at effective rates from 9.25 to 9.75 USD; gradually increased at effective rates from 8.00 to 8.50
Contracts 3) - 100% hedged Balance sheet exposure hedged 100% Net investments in subsidiaries hedged up to 90% of book value in major
currencies
1)Alternative performance measures - see Appendix2)Net cash flow hedging mainly in the Norwegian company3)Strict definitions for contracts applied for 100% hedging (mutually binding agreement in which price, currency, volume and time are defined)4)Currency basket based on Borregaard’s net exposure in 2019 (=100)59
Financials
Currency hedging strategy
FX exposure
Borregaard’s revenues are primarily in USD or EUR, while costs are primarily
in NOK
Net FX exposure in 2019 USD: 65% (approximately 203 mUSD)
EUR: 35% (approximately 98 mEUR)
Other: 0% (GBP, BRL, JPY, SEK, ZAR)
-241
-115
-72
-11
-76
-241-300
-200
-100
0
2015 2016 2017 2018 2019 2020
mNOK Hedging gain/losses on EBITDA
91,8
95,594,5 94,1
100,0
107,2
90,0
95,0
100,0
105,0
110,0
2015 2016 2017 2018 2019 2020
Borregaard currency basket4)

Cash flow, NWC and investments 2015 – 2020
563
1081
780
558697
886
0
200
400
600
800
1 000
1 200
1 400
2015 2016 2017 2018 2019 2020
mNOK
Cash flow from operating activities
Cash flow from operating activities EBITDA¹
878 875820
875
1165
1 298
0%
5%
10%
15%
20%
25%
0
250
500
750
1 000
1 250
1 500
2015 2016 2017 2018 2019 2020
%mNOK
Average NWC
NWC avg % of OpRev ex hedging
60
246358 344 346 370 344
184
264
624
416
213159
0
200
400
600
800
1000
2015 2016 2017 2018 2019 2020
mNOKInvestments
Replacement Expansion Depr. ex IFRS16
Financials
1) Alternative performance measures - see Appendix

INVESTMENT FORECAST 2021-2023
Replacement investments
Targeted at depreciation level
Upgrade of caustic soda production facility a major investment in 2020 and 2021
Expansion2 investments
Capacity expansion for wood-based vanillin the main project (130 mNOK, completion mid-2021)
A few smaller expansion projects are ongoing or planned
Revised forecast due to carry-over from 2020
Mainly related to the caustic soda production facility (replacement) and capacity expansion for wood-based vanillin (expansion)
New projects may lead to additional investments
344400
350 350
159
150
50 50
503
550+/-60
400+/-60
400+/-60
0
100
200
300
400
500
600
2020 2021 2022 2023
mNOKInvestment forecast1
Replacement Expansion² Depreciation ex IFRS16
61
1 Uncertainty is related to final investment decisions, timing of investment payments, execution time and risk and unexpected events2 Alternative performance measure, see Appendix for definition

Major expansion investments – BioSolutions
1) Metric tonne dry solid2) Last twelve months as per June 202062
Investment 890 mNOK (110 mUSD) in 100,000 mtds¹) capacity (phase 1)
Investment 450 mNOK in increased drying capacity, storage tanks and improved solutions for logistics, infrastructure and energy
Investment 130 mNOK in increased capacity of at least 250 tonnes for wood-based vanillin
Volume ramp-up in line with 3-year plan, profitability behind expectations, mainly due to an unfavourable product mix and higher distribution and fixed costs
Cost savings in Norway according to plan, additional restructuring of German operation. Reduced exposure to cyclical market segments and further specialisation
Completion of capacity increase mid-2021, part of the increase in production already realised during last twelve months
EBITDA improvement target next 3 years:150-250 mNOK vs 2020 LTM2) through volume increase, optimisation of product mix, further specialisation and cost savings
Florida – Biopolymers New lignin plant
Sarpsborg site – BiopolymersUpgrade and specialisation of plant
Sarpsborg site – BiovanillinCapacity expansion
Financials From CMD September 2020

Major expansion investments – BioMaterials & Fine Chemicals
1) Last twelve months as per June 202063
Financials
Investment 215 mNOK in increased capacity and quality improvement for high purity cellulose
Investment 225 mNOK in commercial scale (1,000 tonnes dry material) production facility for Exilva cellulose fibrils
Investments totalling more than 100 mNOK in increased capacity for water-free bioethanol and pharma intermediates
Ice Bear volume has gradually increased, significant contributor to stabilise results over time and reduce exposure to textile cellulose
Strong interest from the market and growing number of commercial customers. Sales volume still low and lead-times continue to be quite long
Successful bioethanol expansion with extraordinary result in Q2-20, cost effective debottlenecking for pharma intermediates
EBITDA improvement target next 3 years:75-125 mNOK vs 2020 LTM¹⁾ through volume increase and further specialisation
Sarpsborg site – Speciality celluloseIce Bear project
Sarpsborg site – Cellulose fibrilsExilva plant and commercialisation
Smaller expansion projectsBioethanol and pharma intermediates
From CMD September 2020

Impact from investments on key financials
Assumptions
Actual FX rates USD 9.00 and EUR 10.70 vs NOK, including effects from existing hedging positions
Forecasted investments at midpoints. NWC increasing with revenues. Dividend increased in line with policy.Potential larger expansion investments beyond forecast may negatively affect key financials in the period
Other parameters constant (major uncertainties are market demand, world economy, Covid-19 situation, general cost inflation and input factor prices)
1) Alternative performance measures - see Appendix2) Earnings per share3) Last twelve months as per June 202064
1 072
1 597+/-100200
225
200
800
1 000
1 200
1 400
1 600
1 800
2020 LTM³⁾ FX @actual rates
Investmenttargets
2023 targetsmidpoint
mNOK EBITDA¹⁾ target from investment projects
10,6
17,4
16,6
18,0
3,72
8,20
7,30
9,10
2
4
6
8
10
8
11
14
17
20
2020 LTM³⁾ 2023 targets 2020 LTM³⁾ 2023 targets
NOK%ROCE¹⁾ and EPS²⁾ targets from investment projects
ROCEEPS
If targets are met, Borregaard will improve profitability and meet ROCE objective in 2023
Financials From CMD September 2020

Capital structure
Target for capital structure Maintain key financial ratios corresponding to an investment grade
rated company
Leverage ratio1) targeted between 1.0 and 2.25 over time
Solid capital structure as per 31.12.20 Leverage ratio 1.58 (covenant <3.25)
Equity ratio¹⁾ 53.9% (covenant >25%)
Long term credit facilities New revolving credit facilities (RCF) in July 2020, maturity 2023 and 2025,
margin linked to sustainability targets
60mUSD term loan for LignoTech Florida (LTF), tenor 8.5 years from
completion of project phase 1
Bond issues, 400 mNOK, maturity June 2023
Nordic Investment Bank (NIB) loan, 40 mEUR, maturity 2024
Short term credit facilities 225 mNOK overdraft facilities
15 mUSD overdraft facility in LignoTech Florida
400 mNOK commercial paper
65
0
500
1 000
1 500
2 000
2 500
3 000mNOK Leverage ratio and loan capacity
NIB Bonds LTF RCF NIBD
1.0 * EBITDA
Financials
1) Alternative performance measures - see Appendix
2.25 * EBITDA

Highly experienced and proven management team
66
Management
Gisle Løhre Johansen
• EVP Speciality Cellulose and Fine Chemicals
• In current position from May 2019
• 30 years with Borregaard
Per Bjarne Lyngstad
• CFO
• 23 years in current position
• 33 years with Borregaard
Kristin Misund
• SVP R&D and Business development
• In current position from May 2019
• 28 years with Borregaard
Tom Erik Foss-Jacobsen
• EVP BioSolutions
• In current position from May 2019
• 22 years with Borregaard
Liv Longva
• SVP Strategic Sourcing
• In current position from June 2020
• 13 years with Borregaard
Dag Arthur Aasbø
• SVP Organisation and Public Affairs
• 13 years in current position
• 28 years with Borregaard
Ole Gunnar Jakobsen
• Plant Director - Sarpsborg Site
• 13 years in current position
• 26 years with Borregaard
CEO
Per A. Sørlie
• CEO since 1999
• Member of management team since 1990
• 31 years with Borregaard
Sveinung Heggen
• General Counsel
• 8 years in current position
• 8 years with Borregaard

Appendix – alternative performance measures
In the discussion of the reported operating results, financial position and cash flows, Borregaard refers to certain measures which are not defined by generally accepted accounting principles (GAAP) such as IFRS. Borregaard management makes regular use of these alternative performance measures and is of the opinion that this information, along with comparable GAAP measures, is useful to investors who wish to evaluate the company’s operating performance, ability to repay debt and capability to pursue new business opportunities. Such alternative performance measures should not be viewed in isolation or as an alternative to the equivalent GAAP measure.
EBITDA: Operating profit before depreciation, amortisation and other income and expenses.
EBITDA margin: EBITDA divided by operating revenues.
Equity ratio: Equity (including non-controlling interests) divided by equity and liabilities.
Expansion investments: Investments made in order to expand production capacity, produce new products or to improve the performance of existing products. Such investments include business acquisitions, pilot plants, capitalised R&D costs and new distribution set-ups.
Other income and expenses: Non-recurring items or items related to other periods or to a discontinued business or activity. These items are not viewed as reliable indicators of future earnings based on the business areas’ normal operations. These items will be included in the Group's operating profit.
Leverage ratio: Net interest-bearing debt divided by last twelve months’ EBITDA.
Net interest-bearing debt (NIBD): Interest-bearing liabilities minus interest-bearing assets.
Return on capital employed (ROCE): Last twelve months’ capital contribution (operating profit before amortisation and other income and expenses) divided by average capital employed based on the ending balance of the last five quarters. Capital employed is defined as the total of net working capital, intangible assets, property, plant and equipment, right-of-use assets and investment in joint venture minus net pension liabilities.
67