Business-It Alignment in Higher Education Institutions ...
81
United Arab Emirates University Scholarworks@UAEU eses Electronic eses and Dissertations 11-2017 Business-It Alignment in Higher Education Institutions: United Arab Emirates University Case Study Nayla Salem Ali Al khateri Follow this and additional works at: hps://scholarworks.uaeu.ac.ae/all_theses Part of the Information Security Commons is esis is brought to you for free and open access by the Electronic eses and Dissertations at Scholarworks@UAEU. It has been accepted for inclusion in eses by an authorized administrator of Scholarworks@UAEU. For more information, please contact [email protected]. Recommended Citation Ali Al khateri, Nayla Salem, "Business-It Alignment in Higher Education Institutions: United Arab Emirates University Case Study" (2017). eses. 709. hps://scholarworks.uaeu.ac.ae/all_theses/709
Transcript of Business-It Alignment in Higher Education Institutions ...

United Arab Emirates UniversityScholarworks@UAEU
Theses Electronic Theses and Dissertations
11-2017
Business-It Alignment in Higher EducationInstitutions: United Arab Emirates University CaseStudyNayla Salem Ali Al khateri
Follow this and additional works at: https://scholarworks.uaeu.ac.ae/all_theses
Part of the Information Security Commons
This Thesis is brought to you for free and open access by the Electronic Theses and Dissertations at Scholarworks@UAEU. It has been accepted forinclusion in Theses by an authorized administrator of Scholarworks@UAEU. For more information, please contact [email protected].
Recommended CitationAli Al khateri, Nayla Salem, "Business-It Alignment in Higher Education Institutions: United Arab Emirates University Case Study"(2017). Theses. 709.https://scholarworks.uaeu.ac.ae/all_theses/709

UJ\EU al ti....u •all ul Lo!JI Ci.sulb
.. . J .
United Arab Emirates University
United Arab Emirates University
College of Information Technology
Department of Information Systems and Security
BUSINESS-IT ALIGNMENT IN HIGHER EDUCATION
INSTITUTIONS: UNITED ARAB EMIRATES UNIVERSITY
CASE STUDY
Nayla Salem Mohammed Ali Al khateri
This thesis is submitted in partial fulfilment of the requirements for the degree of
Master of Science in Information Technology Management
Under the Supervision of Dr. Farag Sallabi
November 2017

Approval of the Master Thesis
This Master Thesis is approved by the following Examining Committee Members:
1) Advisor (Committee Chair): Dr. Farag Sallabi
Title: Associate Professor
Department of Computer and Network Engineering
College of Infonnation Technology
ctJ;- -Signature ------\:::::;;5.---- --
2) Member: Dr. Marton Gergely
Title: Assistant Professor
Department of Information Systems and Security
College of Information Technology
Signature 3) Member (External Examiner): Dr. Adel Khelifi
Title: Professor
Department of Computer Information Technology
Institution: American University in Emirates
Signature---+ . .:..._ ___ ... _____ _
Date I 4-' 11. f l
Date / '/ -11 - 1"1
Date Jt.t- I (- 11-
v

This Master Thesis is accepted by:
Dean of the College of Information Technology: Professor Khaled Shuaib
Signature#
Dean of the College of Graduate Studies: Professor Nagi T. Wakim
Signature& : . '
Copy of _!J_
Date J tr \ \ 2. \ 2-0 I 7
v

iii
Copyright
Copyright © 2017 Nayla Salem Mohammed Ali Al khateri
All Rights Reserved

vi
Abstract
This thesis addresses the importance of Business-IT alignment in higher
education institutions. Business-IT alignment is defined as applying IT in a suitable
and timely manner, in harmony with business strategies, goals and needs. Business-
IT alignment is an ultimate goal of governmental and non-governmental
organizations that requires close attention and continuous monitoring. UAE
university has a well-defined business strategy augmented with a well-defined IT
strategy. So, to get the most benefits of acquiring and using IT in the university, the
IT need to be aligned with the core business and the supporting services. The main
objective of this thesis is to review the literature concerning the Business–IT
alignment topic with focus on higher education institutions and explore different
Business–IT alignment frameworks. Also, to define the as-is enterprise architecture
of the UAEU using SAMM (Strategic Alignment Maturity Model) by Luftman. This
model is used to measure the Business-IT Alignment level of the university. The
Business-IT alignment of the as-is architecture will be assessed then the assessment
results will be analyzed and draw conclusions. Also, suggestions for improvements
are put forward, based on the results. Finally, in the last chapter, implications and
limitations of this thesis are discussed and suggestions for other and/or further
research are made.
Keywords: Business-IT Alignment, Assessment Model, Strategic alignment,
Strategic Alignment Maturity model, SAMM.

vii
Title and Abstract (in Arabic)
: دراسة حالة المعلومات في مؤسسات التعليم العاليوتقنية قطاع الأعمال مواءمة
جامعة الإمارات العربية المتحدة
الملخص
بأنها تعرفتختص هذه الأطروحة بأهمية قضية المواءمة بين الأعمال وتقنية المعلومات. و
تطبيق تقنية المعلومات بطريقة مناسبة وفي الوقت المناسب، وفي توافق مع استراتيجيات
نية المعلومات هدف رئيسي وأهداف واحتياجات الأعمال. وتعتبر المواءمة بين الأعمال وتق
لدى .للمنظمات الحكومية وغير الحكومية التي تتطلب الاهتمام الوثيق والمراقبة المستمرة
تقنية استراتيجية مع ومحسنة وجيده واضحة استراتيجية المتحدة العربية الإمارات جامعة
الجامعة، في المعلومات تقنية استخدام من الفائدة من قدر أكبر على وللحصول لذلك المعلومات،
.المساعدة والخدمات الرئيسية الأعمال مع المعلومات تقنية بين مواءمة هناك تكون أن يجب
مواءمة الأعمال بموضوع المتعلقة إن الهدف الرئيسي من هذه الأطروحة هو مراجعة الدراسات
الدراسات. وبالإضافة واستكشاف مختلف النماذج المطروحة من قبل هذه المعلومات، وتقنية
العربية لدراسة حالة بنية جامعة الإمارات (SAMM) لوفتمان على ذلك، استخدم نموذج
المتحدة الحالية، حيث تم استخدام هذا النموذج لقياس مستوى المواءمة بين قطاع الأعمال وتقنية
تحليل البيانات ثم تم ومن الحاضر، المعلومات في الجامعة و تقييم حالة البنية في الوقت
واستخلاص النتائج. واستنادا على هذه النتائج، تم تقديم الاقتراحات المناسبة للتطوير والتحسين
.في المواءمة
وتقديم الدراسة لهذه والقيود المشاكل مناقشة تم الأخير، الفصل في وبالأخص النهاية وفي
يحتوي الذي الملحق إضافة تم الرسالة هذه نهاية وفي وأخيرا المستقبلية، للبحوث المقترحات
في المعلومات وتقنية الأعمال بين المواءمة لدراسة المستخدمة ونتائجه الاستبيان أسئلة على
.الإمارات جامعة
نموذج الاستراتيجية، ءمةالموا اءمة الأعمال وتقنية المعلومات،مو: مفاهيم البحث الرئيسية
.الاستراتيجية المحاذاة

viii
Acknowledgements
I would like to pay special thankfulness, warmth and appreciation to the
persons below who made my research successful and assisted me at every point to
cherish my goal.
My advisor Dr. Farag Sallabi for the continuous support of my research, for
his patience, motivation, enthusiasm, and immense knowledge. His guidance helped
me in all the time of research and writing of this thesis. My committee for their
guidance, support, and assistance throughout my preparation of this thesis, and all
members of the Department of IT Management at the United Arab Emirates
University for assisting me all over my studies and research. My thanks are extended
to the Library Research Desk for providing me with the relevant reference material.
Also, to all my colleagues: Ahlam Kharbash, Alramzana Navaz, Arwa, Shaikha Al
Neyadi and Noura Al khaili who in one way or another shared their support, either
morally and physically during our study in UAEU. In addition, to Dr. Abdullah Al
Khateri, you should know that your support and encouragement was worth more than
I can express on paper.
I would also like to thank my parents, sisters, and brothers. My dearest
friends Eman Al Ghufli and Yusra Al Rawahi. They were always supporting me and
encouraging me with their best wishes. Also, my special thanks go to Mr. Ali Hassan
who is always there cheering me up and stood by me through the good times and
bad. Finally, to my father who was often in my thoughts on this journey – you are
missed.

ix
Dedication
To my beloved parents and family

x
Table of Contents
Title ..................................................................................................................................... i
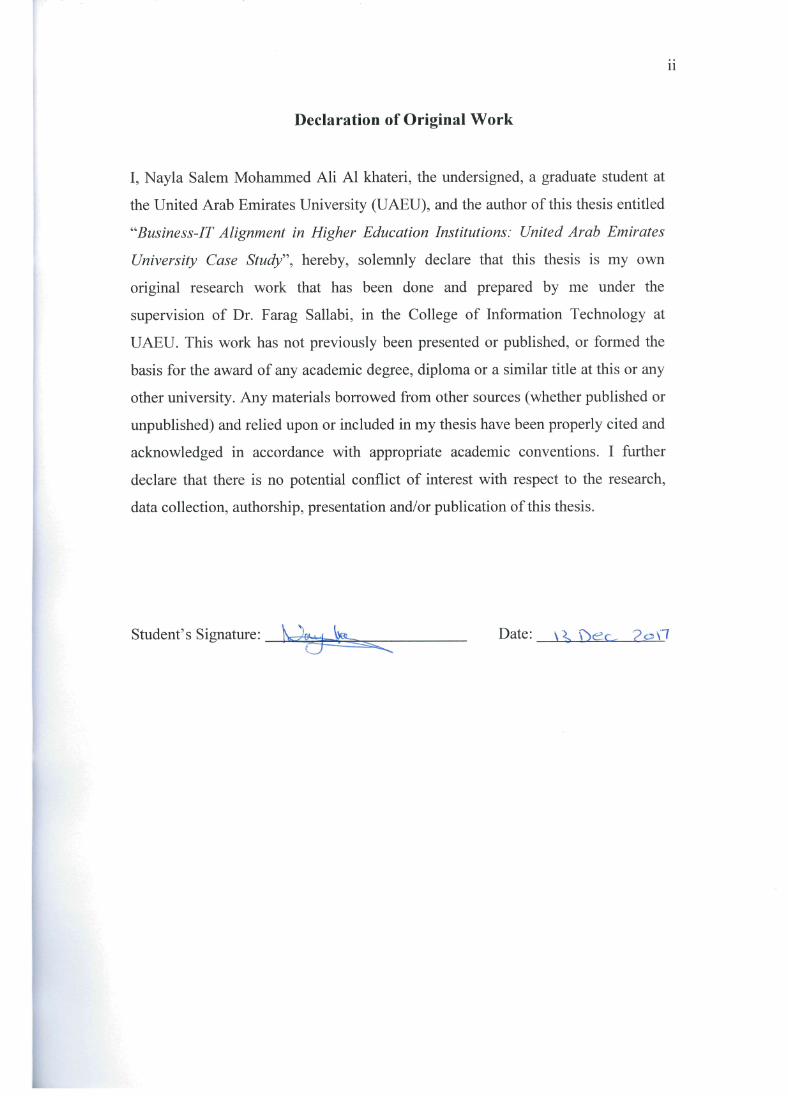
Declaration of Original Work ........................................................................................... ii
Copyright ......................................................................................................................... iii
Approval of the Master Thesis .......................................................................................... iv
Abstract ............................................................................................................................. vi
Title and Abstract (in Arabic) ......................................................................................... vii
Acknowledgements ........................................................................................................ viii
Dedication ......................................................................................................................... ix
Table of Contents ............................................................................................................... x
List of Tables................................................................................................................... xii
List of Figures ................................................................................................................ xiii
List of Abbreviations....................................................................................................... xiv
Chapter 1: Introduction ...................................................................................................... 1
1.1 Overview .......................................................................................................... 1
1.2 Statement of the Problem ................................................................................. 2
1.3 Literature Review ............................................................................................. 4
1.3.1 Business- IT Alignment in Higher Education .......................................... 9
1.3.2 Business-IT Alignment Models ............................................................. 10
Chapter 2: Methods .......................................................................................................... 13
2.1 United Arab Emirates University IT Strategic Plan ....................................... 13
2.2 Research Design ............................................................................................. 14
2.2.1 The Six Criteria of Strategic Alignment Maturity ................................. 15
2.2.2 The Five Levels of Strategic Alignment Maturity ................................. 19
2.2.3 Processes of Strategic Alignment ........................................................... 22
2.3 Data Collection............................................................................................... 23
Chapter 3: Results Analysis and Discussions .................................................................. 24
3.1 Communication .............................................................................................. 26
3.2 Competitive/Value Measurement................................................................... 29
3.3 Governance .................................................................................................... 31
3.4 Partnership ..................................................................................................... 32
3.5 Scope and Architecture .................................................................................. 34
3.6 Skills ............................................................................................................... 35
3.7 Alignment Level per Administrations and Departments ............................... 37
Chapter 4: Limitations and Lessons Learned ................................................................... 41
Chapter 5: Conclusion ...................................................................................................... 43

xi
References ........................................................................................................................ 45
Appendices ....................................................................................................................... 53
Appendix 1: SAMM’S Criteria and Attributes .................................................... 53
Appendix 2: Alignment Level per Departments .................................................. 54
Appendix 3: Alignment Level per Administrations ............................................. 55
Appendix 4: A Survey on “BITA in Higher Education Institutions” .................. 56

xii
List of Tables
Table 1: DoIT Goals & UAEU Goals ........................................................................ 14
Table 2: Communication Criterion From (As-is) to (To-be) ..................................... 27
Table 3: Value Measurement Criterion From (As-is) to (To-be) ............................... 29
Table 4: Governance Criterion From (As-is) to (To-be) ............................................ 31
Table 5: Partnership Criterion From (As-is) to (To-be) ............................................. 33
Table 6: Scope and Architecture Criterion From (As-is) to (To-be) ......................... 34
Table 7: Skills Criterion From (As-is) to (To-be) ...................................................... 36
Table 8: Abbreviations of the Administration in UAEU ........................................... 38
Table 9: Abbreviations of the Departments of UAEU ............................................... 40

xiii
List of Figures
Figure 1: The Six Criteria of SAMM ........................................................................ 16
Figure 2: The Five Levels of SAMM ......................................................................... 20
Figure 3: Organizational Chart of UAEU .................................................................. 25
Figure 4: UAEU Alignment Level ............................................................................. 26
Figure 5: Alignment Level of Communication Attributes ......................................... 28
Figure 6: Alignment Level of Value Measurement Attributes .................................. 30
Figure 7: Alignment Level of Governance Attributes ............................................... 32
Figure 8: Alignment Level of Partnership Attributes. ............................................... 33
Figure 9: Alignment Level of Scope & Architecture Attributes ................................ 35
Figure 10: Alignment Level of Skills Attributes........................................................ 37
Figure 11: Alignment Level per Administration ........................................................ 37
Figure 12: Alignment Level per Department ............................................................. 39

xiv
List of Abbreviations
BITA Business-IT Alignment
C Communication
COBIT Control Objectives for Information and Related Technology
DOIT Division of Information Technology
G Governance
IT Information Technology
ITG IT Governance
ITIL Information Technology Infrastructure Library
P Partnership
S Skills
SA Scope & Architecture
SAMM Strategic Alignment Maturity Model
TOGAF The Open Group Architecture Framework
UAEU United Arab Emirates University
VM Value Measurement

1
Chapter 1: Introduction
1.1 Overview
Recently, technology has become one of the key elements in our daily life. It
has a big role in different sectors, especially in business. Organizations and firms
have chances of success by following the right technological path. Also, because of
the business technology revolution, organizations can improve their communication
processes smoothly. The positive impact of technology on business has changed the
game of business and the business sector is becoming much more competitive than
before. IT has positioned to support organizational goals and objectives, and plays a
role in developing long term business strategy, therefore ensuring that IT and
business strategy functions are aligned is necessary. Several studies and researches
were conducted to highlight the alignment concerns, the first time the alignment
mentioned was in the late 1970s [1].
In the recent years, there has been a growing attention to the topic "Business-
IT alignment" that was studied in the literature with different terms. According to
Porter [2], it is called fit; it is also defined by Ciborra as bridge in [3]; integration by
Safferstone [4]; harmony by Luftman [5]; linkage by Henderson & Venkatraman [6];
and fusion by Smaczny [7]. For example, it can be defined as “applying information
technology (IT) in an appropriate and timely way, in harmony with business
strategies, goals and needs” [5], [8]. Also, it is the linkage between business and IT at
the strategic or planning level. That is the degree to which the IT mission, objectives,
and plans support, and are supported by, the business mission, objectives and plan [9
- 13]. The alignment must include integration of business strategy, IT strategy,

2
business infrastructure and IT infrastructure to achieve organization’s objectives as
well as improving performance or gaining competitive advantages. However,
achieving and sustaining alignment is a big concern and a major challenge for many
organizations. In addition, Luftman & Brier [5] presented the enablers and inhibitors
that need to be understood and acted upon to achieve alignment. One of the enablers
is the support from the senior management, because they define the need for business
leaders to cognizant and support technology innovation. Another enabler is the IT
management’s participation in the creation of business strategies and development of
its own strategies for success. Moreover, one of the key factors for alignment is the
IT managers need to understand business environment. Other enablers are
appropriate prioritization of activities and strong leadership. The same list for
inhibitors show up as well as enablers, so organizations need to focus on maximizing
the enablers and minimizing the inhibitors in order to achieve cohesive goals across
the organization and allows them to address insufficiencies and realign to the
strategic path [14]. The experience in [8] displays that no single activity will enable a
firm to attain and sustain alignment.
1.2 Statement of the Problem
The technology has been present in education for many years, so, a research
work expects that alignment is even more complicated in (higher) education because
the IT leader challenge is to align organizational plans, investments, priorities, and
actions not only with institutional priorities emerging from the leadership but also
with the link to the fast shifting goals of various colleges, and departments [15]. This
expectation finds support in Luftman and Kempaiah’s study in 197 organizations
[16], which ranks education as the lowest scoring industry sector on alignment

3
maturity. Given the opportunity that IT is offered in teaching and learning [17], [18].
Business–IT alignment is an ultimate goal of governmental and non-governmental
organizations that require close attention and continuous monitoring. Since its
establishment, the UAE University has been keen to enhance its core business and
supporting services with the up-to-date technologies and learning and teaching tools.
To get the most benefits of acquiring and using IT in the university, the IT needs to
be aligned with the core business and the supporting services. The university has a
well-defined business strategy augmented with a well-defined IT strategy. Business–
IT alignment will reduce/eliminate any waste and duplication of IT resources, failed
projects, difficulties in executing components aspects of business strategy that are
IT-dependent or IT-enabled.
The aims of this thesis are reviewing the literature concerning the Business-
IT alignment topic, assessing the Business-IT alignment of the as-is architecture of
the UAE university using Strategic Alignment Maturity Model proposed by Luftman
and analyzing the data to identify the gaps of misalignment. In order to provide the
university with the major insights to prioritize the actions for attaining the alignment.
Based on the purpose of the research, the following research questions is formulated:
• To what extent the effects of Business-IT alignment/misalignment in
universities?
Hypothesis: A higher educational organization performance and total spending are
positively/negatively affected by the level of maturity and alignment/misalignment
between business and IT.

4
1.3 Literature Review
Several researches and numerous methods, techniques and tools were
proposed after Business-IT alignment (BITA) is considered as one of the top ranked
management needs. In the annual survey conducted by the Society for Information
Management (SIM), BITA was at the top of management concerns in 2003–2016
with the exception of some years when it was in the second place [19]. The SIM
study proposes that alignment remains a determined issue due to the changing nature
of business and the difficulty that the IT organization has in responding to these
changes. Therefore, different researchers studied the role and impact of alignment on
business performance such as [8], [20 - 23] The researches provide different factors
about alignment and its influence on business. Some alignment researches focused
on improving organization performance [24 - 26]. For example, increasing sales
revenue [27], [28], enhancing operational efficiency [29], [30], reducing cost [31 -
33], and improvement on customer value [34], [35], [32]. Authors in [36], [37]
suggested “aligned” organizations are more likely for investment in IT and allocating
resources to projects regarding to all business objectives. Because of the
understanding of top management of particular business issues in their company,
they welcome what can be done through IT. Moreover, aligned organization force IT
to respond and take advantages of opportunities in the market, increase profit and
gain sustainable competitive advantages [36], [38], [39]. On the other hand, other
researchers found out that aligned organizations reported that there is no changing in
their performance e.g. an “alignment paradox” which means organizations risk
closing themselves in certain way of doing business when create an inflexible IT
backbones and align them to strategy. [31], [40]. The work in [41 - 43] suggested

5
that alignment can result in stagnation, strategic inflexibility, and competitive
disadvantage because it may require specific IT investment and concentrating on
alignment as a remedy for IT-related problems can be wasteful. However, other
argued that alignment may lead to rigid organization because the tight connection
between IT and business restricts the organizations so they will not be able to
recognize change, decrease strategic flexibility, and prevent their ability to respond
to environmental change [7], [36], [41], [44], [45]. This condition is called “rigidity
trap” where the organization may find itself in. It occurs because of the alignment
process is too time consuming, costly and need quick responses to change market
[46]. In general, different studies summarize that alignment may lead to advantages
or disadvantages outcomes for the organizations. Researchers who studied alignment
have developed many models to explain how alignment provides value for firms and
how it can be used to achieve, assess and maintain BITA. One of the first theory of
strategic alignment was introduced in the mid-1980s by Henderson and Venkatraman
[20] they developed the strategic alignment framework in 1990. All other developed
models were focused on different components and highlighted different perspectives,
therefore, this makes it difficult for choosing appropriate BITA models. Moreover,
the challenge to achieve the alignment, identified some years ago, remains hard to
address in practice where there are various models to measure the alignment. Some
models are apparently much more accepted than others, although there seems to be
no consensus on the best one [47] and because there is no a comprehensive approach
for measuring the capabilities of models. Some of early studies are available like [40]
and [49] but a structured comparison between Business-IT alignment models is
missing. This is because of the absence of well-known criteria for evaluating the
models which are available but spread across many sources in literature [47]. In

6
addition, after three decades of research in alignment, Chan and Reich [48]
summarized 150 different articles on this field in an extensive bibliographical study
that included different forms of alignment terms in the literature such as business/IT
alignment, business and IT alignment, business–IT alignment, IT alignment, and
alignment of business and IT, all have the same meaning. Also, the terms IT, ICT
and IS are often used interchangeably. Many studies used different keywords in titles
and abstracts, so it was difficult to find relevant articles in order to find different
models to compare between them. There are many survey papers purposed such as A
Systematic Review of Business and Information Technology Alignment by Ullah
[50] who used the guidelines developed by Kitchenham to review the available
research papers to understand the business-IT alignment and provide a list of future
research direction regarding this field. Also, comparison frameworks can be found in
studies such as that by Chan et al. [51]. Moreover, Avesano & Tortorella [52]
proposed a literature review to evaluate different alignment approaches that aims to
find similarity, maturity, capability to measure, model, asses and evolve the
alignment level existing among business and technological assets of an enterprise.
Also, another research [47] proposed an evaluation framework that made following
design science as a research approach for allowing practitioners in selecting suitable
Business-IT alignment models. This framework contained 25 criteria categorized
into four groups and it was evaluated by seven IT managers from large Swedish
organizations. There are six alignment types provided in literatures that are combined
into single model. Gerow et al. [53] highlighted and defined the six alignment types
and created a robust alignment framework by building upon Henderson &
Venkatraman’s (1993) SAM. They reported on the improvement of the definition
and created statistically evaluated operational measures for each alignment type to

7
create rigorous measures, which was collected from 140 Chief Information Officers.
The overall alignment measure will be used to give future researchers a useful tool
for studying the 6 types of alignment and their relationship with other constructs.
Finally, the literature covers a collection of different approaches to assess alignment,
including case studies, fit models, surveys, conceptual models, and quantitative
assessments such as recent papers by Gerow et al. [54] a recent meta-analysis and by
Coltman et al. [55] who provide a good summary of much of the history and research
in this field.
Recent researches such as paper [56], identified a reference framework to
categorize relevant management practices in the process of Business-IT alignment in
order to find specific management practices that can help to improve the process of
Business-IT alignment and the design of ITG architecture that supports those
processes. The analysis was done in a large leading international food and beverage
company. The most concern in today’s enterprise is the continuous alignment of
business and IT in a fast-changing environment. For this reason, Hinkelmann et al.
[57] proposed a new paradigm for next generation enterprise information system. It
changes the development approach of model-driven engineering to continuous
alignment of business and IT for the agile enterprise. Both human-interpretable
graphical enterprise architecture and machine-interpretable enterprise ontologies are
supported by metamodeling approach. the Strategic Alignment Maturity Model
(SAMM) has been used by Khanfar et al. [58] in a large hospitality and exhibitions
company in the middle-east with the same purpose of assessing the alignment
maturity between business and IT. They defined the gaps between business and IT,
and proposed some measures to bridge these gaps. Helberg [59] presented a model to
prove that cohesive business and IT alignment will lead to gain customer’s

8
satisfaction and achieve business goals. They explained the implementation strategy
and plan, described roles and responsibilities, discussed leadership engagement and
change management principles, and delivered context for measuring and sustaining
alignment. The presented framework of IT and business collaboration models for
organizational consideration illustrated function, structure, advantages and
disadvantages to several models. In addition, Yayla and Hu [60] mentioned that their
knowledge about Business - IT alignment on organizational performance relationship
was limited because of the complexity of contingent factors. Also, there were a few
studies examined the effects of contextual factors such as market environment and
competitive strategy on this relationship. Therefore, their study was to test the
alignment-performance relationship in a developing county to fill the gaps in this
relationship. Survey data collected in Turkey has been used to investigate the
moderating roles of environmental uncertainty and strategic orientation on the
performance effects of strategic alignment. Their analysis result showed a better
understanding of the relationship between alignment and performance under different
environmental and strategic conditions.
Moreover, there are some frameworks like TOGAF that enables the
achievement of business objectives through IT standards. TOGAF is an EA
(enterprise architecture) framework developed by The Open Group since 1995.
When used with any recognized enterprise framework, it will help align IT and
business goals by engaging the various stakeholders and involving them into the
process model. According to Garnter [61], Enterprise Architecture is a way to create
an abstract view of a company (enterprise) or organizations that assist in the planning
and making better decisions. EA scope is not limited to technology planning, but by
adding strategic planning as a key driver for the company and planning as a source of

9
program and enterprise resources requirements. TOGAF as defined in [62] provides
Architecture Development Method (ADM) that allows organizations to transform
their enterprises in a controlled manner in response to business goals and
opportunities. This framework ensures alignment and consistency with architecture
across the enterprise.
1.3.1 Business- IT Alignment in Higher Education
Furthermore, few research has been conducted in the area of Business-IT
alignment in higher education institutions. For instance, in paper [63] a study into
business and IT alignment maturity in Dutch vocational education and training
organizations was reported, where the demand of collaboration among education and
IT departments is important. Their study was performed into the maturity of
alignment between these parties for extracting the path of growth in maturity.
Luftman’s model was adopted as a framework to analyze the alignment maturity. In
another research [64], the authors focused on few researches that relate between the
factors for achieving the alignment and organizational performance, for example, if
there is a positive IT impact on organizational performance. For this reason, they
tried to give a share in the formation of a theoretical model influencing alignment
dimension which affects the performance of the organization. The importance of the
model is in providing empirical evidence that approves the value of categorizing
factors into dimensions in attaining Business-IT alignment and their impact on
universities’ performance. Moreover, Erfurth et al. [65] identified the main
challenges eliciting requirements in order to improve and to set up IT service that
assist academicals and administrative processes of universities. The authors
reviewed ITIL and COBIT, which provide improvement and establishment processes

10
as well as support the operational phase of IT services to identify problem statements
in detecting suitable IT services. Moreover, Robertson [66] aimed to confirm the
alignment maturity of higher education institutions in the United States compared to
the overall industry average reported in this study [16]. His finding supported by
statistical evidence that shows the higher education industry average had a lower
Business-IT Alignment average than the industry, but these findings showed that an
increase by 50.88% in Business-IT Alignment maturity. Also, Al Ghamdi and Sun
[67] provided an overview of Business-IT alignment as a big concern that face CIOs
in private and public organizations and examined the importance to address these
concerns in the higher education sector. They offered suggestions for possible future
Business- IT Alignment research in the higher education. In addition, the dissertation
done by Smith [68] to increase the understanding of the factors that have an
influence in the alignment between institutional strategic planning and information
technology strategy in higher education. She tested an existing alignment model
(SAM) in the context of mid-size four-year colleges and universities. Her study used
a combination of Delphi technique and a survey process.
1.3.2 Business-IT Alignment Models
Henderson and Venkatraman [20] presented their Strategic Alignment Model
(SAM) which is useful to treat the IS strategy alignment. It becomes a support for a
collaborative process between the business strategy, business organization, IS
infrastructure, and IT strategy. All at two different abstraction level of the alignment:
functional and strategic [52]. It is one of the most relevant and cited models aiming
at helping managers to achieve BITA [69]. In addition, Luftman’s Strategy
Alignment Maturity Model (SAMM) [70], which is a framework for measuring or

11
developing alignment provides an extent understanding for organizations to
formulate business models, business strategy, business processes and organizations
that are aligned with infrastructure, applications and IT organizations. Also, SAMM
provides a set of criteria that can be used to assess the ability of the EA framework
and support to achieve strategic business-IT alignment [71]. SAMM model uses six
criteria for a complete model and each used as a component of assessment and
identification of alignment. These criteria are: Communications, Governance, Skills,
Partnership, Competency and Value measurements and Scope and Architecture.
Another model provided by Vargaz Chevez [72], constructed the Unified
Strategic Alignment Model based on four strategic business and IT alignment models
that consist of many elements of the different existing theories. Also, the “4C model”
by Weiss and Anderson [73] that captures the most important elements to enhance
alignment between business and IT. The authors in paper [74] redefined the concept
of Business–IT alignment as a combined management/design concept by placing it in
a combined framework which is a result of generic framework information
management and the integrated architecture framework. Its purpose is to provide the
foundations for additional research of the alignment concept as a real tool for
management and design. It shows the relationship between the key areas of concern
involving not only the visualization of the areas or levels but also implied
management and design processes. In addition, Other models developed by Reich &
Benbasat [12], Sabherwal & Chan [23], and Hu & Huang [75].
Same as Henderson’s and Venkatraman’s [20] strategic alignment model (SAMM),
many alignment researches build on the principle of separation between business and
IT domains with number of variable elements, such as organizations, plans,

12
processes, competences etc. It was adopted and studied from empirical perspective
such as [76], [38] and has been extended by different researchers [5], [38], [74], [77].
SAMM model was the first important work on Business-IT alignment, which
introduced the concepts of alignment to a wide audience and structured the space of
investigation [76]. There are some points lead us to choose this model to be used in
this thesis. Some of these points are listed as follow:
- SAMM is the most famous and the most discussed model among researchers
[38], [78].
- It has attracted the most attention in this field [78] and the most widely cited
per the literature review of [79].
- Various studies have taken SAMM as reference model such as [74] and [9].
- Another used it to evaluate and analyze existing works on alignment, for
example in [80], [81] and [82].
- The SAMM can be considered as an EAF (Enterprise Architecture
framework) because it proposes the construction of a blueprint of an
enterprise in support of BITA [63].

13
Chapter 2: Methods
2.1 United Arab Emirates University IT Strategic Plan
The Division of Information Technology (DoIT) at the UAEU developed an
information technology strategic plan that provides long-term and short-term
objectives, which are aligned with the UAEU strategic plan. The DoIT strategic plan
defines five goals as follows:
1- Customer Focus and Service Oriented,
2- Enable and support Evolving Research Needs,
3- Collaboration and Efficiency through Sharing across Campus,
4- Supporting excellence in Teaching and Learning
5- Student needs, classroom technology, mobile learning, technology based
learning, and development of research computing and comprehensive
University-wide IT environment.
DoIT goals are aligned with some of the UAEU strategic goals, as shown in the
following table:

14
Table 1: DoIT Goals & UAEU Goals
DoIT Strategic Goals UAEU Strategic Goals
Goal 1: Customer Focused &
Service oriented
Goal 5: Provide up–to date IT services
Goal 2: Enable and support
evolving research needs of
UAEU
Goal 2: Build institutional capacity to meet the research
needs in UAEU
Goal 3: ensuring that the academic procedures and
outcomes in the UAEU are at an international standard
Goal 5: Provide up–to date IT services
Goal 3: collaboration &
efficiency through
Information Sharing
Goal 3: ensuring that the academic procedures and
outcomes in the UAEU are at an international standard
Goal 4: Improve the strategic communications of the
university.
Goal 4: support excellence in
Teaching & Learning
Goal 1: Develop and promote innovation in teaching and
learning
Goal 5: An adaptable
organization
Goal 5: Provide up–to date IT services
2.2 Research Design
Strategic Alignment Maturity Model (SAMM) [8] has been widely accepted
among researchers and practitioners [52]. It integrates descriptive and prescriptive
aspects of alignment. Also, it creates a roadmap that organizations can follow to gain
higher levels of IT efficiency which in turn helps them achieve better business
performance [83]. The SAMM model is based on 12 elements of Business-IT
alignment that are found in SAM model of Henderson and Venkatraman. SAM is
defined as BITA framework to enable the implementation of Business and IT and
their infrastructure components which are Business strategy, IT strategy, Business
infrastructure and IT infrastructure [20], [84]. Luftman adopted SAM as a starting
point for his model. Then He suggested a number of enablers and inhibitors [5] as a
building blocks, and constructed SAMM based on these results. Companies may use
a survey based on Luftman’s model to identify their maturity level. Once the
maturity level of the company is defined, the company may develop a roadmap for
enhancing the relationship between the business and the IT [8].

15
Luftman’s theory is found in many articles as a framework for assessing
alignment within a company [67], and looks very useful. This assessment method
provides enterprises and organizations a tool that gives insights in Business-IT
relationship. It can define improvement areas and facilitates an open discussion with
executives from business and IT. The six criteria of SAMM include several elements
that need an attention, not at one specific, but all criteria should be in harmony.
2.2.1 The Six Criteria of Strategic Alignment Maturity
Strategic Alignment Maturity model contains six alignment criteria and each
has several attributes as shown in Figure 1.
These areas are:

16
Figure 1: The Six Criteria of SAMM [8]
1- Communication: this criterion refers to the intensity and quality of the
exchangeable ideas, knowledge, and information between IT and business
organizations. It enables stakeholders to clearly understand their respective
strategies, plans, business or IT environments, risks, priorities, and how to
achieve them. Different researches such as [12], demonstrate that successful
communications between business and IT increase a common understanding
and influence positively the alignment, as understanding is instrumental in
achieving coordinated activities. In addition, IT and business executives learn
to listen, understand, and respect one another while engaging in

17
communications. This help the cooperative leveraging of resources that can
build competitive advantage [8]. This criterion facility integrates and
effectively coordinate plans between IT and the business [85]. However, the
lack of communications between the two parties mean a lack of investment in
IT and missing opportunities [8]. Finally, communications will lead to trusted
relationships between IT and business executives in the university, which is
important and needed as it grows and the integration across the enterprise and
its external partners. This allows higher risk taking, faster responses, and
better accountability.
2- Competency/Value Measurement: this refers to the possible use of metrics
to show the contributions of information technology and the IT organization
to the business in terms that both the business and IT understand and accept.
The analysis of the performance and operations are needed in all
organizations. Currently, many IT organizations can't prove their value to the
business in understandable terms. IT and business in the university need to
participate and generate shared and consistent measures of performance that
help track their performance. To do so effectively, it requires to apply
technical expertise from the IT function to provide demonstrable measures in
forms that the business can know. Likewise, the business needs to learn to
apply and expect competencies from the measurement within IT. This
balanced process shows the value of IT in terms of its contribution to track
and learn from business initiatives, and helps the management ability to prove
IT’s value contributions [8].
3- Governance: involve the processes that IT and business manager’s use at
strategic, tactical, and operational levels to establish IT priorities, allocate

18
resources, and control activities. In addition, it concerns with how well the
organization links its business strategy to current IT priorities, technical
planning, managing risk, and budgeting. It defines who set the decisions, why
they make them, and how they make them. The university needs the activities
of Governance to participate on achieving alignment by assisting to recognize
the value of IT; create informed IT investment decisions and realize business
vision and strategies and the role of IT in achieving them. The key actions for
governance according to Luftman [8] are steering committees, IT-business
liaisons, budget and human resource/sourcing allocation processes, boundary
management of the IT function, and assessments of IT services by business
executives. Those actions that create a shared direction rather than just trying
to monitor IT initiatives, should be provided by the governance and should be
more focused than the others. As noted by Huang et al. [86], “well-designed
and orchestrated IT governance mechanisms are expected to produce IT-
related decisions, actions and assets that are more tightly aligned with an
organization’s strategic and tactical intentions.”
4- Partnership: refers to the level of relationship between business and IT
organizations. This involves determining IT’s role in business strategies, the
degree of trust between the two parties, and how each sees the other’s
contribution. It is essential for the IT function to immediately participate with
the business functions, which can make reciprocal trust, make realistic
expectations, and build efficient relationships. Therefore, it is easier to
achieve cross functional alignment that sustain working relationships which
help understand and commit to shared strategies as they lead to risk and
reward sharing [14]. According to Reich and Benbasat [12] and Luftman and

19
Brier [14], both IT and business executives in the university must realize the
requirement for collaboration and the increased value of relationships.
5- Scope & Architecture: it refers to the constant process of provisioning a
flexible infrastructure, its evaluation, and the application of emerging
technologies and delivery of customized solutions for business units and
external customers or partners. This criterion focuses more on impact of IT
services, which happen through appropriate and innovative scoping of what
the IT function does to provide demonstrable business value [8]. The
alignment processes include scoping, which is the only set of technical
activities. For this reason, dynamic scoping is required in the university
because any change in its business scope will require its infrastructure need to
be re-scoped. Obviously, it is about the university reaction on using the new
technology, if IT enables or drive business processes and strategies and if the
university can be flexible towards user’s needs.
6- Skills: this criterion refers to the human resources actions like hiring,
retaining, training, performance feedback, innovation encouragement, career
opportunities, and individual skill development within IT. Also, it measures
the organization’s preparation for changing, learning capability, and
capability to leverage new ideas. it is hard to accomplish the needed levels of
communications, value analytics, and partnering without the appropriate
investing and balancing of skills and competencies across the business and IT
organization [8].
2.2.2 The Five Levels of Strategic Alignment Maturity

20
The Strategic Alignment Maturity model (SAMM) involves five levels of
maturity as shown in Figure 2 The relative importance of each of the attributes
within the criteria may differ among organizations [8]. Each of the six criteria
described in the main part of this article are evaluated in deriving the level of
strategic alignment maturity.
Figure 2: The Five Levels of SAMM [8]
Level 1 – Initial / AD Hoc process: if the university meets many of the
characteristics of this level, it will not able to attain the alignment between the
business strategy and IT strategy because of the failing to handle its IT investments.

21
Level 2 – Committed process: Level 2 of Strategic Alignment Maturity tends to be
directed at functional level within the enterprise like Marketing, Finance,
Manufacturing and HR. However, the achievement of the alignment in the university
can be difficult because of the limited awareness by the business and IT communities
of the of the different functional use of IT. Although, the business - IT alignment at
the local level is typically not leveraged by the enterprise, the potential opportunities
are beginning to be recognized [8].
Level 3- Established focused process: if the university will be in this Level, it can
be described as having established a focused Strategic Alignment Maturity. At this
level, IT becomes embedded in the business, focuses governance, processes and
communications for specific business objectives [8]. Moreover, level 3 influences IT
assets on an enterprise-wide basis and applications systems show planned, managed
direction different from traditional transaction processing to systems that use
information to make business decisions. The IT extra structure is improving with key
partners.
Level 4 – Improved/ Managed process: if the university will be at level 4, it can be
described as having a managed Strategic Alignment Maturity. At this level, the
concept of IT as a value center is supported by effective governance and services [8].
Level 4 leverage IT assets on an enterprise-wide basis and applications systems
concentrate on improving business process to gain sustainable competitive
advantage. Where IT is viewed as an innovative and imaginative strategic contributor
to success.
Level 5 – Optimized process: at level 5 in the Strategic Alignment Maturity, the
university can be described as having an optimally aligned Strategic Alignment

22
Maturity. The IT strategic planning process and the strategic business process are
integrated by sustained governance processes. At level 5, organizations leverage IT
assets on an enterprise-wide basis to expand the reach of the organization into the
supply chains of customers and suppliers [8].
2.2.3 Processes of Strategic Alignment
Luftman and Brier defined some steps that must be taken to maximize
alignment enablers and minimize the inhibitors [14] in order to attain and sustain
business-IT alignment. These steps are:
1- Set the goals and establish a team: for evaluating the maturity of the business-
IT alignment.
2- Understand the business-IT linkage: by evaluating each of the six criteria.
3- Analyze and prioritize gaps: to understand the activities necessary to improve
the business-IT linkage.
4- Specify the actions: to enhance the alignment.
5- Choose and evaluate success criteria: discussing the measurement criteria
identified to evaluate the implementation of the project plans.
6- Sustain alignment: to sustain the benefit from IT.
The next step is most important part of the process which is the creation of
recommendations addressing the problems and opportunities recognized [8]. The
outcomes of the survey are indicative of the problem/opportunities being addressed.
After assessing the criteria and define the level of the alignment for the organization,
the next higher level of maturity is applied as a roadmap for identifying what should
be done next.

23
2.3 Data Collection
The data were collected using a qualitative survey that was conducted in the
UAE university. The survey includes 39 questions divide into six sections [8] (see
Appendix 4). The answers follow a logical sequence of five possible answers, and it
ranges from an immature answer, up to a mature answer, where a numerical score to
each answer from 1 to 5 has been assigned. For example, the five levels of maturity
that form the scale are represented as follow:
- 1 = Doesn’t fit the company, or the company is very ineffective
- 2 = Low level of fit for the company
- 3 = Moderate fit for the company, or the company is moderately effective
- 4 = Fits most of the company
- 5 = Strong level of fit throughout the company, or the company is very
effective.
This helped to have a complete assessment to plot the results and then derive the
level of alignment. An online survey from Google called “Google Forms” has been
used, where the responses are collected and analyzed in an online spreadsheet. Also,
each response in a single row of a spreadsheet, with each question shown in a
column.

24
Chapter 3: Results Analysis and Discussions
According to the organizational chart of the university, a number of
departments are selected to be visited. As a first step for conducting the survey in the
university, an approval letter has been got from the administration. I have carefully
chosen the persons of interest in relation to the research question, so the targeted
employees are at executive-level positions and directors. Furthermore, they have
been asked to respond to the survey from their point of view and prior experiences,
to rate the university’s behavior and to assure good validity.
It is important to have the right employees to participate in the survey and to
be able to represent the target sample. Figure 3 shows the organizational chart, where
the number of chosen departments were 20, and it has been decided to choose five
members from each department that includes executives, unit directors, key mangers
of the sector and the employees. So, the targeted number was 100 employees.
By using the sample size calculation, it showed that 41 responds are enough
to validate the results of this study. However, a total of 42 employees responded to
the survey, out of 100 target employees.

25
Figure 3: Organizational Chart of UAEU

26
Each criterion of the Strategic Alignment Maturity Model is assessed
individually to determine the university level of strategic maturity. Figure 4 depicts
the maturity criterion and the alignment level for the UAE university.
When viewing the results in Figure 4, it becomes apparent that the total average
business-IT alignment level for the university is between level 3 and 4. As observed,
' Scope & Architecture', 'Value Measurement', 'Governance' and 'Partnership'
maturity criteria approximately show the same average level which is 3.4. However,
the lowest alignment levels can be seen in maturity criteria 'Communications', while
'Skills' scored the highest of the six (average maturity 3.7). Moreover, an analysis of
attributes for each criterion with lowest maturity was conducted to find the gaps
analysis of the least mature elements.
3.1 Communication
In this criterion, we measure the level of understanding between people of IT
and business as well as with external parties such as business partners. The analysis
shows that communication is in level 3, which means the university’s business-IT
communications is at the Established Focused Process level.
1
2
3
4
5
C VM G P SA S Total average
Ali
gnm
net
Lev
el
Criteria
UAEU Alignment level
Figure 4: UAEU Alignment level

27
Table 2: Communication Criterion From (As-is) to (To-be)
Abbreviations Attribute Level 3 (As-is)
Characteristics
Level 4 (To-be)
Characteristics
C1 Understanding of
Business by IT
Good understanding
by managers
understanding
encouraged among staff
C2 Understanding of
IT by business
Good understanding
by managers
understanding
encouraged among staff
C3 Inter/Intra
Organizational
Learning
Regular Unified / bonded
C4 Communication
style
Formal/Two way Two way, somewhat
informal
C5 Knowledge
sharing
Structured around
key processes
Formal sharing at all
level
C6 Liaison(s)
Breadth/Effective
ness
Facilitate knowledge
transfer/ Formalized
Facilitate relationship
building /internal levels
As shown in Table 2, the follow-up assessment of the university’s strategic
alignment maturity need to move from level 3 (As -is) to a Level 4 (To-be) for this
criterion.

28
Figure 5: Alignment Level of Communication Attributes
Each of the Communication’s attributes (C1, C2, …etc) - (see Table 2 ), were
collected and analyzed to define their level. So, the lowest score for the alignment
levels in communication attributes as shown in Figure 5 were:
1- The learning process within/between departments
2- The Communication style used within the organization
Major insights: The University demonstrated some strong communications process,
however, it needs to have regular informal communication with supervisors and
department heads. In order to inform both business and IT employees on the
objectives, status, and achievements of major IT projects and initiatives. So, an open
communication is important in the process of achieving and maintaining alignment.
The IT and business need to work together to identify opportunities to enhance
effective and efficient communications among them. IT staff need an opportunity to
work closely with senior business managers.
2.7 2.8 2.9 3 3.1 3.2 3.3 3.4 3.5 3.6
C1
C2
C3
C4
C5
C6
Alignment level
Att
rib
ute
sAlignment Level of Communication Attributes
29
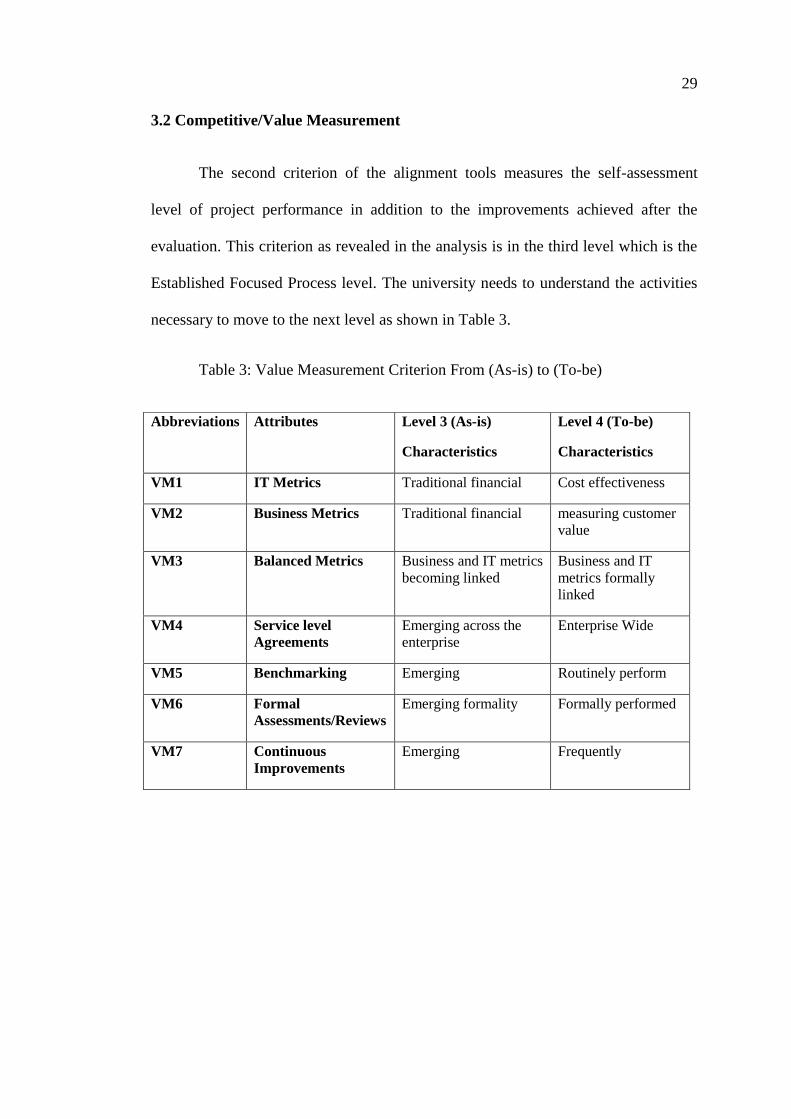
3.2 Competitive/Value Measurement
The second criterion of the alignment tools measures the self-assessment
level of project performance in addition to the improvements achieved after the
evaluation. This criterion as revealed in the analysis is in the third level which is the
Established Focused Process level. The university needs to understand the activities
necessary to move to the next level as shown in Table 3.
Table 3: Value Measurement Criterion From (As-is) to (To-be)
Abbreviations Attributes Level 3 (As-is)
Characteristics
Level 4 (To-be)
Characteristics
VM1 IT Metrics Traditional financial Cost effectiveness
VM2 Business Metrics Traditional financial measuring customer
value
VM3 Balanced Metrics Business and IT metrics
becoming linked
Business and IT
metrics formally
linked
VM4 Service level
Agreements
Emerging across the
enterprise
Enterprise Wide
VM5 Benchmarking Emerging Routinely perform
VM6 Formal
Assessments/Reviews
Emerging formality Formally performed
VM7 Continuous
Improvements
Emerging Frequently

30
Figure 6: Alignment Level of Value Measurement Attributes
The analysis in Figure 6 shows the lowest score, for this section which are:
1- The way of measuring the value of projects (metrics) by IT.
2- The degree of Service level agreements
Major insights: The university’s service level agreements between the IT function
and business need to be global and regional services. Primarily, the university’s
metrics aimed to encourage more efficient and competitive IT-enabled processes.
Level 3 and level 4 SLAs are both technically and relationship oriented are at the
functional level. But SLAs in level 3 are emerging at the enterprise level. while,
Level 4 SLAs mature beyond Level 3 at the enterprise level. Perhaps the university’s
rating is low because they see SLAs as only setting the baselines for IT delivery, not
for contributing to business success. SLAs set expectations for IT support create
proper SLAs, and effective management processes around them, the business needs
to understand IT processes. Also, measuring IT’s contribution to the business should
go beyond traditional.
2.9 3 3.1 3.2 3.3 3.4 3.5 3.6 3.7
VM1
VM2
VM3
VM4
VM5
VM6
VM7
Alignment level
Att
rib
ute
s
Alignment Level of Value Measurement Attributes

31
3.3 Governance
This criterion concentrates on the people who are responsible for decision
making, the reasons they make them, and how they make them. Governance
received an overall maturity score of 3.4, as did Partnership, Value measurement,
Scope and Architecture. These four components of alignment maturity tied for the
second maturity score. Which means all are in Established Focused Process level.
Table 4: Governance Criterion From (As-is) to (To-be)
Abbreviations Attributes Level 3 (As-is)
Characteristics
Level 4 (To-be)
Characteristics
G1 Business strategic
planning
Some IT input and
cross functional
planning
Managed across the
enterprise
G2 IT strategic
planning
Some business input
and cross functional
planning
Managed across the
enterprise
G3 Reporting/
Organization
structure
Central/Decentral;
Some federation; CIO
reports to COO
Federated; CIO reports
to COO or CEO
G4 Budgetary control Cost Center; Some
projects treated as
investments
IT treated as
investment Center
G5 IT investment
management
Traditional; Process
enabler
Cost effectiveness;
Process driver
G6 Steering
committee(s)
Regular clear
communication
Formal, effective
committees
G7 Integration of IT
project
prioritization
Determined by the
business function
Mutually determined
between senior and
mid-level IT and
business management
For effective IT governance, companies need effective communications,
partnerships, and value metrics between IT and the business [8]. The university

32
should focus on some actions in this section to move to next higher level as shown in
Table 4.
Figure 7: Alignment Level of Governance Attributes
These specific actions are defined with lowest score at the analysis results (see
Figure 7) for example:
1- Steering committee(s)
2- Integration of IT project prioritization
Major insights: IT steering committee(s) with senior level IT and business
management participation should be formal, regular committee meetings. Also, the
IT project should mutually determine between senior and mid-level IT and business
management.
3.4 Partnership
This criterion focuses in the level of mutual trust and partnerships between
the two parties (business and the IT departments) of the university.
3 3.1 3.2 3.3 3.4 3.5 3.6 3.7 3.8 3.9 4 4.1
G1
G2
G3
G4
G5
G6
G7
Alignment level
Att
rib
ute
s
Alignment Level of Governance Attributes

33
Table 5: Partnership Criterion From (As-is) to (To-be)
Abbreviations Attributes Level 3 (As-is)
Characteristics
Level 4 (To-be)
Characteristics
P1 Business perception of
IT value
IT enables future
business activities
IT is part of the
business strategy
P2 role of IT in the
strategic business
planning
Business process
driver
Business strategy
enabler/driver
P3 Shared risks, goals and
rewards
Sharing of risks and
rewards is emerging
Risks and rewards are
always shared
P4 IT program
management
Standards Adhered Standards evolve
P6 Relationship/ Trust
Style
IT is emerging as a
valued service
provider
The association is
primarily a long-term
partnership style of
relationship
P7 Business
sponsor/champion
At the functional
organization
At the HQ level
Table 5 shows the actions that should be done by the university to increase their
maturity level from level 3 to level 4. Some specific actions with low score of
maturity level shown in Figure 8:
Figure 8: Alignment Level of Partnership Attributes
3 3.1 3.2 3.3 3.4 3.5 3.6 3.7
P1
P2
P3
P4
P5
P6
Alignment level
Att
rib
ute
s
Alignment Level of Partnership Attributes

34
1- Business perception of IT value
2- Pervasiveness of trust and value
Major insights: A long term partnership and mutual trust between business and IT
departments within the university need to be developed and letting IT to be part of
business strategy.
3.5 Scope and Architecture
This criterion of alignment tools measures the level at which IT has evolved
from being considered as a support instrument to providing a business with a
competitive advantage. It indicates how well IT provides a flexible infrastructure,
introduces emerging technologies, fosters business process change, and delivers
value to the business, customers, and partners.
Table 6: Scope and Architecture Criterion From (As-is) to (To-be)
Abbreviations Attributes Level 3 (As-is)
Characteristics
Level 4 (To-be)
Characteristics
SA1 Traditional,
enabler/driver,
external
Business process
enablers (IT supports
business process
change).
Business process
drivers (IT is a catalyst
for business process
change).
SA2 IT standards
articulation
Emerging enterprise
standards
Enterprise standards
SA3 Degree of
architectural
integration.
Integrated across
functional units.
Integrated across
functional units and
business
partners/alliances
SA4 Degree of
architectural
transparency, agility,
flexibility
Transparent at the
functional level
Transparent across the
entire organization

35
Table 6 shows where the university stand now and where it needs to be after
concentrating in some activities of this criterion of maturity level. The lowest score
of Scope and Architecture attributes as shown in Figure 9 is:
1- Traditional, enabler/driver, external
Figure 9: Alignment Level of Scope & Architecture Attributes
Major insights: The university demonstrated by its use of emerging technologies,
but IT sector in the university needs to support a flexible infrastructure that is
transparent to all business partners and customers and drive business processes and
strategies as a true standard.
3.6 Skills
The last criterion of the Luftman model assesses the skills of staff and how
are capable of quick learning, innovating and understanding of business drivers and
technology concepts. Skills received the highest overall score of 3.7 among the six
criteria. As indicated in the survey’s responses, all staff chose the fourth choice of all
questions in this section (between 40% and 55% of the employees), which shows us
3.1 3.15 3.2 3.25 3.3 3.35 3.4 3.45 3.5 3.55
SA1
SA2
SA3
SA4
Alignment level
Att
rib
ute
s
Alignment Level of Scope & Architecture Attributes

36
that this section is almost in level 4. Therefore, the university should focus and find
the gaps that will help it move to level five as shown in Table 7.
Table 7: Skills Criterion From (As-is) to (To-be)
Abbreviations Attributes Level 4 (As-is)
Characteristics
Level 5 (To-be)
Characteristics
S1 Innovation,
Entrepreneurship
Strongly encouraged
at the functional unit
level.
Strongly encouraged
at the functional unit
and corporate levels.
S2 Locus of Power Across the
organization
All executive,
including CIO &
partners
S3 Management Style Profits/ value based Relationship based
S4 Change Readiness High, focused / Easy High, focused / Very
easy
S5 Career crossover Across the functional
organization
Across the enterprise
S6 Education, cross-
training
At the functional
organization
Across the enterprise
S7 Social, Political,
Trusting environment
Trust and confidence
among IT and
business is achieved.
Trust and confidence
is extended to external
customers and
partners
Figure 10 shows the lowest score of the attributes regarding this criterion is:
1- Locus of power
Major insight: The important IT decisions in the university should be made by All
executives, including CIO and partners / Extended to all staff including IT.

37
Figure 10: Alignment Level of Skills Attributes
3.7 Alignment Level per Administrations and Departments
Administration: Figure 11 illustrates the alignment level per administrations in the
United Arab Emirates University where each administration includes different
departments.
3.2 3.3 3.4 3.5 3.6 3.7 3.8 3.9
S1
S2
S3
S4
S5
S6
S7
Alignment level
Att
rib
ute
s
Alignment Level of 'Skills' Attributes
1
2
3
4
5
A1 A2 A3 A4 A5 A6 A7 A8 A9
lev
el o
f A
lignm
net
Adminstration
Alignment level
Figure 11: Alignment level per Administration

38
Table 8: Abbreviations of the Administration in UAEU
Administration Abbreviations
Vice Chancellor A1
Strategy & Future Dept. A2
Information Technology Sector A3
Media & communication Dept. A4
International Relations Dept. A7
Deputy VC for academic affairs A6
Deputy VC for Research & graduate studies A7
Deputy VC for finance & admin affairs A7
Deputy VC for Students affairs & enrollment A9
Table 8 shows the abbreviations of the Administrations. Apparently, the level of the
alignment of all administrations is between 3 and 4. Interestingly, three
administrations scored the highest of the nine (almost 4) which are A6, A4, A3
(Deputy VC for academic affairs, Media & communication Department, IT)
respectively. While A7 (Deputy VC for Research & graduate studies) scored the
lowest 3.2.
39
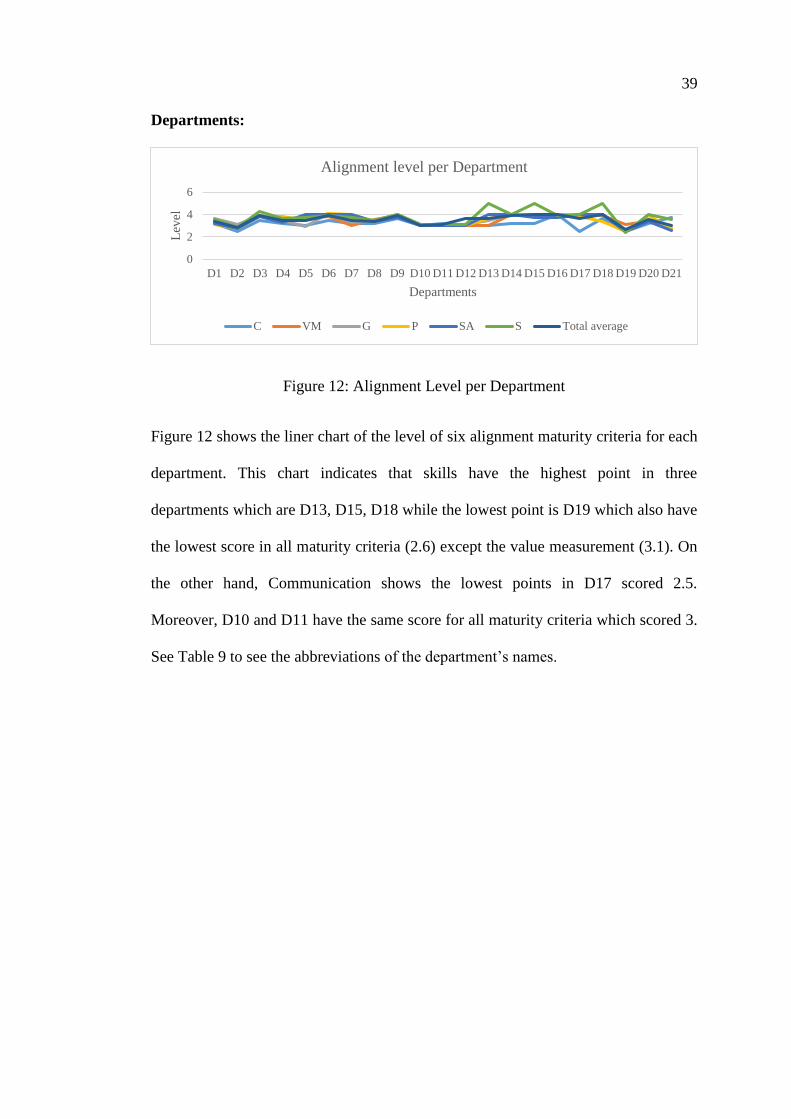
Departments:
Figure 12: Alignment Level per Department
Figure 12 shows the liner chart of the level of six alignment maturity criteria for each
department. This chart indicates that skills have the highest point in three
departments which are D13, D15, D18 while the lowest point is D19 which also have
the lowest score in all maturity criteria (2.6) except the value measurement (3.1). On
the other hand, Communication shows the lowest points in D17 scored 2.5.
Moreover, D10 and D11 have the same score for all maturity criteria which scored 3.
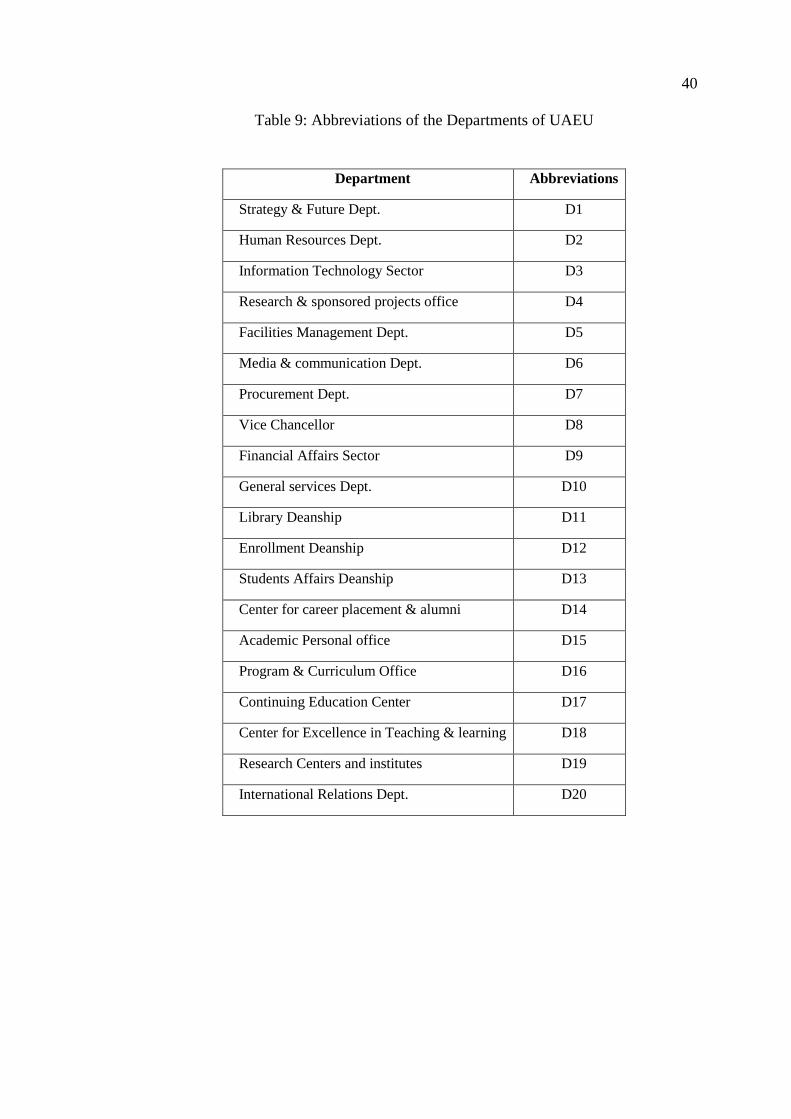
See Table 9 to see the abbreviations of the department’s names.
0
2
4
6
D1 D2 D3 D4 D5 D6 D7 D8 D9 D10 D11 D12 D13 D14 D15 D16 D17 D18 D19 D20 D21
Lev
el
Departments
Alignment level per Department
C VM G P SA S Total average
40
Table 9: Abbreviations of the Departments of UAEU
Department Abbreviations
Strategy & Future Dept. D1
Human Resources Dept. D2
Information Technology Sector D3
Research & sponsored projects office D4
Facilities Management Dept. D5
Media & communication Dept. D6
Procurement Dept. D7
Vice Chancellor D8
Financial Affairs Sector D9
General services Dept. D10
Library Deanship D11
Enrollment Deanship D12
Students Affairs Deanship D13
Center for career placement & alumni D14
Academic Personal office D15
Program & Curriculum Office D16
Continuing Education Center D17
Center for Excellence in Teaching & learning D18
Research Centers and institutes D19
International Relations Dept. D20

41
Chapter 4: Limitations and Lessons Learned
This research found that strategic alignment at UAEU is an established
process, which is good communication between business and IT, some cost
effectiveness defined, relevant processes exist in the organization and IT is seen as
an asset driver. However, as discussed in previous chapter there are still some
improvements in communication, governance and partnership and other criteria with
low alignment maturity score need to be improved. This can be achieved by follow
the steps provided by Luftman which are: First, an evaluation team need to assess
each of the criteria individually, this team includes IT and business executives from
the university. Then, all attributes for each criterion are rated on a 1-5 point Likert
scale. Based on this rating, each criterion and its attributes will be categorized at
level 1, level 2, level 3, level 4 or level 5. After that, the team use their individual
ratings to have the overall assessment level of maturity for the university. Finally, the
evaluation team find specific opportunities and apply the next higher level of
maturity as a perspective roadmap to improve the alignment of the university.
UAEU at level 4 will be able to attain whereby bonding between business and
IT is improved, dashboards are managed periodically, governance is managed across
the organization and IT enables the Business Strategy smoothly. The last stage is to
work towards the last level of the alignment which is Optimized Level, where the
communication becomes informal and pervasive, value measurement is extended to
partners, governance is integrated across the organization, partnership is co-adaptive
between departments and architecture evolves with the partners.
Moreover, for a validation of the contribution to our study it was necessary to
determine whether the six SAM factors significantly different across the all

42
departments and administrations. The result showed that there are a few differences
between the scores of each department. These findings are important to UAEU, it
provides them with information that may help them improve misalignment which
may cause problems in IT/business strategic planning, budgeting, investment
decisions, prioritization, and support. For this reason, having ideas on potential
weaknesses and strengths will help UAEU to target specific areas to improve.
This thesis has several limitations, which should be mentioned, that can
provide opportunity for future research. The primary limitation is that I was planning
to define the as-is enterprise architecture of the UAEU using TOGAF enterprise
architecture with new business model of the university and then developing a
Business-IT alignment framework for continuous alignment. For this reason and
because of the short time required to finish this thesis I defined the as-is architecture
and suggested to-be level for the university using the Maturity model provided by
Luftman. Additionally, allocating time to take this survey was also a big concern
because meeting participants and making the interviews could have increased the
sample size and engender more enthusiasm to take the survey.
Despite all these limitations, this study provided a positive social change in
the UAEU because it provided data that never existed before that may could be used
for future studies. Moreover, I recommend that future researchers should attempt to
assess a bigger sample sizes. Another recommendation is that the decision makers
within UAEU should use this study as a guide in addressing the need for better
business strategy measures and make improvements.
43
Chapter 5: Conclusion
Luftman’s Strategic Alignment Maturity model provides practitioners and
academics with a practical tool to assess and develop an organization’s capability to
align IT to business requirements and opportunities. This thesis has applied a SAMM
model to define the alignment between the business and IT in a higher education
institutions, United Arab Emirates University as a case study. The results displayed
that the alignment start to be established between business and IT (level 3) in the
university. Also, these results identified that a higher alignment maturity correlates
with higher organization performance. That means, a higher educational organization
performance and total spending are positively affected with a higher level of maturity
and alignment between Business-IT. For example, communications which is one of
the enablers of the Alignment between business and IT, have positive impact on the
university’s performance, because exchanging of ideas, understanding on how to
facilitate a successful strategizing process and knowledge sharing is a key success
factor in this manner. Moreover, value analytics have a positive impact on the
Alignment, because of the mutually dashboards between the strategies that
demonstrates IT value in terms of contribution to the business as well as service
levels assessed by IT translated in terms of the business, result with a good
performance of the university. The Governance activities are part of the success
factors that impact the university’s performance if a clear defined authority for
resources, risks, conflict resolutions and responsibility for IT is shared among the
parties. The main advantage for the university, when there is a good partnership
between Business and IT, where IT enables and drives changes to business processes
and strategies and management executives has a clearly defined and shared vision. In

44
addition, with a high technology scope maturity, the university will have a flexible
and transparent infrastructure. The last maturity factor is about the skills that are
included in the university. With high skilled employees who are capable of quick
learning, feel personal responsibility for innovativeness, the university will have a
high performance. However, a deeper analysis also shows that there are many areas
of concern with low alignment maturity representing gaps that can be readily
improved through management interventions.

45
References
[1] M. K. McGee, “Old and New Worries Keep CIOs Awake at Night,” Insur.
Technol., vol. 31, no. 11, pp. 51–52, 2006.
[2] M. Porter, “What Is Strategy,” Harv. Bus. Rev., pp. 61–78, 1994.
[3] C. U. Ciborra, “Deconstructing the concept of strategic alignment,” Scand. J.
Inf. Syst., vol. 9, no. 1993, pp. 67–82, 1997.
[4] M. J. Safferstone, “Leveraging the New Infrastructure: How Market Leaders
Capitalize on Information Technology.,” Acad. Manag. Perspect., vol. 12, no.
4, pp. 137–138, 1998.
[5] J. Luftman, R. Papp, and T. Brier, “Enablers and inhibitors of business-IT
alignment,” Commun. AIS, vol. 1, no. 3es, pp. 1–33, 2000.
[6] J. Henderson and N. Venkatraman, “Strategic alignment: a framework for
strategic information technology management,” CISR WP No. 190, p. 60,
1989.
[7] T. Smaczny, “Is an alignment between business and information technology
the appropriate paradigm to manage IT in today’s organisations?,” Manag.
Decis., vol. 39, no. 10, pp. 797–802, 2001.
[8] J. Luftman, “Assessing Business-It Alignment Maturity,” Commun. AIS, vol.
4, no. December, pp. 1–48, 2000.
[9] Y. E. Chan and B. H. Reich, “IT alignment: What have we learned?,” J. Inf.
Technol., vol. 22, no. 4, pp. 297–315, 2007.
[10] S. H. Chung, J. Rainer R. K., and B. R. Lewis, “The impact of information
technology infrastructure flexibility on strategic alignment and application
implementations,” Commun. Assoc. Inf. Syst., vol. 11, no. 336, pp. 191–206,
2003.
[11] B. H. Reich and I. Benbasat, “Measuring the Linkage between Business and
Information Technology Objectives,” MIS Q., vol. 20, no. 1, pp. 55–81,
1996.
[12] B. H. Reich and I. Benbasat, “Factors That Influence the Social Dimension of
Alignment Between Business and Information Technology Objectives,” MIS
Q., vol. 24, no. 1, pp. 81–113, 2000.
[13] F. B. Tan and R. B. Gallupe, “Aligning business and information systems
thinking: a cognitive approach,” IEEE Trans. Eng. Manag., vol. 53, no. 2, pp.
223–237, 2006.

46
[14] J. Luftman and T. Brier, “Achieving and sustaining business-IT alignment,”
Calif. Manage. Rev., vol. 42, no. 1, pp. 109–122, 1999.
[15] Albrecht, B., Bender, B., Katz, R.N., Pirani, J.A., Salaway, G., Sitko, T.D.
and Voloudakis, J., “Information Technology Alignment in Higher
Education,” Educ. Cent. Appl. Res. (, vol. 3, p. 154, 2004.
[16] J. Luftman and R. Kempaiah, “An update on business-IT alignment: ‘A line’
has been drawn,” MIS Q. Exec., vol. 6, no. 3, pp. 165–177, 2007.
[17] Steven W. Gilbert, “If it takes 40 or 50 years, can we still call it a
revolution?” Educ. Rec., vol. 75, no. 3, pp. p19-28, 1994.
[18] W. Geoghegan, “Stuck at the barricades: Can information technology really
enter the mainstream of teaching and learning,” AAHE Bull., vol. 47, no. 1,
pp. 13–16, 1994.
[19] L. Kappelman, E. McLean, V. Johnson, and R. Torres, “The 2015 SIM IT
Issues and Trends Study,” MIS Q. Exec., vol. 15, no. 1, pp. 55–83, 2016.
[20] J. C. Henderson and N. Venkatraman, “Strategic Alignment Leveraging
Information Technology for Transforming Organizations,” IBM Systems
Journal, vol. 32, no. 1. pp. 4–16, 1993.
[21] J. Luftman, T. Ben-Zvi, R. Dwivedi, and E. H. Rigoni, “IT Governance: An
Alignment Maturity Perspective,” Int. J. It/bus. Alignment Gov., vol. 1, pp.
13–25, 2010.
[22] G. . Kearns and A. . Lederer, “The effect of strategic alignment on the use of
IS-based resources for competitive advantage,” J. Strateg. Inf. Syst., vol. 9,
no. 4, pp. 265–293, 2000.
[23] R. Sabherwal and Y. E. Chan, “Alignment between business and IS
strategies: A study of prospectors, analyzers, and defenders. Information
systems research, 12(1), 11-33.,” Inf. Syst. Res., vol. 12, no. 1, pp. 11–33,
2001.
[24] M. King, P. Cragg, and H. Hussin, “IT Alignment and Organisational
Performance in Small Firms,” in Proceedings of the Eighth European
Conference on Information Systems, 2000, pp. 1–7.
[25] L. Raymond, G. Paré, and F. Bergeron, “Matching information technology
and organizational structure: an empirical study with implications for
performance,” Eur. J. Inf. Syst., vol. 4, pp. 3–15, 1995.
[26] S. Rivard, L. Raymond, and D. Verreault, “Resource-based view and
competitive strategy: An integrated model of the contribution of information

47
technology to firm performance,” J. Strateg. Inf. Syst., vol. 15, no. 1, pp. 29–
50, 2006.
[27] G. S. Kearns, “An electronic commerce strategic typology: Insights from case
studies,” Inf. Manag., vol. 42, no. 7, pp. 1023–1036, 2005.
[28] A. S. Kunnathur and Z. Shi, “An investigation of the strategic information
systems planning success in Chinese publicly traded firms,” International
Journal of Information Management, vol. 21, no. 6. pp. 423–439, 2001.
[29] W. Oh and A. Pinsonneault, “On the Assessment of the Strategic Value of
Information Technologies: Conceptual and Analytical Approaches,” MIS Q.,
vol. 31, no. 2, pp. 239–265, 2007.
[30] G. Premkumar and W. R. King, “An Empirical Assessment of Information
Systems Planning and the Role of Information Systems in Organizations,” J.
Manag. Inf. Syst., vol. 9, no. 2, pp. 99–125, 1992.
[31] H. L. Chang, K. Wang, and I. Chiu, “Business-IT fit in e-procurement
systems: Evidence from high-technology firms in China,” Inf. Syst. J., vol.
18, no. 4, pp. 381–404, 2008.
[32] N. B. Duncan, “Capturing Flexibility of Information Technology
Infrastructure: A Study of Resource Characteristics and Their Measure,” J.
Manag. Inf. Syst., vol. 12, no. 2, pp. 37–57, 1995.
[33] A. M. Johnson and A. L. Lederer, “CEO/CIO mutual understanding, strategic
alignment, and the contribution of IS to the organization,” Inf. Manag., vol.
47, no. 3, pp. 138–149, 2010.
[34] M. Broadbent, P. Weill, and B. S. Neo, “Strategic context and patterns of IT
infrastructure capability,” J. Strateg. Inf. Syst., vol. 8, no. 2, pp. 157–187,
1999.
[35] K. Celuch, G. B. Murphy, and S. K. Callaway, “More bang for your buck:
Small firms and the importance of aligned information technology
capabilities and strategic flexibility,” J. High Technol. Manag. Res., vol. 17,
no. 2, pp. 187–197, 2007.
[36] B. Cumps et al., “Inferring comprehensible business/ICT alignment rules,”
Inf. Manag., vol. 46, no. 2, pp. 116–124, 2009.
[37] A. L. M. Albert L. Lederer, “Coordination of Information Systems Plans with
Business Plans,” J. Manag. Inf. Syst., vol. 6, no. 2, pp. 5–19, 1989.

48
[38] D. B. Avison, D., Jones, B., Powell, P., and Wilson, “Using and Validating
the Strategic Alignment Model,” J. Strateg. Inf. Syst., vol. 13, no. 3, pp. 223–
246, 2004.
[39] R. Papp, “Business-IT Alignment: Productivity Paradox Payoff?,” Ind.
Manag. Data Syst., vol. 99, no. 8, pp. 367–373, 1999.
[40] P. Tallon, “The Alignment Paradox,” CIO Insight, vol. 1, no. 32, p. 75, 2003.
[41] H. Benbya and B. McKelvey, “Using coevolutionary and complexity theories
to improve IS alignment: A multi-level approach,” J. Inf. Technol., vol. 21,
no. 4, pp. 284–298, 2006.
[42] D. Q. Chen, M. Mocker, D. S. Preston, and A. Teubner, “Information
Systems Strategy: Reconceptualization, Measurement, and Implications,”
MIS Q., vol. 34, no. 2, pp. 233–259, 2010.
[43] P. P. Tallon, “Does IT pay to focus? An analysis of IT business value under
single and multi-focused business strategies,” J. Strateg. Inf. Syst., vol. 16,
no. 3, pp. 278–300, 2007.
[44] T. C. Powell, “Organizational alignment as competitive advantage,” Strateg.
Manag. J., vol. 13, no. 2, pp. 119–134, 1992.
[45] P. P. Tallon and K. L. Kraemer, “Investigating the Relationship between
Strategic Alignment and IT Business Value: The Discovery of a Paradox,”
Creat. Bus. Value with Inf. Technol. Challanges Solut., pp. 1–22, 2003.
[46] G. S. Kearns and A. L. Lederer, “A resource-based view of strategic IT
alignment: How knowledge sharing creates competitive advantage,” Decis.
Sci., vol. 34, no. 1, pp. 1–29, 2003.
[47] M. El-Mekawy, L. Rusu, and E. Perjons, “An evaluation framework for
comparing business-IT alignment models: A tool for supporting collaborative
learning in organizations,” Comput. Human Behav., vol. 51, pp. 1229–1247,
2015.
[48] Y. E. Chan and B. H. Reich, “IT alignment: An annotated bibliography,” J.
Inf. Technol., vol. 22, no. 4, pp. 316–396, 2007.
[49] P. Strassmann, The Squandered Computer, Evaluating the Business
Alignment of Information Technologies. Strassmann, Inc, 1997.
[50] A. Ullah and R. Lai, “A Systematic Review of Business and Information
Technology Alignment,” ACM Trans. Manag. Inf. Syst., vol. 4, no. 1, p. 4:1–
4:30, 2013.

49
[51] Y. E. Chan, R. Sabherwal, and J. B. Thatcher, “Antecedents and outcomes of
strategic IS alignment: an empirical investigation,” IEEE Trans. Eng. Manag.,
vol. 53, no. 1, pp. 27–47, 2006.
[52] L. Aversano, C. Grasso, and M. Tortorella, “A Literature Review of
Business/IT Alignment Strategies,” in Enterprise Information Systems, 2013,
pp. 471–488.
[53] J. E. Gerow, J. B. Thatcher, and V. Grover, “Six types of IT-business
strategic alignment: an investigation of the constructs and their
measurement,” Eur. J. Inf. Syst., vol. 24, no. 5, pp. 465–491, 2015.
[54] P. L. R. Jennifer E. Gerow, Varun Grover, Jason Thatcher, “Looking Toward
the Future of IT-Business Strategic Alignment through the Past: A Meta-
Analysis,” Manag. Inf. Syst. Q., vol. 38, no. 4, pp. 1059–1085, 2014.
[55] T. Coltman, P. Tallon, R. Sharma, and M. Queiroz, “Strategic IT alignment:
Twenty-five years on,” Journal of Information Technology, vol. 30, no. 2. pp.
91–100, 2015.
[56] J. Orozco, A. Tarhini, R. Masa’deh, and T. Tarhini, “A framework of
IS/business alignment management practices to improve the design of IT
Governance architectures,” Int. J. Bus. Manag., vol. 10, no. 4, pp. 1–12, 2015.
[57] K. Hinkelmann, A. Gerber, D. Karagiannis, B. Thoenssen, A. Van Der
Merwe, and R. Woitsch, “A new paradigm for the continuous alignment of
business and IT: Combining enterprise architecture modelling and enterprise
ontology,” Comput. Ind., vol. 79, pp. 77–86, 2016.
[58] I. A. Z. Mohamed Khanfar, “Assessing the IT-business alignment maturity in
a hospitality and exhibition company,” Second Int. Conf. Eng. Syst. Manag.
Appl., 2010.
[59] H. Stephanie, “Business and Technology Alignment Framework,” THE
COLLEGE OF ST. SCHOLASTICA, 2012.
[60] A. A. Yayla and Q. Hu, “The impact of IT-business strategic alignment on
firm performance in a developing country setting: exploring moderating roles
of environmental uncertainty and strategic orientation,” Eur. J. Inf. Syst., vol.
21, no. 4, pp. 373–387, 2012.
[61] Enterprise Architecture - EA - Gartner IT Glossary. (2012). Gartner IT
Glossary. Retrieved 6 October 2016, from http://www.gartner.com/it-
glossary/enterprise-architecture-ea/

50
[62] TOGAF®, an Open Group standard | The Open Group. (2016).
Opengroup.org. Retrieved 6 October 2016, from
http://www.opengroup.org/subjectareas/enterprise/togaf
[63] A. J. G. Silvius and B. De Waal, “Assessing business and IT alignment in
educational organizations,” in 2010 International Conference on
Computational Intelligence and Software Engineering, CiSE 2010, 2010.
[64] E. A. A. Seman and J. Salim, “A Model for Business-IT Alignment in
Malaysian Public Universities,” Procedia Technol., vol. 11, no. Iceei, pp.
1135–1141, 2013.
[65] C. Erfurth and I. Erfurth, “Towards business alignment of IT services in
universities: Challenges in elicitations of requirements for IT services,” in
2014 IEEE 1st International Workshop on the Interrelations Between
Requirements Engineering and Business Process Management, REBPM 2014
- Proceedings, 2014, pp. 11–14.
[66] T. R. Robertson, “The relationship between information technology maturity
and business alignment in higher education: A quantitative investigation,”
ProQuest Diss. Publ., no. June, p. 120, 2015.
[67] H. Al Ghamdi and L. Sun, “Business and IT Alignment in Higher Education
Sector,” Sch. Syst. Eng., 2013.
[68] B. Lach Smith, "Application of Strategic Institutional – Information
Technology Alignment Model in Four-Year Institutions of Higher
Education", Ph.D., Indiana State University, Collage of Technology, 2010.
[69] V. Goepp and M. Petit, “a Systematic Evaluation of the Sam According to
Enterprise Architecture Framework Requirements,” MOSIM 2014, Nov.
2014.
[70] J. N. (Stevens I. of T. Luftman, Managing the Information Technology
Resource: Leadership in the Information Age. Prentice Hall, 2004.
[71] Dharga R, “Effectiveness of EA Frameworks in Achieving BITA: An
Analysis Based on SAMM,” vol. 10, no. 2, pp. 21–28, 2012.
[72] N. Vargas Chevez, A Unified Strategic Business and IT Alignment Model.
2010.
[73] J. W. Weiss and D. Anderson, “Aligning technology and business strategy:
issues & frameworks, a field study of 15 companies,” 37th Annu. Hawaii Int.
Conf. Syst. Sci. 2004. Proc., vol. 8, no. C, p. 10 pp., 2004.

51
[74] R. R. Maes, D. Rijsenbrij, O. Truijens, and H. Goedvolk, “Redefining
business – IT alignment through a unified framework,” Primav. Work. Pap.,
vol. 19, pp. 1–25, 2000.
[75] C. D. H. Qing Hu, “Using the Balanced Scorecard to Achieve Sustained IT-
Business Alignment: A Case Study,” Commun. Assoc. Inf. Syst., vol. 17, pp.
181–204, 2006.
[76] J. Burn and C Szeto, “A comparison of the views of business and IT
management on success factors for strategic alignment,” Inf. Manag., vol. 37,
no. 4, pp. 197–216, 2000.
[77] R. Maes, “A Generic Framework for Information Management,” Primav.
Work. Pap. Ser., vol. 99, no. 3, p. 22, 1999.
[78] X. Wang, X. Zhou, L. Jiang, W. X. . B, Z. X.b, and J. L.a, “A method of
business and IT alignment based on enterprise architecture,” Proc. 2008 IEEE
Int. Conf. Serv. Oper. Logist. Informatics, vol. 1, pp. 740–745, 2008.
[79] N. Vargas, L. Plazaola, and J. Flores, “Constructing a General Framework
Definition of the Business and IT Alignment Concern through selected
papers,” Proc. Conf. …, p. 10, 2007.
[80] O. Avila, V. Goepp, and F. Kiefer, “Understanding and Classifying
Information System Alignment Approaches,” J. Comput. Inf. Syst., vol. 50,
no. 1, pp. 2–14, 2009.
[81] M. El Mekawy, L. Rusu, and N. Ahmed, “Business and IT alignment: An
evaluation of strategic alignment models,” in Communications in Computer
and Information Science, 2009, vol. 49, pp. 447–455.
[82] E. Silva, L. Plazaola, and M. Ekstedt, “Strategic business and IT alignment:
A prioritized theory diagram,” in Portland International Conference on
Management of Engineering and Technology, 2006, vol. 1, pp. 1–8.
[83] Luftman, J. Managing the IT Resource: Leadership in Information Age,
Lulu.com, 2009.
[84] J. N. Luftman, P. R. Lewis, and S. H. Oldach, “Transforming the enterprise:
The alignment of business and information technology strategies,” IBM Syst.
J., vol. 32, no. 1, pp. 198–221, 1993.
[85] Rockart, J., Earl, M., and Ross, J.“Eight Imperatives for the New IT
Organization”. Sloan Management Review, (38)1, 43-55,1996.

52
[86] Huang, R., Zmud, R.W. and Price, R.L. (2010). Influencing the Effectiveness
of It Governance Practices through Steering Committees and Communication
Policies. European Journal of Information Systems, 2010 (19), 288-302.

53
Appendices
Appendix 1: SAMM’S Criteria and Attributes
Dimension Definition Items
Communications measures the level and
effectiveness of the exchange of ideas,
knowledge, and information between IT and
business organizations which enables both to
understand the respective strategies, plans,
business and IT environments, risks,
priorities.
C1 -Understanding of Business by IT
C2 -Understanding of IT by Business
C3 –Inter-organizational Learning/Education
C4 -Protocol Rigidity
C5 -Knowledge Sharing
C6 -Liaison Effectiveness
Value Analytics taps into the level of using
metrics to demonstrate the contributions of
information technology and the IT
organization to the business in ways that both
the business and IT understand and accept.
VM1 -IT metrics
VM2 -Business Metrics
VM3 -Integrated IT and Business metrics
VM4 -Service Level Agreements
VM5 –External Benchmarking
VM6 -Formal Assessments/Reviews
VM7 -Continuous Improvement
VM8 -IT function contribution
Governance defines formal processes around
IT decisions and the level of discipline which
IT and business manager’s use at strategic,
tactical, and operational levels in setting IT
priorities and allocating IT resources.
G1 -Business Strategic Planning
G2 -IT Strategic Planning
G3 -IT Organizational Structure
G4 -IT Reporting
G5 -IT Budgeting
G6 -IT Investment Decisions
G7 -Steering committee
G8 -IT Prioritization Process
G9 -IT Reaction Capacity
Partnering gauges, the scope and level of
activities to maintain working relationships
between business and IT organizations, the
degree of trust and how each perceives the
other’s contribution.
P1 -Business Perception of IT Value
P2 -Role of IT in Strategic Business Planning
P3 -Shared Goals, Risk, Rewards/Penalties
P4 -T Program Management
P5 -Relationship/ Trust Style
P6 -Business Sponsor/Champion
Scope measures the level of IT’s
provisioning activities that promote creation
of a flexible IT infrastructure, evaluation and
application of emerging technologies,
activities that drive business process change,
and activities that deliver innovative
customized solutions to business units.
SA1-Traditional, Enabler/Driver, External
SA2 -Standards Articulation
SA3 -Architectural Integration
SA4 -IT infrastructure flexibility
skills capture critical human resource
activities, such as hiring, retention, training,
performance feedback, innovation
encouragement, career opportunities, and
individual skill development. It also covers
activities that promote to IT organization’s
readiness for change, learning, and ability to
leverage new ideas.
S1 -Innovative Entrepreneurial Environment
S2 -Cultural Locus of Power
S3 -Change Readiness
S4 -Career Crossover
S5 –Training/Talent improvement to Learn
S6 -Interpersonal Interaction
S7 -Hiring and Retaining

54
Appendix 2: Alignment Level per Departments
Departments C VM G P SA S Total average
D1 3 3 4 3 3 4 3
D2 3 3 3 3 3 3 3
D3 3 4 4 4 4 4 4
D4 3 3 3 4 3 4 3
D5 3 4 3 4 4 4 3
D6 4 4 4 4 4 4 4
D7 3 3 3 4 4 4 3
D8 3 4 3 3 3 3 3
D9 4 4 4 4 4 4 4
D10 3 3 3 3 3 3 3
D11 3 3 3 3 3 3 3
D12 3 3 3 3 3 3 4
D13 3 3 3 4 4 5 4
D14 3 4 4 4 4 4 4
D15 3 4 4 4 4 5 4
D16 4 4 4 4 4 4 4
D17 3 4 4 4 4 4 4
D18 4 4 4 3 4 5 4
D19 3 3 3 3 3 2 3
D20 3 3 4 4 3 4 4
D21 4 3 3 3 3 4 3

55
Appendix 3: Alignment Level per Administrations
Administration Departments Average
A1 D8 3
A2 D1 3
A3 D3 4
A4 D6 4
A5 D20 4
A6 D15, D16, D17,D18 4
A7 D11, D4,D19 3
A8 D2,D9,D7,D10,D5 3
A9 D12,D13,D14 4

56
Appendix 4: A Survey on “BITA in Higher Education Institutions”
Business-IT alignment refers to applying Information Technology (IT) in an
appropriate and timely manner, in harmony with business strategy. Business-IT
alignment is becoming the key concern of business and IT executives in private and
public organizations. In my capacity as a master student at the College of
Information Technology (CIT), United Arab Emirates University (UAEU), I am
conducting a master's thesis research to assess the maturity level of business-IT
alignment in the UAEU. The purpose of this survey is to collect enough information
that will be analyzed to determine the maturity level.
As an employee of the UAEU, you have been selected to participate in this survey.
The survey is divided into six sections, namely, communications, competency,
governance, partnership, scope and skills. The total survey is expected to take 15
minutes. Your participation would add a significant value to this research.
Any information you provide will remain confidential and anonymous. Your
participation in this survey is voluntarily. You can withdraw at any time from this
study.
o I have read the above information and I volunteer to participate in this study
Nayla Salem Alkhatri
Master of IT Management Candidate
College of Information Technology
United Arab Emirates University
Email: [email protected]
A. Communication:
Ability to use a common and clear language between Business and IT organizations
and ensure ongoing knowledge sharing across the organization.
1. Understanding of Business by IT: Does IT management and staff understand the
business?
Mark only one oval.
o IT management lack understanding
o Limited understanding by IT management
o Good understanding by IT management
o Understanding encouraged among IT staff
o Understanding required of all IT staff

57
2. Understanding of IT by Business: Does business management and staff understand
IT?
Mark only one oval.
o Business management lack understanding
o Limited understanding by management
o Good understanding by managers
o understanding encouraged among staff
o Understanding required of all staff
3. Inter/ Intra Organizational Learning: How does the learning process
within/between departments is conducted?
Mark only one oval.
o Casual conversation and meetings
o Newsletters, reports, group email
o Training departmental meetings
o Formal methods sponsored by senior management
o learning monitored for effectiveness
4. Protocol Rigidity: What is the communication style used within the organization?
Mark only one oval.
o Business to IT only / formal
o One way, somewhat informal
o Two way, formal
o Two way, somewhat informal
o Two way, Informal and flexible
5. Knowledge Sharing: How do you think knowledge sharing is facilitated?
Mark only one oval.
o Adhoc,
o unstructured
o Semi structured
o Structured around key processes
o Formal sharing at all level
o Formal sharing with partners
6. Liaison(s) Breadth/ Effectiveness: How is the communication facilitated between
the business and IT?
Mark only one oval.
o None or used only as needed

58
o Primary IT Business link
o Facilitate knowledge transfer
o Facilitate relationship building
o Building relationship with partners
B. Competency/value Measurements:
Demonstrating the value IT is contributing to the business.
1. IT metrics: Focus of the metrics and processes to measure IT's contribution to
Business.
Mark only one oval.
o Technical only; Not related to business
o Technical cost; metrics rarely reviewed
o Review; Traditional financial
o Cost effectiveness
o Extended to external partners
2. Business metrics: Focus of the metrics and processes to measure Business
contribution.
Mark only one oval.
o IT investment measured rarely
o At the functional organization
o Review / Traditional financial
o Also measure customer value
o Balanced scorecard, include partners
3. Balanced metrics: Degree of an orientation of integrated IT and Business measures
Mark only one oval.
o Value of IT investment rarely measured
o Business and IT metrics unlinked
o Business and IT metrics becoming linked
o Business and IT metrics formally linked
o Balanced; Business, partners and IT metrics linked
4. Degree of Service level agreements: The level in which provision of services of IT
are described and agreed upon.
Mark only one oval.
o Do not use SLAs or do so sporadically.
o SLAs are primarily technically oriented (for technology performance)
between the IT and functional organizations.
o SLAs are both technically oriented and relationship oriented that are between
the IT and functional organizations and also emerging across the enterprise.
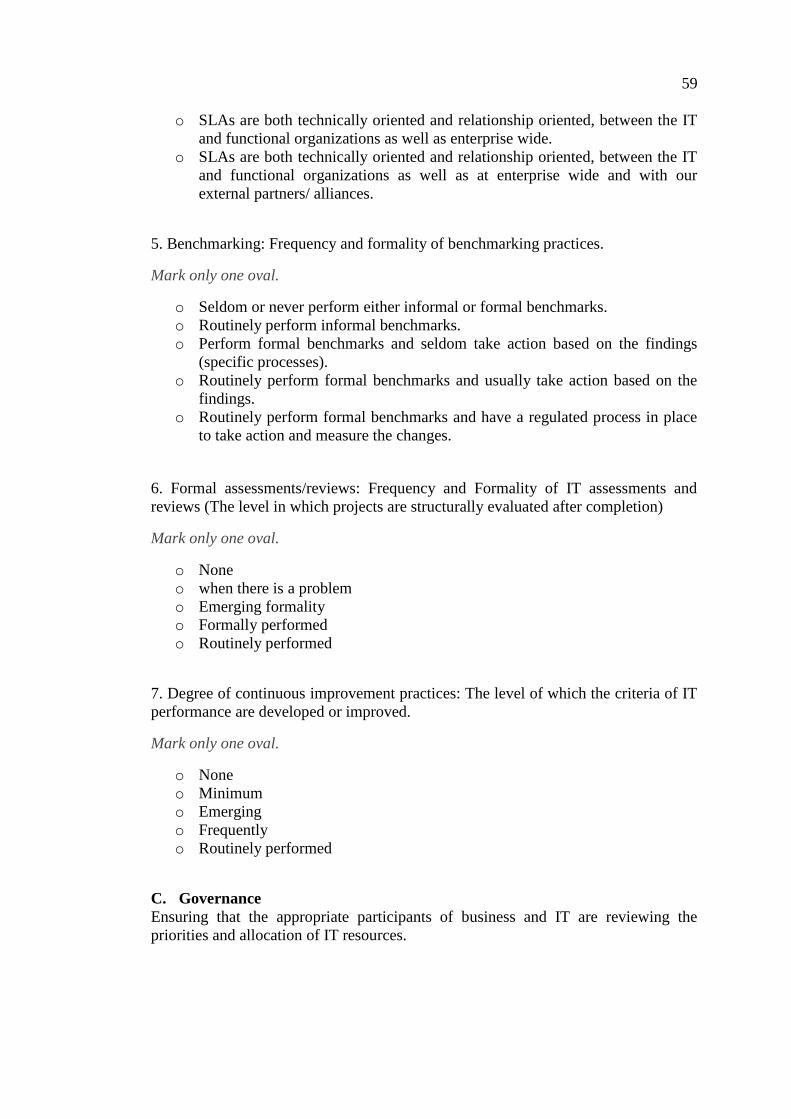
59
o SLAs are both technically oriented and relationship oriented, between the IT
and functional organizations as well as enterprise wide.
o SLAs are both technically oriented and relationship oriented, between the IT
and functional organizations as well as at enterprise wide and with our
external partners/ alliances.
5. Benchmarking: Frequency and formality of benchmarking practices.
Mark only one oval.
o Seldom or never perform either informal or formal benchmarks.
o Routinely perform informal benchmarks.
o Perform formal benchmarks and seldom take action based on the findings
(specific processes).
o Routinely perform formal benchmarks and usually take action based on the
findings.
o Routinely perform formal benchmarks and have a regulated process in place
to take action and measure the changes.
6. Formal assessments/reviews: Frequency and Formality of IT assessments and
reviews (The level in which projects are structurally evaluated after completion)
Mark only one oval.
o None
o when there is a problem
o Emerging formality
o Formally performed
o Routinely performed
7. Degree of continuous improvement practices: The level of which the criteria of IT
performance are developed or improved.
Mark only one oval.
o None
o Minimum
o Emerging
o Frequently
o Routinely performed
C. Governance
Ensuring that the appropriate participants of business and IT are reviewing the
priorities and allocation of IT resources.

60
1. Degree of business strategic planning with IT investment: The level where
strategic or long-term plans for the organization are developed as a whole
Mark only one oval.
o Not done, or done as needed
o Basic planning at the functional level, slight IT input
o Some IT input and cross functional planning
o Managed across the enterprise
o Integrated across and outside the enterprise (with IT and partners)
2. Degree of IT strategic planning with business involvement: The level where
strategic or long-term plans for IT are developed within the organization
Mark only one oval.
o Not done, or done as needed
o Basic planning at the functional level, slight business input
o Some business input and cross functional planning
o Managed across the enterprise
o Integrated across and outside the enterprise
3. Reporting/ Organization structure: The level of reporting of the IT manager or
CIO to the Director or CEO
Mark only one oval.
o Central/Decentral; CIO reports to CFO
o Central/Decentral; Some colocation; CIO reports to CFO
o Central/Decentral; Some federation; CIO reports to COO
o Federated; CIO reports to COO or CEO
o Federated; CIO reports to CEO
4. Budgetary control: The level in which IT is being viewed as a business investment
and not as necessary costs
Mark only one oval.
o Cost Center; Erratic spending
o Cost Center by functional organization
o Cost Center; Some projects treated as investments
o IT treated as investment Center
o Investment Center; Profit Center
5. IT investment management: The level in which IT is being viewed as an asset that
can improve the organization’s competitive advantage
Mark only one oval.
61
o Cost based; Erratic spending
o Cost based; Increase productivity and efficiency as the focus.
o Traditional; Process enabler
o Cost effectiveness; Process driver (IT is seen as a process driver or business
strategy enabler).
o Business value; Extended to business partners
6. Steering committee(s): pertain to IT steering committee(s) with senior level IT and
business management participation:
Mark only one oval.
o Do not have formal/regular steering committee(s).
o We have committee(s) which meet informally on an as needed basis.
o We have formal committees, which meet regularly and have emerging
effectiveness.
o We have formal, regular committee meetings with demonstrated
effectiveness.
o We have formal, regular committee meetings with demonstrated effectiveness
that include strategic business partners sharing decision making
responsibilities.
7. Integration of IT project prioritization: The level in priorities of IT projects are set
in consideration between both business and IT
Mark only one oval.
o In reaction to a business or IT need.
o Determined by the IT function.
o Determined by the business function.
o Mutually determined between senior and midlevel IT and business
management.
o Mutually determined between senior and midlevel IT and business
management and with consideration of the priorities of any business
partners/alliances.
D. Partnership
The relationship between the business and IT organization and how each perceives
the other’s contribution based on mutual trust and sharing risks and rewards.
1. Business perception of IT value: How the business perceives the value IT brings to
the organization.
Mark only one oval.
o IT perceived as a cost of business.
o IT is becoming an asset.

62
o IT enables future business activities.
o IT is part of the business strategy.
o A partner with the business that co-adapts/ improvises in bringing value to
the firm.
2.What role does the IT have in the strategic business planning?
Mark only one oval.
o No seat at the business table; IT does not have a role.
o Business process enabler
o Business process driver
o Business strategy enabler/driver
o IT Business adopt quickly to change.
3. Please rate how the risks, goals and rewards between IT and the business are
shared.
Mark only one oval.
o IT takes all the risks and does not receive any of the rewards.
o IT takes most of the risks with little reward.
o Sharing of risks and rewards is emerging.
o Risks and rewards are always shared.
o Risks and rewards are always shared have formal compensation and reward
systems in place that induce managers to take risks.
4. IT program management: Formally managing the IT/business relationship. To
what extent are there formal processes in place that focus on enhancing the
partnership relationships that exist between IT and business
Mark only one oval.
o We don’t manage our relationships.
o We manage our relationships on an ad-hoc basis.
o We have defined programs to manage our relationships, but IT or the
business does not always comply with them. Conflict is seen as creative
rather than disruptive.
o We have defined programs to manage our relationships and both IT and the
business comply with them.
o We have defined programs to manage our relationships, both IT and the
business comply with them, and we are continuously improving them.
5. Perception of trust and value: The level in which there is mutual trust between
business and IT departments within the organization
Mark only one oval.
o There is a sense of conflict and mistrust between IT and the business.
63
o The association is primarily transactional style of relationship.
o IT is emerging as a valued service provider.
o The association is primarily a long-term partnership style of relationship.
o The association is a long-term partnership and valued service provider.
6. Reporting level business sponsor/champion: The level in which the relations with
business partners are taken into account in IT planning
Mark only one oval.
o None
o Often have a senior level IT sponsor/champion only.
o Often have a senior level IT and business sponsor/champion at the functional
unit level.
o Often have a senior level IT and business sponsor/champion at the corporate
level.
o Often have a senior level IT and the CEO as the business/sponsor champion.
E. Scope and Architecture
Signifying the level of flexibility and transparency the IT is providing to business.
1. Traditional, enabler/driver, external: The level in which company wide IT
standards are implemented
Mark only one oval.
o Traditional office support (e.g., email, accounting, word processing, legacy
systems).
o Transaction oriented (e.g., back office support, ESS, DSS)
o Business process enablers (IT supports business process change).
o Business process drivers (IT is a catalyst for business process change).
o Business strategy enablers/drivers (IT is a catalyst for changes in the business
strategy).
2. IT standards articulation and compliance: The level in which the IT work
processes are standardized. IT standards are:
Mark only one oval.
o None existent or not enforced.
o Defined and enforced at the functional unit level but not across different
functional units.
o Defined and enforced at the functional unit level with emerging coordination
across functional units.
o Defined and enforced across functional units.
o Defined and enforced across functional; Interenterprise standards
3. Degree of architectural integration. The components of our IT infrastructure are:

64
Mark only one oval.
o Not well integrated.
o Integrated at the functional unit with emerging integration across functional
units.
o Integrated across functional units.
o Integrated across functional units and our strategic business
partners/alliances.
o Evolving with our business partners.
4. Degree of architectural transparency, agility, flexibility: the level of disruption
caused by business and IT changes (e.g., implementation of a new technology,
business process, merger/acquisition). Most of the time, a business or IT change is:
Mark only one oval.
o Not readily transparent (very disruptive).
o Transparent at the functional level only.
o Transparent at the functional level and emerging across all remote, branch,
and mobile locations.
o Transparent across the entire organization.
o Transparent across the organization and to our business partners/alliances;
across the infrastructure.
F. Skills
The level of innovation, change readiness, hiring and retaining, and how they are
contributing to the overall organizational effectiveness.
1. Degree of an innovation culture: When you come up with innovative ideas that
you
believe may enhance the business
Mark only one oval.
o Discouraged.
o Moderately encouraged at the functional unit level.
o Strongly encouraged at the functional unit level.
o Strongly encouraged at the functional unit and corporate levels.
o Strongly encouraged at the functional unit, corporate level, and with business
partners/alliances.
2. Locus of power: The important IT decisions are made by
Mark only one oval.
o In the hands of business executives at head office.
o Functional organization / Extended to the managers of subsidiaries / sites.
o Emerging across the organization / Extended to lower management.
o Across the organization / Dependent on the personality of staff.

65
o All executives, including CIO and partners / Extended to all staff including
IT.
3. Management style: My manager cares most about
Mark only one oval.
o Executing his/her instructions
o Consensus among our team
o Result
o Profit or value creation
o Maintaining our relationships internally and externally
4. Please rate the organization’s capability of change: How easy is it to do your daily
tasks in a new way if you get the proper training?
Mark only one oval.
o Resistant to change / Very difficult
o Dependent on functional organization / Difficult
o Recognized need for change / Neutral
o High, focused / Easy
o High, focused / Very easy
5. Career crossover opportunities among IT and business personnel: In our company,
staff has the flexibility to change their career path and get the needed training
Mark only one oval.
o None
o Minimum; To a certain level
o Dependent on functional organization; It varies among sites / subsidiaries
o Across the functional organization; within the same site / subsidiary
o Across the enterprise; across sites / subsidiaries
6. How education and cross training is facilitated in the organization:
Mark only one oval.
o None
o Minimum; Opportunities are dependent on the functional unit.
o Formal programs are practiced by all functional units.
o Formal programs are practiced by all functional units and across the
enterprise.
o Opportunities are formally available across the enterprise and with business
partners/alliances.
66
7. Social, political, trusting environment: The level in which the work environment is
safe and reliable (The interpersonal interaction that exists across IT and business
units).
Mark only one oval.
o There is minimum interaction between IT and business units.
o The association is primarily transactional style of relationship.
o Trust and confidence among IT and business is emerging.
o Trust and confidence among IT and business is achieved.
o Trust and confidence is extended to external customers and partners.