
Business Intelligence:Business Intelligence: A Design ... · Business Intelligence:Business...
93
Business Intelligence: Business Intelligence: A Design Science A Design Science Perspective Salvatore T. March Salvatore T. March David K Wilson Professor of Management Owen Graduate School of Management Vanderbilt University Vanderbilt University http://SalMarch.com
Transcript of Business Intelligence:Business Intelligence: A Design ... · Business Intelligence:Business...

Business Intelligence:Business Intelligence:A Design ScienceA Design Science
Perspectivep
Salvatore T. MarchSalvatore T. MarchDavid K Wilson Professor of ManagementOwen Graduate School of Management
Vanderbilt UniversityVanderbilt Universityhttp://SalMarch.com

Herb Simon"The natural sciences are concerned
Herb SimonThe natural sciences are concerned
with how things are."
"Design ... is concerned with how thingsDesign ... is concerned with how things ought to be, with devising artifacts to attain goals."attain goals.
The Sciences of the Artificial
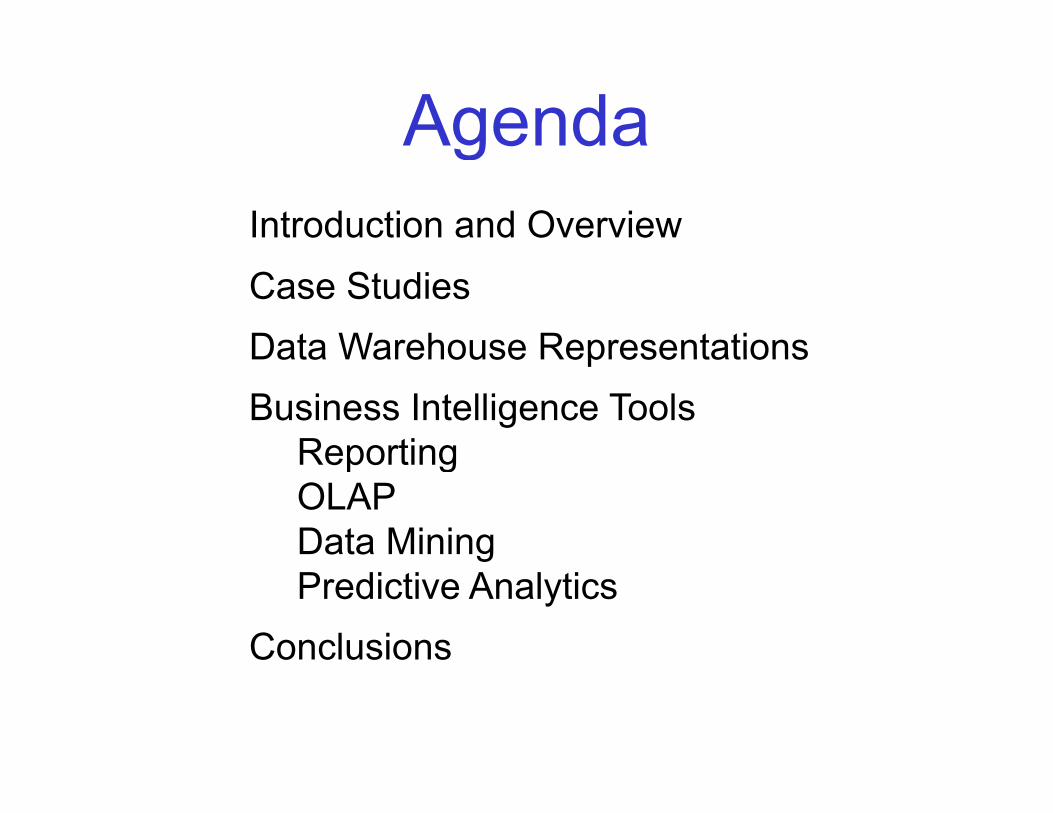
AgendagIntroduction and OverviewCase StudiesData Warehouse RepresentationsData Warehouse RepresentationsBusiness Intelligence Tools
ReportingReportingOLAPData MininggPredictive Analytics
Conclusions
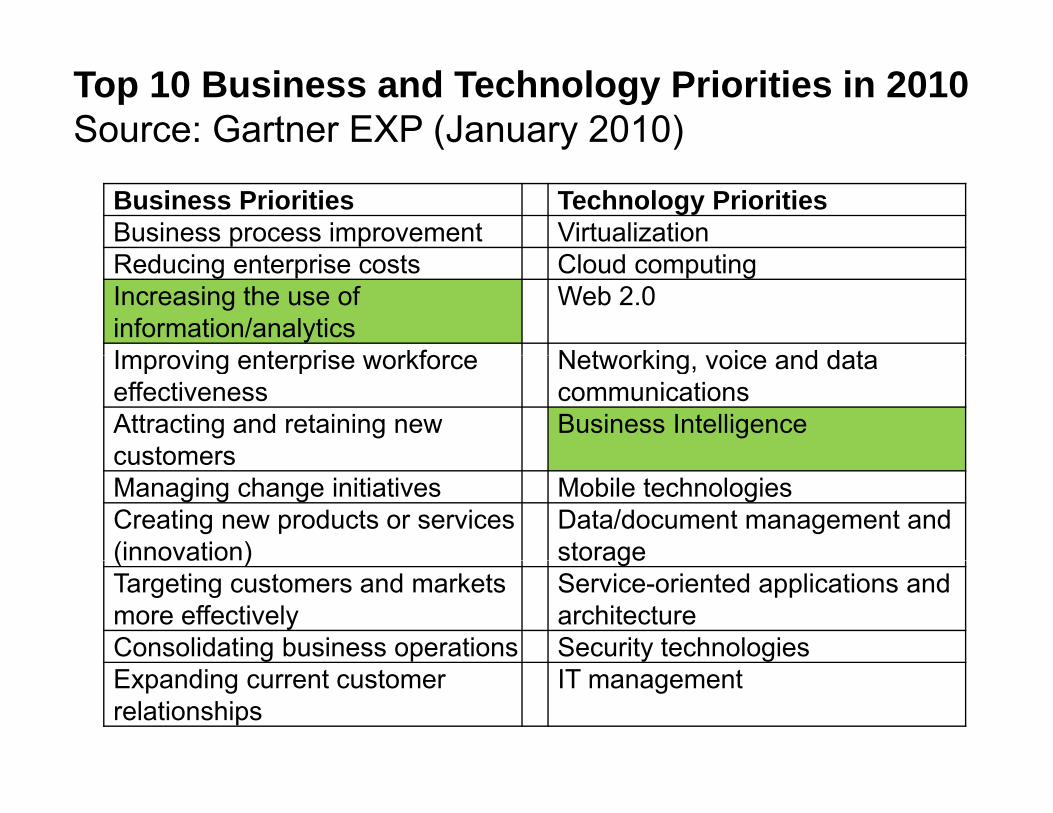
Top 10 Business and Technology Priorities in 2010Source: Gartner EXP (January 2010)
Business Priorities Technology PrioritiesBusiness process improvement VirtualizationReducing enterprise costs Cloud computingIncreasing the use of information/analytics
Web 2.0
Improving enterprise workforce Networking voice and dataImproving enterprise workforce effectiveness
Networking, voice and data communications
Attracting and retaining new customers
Business IntelligencecustomersManaging change initiatives Mobile technologiesCreating new products or services (innovation)
Data/document management and storage( o at o ) sto age
Targeting customers and markets more effectively
Service-oriented applications and architecture
Consolidating business operations Security technologiesExpanding current customer relationships
IT management
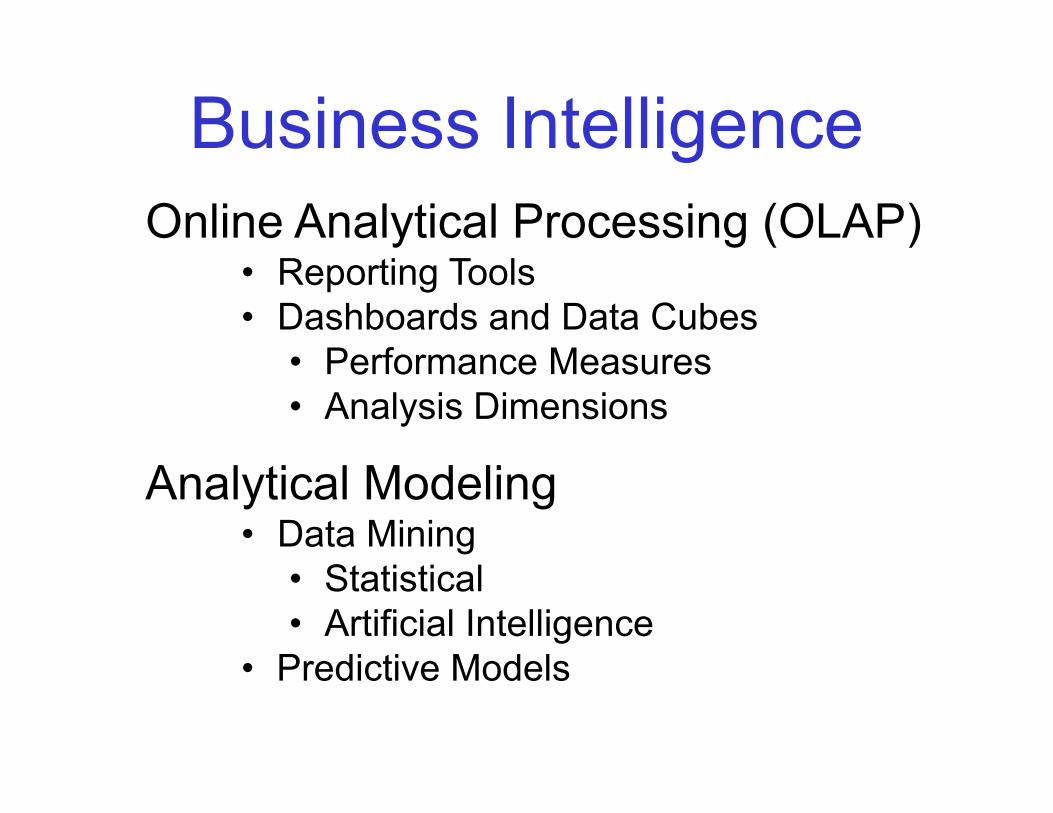
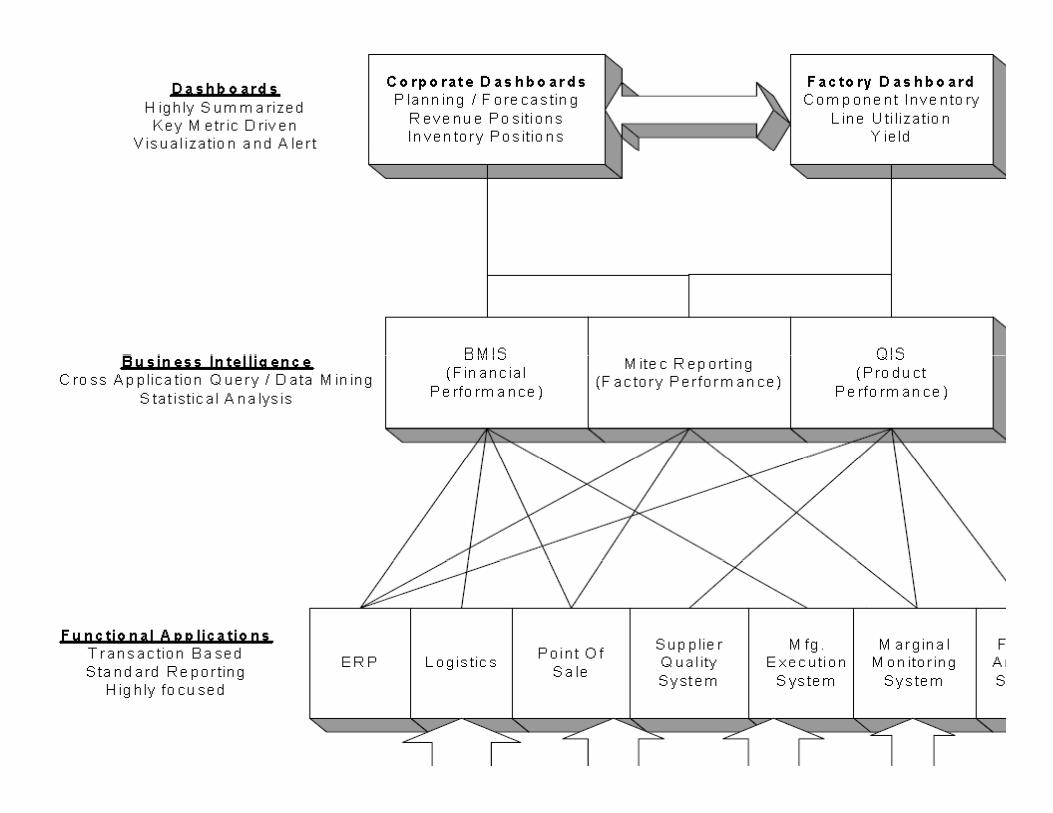
Business Intelligence gOnline Analytical Processing (OLAP)
• Reporting Tools• Dashboards and Data Cubes
Performance Measures• Performance Measures• Analysis Dimensions
Analytical Modeling• Data Mining
• Statistical• Artificial Intelligence
• Predictive Models• Predictive Models
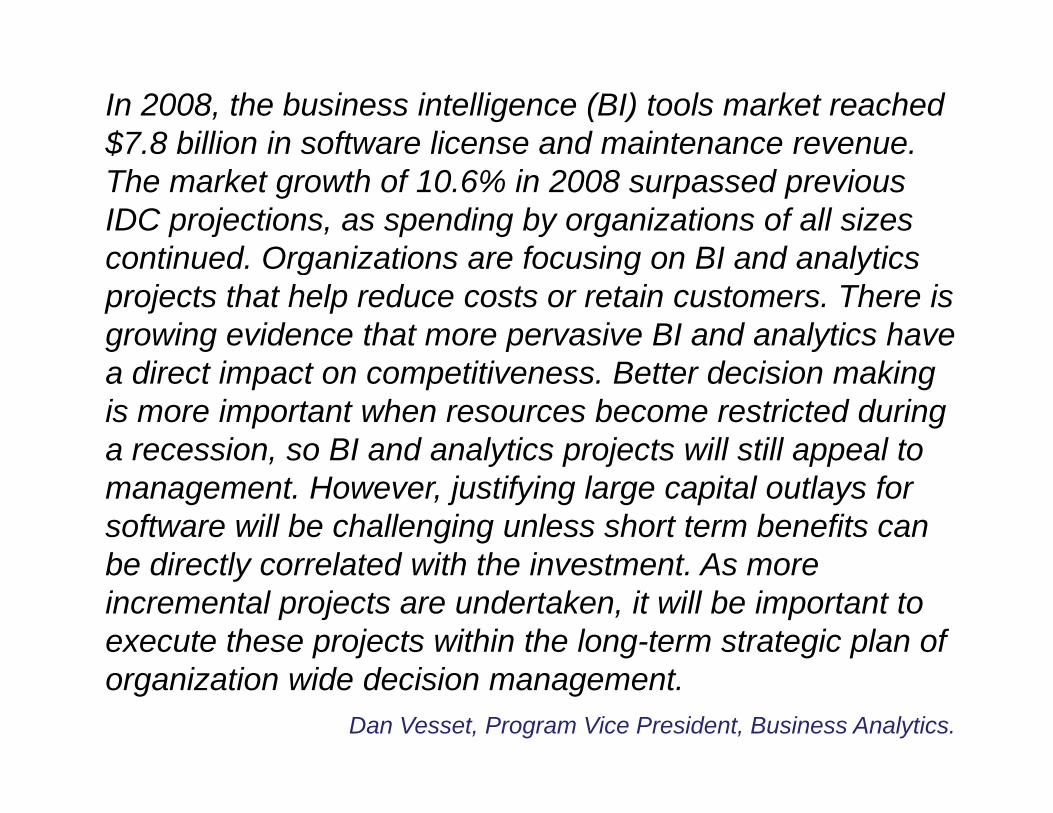
In 2008, the business intelligence (BI) tools market reached $7 8 billion in software license and maintenance revenue$7.8 billion in software license and maintenance revenue. The market growth of 10.6% in 2008 surpassed previous IDC projections, as spending by organizations of all sizes continued Organizations are focusing on BI and analyticscontinued. Organizations are focusing on BI and analytics projects that help reduce costs or retain customers. There is growing evidence that more pervasive BI and analytics have a direct impact on competitiveness. Better decision making is more important when resources become restricted during a recession, so BI and analytics projects will still appeal toa recession, so BI and analytics projects will still appeal to management. However, justifying large capital outlays for software will be challenging unless short term benefits can be directly correlated with the investment As morebe directly correlated with the investment. As more incremental projects are undertaken, it will be important to execute these projects within the long-term strategic plan of organization wide decision management.
Dan Vesset, Program Vice President, Business Analytics.
Do you want run one of the world’s ylargest data warehouses?At Amazon.com data and analysis guide every business y g ydecision and deliver enormous business value. Amazon’s Business Intelligence team is responsible for a business analytics platform that provides reporting analysis andanalytics platform that provides reporting, analysis, and data mining, and to over thousands of internal and external customers worldwide. To help deliver these core business metrics and decisions, we run one of the world’s largest data warehouses. The BI team is recruiting for a Manager of Database Administration to help deliver the next pgeneration of Amazon.com's data warehousing solution.
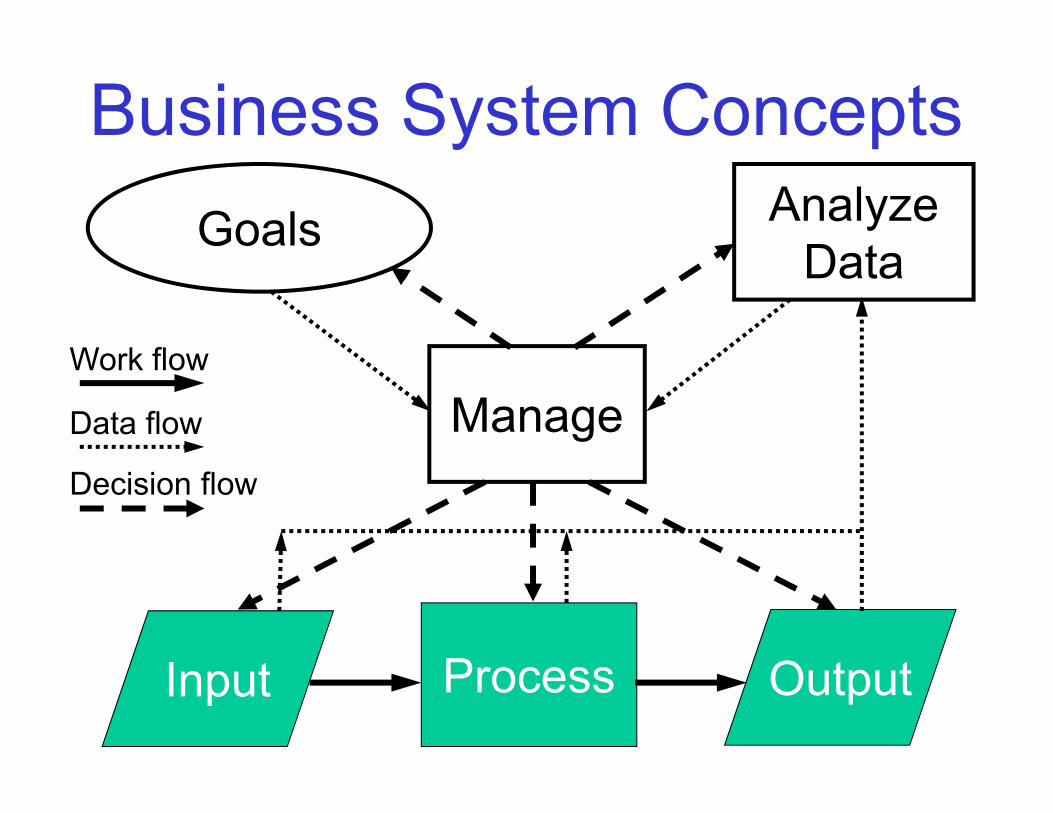
Business System ConceptsGoals Analyze
DataData
Work flow
ManageWork flow
Data flow
Decision flow
I t P O t tInput Process Output
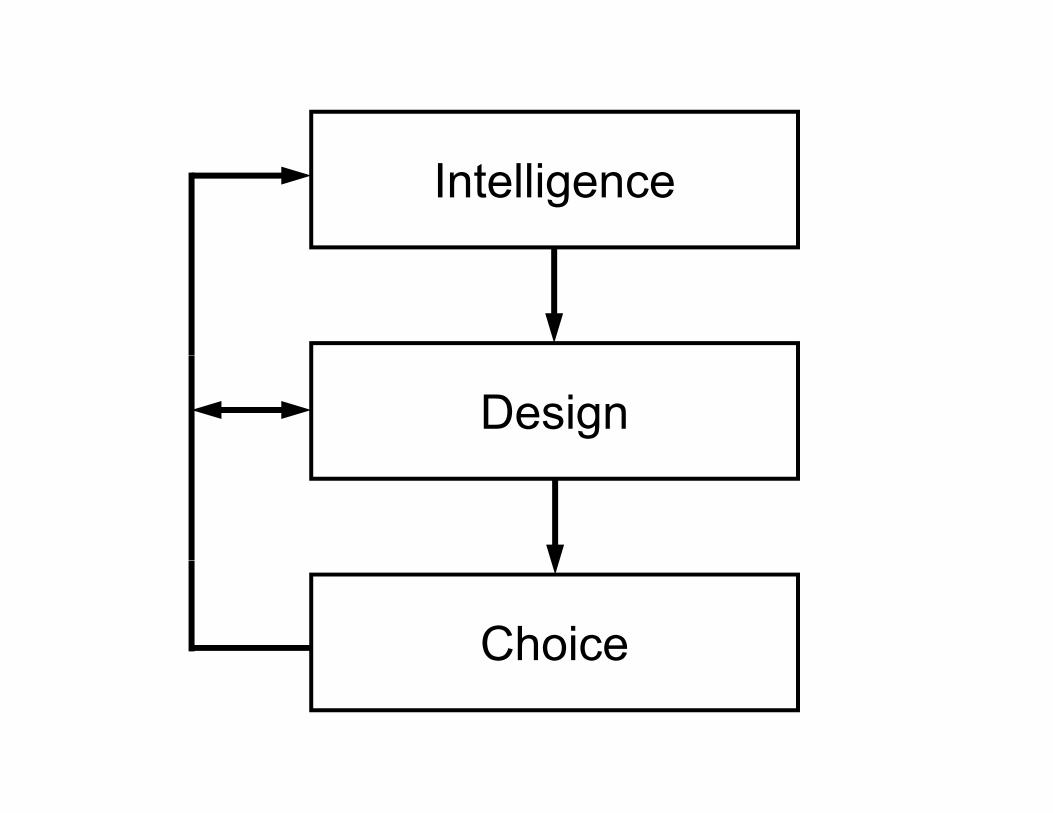
Intelligence
Design
Choice

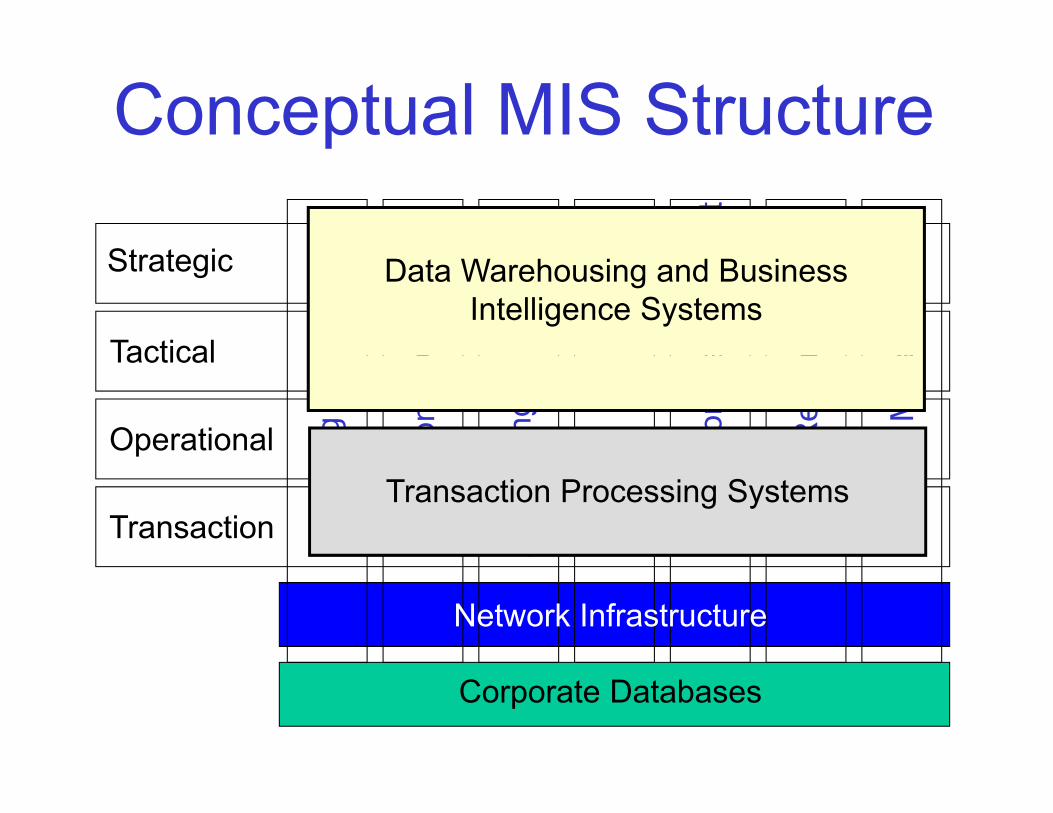
Conceptual MIS Structure
St t i ns men
t
ntStrategic
Tactical Ope
ratio
n
anag
em
urce
s
agem
enData Warehousing and Business Intelligence Systems
Tactical
Operational ing
ctio
n / O
ntin
g
e atio
n M
a
n R
esou
gic
Man
a
Transaction Mar
ket
Pro
duc
Acc
oun
Fina
nce
Info
rma
Hum
an
Stra
teg
Transaction Processing Systems
Network Infrastructure
Corporate Databases
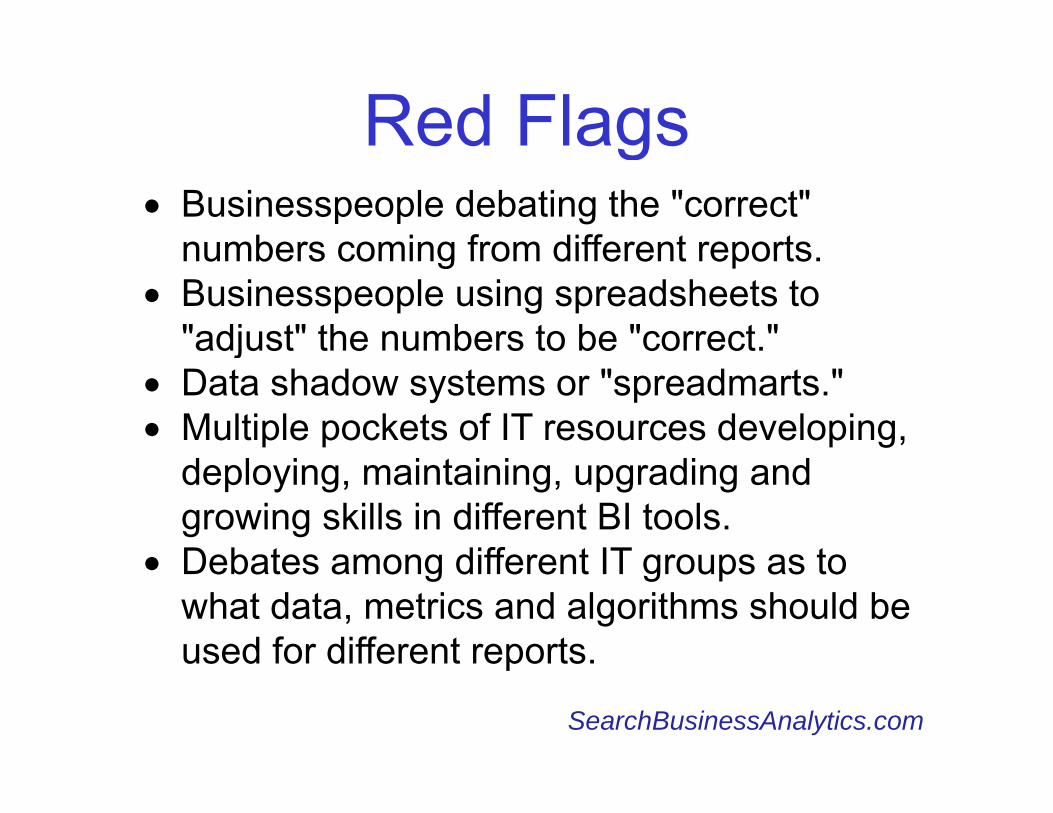
Red Flags g• Businesspeople debating the "correct"
numbers coming from different reportsnumbers coming from different reports. • Businesspeople using spreadsheets to
"adjust" the numbers to be "correct." j• Data shadow systems or "spreadmarts." • Multiple pockets of IT resources developing,
d l i i i i di ddeploying, maintaining, upgrading and growing skills in different BI tools.
• Debates among different IT groups as to• Debates among different IT groups as to what data, metrics and algorithms should be used for different reports.used for different reports.
SearchBusinessAnalytics.com
ReferencesHoughton, R. et al. "Vigilant Information Systems for
Managing Enterprises in Dynamic Supply Chains:Managing Enterprises in Dynamic Supply Chains: Real-time Dashboards At Western Digital," MIS Quarterly Executive, March 2004.
McAfee, A. "Business Intelligence Software at SYSCO," Harvard Business School Case Study, September 2006September 2006.
Wetherbe, J. C. "Executive Information Requirements: Getting it Right " MIS Quarterly March 1991Getting it Right, MIS Quarterly, March 1991.
Davenport, T. "Competing on Analytics," Harvard Business Review Jan 2006Business Review, Jan. 2006.

References: Yogi Berra g• If you don't know where you are going, you
might wind up someplace elsemight wind up someplace else.
• When you come to a fork in the road, take it.
• You can observe a lot by just watching.
• If the world were perfect, it wouldn't be.If the world were perfect, it wouldn t be.
• If you ask me a question I don't know, I'm not going to answergoing to answer.
• It's tough to make predictions, especially about the futureabout the future.
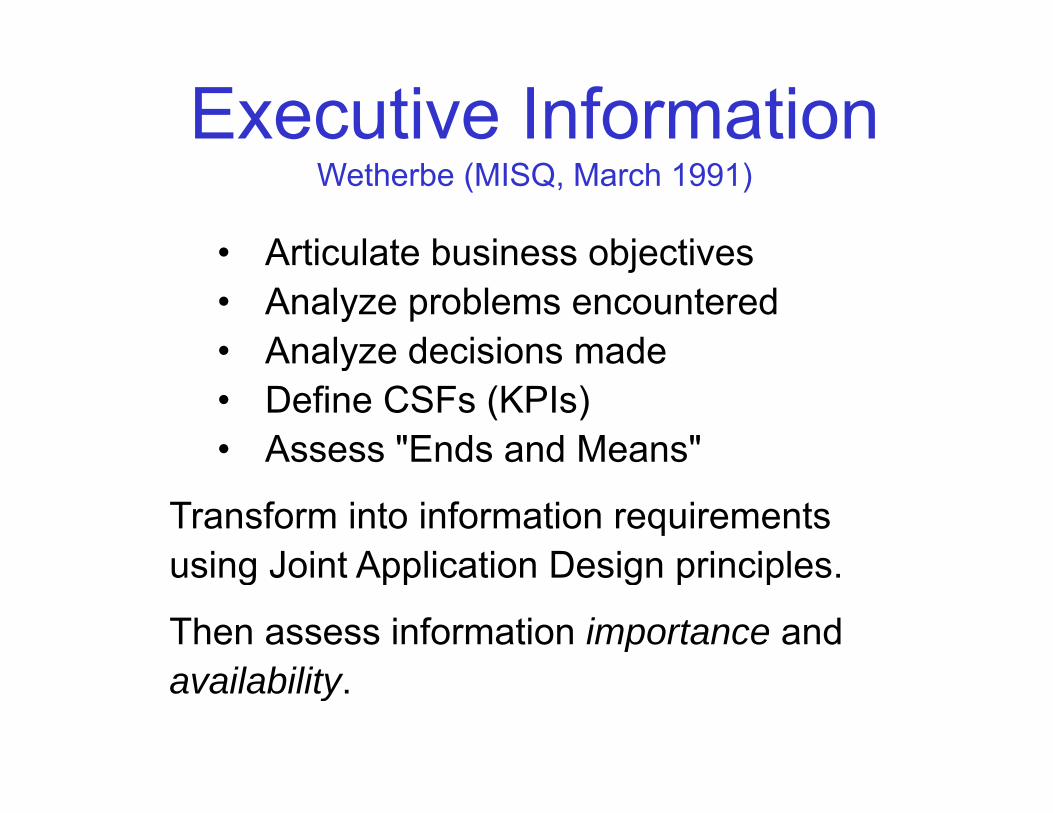
Executive InformationWetherbe (MISQ, March 1991)
• Articulate business objectives• Articulate business objectives• Analyze problems encountered• Analyze decisions madeAnalyze decisions made• Define CSFs (KPIs)• Assess "Ends and Means"Assess Ends and Means
Transform into information requirements using Joint Application Design principlesusing Joint Application Design principles.
Then assess information importance and availability.
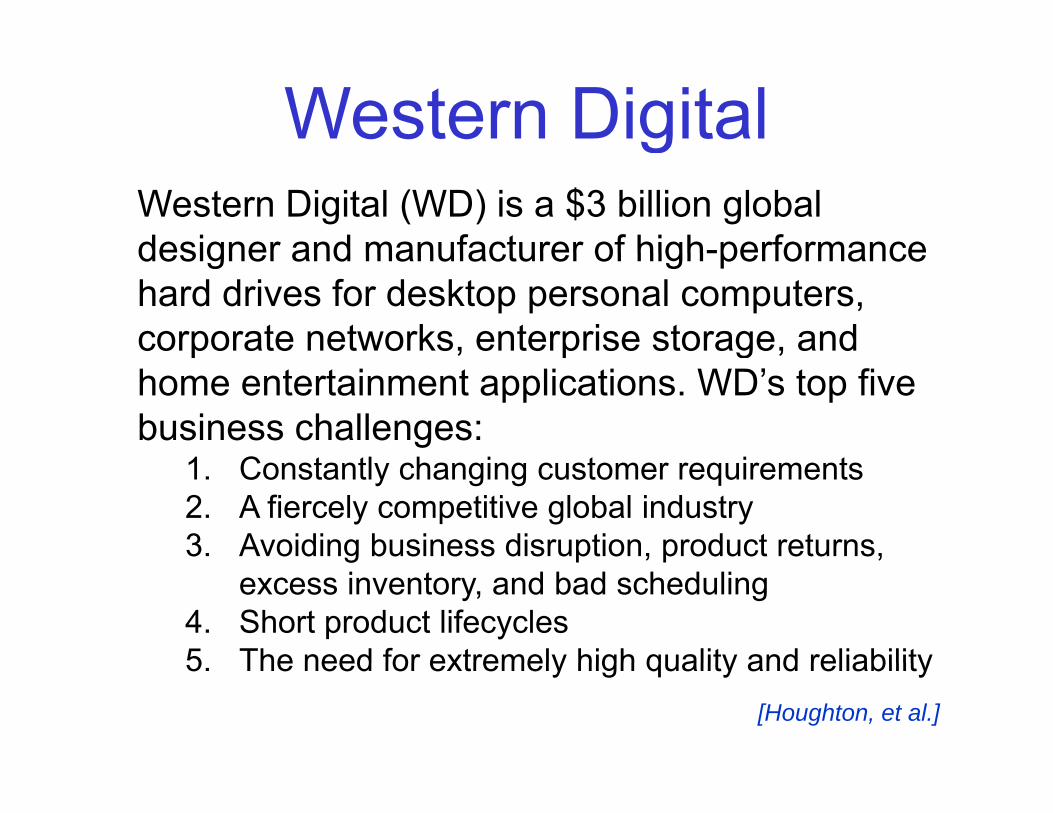
Western DigitalgWestern Digital (WD) is a $3 billion global designer and manufacturer of high-performancedesigner and manufacturer of high-performance hard drives for desktop personal computers, corporate networks, enterprise storage, and p , p g ,home entertainment applications. WD’s top five business challenges:
1 C t tl h i t i t1. Constantly changing customer requirements2. A fiercely competitive global industry3. Avoiding business disruption, product returns, g p , p ,
excess inventory, and bad scheduling4. Short product lifecycles5 The need for extremely high quality and reliability5. The need for extremely high quality and reliability
[Houghton, et al.]
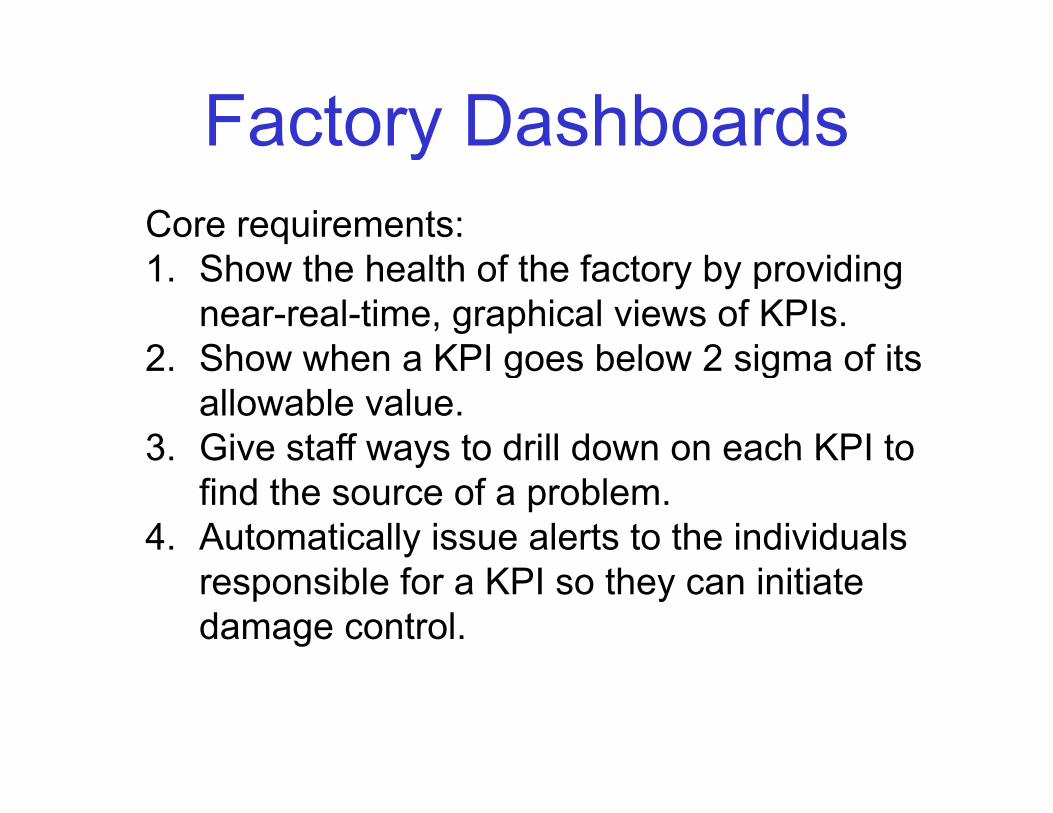
Factory DashboardsCore requirements:
y
1. Show the health of the factory by providing near-real-time, graphical views of KPIs.
2 Show when a KPI goes below 2 sigma of its2. Show when a KPI goes below 2 sigma of its allowable value.
3. Give staff ways to drill down on each KPI to3. Give staff ways to drill down on each KPI to find the source of a problem.
4. Automatically issue alerts to the individuals responsible for a KPI so they can initiate damage control.
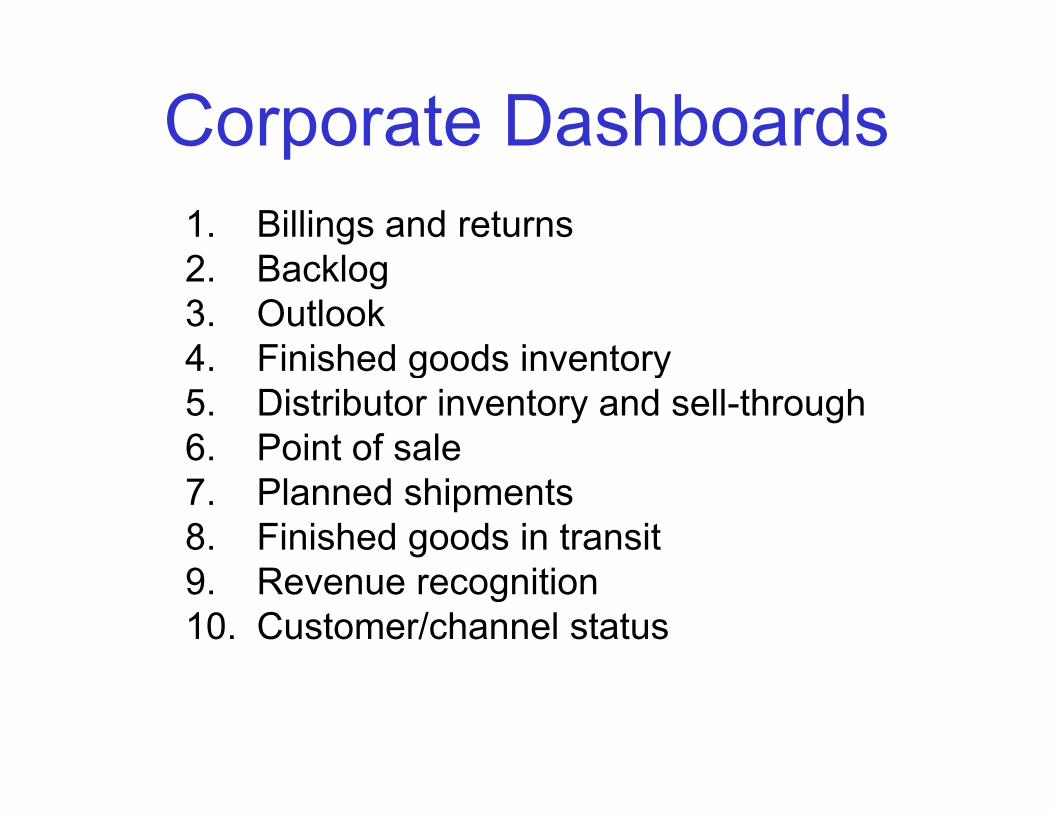
Corporate Dashboards1. Billings and returns
p
2. Backlog3. Outlook4 Finished goods inventory4. Finished goods inventory5. Distributor inventory and sell-through6. Point of sale6. Point of sale7. Planned shipments8. Finished goods in transit9. Revenue recognition10. Customer/channel status
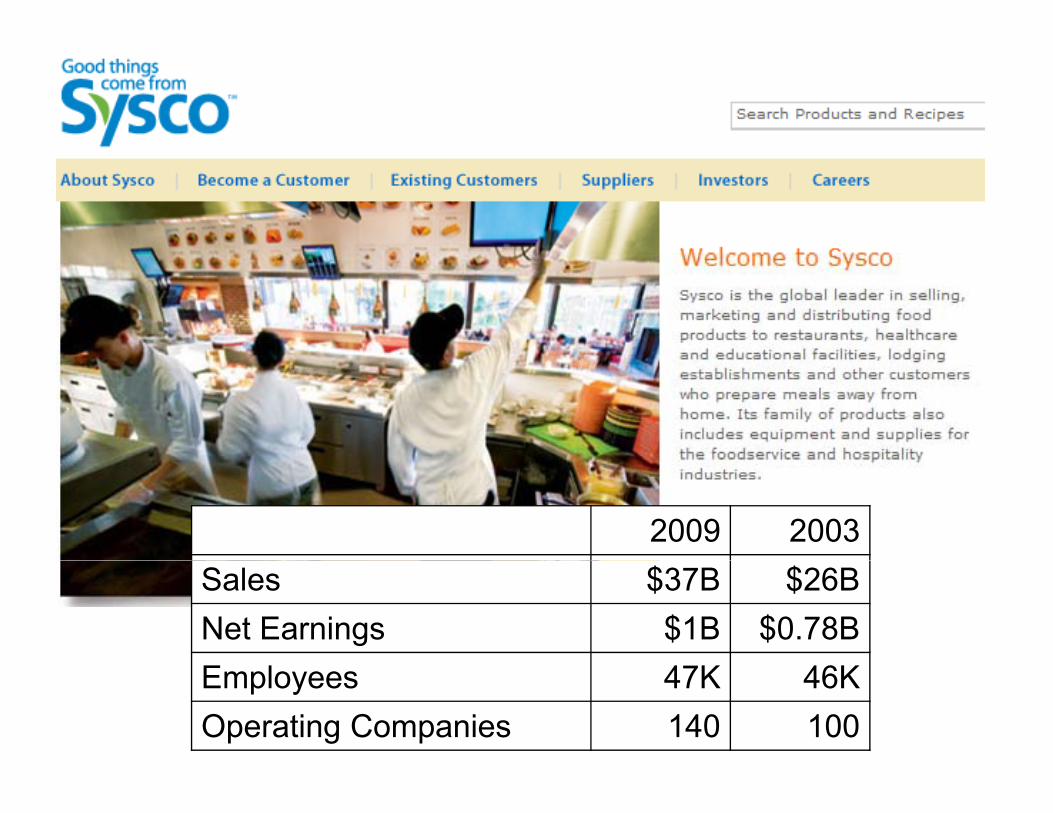
2009 2003Sales $37B $26BNet Earnings $1B $0.78BEmployees 47K 46KOperating Companies 140 100
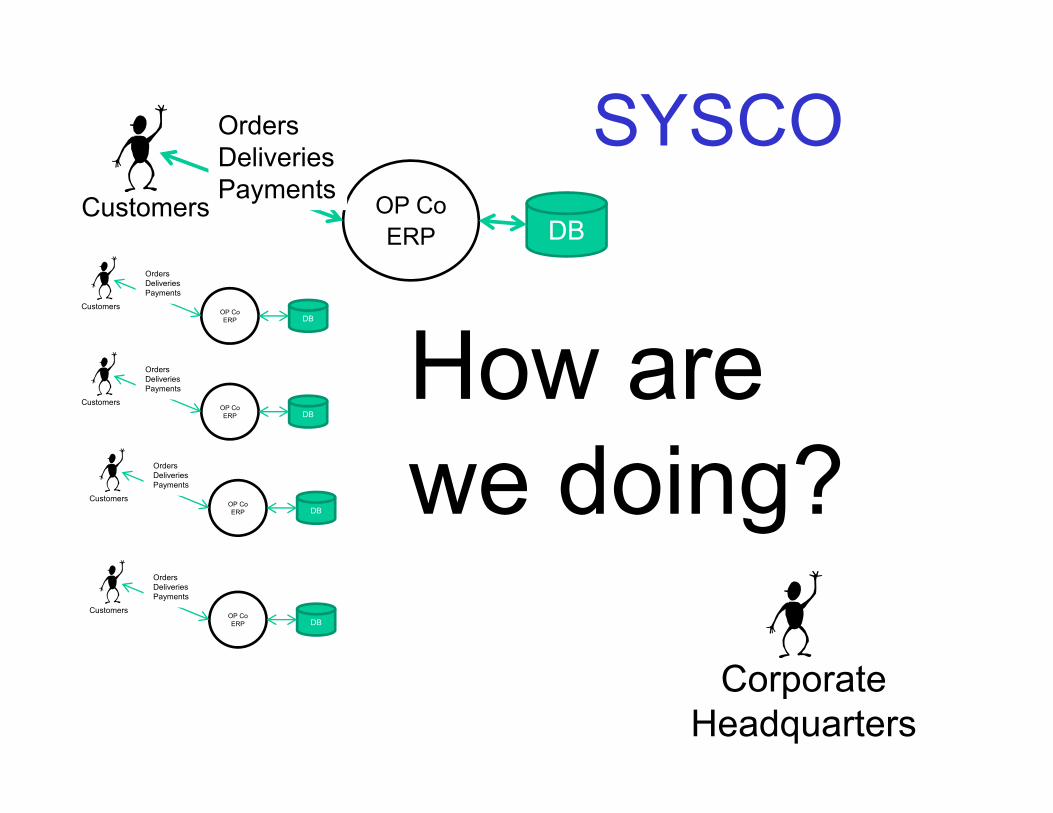
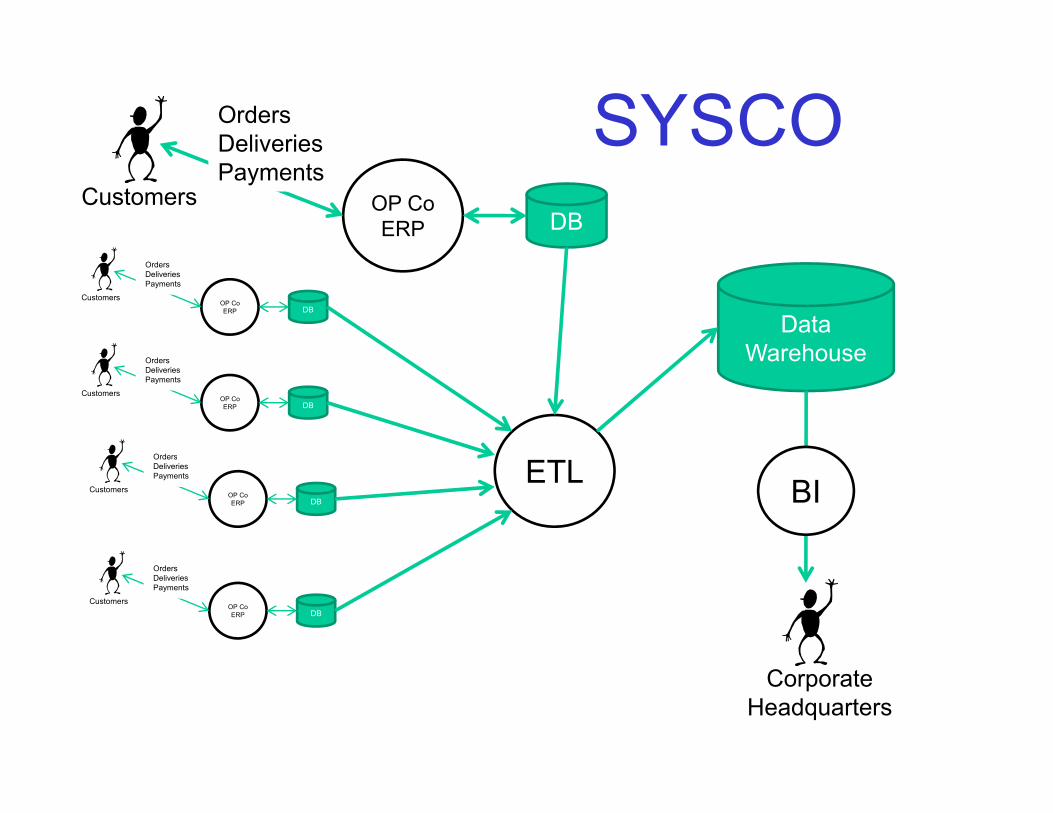
OrdersD li i
SYSCOOP CoERP
Customers
DeliveriesPayments
DB
OP CoERP
Customers
OrdersDeliveriesPayments
DB
How areOP CoERP
Customers
OrdersDeliveriesPayments
DB
How are d i ?OP Co
ERP
Customers
OrdersDeliveriesPayments
DB we doing?OP CoERP
Customers
OrdersDeliveriesPayments
DB
CorporateHeadquarters
OrdersDeliveries
OP CoERP
CustomersPayments
DB
OP CoERP
Customers
OrdersDeliveriesPayments
DB
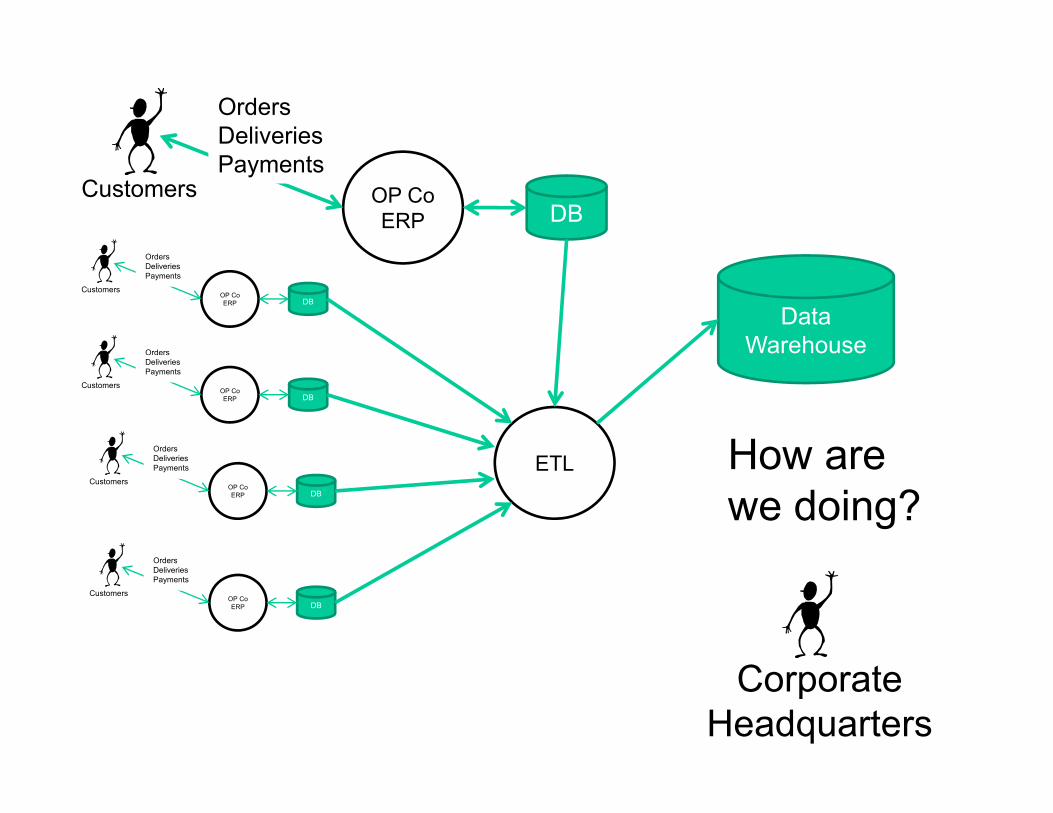
Orders
DataWarehouse
OP CoERP
Customers
DeliveriesPayments
DB
OrdersDeliveries ETL How are
OP CoERP
Customers
DeliveriesPayments
DB
Orders
ETL How are we doing?
OP CoERP
Customers
OrdersDeliveriesPayments
DB
CorporateHeadquarters

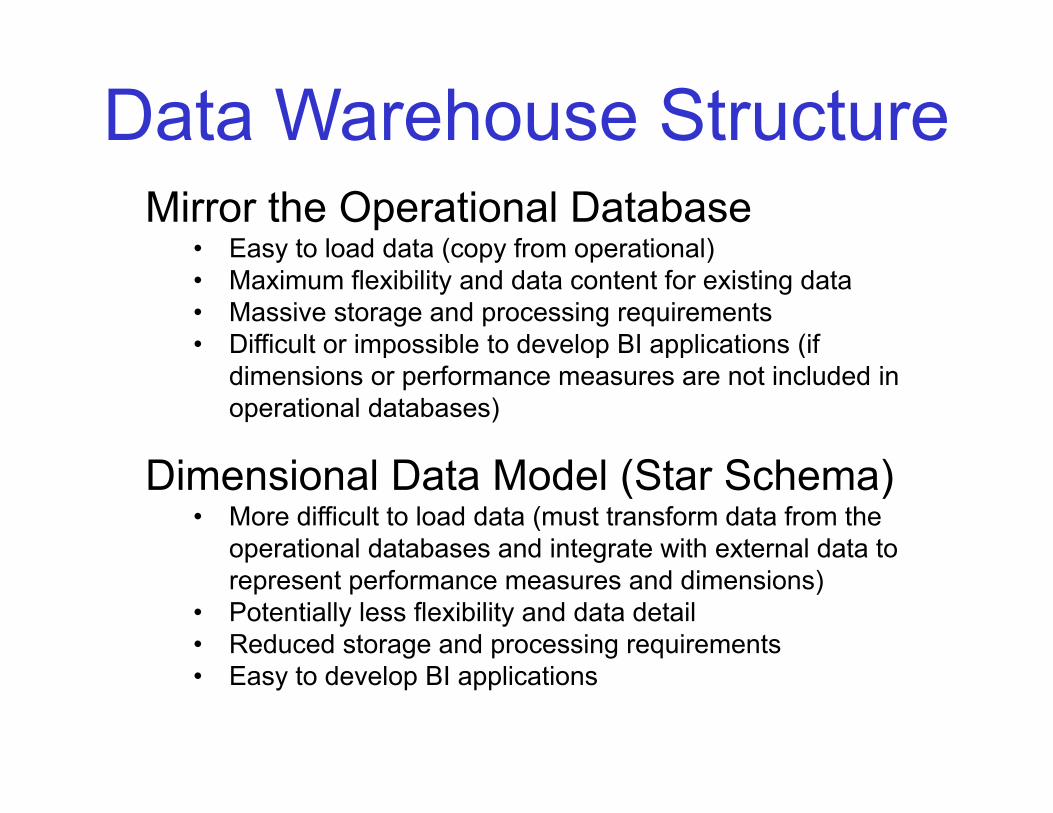
Data Warehouse StructureMirror the Operational Database
• Easy to load data (copy from operational)Easy to load data (copy from operational)• Maximum flexibility and data content for existing data• Massive storage and processing requirements• Difficult or impossible to develop BI applications (if p p pp (
dimensions or performance measures are not included in operational databases)
Dimensional Data Model (Star Schema)• More difficult to load data (must transform data from the
operational databases and integrate with external data to p grepresent performance measures and dimensions)
• Potentially less flexibility and data detail• Reduced storage and processing requirements• Easy to develop BI applications
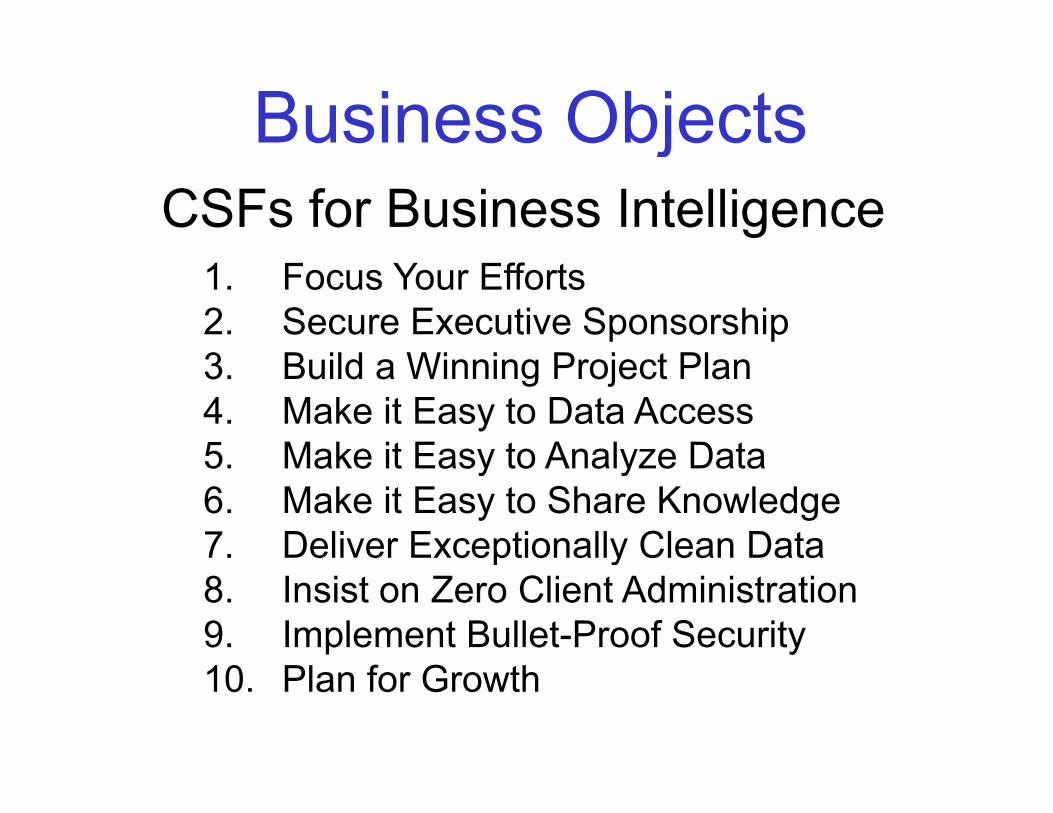
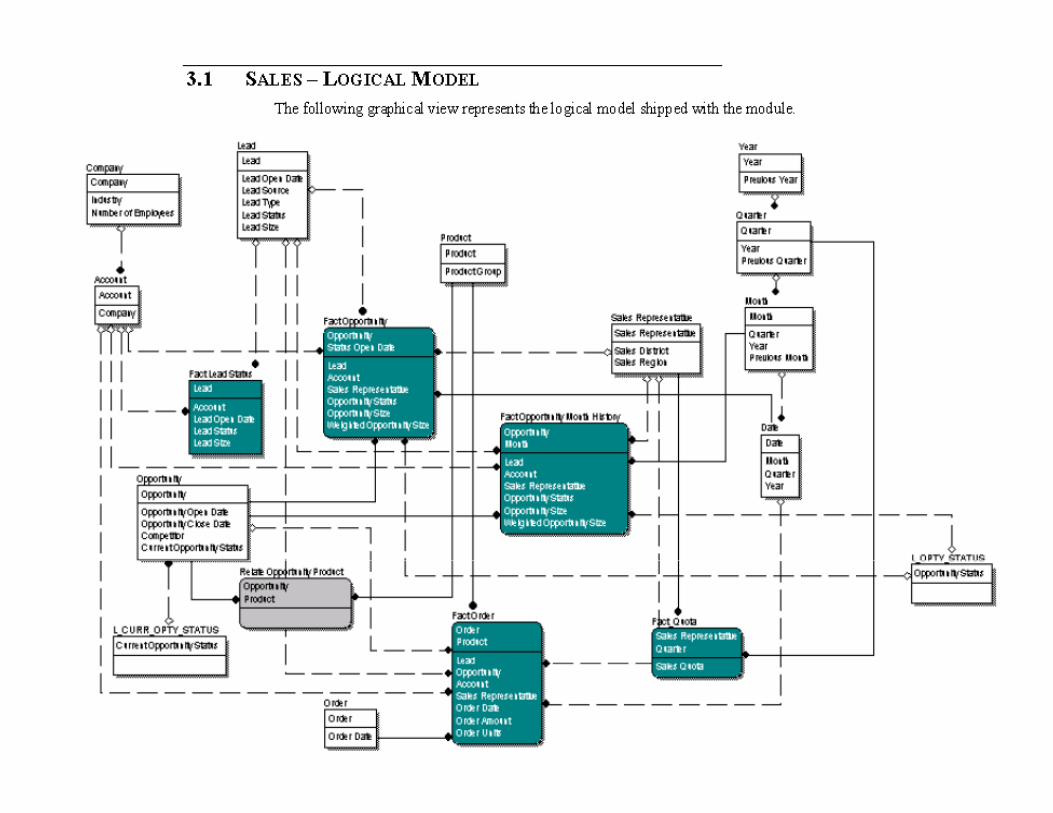
Business ObjectsCSFs for Business Intelligence
j
1. Focus Your Efforts2. Secure Executive Sponsorship3 B ild Wi i P j t Pl3. Build a Winning Project Plan4. Make it Easy to Data Access5 Make it Easy to Analyze Data5. Make it Easy to Analyze Data6. Make it Easy to Share Knowledge7. Deliver Exceptionally Clean Datap y8. Insist on Zero Client Administration9. Implement Bullet-Proof Security10. Plan for Growth
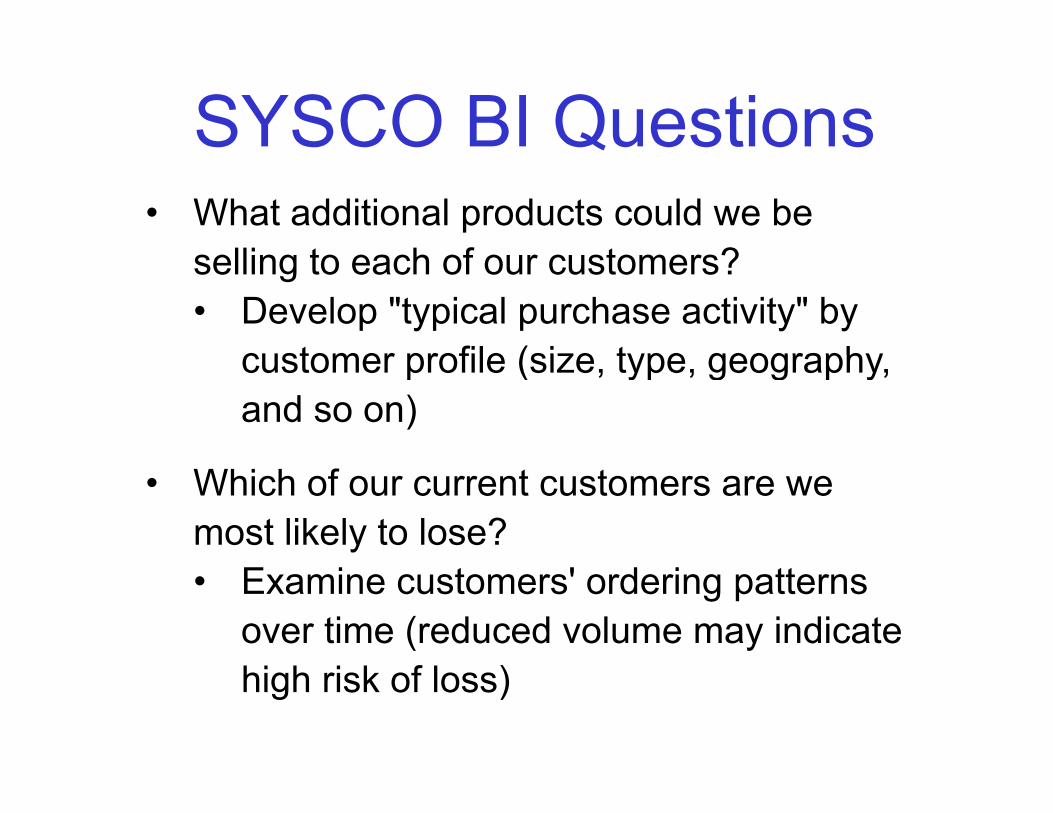
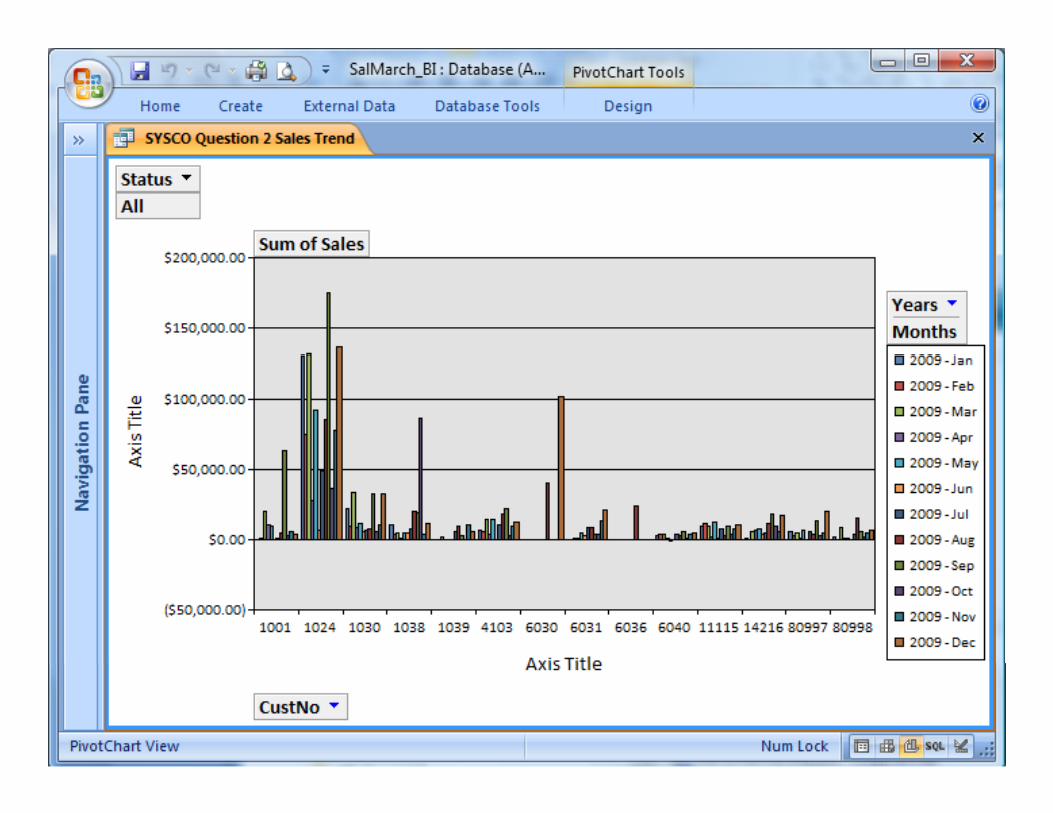
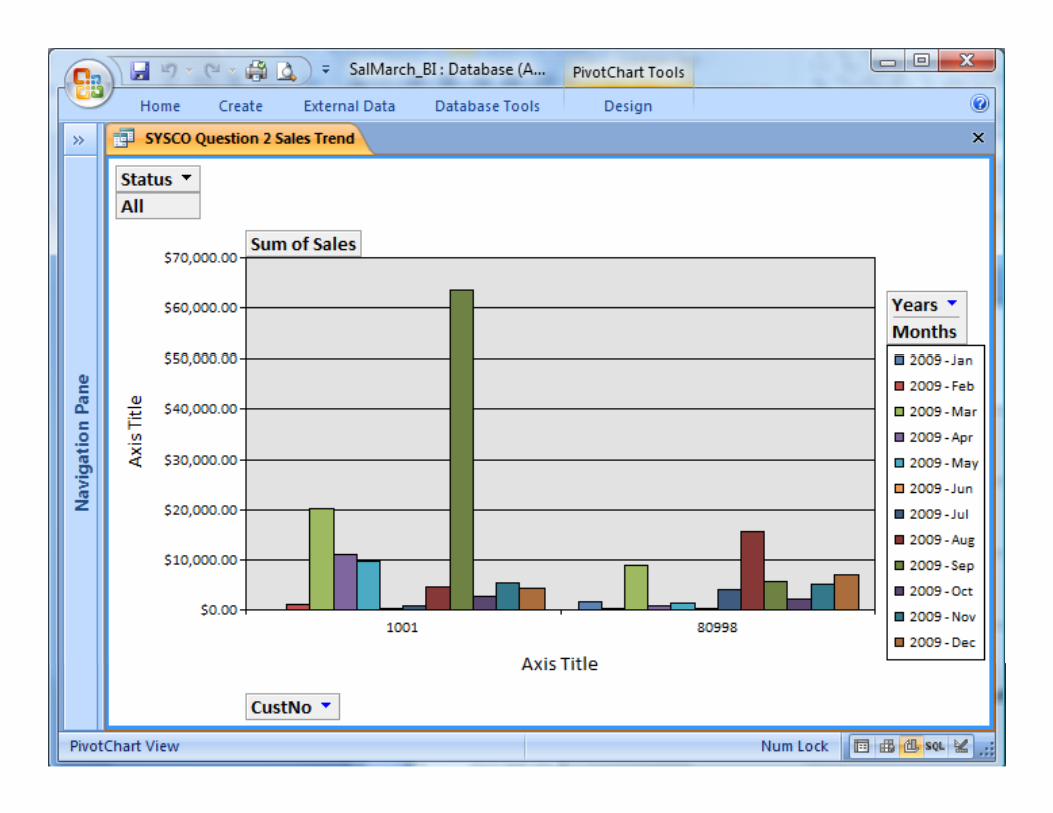
SYSCO BI QuestionsQ• What additional products could we be
lli t h f t ?selling to each of our customers?• Develop "typical purchase activity" by
customer profile (size type geographycustomer profile (size, type, geography, and so on)
• Which of our current customers are we most likely to lose?• Examine customers' ordering patterns
over time (reduced volume may indicate high risk of loss)
OrdersDeliveries SYSCO
OP CoERP
Customers
DeliveriesPayments
DB
OP CoERP
Customers
OrdersDeliveriesPayments
DB
DataWarehouse
OP CoERP
Customers
OrdersDeliveriesPayments
DB
Orders
Warehouse
OP CoERP
Customers
OrdersDeliveriesPayments
DB
ETL BI
OP CoERP
Customers
OrdersDeliveriesPayments
DB
CorporateHeadquarters
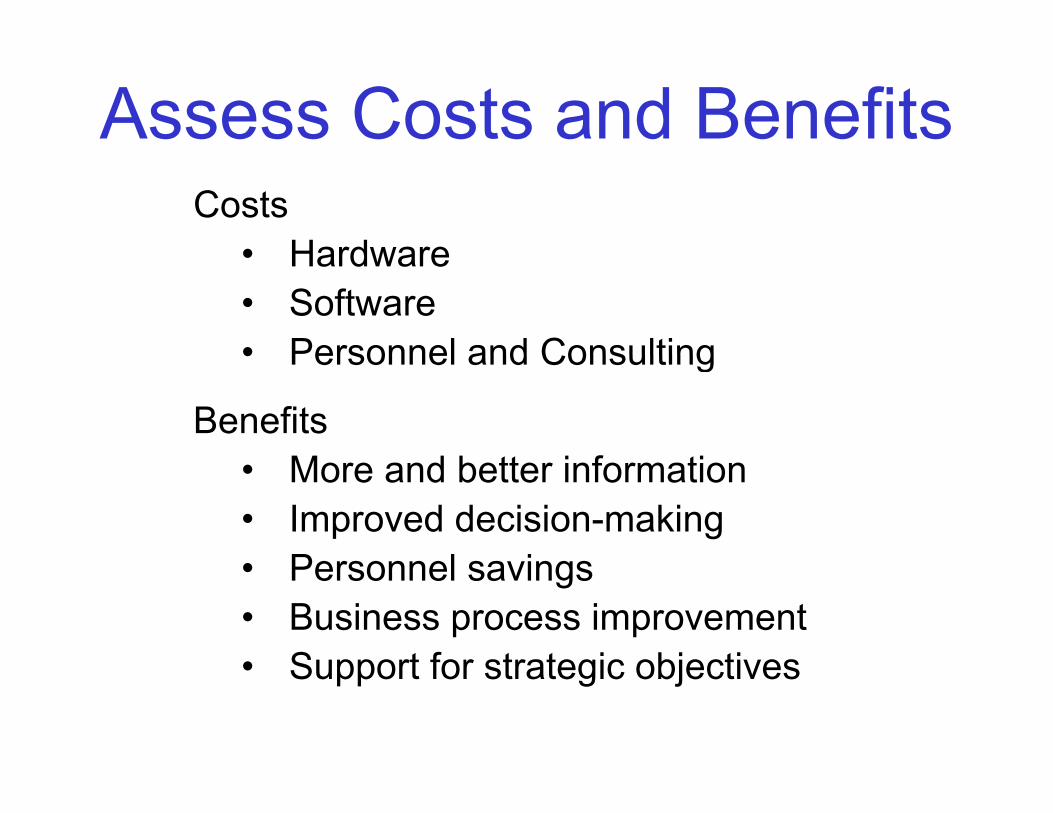
Assess Costs and BenefitsCosts
• Hardware• Hardware• Software• Personnel and Consulting• Personnel and Consulting
BenefitsM d b tt i f ti• More and better information
• Improved decision-makingP l i• Personnel savings
• Business process improvement• Support for strategic objectives• Support for strategic objectives
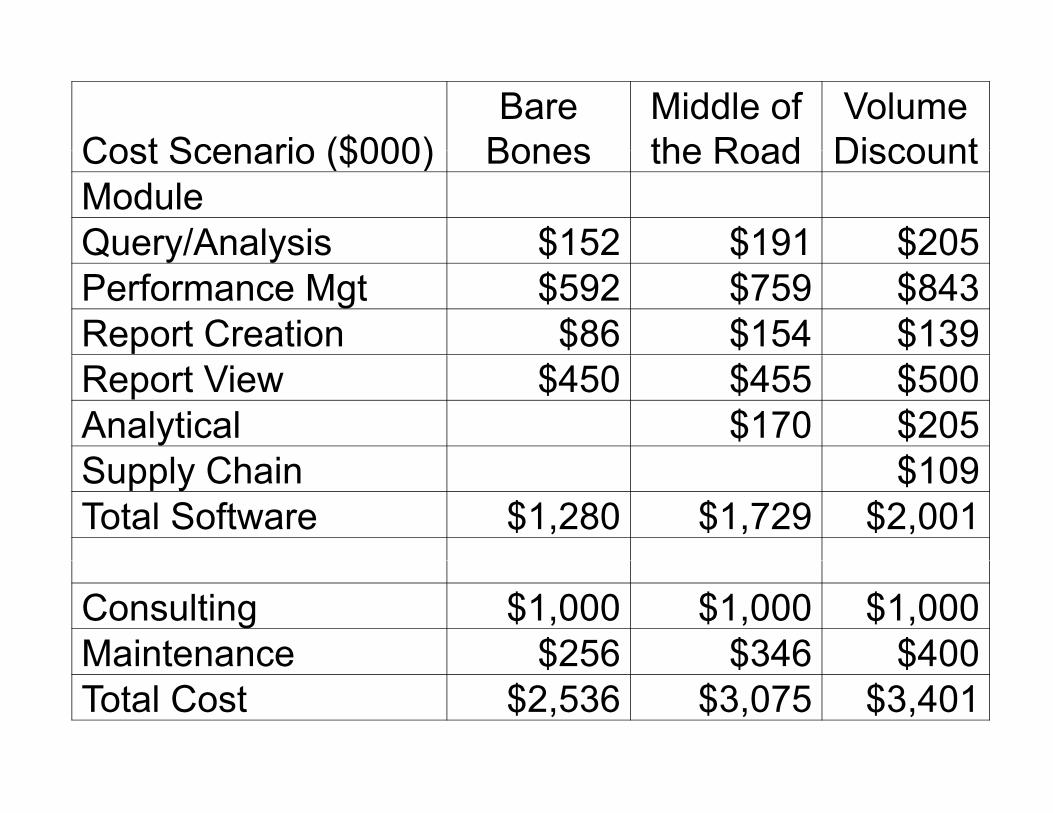
Cost Scenario ($000)Bare
BonesMiddle of the Road
Volume DiscountCost Scenario ($000) Bones the Road Discount
ModuleQuery/Analysis $152 $191 $205Query/Analysis $152 $191 $205Performance Mgt $592 $759 $843Report Creation $86 $154 $139Report View $450 $455 $500Analytical $170 $205S l Ch i $109Supply Chain $109Total Software $1,280 $1,729 $2,001
Consulting $1,000 $1,000 $1,000Maintenance $256 $346 $400Maintenance $256 $346 $400Total Cost $2,536 $3,075 $3,401
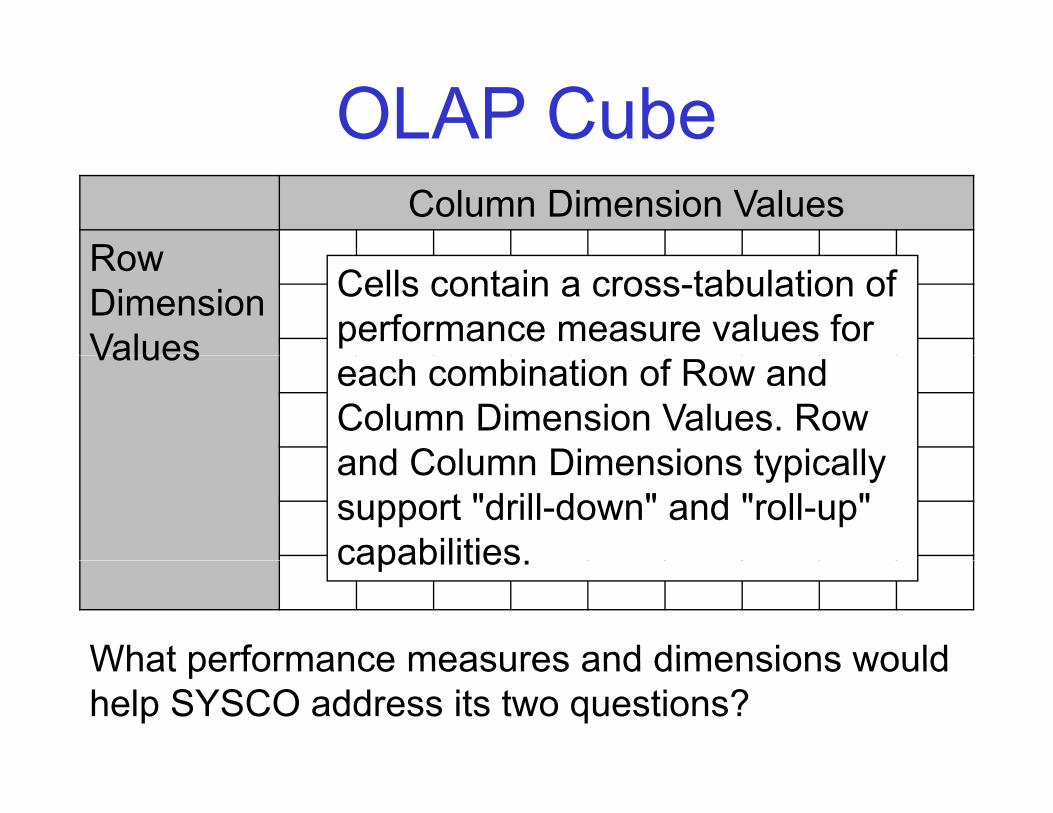
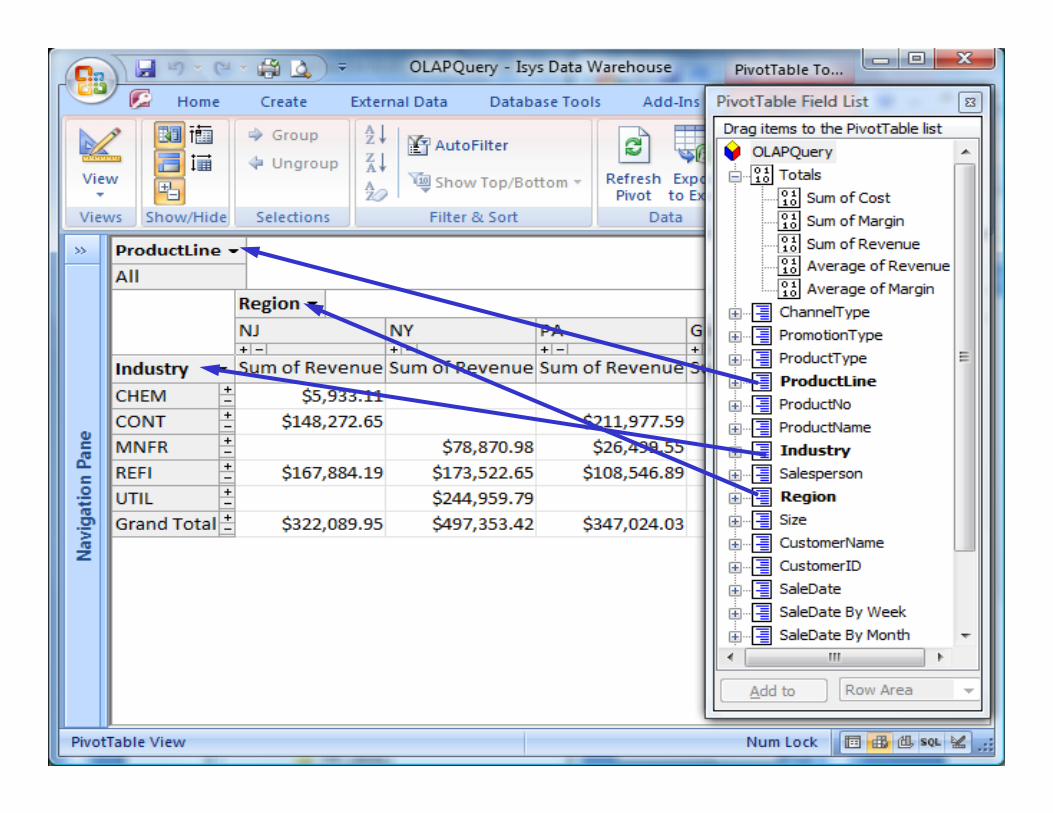
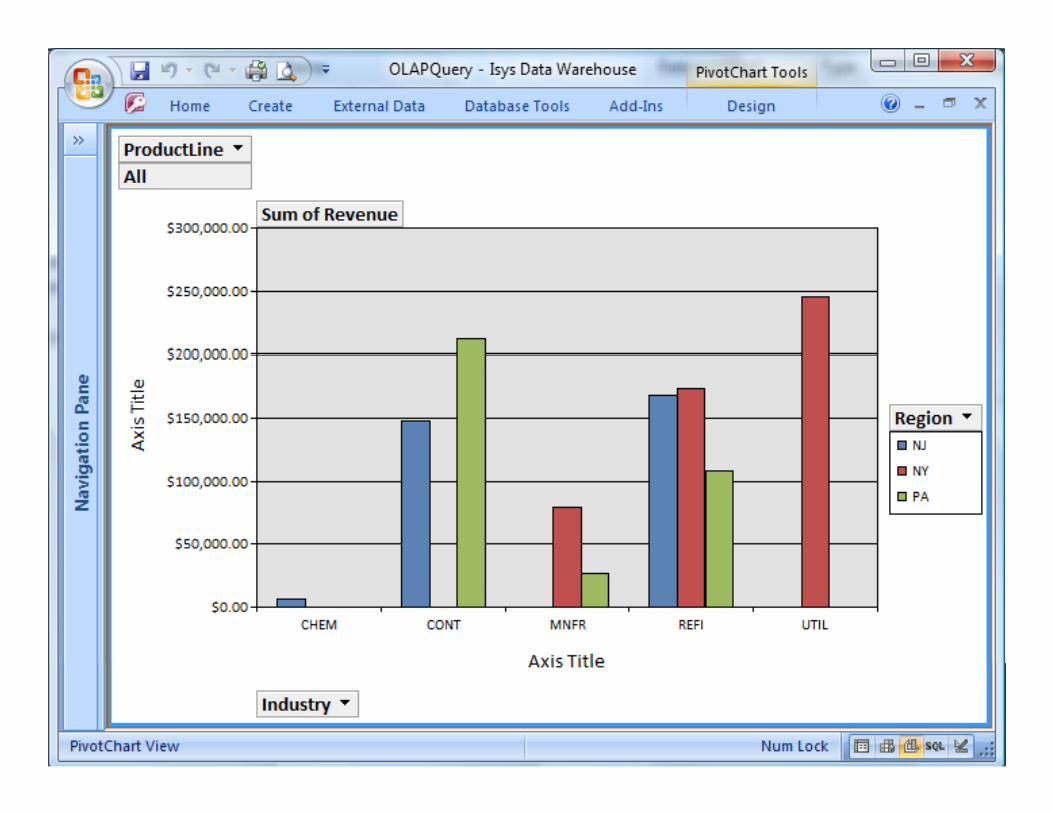
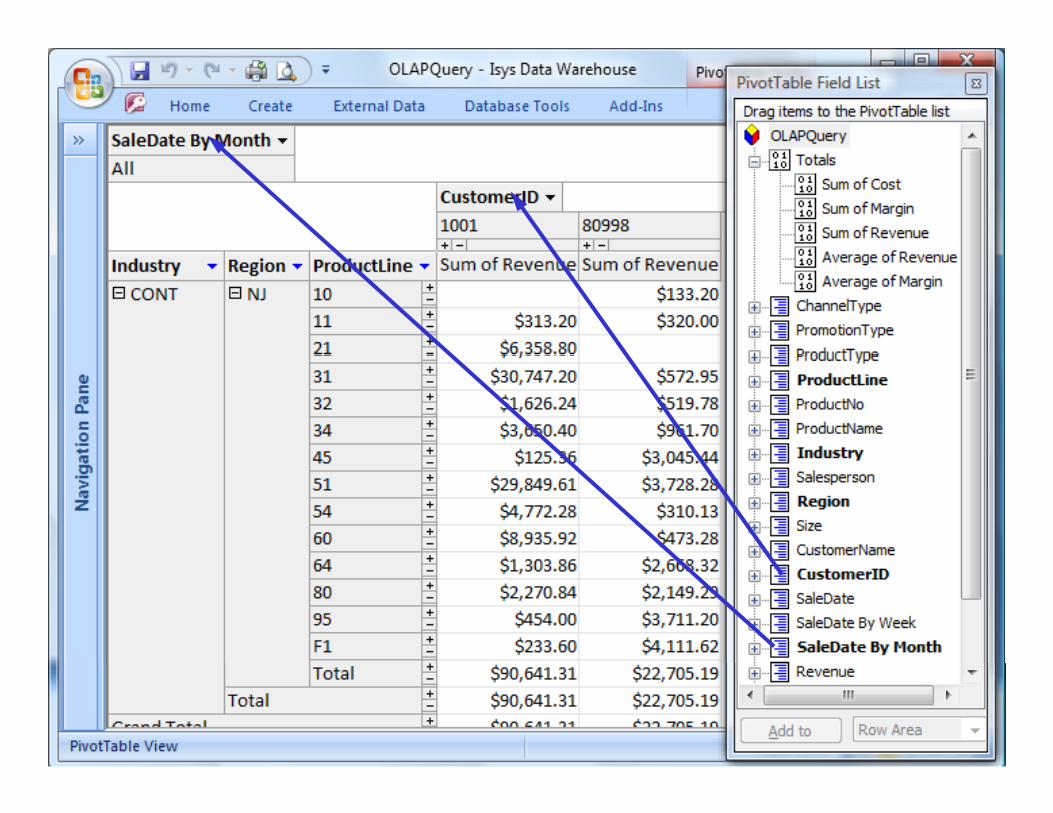
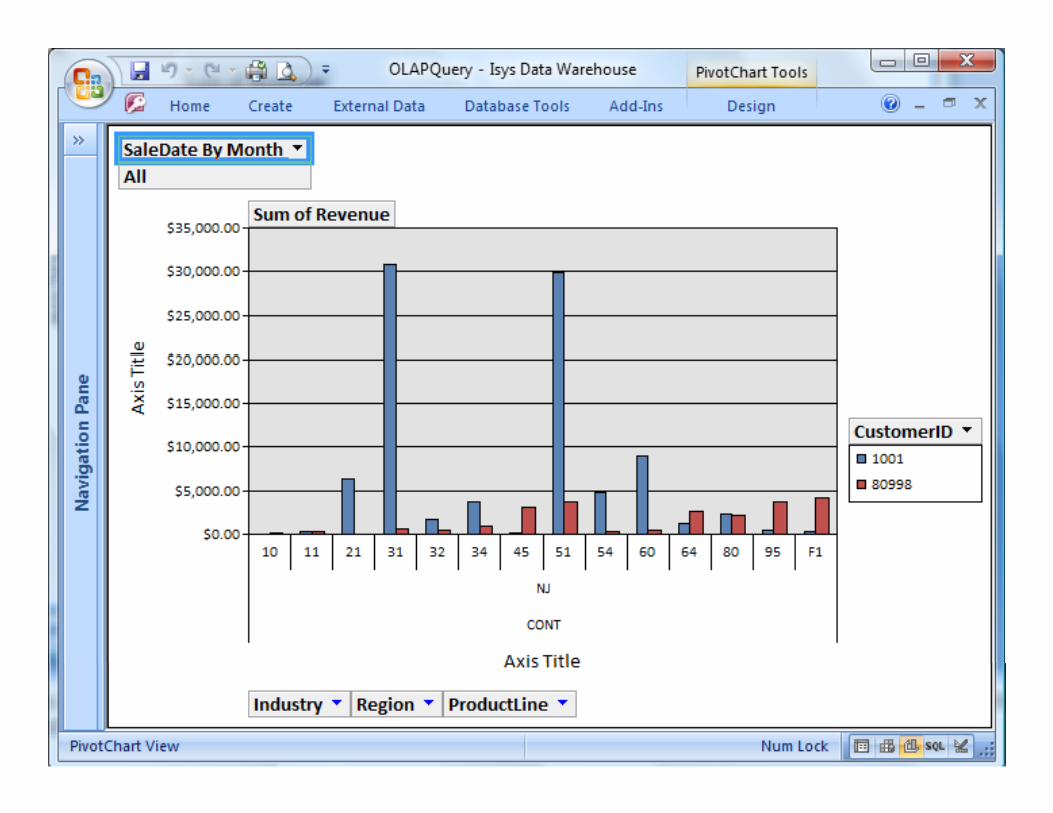
OLAP CubeColumn Dimension Values
RowRowDimensionValues
Cells contain a cross-tabulation of performance measure values for Valueseach combination of Row and Column Dimension Values. Row and Column Dimensions typicallyand Column Dimensions typically support "drill-down" and "roll-up" capabilitiescapabilities.
What performance measures and dimensions wouldWhat performance measures and dimensions would help SYSCO address its two questions?
Data Warehouse StructureMirror the Operational Database
• Easy to load data (copy from operational)Easy to load data (copy from operational)• Maximum flexibility and data content for existing data• Massive storage and processing requirements• Difficult or impossible to develop BI applications (if p p pp (
dimensions or performance measures are not included in operational databases)
Dimensional Data Model (Star Schema)• More difficult to load data (must transform data from the
operational databases and integrate with external data to p grepresent performance measures and dimensions)
• Potentially less flexibility and data detail• Reduced storage and processing requirements• Easy to develop BI applications
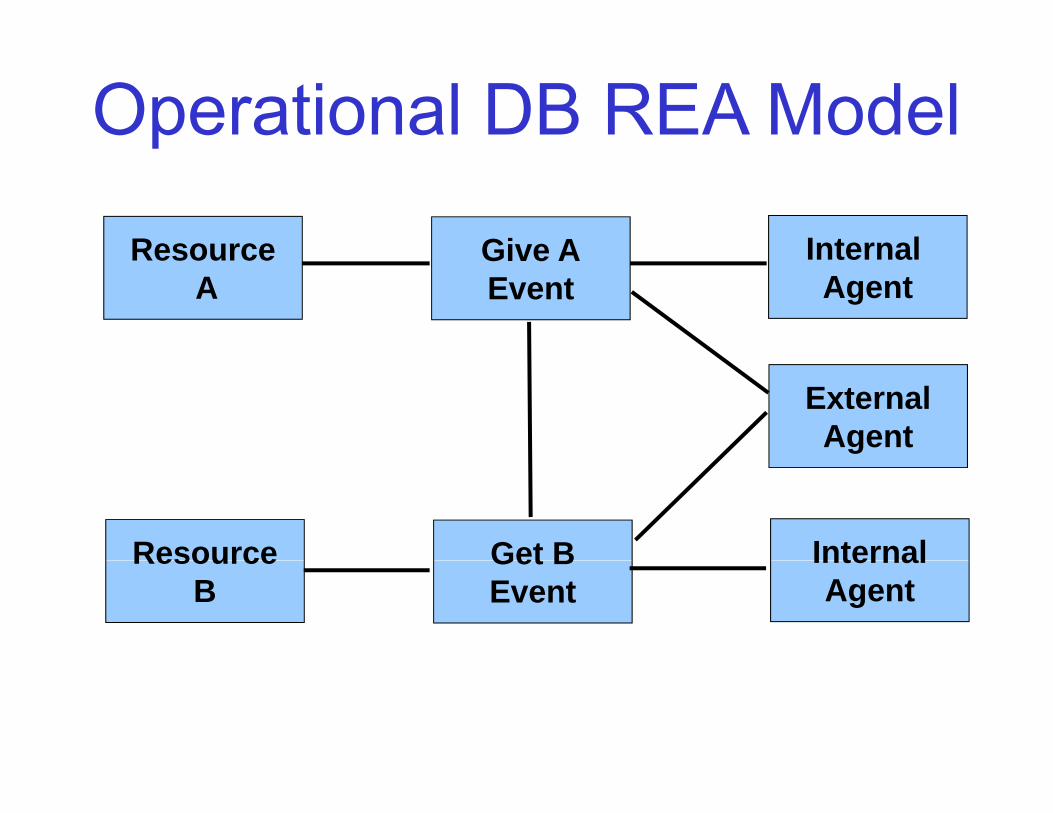
Operational DB REA Model
InternalGive AResource Internal Agent
Give AEvent
ResourceA
ExternalAgent
InternalGet BResource InternalAgent
Get BEvent
ResourceB
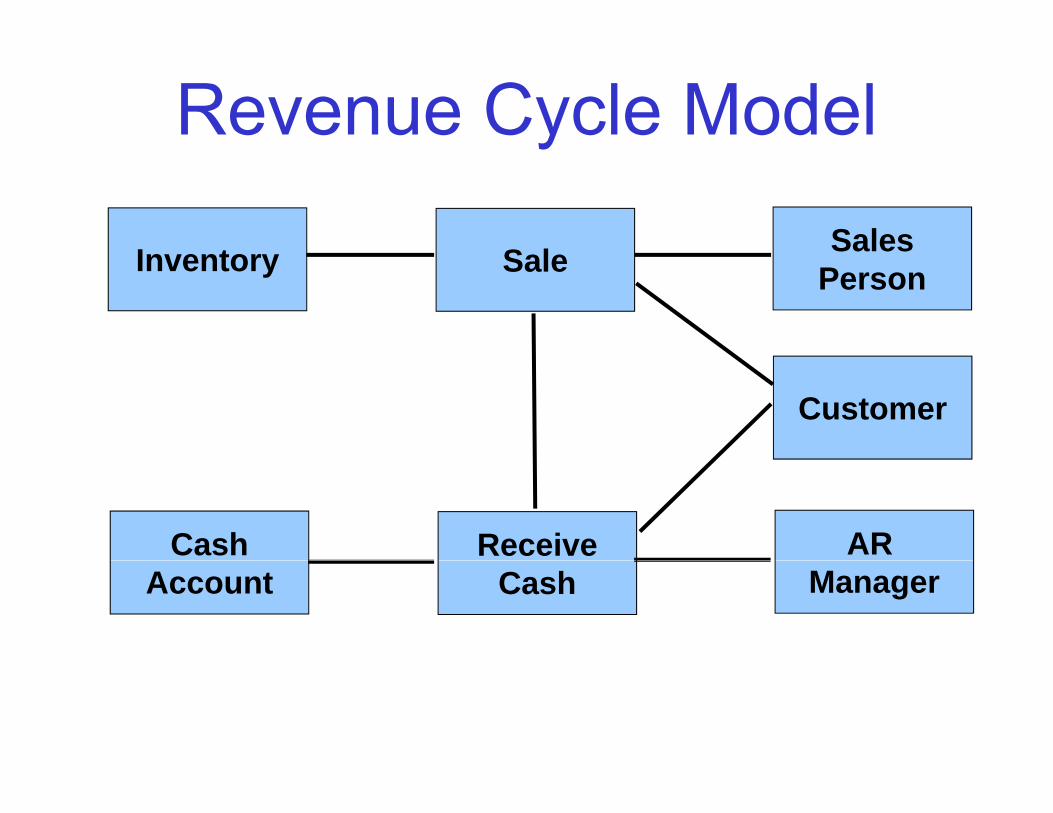
Revenue Cycle ModelSalesS lI t PersonSaleInventory
Customer
AR ReceiveCashManagerCashAccount
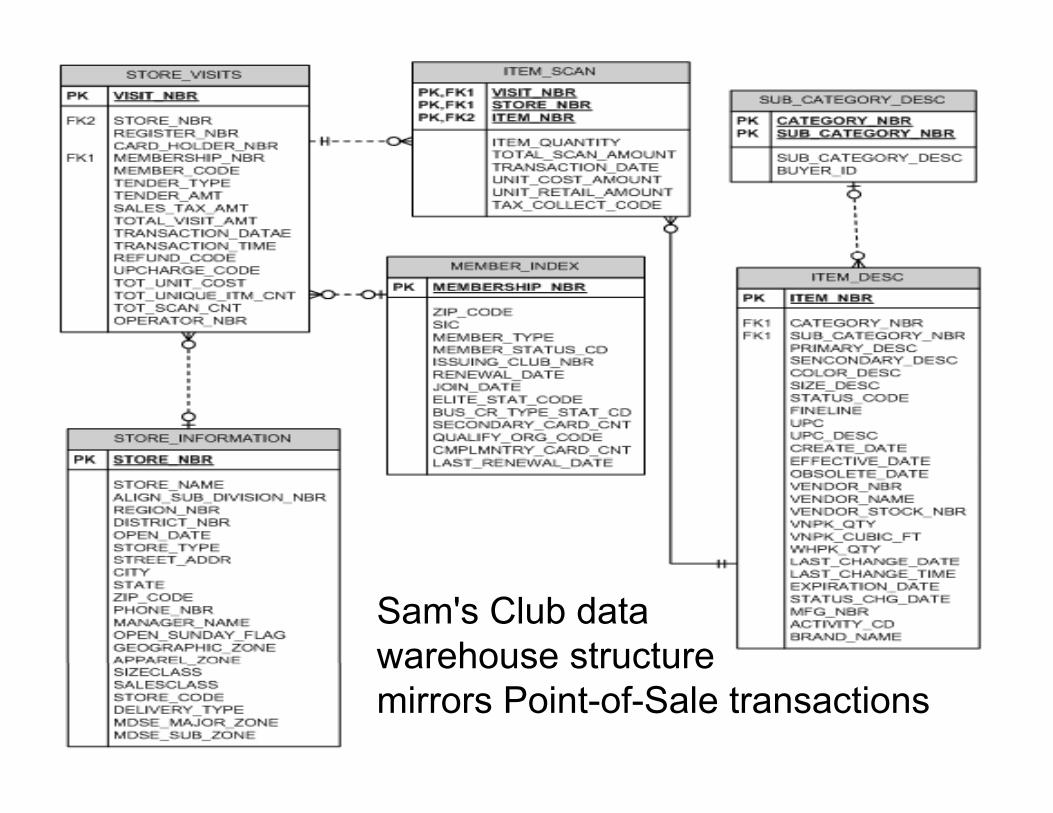
Sam's Club data warehouse structurewarehouse structure mirrors Point-of-Sale transactions
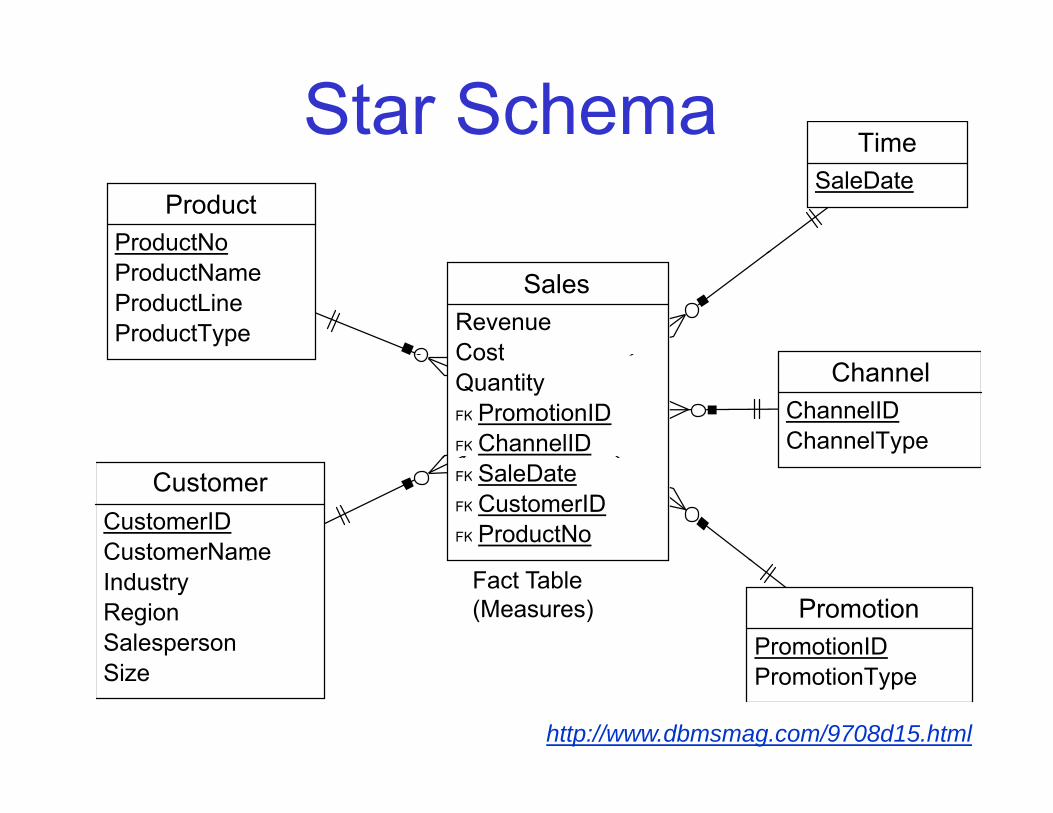
Star SchemaTime
ProductProductNo
TimeSaleDate
SalesRevenueCost
ProductNameProductLineProductType
CostQuantityFK PromotionIDFK ChannelID
ChannelChannelIDChannelType
FK SaleDateFK CustomerIDFK ProductNo
CustomerCustomerIDCustomerNameIndustryRegionSalesperson
PromotionPromotionID
Fact Table(Measures)
http://www.dbmsmag.com/9708d15.html
Size PromotionType
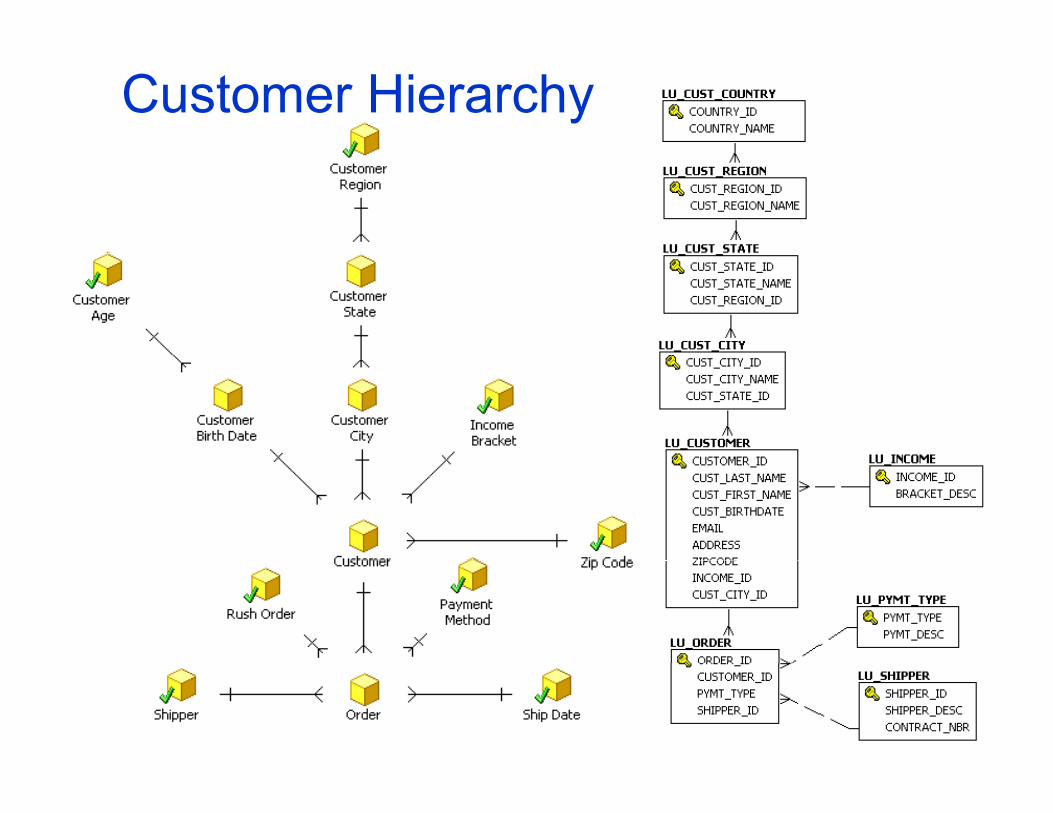
Customer Hierarchy
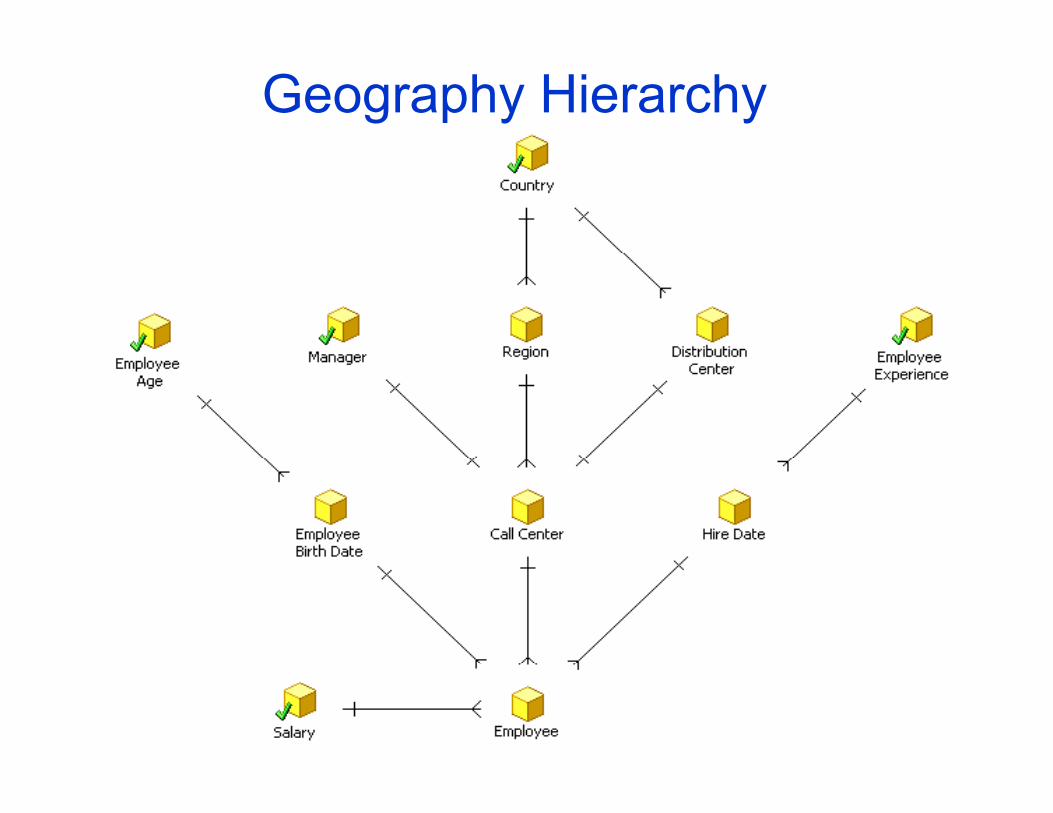
Geography Hierarchy
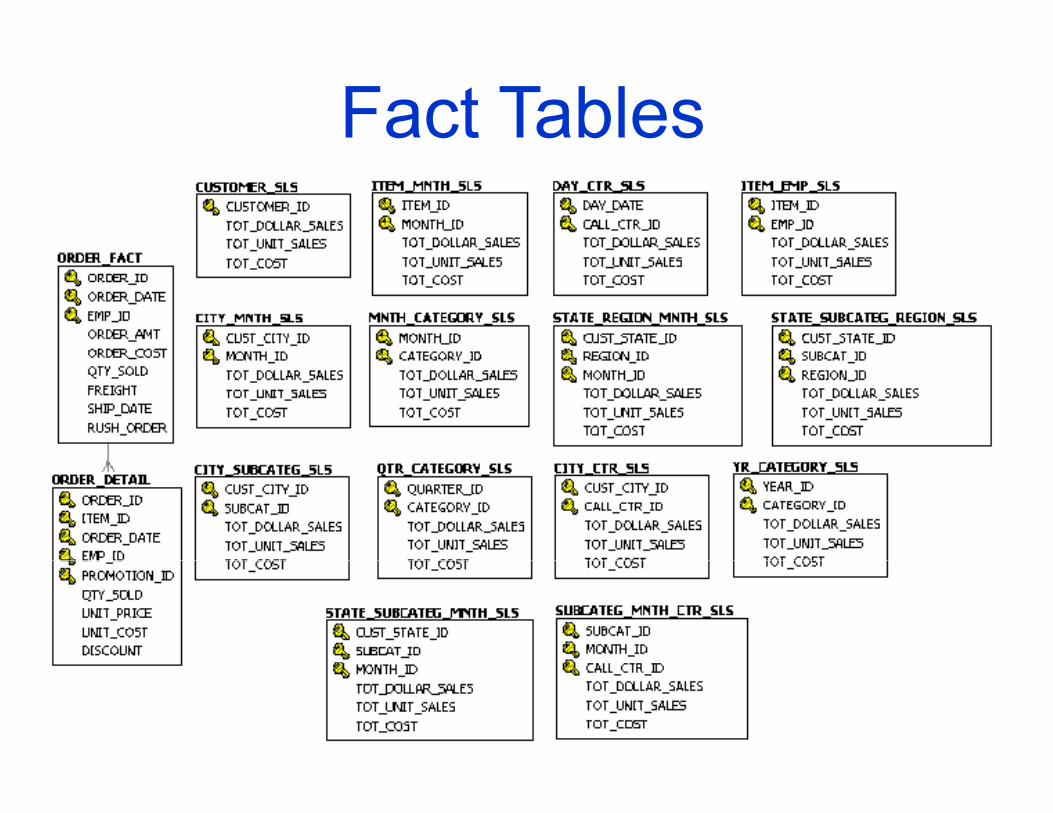
Fact Tables
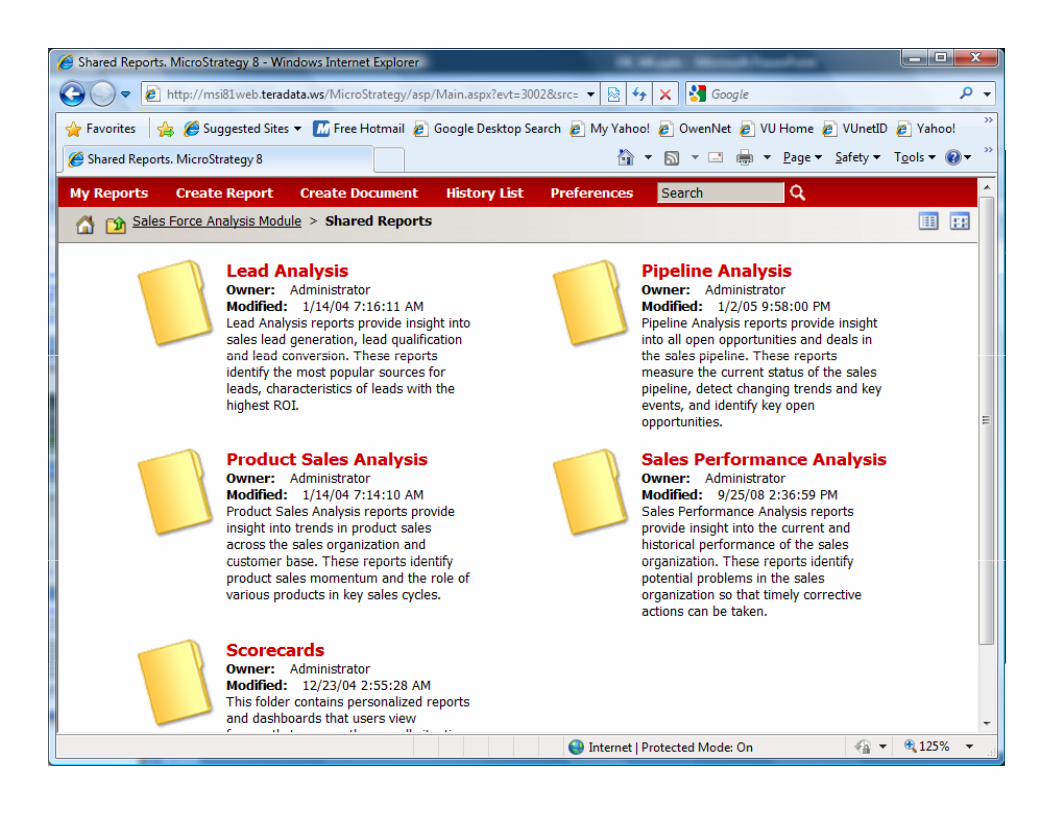
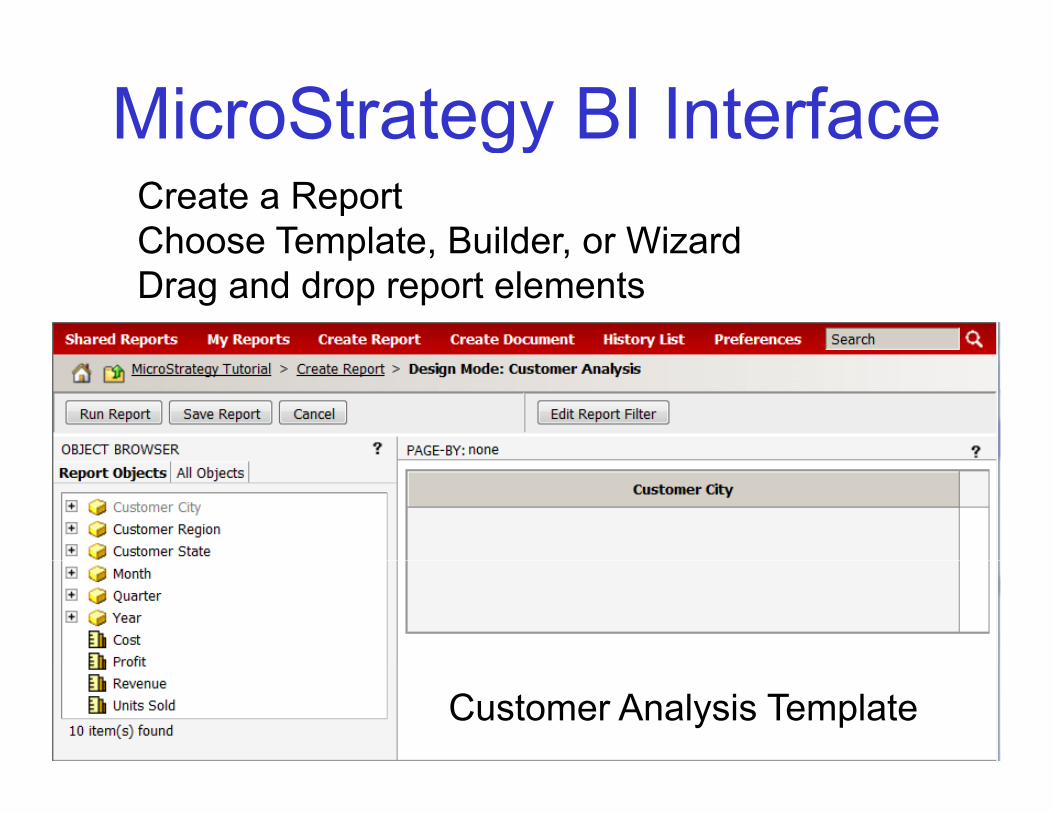
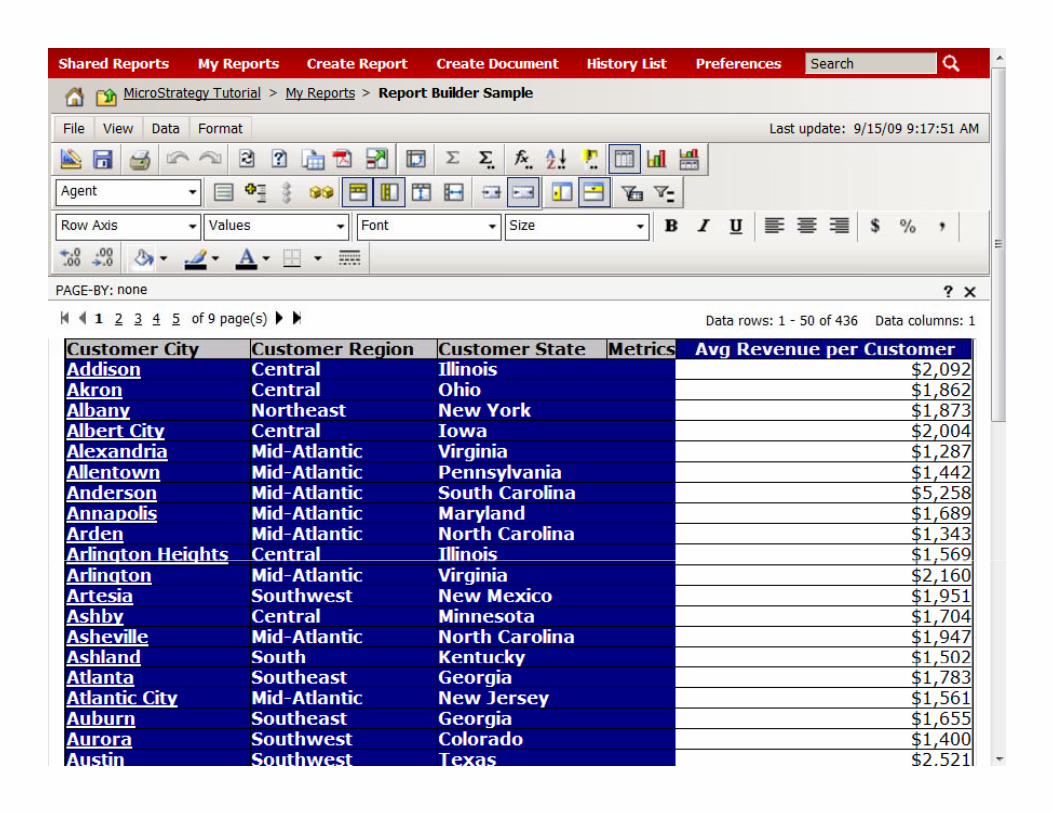
MicroStrategy BI Interface Create a ReportChoose Template, Builder, or Wizard
gyChoose Template, Builder, or WizardDrag and drop report elements
Customer Analysis Template
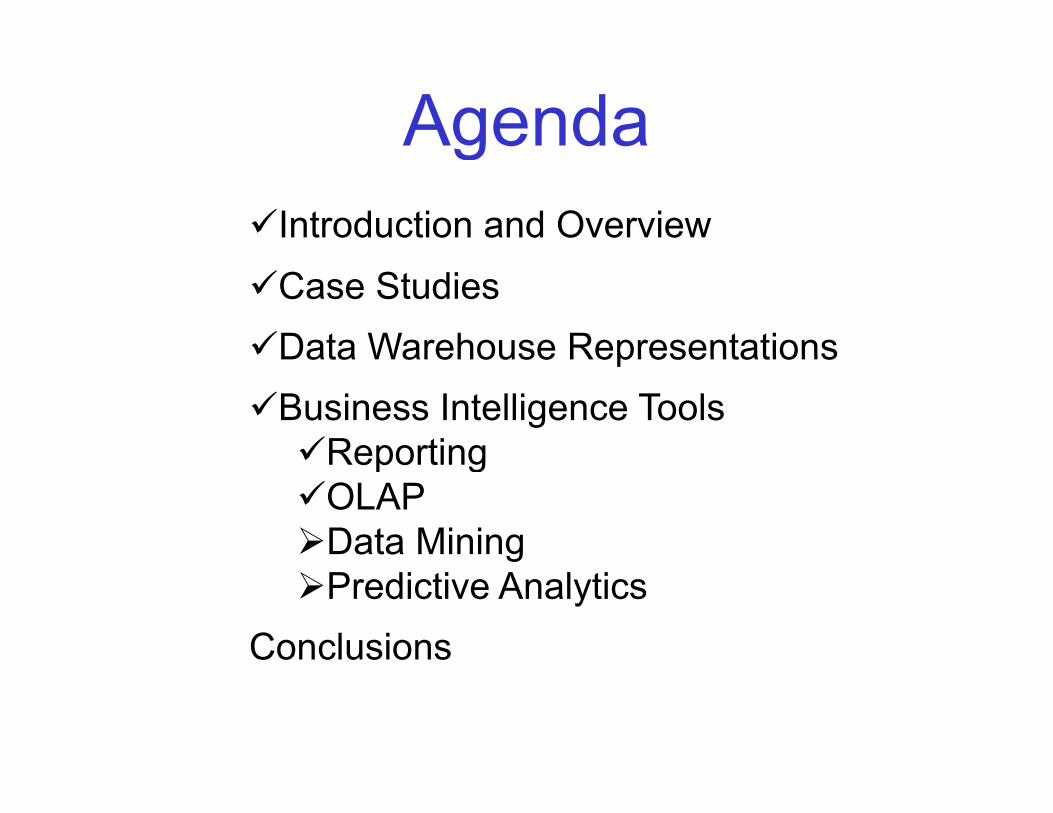
AgendagIntroduction and OverviewCase StudiesData Warehouse RepresentationsData Warehouse RepresentationsBusiness Intelligence Tools
ReportingReportingOLAPData MininggPredictive Analytics
Conclusions
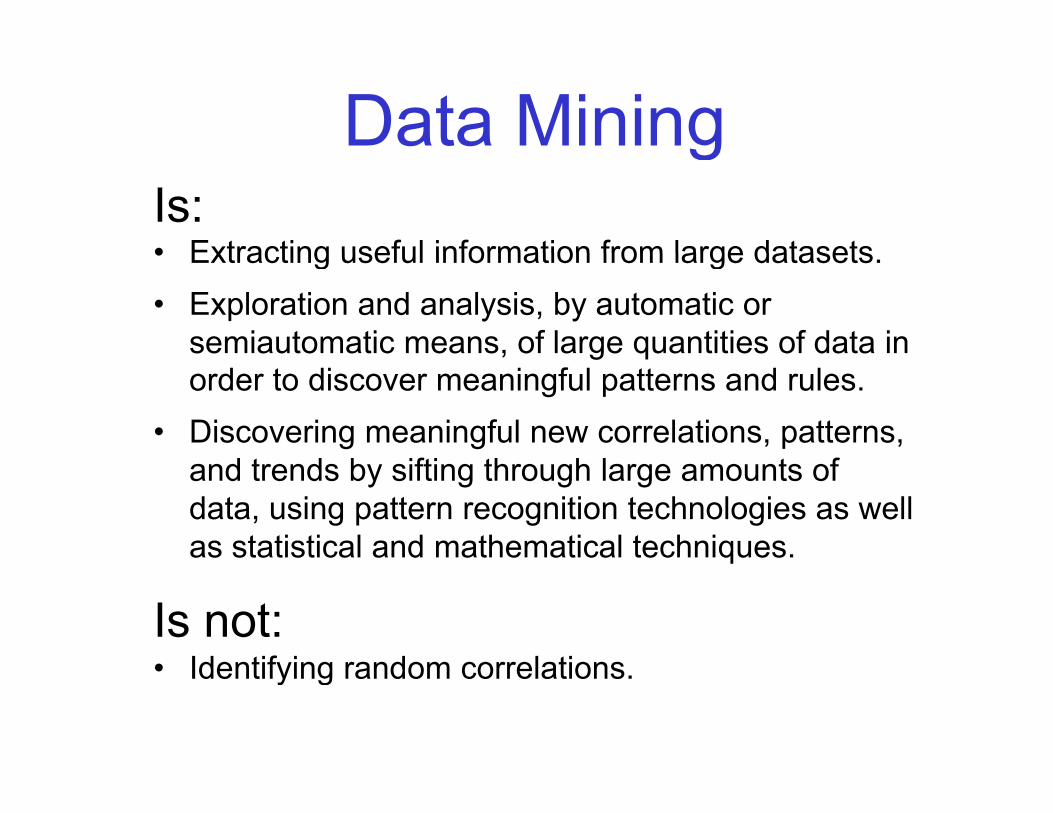
Data MininggIs:• Extracting useful information from large datasets• Extracting useful information from large datasets.• Exploration and analysis, by automatic or
semiautomatic means, of large quantities of data in , g qorder to discover meaningful patterns and rules.
• Discovering meaningful new correlations, patterns, d d b if i h h l fand trends by sifting through large amounts of
data, using pattern recognition technologies as well as statistical and mathematical techniques.q
Is not:Identifying random correlations• Identifying random correlations.
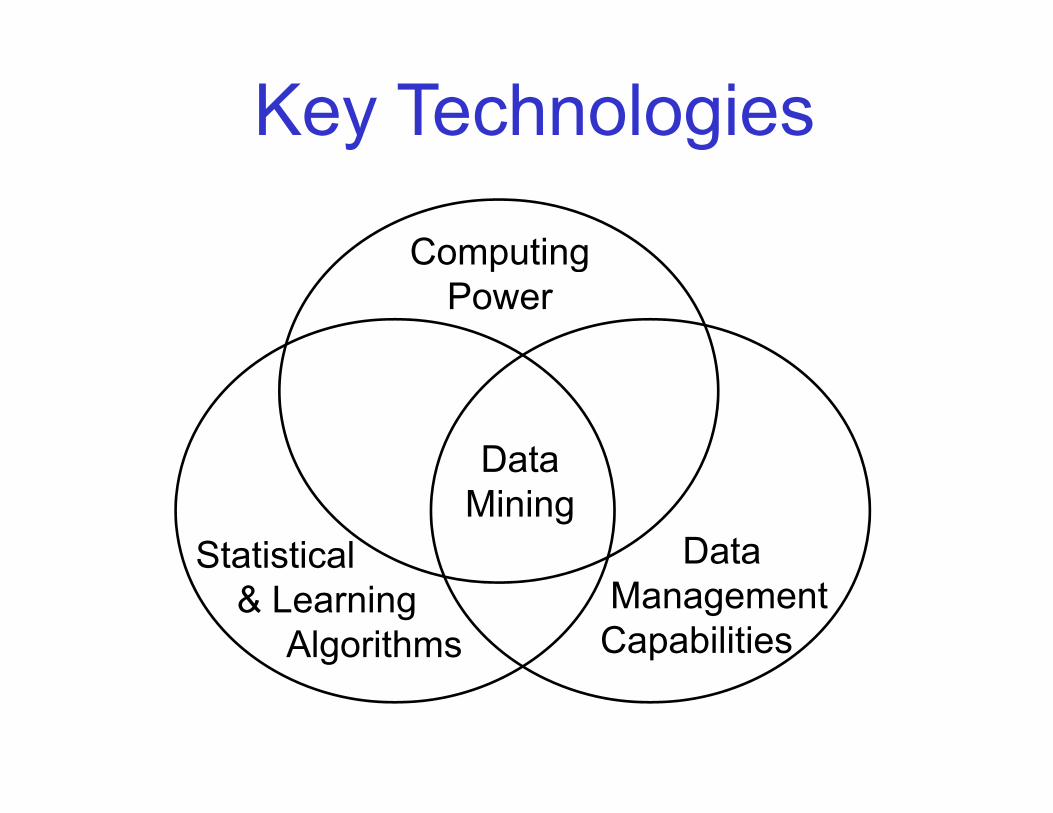
Key Technologies
ComputingComputingPower
DataDataMining
Statistical DataStatistical& Learning
Algorithms
DataManagementCapabilitiesg
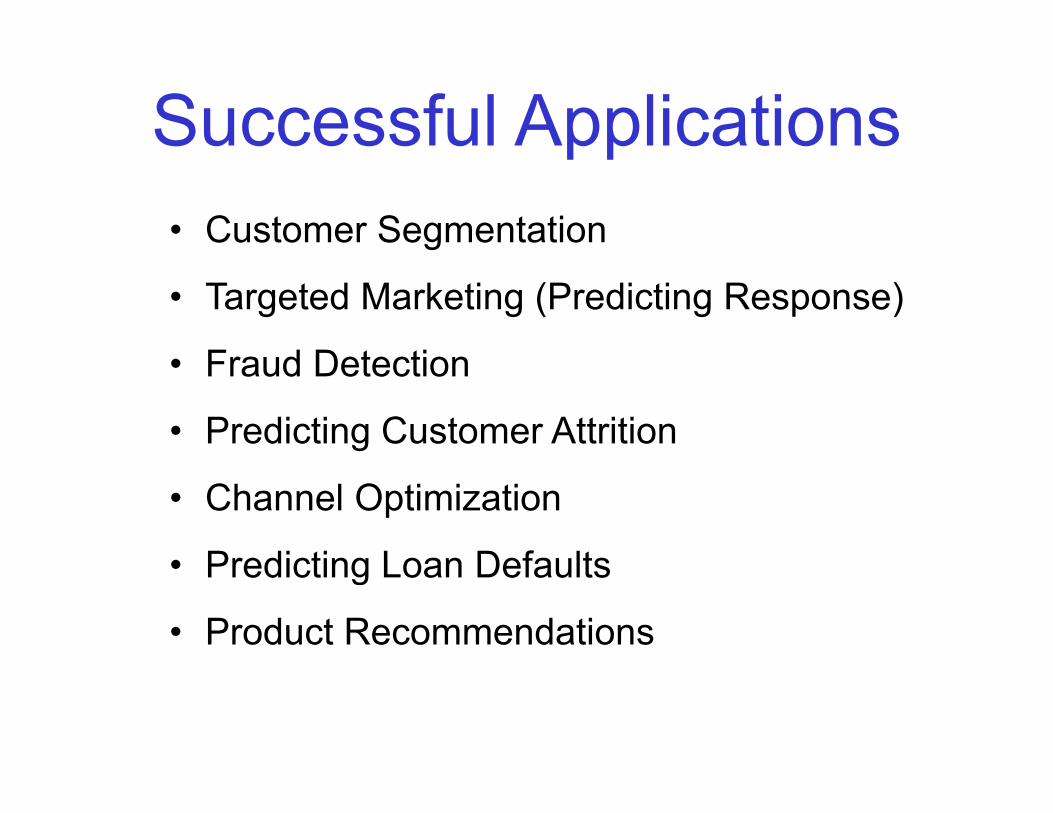
Successful Applicationspp• Customer Segmentation
• Targeted Marketing (Predicting Response)
F d D t ti• Fraud Detection
• Predicting Customer Attrition
• Channel Optimization
• Predicting Loan Defaults• Predicting Loan Defaults
• Product Recommendations
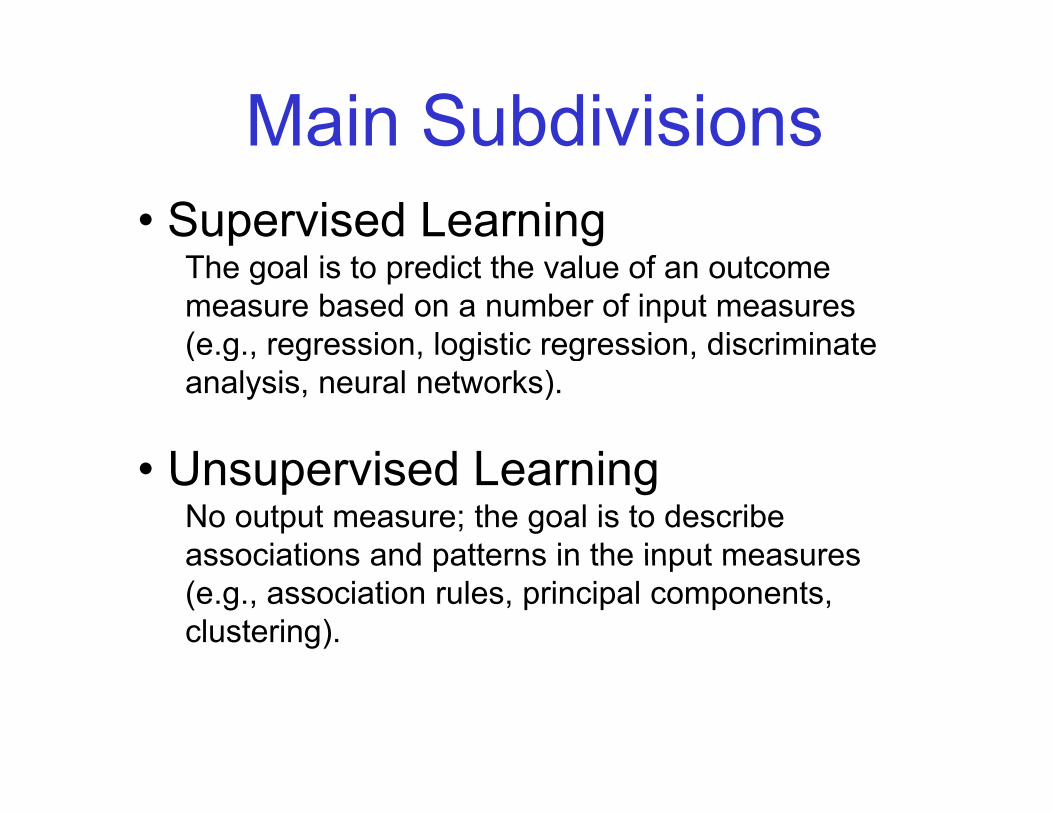
Main Subdivisions• Supervised Learning
The goal is to predict the value of an outcome measure based on a number of input measures (e.g., regression, logistic regression, discriminate ( g , g , g g ,analysis, neural networks).
U i d L i• Unsupervised LearningNo output measure; the goal is to describe associations and patterns in the input measuresassociations and patterns in the input measures (e.g., association rules, principal components, clustering).
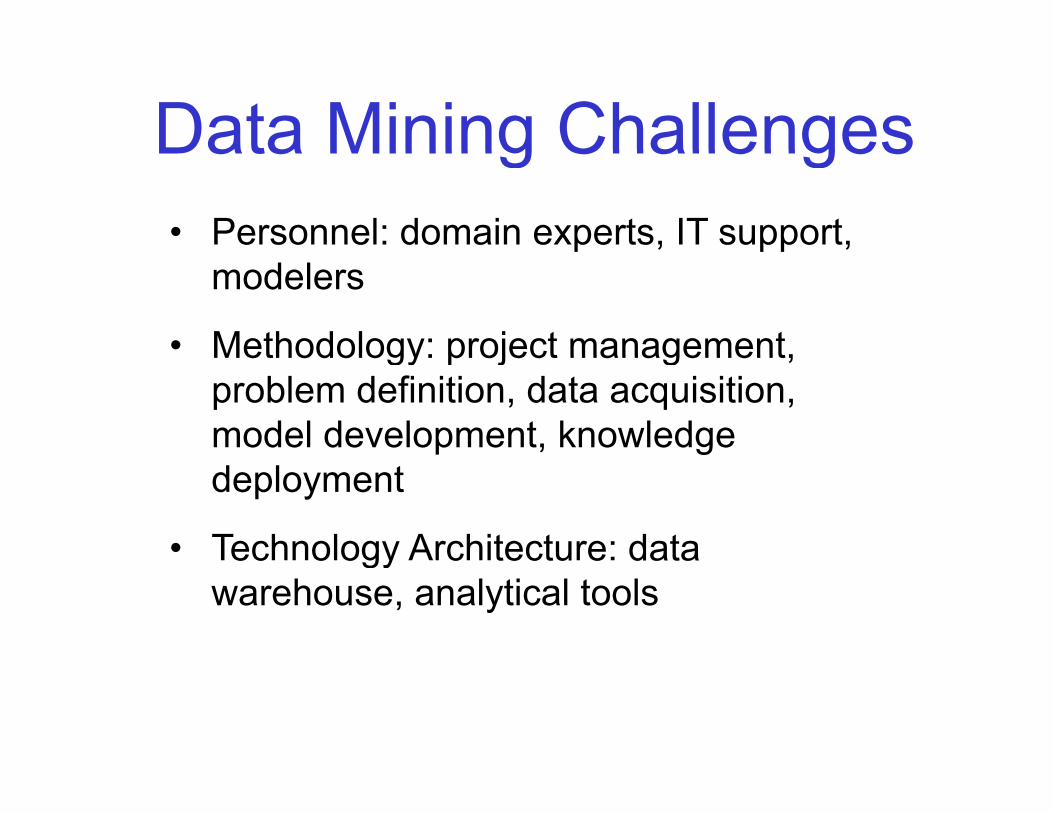
Data Mining ChallengesData Mining Challenges• Personnel: domain experts, IT support,
modelers
• Methodology: project management,Methodology: project management, problem definition, data acquisition, model development, knowledge deployment
• Technology Architecture: data ec o ogy c tectu e datawarehouse, analytical tools
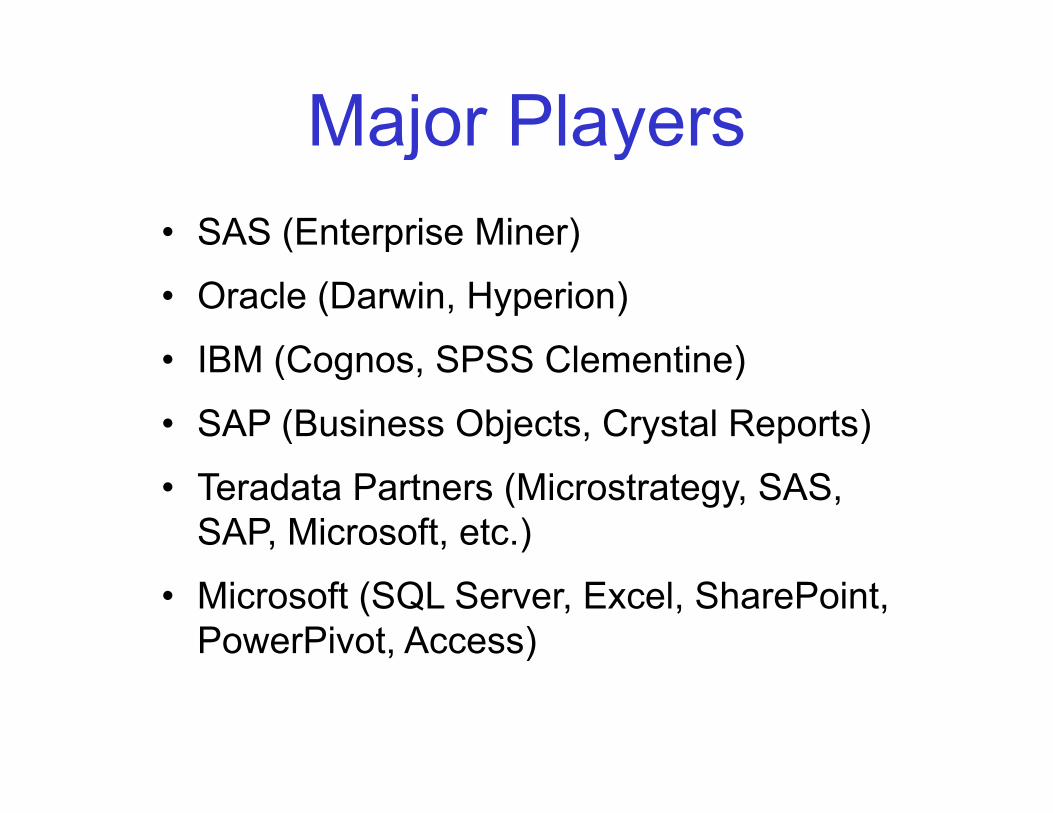
Major Playersj y• SAS (Enterprise Miner)
• Oracle (Darwin, Hyperion)
• IBM (Cognos SPSS Clementine)• IBM (Cognos, SPSS Clementine)
• SAP (Business Objects, Crystal Reports)
• Teradata Partners (Microstrategy, SAS, SAP, Microsoft, etc.)
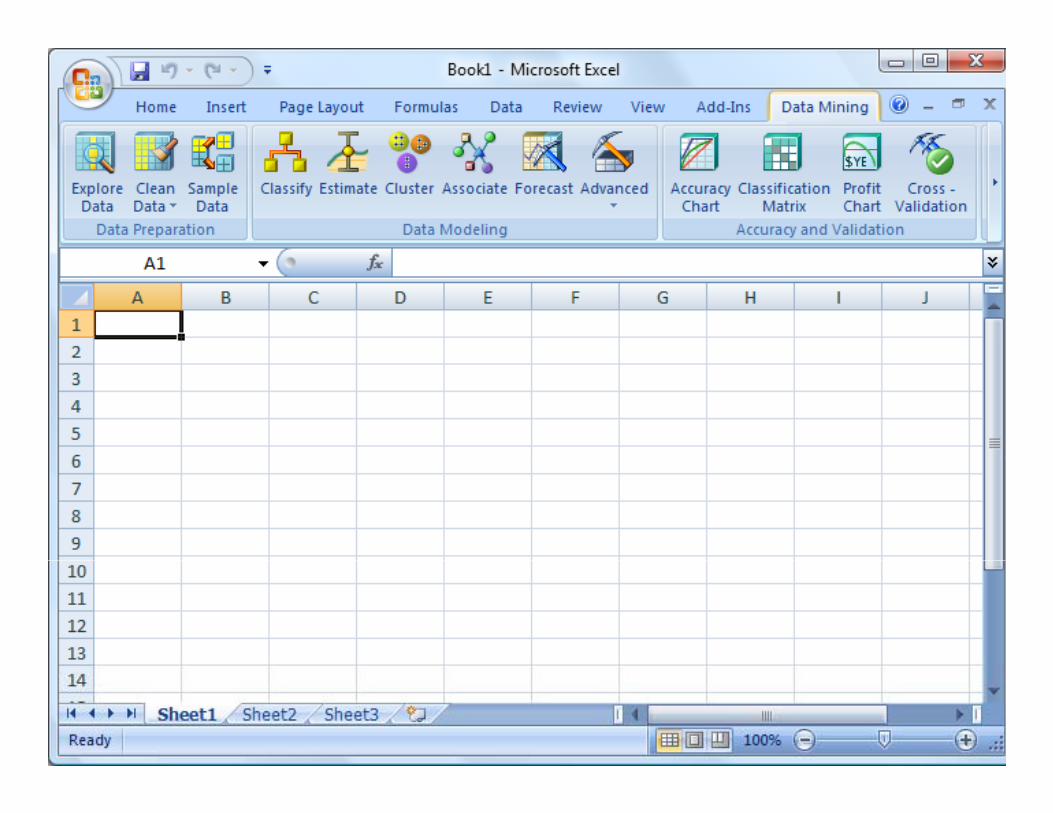
• Microsoft (SQL Server, Excel, SharePoint, PowerPivot, Access)
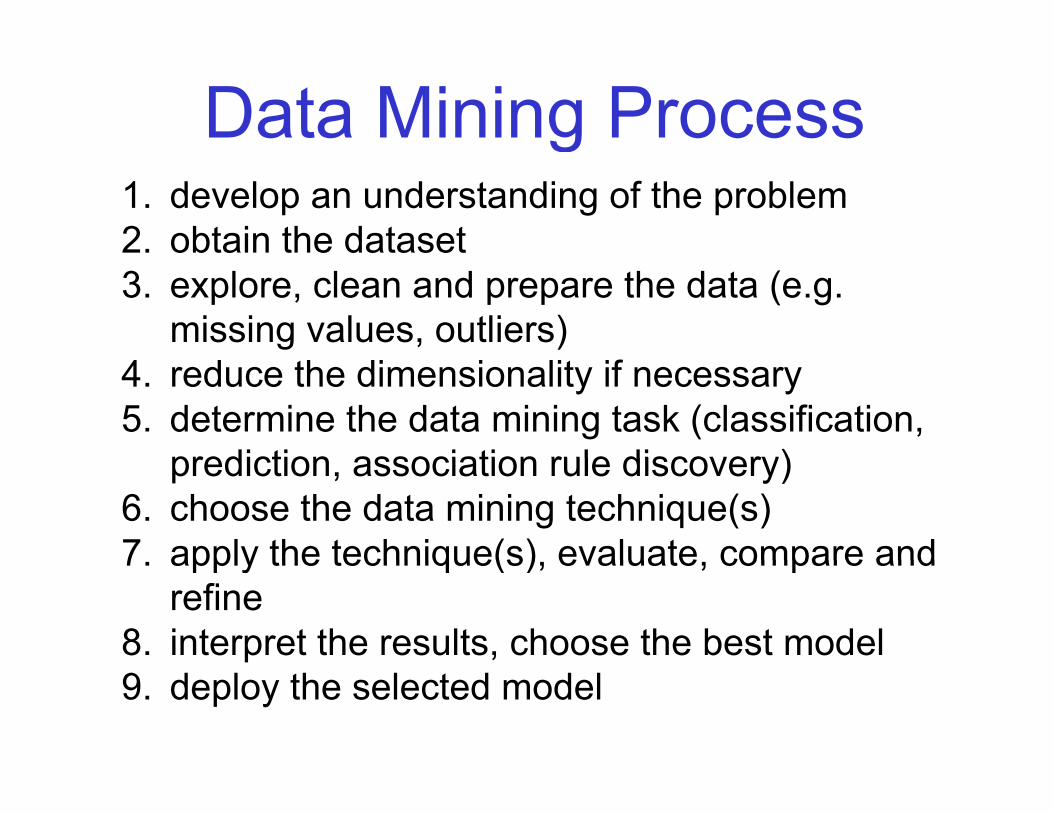
Data Mining Process1. develop an understanding of the problem2. obtain the dataset
gob a e da ase
3. explore, clean and prepare the data (e.g. missing values, outliers)
4. reduce the dimensionality if necessary5. determine the data mining task (classification,
prediction association rule discovery)prediction, association rule discovery)6. choose the data mining technique(s)7 apply the technique(s) evaluate compare and7. apply the technique(s), evaluate, compare and
refine8. interpret the results, choose the best model 9. deploy the selected model

Data Mining Isn't a Good Bet For Stock-Market Predictions
"… data-mined numbers can be so irresistible that they are one of the leading causes of the evaporation of money [in the stock market] "evaporation of money [in the stock-market].
Over a 13-year period annual butter production in B l d h " l i d" 75% f th i ti i thBangladesh "explained" 75% of the variation in the annual returns of the Standard & Poor's 500-stock index Tossing in U S cheese production and theindex. Tossing in U.S. cheese production and the total population of sheep in both Bangladesh and the U.S. improved the "explanation" to 99%.
Wall Street Journal, August 8, 2009
p p
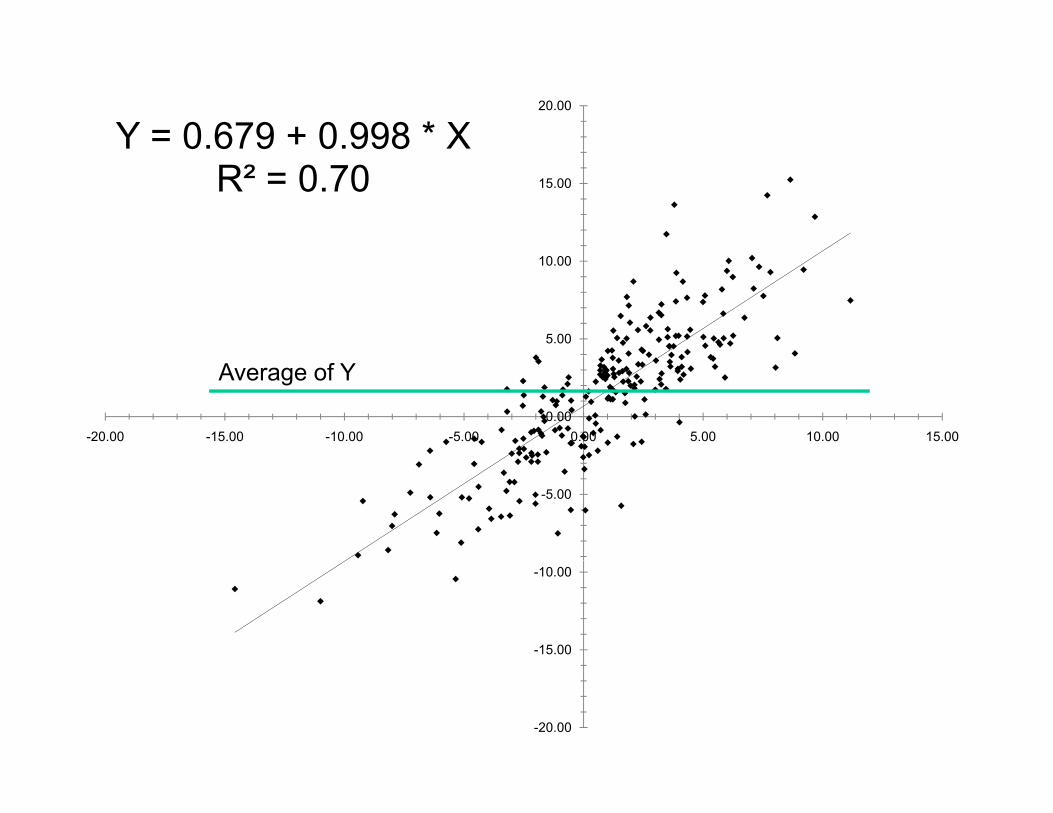
Y = 0.679 + 0.998 * X 20.00
R² = 0.70 15.00
5.00
10.00
0.00-20.00 -15.00 -10.00 -5.00 0.00 5.00 10.00 15.00
Average of Y
-5.00
-15.00
-10.00
-20.00
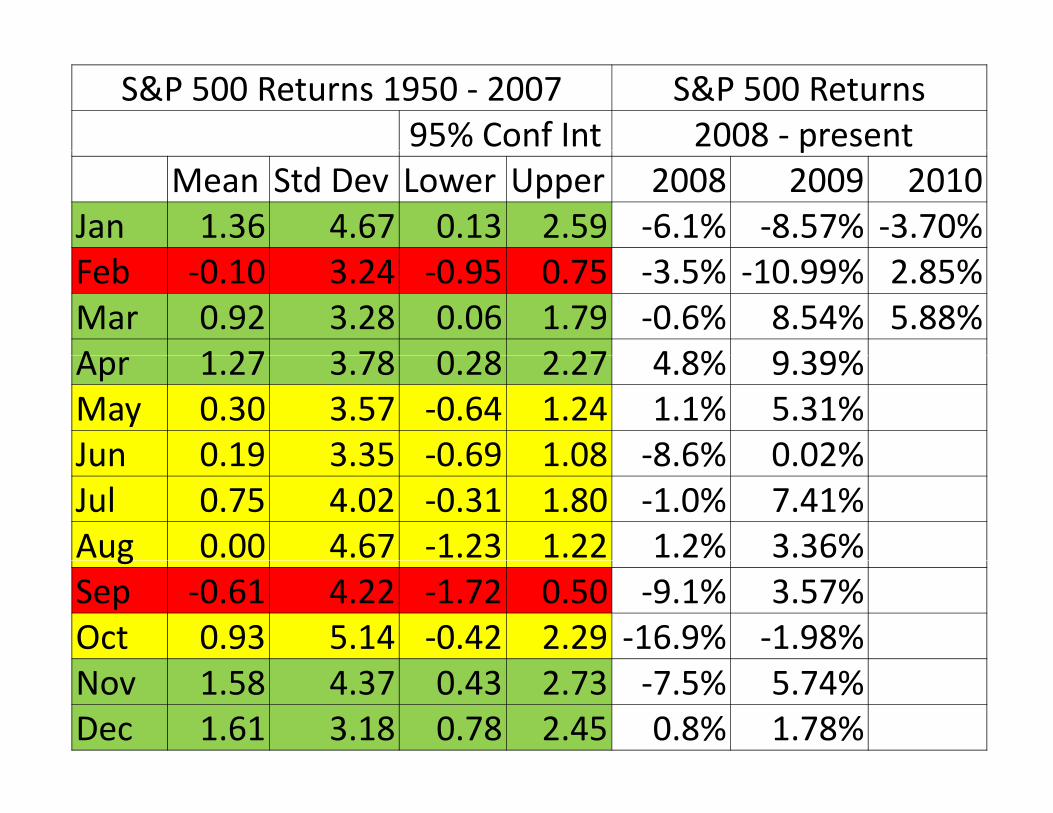
S&P 500 Returns 1950 ‐ 2007 S&P 500 Returns95% Conf Int 2008 ‐ presentp
Mean Std Dev Lower Upper 2008 2009 2010Jan 1.36 4.67 0.13 2.59 ‐6.1% ‐8.57% ‐3.70%Feb ‐0.10 3.24 ‐0.95 0.75 ‐3.5% ‐10.99% 2.85%Mar 0.92 3.28 0.06 1.79 ‐0.6% 8.54% 5.88%A 1 27 3 78 0 28 2 27 4 8% 9 39%Apr 1.27 3.78 0.28 2.27 4.8% 9.39%May 0.30 3.57 ‐0.64 1.24 1.1% 5.31%Jun 0 19 3 35 ‐0 69 1 08 ‐8 6% 0 02%Jun 0.19 3.35 ‐0.69 1.08 ‐8.6% 0.02%Jul 0.75 4.02 ‐0.31 1.80 ‐1.0% 7.41%Aug 0.00 4.67 ‐1.23 1.22 1.2% 3.36%gSep ‐0.61 4.22 ‐1.72 0.50 ‐9.1% 3.57%Oct 0.93 5.14 ‐0.42 2.29 ‐16.9% ‐1.98%Nov 1.58 4.37 0.43 2.73 ‐7.5% 5.74%Dec 1.61 3.18 0.78 2.45 0.8% 1.78%

A $1000 Investment2008 2009 2010 2008 2009 2010
Jan $939 $833 $1,026 $939 $641 $904Feb $939 $833 $1,026 $939 $641 $904Mar $933 $905 $1,086 $933 $696 $957A $978 $990 $978 $761Apr $978 $990 $978 $761May $978 $990 $988 $801Jun $978 $990 $903 $802Jun $978 $990 $903 $802Jul $978 $990 $894 $861Aug $978 $990 $905 $890Aug $978 $990 $905 $890Sep $978 $990 $905 $890Oct $978 $990 $752 $872Nov $904 $1,046 $695 $922Dec $912 $1,065 $701 $939
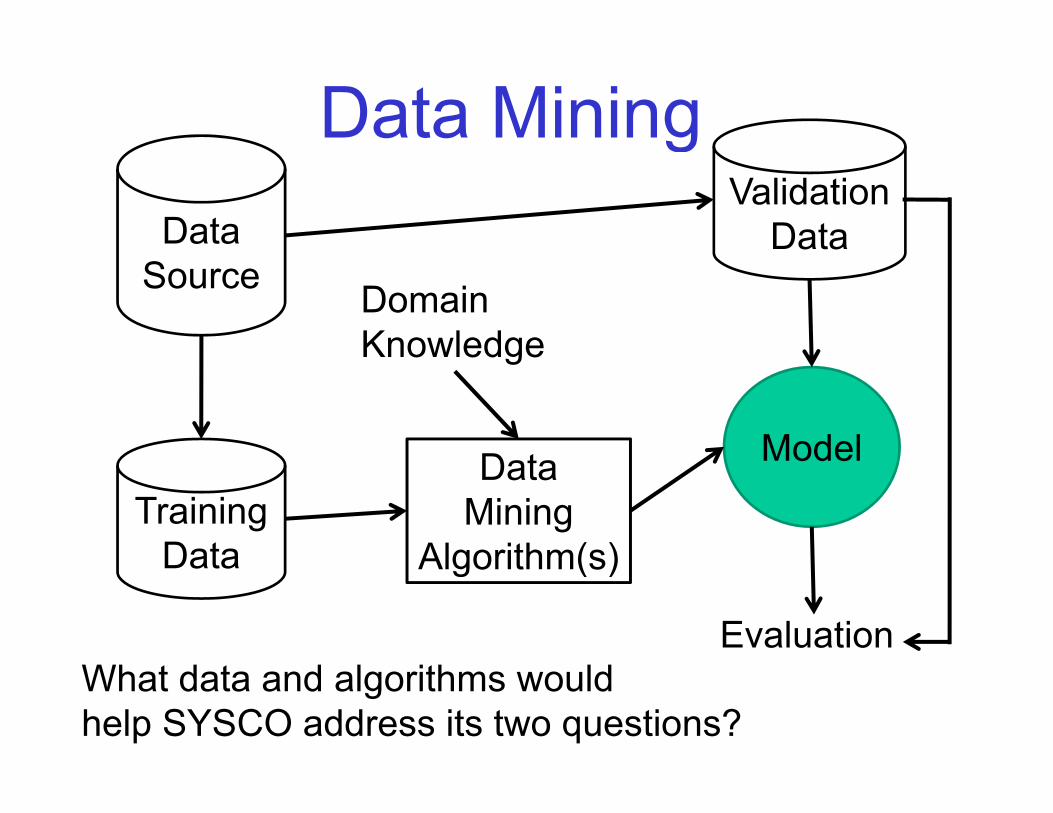
Data MininggData
ValidationData
Source Domain Knowledge
D t Model
Knowledge
TrainingData
DataMining
Algorithm(s)
Model
Evaluation
Data Algorithm(s)
What data and algorithms would help SYSCO address its two questions?
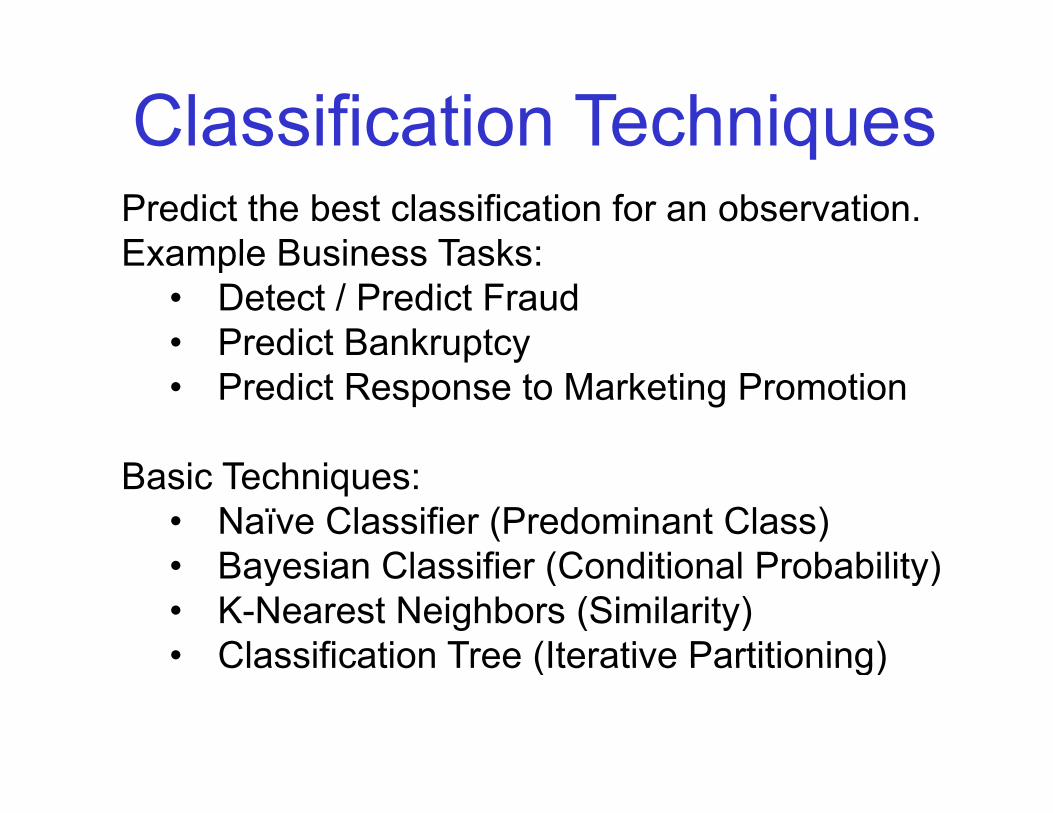
Classification TechniquesPredict the best classification for an observation.Example Business Tasks:
q
Example Business Tasks:• Detect / Predict Fraud• Predict Bankruptcyp y• Predict Response to Marketing Promotion
Basic Techniques:• Naïve Classifier (Predominant Class)
Bayesian Classifier (Conditional Probability)• Bayesian Classifier (Conditional Probability)• K-Nearest Neighbors (Similarity)• Classification Tree (Iterative Partitioning)Classification Tree (Iterative Partitioning)
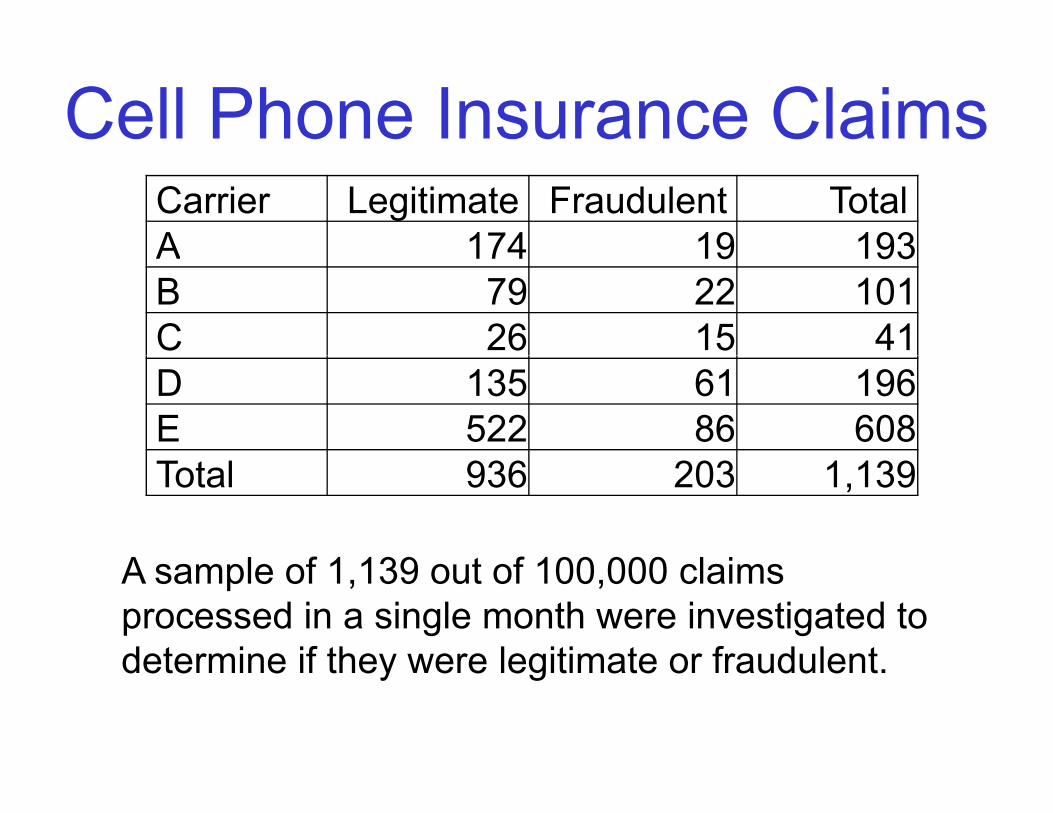
Cell Phone Insurance ClaimsCarrier Legitimate Fraudulent TotalA 174 19 193A 174 19 193B 79 22 101C 26 15 41D 135 61 196E 522 86 608Total 936 203 1,139
A l f 1 139 t f 100 000 l iA sample of 1,139 out of 100,000 claims processed in a single month were investigated to determine if they were legitimate or fraudulentdetermine if they were legitimate or fraudulent.
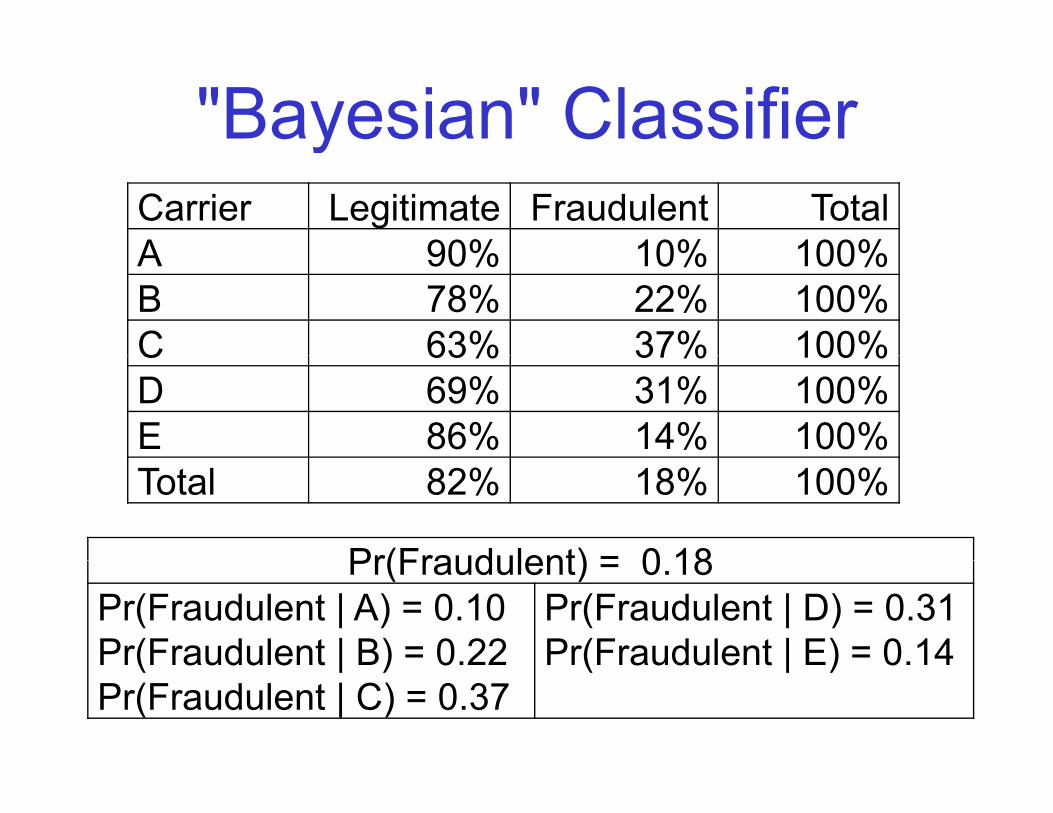
"Bayesian" ClassifieryCarrier Legitimate Fraudulent TotalA 90% 10% 100%A 90% 10% 100%B 78% 22% 100%C 63% 37% 100%C 63% 37% 100%D 69% 31% 100%E 86% 14% 100%Total 82% 18% 100%
Pr(Fraudulent) = 0 18Pr(Fraudulent) = 0.18Pr(Fraudulent | A) = 0.10Pr(Fraudulent | B) = 0.22
Pr(Fraudulent | D) = 0.31Pr(Fraudulent | E) = 0.14Pr(Fraudulent | B) 0.22
Pr(Fraudulent | C) = 0.37Pr(Fraudulent | E) 0.14
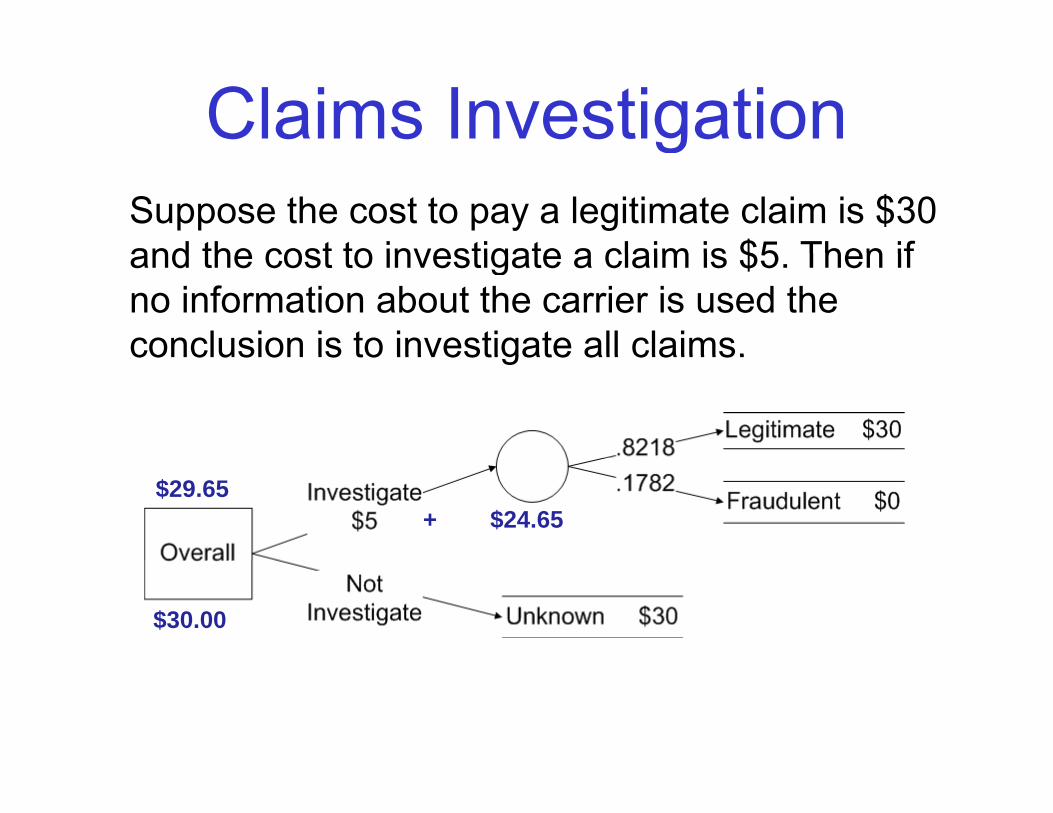
Claims InvestigationgSuppose the cost to pay a legitimate claim is $30 and the cost to investigate a claim is $5 Then ifand the cost to investigate a claim is $5. Then if no information about the carrier is used the conclusion is to investigate all claims.conclusion is to investigate all claims.
+ $24.65$29.65
$30.00
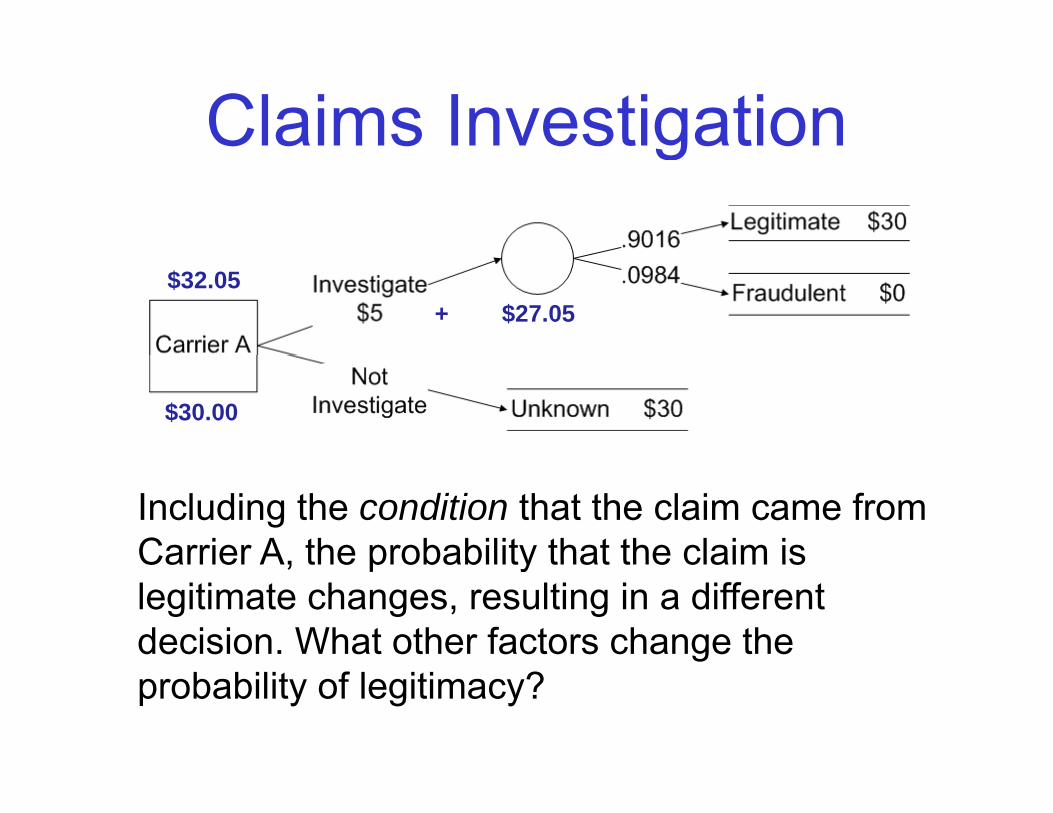
Claims Investigationg
+ $27.05$32.05
$30.00
Including the condition that the claim came from Carrier A the probability that the claim isCarrier A, the probability that the claim is legitimate changes, resulting in a different decision. What other factors change the probability of legitimacy?
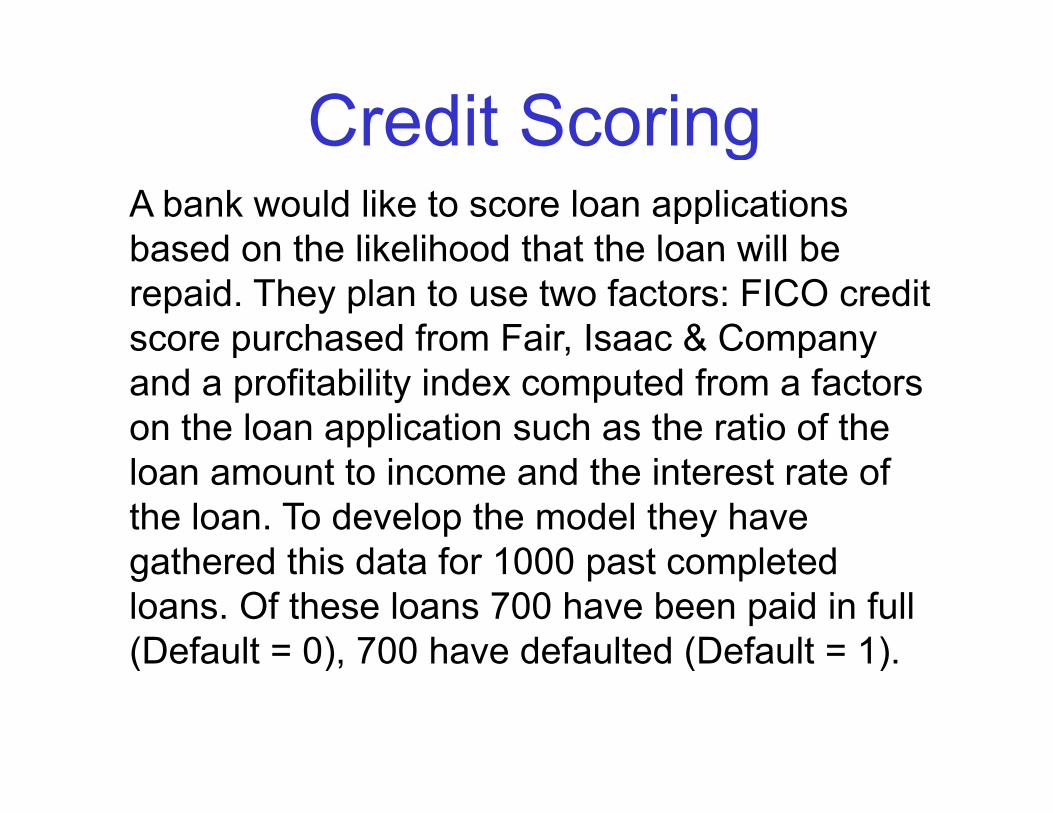
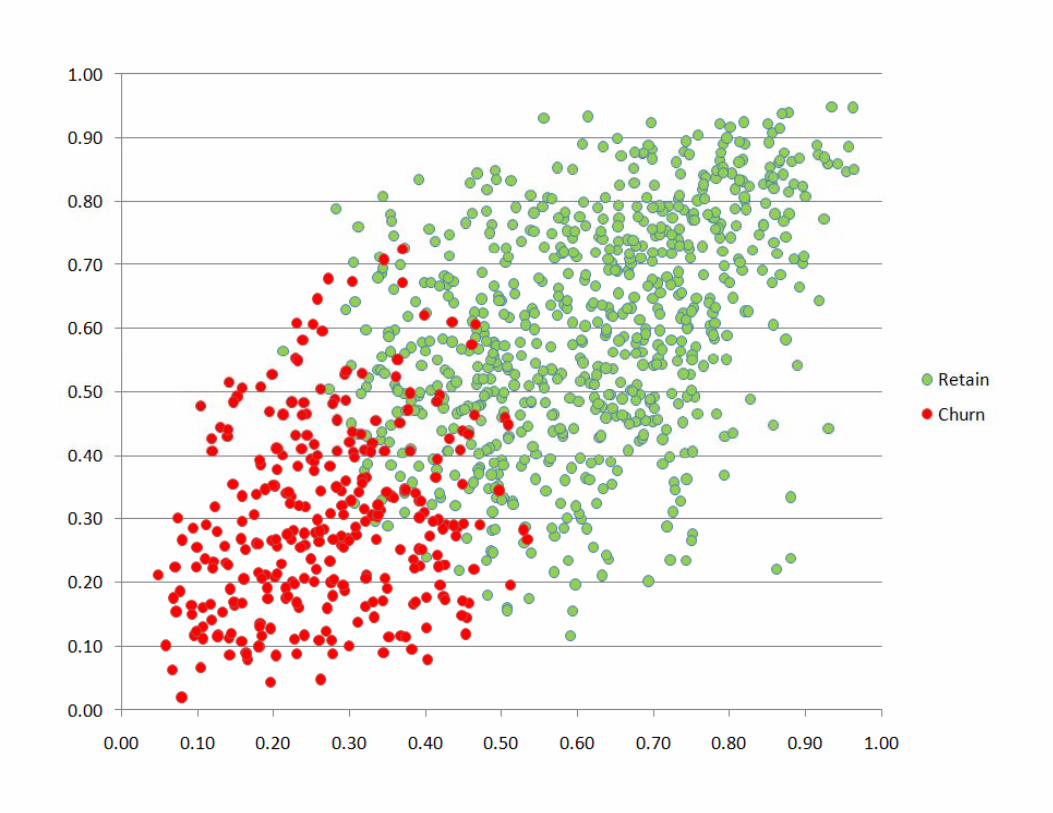
Credit ScoringA bank would like to score loan applications based on the likelihood that the loan will be
gbased on the likelihood that the loan will be repaid. They plan to use two factors: FICO credit score purchased from Fair, Isaac & Company p , p yand a profitability index computed from a factors on the loan application such as the ratio of the l i d h i floan amount to income and the interest rate of the loan. To develop the model they have gathered this data for 1000 past completedgathered this data for 1000 past completed loans. Of these loans 700 have been paid in full (Default = 0), 700 have defaulted (Default = 1).(Default 0), 700 have defaulted (Default 1).
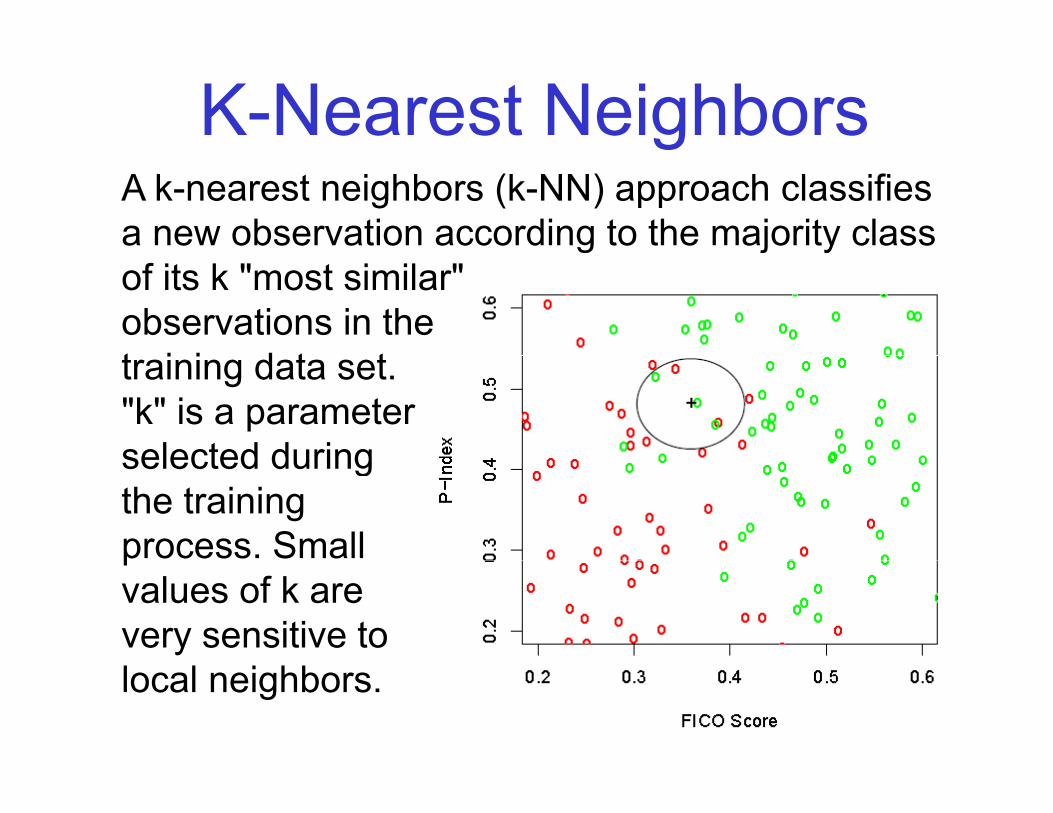
K-Nearest NeighborsA k-nearest neighbors (k-NN) approach classifies a new observation according to the majority class g j yof its k "most similar" observations in the t i i d t ttraining data set. "k" is a parameter selected duringselected during the training process. Smallpvalues of k are very sensitive to local neighbors.
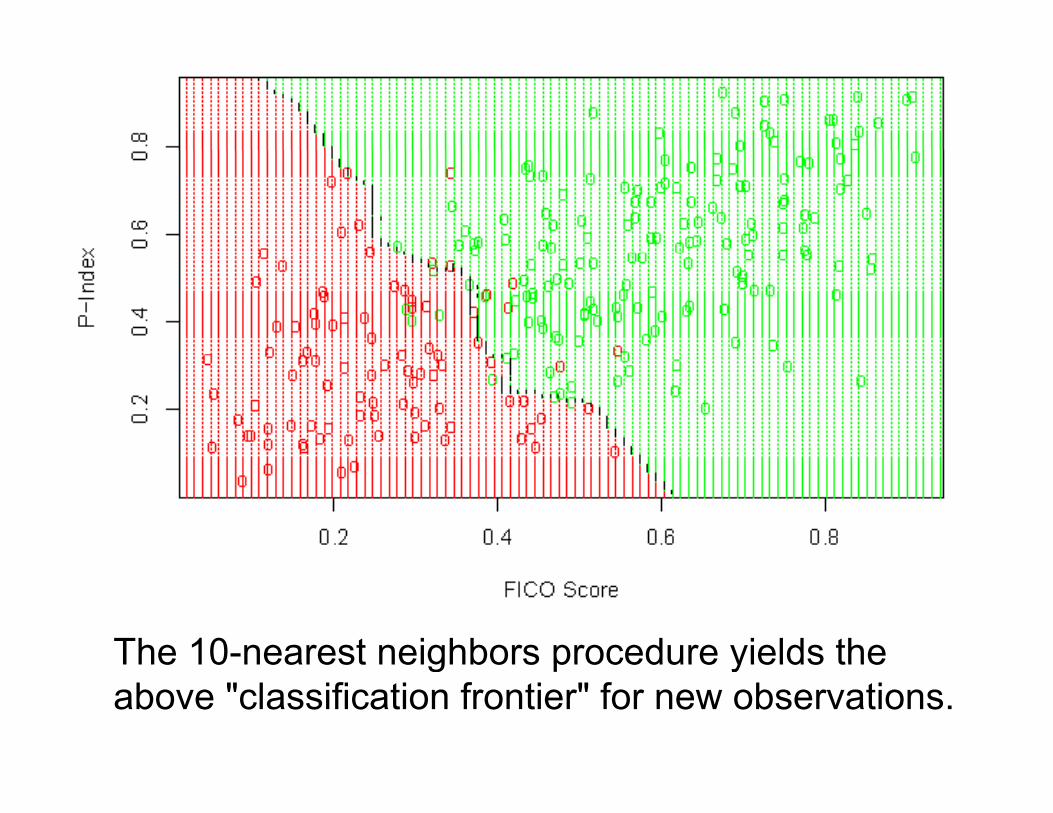
The 10-nearest neighbors procedure yields theThe 10 nearest neighbors procedure yields the above "classification frontier" for new observations.
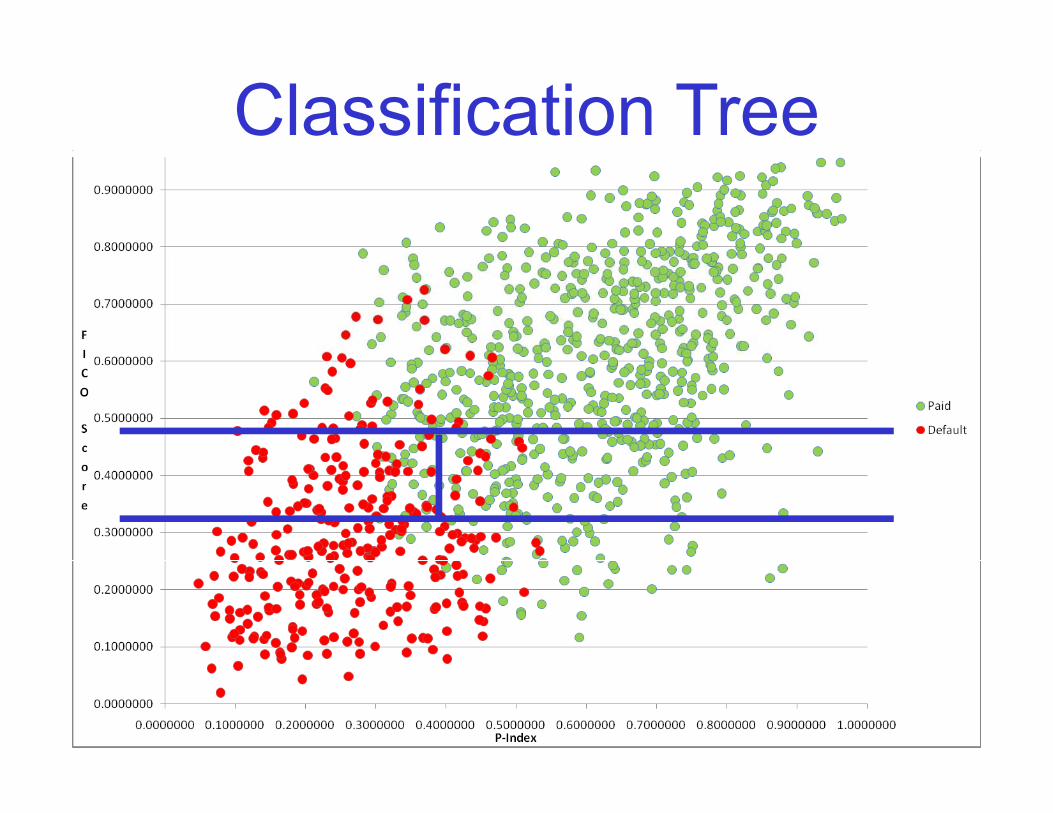
Classification Tree
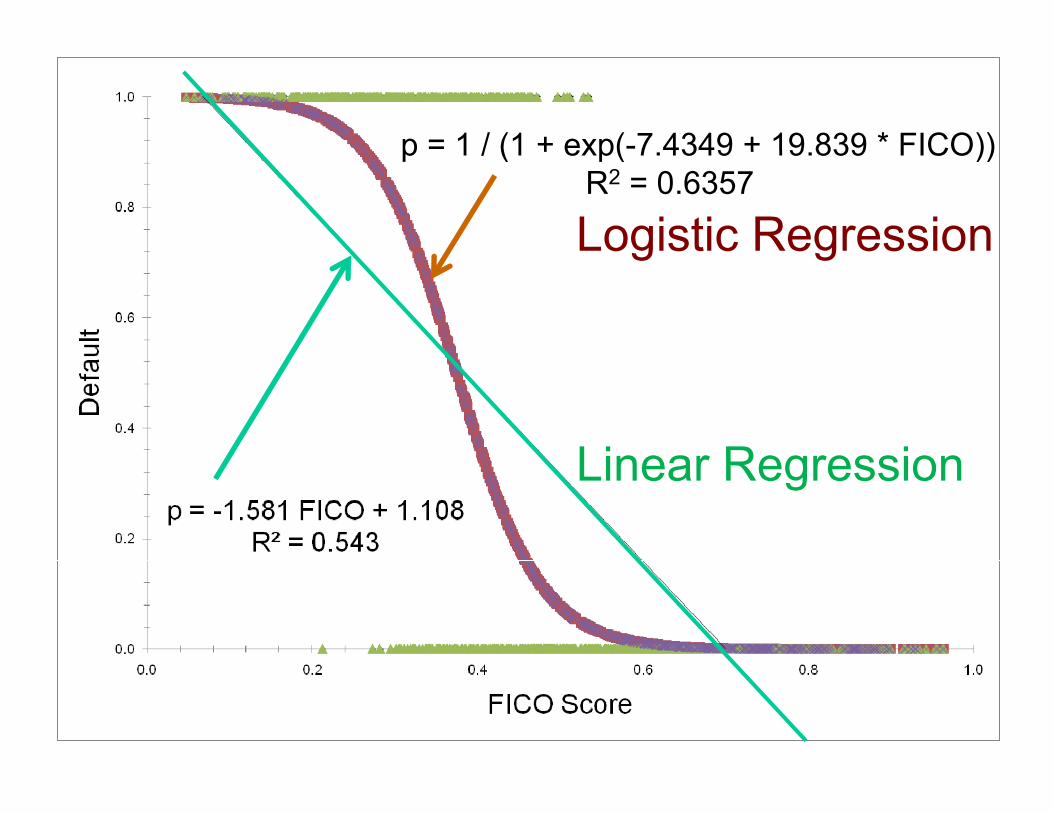
p = 1 / (1 + exp(-7 4349 + 19 839 * FICO))p 1 / (1 + exp( 7.4349 + 19.839 FICO))R2 = 0.6357
Logistic Regressiong g
Linear RegressionLinear Regression
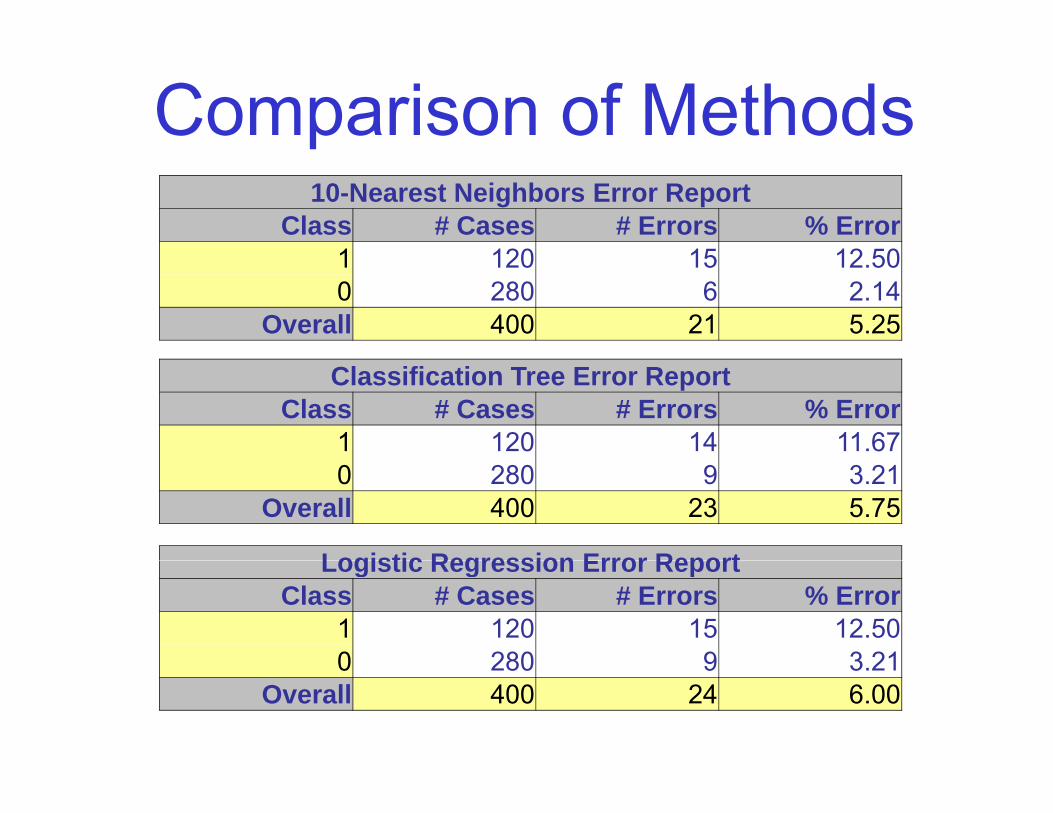
Comparison of Methods10-Nearest Neighbors Error Report
Class # Cases # Errors % Error1 120 15 12 501 120 15 12.500 280 6 2.14
Overall 400 21 5.25
Classification Tree Error ReportClass # Cases # Errors % Error
1 120 14 11.67
Logistic Regression Error Report
0 280 9 3.21Overall 400 23 5.75
Logistic Regression Error ReportClass # Cases # Errors % Error
1 120 15 12.500 280 9 3 210 280 9 3.21
Overall 400 24 6.00
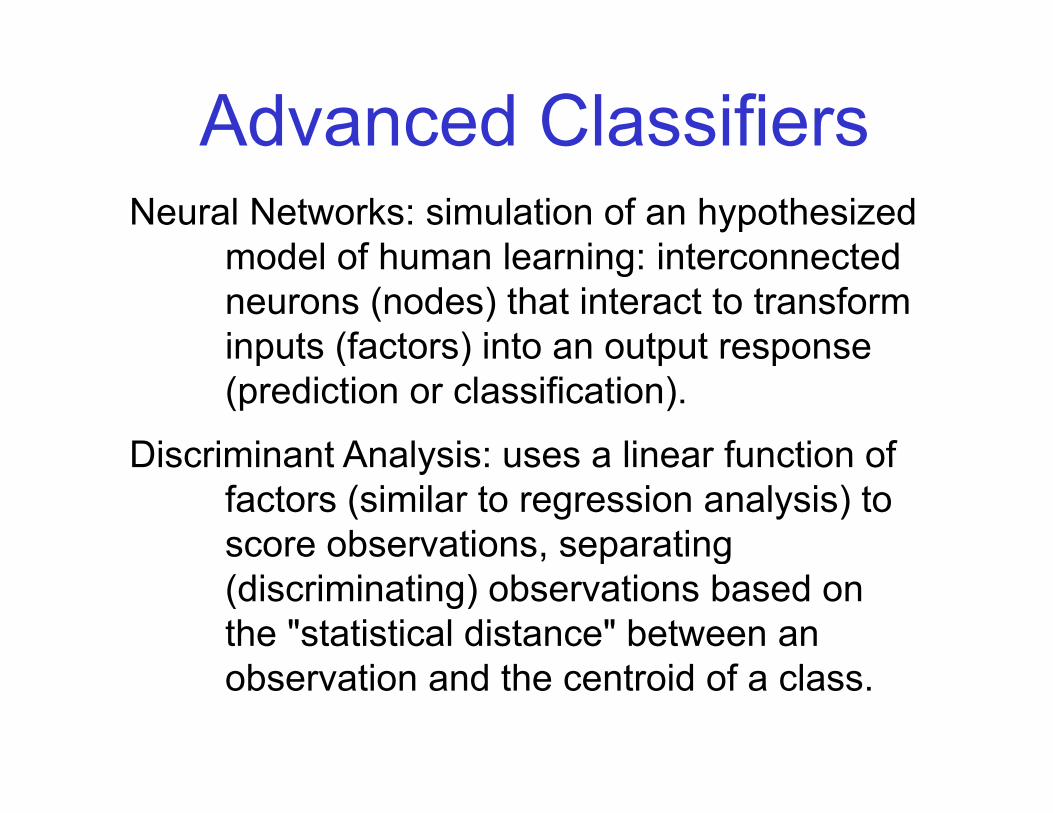
Advanced ClassifiersNeural Networks: simulation of an hypothesized
model of human learning: interconnectedmodel of human learning: interconnected neurons (nodes) that interact to transform inputs (factors) into an output responseinputs (factors) into an output response (prediction or classification).
Discriminant Analysis: uses a linear function ofDiscriminant Analysis: uses a linear function of factors (similar to regression analysis) to score observations, separating , p g(discriminating) observations based on the "statistical distance" between an observation and the centroid of a class.
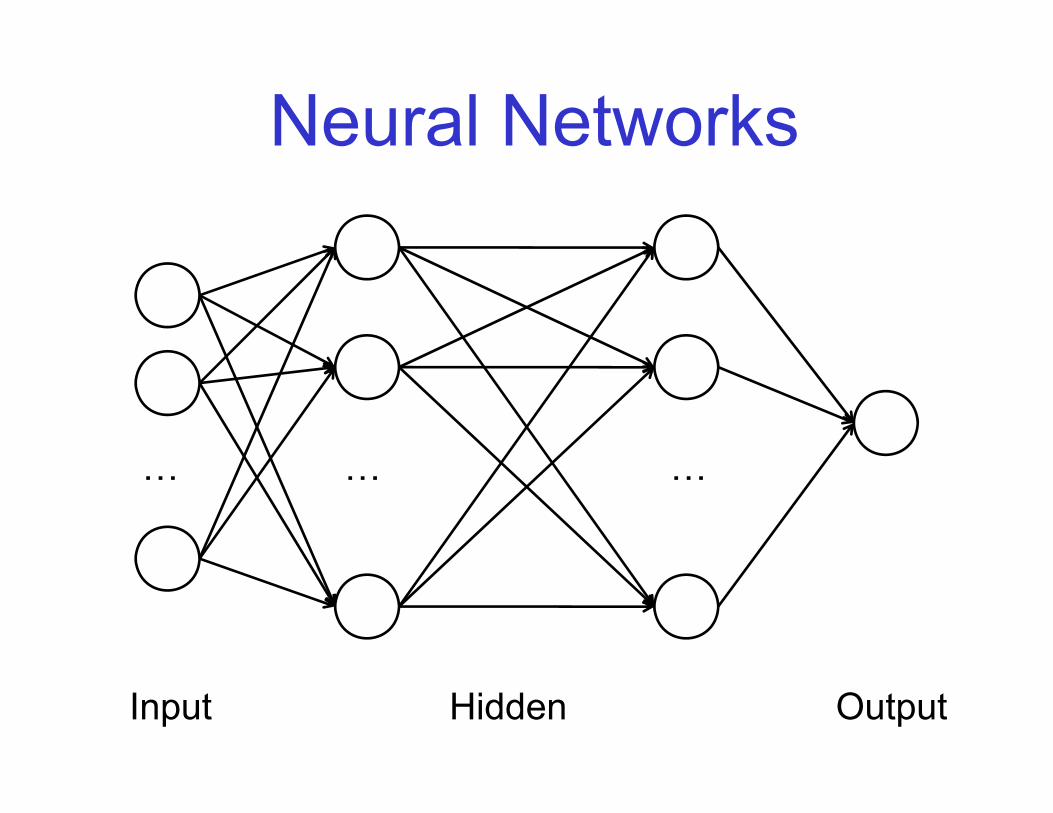
Neural Networks
… … …
Input Hidden Output
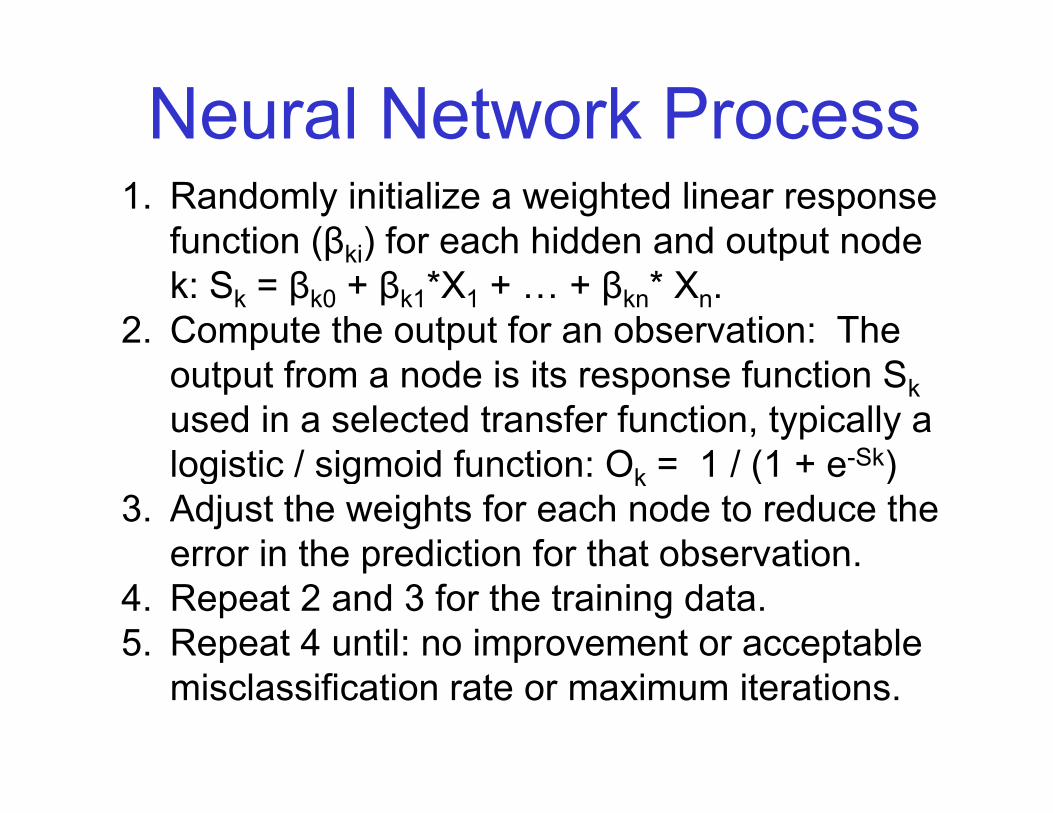
Neural Network Process 1. Randomly initialize a weighted linear response
function (βki) for each hidden and output nodefunction (βki) for each hidden and output node k: Sk = βk0 + βk1*X1 + … + βkn* Xn.
2. Compute the output for an observation: The output from a node is its response function Skused in a selected transfer function, typically a logistic / sigmoid function: O = 1 / (1 + e-Sk)logistic / sigmoid function: Ok = 1 / (1 + e-Sk)
3. Adjust the weights for each node to reduce the error in the prediction for that observationerror in the prediction for that observation.
4. Repeat 2 and 3 for the training data.5. Repeat 4 until: no improvement or acceptable
misclassification rate or maximum iterations.
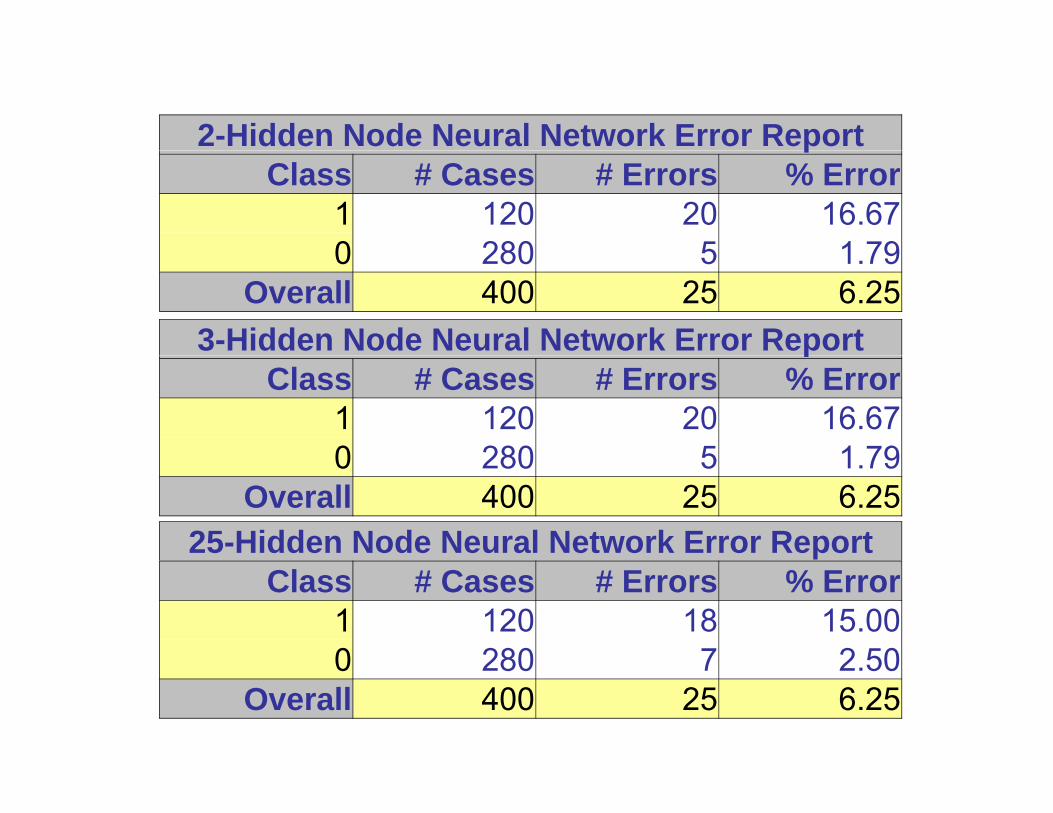
2-Hidden Node Neural Network Error ReportpClass # Cases # Errors % Error
1 120 20 16.670 280 5 1 790 280 5 1.79
Overall 400 25 6.253-Hidden Node Neural Network Error Reportp
Class # Cases # Errors % Error1 120 20 16.670 280 5 1 79
25-Hidden Node Neural Network Error Report
0 280 5 1.79Overall 400 25 6.25
Class # Cases # Errors % Error1 120 18 15.000 280 7 2 500 280 7 2.50
Overall 400 25 6.25
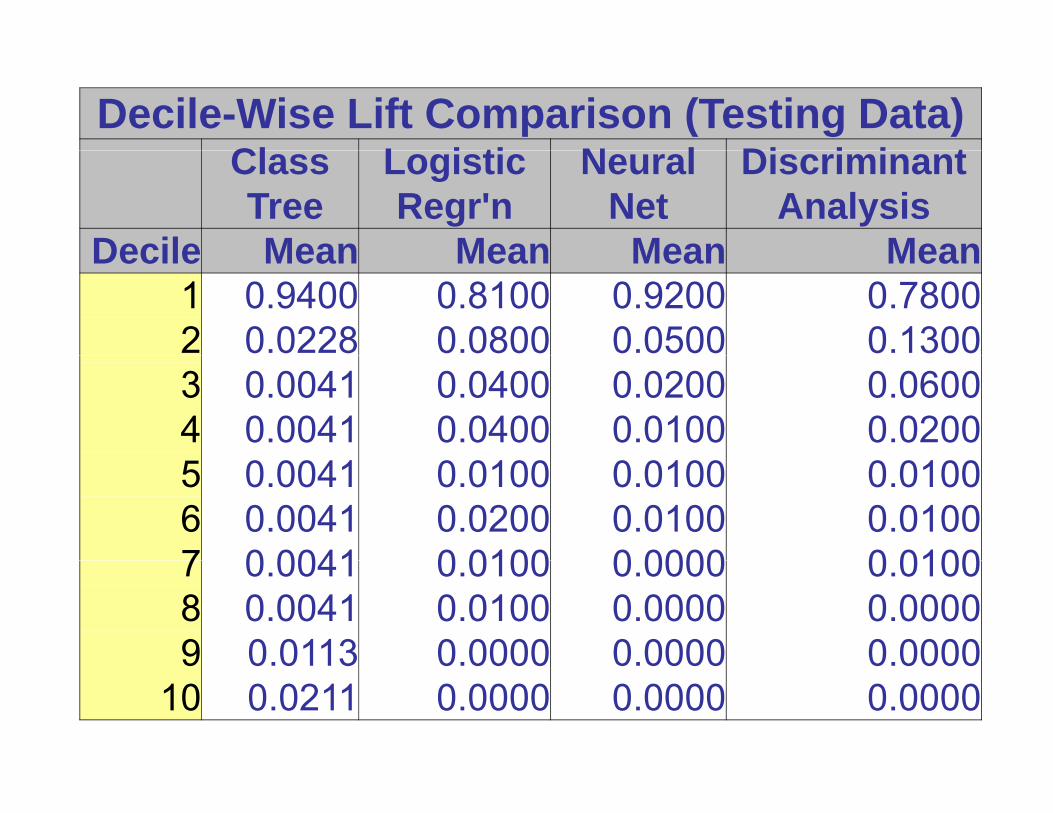
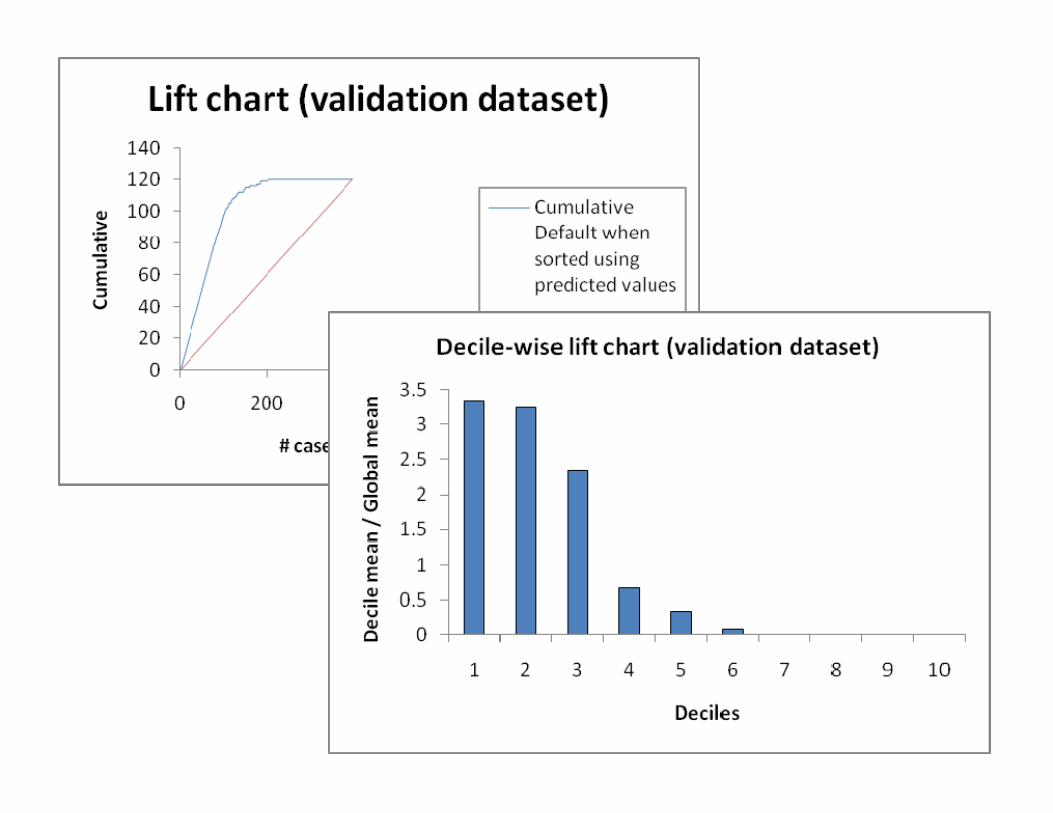
Decile-Wise Lift Comparison (Testing Data)Cl L i ti N l Di i i tClassTree
Logistic Regr'n
Neural Net
DiscriminantAnalysis
Decile Mean Mean Mean MeanDecile Mean Mean Mean Mean1 0.9400 0.8100 0.9200 0.78002 0.0228 0.0800 0.0500 0.13003 0.0041 0.0400 0.0200 0.06004 0.0041 0.0400 0.0100 0.02005 0.0041 0.0100 0.0100 0.01006 0.0041 0.0200 0.0100 0.01007 0 0041 0 0100 0 0000 0 01007 0.0041 0.0100 0.0000 0.01008 0.0041 0.0100 0.0000 0.00009 0.0113 0.0000 0.0000 0.00009 0.0113 0.0000 0.0000 0.0000
10 0.0211 0.0000 0.0000 0.0000
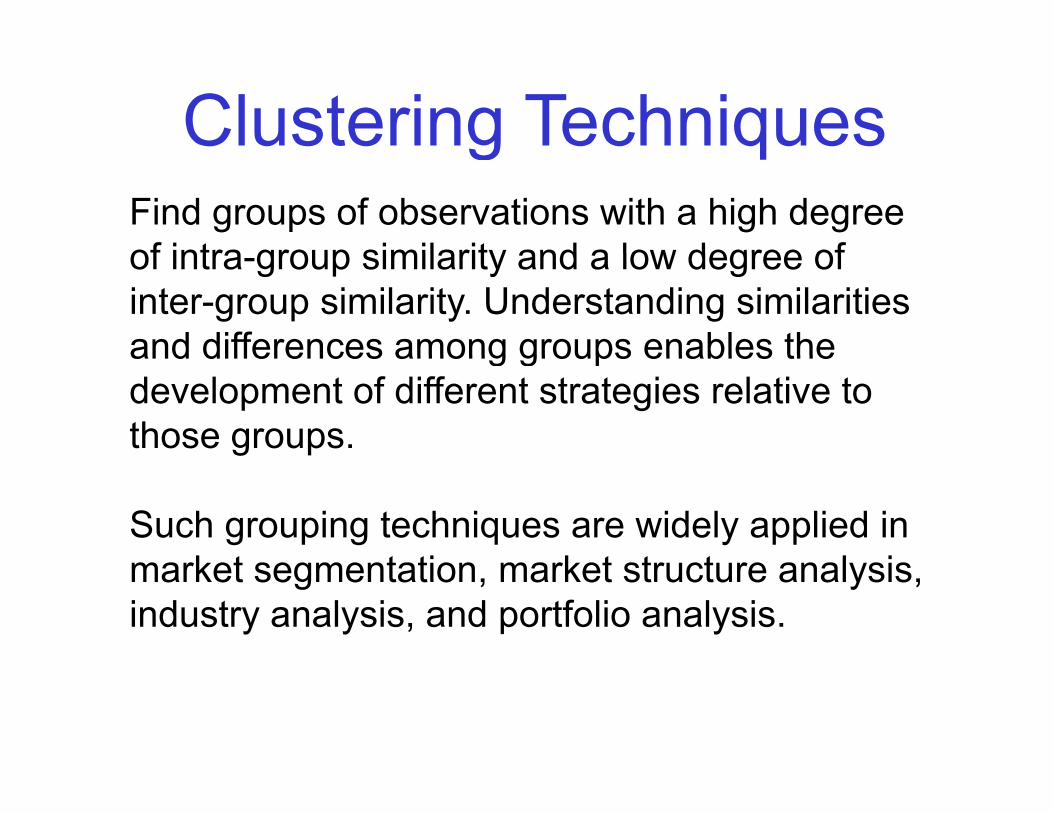
Clustering TechniquesFind groups of observations with a high degree of intra group similarity and a low degree of
g q
of intra-group similarity and a low degree of inter-group similarity. Understanding similarities and differences among groups enables theand differences among groups enables the development of different strategies relative to those groups.
Such grouping techniques are widely applied in k t t ti k t t t l imarket segmentation, market structure analysis,
industry analysis, and portfolio analysis.
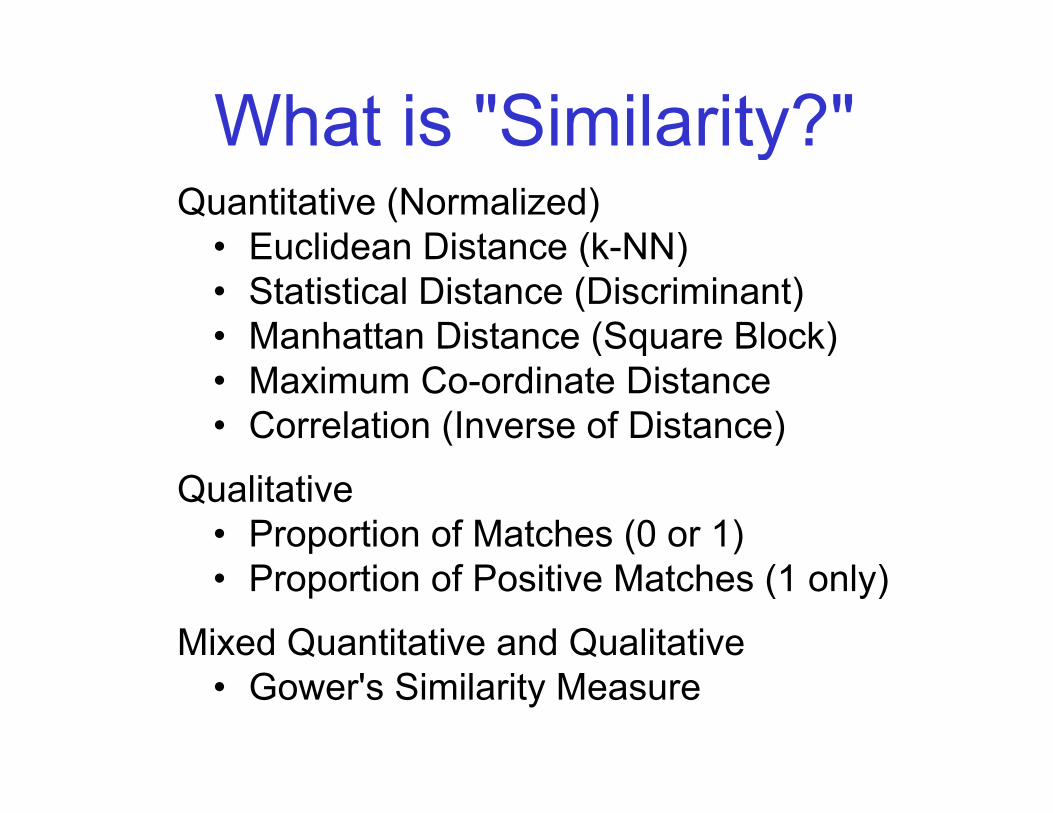
What is "Similarity?"Quantitative (Normalized)
• Euclidean Distance (k-NN)
yEuclidean Distance (k NN)
• Statistical Distance (Discriminant)• Manhattan Distance (Square Block)( q )• Maximum Co-ordinate Distance• Correlation (Inverse of Distance)
Qualitative• Proportion of Matches (0 or 1)• Proportion of Positive Matches (1 only)
Mixed Quantitative and Qualitative• Gower's Similarity Measure
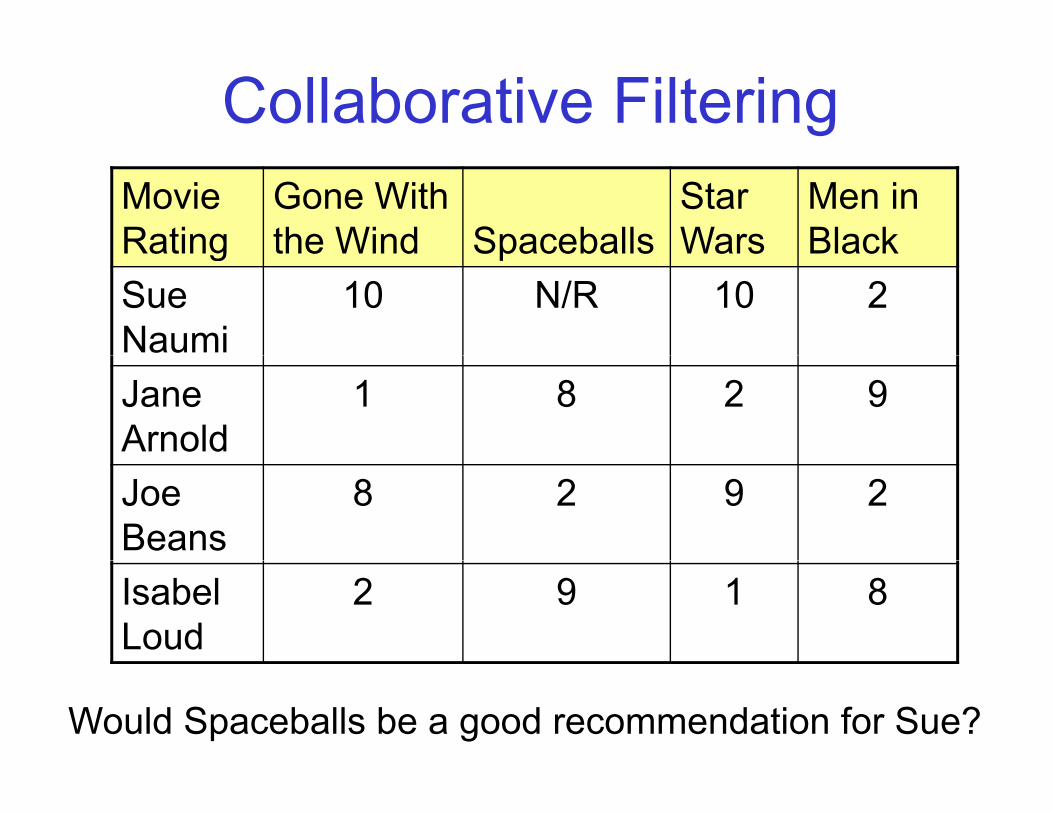
Collaborative FilteringMovie Rating
Gone With the Wind Spaceballs
Star Wars
Men in BlackRating the Wind Spaceballs Wars Black
Sue Naumi
10 N/R 10 2
Jane Arnold
1 8 2 9
Joe Beans
8 2 9 2
Isabel Loud
2 9 1 8
Would Spaceballs be a good recommendation for Sue?
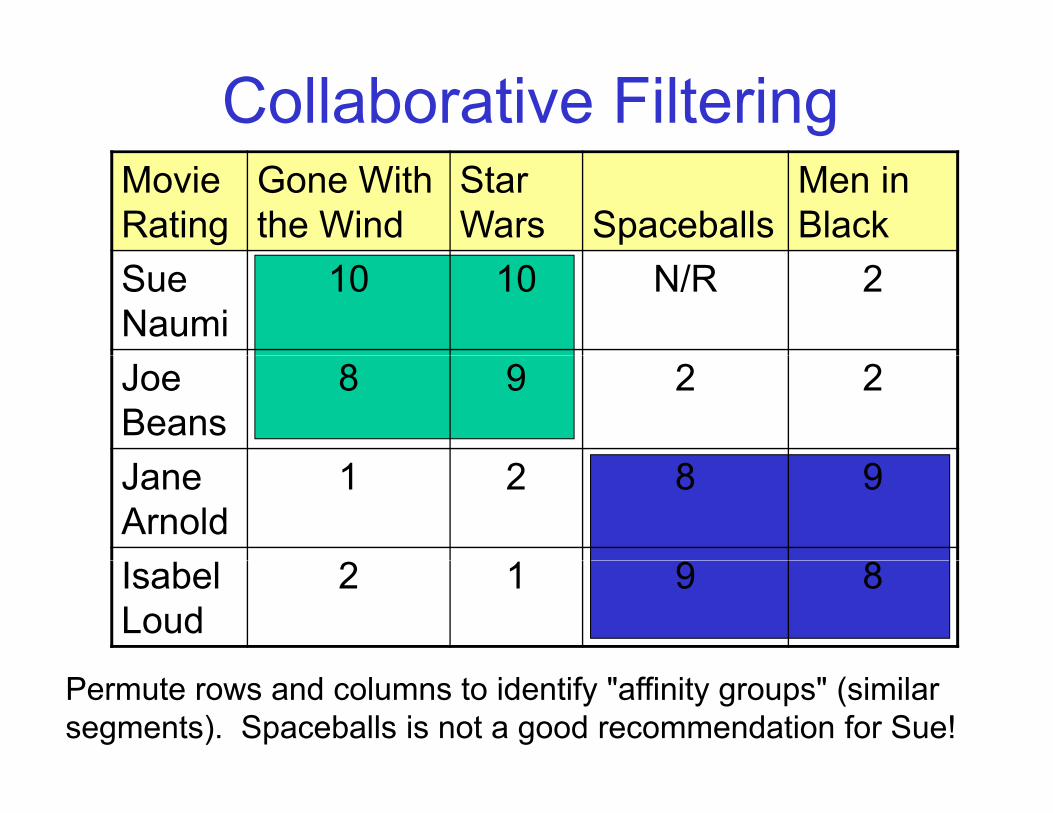
Collaborative FilteringMovie Rating
Gone With the Wind
Star Wars Spaceballs
Men in Black
Sue Naumi
10 10 N/R 2
Joe Beans
8 9 2 2
Jane Arnold
1 2 8 9
Isabel Loud
2 1 9 8
Permute rows and columns to identify "affinity groups" (similar segments). Spaceballs is not a good recommendation for Sue!
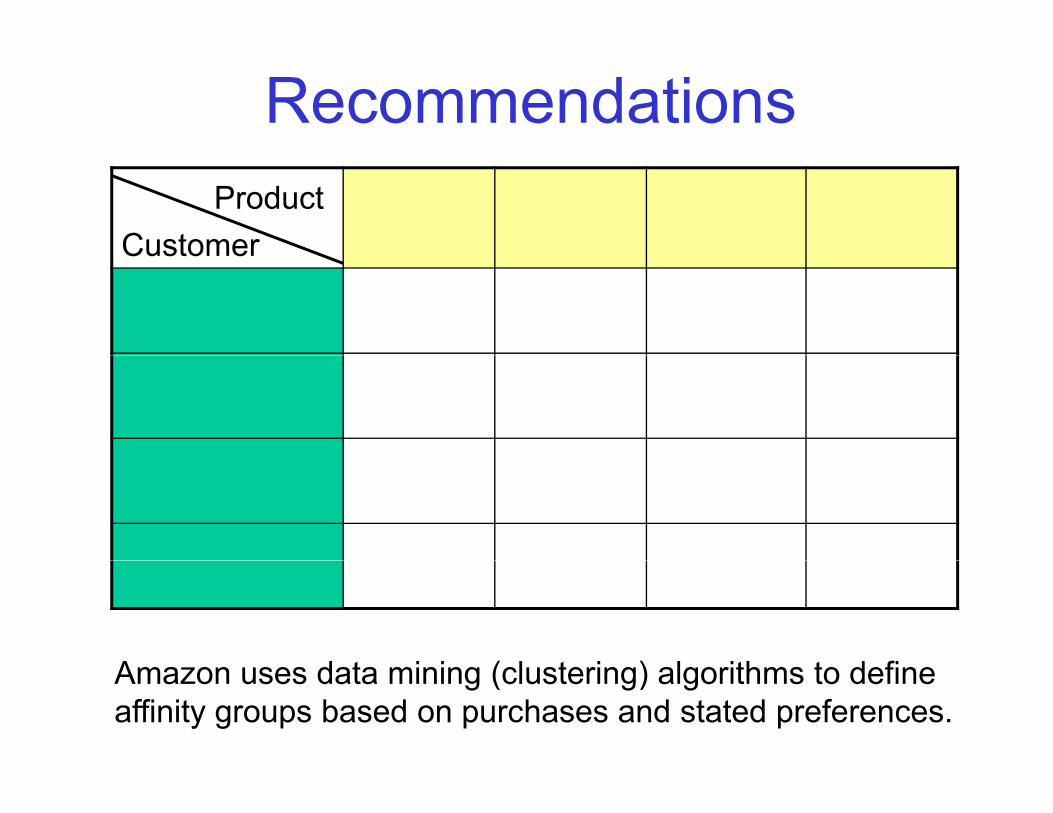
RecommendationsProduct
CustomerCustomer
A d t i i ( l t i ) l ith t d fiAmazon uses data mining (clustering) algorithms to define affinity groups based on purchases and stated preferences.
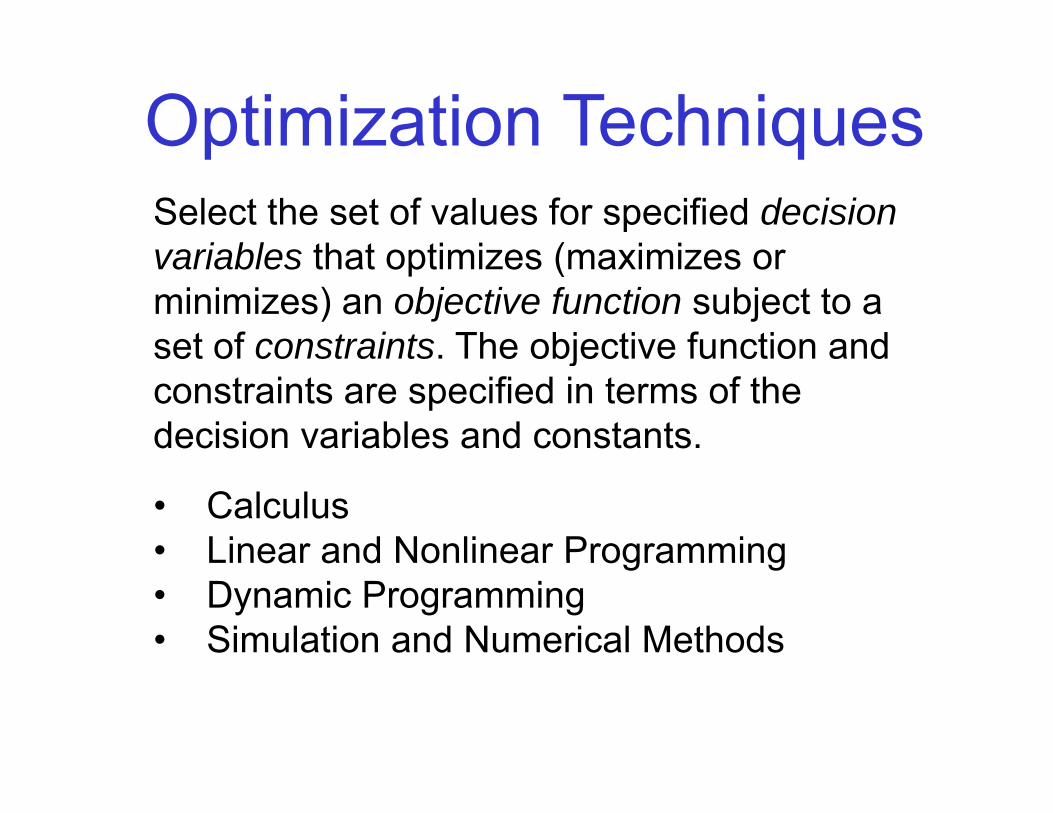
Optimization TechniquesSelect the set of values for specified decision variables that optimizes (maximizes or
p q
variables that optimizes (maximizes or minimizes) an objective function subject to a set of constraints. The objective function andset of constraints. The objective function and constraints are specified in terms of the decision variables and constants.
• Calculus• Linear and Nonlinear ProgrammingLinear and Nonlinear Programming• Dynamic Programming• Simulation and Numerical Methods
Extent Decisions• Extent decisions deal with the allocation
of scarce resources that determine theof scarce resources that determine the "production" level (output produced by an activity).y)
• Of necessity the extent of one activity impacts the extent of other activitiesimpacts the extent of other activitiescompeting for those scarce resources.
• Scarce resources include money• Scarce resources include money(capital), people (labor), facilities(equipment), raw materials, etc.(equipment), raw materials, etc.
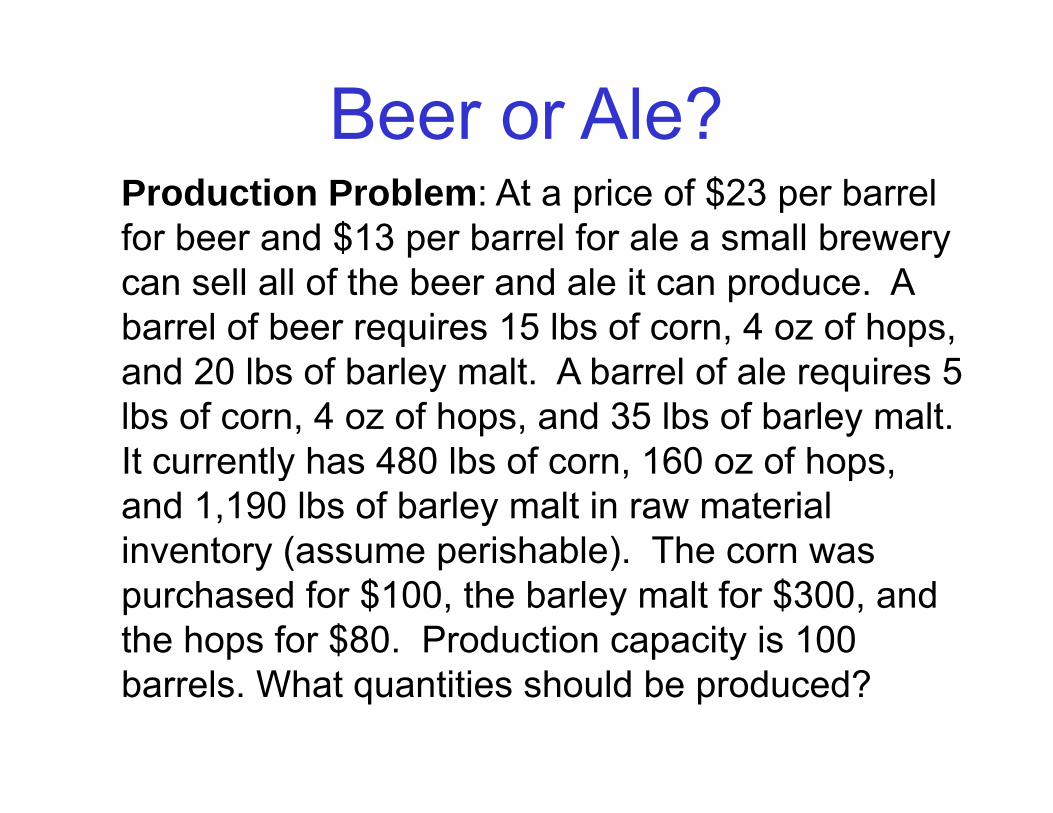
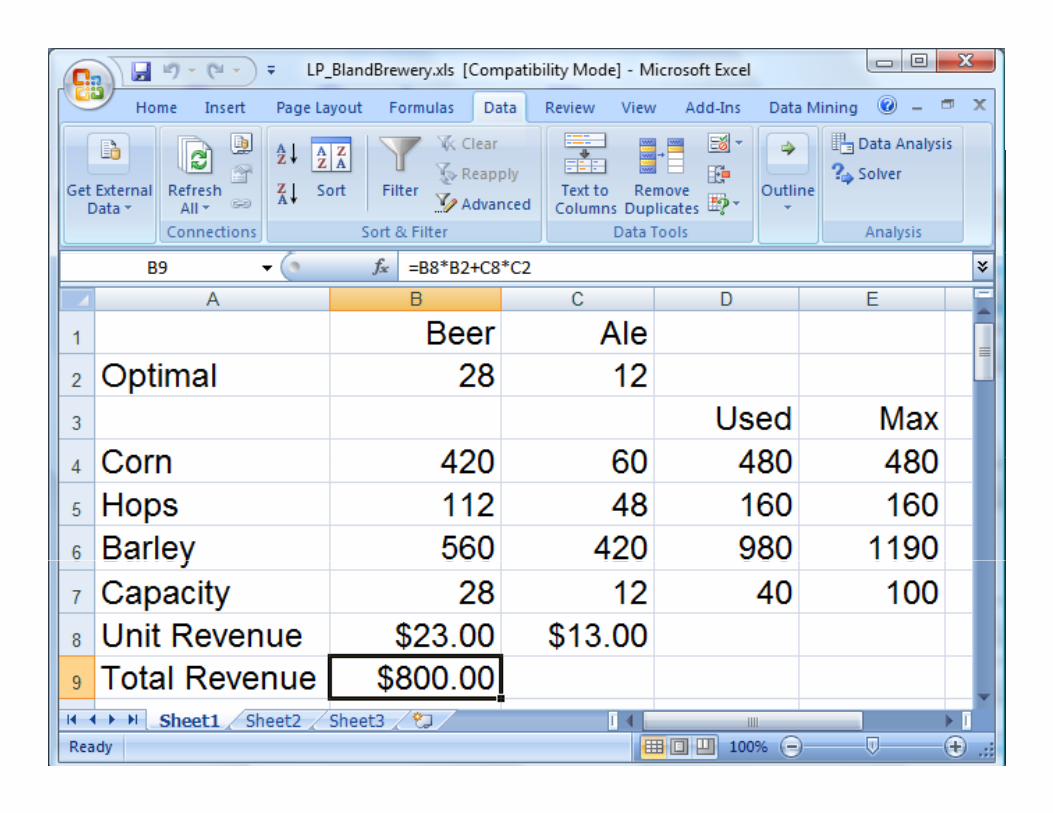
Beer or Ale?Production Problem: At a price of $23 per barrel for beer and $13 per barrel for ale a small brewery $ p ycan sell all of the beer and ale it can produce. A barrel of beer requires 15 lbs of corn, 4 oz of hops, and 20 lbs of barley malt. A barrel of ale requires 5 lbs of corn, 4 oz of hops, and 35 lbs of barley malt. It currently has 480 lbs of corn 160 oz of hopsIt currently has 480 lbs of corn, 160 oz of hops, and 1,190 lbs of barley malt in raw material inventory (assume perishable). The corn wasinventory (assume perishable). The corn was purchased for $100, the barley malt for $300, and the hops for $80. Production capacity is 100 barrels. What quantities should be produced?
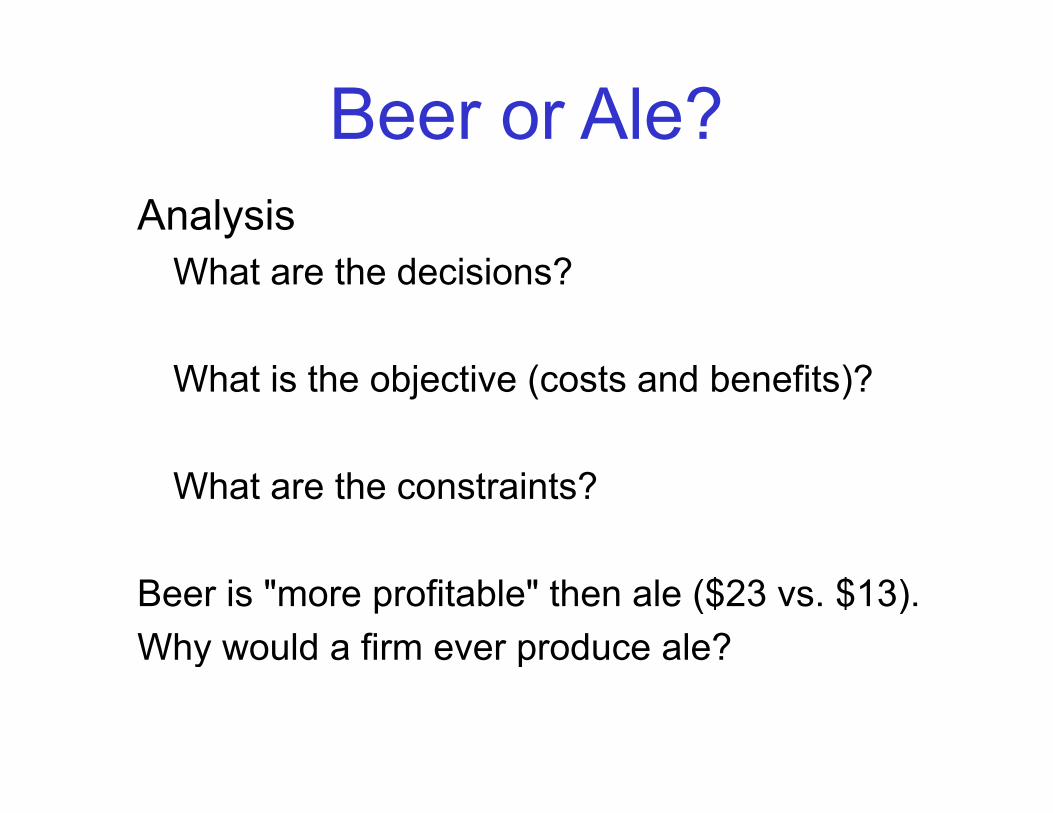
Beer or Ale?Analysis
What are the decisions?
What is the objective (costs and benefits)?
What are the constraints?
Beer is "more profitable" then ale ($23 vs. $13).Why would a firm ever produce ale?y p
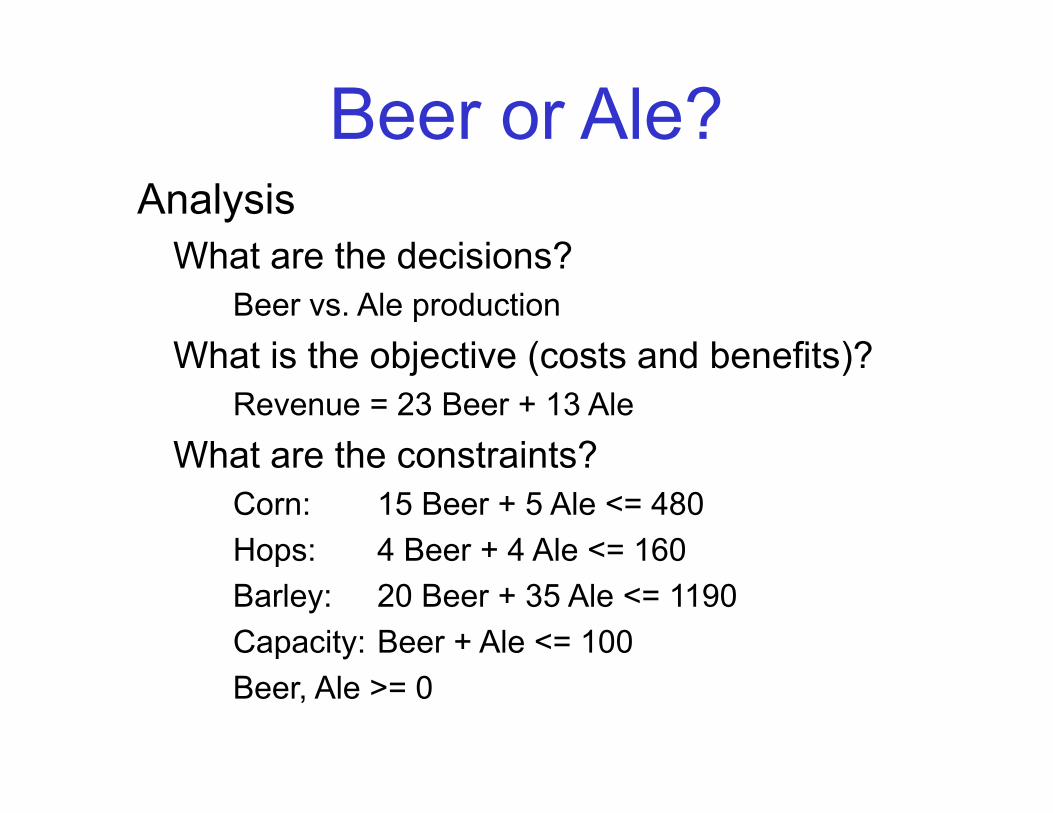
Beer or Ale?Analysis
What are the decisions?What are the decisions?Beer vs. Ale production
What is the objective (costs and benefits)?What is the objective (costs and benefits)?Revenue = 23 Beer + 13 Ale
What are the constraints?What are the constraints?Corn: 15 Beer + 5 Ale <= 480Hops: 4 Beer + 4 Ale <= 160Hops: 4 Beer 4 Ale 160Barley: 20 Beer + 35 Ale <= 1190Capacity: Beer + Ale <= 100Beer, Ale >= 0
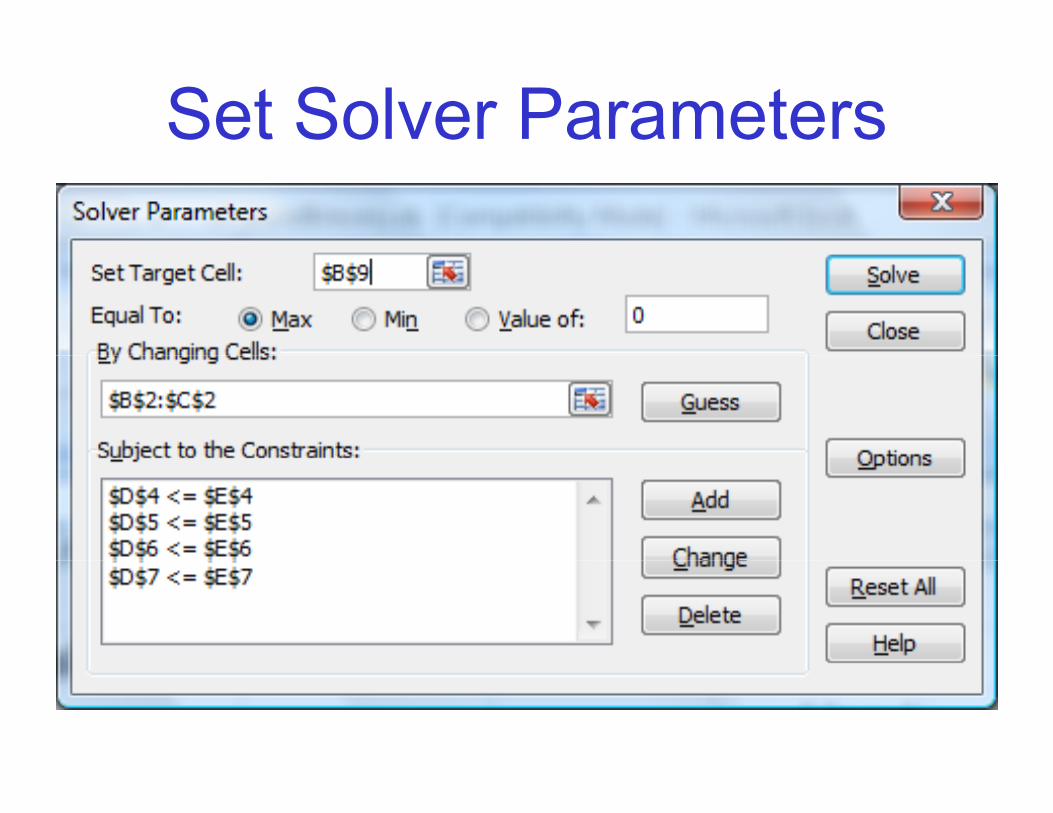
Set Solver Parameters
Conceptual MIS Structure
St t i ns men
t
ntStrategic
Tactical Ope
ratio
n
anag
em
urce
s
agem
enData Warehousing and Business Intelligence Systems
Tactical
Operational ing
ctio
n / O
ntin
g
e atio
n M
a
n R
esou
gic
Man
a
Transaction Mar
ket
Pro
duc
Acc
oun
Fina
nce
Info
rma
Hum
an
Stra
teg
Transaction Processing Systems
Network Infrastructure
Corporate Databases