BUSINESS INFORMATION SYSTEM - MicroStrategy INFORMATION SYSTEM January 2015 ... • Performance...
37
BUSINESS INFORMATION SYSTEM January 2015 Presenters: Azzy Golshani (Director, HBC Reporting Strategy) Harjeet Komal (Lead BI Technical Analyst) 1
Transcript of BUSINESS INFORMATION SYSTEM - MicroStrategy INFORMATION SYSTEM January 2015 ... • Performance...

BUSINESS INFORMATION SYSTEM January 2015 Presenters: Azzy Golshani (Director, HBC Reporting Strategy) Harjeet Komal (Lead BI Technical Analyst)
1

Abstract BI Reporting from a User's Point of View at a Large Department Store Company Listen to Hudson's Bay talk about how they enable reporting and analysis from a business user's point of view. They will review: • How they use MicroStrategy to present users with the data they need to
make effective business and operational decisions via dashboards, reports, automated reports etc…
• They will talk about how they perform change management with MicroStrategy.
• Additionally they will talk about the process used to ensure reports are tuned and the reporting environment is kept responsive.
2

Agenda
• HBC – Who Are We? • HBC Banners • Pre-Microstrategy Era • Why Microstrategy? • HBC Reporting Environment • HBC Enterprise Data Warehouse • What is BIS? • System Availability • Available Reports • Accessing Reports • BIS Security • External Login Page • Report Naming Convention • Report Subscribing and Sharing • Report Enhancement Process • Performance Tuning Process • Performance Tuning Findings • Change Management • Demo
3
4
HBC – Who are we?
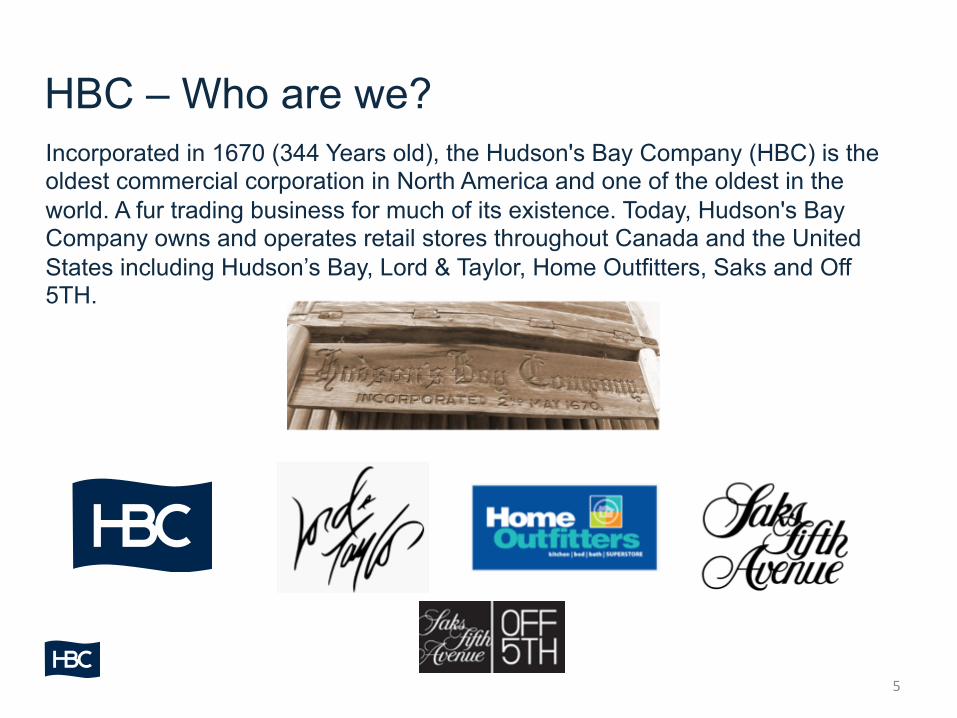
HBC – Who are we? Incorporated in 1670 (344 Years old), the Hudson's Bay Company (HBC) is the oldest commercial corporation in North America and one of the oldest in the world. A fur trading business for much of its existence. Today, Hudson's Bay Company owns and operates retail stores throughout Canada and the United States including Hudson’s Bay, Lord & Taylor, Home Outfitters, Saks and Off 5TH.
5
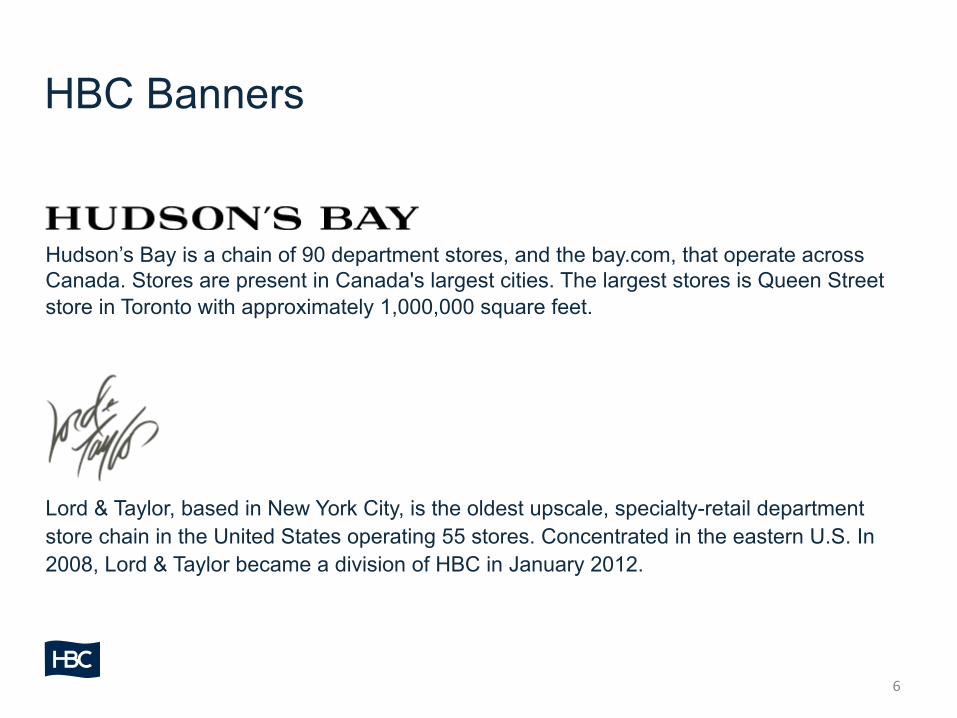
HBC Banners Hudson’s Bay is a chain of 90 department stores, and the bay.com, that operate across Canada. Stores are present in Canada's largest cities. The largest stores is Queen Street store in Toronto with approximately 1,000,000 square feet.
Lord & Taylor, based in New York City, is the oldest upscale, specialty-retail department store chain in the United States operating 55 stores. Concentrated in the eastern U.S. In 2008, Lord & Taylor became a division of HBC in January 2012. 6

HBC Banners Home Outfitters is Canada's largest kitchen, bed, and bath superstore, with 69 stores across the country selling bedding, towels, housewares, and other home accessories. The average Home Outfitters store size is 34,000 square feet.
Saks, Inc., is an operator of 39 high-end department stores in the United States under the nameplate Saks Fifth Avenue. It was founded in NYC in 1867 and is currently headquartered in New York City. Saks officially became a member of the HBC family on November 4th, 2013. Originally conceived as a clearinghouse for Saks Fifth Avenue merchandise in 1990, Saks Fifth Avenue OFF 5TH with 64 nation wide stores has reinvented itself as a major national retailer in its own right and, most recently, a compelling place to find the same exceptional deals online.
7

Pre-Microstrategy Era Prior to implementing MicroStrategy, Hbc was using a different application that was less structured. • Users liked the blank template approach, where they could pick and choose
what they wanted to see in their reports, allowing for greater flexibility in their data pulls.
• Users would run their reports and end up with different answers depending of how they had set up their queries.
• The system was not web-based. • It did not allow for report reviewing before exporting. • That system also used a large amount of resources to run efficiently.
8

Why ?
• One common reporting system for all HBC banners, merchants, stores and vendors.
• Single version of the truth.
• Web-based and easily accessible.
• Custom reporting is available where users can create reporting for their specific requirements and can select from a list of metrics and attributes.
• Provides greater visibility to their business and allows for better decision making.
• Home Office associates would not have to assist stores with reporting.
• Able to export reports to Excel for manipulation, printing or emailing
• Able to save templates as well as subscribe for easy reporting (ie one-time set-up).
9
HBC Reporting Environment
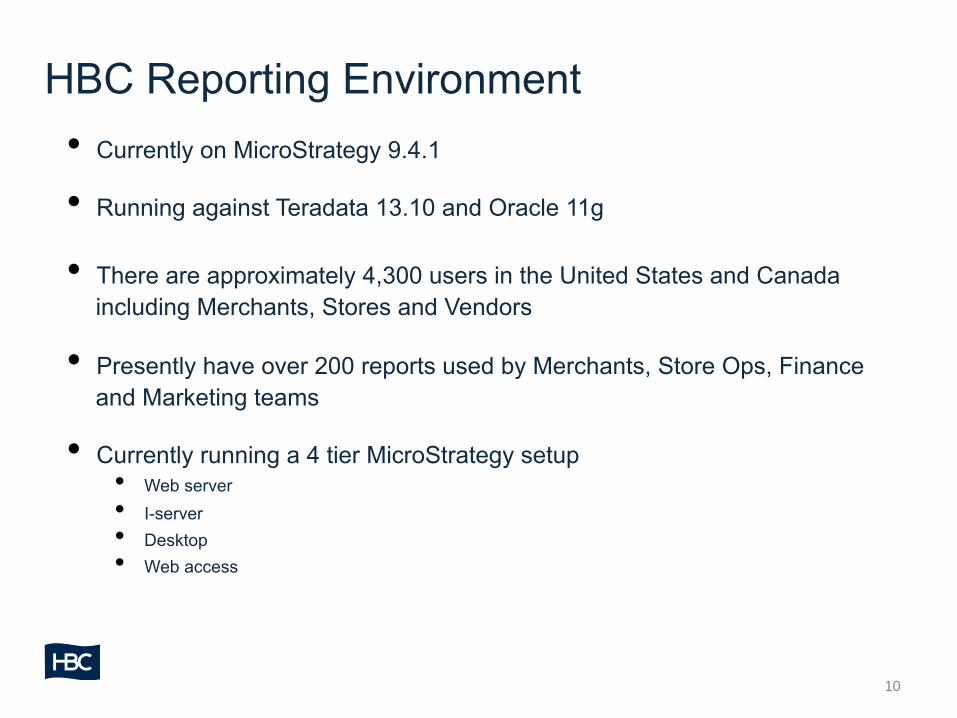
• Currently on MicroStrategy 9.4.1
• Running against Teradata 13.10 and Oracle 11g
• There are approximately 4,300 users in the United States and Canada including Merchants, Stores and Vendors
• Presently have over 200 reports used by Merchants, Store Ops, Finance and Marketing teams
• Currently running a 4 tier MicroStrategy setup • Web server • I-server • Desktop • Web access
10

HBC Enterprise Data Warehouse • Teradata Database approximately 14TB
• Teradata Production running on 7 Node 6700
• Development Environment 6 Node 2850 Appliance
• Users run approximately 35,000 Reports per week.
• Approximately 60% of these reports run in less than 1 minute during our heaviest peak period of the year.
11

What is BIS? BIS (Business Information System) is a web-based system used to generate reporting for all of HBC. Built using the MicroStrategy software platform , BIS is able to provide financial KPI’s that can be shared between banners, stores and our vendor partners. BIS is able to provide users the ability to customize reports for a variety of sales, inventory and markdown metrics and also attributes and pricing details for all level of organization, hierarchy and timeframes. By adopting MicroStrategy technology across HBC, we have seen the speed by which decisions are made and productivity levels increase. HBC users analyze and share corporate data with ease.
12

System Availability BIS is available from: • Monday to Saturday from 7am to 8pm • Sundays and most holidays from 12pm to 5pm
User Help Desk (BIS Solution Centre) is available from: • Monday to Friday from 8am to 4pm BIS Solution Centre is dedicated to help with: • Assistance on report generation • Data issues • Additional training and follow-up on
specific functions • Procedural questions such as “What
do I do with this report?”
• Navigation • Terminology questions • Communication (updates/changes) • Consolidation of issues related to
training • General trouble shooting
13

Available Reports Several different reports exist within BIS, created in different ways to support the different needs of the business: • Automated Reports
• Dashboards
• Executive Reports
• Merchant Reports
• Vendor Reports
• Store Reports
• Exception Reports
• Financial Reports
14

Accessing Reports
15
All reports are accessible on HbcNet by navigating the following path:
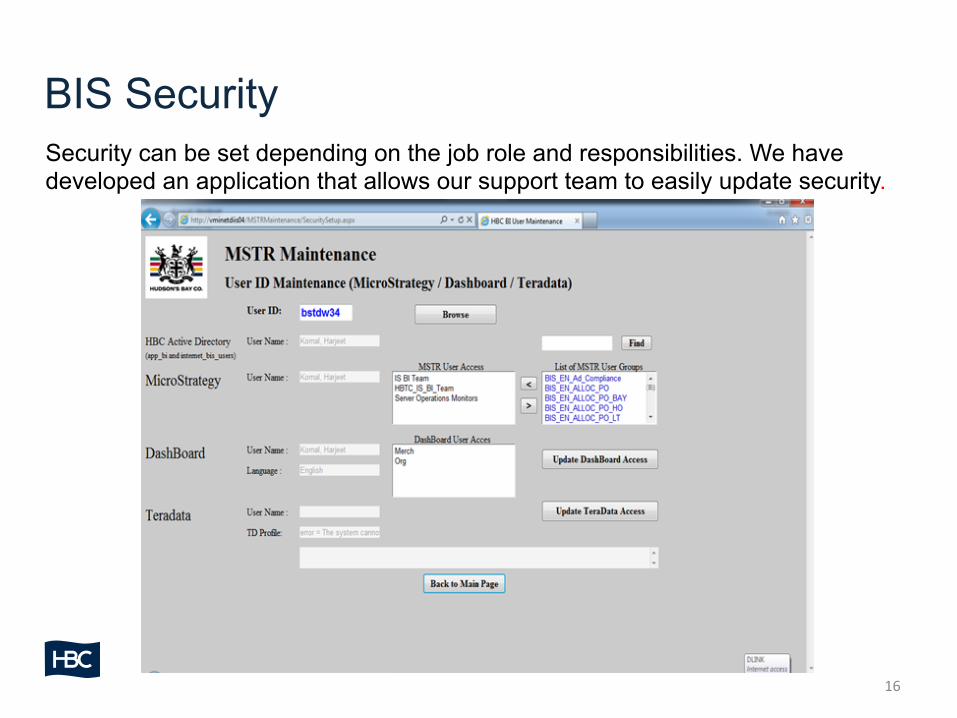
BIS Security Security can be set depending on the job role and responsibilities. We have developed an application that allows our support team to easily update security.
16
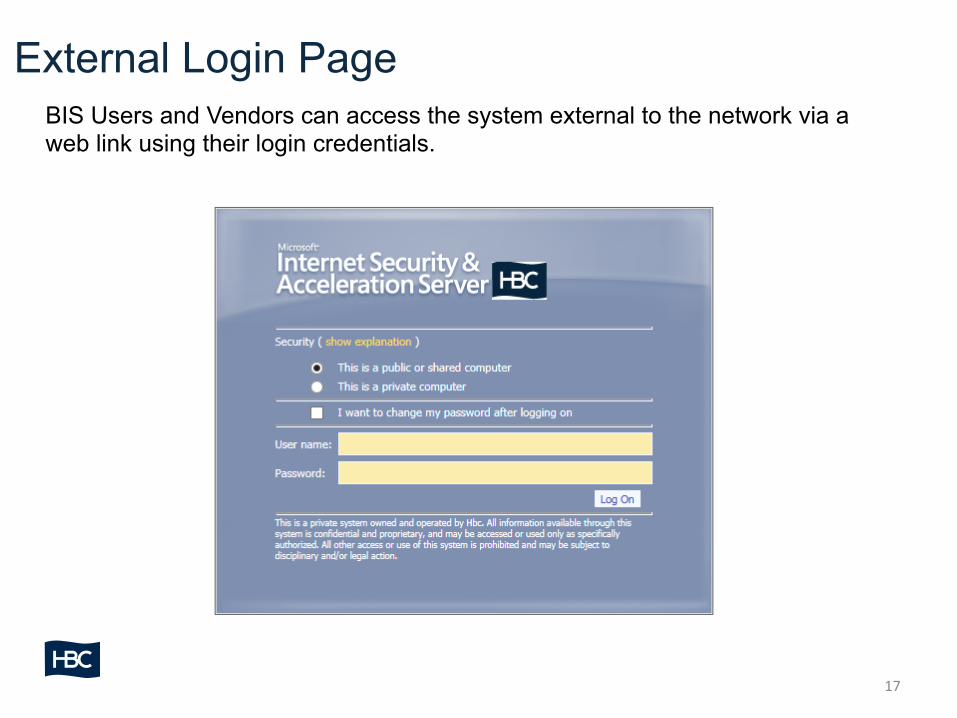
External Login Page
17
BIS Users and Vendors can access the system external to the network via a web link using their login credentials.

Report Naming Convention To help identify reports and relay issues we developed a naming convention :
18
Report Subscribing & Sharing Report Subscription: • Allows the user to have a report automatically run based on a given schedule and save
it into their “History list” or email it to them.
• Users can subscribe to 30 reports
• Currently there are over 5,300 daily and weekly subscribed reports Report Sharing: • Users can share a report they have created by saving it to appropriate folders under
the shared folder. Other users can then go to the shared folder and open the report and personalize it.
• Users can also share a report they have created by saving and emailing the link to the
newly created report.
19

Report Enhancement Process • Data QA, functionality and stress testing were done by the HBC BI team,
ensuring the BIS data matched our source systems.
• The MicroStrategy environment is setup with 4 distinct environments: • BIS DEV • BIS QA • BIS UAT • BIS PROD
• Once the reports have been successfully tested in the BIS UAT environment, they are migrated to Production in a bundle promotion process (typically done on Thursday nights).
• Numerous checks and balances are put in the bundle promotion process, along with regression testing to ensure a successful bundle.
20
21
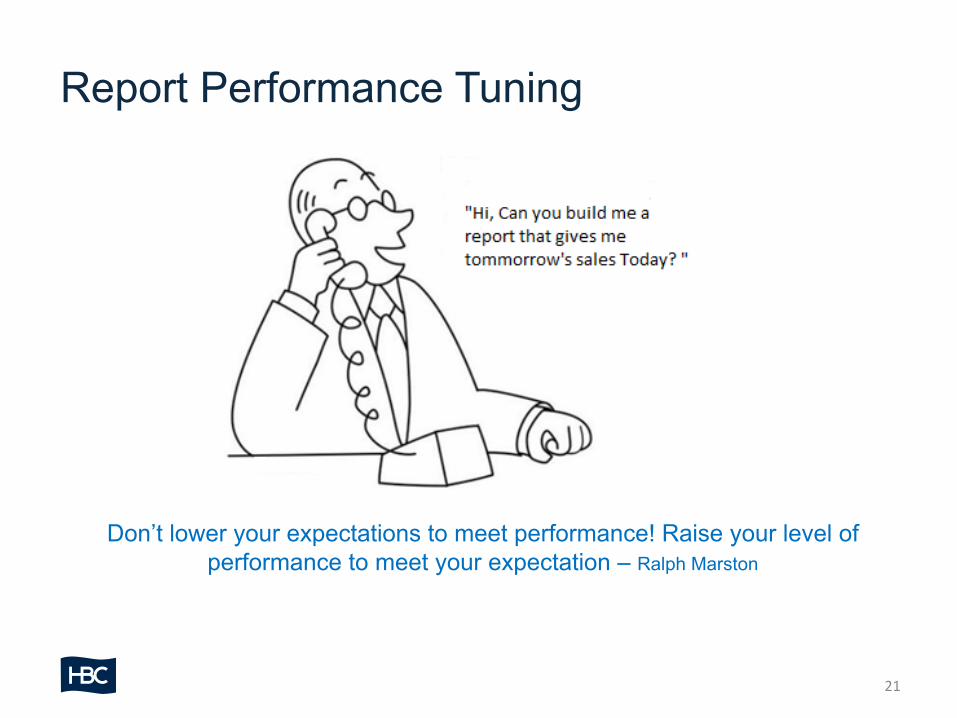
Report Performance Tuning
Don’t lower your expectations to meet performance! Raise your level of performance to meet your expectation – Ralph Marston

Change Management
22

Change Management Overview
23
the
Go Live
Prod
uc-v
ity
Time
Change Management provides resources to enable success with the change and minimize the produc8vity dip at Go Live
Minimized dip in produc-vity
Accelerated produc-vity

24
Moving Up the Curve CO
MMITMEN
T
Unaware Aware Understand
Acceptance
Engagement
Advocacy & Ownership
• I am aware of it
TIME & CHANGE MANAGEMENT SUPPORT
• I understand it & can explain it • I am unaware
• I accept it (but don’t necessarily want it) • I see the benefits
• I am open to it • I see how it benefits me • I am involved
• I support it • I believe in it • I recommended it
Educa-on & Alignment
Engagement & Empowerment
Sustainability & Resonance
Understanding the specific impact to different groups will allow us to proac-vely move people along the change curve.

Change Management - Challenges
• Dealing with the few individuals that saw change as negative
• Started testing too late in the game due to upstream delays
• Started the Super User program too late in the game • Business areas that had poor results, had trouble trusting the data.
• Some users required refreshers on metric definitions, report functionality for which they had received training and reference material.
• Attempted to make a report as the master report that does everything
• Needed more testing on the Report performance specially the master report during UAT sessions
25

Change Management – Learnings • It is imperative that the senior leadership team fully supports the initiative. • It’s important to bring any new members of the Sr. Merchant team up to speed as soon
as possible and get their feedback on the direction • It is essential for the senior team be involved in change management and for the main
business communications to come through them
• It is very important to create a pilot group (Super Users) from all levels of the hierarchy
• The performance team needs to be involved from the outset of report development with reviews of performance during UAT testing and post production installation.
• Stay positive at all times
26

Conclusion • Change is difficult for most people, ensure that individuals responsible for
rolling out the change are committed, extremely knowledgeable and believe in the benefits.
• Ensure senior leadership shows support throughout the entire process.
• Ensure tools and continual support are available.
• Ensure that the all decisions and processes are documented and clearly communicated
• Ensure that the performance of your reporting system is constantly monitored and performance tuning efforts are a continuous ongoing effort, not just when performance becomes an issue.
• Sell the change before rolling it out, and constantly remind the organization of the benefits.
27

Reporting Examples
• Automated Reports
• MicroStrategy Reports
• Dashboards
26

Automated Reports
29
Weekly Cross Banner Sales and GM Report The purpose of this report is to provide the executives with a view of: • Sales, GM and Inventory TY, Plan and LY • Day, WTD, PTD, STD and YTD timeframes • Sales and GM by bucket (Eg. Regular Sales vs Reduced Sales)
Dummy Data used for Demonstra;on Purposes

MicroStrategy Report
27 Dummy Data used for Demonstra;on Purposes

MicroStrategy Report
28 Dummy Data used for Demonstra;on Purposes

MicroStrategy Report
29 Dummy Data used for Demonstra;on Purposes

MicroStrategy Report
33 Dummy Data used for Demonstra;on Purposes

Merchant Dashboard – Product View
34
• The product view provides a view of key sales, GM, inventory and markdown metrics by hierarchy level.
• Users will select a GMM and then click on “DMM”, and the DMM’s within that GMM will display.
• Once the list of DMM’s appear, users can select a DMM and then click on “Buyer” and the Buyers with than DMM will display.
• Once the list of Buyers appear, users can select a Buyer and then click on “Dept” and the Dept’s with than Buyer will display.
• All timeframes are available and can be selected as required.
Dummy Data used for Demonstra;on Purposes
Merchant Dashboard – Product View
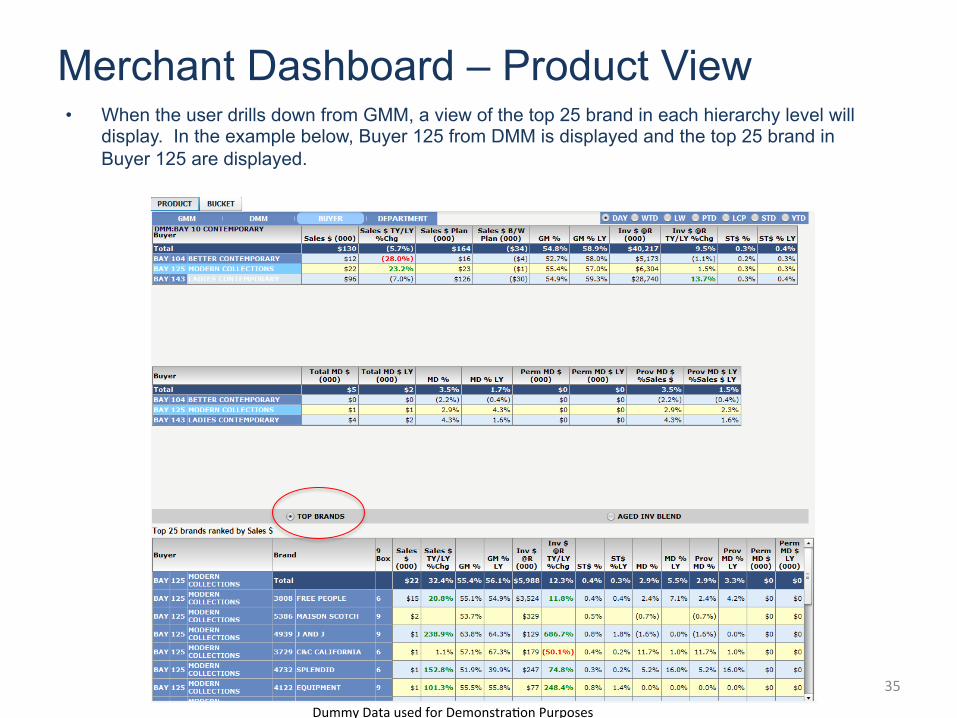
35
• When the user drills down from GMM, a view of the top 25 brand in each hierarchy level will display. In the example below, Buyer 125 from DMM is displayed and the top 25 brand in Buyer 125 are displayed.
Dummy Data used for Demonstra;on Purposes

Merchant Dashboard – Product View
36
• The user can also view Aged Inventory Blend for the same hierarchy level that was selected to view the top 25 brands. In the example below, Buyer 125 from DMM is displayed and the Aged Inventory Blend for Buyer 125 is displayed.
Dummy Data used for Demonstra;on Purposes

Questions?
37
HUDSON’S BAY COMPANY
HUDSON’S BAY ·∙ LORD & TAYLOR ·∙ SAKS FIFTH AVENUE SAKS FIFTH AVENUE OFF 5TH ·∙ HOME OUTFITTERS
Azzy Golshani -‐ [email protected] Harjeet Komal – [email protected]