
Business Growth and Innovation - the innovation foundation · PDF fileBusiness Growth and...
52
Research report: October 2009 Business Growth and Innovation The wider impact of rapidly-growing firms in UK city-regions Geoff Mason, Kate Bishop and Catherine Robinson
Transcript of Business Growth and Innovation - the innovation foundation · PDF fileBusiness Growth and...

Research report: October 2009
Business Growth and Innovation The wider impact of rapidly-growing firms in UK city-regions
Geoff Mason, Kate Bishop and Catherine Robinson


Business Growth and InnovationThe wider impact of rapidly-growing firms in UK city-regions
Foreword
Thriving businesses are vital to the UK’s economic recovery. Businesspeople, investors and policymakers agree that they create jobs, wealth and wider prosperity.
If government is to create the right conditions for businesses to grow, it must understand how this growth happens and what lies behind it.
This report examines business growth in UK cities, considering the wider benefits of growth businesses and the relationship between growth and innovation. It demonstrates the importance of innovation to business growth, as well as the considerable socio-economic benefits of high-growth businesses. Not only do they employ a significant number of people, but they also drive the employment of the businesses that surround them. Hence, this report is the counterpart to Measuring Business Growth, which considers instead the direct contribution to employment made by UK high-growth firms.
This work has significant implications for the direction of economic policy. It shows that enabling innovation is good for growth, and that high-growth businesses make a disproportionate contribution to job creation and prosperity.
We believe that this report will be a powerful contribution to the debate on how to foster economic growth. As ever, I welcome your views.
Stian Westlake Executive Director of Policy and Research, NESTA
October, 2009
3
NESTA is the National Endowment for Science, Technology and the Arts.
Our aim is to transform the UK’s capacity for innovation. We invest in early-stage companies, inform innovation policy and encourage a culture that helps innovation to flourish.

Executive summary
Countries prosper when their businesses thrive, which is why governments encourage entrepreneurship and support small firms
The UK’s long-term economic growth is underpinned by the vitality of its businesses. A dynamic business sector, where new firms continuously enter the market, grow in size and displace weak firms, is the best guarantee of the UK’s future economic performance.
For these reasons the UK government encourages entrepreneurship and provides a range of help for small and medium-sized enterprises (SMEs). This includes grants for business investment and research and development, advice and co-funding for development of export capability, small loan guarantees and venture capital schemes.
But our knowledge regarding UK businesses’ growth is limited
Despite the interest in fast-growing firms, not much is currently known about how businesses grow in the UK and what the impact on economic performance is.
We aim to help fill this gap. First, we examine the wider impact of fast-growing firms on economic and social outcomes in 45 UK city-regions, which account for just under 80 per cent of total UK employment. Specifically, we use econometric techniques to find out what happens to regional performance if firm growth involves a small minority of outstanding performers rather than modest average growth by the majority of firms in the region.
Second, we study the causal relationship between businesses’ growth and their innovation activities. We use firm-level data from the Business Structure Database and the Community Innovation Survey and ask whether innovation drives growth, and whether faster growth subsequently leads to higher spending on innovation.
And to complete the picture, Measuring Business Growth,1 a separate NESTA report, provides a comprehensive study of business growth in the UK, focusing particularly on high-growth firms, their distribution across sectors and regions, and examining their direct contribution to job creation.
Not all businesses have the same impact on the UK’s prosperity
Both new entrants and SMEs play an important role in UK’s economy. But many new firms do not survive and many small firms remain small for long periods of time. Our analysis shows that a small minority of high-growth firms does most to boost the economy and employment in UK city-regions, and to drive innovation.
High-growth firms are defined by the OECD as those with ten or more employees that have recorded average annual growth rates of 20 per cent or more (in employment or sales) over a three-year period. In terms of employment growth, there were just under 11,500 such firms in the UK in 2005, representing 6 per cent of all firms with ten or more employees. This is above-average compared to other OECD countries for which such data are available.2
4
1. Anyadike-Danes, M., Bonner, K., Hart, M. And Mason, C. (2009) ‘Measuring Business Growth: High-growth firms and their contribution to employment in the UK.’ London: NESTA.

In the UK, newer firms are more likely than older firms to surpass this high-growth threshold though as many as half the firms in this category are at least ten years old. Moreover, high-growth firms are found in all sectors of the economy, not just in high-tech sectors, as is commonly assumed.
High-growth firms contribute to economic performance in several ways
High-growth firms have a direct impact on national economic performance through their own employment, innovation and productivity growth. But they also have wider effects on economic and social outcomes. We identify three main effects of this kind:
1. The positive impact of high-growth firms on productivity as the resources of displaced weaker firms are reallocated to stronger firms. This process also encourages greater innovation and efficiency in surviving firms.
2. The spillover effects of rapid firm growth on the growth of other firms as well as on regional economic and social outcomes, such as employment and inactivity rates.
3. Positive effects on overall innovative activity, since high-growth firms are disproportionately innovative.
High-growth firms generate spillovers in their regions
Our new analysis of UK city-region data finds evidence that not only do high-growth firms create jobs, but they do so over and above their direct effect on employment. If two city-regions have the same average level of firm growth, the one with a greater proportion of high-growth firms (and by implication a greater proportion of lower-growth or declining companies too) will generate more jobs. Specifically, a 5 percentage point rise in the share of employment accounted for by high-growth firms typically leads to a 1 percentage point increase in employment rates in a city-region, even assuming the same average firm growth. High-growth firms also help to reduce inactivity and dependency rates in city-regions.
High-growth firms are major innovators
The ability of high-growth firms to outperform others derives in large part from their greater levels of successful innovation.3 We find that innovative firms grow twice as fast, both in employment and sales, as firms that fail to innovate. This reflects earlier investment by fast-growing firms in innovative resources and in development of innovation-related capabilities.
For instance, firms that had introduced a product innovation in 2002-04 experienced a 4.4 per cent average employment growth rate between 2004-07, in contrast to the 2 per cent average growth displayed by non-innovators. And the figures are 10 per cent and 5.8 per cent respectively if we consider sales growth. Looking at it the other way around, high-growth firms’ propensity to innovate in the prior period was 6 percentage points higher than for slower-growing firms.
Innovation drives growth
But we cannot necessarily infer from simple correlations that innovation is the driver of growth. To explore this issue further, we carried out multivariate analysis which showed that more innovative firms do indeed grow faster (as measured by the percentage of sales coming from new products, a common measure of innovation success). This effect is more marked the faster a company is growing. A high-growth firm that sees a 10 percentage point increase in the share of sales from new products adds almost 1.5 percentage points to its employment growth rate.
Investment in innovation continues after an initial period of strong growth
Our analysis suggests that the relationship between firm growth and innovation also works the other way around. We find evidence that high-growth firms continue to invest in innovative activity after their initial period of growth, whereas slower-growing firms are less likely to invest more in innovation. This is another reason why high-growth firms contribute disproportionately to innovative activity in the economy.
5
2. See Ibid.
3. Regardless of the definition of innovative firms that we choose (i.e. product innovator, process innovator or wider innovator).

6
Implications for policymakers
1. Focus on the firms with the potential for significant growthThe UK has successfully nurtured many small firms. There are many subsistence entrepreneurs, who happily continue to earn a modest income and employ a limited number of people. Policymakers have traditionally focused on the number rather than the quality of small firms. But to achieve greater economic prosperity and higher rates of employment, this research shows that it is important to focus on those firms with the greatest potential to grow.
2. Don’t rule out existing businessesYoung firms are more likely to grow fast, but still only a small proportion of new firms succeed in achieving high-growth status. At the same time mature firms constitute a large proportion of high-growth firms (even though the vast majority of older firms do not grow much at all). So support for small and medium-sized firms would probably best be targeted at firms which have demonstrated some capacity or ambition to grow, regardless of their age.
3. Encourage innovation, and make sure the necessary finance is availableThe links between innovation and growth suggest that supporting innovation is a crucial channel to foster business growth. Therefore, it is important to continue improving the availability of finance for growing innovative firms.

7
Contents
Business Growth and Innovation The wider impact of rapidly-growing firms in UK city-regions
Part 1: Overview 8
Part 2: Characteristics of high-growth firms 10
Part 3: The wider impact of high-growth firms 14
3.1 The effects of high-growth firms on aggregate economic performance 14
3.2 Spillovers from high-growth firms in UK city-regions 15
Part 4: Innovation and firm growth 20
4.1 Explaining persistent differences in firm growth 20
4.2 Firm growth and innovation success 21
Part 5: Assessment 28
References 30
Appendix tables 32
Acknowledgements 50
Part 1: Overview
The growth of firms is dear to the hearts of policymakers in market economies. In recent decades differences between countries in patterns of firm growth have been linked to relative national economic performance, not just in new job creation (Birch, 1981, 1987) but also in improved productivity (Bartelsman, Scarpetta and Schivardi, 2005).
Productivity growth can be decomposed between the effects of the reallocation of resources within firms (for instance, through internal reorganisation) and between firms (as a result of entry, growth and exit). But this restructuring process is inhibited if highly productive firms’ growth is constrained, so that they fail to replace low-productivity firms. And this failure is relatively more frequent across Europe than in the USA (Bartelsman et al., 2005). There is therefore a keen interest in learning more about the policy and institutional settings which help create the most favourable conditions for firms to prosper and grow.
Why pay attention to high-growth firms?The role of creative destruction in fostering growth has captured the interest of policymakers in the UK and other European countries. This in part results from the desire in these countries to emulate the US in breeding innovative new firms that grow quickly into world leaders in their fields (such as Microsoft, Cisco, Google, Starbucks and FedEx). Particular attention is paid to the performance of so-called ‘gazelle’, ‘high-growth’ or ‘high impact’ firms which show above-average growth in employment or sales over several years (Ahmad and Gonnard, 2006; Hölzl and Friesenbichler, 2008). High-growth firms are therefore seen as major contributors to the process of creative destruction, driving productivity growth and the economic performance of nations.
Definitions of high-growth firms and gazelles vary. Some authors define them solely in terms of growth rates while others also emphasise either their age or size. For example, OECD (2008) defines gazelles as a sub-set of high-growth firms born five years or less before the end of a three-year observation period. By contrast, Hölzl and Friesenbichler (2008) define gazelles as high-growth firms with fewer than 250 employees. In this report we adopt the OECD definition of ‘high-growth’ status, namely, that firms have recorded average annual growth rates of 20 per cent or higher (in employment or in sales) in a recent three-year period, regardless of their age.
Policymakers in the UK and elsewhere have developed, with more or less success, a variety of government support programmes to facilitate the emergence of these ‘exceptional’ firms. They are often focused on new-start firms and small and medium-sized enterprises (SMEs), since they are expected to make substantial contributions to product innovation and to help “[displace] old products and practices with better, more efficient ones” (BERR, 2008b: 7). Programmes in the UK include grants for business investment and research and development, venture capital schemes, advice and co-funding for development of export capability and a number of other services (BERR, 2008a).
These business support programmes attempt to strike a delicate balance. On the one hand, they support new entrants in the hope that they will expand, challenge and replace incumbent firms. On the other hand, they also support established businesses which vary greatly in their growth prospects. In consequence, there is an on-going debate about which kind of businesses (if any) the government should
8

support. A key choice for policymakers is whether to try to help a wide cross-section of businesses or whether to target only those firms that have the potential to achieve high levels of growth. Both these approaches have pros and cons, and the arguments about them concern, in particular, the feasibility of a targeted approach, the cost-effectiveness of different types of intervention and the impact of firm growth on wider economic performance. Ultimately, the choice to target (or not target) high-growth firms needs to be informed by empirical evidence.
Do high-growth firms have strong effects on socio-economic outcomes?We do not really know much about high-growth firms in the UK, but this is changing quickly. The recent availability of a newly developed business demography database has provided the opportunity to study high-growth firms and their impact on economic performance.4
As a result of this, NESTA is now publishing two complementary reports that shed some light on the role of high-growth firms in the UK. The first one provides the first comprehensive study of high-growth firms in the UK.5 It maps their distribution across sectors and regions, and examines their direct contribution to employment creation.
The second one is this report, which focuses primarily on the indirect contribution of high-growth firms to wider economic performance and social welfare, and compares it to that made by other, slower-growing firms in the economy. By doing so, we aim to provide evidence on whether a targeting approach to business support policy would – subject to feasibility – also be desirable.
In order to assess the impact of firm growth on economic and social outcomes, we need to take explicit account of externalities arising from this process, that is, the costs and benefits of firm growth which ‘spill over’ onto third parties. These accrue to consumers, workers, regions and other firms as a result of the investments in resources and capability development made by growing firms. Examples include the build-up of local skill supplies and business services, and the intensification of supply-chain linkages and relationships between firms and local universities and research institutions.
High-growth firms are also likely to contribute disproportionately to innovation activities, in the form of distinctive new products, processes
or forms of work organisation. The practices that have helped them achieve above-average growth rates provide learning opportunities for other firms in the same area, which can then choose to adopt the most successful of them.
Consequently, the goals of this report are two-fold. First, we examine the effects on social and economic outcomes if growth involves a small minority of outstanding performers (i.e. a few high-growth firms) rather than a strong average growth performance by firms in general. In other words, we study the relationship between the ‘skewness’ of the distribution of firm growth rates and socio-economic outcomes in different regions of the UK, such as employment, inactivity and dependency rates. Second, we present new analyses of the links between high-growth firms and innovation in the UK, drawing on data for services, utilities and construction firms as well as for firms in manufacturing.
Structure of the reportOur findings are presented as follows: Part 2 briefly summarises the main characteristics of high-growth firms in the UK. Part 3 presents new evidence on the effects of spillovers from firm growth onto social and economic outcomes in UK city-regions. Part 4 assesses the links between firm growth and innovation in the UK. Part 5 summarises our main conclusions regarding the impact of growing firms on economic and social outcomes.
9
4. Business Structure Database (BSD), Office for National Statistics.
5. Anyadike-Danes, M., Bonner, K., Hart, M. And Mason, C. (2009) ‘Measuring Business Growth: High-growth firms and their contribution to employment in the UK.’ London: NESTA.
9

Part 2: Characteristics of high-growth firms
We focus on firms exceeding 20 per cent annual growth over three years Measuring Business Growth,6 the new NESTA report being published in parallel with this one, provides a comprehensive study of high-growth firms in the UK and its regions. Here we provide a quick review of the main characteristics of high-growth firms to provide perspective for the analysis that we undertake.
Definitions of ‘high-growth firms’ are typically based on either threshold measures (growth rates above a certain percentage level) or relative measures (e.g. firms in the upper decile of growth rates of a given population of firms). We adopt the threshold measure proposed in the EUROSTAT-OECD Business Demography Manual:
All enterprises with average annualised growth greater than 20 per cent over a three year period, and with ten or more employees in the beginning of the observation period, should be considered as high-growth enterprises. Growth can be measured by the number of employees or by turnover.
Thus we focus on survivor firms with ten or more employees over selected time periods ending in 2005. We classify firms into groups based on their initial size at the start of each period and exclude firms which started in the first year of each time period.7
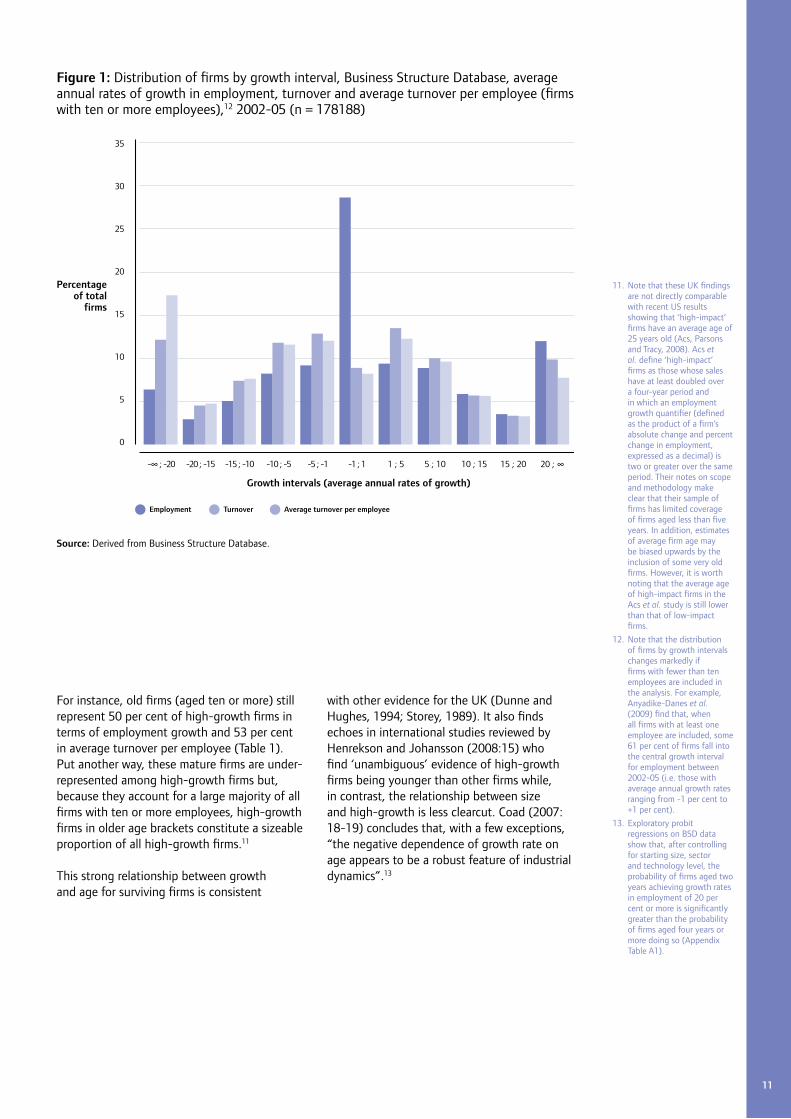
We first consider the main characteristics of high-growth firms in the UK by reporting analyses based on the Business Structure Database (BSD) which effectively covers all known firms in the UK (as recorded on the Inter-Departmental Business Register).9 As shown in Figure 1, just over two-thirds of firms
with ten or more employees recorded negative or minimal growth in employment between 2002 and 2005.10 Some 11,369 firms (about 6 per cent of the total) achieved the high-growth threshold of 20 per cent or higher average growth in employment during this period. This proportion rises to 12 per cent if growth is measured in terms of turnover (annual sales) and 17 per cent if growth in average turnover per employee is considered.
However, a large majority of the 30,828 firms achieving high-growth status in terms of average turnover per employee (TPE) between 2002 and 2005 did so in part by cutting back on employment. Some 71 per cent of these high-growth TPE firms recorded negative growth in employment over this period while a further 14 per cent recorded no growth in employment. In all, only 4,642 firms (2.6 per cent of all firms with ten or more employees) surpassed the high-growth TPE threshold whilst increasing employment.
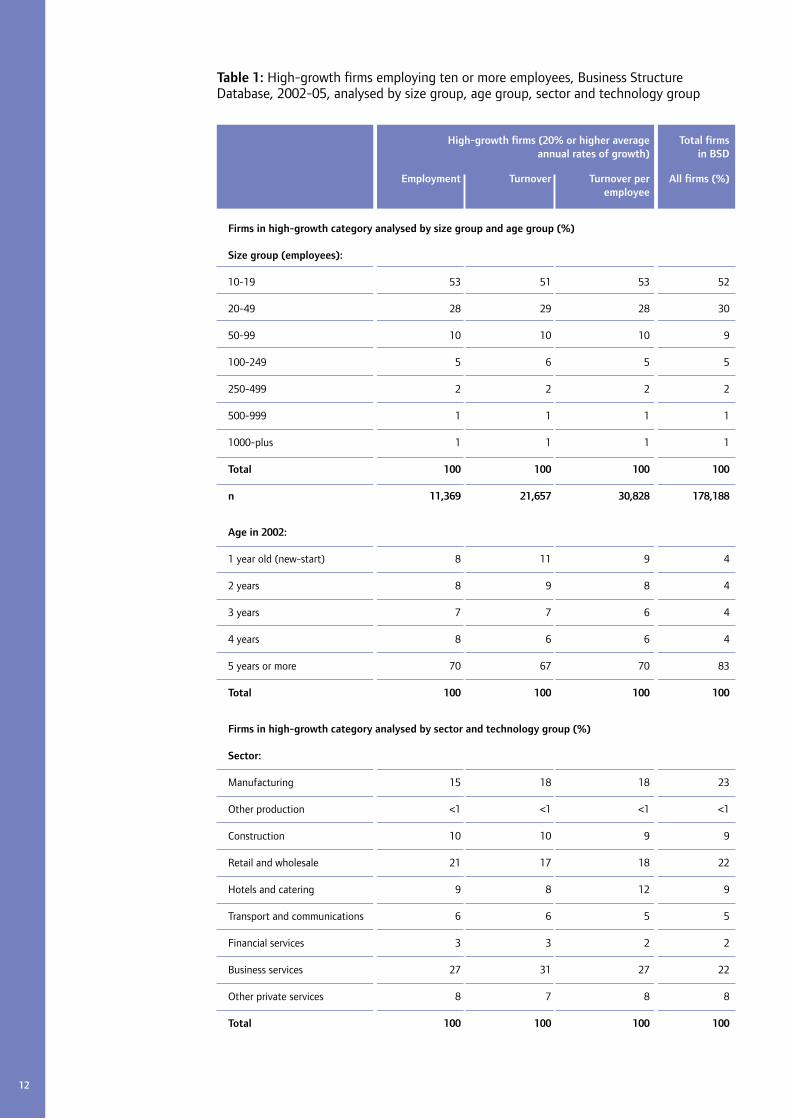
A firm’s age is more important to its growth than its sizeLooking at the results for 2002-05 in detail, business service firms are strikingly over-represented on all three high-growth measures while manufacturing firms are under-represented (Table 1). It is notable that the distribution of high-growth firms by size bracket on all three measures is not much different from the overall size-distribution of firms with ten or more employees.
By contrast, there is much more variation by age of firm with relatively young firms (those less than five years old) being over-represented on all three high-growth measures.11 However, most high-growth firms are still aged more than five years.
10
6. Anyadike-Danes, M., Bonner, K., Hart, M. And Mason, C. (2009) ‘Measuring Business Growth: High-growth firms and their contribution to employment in the UK.’ London: NESTA.
7. The reason for excluding firms born in the first year of each time period is that it is impossible to take account of how long each newborn firm was active during this first year.
8. The BSD is an experimental database constructed by the ONS by utilising the snapshots of the Inter-Departmental Business Register each year to construct a panel dataset. Further details are available in the BSD User Guide (Version 1, May 2006).
9. Average annual growth in variables of interest such as employment (N) is computed as follows:
where i = the number of years in each time period.
10. Firm age is here calculated following Anyadike-Danes et al. (2009) by using the presence or absence of employees in the period 1997-2002 to derive the age of the business. This criterion reflects the fact that 1997 is the starting year for the Business Structure Database.
11
For instance, old firms (aged ten or more) still represent 50 per cent of high-growth firms in terms of employment growth and 53 per cent in average turnover per employee (Table 1). Put another way, these mature firms are under-represented among high-growth firms but, because they account for a large majority of all firms with ten or more employees, high-growth firms in older age brackets constitute a sizeable proportion of all high-growth firms.11
This strong relationship between growth and age for surviving firms is consistent
with other evidence for the UK (Dunne and Hughes, 1994; Storey, 1989). It also finds echoes in international studies reviewed by Henrekson and Johansson (2008:15) who find ‘unambiguous’ evidence of high-growth firms being younger than other firms while, in contrast, the relationship between size and high-growth is less clearcut. Coad (2007: 18-19) concludes that, with a few exceptions, “the negative dependence of growth rate on age appears to be a robust feature of industrial dynamics”.13
11. Note that these UK findings are not directly comparable with recent US results showing that ‘high-impact’ firms have an average age of 25 years old (Acs, Parsons and Tracy, 2008). Acs et al. define ‘high-impact’ firms as those whose sales have at least doubled over a four-year period and in which an employment growth quantifier (defined as the product of a firm’s absolute change and percent change in employment, expressed as a decimal) is two or greater over the same period. Their notes on scope and methodology make clear that their sample of firms has limited coverage of firms aged less than five years. In addition, estimates of average firm age may be biased upwards by the inclusion of some very old firms. However, it is worth noting that the average age of high-impact firms in the Acs et al. study is still lower than that of low-impact firms.
12. Note that the distribution of firms by growth intervals changes markedly if firms with fewer than ten employees are included in the analysis. For example, Anyadike-Danes et al. (2009) find that, when all firms with at least one employee are included, some 61 per cent of firms fall into the central growth interval for employment between 2002-05 (i.e. those with average annual growth rates ranging from -1 per cent to +1 per cent).
13. Exploratory probit regressions on BSD data show that, after controlling for starting size, sector and technology level, the probability of firms aged two years achieving growth rates in employment of 20 per cent or more is significantly greater than the probability of firms aged four years or more doing so (Appendix Table A1).
-∞ ; -20 -20 ; -15 -15 ; -10 -10 ; -5 -5 ; -1 -1 ; 1 1 ; 5 5 ; 10 10 ; 15 15 ; 20 20 ; ∞
10
15
5
35
30
25
20
0
Employment Turnover Average turnover per employee
Percentageof total
firms
Growth intervals (average annual rates of growth)
Figure 1: Distribution of firms by growth interval, Business Structure Database, average annual rates of growth in employment, turnover and average turnover per employee (firms with ten or more employees),12 2002-05 (n = 178188)
Source: Derived from Business Structure Database.
12
Table 1: High-growth firms employing ten or more employees, Business Structure Database, 2002-05, analysed by size group, age group, sector and technology group
High-growth firms (20% or higher average Total firms annual rates of growth) in BSD
Employment Turnover Turnover per All firms (%) employee
Firms in high-growth category analysed by size group and age group (%)
Size group (employees):
10-19 53 51 53 52
20-49 28 29 28 30
50-99 10 10 10 9
100-249 5 6 5 5
250-499 2 2 2 2
500-999 1 1 1 1
1000-plus 1 1 1 1
Total 100 100 100 100
n 11,369 21,657 30,828 178,188
Age in 2002:
1 year old (new-start) 8 11 9 4
2 years 8 9 8 4
3 years 7 7 6 4
4 years 8 6 6 4
5 years or more 70 67 70 83
Total 100 100 100 100
Firms in high-growth category analysed by sector and technology group (%)
Sector:
Manufacturing 15 18 18 23
Other production <1 <1 <1 <1
Construction 10 10 9 9
Retail and wholesale 21 17 18 22
Hotels and catering 9 8 12 9
Transport and communications 6 6 5 5
Financial services 3 3 2 2
Business services 27 31 27 22
Other private services 8 7 8 8
Total 100 100 100 100

13
Notes: See notes to Figure 1. Percentage column totals may not sum to 100 due to rounding.
High-tech sectors are defined as follows (SIC codes): 64.20; 72.20; 72.30; Telecommunication, Computer Programming and Software Service Industries; 72.40; 72.60; 73.10; Data Processing, Misc. Computer Services, R&D in Natural Sciences and Engineering; 30.01; 30.02; 32.20; 32.30; Office Equipment; Computers and other Information Processing Equipment; Television and Radio Transmitters and Apparatus for Line Telephony and Line Telegraphy; Television and Radio Receivers, Sound or Video Recording and Reproducing Apparatus; 33.20; 33.30; 33.40 Electronic Instruments and Appliances for Measuring, Checking (except Industrial Process Control); Electronic Industrial Process Control Equipment; Optical Instruments; Photographic Equipment; 24.41; 24.42; 33.10 Pharmaceutical Products and Preparations; Medical and Life Sciences Surgical Equipment and Orthopaedic Appliances; 24.16; 24.17; 31.10; Plastics and Synthetic Rubber in Primary Form; Electric Manufacturing; 31.20; 32.10; 35.30. Motors, Generators and Transformers; Electricity Distribution and Control Apparatus; Electronic Valves, Tubes and other Components; Aircraft and Spacecraft Manufacturing.
Source: Derived from Business Structure Database.
High-growth firms (20% or higher average Total firms annual rates of growth) in BSD
Employment Turnover Turnover per All firms (%) employee
Firms in high-growth category analysed by size group and age group (%)
Technology group:
High-tech 7 8 7 6
Medium- or low-tech 93 92 93 94
Total 100 100 100 100

Part 3: The wider impact of high-growth firms
3.1 The effects of high-growth firms on aggregate economic performance
We now consider the extent to which firm growth makes an impact on economic and social outcomes over and above the direct effects of the fast-growing firms themselves. It is well understood that high-growth firms help improve productivity within their sectors by promoting more rapid churn (entry/exit) and resource reallocation between firms. At the same time, this external restructuring within sectors helps to raise multi-factor productivity growth within individual firms by inducing internal restructuring (Disney, Haskel and Heden, 2003; Aghion, Blundell, Griffith, Howitt and Prantl, 2007).
But high-growth firms’ contribution to the UK economy goes beyond that. For instance, existing research on the wider effects of rapidly-growing firms highlights their contribution to the development of local resources which help improve the productivity of other local firms, including those in different sectors. Examples include the build-up of local skills and business services, the intensification of supply-chain linkages and relationships between firms and local universities and research institutions. To the extent that the benefits of such developments are available to other firms at little or no cost to themselves, they may be regarded as ‘spillovers’ from the activities of rapidly-growing firms (Harris and Robinson, 2004; Crespi, Criscuolo, Haskel and Slaughter, 2008). Therefore, our focus is on the effects of spillovers from growing firms on wider economic and social outcomes, not just the effects of spillovers on the growth of other firms.
Growth spillovers in cities and regionsMany high-growth firms operate on a national or international scale and do not confine their important supply-chain or innovation-related interactions to specific geographical regions. However, focussing on economic and social outcomes at regional level provides a fruitful way of examining some of the spillover effects from firm growth in which we are interested, such as the development of the localised resources which underlie both intra-industry and inter-industry spillovers.
The benefits of regional-level analysis for investigation of spillovers are shown by Glaeser et al.’s (1992) study of 170 US cities, which suggests that industries grow slower in cities in which they have the most employees. This supports an argument that city diversity promotes growth as knowledge and ideas spread between sectors. Glaeser et al. also find evidence of urbanisation externalities (spin-offs or side effects), deriving from the impact of industrial growth on local payrolls and thus local demand for a wide range of goods and services (although there are some negative side effects such as overcrowding and growth in pollution).
Clearly, there may be some interdependence between this growth and its positive spillover effects. Growing firms contribute through knowledge, agglomeration14 and other spillovers to regional economic and social outcomes (for example, productivity levels and aspects of living standards such as employment and wage rates) while being simultaneously affected in their own growth rates by those regional characteristics. To investigate these issues further, we estimate the impact of firm growth on wider economic and social outcomes at regional level for the UK using
14
14. ‘Agglomeration spillovers’ here refer to the cost reductions or benefits that firms gain as a result of concentrating or clustering together.

econometric methods which take account of inter-dependence of this kind.
3.2 Spillovers from high-growth firms in UK city-regions
Our analysis uses a new dataset for the 45 UK city-regions which account for just under 80 per cent of total UK employment. City-regions typically comprise large metropolitan areas – or contiguous metropolitan areas – together with their surrounding hinterlands (Scott, 2005). Our own definition of city-regions derives from Robson et al. (2006) who used employment, housing, retail and commuting data to identify relatively self-contained city-regions which overlap with the commuting patterns of managers and professionals.
Thus city-regions potentially delineate both labour markets for high-level skills and the geographical boundaries within which extensive face-to-face business interactions and knowledge exchange may take place.
Our city-regions dataset has been built up from Local Authority District (LAD)-level data derived from a number of sources such as NOMIS, the Annual Survey of Hours and Earnings and the Business Structure Database (Appendix Tables A2-4).
The wider economic and social effects of high-growth firms in city-regions are assessed through measures of economic performance, living standards, and social exclusion and hardship. Descriptive statistics indicate that there are marked differences between city-regions in respect of employment and inactivity rates (Figure 2) as well as in median gross hourly pay levels.
Given that high-performing firms may be attracted to locations in areas of high skill density, it seems likely that some regions will benefit more than others from regional agglomeration and other spillovers from firm growth. Thus the concentration of high-growth firms may also contribute to the marginalisation of some regions through reduced labour force participation and pay rates.
15
0.600 0.650 0.700 0.750 0.800 0.850
0.180
0.200
0.160
0.140
0.120
0.280
0.260
0.240
0.220
0.100
Inactivityrate (%)
Employment rate (%)
y = -0.7659x + 0.7855R2 = 0.9545
Figure 2: Employment and inactivity rates, UK city-regions, 2007
Source: NIESR City-Regions Dataset.

Investigating the impact of high-growth firms on economic performance and living standardsIn order to assess the impact of the distribution of firm growth rates at city-region level on wider economic and social outcomes, we test whether these outcomes are more closely linked to a small minority of high-growth firms than they are to moderate performance by ‘average’ firms. We do so by examining the effects of both the average growth rate achieved by firms in city-regions and the skewness of the growth distribution. Finally, we also examine the impact of new firm start-ups on the same socio-economic outcomes.
We use the following measures to characterise the firm growth distribution and the entry of new firms:
•Mean firm growth rate (employment-weighted)
•Employment share of high-growth firms
•90th percentile firm growth rate (employment-weighted)
•New-start firms per 1,000 working age population
And we consider three sets of socio-economic outcomes:
1. Measures of economic performance at city-region level:
a. Annual growth rate of private sector employment
b. Employment rate (employed persons as a proportion of the total working age population, defined as men aged 16-64 and women aged 16-59)
2. Measures of social exclusion at city-region level:
a. Inactivity rate (persons neither working nor seeking employment as a proportion of the total working-age population)
b. Dependency rate (non-employed persons as a proportion of the total population)
3. Pay at city-region level:
a. Median gross hourly pay (2005 prices)
Other variables in the dataset enable us to take account of workforce qualifications, industrial structure, age and size structure of firms and the annual rate of growth in the working-age population. The latter variable captures the net effects of age-related movements into and out of working-age populations as well as net migration in and out of city-regions by working-age people. Finally, in all models except those where the dependent variables are wage-related, we enter the average gross hourly rate of pay as an independent variable, as a rough proxy for average labour productivity. Box 1 provides further details of the empirical models and estimation methods that we use, which also address the problem of simultaneity between firm growth and the other socio-economic variables.
High-growth firms drive employment growth The results summarised in Table 2 provide strong evidence that high-growth firms have a positive impact on private sector employment growth and employment rates and a negative impact on inactivity and dependency rates. For example, an increase of 5 percentage points (pp) in the employment share of high-growth firms is associated with an increase of 3.5 pp in private sector employment growth rates (Table 2, Panel A, Column 2) and a 1 percentage point increase in employment rates in a city-region (Table 2, Panel B, Column 2). It is notable that these spillover effects derive from high-growth firms but not from firms with average (mean) employment growth.
The effects of new firm start-ups are mixedEmployment rates also benefit from entrepreneurship in the form of new firm start-ups. But our measure of business start-ups is not associated with faster growth in private sector employment or with lower inactivity and dependency rates in UK city-regions. This may reflect the fact that, as other research in German and US regions suggests, new firm start-ups take time to impact on employment growth (Fritsch and Mueller, 2004; Acs and Mueller, 2008). Hence, it is possible that longer lags would capture greater effects of business start-ups on employment growth in UK city-regions.
Pay levels are independent of entry and growthWe do not find any effect of high-growth firms or new firm start-ups on regional pay levels and higher pay rates. This may reflect the net outcome of contending forces in regional labour markets. On the one hand, relatively
16

low pay may (all else being equal) encourage growth in many types of employment, in particular, of low-skilled workers. On the other hand, rapid firm growth may increase the demand for labour, putting upward pressure on wage rates in some city-regions but also attracting new workers from other regions.
We provide full tables describing the models that we estimate in the Appendix (Tables A5-9). These tables show that several other variables contribute substantially to the explanatory power of our models. For example, the graduate share of employment is strongly positively related to employment rates as is the high-tech share of employment (Table A6). The annual growth rate of the working-age population (which captures differences in age structure and net migration between city-regions) has no significant effects on employment or inactivity rates but is strongly positively associated with dependency rates (Table A8). However, we do not find any significant links between firm growth measures and pay (Table A9).15
17
15. This conclusion also applies to estimates (not reported here) in which average pay levels and annual growth rates in median and average hourly pay were taken as dependent variables.
In more precise terms, our empirical model takes the form:
(1.1) SOit = ß0 + ß1 FGit + ß2 Xit + εit
where i denotes city-regions; SO represents a selected socio-economic outcome measure; FG is a measure of firm growth; X is a vector of city-region characteristics which prior research has suggested may affect social and economic outcomes at regional level, for example, workforce skills, industrial structure and pay rates (Overman and Puga, 2002; Badinger and Url, 2002); and ε is an error term.
Analysis of bivariate correlations suggests that our measures of firm growth are likely to have contemporaneous effects on growth rates in private sector employment but lagged effects on socio-economic outcomes such as employment and dependency rates. Accordingly, in the latter cases Equation (1.1) is modified to allow for one-year lagged measures of firm growth (FG
t-1) as
independent variables. The firm start-up rate is entered as a once-lagged variable in all models, reflecting evidence that any effect it has on employment rates take
time to develop (Fritsch and Mueller, 2004; Acs and Mueller, 2008). Note also that the results shown here make use of employment-weighted versions of firm growth rates; alternative estimates (not shown here) indicate that our main conclusions are not altered if we use unweighted growth rates.
The estimates presented in Table 3.1 are for Fixed Effects (FE) specifications using Instrumental Variable (IV) techniques. FE models make use of time series variation within city-regions but not of cross-sectional variation between city-regions. This ensures the consistency of our estimators by removing city-region specific effects which are correlated with independent variables in our models. IV methods are required to allow for the potential endogeneity (two-way interdependence or reverse causality) of our firm growth indicators. These indicators are instrumented by second lag and rank order versions of themselves. While the rank order terms are still highly correlated with the original firm growth measures, they are purged of ‘errors in variables’ (measurement error) that might be related to the error terms in the main regressions (Durbin, 1954; Johnston, 1972).
Box 1: Socio-economic outcomes and firm growth at city-region level

18
Table 2: Fixed effects instrumental variable estimates of the determinants of socio-economic outcomes at city-region level, 1997-2007
(1) (2) (3)
Dependent variable: (A) Annual rate of growth in private sector employment
Mean firm employment growth rate (weighted) (t) 0.0004 0.0001 0.0002
[0.0008] [0.0008] [0.0008]
New firm start rate (t-1) -0.0016 -0.0037 -0.0035
[0.0030] [0.0032] [0.0031]
Employment share of high-growth firms (t) 0.7095***
[0.2144]
90th percentile firm growth rate (weighted) (t) 0.0017**
[0.0008]
Dependent variable: (B) Employment rate
Mean firm employment growth rate (weighted) (t-1) -0.0001 -0.0002 -0.0002
[0.0003] [0.0003] [0.0003]
New firm start rate (t-1) 0.0027* 0.0031** 0.0030**
[0.0014] [0.0012] [0.0012]
Employment share of high-growth firms (t-1) 0.1981***
[0.0762]
90th percentile firm growth rate (weighted) (t-1) 0.0007**
[0.0003]
Dependent variable: (C) Inactivity rate
Mean firm employment growth rate (weighted) (t-1) 0.0002 0.0003 0.0003
[0.0003] [0.0003] [0.0003]
New firm start rate (t-1) -0.0008 -0.0011 -0.001
[0.0012] [0.0011] [0.0011]
Employment share of high-growth firms (t-1) -0.1470**
[0.0629]
90th percentile firm growth rate (weighted) (t-1) -0.0005**
[0.0002]

19
(1) (2) (3)
Dependent variable: (D) Dependency rate
Mean firm employment growth rate (weighted) (t-1) 0.0000 0.0000 0.0000
[0.0003] [0.0003] [0.0003]
New firm start rate (t-1) 0.0000 -0.0002 -0.0002
[0.0012] [0.0013] [0.0013]
Employment share of high-growth firms (t-1) -0.1067**
[0.0506]
90th percentile firm growth rate (weighted) (t-1) -0.0003*
[0.0002]
Dependent variable: (E) Median gross hourly pay
Mean firm employment growth rate (weighted) (t-1) -0.0003 -0.0001 0.0001
[0.0051] [0.0052] [0.0051]
New firm start rate (t-1) 0.0318* 0.0308 0.0311
[0.0190] [0.0193] [0.0191]
Employment share of high-growth firms (t-1) -0.4831
[0.9659]
90th percentile firm growth rate (weighted) (t-1) -0.0017
[0.0037]
Notes: *** p<0.01, ** p<0.05, * p<0.1
Robust standard errors, shown in brackets, are corrected for clustering of observations at the city-region level. All equations include year dummies and control variables for graduate share of employment; manufacturing, business services, high tech and public sector shares of employment; small firms share of employment; older firms share of employment; and annual growth rate of working-age population. Average gross hourly pay rates are also entered as an independent variable in all models except where the dependent variable is median gross hourly pay. See Appendix Tables A5-9 for details of fixed effects IV specifications and statistical tests for all models.

Part 4: Innovation and firm growth
Innovation is one of the main channels by which growing firms affect wider economic performance. High-growth firms are likely to contribute disproportionately to innovation activity, and thus generate in the process significant spillovers that benefit other firms.
But the relationship between firm growth and innovation is two-way. Investing in innovation is one of the drivers of firm growth, while high-growth firms are also in a better position to innovate. Therefore, we need to address this inter-dependence. But prior to doing so, we briefly review what we know about the drivers of firm growth, and the role that innovation plays in the process.
4.1 Explaining persistent differences in firm growth
Why do some firms perform so much better than others? Resource- and knowledge-based theories of the firm suggest that differences arise because successful firms build up distinctive resources, capabilities and structures over time which:
i. permit them to offer superior product performance and/or lower prices;
ii. are difficult and/or costly for other firms to duplicate or imitate.
Here, resources and capabilities are broadly defined to include intangible assets such as skills, tacit knowledge and relationships with external organisations, as well as the tangible assets arising from past investments in capital equipment and new product development. In each sector, those firms which achieve a
position of relatively high profitability will need to continue developing new capabilities to retain those positions. For example, firms which have benefited from a breakthrough new product are under pressure to scale up production in ways that rivals find hard to emulate.
In this context it is hardly surprising that firms grow in different ways. At each point, the opportunities confronting firms – and their ability to respond to them – are shaped by the idiosyncratic and specific nature of their own previous decisions, as well as the resources and capabilities which they have accumulated, and their organisational routines. Thus the present-day options confronting firms reflect their history, that is, they are ‘path dependent’. When seeking to respond to competitive market pressures and opportunities, firms are each typically starting from very different places in terms of the firm-specific knowledge, operational capabilities and dynamic or change capabilities which they have accumulated (Teece, Pisano and Shuen, 1997; Eisenhardt and Martin, 2001; Teece, 2007).
Both mature and new firms are under pressure to innovateClearly, these issues arise most strongly in mature firms which may face difficulties in responding to pressures for change while their existing products and routines remain profitable. March (1991) characterises this dilemma in terms of the ‘exploitation’ of existing resources and capabilities versus the need for ‘exploration’ of new technologies, markets and organisational structures. The ability to balance this tension is described as ‘ambidexterity’ by O’Reilly and Tushman (2007) whose review of firm-level studies points to marked differences between firms in the senior
20
management capabilities needed to adapt to emerging markets and technologies while continuing to make effective use of existing assets (for example, the ability to manage organisational sub-units with very different short-term objectives).16
By contrast, newer firms are typically small, making their first priority reaching the minimum efficient scale of operations for their sector quickly if they are to stand any chance of competing against incumbent firms (Audretsch, 1995). However, like older firms, they will be aided in achieving rapid growth if they engage in ‘innovation’ in the broad sense proposed by Schumpeter (1939), that is, if they combine resources in new and better ways than other slower-growing competitor firms.
Mixed evidence on firm growth and innovationIn this context it is surprising that empirical evidence on the relationship between innovation and firm growth has until recently been mixed. While employment growth is usually positively related to product innovations, the effects of process innovations on employment growth are more variable. At the same time there is strong evidence of positive links between innovation and productivity growth at firm level (Ahn, 2002; Lööf and Heshmati, 2006; Parisi, Schiantarelli and Sembenelli, 2006) but researchers often fail to find any clear link between innovation and firm sales growth (Coad, 2007).
One explanation is that investments in different forms of innovation pay off differently and on different timescales for different firms (Coad and Rao, 2008). This reflects both the inherent riskiness of innovation and the different levels of investment by firms in skills and external relationships. But different proxy measures of innovation also have their limitations. Innovation input measures such as R&D spending or R&D employment provide no indication of the effectiveness of firms’ innovation activities. They also suffer from the fact that in many sectors innovation is not the result of formal R&D investment for which data are collected. At the same time, innovation output measures such as patents may be poor indicators of the commercial value of the innovations concerned and also tend to be more prevalent in some sectors than others.
4.2 Firm growth and innovation success
We now turn to examine the innovation performance of high-growth firms in the UK. In the process we aim to shed light on the relationship between firm growth and innovation. In particular, we want to disentangle the effect of innovation on growth from the effect of growth on innovation. We focus on the following questions:
1. Does innovation in preceding time periods drive firm growth today? And is the impact the same across firms, or do some firms benefit more from innovation than others?
2. Do high-growth firms contribute disproportionately to aggregate innovative activity in time periods following their rapid growth?
As the previous discussion makes clear, commonly-used innovation measures are far from perfect. But measures of ‘innovation success’ (e.g. the sales share of new products in a specified time period) are potentially more attractive than innovation input or process measures because they come closer to capturing the commercial potential generated by firms’ previous investments in innovation and their development of innovation-related capabilities. Accordingly, we use innovation success measures derived from Community Innovation Survey (CIS) data and firm-level data on employment growth derived from the Business Structure Database (BSD) to address these questions.
Our analysis is based on data for 12,672 firms with ten or more employees in the 2002-04 CIS4 which could be matched against firm-level data in the BSD and of those just under half (6,216) could also be matched against participants in the 2004-06 CIS5.17
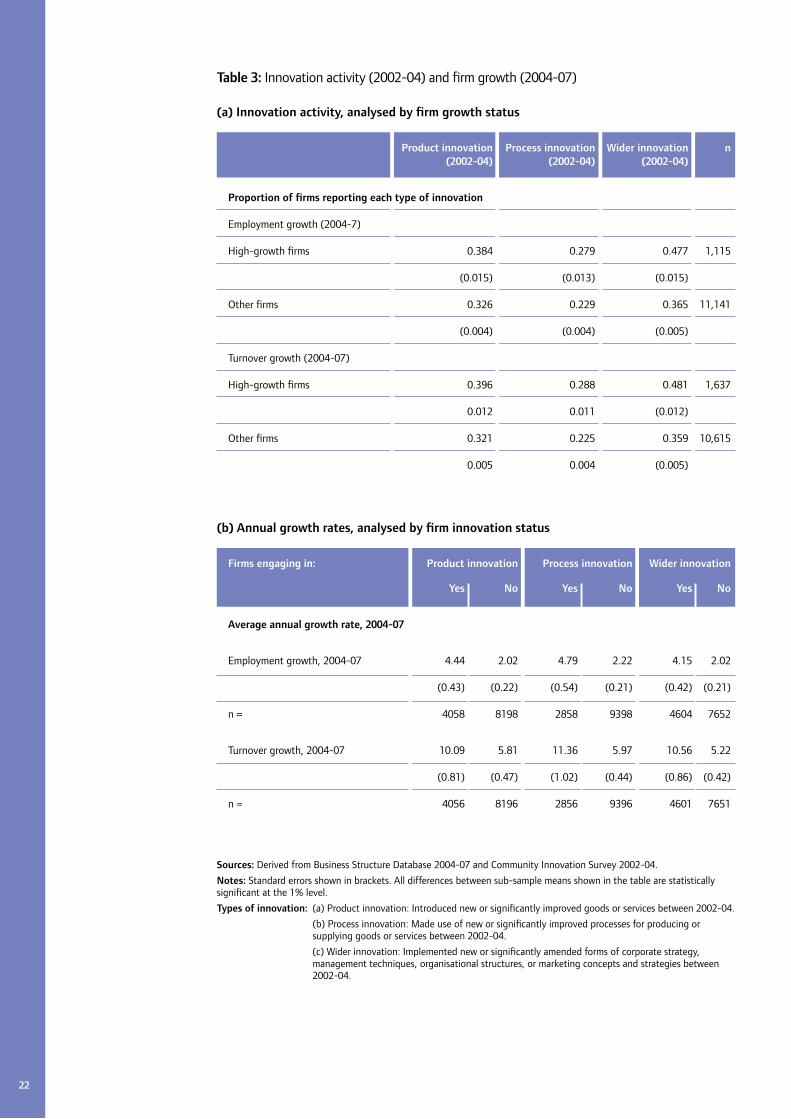
As a starting point for our analysis, Table 3 presents basic summary statistics of innovation activity by high-growth firms compared to other firms which did not achieve the 20 per cent-plus high-growth threshold in employment or turnover. On three different indicators of innovation – new products, new processes and innovations in business structures and practices (as defined in the notes to Table 3) – high-growth firms are significantly more innovative than other firms in the economy (Panel A). For example, some 38 per cent of high-growth firms reported product innovations compared to 33 per cent in non-high-growth firms. Similarly, we can
21
16. Birkinshaw and Gibson (2004) provide evidence derived from ten multinational firms that the ability to strike a balance between ‘adaptability’ (e.g. responding to new opportunities) and ‘alignment’ (e.g. extracting maximum value from existing proprietary assets) is positively associated with corporate performance.
17. Full details of the datasets and matching procedures are available from the authors on request, as is further information on the derivation of measures of innovation success, innovation inputs and related capabilities.
22
Product innovation Process innovation Wider innovation n (2002-04) (2002-04) (2002-04)
Proportion of firms reporting each type of innovation
Employment growth (2004-7)
High-growth firms 0.384 0.279 0.477 1,115
(0.015) (0.013) (0.015)
Other firms 0.326 0.229 0.365 11,141
(0.004) (0.004) (0.005)
Turnover growth (2004-07)
High-growth firms 0.396 0.288 0.481 1,637
0.012 0.011 (0.012)
Other firms 0.321 0.225 0.359 10,615
0.005 0.004 (0.005)
Firms engaging in: Product innovation Process innovation Wider innovation
Yes No Yes No Yes No
Average annual growth rate, 2004-07
Employment growth, 2004-07 4.44 2.02 4.79 2.22 4.15 2.02
(0.43) (0.22) (0.54) (0.21) (0.42) (0.21)
n = 4058 8198 2858 9398 4604 7652
Turnover growth, 2004-07 10.09 5.81 11.36 5.97 10.56 5.22
(0.81) (0.47) (1.02) (0.44) (0.86) (0.42)
n = 4056 8196 2856 9396 4601 7651
Table 3: Innovation activity (2002-04) and firm growth (2004-07)
(a) Innovation activity, analysed by firm growth status
(b) Annual growth rates, analysed by firm innovation status
Sources: Derived from Business Structure Database 2004-07 and Community Innovation Survey 2002-04.
Notes: Standard errors shown in brackets. All differences between sub-sample means shown in the table are statistically significant at the 1% level.
Types of innovation: (a) Product innovation: Introduced new or significantly improved goods or services between 2002-04.
(b) Process innovation: Made use of new or significantly improved processes for producing or supplying goods or services between 2002-04.
(c) Wider innovation: Implemented new or significantly amended forms of corporate strategy, management techniques, organisational structures, or marketing concepts and strategies between 2002-04.

also break the data by innovators vs. non-innovators and look at average annual growth rates in each type of firm. As shown in Table 3, Panel B, average annual growth rates in both employment and sales were significantly higher for innovative firms than for non-innovators.
But many other factors, such as industry and size, could be driving these differences. So next we undertake an econometric analysis to control for these other factors, while also examining the direction of causation. We first estimate an equation taking a measure of innovation success as dependent variable, with measures of firms’ investments in
the development of innovation-related capabilities entered as independent variables (see Appendix Table A11). Subsequently, for reasons described in Box 2, the predicted values of innovation success generated by this regression are entered as independent variables in a second equation which estimates the determinants of firm growth over a three-year period subsequent to the recording of innovation success. Our methodology also takes account of the ‘survivor bias’ arising from the fact that we can only explore the growth rates of firms which have survived until the end of each time period.
23
In order to explore the links between innovation inputs, innovation success and firm growth, we first estimate an equation taking a measure of innovation success as a dependent variable, with measures of firms’ investments in the development of innovation-related capabilities in the current year and the previous two years entered as independent variables:
(2.1) NPSit = ß0 + ß1 ∑j INNijt* + ß2 ∑
k Xikt + εit
where i denotes firms; NPSt is the new products share of turnover in year t; INNt* is a vector of j innovation inputs and capabilities developed in the time period t-2 to t; Xt is a vector of k firm-specific characteristics such as employment size, age, sector, region and geographic market focus; and ε is an error term.
Subsequently, the predicted values of innovation success generated by this regression are entered as independent variables in a second equation which estimates the determinants of firm growth, measured successively as growth in employment and turnover (sales):
(2.2) FG(t+3)/t = ß0 + ß1 NPSit + ß2 ∑k Xikt + vit
where FG(t+3)/t is a measure of firm growth between years t and t+3, and v is an error term.
By evaluating the relationship between innovative success in year t and firm
growth in a subsequent three-year period, we attempt to control for problems of simultaneity, i.e. two-way interdependence between firm growth and innovation in the same time period. Furthermore, using the predicted value of the dependent variable in the first equation as a regressor in the second equation has the advantage of addressing other concerns about endogeneity (reverse causality) since the predicted values of the innovation success measure are not correlated with the error term in the second equation as might be expected if we used the actual values of this measure.
Equation 2.1 is estimated by Tobit methods which are preferred when the dependent variable is left- and right-censored (as it is in this case, ranging between 0-100). Equation 2.2 is first estimated using Heckman two-step OLS (Ordinary Least Squares) regression methods with firm growth conditioned on a prior selection equation estimating the probability of firm survival from 2004 until 2007. The identifying variables in this selection equation relate to market conditions, namely, the extent to which markets are dominated by established firms and/or are subject to uncertain demand. This produces estimates of the ‘average’ effect of innovation success on firm growth. Subsequently, we carry out quantile regressions which enable us to explore the relationship between innovation success and firm growth at different points on the firm growth distribution.
Box 2: Empirical models of firm growth and innovation
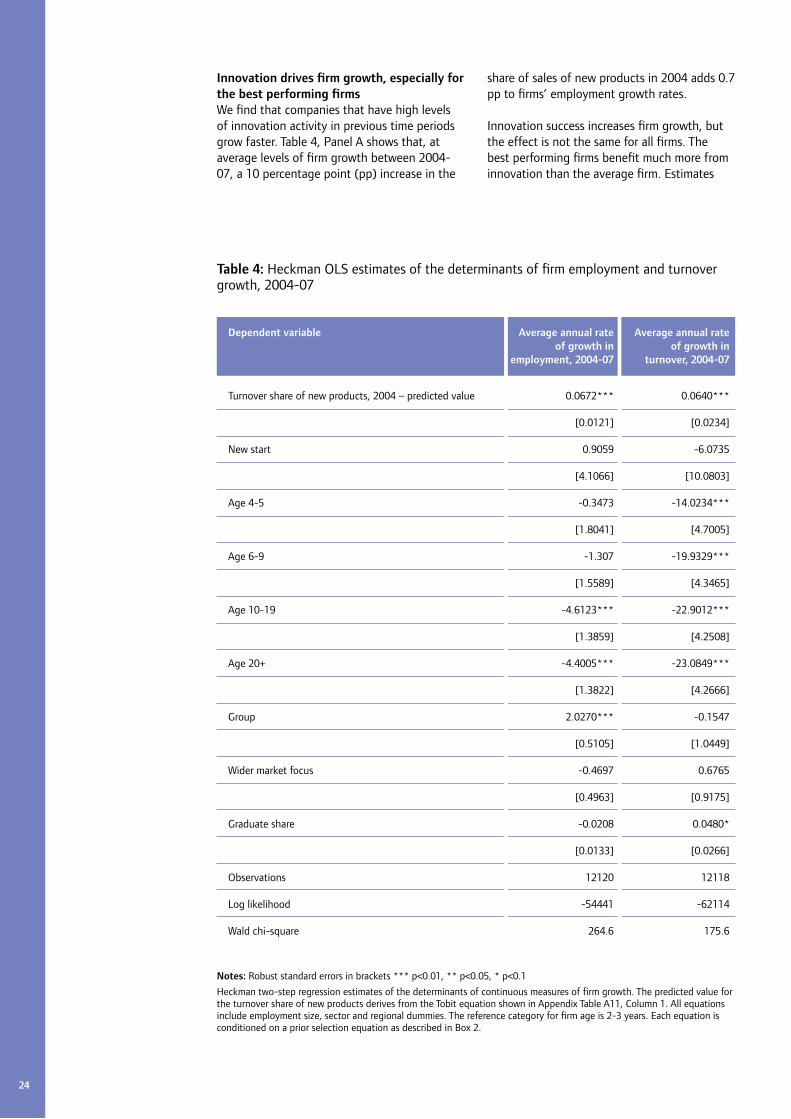
Innovation drives firm growth, especially for the best performing firmsWe find that companies that have high levels of innovation activity in previous time periods grow faster. Table 4, Panel A shows that, at average levels of firm growth between 2004-07, a 10 percentage point (pp) increase in the
share of sales of new products in 2004 adds 0.7 pp to firms’ employment growth rates.
Innovation success increases firm growth, but the effect is not the same for all firms. The best performing firms benefit much more from innovation than the average firm. Estimates
24
Dependent variable Average annual rate Average annual rate of growth in of growth in employment, 2004-07 turnover, 2004-07
Turnover share of new products, 2004 – predicted value 0.0672*** 0.0640***
[0.0121] [0.0234]
New start 0.9059 -6.0735
[4.1066] [10.0803]
Age 4-5 -0.3473 -14.0234***
[1.8041] [4.7005]
Age 6-9 -1.307 -19.9329***
[1.5589] [4.3465]
Age 10-19 -4.6123*** -22.9012***
[1.3859] [4.2508]
Age 20+ -4.4005*** -23.0849***
[1.3822] [4.2666]
Group 2.0270*** -0.1547
[0.5105] [1.0449]
Wider market focus -0.4697 0.6765
[0.4963] [0.9175]
Graduate share -0.0208 0.0480*
[0.0133] [0.0266]
Observations 12120 12118
Log likelihood -54441 -62114
Wald chi-square 264.6 175.6
Table 4: Heckman OLS estimates of the determinants of firm employment and turnover growth, 2004-07
Notes: Robust standard errors in brackets *** p<0.01, ** p<0.05, * p<0.1
Heckman two-step regression estimates of the determinants of continuous measures of firm growth. The predicted value for the turnover share of new products derives from the Tobit equation shown in Appendix Table A11, Column 1. All equations include employment size, sector and regional dummies. The reference category for firm age is 2-3 years. Each equation is conditioned on a prior selection equation as described in Box 2.

based on quantile regression methods suggest that the impact of a 10 pp increase in the share of sales of new products rises to almost a 1.5 pp increase on employment growth rates for the most rapidly-growing firms, represented here by those at the 95th percentile of the firm growth distribution (Table 5).18 Similar results are obtained when we use a different specification which covers a different time period for firm employment growth (2006-08) and allows for the possibility of longer lags in the effects of innovation investment (between 2002-04) on innovation success in 2006.19
Younger firms grow fasterThese results also provide some insights on some of the other factors that drive growth. In particular, they show that surviving young firms aged between two and three years experience the fastest growth, both in employment and sales. This partly reflects the fact that young firms are typically relatively small and thus are starting from a low employment base. But it is also consistent with expectations that the small minority of young firms that survive their initial few years of existence do so by developing innovative ways of outperforming
25
18. This result is clearly consistent with that obtained by Coad and Rao (2008).
19. In this alternative model, the analysis is based on the subset of firms which are represented in both CIS4 and CIS5. First, innovation success in 2006 (measured by the turnover share of new products) is regressed on firms’ investments in innovation inputs and the development of innovation-related capabilities between 2002-04. Subsequently, the predicted value of innovation success derived from this model is entered as an independent variable in models taking firm growth in employment between 2006-08 as dependent variable. These results are available from the authors on request.
Dependent variable Average annual rate Average annual rate of growth in of growth in employment, 2004-07 turnover, 2004-07
Turnover share of new products – predicted value
25th percentile 0.0240*** 0.0251***
[0.0084] [0.0077]
50th percentile 0.0223*** 0.0404***
[0.0049] [0.0069]
75th percentile 0.0465*** 0.0548***
[0.0091] [0.0118]
90th percentile 0.0844*** 0.0854***
[0.0171] [0.0302]
95th percentile 0.1448*** 0.1241**
[0.0362] [0.0525]
Observations 11709 11707
.25 Pseudo R2 0.0116 0.0116
.50 Pseudo R2 0.0085 0.0137
.75 Pseudo R2 0.0284 0.0330
.90 Pseudo R2 0.0550 0.0556
.95 Pseudo R2 0.0765 0.0884
Table 5: Simultaneous quantile regression estimates of the determinants of firm employment and turnover growth, 2004-07
Notes: Bootstrapped standard errors in brackets (50 replications). *** p<0.01, ** p<0.05, * p<0.1
The predicted value for the turnover share of new products derives from the Tobit equation shown in Appendix Table A11, Column 1. All equations include employment size, sector and regional dummies and control variables for group membership, geographical market focus and graduate share of employment.

their rivals and achieving the minimum efficient scale needed to operate successfully in their industries.
Firms that grow fast continue to be more innovative in the futureWe have shown that innovation drives growth, so now we ask whether growth also drives innovation. In short, we examine whether high-growth firms contribute disproportionately to aggregate innovative activity in time periods following their rapid growth. If the answer is affirmative, then not only does rapid firm growth depend on innovation but it also contributes to subsequent increases in innovative activity in the economy.
Here we define innovation intensity as the ratio of total expenditures on innovation-related activities to total sales.20 We then estimate the relationship between innovation intensity and a measure of external knowledge sourcing activity in 2002-04 and firm growth in a prior period, namely, 1999-2002. As shown in Table 6, firms that grow in terms of employment go on to experience higher levels of innovation intensity in subsequent periods. And this impact is significantly larger for high-growth firms than for firms in the bottom half of the firm growth distribution.21
By contrast, a more nuanced picture emerges if we consider growth in sales. Average turnover growth is not significantly related to future innovation intensity. However, firms in the upper half of the firm sales growth distribution are significantly more likely to report future increases in innovation intensity than firms in the lower quartile of the distribution.
Inter-organisational collaboration in research and knowledge transferTurning to another measure of innovative activity – firms’ involvement in external knowledge sourcing – we find that this kind of activity is significantly positively related to prior growth in average turnover but there is no clear evidence that this impact is greater for the fastest-growing firms (for example, those at the 95th percentile). Nor is there any discernible impact of employment growth on future external knowledge sourcing (Appendix Table A15). Therefore, high-growth firms do not appear to contribute disproportionately to inter-organisational collaboration in research and knowledge transfer. This is consistent with findings for Northern Continental European countries by Hölzl and Friesenbichler (2008) and may reflect the fact that measures of external collaboration do not convey
information about the degree of success resulting from external relationships.
26
20. The activities included in this definition are innovation-related expenditures on internal R&D, acquisition of external R&D, acquisition of machinery, equipment and software, acquisition of external knowledge, training, design and marketing.
21. This conclusion is supported by alternative estimates based on different time periods where we regress innovation intensity in 2004-06 on firm growth in 2001-04 (Appendix Table A14).

27
Table 6: Tobit estimates of the determinants of innovation intensity at firm level in CIS4 (2002-04)
(1) (2) (3) (4)
Average employment growth, 1999-2002 1.2683**
[0.5501]
Employment growth, 1999-2002 – 25th-49th percentiles 0.7685**
[0.3169]
Employment growth, 1999-2002 – 50th-74th percentiles 1.0670***
[0.2590]
Employment growth, 1999-2002 – 75th-94th percentiles 1.1476***
[0.3455]
Employment growth, 1999-2002 – 95th-100th percentiles 1.4691**
[0.6180]
Average turnover growth, 1999-2002 0.6109
[0.4349]
Turnover growth, 1999-2002 – 25th-49th percentiles 0.4579
[0.3056]
Turnover growth, 1999-2002 – 50th-74th percentiles 0.8824***
[0.3090]
Turnover growth, 1999-2002 – 75th-94th percentiles 1.2317***
[0.3240]
Turnover growth, 1999-2002 – 95th-100th percentiles 0.6310
[0.5926]
Observations 9996 9996 9944 9944
Log likelihood -25971 -25966 -25819 -25813
Pseudo R sqd 0.016 0.0162 0.016 0.0162
Notes: Bootstrapped standard errors in brackets *** p<0.01, ** p<0.05, * p<0.1
Tobit estimates. The dependent variable is the measure of innovation intensity for 2002-04 (CIS4), defined as described in the notes to Table A2. All equations include firm age, employment size, sector and regional dummies and control variables for group membership, geographical market focus and graduate share of employment.

Part 5: Assessment
Taken together, our results suggest that high-growth firms influence national economic performance and social outcomes in several ways:
•The direct effects of individual firms’ contributions to employment, output and productivity growth (reflecting their investments in resources and development of capabilities).
•The positive impact of high-growth firms on aggregate productivity growth which occurs by displacing weaker firms and speeding up the reallocation of their resources to stronger firms. This process also encourages greater innovation and efficiency in surviving firms.
•The spillover effects of rapid firm growth on the growth of other firms as well as on regional economic and social outcomes such as employment and inactivity rates.
•Positive effects on overall innovative activity, since high-growth firms are responsible for a disproportionate amount of innovation.
However, the relative importance of these channels is hard to establish since the different effects are often closely related. For example, the greater the aggregated direct effects of firm growth, the more likely national economic performance will benefit from both resource reallocation and spillovers. On the one hand, the higher the proportion of firms in the economy that may be classified as high-growth by some objective criterion, the more likely weak firms are to be squeezed out of their markets and their resources made available to stronger performers. On the other hand, rapid firm growth depends in large part on the development of dynamic capabilities
deriving from investments in skills, knowledge, innovation, external relationships and other intangible assets which research suggests have strong spillover effects on the growth of other firms.
In respect of wider social outcomes, it can be argued that some aspects of rapid firm growth may be at odds with policy objectives to reduce regional disparities within the UK. Given the likelihood that high-performing firms are attracted to areas of high skill density, some regions are more likely than others to benefit from regional agglomeration effects and other spillovers from firm growth, which may result in a widening of regional disparities. However, at national level these developments are clearly offset by the positive impacts of high-growth firms.
To what extent does it matter for economic and social outcomes if firm growth takes the form of a small minority of outstanding performers as compared to, say, a strong average growth performance by firms in general? For wider social outcomes such as employment rates, our evidence shows that the prevalence of high-growth firms has a strong impact over and above the effects of firms expanding at average rates of growth.
In addition, high-growth firms contribute disproportionately to aggregate innovative activity. And innovation itself drives firm growth. We find that the ability of high-growth firms to outperform their rivals typically reflects success in broadly-defined innovation of some kind (for example, new or improved products, processes, routines or service delivery). This relationship is strongest at the upper end of the firm growth distribution. However, average firm growth is also enhanced by prior success in
28

innovation as a result of innovative investments and the development of innovation-related capabilities.
While many high-growth firms are relatively new, only a small proportion of new firms succeed in achieving high-growth status. At the same time, mature firms constitute a large proportion of high-growth firms but the vast majority of older firms (including smaller ones) do not grow much at all. One implication for policymakers is that industrial support for small and medium-sized firms is probably best targeted, whenever feasible, at firms which have demonstrated some capacity or potential to grow rather than being made available to a broad mass of firms. In this respect it is particularly important for business support policy to focus on ways of improving the availability of finance for rapidly-growing firms to continue to make investments in innovation.
29

References
Acs, Z. and Mueller, P. (2008) Employment effects of business dynamics: mice, gazelles and elephants. ‘Small Business Economics.’ 30, pp.85-100.
Acs, Z., Parsons, W. and Spencer, T. (2008) ‘High Impact Firms: Gazelles Revisited.’ Washington DC: Office of Advocacy, US Small Business Administrations.
Aghion, P., Blundell, R., Griffith, R., Howitt, P. and Prantl, S. (2009) The Effects of entry on incumbent innovation and productivity. ‘Review of Economics and Statistics.’ 91:1, pp.20-32.
Ahmad, N. and Gonnard, E. (2007) ‘High-growth enterprises and gazelles.’ Paper presented at The International Consortium on Entrepreneurship (ICE), 22-23 February 2007, Copenhagen.
Ahn, S. (2001) ‘Firm dynamics and productivity growth: a review of micro evidence from OECD countries.’ OECD Economics Department Working Papers, No. 297. Paris: OECD.
Anyadike-Danes, M., Bonner, K., Hart, M. and Mason, C. (2009) ‘Measuring Business Growth: High-growth firms and their contribution to employment in the UK.’ London: NESTA.
Audretsch, D. (1995) Innovation, growth and survival. ‘International Journal of Industrial Organisation.’ 13(4), pp.441-457.
Badinger, H. and Url, T. (2002) Determinants of regional unemployment: some evidence from Austria. ‘Regional Studies.’ 36, pp.977-988.
Bartelsman, E., Scarpetta, S. and Schivardi, F. (2003) ‘Comparative analysis of firm demographics and survival: Micro level evidence from OECD countries.’ OECD Economics Department Working papers, No. 348. Paris: OECD.
Bartelsman, E., Haltiwanger, J. and Scarpetta, S. (2005) ‘Measuring and analysing cross-country differences in firm dynamics.’ Paper presented to NBER Conference on Research in Income and Wealth, April 8-9, 2005.
BERR (2008a) ‘The economic drivers of government-funded business support: supporting analysis for Solutions for Business: Supporting Success.’ London: BERR.
BERR (2008b) ‘High-growth firms in the UK: Lessons from an analysis of comparative UK performance.’ Economics Paper No. 3. London: BERR.
Birkinshaw, J. and Gibson, C. (2005) ‘The Ambidextrous Organisation.’ Executive Briefing, Advanced Institute of Management Research, October 2005.
Coad, A. (2007) ‘Firm Growth: a survey.’ Jena: Max Planck Institute of Economics (Mimeo).
Coad, A. and Rao, R. (2008) Innovation and firm growth in high-tech sectors: a quantile regression approach. ‘Research Policy.’ 37, pp.633-648.
Crespi, G., Criscoulo, C., Haskel, J. and Slaughter, M. (2008) ‘Productivity growth, knowledge flows and spillovers.’ Working Paper No. W13959. Cambridge, MA: National Bureau of Economic Research (NBER).
Disney, R., Haskel, J. and Heden, Y. (2003) Restructuring and Productivity Growth in UK Manufacturing. ‘Economic Journal.’ 113, p.666-694.
Dunne, P. and Hughes, A. (1994) Age, size, growth and survival: UK companies in the 1980s. ‘Journal of Industrial Economics.’ 42 (2), pp.115-140.
Durbin, J. (1954) Errors in variables. ‘Review of the International Statistical Institute.’ 22, pp.22-32.
30

Eisenhardt, K. and Martin, J. (2001) Dynamic capabilities: what are they? ‘Strategic Management Journal.’ 21, pp.1105-1121.
Fritsch, M. and Mueller, P. (2004) Effects of new business formation on regional development over time. ‘Regional Studies.’ 38.8, pp.961-975.
Glaeser, E., Kallal, H., Scheinkman, J. and Shleifer, A. (1992) Growth in Cities. ‘Journal of Political Economy.’ 100(6), pp.1126-1152.
Harris, R. and Robinson, C. (2004) Productivity impacts and spillovers from foreign ownership in the United Kingdom. ‘National Institute Economic Review.’ No.187, pp.58-75.
Henrekson, M. and Johansson, D. (2008) ‘Gazelles as job creators – a survey and interpretation of the evidence.’ IFN Working Paper Series, No. 733. Stockholm: Research Institute of Industrial Economics.
Hölzl, W. and Friesenbichler, K. (2008) ‘Final Sector Report: Gazelles.’ Europe Innova Sector Report. Vienna: WIFO.
Johnston, J. (1972) ‘Econometric Methods.’ New York: McGraw-Hill.
Lööf, H. and Heshmati, A. (2006) On the relationship between innovation and performance: a sensitivity analysis. ‘Economics of Innovation and New Technology.’ 15(4&5), pp.317-344.
March, J.G. (1991) Exploration and exploitation in organizational learning. ‘Organization Science.’ 2, pp.71-87.
O’Reilly, C. and M. Tushman (2007) Ambidexterity as a dynamic capability: resolving the innovators dilemma. ‘Research in Organisation Behaviour.’ 28, pp.1-60.
Overman, H. and Puga, D. (2002) Unemployment clusters across Europe’s regions and countries. ‘Economic Policy.’ 17 (34), pp.115-148.
Parisi, M., Schiantarelli, F. and Sembenelli, A. (2006) Productivity, innovation and R&D: micro evidence for Italy. ‘European Economic Review.’ 50(8), pp.2037-2061.
Robson, B., Barr, R., Coombes, M., Lymperopoulou, K. and Rees, J. (2006) ‘A Framework for City-Regions: Working Paper 1, Mapping City-Regions.’ London: Office of the Deputy Prime Minister (ODPM).
Scott, A. (2005) ‘City-regions: economic motors and political actors on the global stage.’ Los Angeles: UCLA Department of Public Policy and Department of Geography.
Schumpeter, J. (1939) ‘Business Cycles.’ New York: McGraw-Hill.
Storey, D. (1989) Firm performance and size: explanations from the small firm sectors. ‘Small Business Economics.’ 1 (3), pp.175-80.
Teece, D. (2007) Explicating dynamic capabilities: the nature and microfoundations of (sustainable) enterprise performance. ‘Strategic Management Journal.’ 18, pp.1319-1350.
Teece, D., Pisano, G. and Shuen, A. (1997) Dynamic capabilities and strategic management. ‘Strategic Management Journal.’ 18(7), pp.509–33.
31

Appendix tables
32
Employment Turnover
Size 20-49 -0.0020 0.0045**
[0.0013] [0.0018]
Size 50-99 0.0087*** 0.0150***
[0.0021] [0.0029]
Size 100-249 0.0068** 0.0243***
[0.0028] [0.0039]
Size 250-499 0.0054 0.0175***
[0.0047] [0.0063]
Size 500-999 0.0176*** 0.0271***
[0.0071] [0.0092]
Size 1,000+ 0.0046 0.0597***
[0.0068] [0.0105]
New start -0.0042 0.0455***
[0.0030] [0.0051]
Age-3 0.0002 -0.0163***
[0.0032] [0.0040]
Age-4 -0.0054* -0.0389***
[0.0030] [0.0033}
Age-5+ -0.0573*** -0.1308***
[0.0034] [0.0045]
High-tech 0.0055 0.0223***
[0.0026] [0.0036]
Observations 178188 178188
Pseudo R-squared 0.0200 0.0416
Sector dummies included Yes Yes
Table A1: Determinants of the probability of firms appearing in high-growth intervals for employment and turnover (probit estimates), Business Structure Database, 2002-05, all firms employing ten or more employees – marginal effects
Notes: Robust standard errors in brackets *** p<0.01, ** p<0.05, * p<0.1
Probit estimates. Marginal effects are shown for independent variables evaluated at the means of other covariates. Dependent variable = 1 if firm appears in high-growth interval (average annual rates of growth of 20% or higher between 2002-05) for, respectively, employment and turnover; = 0 if not in these categories. The reference categories for size and age dummies are, respectively, size 10-19 and age-2.
Source: Derived from Business Structure Database.

33
City-region Govt Office Region
1 Birmingham/Sandwell/Wolverhampton West Midlands
2 Bournemouth/Poole South West
3 Brighton/Hove South East
4 Bristol/S.Gloucester South West
5 Cambridge Eastern
6 Carlisle North West
7 Chester Wales
8 Colchester Eastern
9 Coventry West Midlands
10 Exeter South West
11 Greater London Eastern/London/South East
12 Gloucester/Cheltenham South West
13 Ipswich Eastern
14 Kingston upon Hull Yorkshire & Humber
15 Leeds/Bradford Yorkshire & Humber
16 Leicester East Midlands
17 Lincoln East Midlands
18 Liverpool North West
19 Luton Eastern
20 Manchester/Salford/Trafford North West/East Midlands
21 Middlesbrough/Stockton North East/Yorkshire & Humber
22 Milton Keynes South East
23 Newcastle/Gateshead/Sunderland North East
24 Northampton East Midlands
25 Norwich Eastern
26 Nottingham/Derby East Midlands
27 Oxford South East
28 Peterborough Eastern
29 Plymouth South West
30 Portsmouth/Southampton South East
31 Preston North West
32 Reading South East
33 Sheffield Yorkshire & Humber/East Midlands
Table A2: UK city-regions

34
City-region Govt Office Region
34 Stoke-on-Trent West Midlands
35 Swindon South West
36 Telford and Wrekin West Midlands
37 Worcester West Midlands
38 York Yorkshire & Humber
39 Cardiff Wales
40 Swansea Wales
41 Aberdeen Scotland
42 Dundee Scotland
43 Edinburgh Scotland
44 Glasgow Scotland
45 Belfast Northern Ireland
Notes: Definitions of English city-regions are derived from Robson et al. (2006, Chapter 2, especially Figures 2.8 and 2.9). We are grateful to Brian Robson and colleagues for the use of their LAD (local authority district) mapping to city-regions. Their Table 2.2 identifies 39 ‘destination nodes’ which constitute the nuclei of city-regions in England. We have reduced this total to 38 English city-regions by combining Nottingham and Derby because of the overlap in commuting patterns between these two cities and their surrounding areas. City-regions in Wales, Scotland and Northern Ireland were identified with the aid of information in Belfast City Development Department (2005), Derek Halden Consultancy (2002), Morgan (2006) and Statistics for Wales (2008).

35
Sources: NOMIS: Official Labour Market Statistics, Office of National Statistics.
BSD: Business Structure Database, Office of National Statistics.
ASHE: Annual Survey of Hours and Earnings.
Source
Employment rate (= Employed as percentage of population of working age) NOMIS
Unemployment rate (= Unemployed as percentage of economically active persons NOMIS [employed + unemployed])
Dependency rate (= Non-employed persons as percentage of total population) NOMIS
Economic activity rate (= [Employed + unemployed] as percentage of population of working age) NOMIS
Economic inactivity rate (= Economically inactive as percentage of population of working age) NOMIS
Source
Employment share of firms in high-growth employment interval (20 per cent or higher growth BSD per annum) as percentage of total employment
Mean employment growth rate of firms BSD
90th percentile employment growth rate of firms BSD
Annual rate of growth in private sector employment BSD
Entrepreneurship: new start firms per head of working-age population BSD/NOMIS
Source
Graduate share of employment (= Holders of NVQ4 or higher qualifications as percentage NOMIS of workforce)
Manufacturing share of employment BSD
Business services share of employment BSD
Public sector share of employment BSD
High-tech share of employment BSD
Older firms (aged 20 years or more) share of employment BSD
Small firms (<100 employees) share of employment BSD
Median gross hourly pay ASHE
Average gross hourly pay ASHE
Annual rate of growth in working-age population NOMIS
Table A3: City-region variable definitions and data sources
Socio-economic outcomes:
Firm growth measures:
Other city-region characteristics:
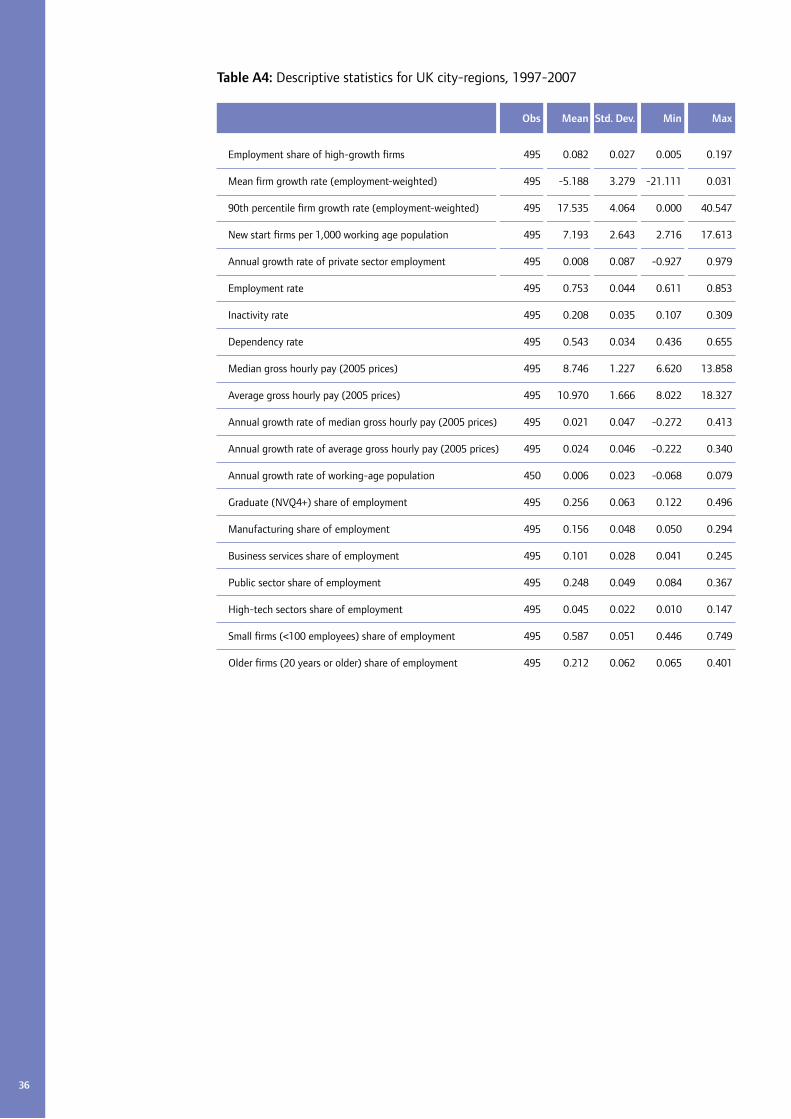
36
Obs Mean Std. Dev. Min Max
Employment share of high-growth firms 495 0.082 0.027 0.005 0.197
Mean firm growth rate (employment-weighted) 495 -5.188 3.279 -21.111 0.031
90th percentile firm growth rate (employment-weighted) 495 17.535 4.064 0.000 40.547
New start firms per 1,000 working age population 495 7.193 2.643 2.716 17.613
Annual growth rate of private sector employment 495 0.008 0.087 -0.927 0.979
Employment rate 495 0.753 0.044 0.611 0.853
Inactivity rate 495 0.208 0.035 0.107 0.309
Dependency rate 495 0.543 0.034 0.436 0.655
Median gross hourly pay (2005 prices) 495 8.746 1.227 6.620 13.858
Average gross hourly pay (2005 prices) 495 10.970 1.666 8.022 18.327
Annual growth rate of median gross hourly pay (2005 prices) 495 0.021 0.047 -0.272 0.413
Annual growth rate of average gross hourly pay (2005 prices) 495 0.024 0.046 -0.222 0.340
Annual growth rate of working-age population 450 0.006 0.023 -0.068 0.079
Graduate (NVQ4+) share of employment 495 0.256 0.063 0.122 0.496
Manufacturing share of employment 495 0.156 0.048 0.050 0.294
Business services share of employment 495 0.101 0.028 0.041 0.245
Public sector share of employment 495 0.248 0.049 0.084 0.367
High-tech sectors share of employment 495 0.045 0.022 0.010 0.147
Small firms (<100 employees) share of employment 495 0.587 0.051 0.446 0.749
Older firms (20 years or older) share of employment 495 0.212 0.062 0.065 0.401
Table A4: Descriptive statistics for UK city-regions, 1997-2007

37
(1) (2) (3) (4) (5) (6) FE FE IV FE FE IV FE FE IV
Mean firm employment growth rate (weighted) (t) 0.0012** 0.0004 0.001 0.0001 0.0010* 0.0002
[0.0006] [0.0008] [0.0006] [0.0008] [0.0006] [0.0008]
New firm start rate (t-1) 0.0031*** -0.0016 0.0017 -0.0037 0.0018 -0.0035
[0.0011] [0.0030] [0.0015] [0.0032] [0.0014] [0.0031]
Employment share of high-growth firms (t) 0.5140*** 0.7095***
[0.1098] [0.2144]
90th percentile firm growth rate (weighted) (t) 0.0016*** 0.0017**
[0.0005] [0.0008]
Graduate share of employment 0.0823 0.0246 0.0801 0.0208 0.0865 0.0227
[0.1087] [0.1498] [0.1002] [0.1397] [0.1051] [0.1470]
Manufacturing share of employment -0.1103 -0.3526 -0.1133 -0.3392 -0.1115 -0.333
[0.2135] [0.2620] [0.2120] [0.2665] [0.2132] [0.2654]
Business services share of employment 0.3833 0.2641 0.4626 0.3804 0.4275 0.3168
[0.2905] [0.3067] [0.2899] [0.3285] [0.2824] [0.3033]
Public sector share of employment 0.2605 0.1415 0.2158 0.0742 0.2287 0.1145
[0.1842] [0.2195] [0.1709] [0.2207] [0.1757] [0.2196]
Small firms share of employment 0.8868*** 1.1003*** 0.8769*** 1.0968*** 0.8913*** 1.1095***
[0.1776] [0.2233] [0.1743] [0.2095] [0.1763] [0.2157]
Older firms share of employment -0.3093** -0.4442*** -0.2830** -0.3870** -0.3003** -0.4240***
[0.1253] [0.1561] [0.1262] [0.1544] [0.1261] [0.1577]
High-tech sectors share of employment -0.036 0.0214 -0.0694 -0.0838 -0.0633 -0.0296
[0.2823] [0.3023] [0.2700] [0.2871] [0.2706] [0.2903]
Average gross hourly pay -0.0010 -0.0007 -0.0009 -0.0004 -0.0009 -0.0005
[0.0014] [0.0015] [0.0014] [0.0015] [0.0013] [0.0014]
Annual growth rate of working-age population 0.1530 0.1607 0.1260 0.1197 0.1403 0.1535
[0.1356] [0.1760] [0.1320] [0.1712] [0.1346] [0.1765]
Observations 403 313 403 313 403 313
R-squared 0.756 0.767 0.761
F statistic 33.25 36.14 32.64
Anderson LR statistic 341.8 263.2 327.4
(p-value) <0.001 <0.001 <0.001
Hansen J statistic 0.405 0.679 1.034
(p-value) 0.817 0.878 0.793
Table A5: Fixed effects estimates of the determinants of annual growth rates in private sector employment at city-region level, 1997-2007
Notes: *** p<0.01, ** p<0.05, * p<0.1
Robust standard errors, shown in brackets, are corrected for clustering of observations at the city-region level. All equations include year dummies. The dependent variable is the annual rate of growth in private sector employment. Two outlying observations have been omitted since the absolute values of the dependent variable in each case were three times greater than those of the next closest observation. For IV specifications the instrumented variables are the mean firm employment growth rate, the new firm start rate, the employment share of high-growth firms and the 90th percentile firm growth rate. The Anderson LR statistic reports a canonical correlations likelihood-ratio test of the null hypothesis that the equation is underidentified. The Hansen J statistic is the appropriate test of overidentifying restrictions in the presence of heteroscedasticity. The null hypothesis is that all instruments are valid.

38
(1) (2) (3) (4) (5) (6) FE FE IV FE FE IV FE FE IV
Mean firm employment growth rate (weighted) (t-1) -0.0001 -0.0001 -0.0002 -0.0002 -0.0002 -0.0002
[0.0003] [0.0003] [0.0003] [0.0003] [0.0003] [0.0003]
New firm start rate (t-1) 0.0013 0.0027* 0.0020* 0.0031** 0.0019* 0.0030**
[0.0011] [0.0014] [0.0011] [0.0012] [0.0011] [0.0012]
Employment share of high-growth firms (t-1) 0.2150*** 0.1981***
[0.0706] [0.0762]
90th percentile firm growth rate (weighted) (t-1) 0.0008*** 0.0007**
[0.0002] [0.0003]
Graduate share of employment 0.1444** 0.1425** 0.1594** 0.1574** 0.1530** 0.1526**
[0.0641] [0.0711] [0.0617] [0.0689] [0.0640] [0.0714]
Manufacturing share of employment 0.1509 -0.0328 0.1614* -0.0260 0.1813* -0.0001
[0.1028] [0.1088] [0.0957] [0.1026] [0.0978] [0.1054]
Business services share of employment 0.0079 0.0826 -0.0056 0.0880 -0.0282 0.0639
[0.2325] [0.2310] [0.2259] [0.2249] [0.2290] [0.2276]
Public sector share of employment 0.0624 0.0087 0.0437 -0.0095 0.0814 0.0305
[0.0833] [0.0770] [0.0804] [0.0720] [0.0800] [0.0714]
Small firms share of employment -0.0605 0.0281 -0.0438 0.0510 -0.0492 0.0369
[0.0706] [0.0679] [0.0732] [0.0710] [0.0709] [0.0691]
Older firms share of employment 0.0157 0.046 0.0072 0.0421 0.0232 0.0558*
[0.0407] [0.0331] [0.0356] [0.0320] [0.0343] [0.0323]
High-tech sectors share of employment 0.3971*** 0.4898*** 0.3631*** 0.4368*** 0.3912*** 0.4750***
[0.1004] [0.1015] [0.1055] [0.1159] [0.0996] [0.1073]
Average gross hourly pay -0.0023* -0.0030** -0.002 -0.0025** -0.0020 -0.0027**
[0.0014] [0.0014] [0.0012] [0.0013] [0.0012] [0.0013]
Annual growth rate of working-age population 0.0336 0.0488 0.032 0.0438 0.0314 0.0479
[0.0352] [0.0453] [0.0362] [0.0467] [0.0362] [0.0454]
Observations 405 315 405 315 405 315
R-squared 0.171 0.168 0.204 0.201 0.199 0.200
F statistic 4.668 5.733 5.816
Anderson LR statistic 374.3 375.3 374.2
(p-value) <0.001 <0.001 <0.001
Hansen J statistic 0.548 2.763 2.514
(p-value) 0.760 0.430 0.473
Table A6: Fixed effects estimates of the determinants of employment rates at city-region level, 1997-2007
Notes: *** p<0.01, ** p<0.05, * p<0.1
Robust standard errors, shown in brackets, are corrected for clustering of observations at the city-region level. All equations include year dummies. For details of instrumented variables and test statistics, see notes to Table A5.

39
(1) (2) (3) (4) (5) (6) FE FE IV FE FE IV FE FE IV
Mean firm employment growth rate (weighted) (t-1) 0.0002 0.0002 0.0003 0.0003 0.0003 0.0003
[0.0002] [0.0003] [0.0002] [0.0003] [0.0002] [0.0003]
New firm start rate (t-1) -0.0003 -0.0008 -0.0008 -0.0011 -0.0007 -0.001
[0.0009] [0.0012] [0.0009] [0.0011] [0.0009] [0.0011]
Employment share of high-growth firms (t-1) -0.1612** -0.1470**
[0.0608] [0.0629]
90th percentile firm growth rate (weighted) (t-1) -0.0005** -0.0005**
[0.0002] [0.0002]
Graduate share of employment -0.0662 -0.0643 -0.0775 -0.0754 -0.0717 -0.0714
[0.0518] [0.0565] [0.0513] [0.0552] [0.0523] [0.0570]
Manufacturing share of employment -0.119 -0.009 -0.1268* -0.014 -0.1380* -0.0318
[0.0777] [0.0836] [0.0720] [0.0791] [0.0755] [0.0824]
Business services share of employment 0.0437 0.0152 0.0538 0.0112 0.0663 0.0283
[0.1662] [0.1833] [0.1610] [0.1790] [0.1633] [0.1799]
Public sector share of employment 0.0131 0.0294 0.0271 0.0428 0.0011 0.0140
[0.0635] [0.0623] [0.0611] [0.0580] [0.0616] [0.0594]
Small firms share of employment 0.0426 0.0059 0.03 -0.011 0.0355 -0.0003
[0.0641] [0.0596] [0.0669] [0.0623] [0.0648] [0.0607]
Older firms share of employment -0.0385 -0.0541* -0.0321 -0.0512* -0.0432 -0.0609**
[0.0333] [0.0314] [0.0294] [0.0296] [0.0297] [0.0297]
High-tech sectors share of employment -0.1805** -0.2340** -0.1551* -0.1947** -0.1768** -0.2236**
[0.0848] [0.0917] [0.0846] [0.0954] [0.0818] [0.0908]
Average gross hourly pay 0.0014 0.0020* 0.0011 0.0017* 0.0012 0.0018*
[0.0011] [0.0011] [0.0010] [0.0010] [0.0010] [0.0010]
Annual growth rate of working-age population -0.0054 -0.0394 -0.0042 -0.0357 -0.004 -0.0387
[0.0328] [0.0407] [0.0336] [0.0418] [0.0335] [0.0414]
Observations 405 315 405 315 405 315
R-squared 0.092 0.124 0.118 0.154 0.107 0.145
F statistic 2.832 3.591 3.381
Anderson LR statistic 374.3 375.3 374.2
(p-value) <0.001 <0.001 <0.001
Hansen J statistic 0.668 2.432 2.207
(p-value) 0.716 0.488 0.531
Table A7: Fixed effects estimates of the determinants of inactivity rates at city-region level, 1997-2007
Notes: *** p<0.01, ** p<0.05, * p<0.1
Robust standard errors, shown in brackets, are corrected for clustering of observations at the city-region level. All equations include year dummies. For details of instrumented variables and test statistics, see notes to Table A5.
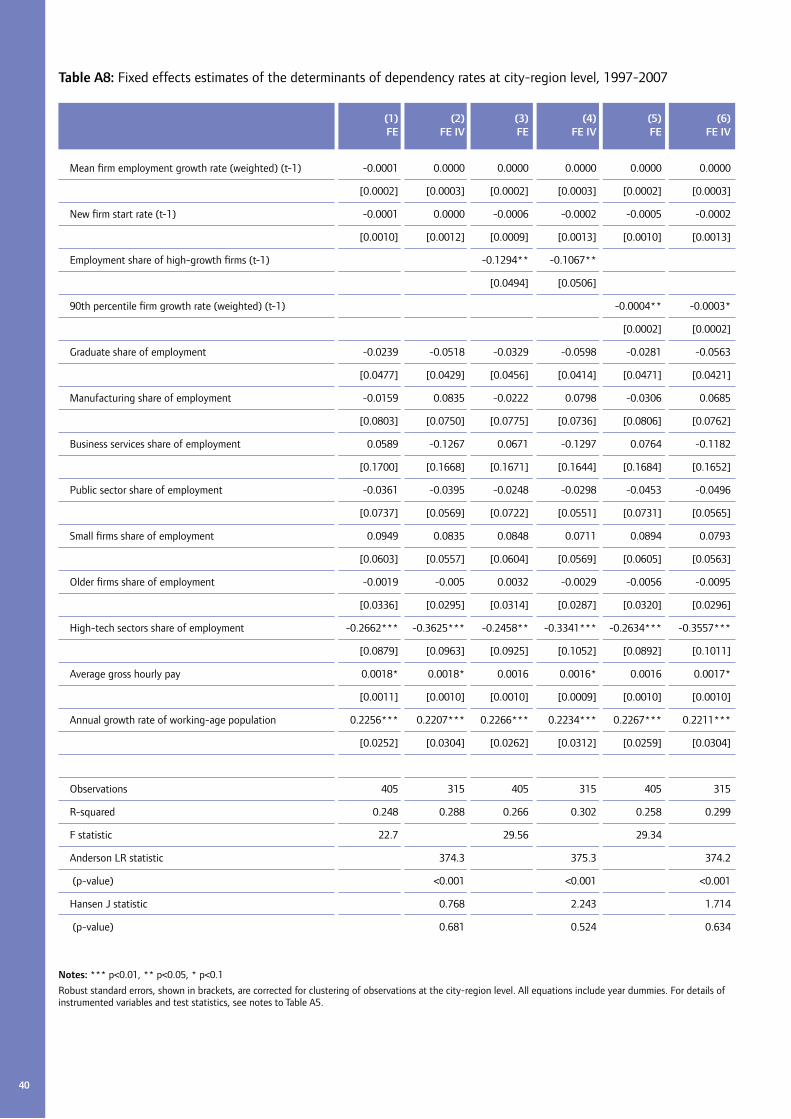
40
(1) (2) (3) (4) (5) (6) FE FE IV FE FE IV FE FE IV
Mean firm employment growth rate (weighted) (t-1) -0.0001 0.0000 0.0000 0.0000 0.0000 0.0000
[0.0002] [0.0003] [0.0002] [0.0003] [0.0002] [0.0003]
New firm start rate (t-1) -0.0001 0.0000 -0.0006 -0.0002 -0.0005 -0.0002
[0.0010] [0.0012] [0.0009] [0.0013] [0.0010] [0.0013]
Employment share of high-growth firms (t-1) -0.1294** -0.1067**
[0.0494] [0.0506]
90th percentile firm growth rate (weighted) (t-1) -0.0004** -0.0003*
[0.0002] [0.0002]
Graduate share of employment -0.0239 -0.0518 -0.0329 -0.0598 -0.0281 -0.0563
[0.0477] [0.0429] [0.0456] [0.0414] [0.0471] [0.0421]
Manufacturing share of employment -0.0159 0.0835 -0.0222 0.0798 -0.0306 0.0685
[0.0803] [0.0750] [0.0775] [0.0736] [0.0806] [0.0762]
Business services share of employment 0.0589 -0.1267 0.0671 -0.1297 0.0764 -0.1182
[0.1700] [0.1668] [0.1671] [0.1644] [0.1684] [0.1652]
Public sector share of employment -0.0361 -0.0395 -0.0248 -0.0298 -0.0453 -0.0496
[0.0737] [0.0569] [0.0722] [0.0551] [0.0731] [0.0565]
Small firms share of employment 0.0949 0.0835 0.0848 0.0711 0.0894 0.0793
[0.0603] [0.0557] [0.0604] [0.0569] [0.0605] [0.0563]
Older firms share of employment -0.0019 -0.005 0.0032 -0.0029 -0.0056 -0.0095
[0.0336] [0.0295] [0.0314] [0.0287] [0.0320] [0.0296]
High-tech sectors share of employment -0.2662*** -0.3625*** -0.2458** -0.3341*** -0.2634*** -0.3557***
[0.0879] [0.0963] [0.0925] [0.1052] [0.0892] [0.1011]
Average gross hourly pay 0.0018* 0.0018* 0.0016 0.0016* 0.0016 0.0017*
[0.0011] [0.0010] [0.0010] [0.0009] [0.0010] [0.0010]
Annual growth rate of working-age population 0.2256*** 0.2207*** 0.2266*** 0.2234*** 0.2267*** 0.2211***
[0.0252] [0.0304] [0.0262] [0.0312] [0.0259] [0.0304]
Observations 405 315 405 315 405 315
R-squared 0.248 0.288 0.266 0.302 0.258 0.299
F statistic 22.7 29.56 29.34
Anderson LR statistic 374.3 375.3 374.2
(p-value) <0.001 <0.001 <0.001
Hansen J statistic 0.768 2.243 1.714
(p-value) 0.681 0.524 0.634
Table A8: Fixed effects estimates of the determinants of dependency rates at city-region level, 1997-2007
Notes: *** p<0.01, ** p<0.05, * p<0.1
Robust standard errors, shown in brackets, are corrected for clustering of observations at the city-region level. All equations include year dummies. For details of instrumented variables and test statistics, see notes to Table A5.

41
(1) (2) (3) (4) (5) (6) FE FE IV FE FE IV FE FE IV
Mean firm employment growth rate (weighted) (t-1) -0.0027 -0.0003 -0.0031 -0.0001 -0.0029 0.0001
[0.0040] [0.0051] [0.0040] [0.0052] [0.0039] [0.0051]
New firm start rate (t-1) 0.0052 0.0318* 0.0079 0.0308 0.0061 0.0311
[0.0104] [0.0190] [0.0115] [0.0193] [0.0118] [0.0191]
Employment share of high-growth firms (t-1) 0.7691 -0.4831
[0.6883] [0.9659]
90th percentile firm growth rate (weighted) (t-1) 0.0012 -0.0017
[0.0032] [0.0037]
Graduate share of employment 1.0962 1.7323 1.1498 1.695 1.1087 1.7051
[0.8280] [1.3446] [0.8230] [1.3455] [0.8211] [1.3332]
Manufacturing share of employment 1.5306 0.0692 1.568 0.0528 1.5745 -0.0078
[1.2997] [1.6098] [1.3089] [1.6094] [1.3430] [1.6552]
Business services share of employment -1.376 -3.7585 -1.4244 -3.7716 -1.4282 -3.7146
[2.0415] [2.8063] [2.0426] [2.8246] [2.0111] [2.7859]
Public sector share of employment -0.9546 -2.8951** -1.0216 -2.8507** -0.9272 -2.9476**
[1.1240] [1.3292] [1.1013] [1.2954] [1.1656] [1.3872]
Small firms share of employment -0.3024 -1.5296 -0.2423 -1.5844 -0.286 -1.5449
[1.2390] [1.3081] [1.2584] [1.3426] [1.2645] [1.3202]
Older firms share of employment 0.7069 0.9604 0.6764 0.9701 0.7177 0.9392
[0.6883] [0.6236] [0.6821] [0.6330] [0.6805] [0.6241]
High-tech sectors share of employment 0.9922 -0.9798 0.8709 -0.8513 0.9837 -0.9505
[3.9670] [3.5889] [3.9294] [3.5992] [3.9534] [3.5806]
Annual growth rate of working-age population 0.6736*** 0.6845*** 0.6749*** 0.6835*** 0.6741*** 0.6839***
[0.0571] [0.0528] [0.0570] [0.0528] [0.0567] [0.0525]
Observations 405 315 405 315 405 315
R-squared 0.939 0.927 0.939 0.927 0.939 0.927
F statistic 218.2 213.7 209.2
Anderson LR statistic 374.3 375.3 374.2
(p-value) <0.001 <0.001 <0.001
Hansen J statistic 0.581 0.816 1.319
(p-value) 0.748 0.846 0.725
Table A9: Fixed effects estimates of the determinants of median gross hourly pay at city-region level, 1997-2007
Notes: *** p<0.01, ** p<0.05, * p<0.1
Robust standard errors, shown in brackets, are corrected for clustering of observations at the city-region level. All equations include year dummies. For details of instrumented variables and test statistics, see notes to Table A5.
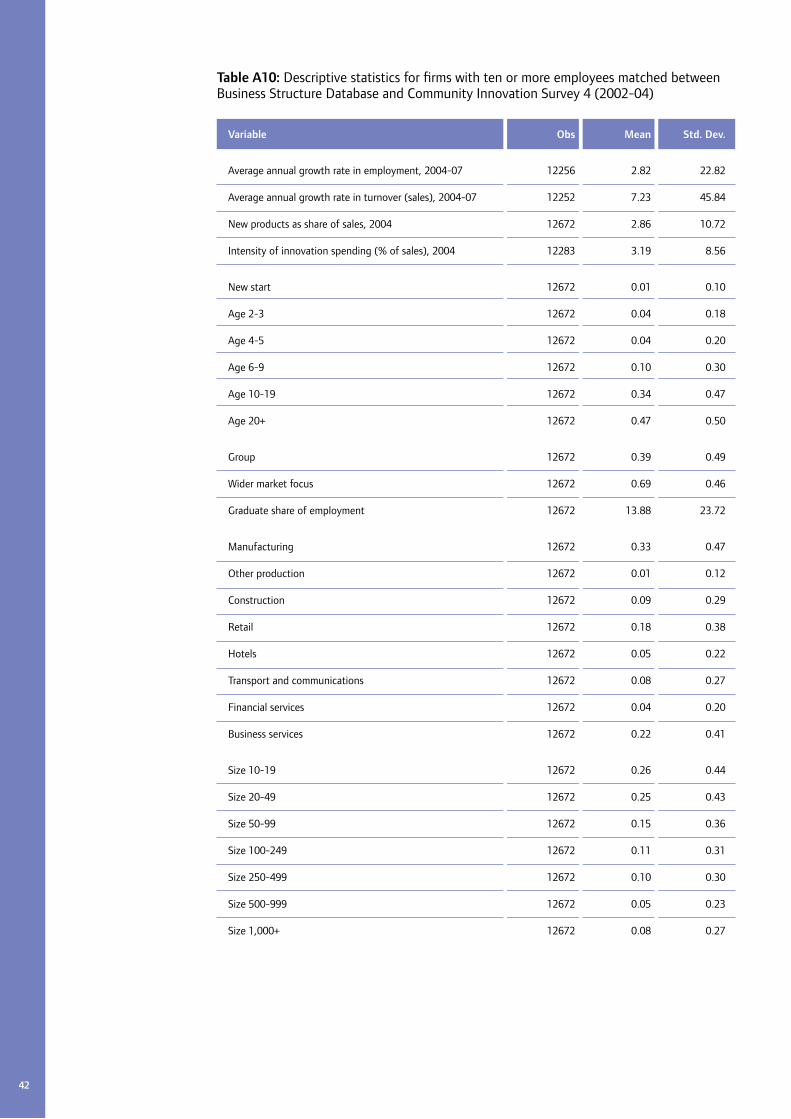
42
Variable Obs Mean Std. Dev.
Average annual growth rate in employment, 2004-07 12256 2.82 22.82
Average annual growth rate in turnover (sales), 2004-07 12252 7.23 45.84
New products as share of sales, 2004 12672 2.86 10.72
Intensity of innovation spending (% of sales), 2004 12283 3.19 8.56
New start 12672 0.01 0.10
Age 2-3 12672 0.04 0.18
Age 4-5 12672 0.04 0.20
Age 6-9 12672 0.10 0.30
Age 10-19 12672 0.34 0.47
Age 20+ 12672 0.47 0.50
Group 12672 0.39 0.49
Wider market focus 12672 0.69 0.46
Graduate share of employment 12672 13.88 23.72
Manufacturing 12672 0.33 0.47
Other production 12672 0.01 0.12
Construction 12672 0.09 0.29
Retail 12672 0.18 0.38
Hotels 12672 0.05 0.22
Transport and communications 12672 0.08 0.27
Financial services 12672 0.04 0.20
Business services 12672 0.22 0.41
Size 10-19 12672 0.26 0.44
Size 20-49 12672 0.25 0.43
Size 50-99 12672 0.15 0.36
Size 100-249 12672 0.11 0.31
Size 250-499 12672 0.10 0.30
Size 500-999 12672 0.05 0.23
Size 1,000+ 12672 0.08 0.27
Table A10: Descriptive statistics for firms with ten or more employees matched between Business Structure Database and Community Innovation Survey 4 (2002-04)

43
Dependent variables: Turnover share of new Turnover share of new and products (%) improved products (%)
Innovation intensity 0.2390*** 0.5509***
[0.0407] [0.0656]
External information sourcing 0.8794 3.4906***
[0.6906] [0.7120]
External partnerships (distance) 1.4518*** 0.1569
[0.3679] [0.6655]
Organisational innovation 1.7237*** 5.2454***
[0.3975] [0.6189]
Public support 0.7627** 1.1575**
[0.3402] [0.5400]
Wider collaboration 20.7849*** 48.0602***
[0.7464] [0.9895]
Formal protection 2.3392*** 2.3741***
[0.5667] [0.7635]
Strategic protection 7.6617*** 9.2574***
[0.5371] [0.9315]
Financial barriers 0.7139 0.2926
[0.5253] [0.7182]
Skill barriers 0.3915 1.0667*
[0.4557] [0.5648]
New start 10.3001** 1.9154
[4.9759] [8.2184]
Age 4-5 -4.2104 -5.4019
[3.7765] [3.8422]
Age 6-9 -6.4431** -10.4290***
[3.0223] [4.0297]
Age 10-19 -7.0189** -15.1694***
[2.9659] [3.2981]
Age 20+ -9.2751*** -19.1984***
[3.2496] [3.2211]
Group 1.5184 0.8794
[1.0679] [1.2317]
Table A11: Tobit estimates of the determinants of innovation success, 2004

44
Dependent variables: Turnover share of new Turnover share of new and products (%) improved products (%)
Wider market focus 4.2134*** 7.6551***
[1.5284] [1.9779]
Graduate share 0.1129*** 0.1155***
[0.0190] [0.0273]
Observations 12114 12114
Log likelihood -11477 -20210
Pseudo R sqd 0.128 0.136
Notes: Bootstrapped standard errors in brackets. *** p<0.01, ** p<0.05, * p<0.1
The Tobit estimation procedure is used because the dependent variables are left- and right-censored. Both equations include employment size, sector and regional dummies. The reference category for firm age is 2-3 years. Innovation intensity is defined as the per cent of turnover spent on R&D (intramural plus extramural) and on innovation-related machinery, equipment, software, acquisition of external knowledge, training, design and marketing. For details of the derivation of measures of other innovation-related resources and capabilities, see Appendix Tables A12-13.

45
Variable name
New products
New and improved products
Innovation intensity
External information sourcing
External partnerships
Organisational innovation
Variable range
0-100
0-100
0-100
Factor score
Factor score
Factor score
Definitions of variables or constituent elements of factor scores
Turnover share of products new to market
Turnover share of products either significantly improved, new to enterprise or new to market
Total innovation spending as per cent of turnover in 2004, comprising spending on:
R&D (intramural plus extramural)
Innovation-related machinery, equipment and software
Innovation-related acquisition of external knowledge
Innovation-related training
Innovation-related design
Innovation-related marketing
Market sources – suppliers of equipment, materials, services, or software
Market sources – Clients or customers
Market sources – Competitors or others enterprises in your industry
Market sources – Consultants, commercial labs, or private R&D institutes
Institutional sources – Universities or other higher education institutions
Institutional sources – Government or public research institutes
Conferences, trade fairs, exhibitions
Scientific journals and trade/technical publications
Professional and industry associations
Technical, industry or service standards
Types of co-operation partnership and where located
Local or Regional within UK/UK national/Other Europe/All other countries
Suppliers of equipment, materials, services, or software
Clients or customers
Competitors or other enterprises in your industry
Consultants, commercial labs, or private R&D institutes
Universities or other higher education institutions
Government or public research institutes
Major changes in business structure and practices Y/N
Implementation of a new or significantly changed corporate strategy
Implementation of advanced management techniques within your enterprise, e.g. knowledge management
systems, Investors in People
Implementation of major changes to your organisational structure, e.g. introduction of cross-
functional teams, outsourcing of major business functions.
Implementation of changes in marketing concepts or strategies, e.g. packaging or presentational changes to a product to target new markets, new support services
to open up new markets.
Table A12: Measures of innovative effort at firm level derived from the Community Innovation Survey

46
Variable name
Public support
Wider collaboration
Formal protection
Strategic protection
Financial barriers
Skill barriers
Market domination
Uncertain demand
Group
Wider market focus
Graduate share
Internal information sources
Process innovator
Variable range
Factor score
Mean of 0-2 scores for collaboration on product and process innovations
Factor score
Factor score
Factor score
0-3 score
0-3 score
0-3 score
0/1 score
0/1 score
0-100
0-3 score
0/1 score
Definitions of variables or constituent elements of factor scores
Public support for innovation Y/N
Local or regional authorities
Central Government or devolved administrations (including their government agencies or ministries)
The European Union (EU)
How were innovative goods and services developed?
0: Mainly by your enterprise or enterprise group
1: Mainly by your enterprise together with other enterprises or institutions
2: Mainly by other enterprises or institutions
How were innovative processes developed?
0: Mainly by your enterprise or enterprise group
1: Mainly by your enterprise together with other enterprises or institutions
2: Mainly by other enterprises or institutions
Formal registration of design
Trademarks
Patents
Confidentiality agreements
Copyrights
Strategic secrecy
Complexity of design
Lead-time advantage on competitors
Barriers to innovation activity:
Factor not experienced/Low/Medium/High
Excessive perceived economic risks
Direct innovation costs too high
Cost of finance
Availability of finance
Lack of qualified personnel:
Factor not experienced/Low/Medium/High
Market dominated by established enterprises:
Factor not experienced/Low/Medium/High
Uncertain demand for innovative goods or services:
Factor not experienced/Low/Medium/High
Whether part of group
Whether market extends beyond local and regional areas
Percentage of graduates (all disciplines) among workforce
Importance of internal information sources within enterprise or enterprise group
Introduced at least one new or significantly improved production process
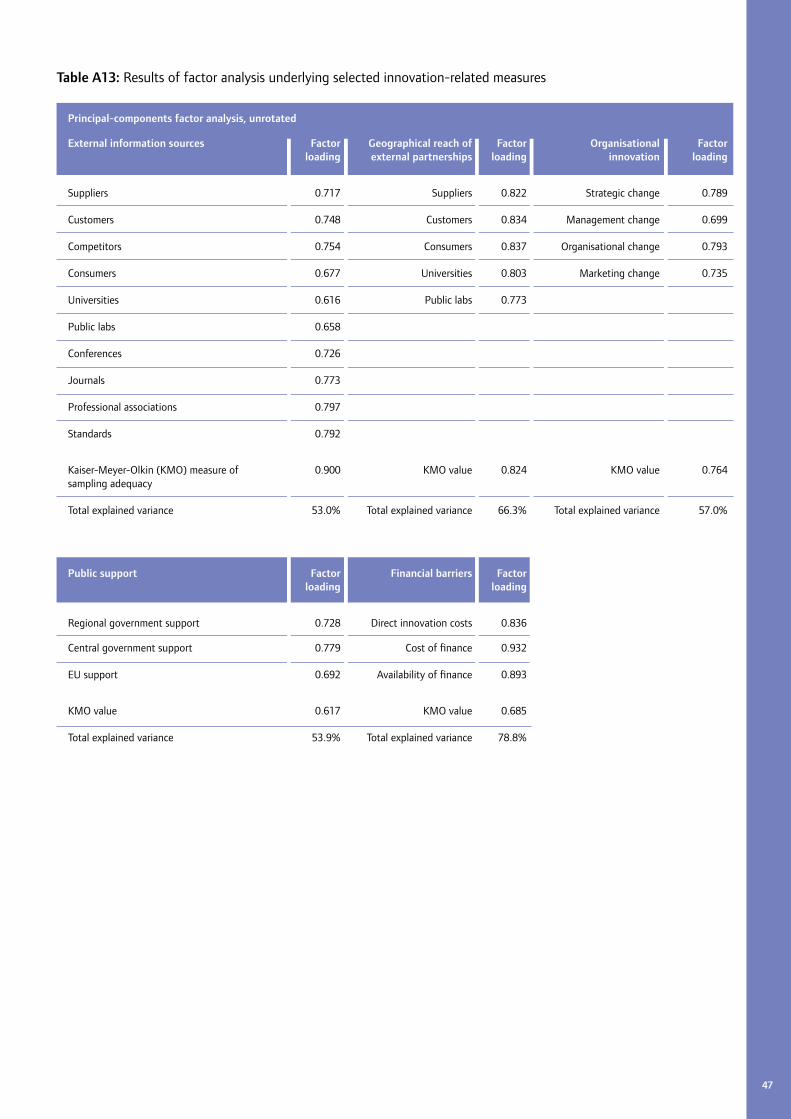
47
Principal-components factor analysis, unrotated
External information sources Factor Geographical reach of Factor Organisational Factor loading external partnerships loading innovation loading
Suppliers 0.717 Suppliers 0.822 Strategic change 0.789
Customers 0.748 Customers 0.834 Management change 0.699
Competitors 0.754 Consumers 0.837 Organisational change 0.793
Consumers 0.677 Universities 0.803 Marketing change 0.735
Universities 0.616 Public labs 0.773
Public labs 0.658
Conferences 0.726
Journals 0.773
Professional associations 0.797
Standards 0.792
Kaiser-Meyer-Olkin (KMO) measure of 0.900 KMO value 0.824 KMO value 0.764 sampling adequacy
Total explained variance 53.0% Total explained variance 66.3% Total explained variance 57.0%
Public support Factor Financial barriers Factor loading loading
Regional government support 0.728 Direct innovation costs 0.836
Central government support 0.779 Cost of finance 0.932
EU support 0.692 Availability of finance 0.893
KMO value 0.617 KMO value 0.685
Total explained variance 53.9% Total explained variance 78.8%
Table A13: Results of factor analysis underlying selected innovation-related measures

48
(1) (2) (3) (4)
Average employment growth, 2001-2004 1.2104**
[0.5724]
Employment growth, 2001-2004 – 25th-49th percentiles 0.5338
[0.3437]
Employment growth, 2001-2004 – 50th-74th percentiles 0.8918***
[0.2205]
Employment growth, 2001-2004 – 75th-94th percentiles 0.2310
[0.2647]
Employment growth, 2001-2004 – 95th-100th percentiles 1.4160***
[0.5044]
Average turnover growth, 2001-2004 0.0439
[0.3026]
Turnover growth, 2001-2004 – 25th-49th percentiles -0.1495
[0.2746]
Turnover growth, 2001-2004 – 50th-74th percentiles -0.0505
[0.2967]
Turnover growth, 2001-2004 – 75th-94th percentiles 0.2303
[0.2958]
Turnover growth, 2001-2004 – 95th-100th percentiles -0.2845
[0.3859]
Observations 5241 5241 5220 5220
Log likelihood -13133 -13128 -13070 -13069
Pseudo R sqd 0.012 0.0123 0.0119 0.012
Table A14: Tobit estimates of the determinants of innovation intensity at firm level in CIS5 (2004-06)
Notes: Bootstrapped standard errors in brackets *** p<0.01, ** p<0.05, * p<0.1
Tobit estimates. The dependent variable is the measure of innovation intensity for 2004-06 (CIS5), defined as described in the notes to Table A11. All equations include firm age, employment size, sector and regional dummies and control variables for group membership, geographical market focus and graduate share of employment.
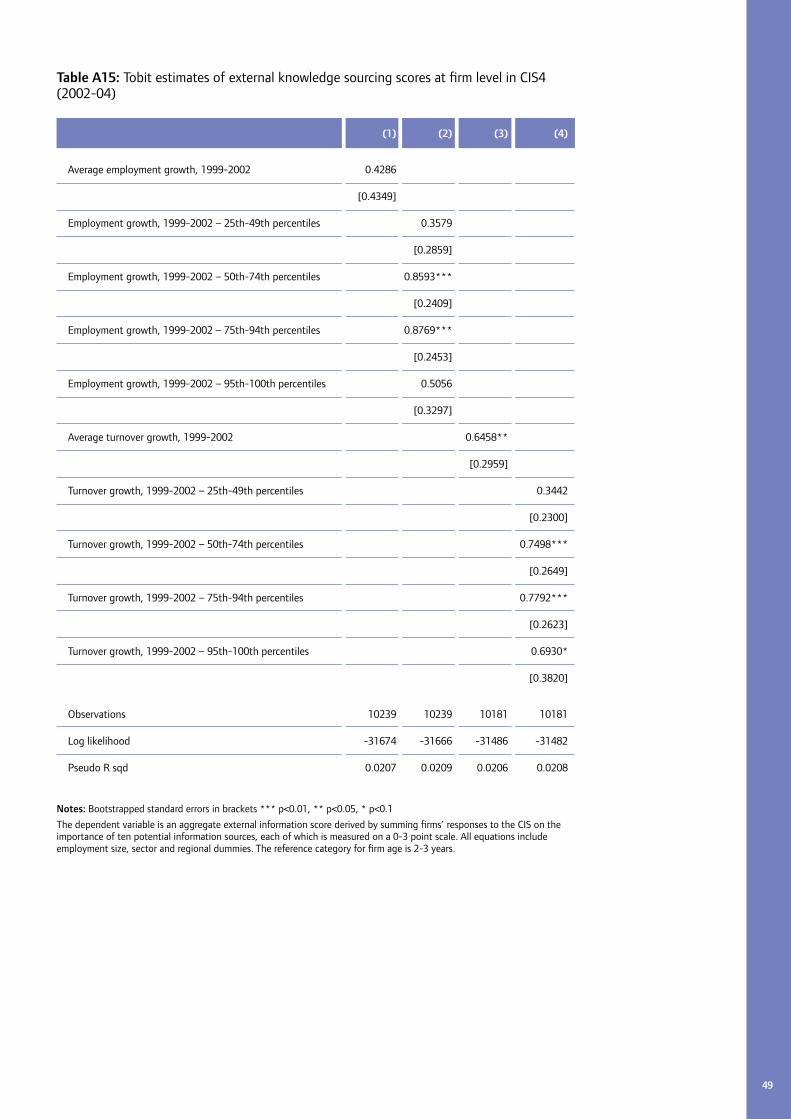
49
(1) (2) (3) (4)
Average employment growth, 1999-2002 0.4286
[0.4349]
Employment growth, 1999-2002 – 25th-49th percentiles 0.3579
[0.2859]
Employment growth, 1999-2002 – 50th-74th percentiles 0.8593***
[0.2409]
Employment growth, 1999-2002 – 75th-94th percentiles 0.8769***
[0.2453]
Employment growth, 1999-2002 – 95th-100th percentiles 0.5056
[0.3297]
Average turnover growth, 1999-2002 0.6458**
[0.2959]
Turnover growth, 1999-2002 – 25th-49th percentiles 0.3442
[0.2300]
Turnover growth, 1999-2002 – 50th-74th percentiles 0.7498***
[0.2649]
Turnover growth, 1999-2002 – 75th-94th percentiles 0.7792***
[0.2623]
Turnover growth, 1999-2002 – 95th-100th percentiles 0.6930*
[0.3820]
Observations 10239 10239 10181 10181
Log likelihood -31674 -31666 -31486 -31482
Pseudo R sqd 0.0207 0.0209 0.0206 0.0208
Table A15: Tobit estimates of external knowledge sourcing scores at firm level in CIS4 (2002-04)
Notes: Bootstrapped standard errors in brackets *** p<0.01, ** p<0.05, * p<0.1
The dependent variable is an aggregate external information score derived by summing firms’ responses to the CIS on the importance of ten potential information sources, each of which is measured on a 0-3 point scale. All equations include employment size, sector and regional dummies. The reference category for firm age is 2-3 years.

50
Acknowledgements
This report was written by Geoff Mason, Kate Bishop and Catherine Robinson at the National Institute of Economic and Social Research (NIESR). The authors are grateful to Albert Bravo-Biosca of NESTA for helpful comments and advice throughout the project. They also thank: Suzanne Grazier, Felix Ritchie and Richard Welpton at the Virtual Microdata Laboratory (VML), Office of National Statistics, for advice and assistance on using the Business Structure Database (BSD);22 NIESR colleagues James Mitchell and Rebecca Riley for comments and advice; Michael Anyadike-Danes (ERINI) and Mark Hart (Aston University) for sharing some of their previous work on BSD analysis; and participants at workshops held at NESTA and NIESR for comments on previous versions of this report.
22. This report is partly based on statistical data from ONS which is Crown Copyright and reproduced with the permission of the controller of HMSO and Queen’s Printer for Scotland. The use of the ONS statistical data in this work does not imply the endorsement of the ONS in relation to the interpretation or analysis of the statistical data. This work uses research datasets which may not exactly reproduce National Statistics aggregates.


NESTA
1 Plough Place London EC4A 1DE [email protected]
www.nesta.org.uk
Published: October 2009BGI/36