Business environment and foreign direct investments: the ...
25
Full Terms & Conditions of access and use can be found at https://www.tandfonline.com/action/journalInformation?journalCode=rero20 Economic Research-Ekonomska Istraživanja ISSN: (Print) (Online) Journal homepage: https://www.tandfonline.com/loi/rero20 Business environment and foreign direct investments: the case of selected European emerging economies Mladen Vučković, Vito Bobek, Anita Maček, Hazbo Skoko & Tatjana Horvat To cite this article: Mladen Vučković, Vito Bobek, Anita Maček, Hazbo Skoko & Tatjana Horvat (2020) Business environment and foreign direct investments: the case of selected European emerging economies, Economic Research-Ekonomska Istraživanja, 33:1, 243-266, DOI: 10.1080/1331677X.2019.1710228 To link to this article: https://doi.org/10.1080/1331677X.2019.1710228 © 2020 The Author(s). Published by Informa UK Limited, trading as Taylor & Francis Group Published online: 27 Feb 2020. Submit your article to this journal Article views: 1100 View related articles View Crossmark data Citing articles: 1 View citing articles
Transcript of Business environment and foreign direct investments: the ...
Full Terms & Conditions of access and use can be found athttps://www.tandfonline.com/action/journalInformation?journalCode=rero20
Economic Research-Ekonomska Istraživanja
ISSN: (Print) (Online) Journal homepage: https://www.tandfonline.com/loi/rero20
Business environment and foreign directinvestments: the case of selected Europeanemerging economies
Mladen Vučković, Vito Bobek, Anita Maček, Hazbo Skoko & Tatjana Horvat
To cite this article: Mladen Vučković, Vito Bobek, Anita Maček, Hazbo Skoko & Tatjana Horvat(2020) Business environment and foreign direct investments: the case of selected Europeanemerging economies, Economic Research-Ekonomska Istraživanja, 33:1, 243-266, DOI:10.1080/1331677X.2019.1710228
To link to this article: https://doi.org/10.1080/1331677X.2019.1710228
© 2020 The Author(s). Published by InformaUK Limited, trading as Taylor & FrancisGroup
Published online: 27 Feb 2020.
Submit your article to this journal Article views: 1100
View related articles View Crossmark data
Citing articles: 1 View citing articles

Business environment and foreign direct investments:the case of selected European emerging economies
Mladen Vu�ckovi�ca, Vito Bobekb, Anita Ma�cekc,b, Hazbo Skokod andTatjana Horvate
aBusiness in Emerging Markets, FH Joanneum, University of Applied Sciences Graz, Graz, Austria; bFHJoanneum, University of Applied Sciences Graz, Graz, Austria; cDoba Business School, Maribor,Slovenia; dFaculty of Business, School of Accounting and Finance, Charles Strut University, Sydney,NSW, Australia; eFaculty of Management, University of Primorska, Koper, Slovenia
ABSTRACTThe globalisation process of the world economy has led toincrease of international capital mobility. In the last two decades,the level of foreign direct investments (F.D.I.) was significantlyraised and in 2017 was US$1.8 trillion. The question occupyingattention in economic literature is what the main motives anddeterminants of F.D.I. in certain countries are. This article aims toexplore what are the linkages between business environment andinward F.D.I. The research was performed on the sample of fiveEuropean emerging economies, located in Central and EasternEurope (C.E.E.) – Poland, Slovenia, Bulgaria, Romania and Serbia.The research compared the main tendencies of F.D.I.s in selectedeconomies, institutional framework and reforms during transitionprocess, competitiveness and ease of doing business (E.D.B.). Withthe quantitative analysis and ordinary least squares (O.L.S.) regres-sion authors tried to identify statistical significant linkagesbetween inward F.D.I. and ease of doing business indicators,where control variables were G.C.I. pillars (relevant for businessregulation and institutional framework), macroeconomic perform-ances, market capitalisation and taxation. The results are identi-fied factors of business environment relevant for attraction ofF.D.I. and provided empirical model for each country respectively.
ARTICLE HISTORYReceived 27 February 2018Accepted 23 December 2019
KEYWORDSF.D.I. inflows; businessenvironment; regulationframework; ease of doingbusiness (E.D.B.); globalcompetitiveness; Centraland Eastern European(C.E.E.) countries
JEL CLASSIFICATIONF 21; F 23; G 18
1. Introduction
Foreign direct investments (F.D.I.) are specific forms of international capital move-ment, characterised by control mechanism in invested enterprise. That is more thaninternational capital movement (Krugman & Obstfeld, 2009, pp. 153–163).
F.D.I. presents capital mobility combined with the control and other elements, aswell as technology. Dunning and Lundan (2008a, p. 18) explained that F.D.I. are
CONTACT Tatjana Horvat [email protected]� 2020 The Author(s). Published by Informa UK Limited, trading as Taylor & Francis Group.This is an Open Access article distributed under the terms of the Creative Commons Attribution License (http://creativecommons.org/licenses/by/4.0/), which permits unrestricted use, distribution, and reproduction in any medium, provided the original work isproperly cited.
ECONOMIC RESEARCH-EKONOMSKA ISTRAŽIVANJA2020, VOL. 33, NO. 1, 243–266https://doi.org/10.1080/1331677X.2019.1710228

more than financial capital. Through the F.D.I. transfer of managerial and technicalskills, as well as spreading the knowledge about entrepreneurship, regarding theresearch and development, technology, marketing knowledge and managerial skillsare realised.
The commonly used explanation of F.D.I. is provided by international institutions,which follows the investments around the world. One of the definitions is: ‘F.D.I.reflect the objective of obtaining a lasting interest by a resident entity in one economy(“direct investor”) in an entity resident in an economy other than that of the investor(“direct investment enterprise”)’ (OECD, 1996, p. 7). Establishing a long-term ori-ented benefit indicates the long-term relationship between direct investor and theaffiliated enterprise in the foreign country. Additionally, the significant level of con-trol of this enterprise plays an important role. The longstanding benefit meansacquiring at least 10% of shares of the company in the foreign country. These sharesmust have ‘voting power in the invested enterprise’ (IMF, 1993, p. 86).
The question what are the main motives that drive F.D.I., is mostly occupying theattention of the researchers in economic literature. It is the subject of numerous the-oretical and empirical researches (e.g., A�sanin Gole, Ma�cek, & Vukasovi�c, 2016;Popescua, 2013; Makuyana & Odhiambo, 2018; Peres, Ameer, & Xu, 2018; Kamal,Ullah, Zheng, Zheng, & Xia, 2019; Pietrucha & �Zelazny, 2019; Jia, Han, Peng, & Lei,2019). But on the other side, economic literature does not provide enough researchon the topic of regulatory framework and F.D.I. inflows, particularly in Central andEastern Europe ([C.E.E.] countries that are recognised as European emerging region).
The objective of this article is to explore the link between business environment(regulatory and institutional framework) in C.E.E. countries (Bulgaria, Poland,Romania, Serbia and Slovenia), measured by the ease of doing business (E.D.B.) indica-tors and inward F.D.I. in the period between 2006 and 2016. ‘Business environment’ isdefined as a set of factors which are outside the enterprise and out of control of itsmanagement. In this approach, the business environment is divided into internal andexternal, and economic and non-economic. Observed from the macro aspect, the busi-ness environment means an external, economic and non-economic environment, and itrefers to the prevailing system of values in society, the laws adopted by the state, therules regulating the economy, the monetary policy adopted by the central bank, the fis-cal policy controlled by the central and local government, institutional infrastructure,foreign trade policy, government position and foreign capital policies and enterprises.The business environment represents all factors that influence the decisions, results andorganisation of the company. Bearing this in mind, an enterprise should carefully ana-lyse all the components of the business environment so that it can function anddevelop normally.
In this article authors will compare F.D.I. inflows, business environment and regu-latory framework according to E.D.B. The empirical data analysis will be performedon the following indicators: F.D.I. inflow, E.D.B. components and control variables(global competitiveness index pillars that are relevant for institutional and regulatoryframework and macroeconomic indicators).
After introduction in Section 1, literature review, which it is composed by second-ary data is presented. After presenting the methodology and sample in Section 3,
244 M. VUČKOVIĆ ET AL.

Section 4 discusses the results of an empirical analysis of factors that were the mostrelevant for the attraction of F.D.I. in C.E.E. countries. Section 5 draws conclusions.
2. Literature review
At the time of acceleration of internationalisation of production, the special consider-ation of economic scholars for 40years has been on eclectic theory of internationalisa-tion of production. Its essence is reflected in the attitude that domestic enterpriseshave different perspective of growth through horizontal or vertical diversification onthe foreign market. The diversification could be achieved through new product lines,new activities, acquisition of domestic enterprises, as well as production of knowledge(Dunning, 1980). In the economic literature this theory is well known as theOwnership, Location and Internationalisation (O.L.I.) paradigm.
The actualisation of the O.L.I. paradigm in the early 1980s led to the fact that thetheory was the subject of numerous researches through various empirical studies. Theresults of such testing showed that competitive advantage of enterprise is based onownership advantage on the foreign market and location advantage where productionis based. The research was performed on a sample of U.S. affiliates in seven differentcountries and 14 manufacturing industries during 1970 (Dunning, 1980, p. 13).Meyer (2015, pp. 61–62) researched the O.L.I. paradigm by investments in someemerging and developed economies.
In parallel with O.L.I. theory, neo-institutional theory has attracted the attention atthe end of the twentieth century. The new approach emphasised the importance ofinstitution factors for economic growth. Michael Todaro, professor of developmenteconomics, classified this theory as the component of new endogenous theory of eco-nomic growth (Todaro & Smith, 2015, p. 119). Douglas and North are considered tobe the authors of neo-institutional theoretical direction. North differentiates betweentwo approaches in research: formal rules and informal constraints. Formal rules ofinstitutions are related to laws, regulation, constitutions, while informal constraintsobserve behaviour norms, convention, code of conduct, etc. (North, 1994, p. 360).
Later, at the beginning of twenty-first century, Dunning and Lundan tried to asso-ciate the institutional dimension with the three components of the O.L.I. paradigm inthe explanation of internationalisation of global production (Dunning & Lundan,2008b, p. 573). The institutional dimension should provide attractive investment cli-mate and efficient regulatory environment for attracting inward F.D.I. in the hostcountry. Thus, the regulatory framework of business has become an important deter-minant of internationalisation of production.
This approach was caused by the empirical research, which recognised the regula-tory framework for business entities as the crucial determinant during start-up busi-ness activities (Djankov et al., 2002, pp. 1–37). More specifically, the differences inregulation of the business activities are closely correlated to the location, where busi-ness activity will be realised. Thus, it affects the investment decision of multinationalcompanies during the process of selection of the location among potentialhost countries.
ECONOMIC RESEARCH-EKONOMSKA ISTRAŽIVANJA 245
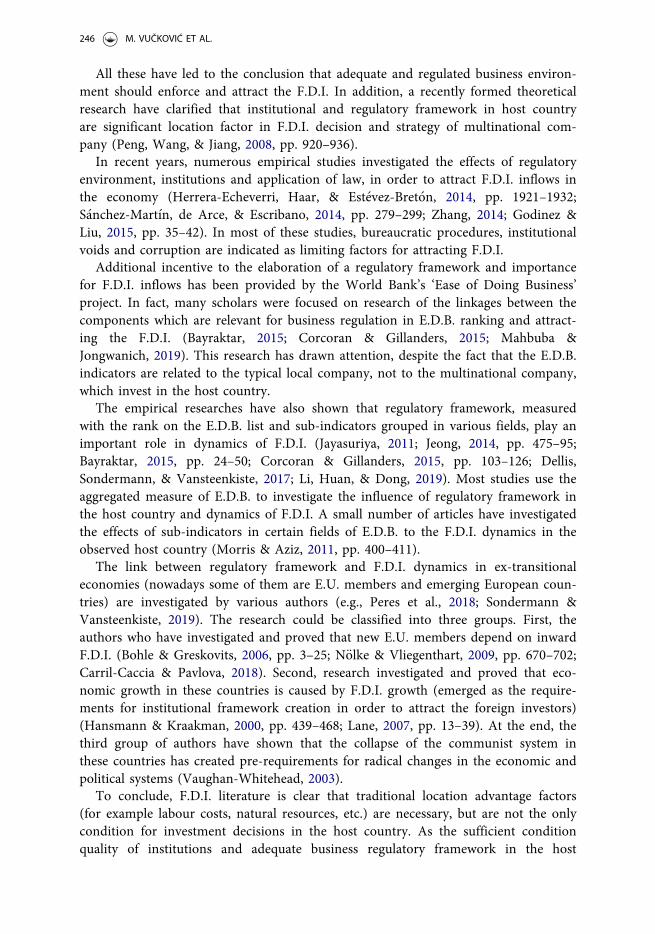
All these have led to the conclusion that adequate and regulated business environ-ment should enforce and attract the F.D.I. In addition, a recently formed theoreticalresearch have clarified that institutional and regulatory framework in host countryare significant location factor in F.D.I. decision and strategy of multinational com-pany (Peng, Wang, & Jiang, 2008, pp. 920–936).
In recent years, numerous empirical studies investigated the effects of regulatoryenvironment, institutions and application of law, in order to attract F.D.I. inflows inthe economy (Herrera-Echeverri, Haar, & Est�evez-Bret�on, 2014, pp. 1921–1932;S�anchez-Mart�ın, de Arce, & Escribano, 2014, pp. 279–299; Zhang, 2014; Godinez &Liu, 2015, pp. 35–42). In most of these studies, bureaucratic procedures, institutionalvoids and corruption are indicated as limiting factors for attracting F.D.I.
Additional incentive to the elaboration of a regulatory framework and importancefor F.D.I. inflows has been provided by the World Bank’s ‘Ease of Doing Business’project. In fact, many scholars were focused on research of the linkages between thecomponents which are relevant for business regulation in E.D.B. ranking and attract-ing the F.D.I. (Bayraktar, 2015; Corcoran & Gillanders, 2015; Mahbuba &Jongwanich, 2019). This research has drawn attention, despite the fact that the E.D.B.indicators are related to the typical local company, not to the multinational company,which invest in the host country.
The empirical researches have also shown that regulatory framework, measuredwith the rank on the E.D.B. list and sub-indicators grouped in various fields, play animportant role in dynamics of F.D.I. (Jayasuriya, 2011; Jeong, 2014, pp. 475–95;Bayraktar, 2015, pp. 24–50; Corcoran & Gillanders, 2015, pp. 103–126; Dellis,Sondermann, & Vansteenkiste, 2017; Li, Huan, & Dong, 2019). Most studies use theaggregated measure of E.D.B. to investigate the influence of regulatory framework inthe host country and dynamics of F.D.I. A small number of articles have investigatedthe effects of sub-indicators in certain fields of E.D.B. to the F.D.I. dynamics in theobserved host country (Morris & Aziz, 2011, pp. 400–411).
The link between regulatory framework and F.D.I. dynamics in ex-transitionaleconomies (nowadays some of them are E.U. members and emerging European coun-tries) are investigated by various authors (e.g., Peres et al., 2018; Sondermann &Vansteenkiste, 2019). The research could be classified into three groups. First, theauthors who have investigated and proved that new E.U. members depend on inwardF.D.I. (Bohle & Greskovits, 2006, pp. 3–25; N€olke & Vliegenthart, 2009, pp. 670–702;Carril-Caccia & Pavlova, 2018). Second, research investigated and proved that eco-nomic growth in these countries is caused by F.D.I. growth (emerged as the require-ments for institutional framework creation in order to attract the foreign investors)(Hansmann & Kraakman, 2000, pp. 439–468; Lane, 2007, pp. 13–39). At the end, thethird group of authors have shown that the collapse of the communist system inthese countries has created pre-requirements for radical changes in the economic andpolitical systems (Vaughan-Whitehead, 2003).
To conclude, F.D.I. literature is clear that traditional location advantage factors(for example labour costs, natural resources, etc.) are necessary, but are not the onlycondition for investment decisions in the host country. As the sufficient conditionquality of institutions and adequate business regulatory framework in the host
246 M. VUČKOVIĆ ET AL.

country are mentioned. The findings in the literature show, that in C.E.E. countries,entrepreneurial orientation, friendly environment (mostly focus on location) and effi-cient business regulation were important by attracting F.D.I. (realised by multi-national companies). All of these factors were key to the competitive advantage of thecountry (Berg & Cazes, 2007, pp. 1–31). Unfortunately, there are insufficient andsmall numbers of empirical studies in C.E.E. countries that confirm the mentionedstatement. Furthermore, these studies are focused on administration, political and cul-tural determinants (Bandelj, 2002, pp. 411–44; Carstensen & Toubal, 2004, pp. 3–22).More specifically, the importance of a comprehensive institutional environment isstressed, but there is a lack of information about certain determinants that explainthe efficiency of regulatory environment and E.D.B. in the country. Additionally, theproject ‘Doing Business’ started to measure regulatory framework in 2005. This articlewill try to identify which components of the E.D.B. are significant for F.D.I. inflows.
3. Methodology and sample
The aim of this article is to explore the linkages between a business environment(regulatory and institutional framework) and inflow of F.D.I. The research will beperformed on the sample of different C.E.E. countries (Poland, Slovenia, Romania,Bulgaria and Serbia) in period 2006–2016. Some of these countries have become E.U.members in the meantime, while others negotiate for the membership. The articlecompares the F.D.I. inflow, business environment and regulatory framework accord-ing to E.D.B. The empirical data analysis is performed on the following indicators:F.D.I inflow, E.D.B. components and control variables (global competitiveness indexpillars that are relevant for institutional and regulatory framework and macroeco-nomic indicators). The regression analysis should test the hypothesis and identifywhich components are significantly attracting the F.D.I. inflow. The final result is theempirical model which quantifies these components.
For the research, secondary data and official databases of international organisations,official reports, as well as national statistical databases were used. The following sourceswere used:
� U.N.C.T.A.D. Database – F.D.I. statistics (UNCTAD, 2017),� Doing Business Reports and E.D.B. database (The World Bank, 2017a)� World Economic Forum and G.C.I. database (World Economic Forum, 2018)� The World Bank Indicator database (The World Bank, 2017b),� Eurostat statistical database (Eurostat, 2017),� National statistical databases.
For our sample five different countries was chosen. Authors wanted to researchthe diversity, therefore the sample is created to compare one big and one small coun-try, for example, Poland and Slovenia, Bulgaria and Romania. The first two countriesentered the E.U. in 2004, while Bulgaria and Romania entered the E.U. in 2007. Forthe fifth country we chose Serbia, which started negotiations for joining the E.U. in2013. All countries had an obligation to adapt and reform institutional framework
ECONOMIC RESEARCH-EKONOMSKA ISTRAŽIVANJA 247

during the joining process according to E.U. legislation and principles. Regarding thefact that authors wanted to analyse two countries that became E.U. members in 2004,two countries that entered the E.U. in 2007 and one country that negotiates for mem-bership, it was not possible to define the sample that has homogeneous exchangerates. Authors are aware that exchange rates can influence the total amount of F.D.I.(Mackton, Odondo, & Nyongesa, 2018; Adekunle, Abdulahi, Gbadebo, & Fakunmoju,2019). According to the previous literature one set of researchers supports a negativerelationship between exchange rate and F.D.I. (e.g., Krugman & Obstfeld, 2009;Ellahi, 2011), the second finds a positive relationship between exchange rate andF.D.I. (Phillips & Ahmadi-Esfahani, 2008, pp. 505–525; Nyarko, Nketiah-Amponsah,& Barnor, 2011, pp. 277–286; Omorokunwa & Ikponmwosa, 2014, pp. 146–154).
Furthermore, some control variables are subjectively determined, for example, mar-ket capitalisation which is in some countries only a matter of decision of the majorshareholders to put their companies in the official stock exchange list.
Research refers to the period from 2006 to 2016. Within this period there was aglobal financial crisis. According to Alfaro and Chen (2010); Poulsen and Hufbauer(2011); Dornean, Isan, and Oanea (2012, pp. 1012–1017); Stoddard and Noy (2015,pp. 387–399) financial crises had a strong negative effect on inward F.D.I. The crisiscertainly influenced the F.D.I., but regarding the fact that authors researched a 10year period and that financial crises occur about once every decade, there would beimpacts of the crisis on F.D.I. in each period. Some of the most relevant indicatorsfor each economy are presented in the following Table 1.
Table 1 shows the most important economic indicators for selected countries. Itcan be seen that countries are very different according to their size, economic stabil-ity, F.D.I. inflows and selected indices.
Variables and analytical framework
The variables used in this research could be classified as: (i) dependent variable; (2)independent variables; and (3) control variables.
Table 1. Selected economic indicators of the selected economy.Indicator Bulgaria Poland Romania Serbia Slovenia
Population (millions) 2006 7.6 38.1 21.2 7.4 2.02016 7.2 38.0 19.9 7.1 2.1
GDP growth 2006 6.8% 6.2% 8.0% 9.7% 5.6%2016 3.9% 3.1% 4.8% 3.3% 3.1%
Inflation rate in 2016 2006 7.3% 1.28% 6.56% 11.72% 2.46%2016 �0.80% �0.66% �1.54% 1.12% �0.005%
Unemployment rate in 2016 2006 8.9% 13.8% 7.3% 20.8% 5.9%2016 7.6% 6.2% 5.9% 15.9% 8.0%
FDI inflows (billions of USD) 2006 7.87 21.47 11.00 4.26 0.692016 1.56 18.32 6.25 2.35 1.45
GCI 2017 (1/138) 2006 72 48 68 87 332016 50 36 62 90 56
CPI index (rank) 2006 64 62 70 82 272016 75 29 57 72 31
Source: World Bank, W.E.F., O.E.C.D., U.N.C.T.A.D., National Institute of Statistics – Romania. (2019), Republic ofBulgaria National statistical institute (2019), Republic of Slovenia Statistical Office (2019), Statistical Office of theRepublic of Serbia (2019), Statistics Poland (2019).
248 M. VUČKOVIĆ ET AL.

The dependent variable is inward F.D.I. at current prices in U.S. dollars. Data wastaken from the U.N.C.T.A.D. database. Inward F.D.I. means inflows of F.D.I. in econ-omy (investment equity flow).
The independent variables are E.D.B. indicators: starting a business, dealing withconstruction permits, getting electricity, registering property, getting credit, protectingminority investors, paying taxes, trading across borders, enforcing contracts, resolvinginsolvency. Data was taken from the ‘Doing Business Database’. The measure of eachindicator is D.T.F. score, which measures the quality of performance. Values of theseindicators are numerically expressed in terms of the D.T.F. score method that repre-sents a score between 0 and 100 (100 is the best result, thus, this is the target pointand 0 means the weakest result and refers to the worst performance) and it indicatesthe distance of a country in relation to the country that experiences the best results(performance) in some area of the business environment in the observed period.
The control variables are: (1) global competitiveness indicators (pillars of G.C.I.index); (2) macroeconomic performance indicators; (3) market capitalisation; (4) taxrates; and (5) fertility rate.
Global competitiveness indicators (G.C.I.) uses 12 pillars of competitiveness (someof them measure regulation and institutional framework). For this article the follow-ing pillars were used: institutions, infrastructure, macroeconomic environment, goodsmarket efficiency, Labour market efficiency, financial market development, techno-logical readiness, market size, business sophistication. All these indicators are meas-ured by the rank on the G.C.I. list. Data was taken from the Global CompetitivenessReport database by the World Economic Forum.
Macroeconomic indicators measure the economic performance of the country andfor the variables we chose four most relevant indicators: G.D.P. growth, inflation rate,unemployment rate and balance of payment (measured by current account balance as% of G.D.P.). The indicators were taken from the World Bank database, Eurostat andnational statistical databases.
Market capitalisation of listed domestic companies is recognised as market value.The indicator is measured in current prices in U.S. dollars. These indicators show thedevelopment of the financial market. Data was taken from the World Bank database.Tax rates are corporate income tax rates (measured in %), while the fertility ratemeans the total birth per woman. Data was taken from the Eurostat database, as wellas the World Bank database.
According to the problem statement and identified research gap, the followingresearch question was defined:
Which factors of business regulation framework are key determinants of F.D.I.inflows in C.E.E. countries in the period between 2006 and 2016?
According to the theoretical research, where it is shown which factors influencesF.D.I. inflow (e.g., Alguacil, Cuadros, & Orts, 2011; Becker, Fuest, & Riedel, 2012;Bellak & Leibrecht, 2009; Blyde & Molina, 2015; Busse, Nunnenkamp, & Spatareanu,2011; Cuzovic, Sokolov Mladenovic, & Cuzovic, 2014; Donaubauer, Meyer, &
ECONOMIC RESEARCH-EKONOMSKA ISTRAŽIVANJA 249

Nunnenkamp, 2016; Egger & Winner, 2005; Ghinamo, Panteghini, & Revelli, 2010;Pruefer & Tondl, 2008) and chosen variables the following hypothesis were formed:
H0: There is no relation between variables published in the Doing Business Databaseand F.D.I. inflows in C.E.E. countries in the period between 2006 and 2016.
H1: There is a relation between variables published in the Doing Business Database andF.D.I. inflows in C.E.E. countries in the period between 2006 and 2016.
H0: There is no relation between regulatory and institution related variables published inG.C.I. report and F.D.I. inflows in C.E.E. countries in the period between 2006 and 2016
H1: There is a relation between regulatory and institution related variables published inG.C.I. report and F.D.I. inflows in C.E.E. countries in the period between 2006 and 2016.
For the analysis multiple linear regression model (O.L.S. regression) was used. Thismethod aims to explore the linkages between variables and to quantify the statisticalsignificance of certain variables. The regression model is a stochastic model thatshows average composition of variation of investigated occurrence. Before all theassumptions (no multicollinearity, heteroskedasticity and autocorrelation) for the modelwere tested. Multiple regression model has the following equation (Wooldridge, 2013,pp. 68–76):
y ¼ b0 þb1x1 þ b2x2 þ b3x3 þ ::: þ bkxk þ u (1)
where x - means independent variable, y – dependent variable, b – regression param-eter and u is residual. The aim of regression analysis is to predict some values of y(dependent variable, in this research F.D.I. inflows), for certain value of x (independ-ent variable, in this research E.D.B. indicators).
Ordinary least square (O.L.S.) method minimises squares sum residual in order toestimate the unrecognised parameters in the sample. The O.L.S. regression modelwith k estimated variables could be written as follows:
y2 ¼ b02þb1
2x1 þ b22x2 þ b32x3 þ ::: þ bk
2xk þ u (2)
where b02, b1
2…bk2 are estimated values of b0, b1…bk. Furthermore, the O.L.S.
method estimates and minimises the sum of squared residuals.The estimation of b1
2 and b22 have ceteris paribus interpretation, that y (depend-
ent variable) could be predicted with the change of x1 and x2.The reliability of the model was accepted on the p-value and R square (adjusted R
square). The p-value should be less than 0.05 (in some estimation the level could behigher – 0.10 or 0.15). Higher value of adjusted R square means that model is morereliable (Wooldridge, 2013, pp. 68–76).
4. Results of the quantitative analysis
In order to find out which factors of the business regulatory environment influencethe volume and dynamics of F.D.I. inflows in the five selected countries in C.E.E.most significantly, appropriate regression models (O.L.S. regression) for each countryhave been constructed. We focused on the period between 2006 and 2016. On the
250 M. VUČKOVIĆ ET AL.
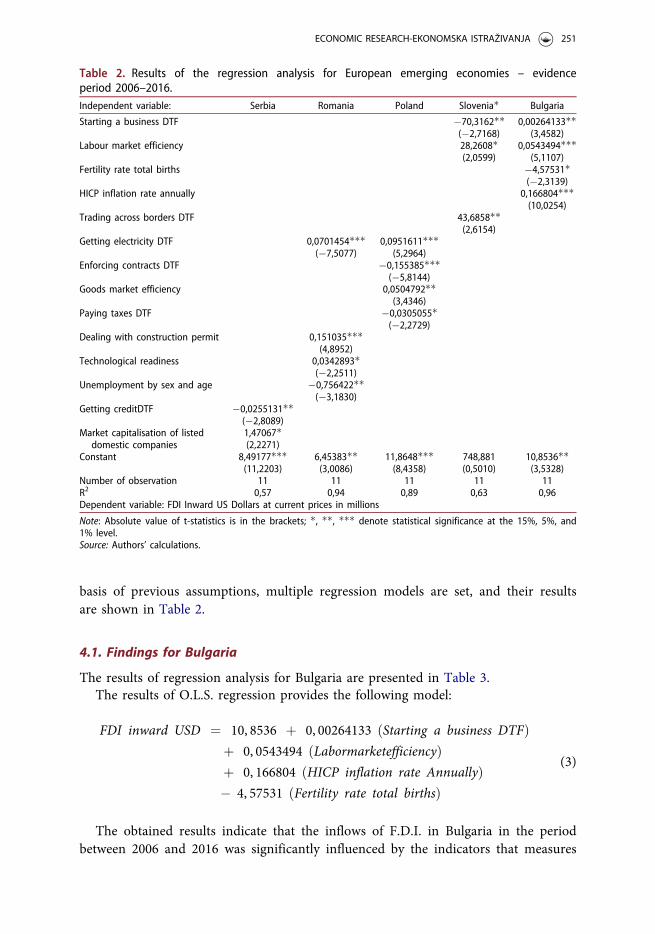
basis of previous assumptions, multiple regression models are set, and their resultsare shown in Table 2.
4.1. Findings for Bulgaria
The results of regression analysis for Bulgaria are presented in Table 3.The results of O.L.S. regression provides the following model:
FDI inward USD ¼ 10, 8536 þ 0, 00264133 ðStarting a business DTFÞþ 0, 0543494 ðLabormarketefficiencyÞþ 0, 166804 ðHICP inflation rate AnnuallyÞ� 4, 57531 ðFertility rate total birthsÞ
(3)
The obtained results indicate that the inflows of F.D.I. in Bulgaria in the periodbetween 2006 and 2016 was significantly influenced by the indicators that measures
Table 2. Results of the regression analysis for European emerging economies – evidenceperiod 2006–2016.Independent variable: Serbia Romania Poland Slovenia� Bulgaria
Starting a business DTF �70,3162��(�2,7168)
0,00264133��(3,4582)
Labour market efficiency 28,2608�(2,0599)
0,0543494���(5,1107)
Fertility rate total births �4,57531�(�2,3139)
HICP inflation rate annually 0,166804���(10,0254)
Trading across borders DTF 43,6858��(2,6154)
Getting electricity DTF 0,0701454���(�7,5077)
0,0951611���(5,2964)
Enforcing contracts DTF �0,155385���(�5,8144)
Goods market efficiency 0,0504792��(3,4346)
Paying taxes DTF �0,0305055�(�2,2729)
Dealing with construction permit 0,151035���(4,8952)
Technological readiness 0,0342893�(�2,2511)
Unemployment by sex and age �0,756422��(�3,1830)
Getting creditDTF �0,0255131��(�2,8089)
Market capitalisation of listeddomestic companies
1,47067�(2,2271)
Constant 8,49177���(11,2203)
6,45383��(3,0086)
11,8648���(8,4358)
748,881(0,5010)
10,8536��(3,5328)
Number of observation 11 11 11 11 11R2 0,57 0,94 0,89 0,63 0,96Dependent variable: FDI Inward US Dollars at current prices in millions
Note: Absolute value of t-statistics is in the brackets; �, ��, ��� denote statistical significance at the 15%, 5%, and1% level.Source: Authors’ calculations.
ECONOMIC RESEARCH-EKONOMSKA ISTRAŽIVANJA 251

Starting a Business, H.I.C.P. – Inflation rate, Labour market efficiency and Fertilityrate, because the variations of these four variables explain 93% of the total variations(Adjusted R-squared ¼ 0.933905) in the F.D.I. inflows in Bulgaria in the periodbetween 2006 and 2016.
The biggest influence on the F.D.I. inflows in Bulgaria has an indicator thatmeasures the H.I.C.P. – inflation rate, and is expressed through the annual averagerate of change (%). The influence of this indicator is statistically significant (p isless than 0.01). The positive value of the coefficient indicates that the growth ofthis indicator, with unchanged values of other variables, can positively affect theinflows of F.D.I. in Bulgaria. The positive relationship between F.D.I. and inflationrate is a little unexpected as numerous studies show negative relationship betweenboth variables (Twimukye, 2006; Asiedu, 2006, pp. 63–77; Aijaz, Siddiqui, &Aumeboonsuke, 2014, pp. 59–70). On the other hand, positive correlation betweeninflation and F.D.I. can also be found in numerous studies (e.g., Anitha, 2012; Ali,2015, pp. 17–24; Ali, Ibrahim, & Omar, 2017, pp. 25–37). The argument for thatresult can be that inflation is a pull factor in terms of providing a conducive envir-onment for both foreign and local investments (Mishkin, 2007, pp. 317–334; Batini& Laxton, 2006). Furthermore, Sayek (2009, pp. 419–443) also proved thatincreased domestic inflation rates normally increases F.D.I. through changes in theinternational consumption trend of the host country as it may reduce the cost ofF.D.I. operations.
Another indicator that significantly influences the inflows of F.D.I. in Bulgaria isan indicator that is an integral part of the G.C.I. and measures Labour market effi-ciency (the level of productivity of the labour market). The influence of this indica-tor is statistically significant (p is less than 0.01), and the positive value of thecoefficient shows the importance of allocating a country’s human resources as valu-able organisational resources (Veingerl �Ci�c, Mulej, & �Sarotar �Zi�zek, 2016), to itsmost productive sectors. Skilled employees are valuable organisational resources.The model predicts, if the country makes further low rank, the F.D.I. inflows willstill stay positive – because the country is becoming attractive for efficiency seeking
Table 3. Results of O.L.S. regression, using observations 2006–2016 (T ¼ 11), Bulgaria.Coef. Std.Error t-ratio p-value
const 10,8536 3,07224 3,5328 0,01233 ��Starting a Business DTF 0,00264133 0,000763793 3,4582 0,01350 ��Labour market efficiency 0,0543494 0,0106345 5,1107 0,00220 ���HICP inflation rate annually 0,166804 0,0166382 10,0254 0,00006 ���Fertility rate total births �4,57531 1,97729 �2,3139 0,05995 �Mean dependent var. 7,994137 S.D. dependent var. 0,873565Sum squared resid. 0,302629 S.E. of regression 0,224584R-squared 0,960343 Adjusted R-squared 0,933905F(4, 6) 36,32436 p-value(F) 0,000242Log-likelihood 4,153966 Akaike criterion 1,692068Schwarz criterion 3,681544 Hannan-Quinn 0,437982rho �0,378288 Durbin-Watson 2,620437GQ (F¼ 6,8) 3,024742 VIF 1,005061Dependent variable: FDI Inward US Dollars at current prices in millions
Note: �, ��, ��� denote statistical significance at the 15%, 5%, and 1% level.Source: Authors’ calculations.
252 M. VUČKOVIĆ ET AL.
F.D.I. The model predicts this relation in the case of unchanged values of other var-iables (‘ceteris paribus’).
A positive impact on the F.D.I. inflows in Bulgaria has an indicator that measuresStarting a Business. It is a Doing Business indicator that is calculated by the D.T.F.method. The impact of this indicator is statistically significant (p is less than 0.05),and the positive value of the coefficient shows that further reduction of Bulgaria’s lag-ging in Starting a Business area, with unchanged values of other variables, will posi-tively affect the F.D.I. inflows. One of the reasons for this result is the relatively lowranking of Bulgaria in the world according to this indicator (for example, 82nd placeout of 190 countries). The number of points which Bulgaria has (85.83 points out of100 maximum) gives a lot of room for improvement in this area, thus easing the con-ditions for starting a business and improving Bulgaria’s attractiveness as a preferreddestination for foreign investment.
Unlike the previous three indicators whose growth positively influences the F.D.I.inflows, the growth of the fourth indicator negatively influences the inflows of F.D.I.in Bulgaria. It is an indicator that measures Fertility rate and whose statisticaldependence is still significant (p is less than 0.15). Fertility rate growth may have anegative impact on F.D.I. inflows, as it reduces the number of women in the labourmarket during pregnancy and childbirth, increases the cost of their engagement (sickleave, additional training costs) and reduces the flexibility of the labour market.Additional reason could be that F.D.I. is not looking for labour intensive industries,where the human capital plays an important role.
Based on the results obtained from the previously analysed F.D.I. inflows model, itcan be concluded that the most important factors leading to a larger inflow of F.D.I.in Bulgaria are: Starting a Business, H.I.C.P. – Inflation Rate and Labour market effi-ciency. Unlike these factors, factors like Fertility rate can reduce F.D.I. inflowsin Bulgaria.
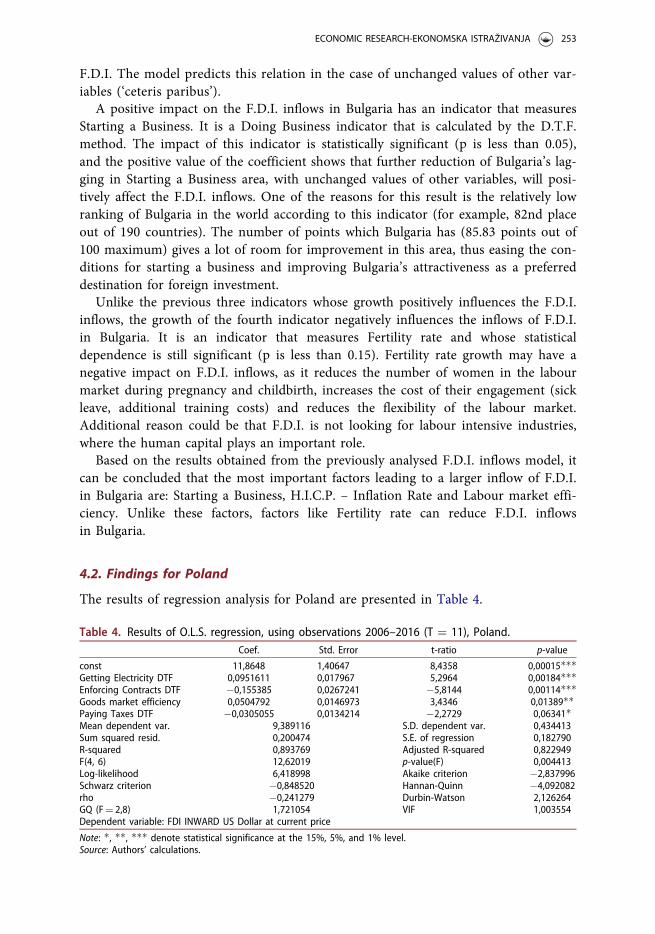
4.2. Findings for Poland
The results of regression analysis for Poland are presented in Table 4.
Table 4. Results of O.L.S. regression, using observations 2006–2016 (T ¼ 11), Poland.Coef. Std. Error t-ratio p-value
const 11,8648 1,40647 8,4358 0,00015���Getting Electricity DTF 0,0951611 0,017967 5,2964 0,00184���Enforcing Contracts DTF �0,155385 0,0267241 �5,8144 0,00114���Goods market efficiency 0,0504792 0,0146973 3,4346 0,01389��Paying Taxes DTF �0,0305055 0,0134214 �2,2729 0,06341�Mean dependent var. 9,389116 S.D. dependent var. 0,434413Sum squared resid. 0,200474 S.E. of regression 0,182790R-squared 0,893769 Adjusted R-squared 0,822949F(4, 6) 12,62019 p-value(F) 0,004413Log-likelihood 6,418998 Akaike criterion �2,837996Schwarz criterion �0,848520 Hannan-Quinn �4,092082rho �0,241279 Durbin-Watson 2,126264GQ (F¼ 2,8) 1,721054 VIF 1,003554Dependent variable: FDI INWARD US Dollar at current price
Note: �, ��, ��� denote statistical significance at the 15%, 5%, and 1% level.Source: Authors’ calculations.
ECONOMIC RESEARCH-EKONOMSKA ISTRAŽIVANJA 253
The results of O.L.S. regression provide the following model:
FDI inward USD ¼ 11, 8648 þ 0, 0951611 ðGetting Electricity DTFÞ� 0, 155385 ðEnforcing Contracts DTFÞ þ 0, 0504792 ðGoods market efficiencyÞ� 0, 0305055 ðPaying Taxes DTFÞ
(4)
The obtained results indicate that the inflows of F.D.I.s in Poland in the periodbetween 2006 and 2016 was affected by three variants of Doing Business indicators(Getting Electricity, Enforcing Contracts and Paying Taxes), as well as an indicatorthat measures Goods market efficiency, since variations of these four variables explain82% of the total variations (Adjusted R-squared ¼ 0.822949) in F.D.I. inflows inPoland for the period between 2006 and 2016.
The indicator which measures Getting Electricity, has a statistical significance (p isless than 0.01) and positive impact on the inflow of foreign investments. In the caseof Poland, the obtained results show that growth of the value of this indicator posi-tively influences the F.D.I. inflows, which was expected, as it reflects the quality ofthe basic infrastructure that can greatly facilitate and reduce the costs of doing busi-ness in an economy.
A statistically significant impact (p is less than 0.05) on the F.D.I. inflows inPoland has also an indicator that measures Goods market efficiency. It is an indicatorthat is an integral part of the Global Competitiveness Index and measures the effi-ciency of using the factors of production, or the intensity of competition and the dis-tortion of fiscal policies and regulations. A positive sign indicates that theimprovement in the Goods market efficiency has a positive impact on attractingF.D.I.s in Poland, which is in accordance with expectations.
The biggest impact on F.D.I. inflows in Poland has an indicator that measuresEnforcing Contracts. The impact of this indicator is statistically significant (p is lessthan 0.01), and the negative value of the coefficient shows that further decrease inPoland’s lagging behind compared to the best countries in the world, with unchangedvalues of other variables, can negatively affect the inflows of F.D.I. investments inPoland. Poland’s attractiveness as a preferred investment destination, especially formultinational companies that often go to countries where the rule of law is not at itshighest level, because they are often in a privileged position in such situation. Thissituation is typical for Greenfield investments. When the procedures in court disputesare high, the domestic companies that are waiting for the executive solutions have abig problem with the profitability and market value. Because of the obligations, thedomestic companies were usually offered to foreign investors under the market price.Further improvement in this field could not be interested in F.D.I. and this typeof investment.
A very similar situation is with an indicator that measures Paying Taxes, wherethe indicator is statistically significant (p is less than 0.15). As Doing Business indica-tor, it is calculated by the D.T.F. method, and the negative impact on the F.D.I.inflows can be explained by the efforts of foreign investors to have a privileged pos-ition in the economy when it comes to the tax discipline and taxation. The variation
254 M. VUČKOVIĆ ET AL.
could be explained by the lower wave of investments in the period after the worldeconomic crisis. Poland had two ways of calculating F.D.I. since 1991. An intensiveperiod of F.D.I. inflows was five years after 1991 and the second wave was afterentering the E.U. Continuously improvement of the taxation system is not followedby the significant variation of F.D.I. in the country.
Based on the results obtained from the previously analysed F.D.I. inflow model, itcan be concluded that the most important factors that lead to higher F.D.I. inflows inPoland are the Goods market Efficiency and Getting Electricity. Unlike these factors,factors such as Enforcing Contracts and Paying Taxes can reduce F.D.I. inflowsin Poland.
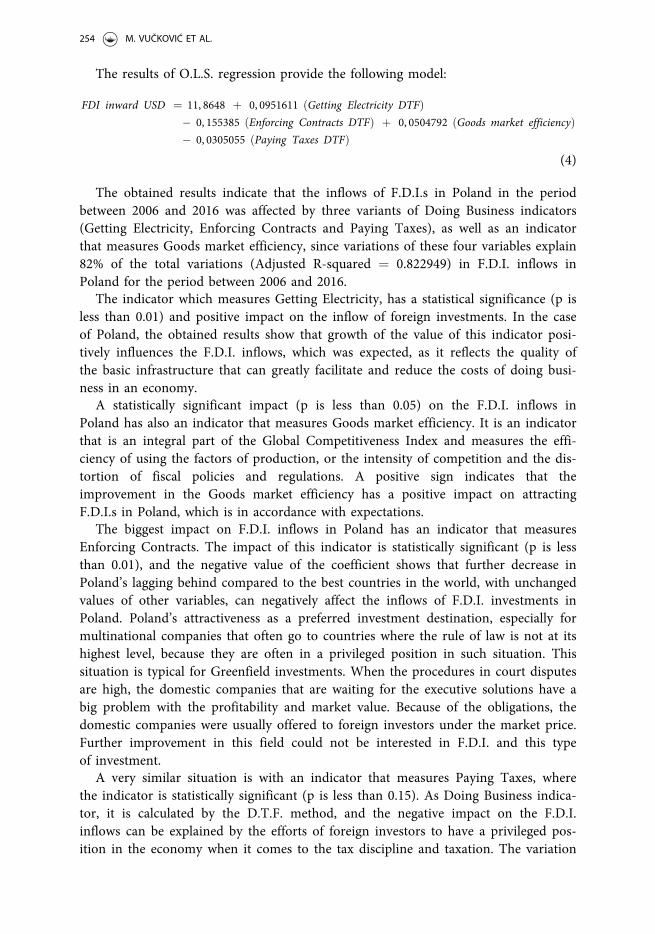
4.3. Findings for Romania
The results of regression analysis for Romania are presented in Table 5.The results of O.L.S. regression provides the following model:
FDI inward USD ¼ 6, 45383 þ 0, 151035 ðDealingwithConstructionPermitsDTFÞþ 0, 0701454 ðGettingElectricityDTFÞ þ 0, 0342893 ðTechnologicalreadinessÞ� 0, 756422 ðUnemploymentbysexandageÞ
(5)
The obtained results show that inflows of F.D.I. in Romania in the period between2006 and 2016 was influenced by two Doing Business Indicators (Dealing withConstruction Permits and Getting Electricity), as well as indicators that measure theTechnological Readiness and Unemployment by sex and age, because variations ofthese four variables explain 90% of the total variations (Adjusted R-squared ¼ 0,898521) in F.D.I. inflows in Romania in the period between 2006 and 2016.
The biggest impact on F.D.I. inflows in Poland has an indicator that measuresDealing with Construction Permits. The impact of this indicator is statistically signifi-cant (p is less than 0.01), and the positive value of the coefficient indicates that the
Table 5. Results of O.L.S. regression, using observations 2006–2016 (T ¼ 11), Romania.Coef. Std. Error t-ratio p-value
const 6,45383 2,14511 3,0086 0,02374��Dealing with Construction Permit 0,151035 0,0308534 4,8952 0,00272���Getting Electricity DTF 0,0701454 0,0093431 �7,5077 0,00029���Technological readiness 0,0342893 0,0152324 �2,2511 0,06534�Unemployment by sex and age �0,756422 0,237646 �3,1830 0,01900��Mean dependent var. 8,476014 S.D. dependent var. 0,583657Sum squared resid. 0,207417 S.E. of regression 0,185929R-squared 0,939112 Adjusted R-squared 0,898521F(4, 6) 23,13553 p-value(F) 0,000862Log-likelihood 6,231736 Akaike criterion �2,463472Schwarz criterion �0,473996 Hannan-Quinn �3,717558rho �0,677276 Durbin-Watson 3,224055GQ (F¼ 16,58) 12,585943 VIF 1,009822Dependent variable: FD IINWARD US Dollar at current price
Note: �, ��, ��� denote statistical significance at the 15%, 5%, and 1% level.Source: Authors’ calculations.
ECONOMIC RESEARCH-EKONOMSKA ISTRAŽIVANJA 255

reduction of Romania’s lagging behind in this area in relation to the best countries inthe world, with unchanged values of other variables, can positively affect the inflowF.D.I. investment in Romania. One of the reasons for this is the relatively low rankingof Romania according to this indicator (95th place out of 190 countries). Anotherreason is the fact that there is a large space (58.09 points out of 100 maximum) forfurther progress in this area.
Another important factor influencing the F.D.I. inflows in Romania is also DoingBusiness indicator that measures Getting Electricity. This indicator, too, has a largestatistical significance (p is less than 0. 01), and a positive influence on the inflow offoreign investments. As in the case of Poland and Romania, the obtained resultsshow that the growth of the value of this indicator positively influences the inflows ofF.D.I., especially if one takes into account Romania’s lagging in comparison with thebest countries – according to this indicator Romania is low in rank compared toother countries (134th place out of 190 countries) and there is a significant space(53.23 points out of 100 maximum) for further progress in this area and for attractingF.D.I. on this basis.
The third indicator that significantly influences the inflows of F.D.I. in Romania isan indicator that is an integral part of the G.C.I. and measures the TechnologicalReadiness, or Technological adoption. The influence of this indicator is statisticallysignificant (p is less than 0.15). The positive value of the coefficient indicates thatRomania will be interested destination for F.D.I. inflows if exists technological disad-vantage of the country (the rank will be higher and position of the country lower),with unchanged values of other variables. This comes from the fact, that a lot ofmultinational companies are looking for countries where could export own technol-ogy. The characteristics of these markets are a lack of technology and a need for for-eign capital.
Unlike the previous three indicators whose growth positively influences the inflowsof F.D.I., the growth of the fourth indicator has a negative impact on the F.D.I.inflows in Romania. It is an indicator that measures Unemployment by sex and age –annual average and whose statistical dependence is significant (p is less than 0.05).The increase in unemployment has a negative impact on the F.D.I. inflows, as itreduces the purchasing power of the population and, consequently, the size of thedomestic market and domestic demand, it increases social tensions and society’scohesion, and it increases the pressure on macroeconomic stability due to the increas-ing demands for social benefits.
Based on the results obtained from the previously analysed F.D.I. inflows model, itcan be concluded that the most important factors leading to a larger inflow of F.D.I.in Romania are Dealing with Construction Permits, Getting Electricity andTechnological Readiness. Unlike these factors, factors such as Unemployment by sexand age can reduce F.D.I. inflows in Romania.
4.4. Findings for Serbia
The results of regression analysis for Serbia are presented in Table 6.
256 M. VUČKOVIĆ ET AL.
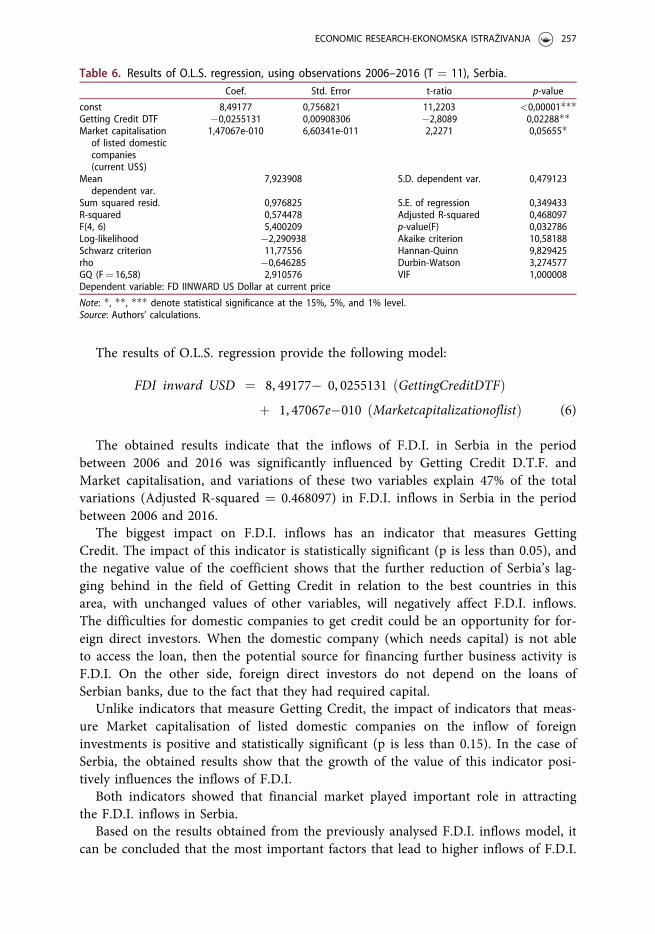
The results of O.L.S. regression provide the following model:
FDI inward USD ¼ 8, 49177� 0, 0255131 ðGettingCreditDTFÞþ 1, 47067e�010 ðMarketcapitalizationoflistÞ (6)
The obtained results indicate that the inflows of F.D.I. in Serbia in the periodbetween 2006 and 2016 was significantly influenced by Getting Credit D.T.F. andMarket capitalisation, and variations of these two variables explain 47% of the totalvariations (Adjusted R-squared ¼ 0.468097) in F.D.I. inflows in Serbia in the periodbetween 2006 and 2016.
The biggest impact on F.D.I. inflows has an indicator that measures GettingCredit. The impact of this indicator is statistically significant (p is less than 0.05), andthe negative value of the coefficient shows that the further reduction of Serbia’s lag-ging behind in the field of Getting Credit in relation to the best countries in thisarea, with unchanged values of other variables, will negatively affect F.D.I. inflows.The difficulties for domestic companies to get credit could be an opportunity for for-eign direct investors. When the domestic company (which needs capital) is not ableto access the loan, then the potential source for financing further business activity isF.D.I. On the other side, foreign direct investors do not depend on the loans ofSerbian banks, due to the fact that they had required capital.
Unlike indicators that measure Getting Credit, the impact of indicators that meas-ure Market capitalisation of listed domestic companies on the inflow of foreigninvestments is positive and statistically significant (p is less than 0.15). In the case ofSerbia, the obtained results show that the growth of the value of this indicator posi-tively influences the inflows of F.D.I.
Both indicators showed that financial market played important role in attractingthe F.D.I. inflows in Serbia.
Based on the results obtained from the previously analysed F.D.I. inflows model, itcan be concluded that the most important factors that lead to higher inflows of F.D.I.
Table 6. Results of O.L.S. regression, using observations 2006–2016 (T ¼ 11), Serbia.Coef. Std. Error t-ratio p-value
const 8,49177 0,756821 11,2203 <0,00001���Getting Credit DTF �0,0255131 0,00908306 �2,8089 0,02288��Market capitalisation
of listed domesticcompanies(current US$)
1,47067e-010 6,60341e-011 2,2271 0,05655�
Meandependent var.
7,923908 S.D. dependent var. 0,479123
Sum squared resid. 0,976825 S.E. of regression 0,349433R-squared 0,574478 Adjusted R-squared 0,468097F(4, 6) 5,400209 p-value(F) 0,032786Log-likelihood �2,290938 Akaike criterion 10,58188Schwarz criterion 11,77556 Hannan-Quinn 9,829425rho �0,646285 Durbin-Watson 3,274577GQ (F¼ 16,58) 2,910576 VIF 1,000008Dependent variable: FD IINWARD US Dollar at current price
Note: �, ��, ��� denote statistical significance at the 15%, 5%, and 1% level.Source: Authors’ calculations.
ECONOMIC RESEARCH-EKONOMSKA ISTRAŽIVANJA 257

in Serbia are the development of domestic enterprises, that is, Market capitalisationof listed domestic companies. On the other hand, strengthening the role of the bank-ing sector, measured through indicators Getting Credit can have a negative impact onthe F.D.I. approach in Serbia.
4.5. Findings for Slovenia
The results of regression analysis for Slovenia are presented in Table 7.The results of O.L.S. regression provides the following model:
FDI inward USD ¼ 748, 881� 70, 3162 ðStartingaBusinessDTFÞþ 43, 6858 ðTradingacrossBordersDTFÞþ 28, 2608 ðLabormarketefficiencyÞ (7)
The obtained results indicate that the inflows of F.D.I. in Slovenia in the periodbetween 2006 and 2016 was significantly influenced by the indicators that measureTrading across Borders, Labour market efficiency, and Starting a Business. Variationsof these three variables explain 47% of the total variations (Adjusted R-squared ¼0.470313) in the inflows of F.D.I. in Slovenia in the period between 2006 and 2016.
The greatest impact on F.D.I. inflows has an indicator that relates to Starting aBusiness and belongs to the Doing Business Indicator group, and thus, it is measuredby the D.T.F. method. The impact of this indicator is statistically significant (p is lessthan 0.05), and the negative value of the coefficient shows that further improvementof business environment (in starting a business) will not attract inflows of F.D.I.Slovenia had the biggest variation in the recent period and negative values of F.D.I.inflows in 2009 and 2013. The explanation could be that disinvestment will be greaterthan investment and that the capital of foreign companies will be repatriated.
Unlike the indicators that measure Starting a Business, the impact of indicatorsthat measure Trading across Borders D.T.F. and Labour market efficiency on theinflow of foreign investment is positive. Trading across borders has a statistical
Table 7. Results of O.L.S. regression, using observations 2006–2016 (T ¼ 11), SloveniaCoef. Std. Error t-ratio p-value
const 748,881 1494,92 0,5010 0,63177Starting a Business DTF �70,3162 25,8817 �2,7168 0,02990��Labour market efficiency 28,2608 13,7196 2,0599 0,07838�Trading across Borders DTF 43,6858 16,7030 2,6154 0,03464��Mean dependent var. 652,8278 S.D. dependent var. 633,5986Sum squared resid. 1488489 S.E. of regression 461,1305R-squared 0,629219 Adjusted R-squared 0,470313F(4, 6) 3,959691 p-value(F) 0,060899Log-likelihood �80,59290 Akaike criterion 169,1858Schwarz criterion 170,7774 Hannan-Quinn 168,1825rho �0,223074 Durbin-Watson 2,409259GQ (F¼ 16,58) 1,956475 VIF 1,000643Dependent variable: FD IINWARD US Dollar at current price
Note: �, ��, ��� denote statistical significance at the 15%, 5%, and 1% level.Source: Authors’ calculation.
258 M. VUČKOVIĆ ET AL.

significance (p is less than 0.05), and the obtained results show that the growth of thevalue of this indicator positively influences the F.D.I. inflows.
The situation is similar with the Labour market efficiency indicator (p is less than0.15), because the improvement in this area positively affects the F.D.I. inflows inSlovenia. The model predicts that further rank increasing of Labour market efficiencycould stimulate F.D.I. inflows. The explanation could come from the fact thatSlovenia is not attractive for foreign investors because of cheap labour, but because ofother motives, such as efficiency seeking. This relation is valid under the ‘ceteris pari-bus’ interpretation.
Based on the results obtained from the previously analysed F.D.I. inflows model, itcan be concluded that the increase in F.D.I. inflows in Slovenia will positively affectimprovements in the areas of Trading across Borders D.T.F. and Labour market effi-ciency, but further easing of conditions for Starting a Business can have negativeinfluence on the F.D.I. inflows due to the effect of excessive deregulation in this area.
5. Discussion
Empirical part compared five European emerging economies by F.D.I.s, institutionalreforms in transition period, competitiveness and E.D.B. Poland was an absoluteleader in attracting the F.D.I. and the largest amount was recorded in this country.Additionally, Poland was the best ranked country in the sample by competitiveness in2017 (rank 36 out of 138 countries). Slovenia had the best rank for E.D.B. in 2017(rank 17 out of 190 economies). Nevertheless, all countries were faced with numerousadministrative and bureaucratically problems that could be a limitation in attractingthe F.D.I. While the taxation regulation is the biggest problem in Poland, Serbia andSlovenia – Bulgari�as problem is the corruption and Romania struggled with the accessto finance. Quantitative analysis, based on O.L.S. regression, identified the most rele-vant business fields’ regulation that influenced the F.D.I. inflow.
This article provided qualitative comparison of the countries and presented theempirical models, based on statistical analysis. These models present the relationsbetween variables and predict the F.D.I. inflow with ‘ceteris paribus’ interpretationfor each country respectively.
Based on the results obtained from the previously analysed F.D.I. inflows model, itcan be concluded that the most important factors leading to a larger inflow of F.D.I.in Bulgaria are starting a business, H.I.C.P. – inflation rate and Labour market effi-ciency. Unlike these factors, factors like fertility rate can reduce F.D.I. inflowsin Bulgaria.
The most important factors that lead to higher F.D.I. inflows in Poland are thegoods market efficiency and getting electricity while factors such as enforcing con-tracts and paying taxes can reduce F.D.I. inflows in Poland.
According to the analysis the most important factors leading to larger inflows ofF.D.I. in Romania are dealing with construction permits, getting electricity andtechnological readiness, while factors such as unemployment by sex and age canreduce F.D.I. inflows in Romania.
ECONOMIC RESEARCH-EKONOMSKA ISTRAŽIVANJA 259

In Serbia the most important factors that lead to higher inflows of F.D.I. are thedevelopment of domestic enterprises, that is, market capitalisation of listed domesticcompanies. On the other hand, strengthening the role of the banking sector, meas-ured through indicators getting credit can have a negative impact on the F.D.I.approach in Serbia.
The increase in F.D.I. inflows in Slovenia will positively affect improvements inthe areas of trading across borders D.T.F. and Labour market efficiency, but furthereasing of conditions for starting a business can have negative influence on the F.D.I.inflows due to the effect of excessive deregulation in this area.
Results from our research are in line with some other research. Carlin and Seabright(2008, pp. 123–125) exposed that physical infrastructure, the legal system, the financialsystem, various aspects of micro and macroeconomic policies (for example, taxationand regulation), macroeconomic stability and social factors (such as the prevalence ofcrime and corruption) are the main key factors for attracting foreign investments. ForDesbordes (2007, p. 734) the quality of government in the country is particularlyimportant for attracting foreign investors. Also the prevalence of corruption (Egger &Winner, 2005, pp. 932–952), economic instability and high inflation rate can greatlyaffect the decisions of potential foreign investors (Alguacil et al., 2011, p. 494; Pruefer& Tondl, 2008, p. 19; Zvezdanovi�c, Ma�cek, & Ovin, 2014).
Furthermore, numerous authors have stressed that well-developed infrastructure isa crucial element for foreign investors and doing a business in host country (Wheeler& Mody, 1992, p. 71, Limao & Anthony, 2001, p. 470; Kalotay, 2008; Cuzovic et al.,2014, p. 18; Blyde & Molina, 2015, p. 329; Bitzenis & Zugic, 2016; Donaubauer et al.,2016, p. 240).
The companies lean toward host countries where the protection of labour rightsexists and where the labour rights are regarded (Busse et al., 2011, pp. 151–152).Lack of financial capital, inefficiency of banking system and non-developed financialmarket could be important barrier for attracting the F.D.I.s (Hermes & Lensink,2003, p. 158; Azman-Saini, Law, & Ahmad, 2010, p. 213).
Lower tax rates, introduced by government have significantly influence on F.D.I.s(Becker et al., 2012, pp. 1495–1511; Bellak & Leibrecht, 2009, pp. 2691–2703;Ghinamo et al., 2010, pp. 532–555).
6. Conclusion
This article researched the importance of business environment in attracting theF.D.I.s. According to identified research gap and elaborated problem statement, theresearch question of this article was focused on investigation of which factors of busi-ness regulation are the key determinants of F.D.I. inflows in C.E.E. countries. Theresearch was performed on the sample of five European emerging economies (Bulgaria,Poland, Romania, Serbia and Slovenia) in the period between 2006 and 2016.
The empirical results of the regression analysis for five European emerging econo-mies – countries evidence from the period from 2006 to 2016, indicate that theinflows of F.D.I. is influenced by a large number of different factors and that theimpact varies between the observed countries.
260 M. VUČKOVIĆ ET AL.
The survey showed that the factors of business regulation framework have a sig-nificant impact on F.D.I. inflows in all observed countries, but that this effect variesby both the type of factor and the intensity of impact. Considering all these elements,out of 10 factors that measure the E.D.B. in a country, a significant impact on F.D.I. inselected countries is related to six factors (Starting a Business, Trading across Borders,Getting Credit, Getting Electricity, Enforcing Contracts, Paying Taxes) and factors thatmeasure ‘Start a Business’ and ‘Getting Electricity’ have a higher statistical significancein two different countries (Slovenia and Bulgaria, or Poland and Romania).
In addition to the factors of business regulation framework, the results of regres-sion models show that other factors have an impact on F.D.I. inflows. Out of the fac-tors that have the role of control variables, a significant impact on F.D.I. inflows havefactors that measure: Labour market efficiency, Market capitalisation, Goods marketefficiency, Dealing with Construction Permits, Technological readiness, Unemploymentby sex and age, H.I.C.P. inflation rate Annual and Fertility rate total births, and theindicator which measures Labour market efficiency has a statistically significant impactin two countries, in Slovenia and Bulgaria.
The results of regression analysis identified statistically significant factors of busi-ness regulation that are related to F.D.I. inflows. Because of that we rejected the nullhypotheses and accepted alternatives – the F.D.I. inflows is related with regulatoryindicators measured by ‘Doing Business’, as well as regulatory and institution relatedvariables published in ‘Global Competitiveness Report’ report.
This research was performed on the small sample and it is relevant for selectedcountries in defined period. It was not possible to provide the common model for allcountries due to the big differences between economies: population, capacity of econ-omy, size and economic performance. This article did not identify the common busi-ness regulation factors for emerging economies, but highlighted a country’sspecificity. Different factors are identified for each economy. Another limitation wasa short period of observation; due to the availability of data (the indexes that wereused are available for recent 10 years). An additional argument is that the world eco-nomic crisis had a very strong effect on F.D.I. in 2008 and 2009. Due to that coun-tries needed a couple of years to recover.
Further research could be extended with more countries in the sample, as well asobserved real inflow of F.D.I., that increased the country�s productivity. Due to thefact that there is no unique approach for measuring business regulation, furtherresearches could be focused on developing a comprehensive approach to this topic.
Disclosure statement
No potential conflict of interest was reported by the authors.
References
Adekunle, A. O., Abdulahi, B. I., Gbadebo, A. O. & Fakunmoju, S. K. (2019). An empiricalanalysis of effects of foreign direct invesmtment, exchange rate, and energy infrastructureon domestic investment in Nigeria. Journal of Management, Economics and IndustrialOrganisation, 3(1), 1–17.
ECONOMIC RESEARCH-EKONOMSKA ISTRAŽIVANJA 261
Aijaz, H., Siddiqui, A., & Aumeboonsuke, V. (2014). Role of interest rate in attracting the FDI:study on ASEAN 5 economy. International Journal of Technical Research, 2(3), 59–70.
Alfaro, L. & Chen, M. (2010). Surviving the global financial crisis: Foreign direct investment andestablishment performance. Harvard Business School Working Paper 10–110. Retrieved fromhttps://hbswk.hbs.edu/item/surviving-the-global-financial-crisis-foreign-direct-investment-and-establishment-performance.
Alguacil, M., Cuadros, A., & Orts, V. (2011). Inward FDI and growth: The role of macroeco-nomic and institutional environment. Journal of Policy Modelling, 33(3), 481–496. doi:10.1016/j.jpolmod.2010.12.004
Ali, S. S. (2015). Corporate taxation and foreign direct investment in Nigeria. EuropeanJournal of Accounting, Auditing and Finance Research, 3(8), 17–24.
Ali, Y. S., Ibrahim, M. I., & Omar, Z. M. (2017). Impact of change in exchange rate on foreigndirect investment: Evidence from Somalia. Journal of Economics and SustainableDevelopment, 8(8), 25–37.
Anitha, R. (2012). Foreign direct investment and economic growth in India. IRJC InternationalJournal of Marketing, Financial Services & Management Research, 1(8), 108–125. doi:10.1504/AAJFA.2015.073487
A�sanin Gole, P., Ma�cek, A., & Vukasovi�c, T. (2016). Strate�sko komuniciranje in tr�zenje dr�zavekot lokacije za neposredne tuje investicije. Retrieved from https://www.researchgate.net/pub-lication/299336797_Stratesko_komuniciranje_in_trzenje_drzave_kot_lokacije_za_neposredne_tuje_investicije_Strategic_Communication_and_Marketing_of_the_Country_as_a_Location_for_Foreign_Direct_Investment.
Asiedu, E. (2006). Foreign direct investment in Africa: The role of government policy, institu-tions and political instability. World Economy, 29(1), 63–77. 2006.00758.x. doi:10.1111/j.1467-9701
Azman-Saini, W. N. W., Law, S. H., & Ahmad, A. H. (2010). FDI and economic growth: Newevidence on the role of financial markets. Economics Letters, 107(2), 211–213. doi:10.1016/j.econlet.2010.01.027
Bandelj, N. (2002). Embedded economies: Social relations as determinants of foreign directinvestment in Central and Eastern Europe. Social Forces, 81(2), 411–444. doi:10.1353/sof.2003.0001
Batini N. & Laxton, D. (2006). Under what conditions can inflation targeting be adopted? Theexperience of emerging markets. Central banking, analysis, and economic policies book ser-ies. In F. S. Miskin, K. Schmidt-Hebbel, N. Loayza, & K. Schmidt-Hebbel (Eds.), Monetarypolicy under inflation targeting (1st ed., vol. 11, chapter 12, pp. 467–506). Santiago: CentralBank of Chile. Retrieved from http://si2.bcentral.cl/public/pdf/banca-central/pdf/v11/467-506.pdf.
Bayraktar, N. (2015). Importance of investment climates for inflows of foreign direct invest-ment in developing countries. Business and Economic Research, 5(1), 24–50. doi:10.5296/ber.v5i1.6762
Becker, J., Fuest, C., & Riedel, N. (2012). Corporate tax effects on the quality and quantity ofFDI. European Economic Review, 56(8), 1495–1511. doi:10.1016/j.2012.07.001
Bellak, C., & Leibrecht, M. (2009). Do low corporate income tax rates attract FDI?: Evidencefrom Central- and East European countries. Applied Economics, 41(21), 2691–2703. doi:10.1080/00036840701320217
Berg, J., & Cazes, S. (2007). The Doing Business indicators: measurement issues and politicalimplications. Working paper. Retrieved from http://www.ilo.org/empelm/pubs/WCMS_113905/lang–en/index.htm.
Bitzenis, A. P. and V. P. Zugic. (2016). Barriers for FDI in Serbia: Evidence from the manufac-turing sector. Global Business and Economic Review, 18(2):227. doi:10.1504/GBER.2016.075526
Blyde, J., & Molina, D. (2015). Logistic infrastructure and the international location of frag-mented production. Journal of International Economics, 95(2), 319–332. doi:10.1016/j.jinteco.2014.11.010
262 M. VUČKOVIĆ ET AL.
Bohle, D., & Greskovits, B. (2006). Capitalism without compromise: Strong business and weakLabour in Eastern Europe’s new transnational industries. Studies in ComparativeInternational Development, 41(1), 3–25. doi:10.1007/BF02686305
Busse, M., Nunnenkamp, P., & Spatareanu, M. (2011). Foreign direct investment and labourrights: A panel analysis of bilateral FDI flows. Applied Economics Letters, 18(2), 149–152.doi:10.1080/13504850903559500
Carlin, W., & Seabright, P. (2008). Bring me sunshine: Which parts of the business climateshould public policy try to fix? In Annual World Bank Conference on DevelopmentEconomics: Global 2008: Private Sector and Development. Washington DC: The World Bank.Retrieved from https://pdfs.semanticscholar.org/0df8/8c1311da1ad333828b9ca055e2eaa-ca5503f.pdf?_ga=2.131217096.613162584.1572796423-837563246.1572384150.
Carril-Caccia, F. & Pavlova, E. (2018). Foreign direct investment and its drivers: a global andEU perspective. ECB Economic Bulletin, 4. Retrieved from https://www.ecb.europa.eu/pub/economic-bulletin/articles/2018/html/ecb.ebart201804_01.en.html.
Carstensen, K., & Toubal, F. (2004). Foreign direct investment in Central and EasternEuropean countries: a dynamic panel analysis. Journal of Comparative Economics, 32(1),3–22. doi:10.1016/j.jce.2003.11.001
Corcoran, A., & Gillanders, R. (2015). Foreign direct investment and the ease of doing busi-ness. Review of World Economics, 151(1), 103–126. doi:10.1007/s10290-014-0194-5
Cuzovic, S., Sokolov Mladenovic, S., & Cuzovic, D. (2014). E-commerce as the leader of inter-national business. Journal of Economic and Business Sciences, 1(2), 18–29. Retrieved fromhttp://www.dlib.si/?URN=URN:NBN:SI:DOC-Q5ZRIL3N.
Dellis, K., Sondermann, D., & Vansteenkiste, I. (2017). Determinants of FDI inflows inadvanced economies: does the quality of economic structures matter? European CentralBank working paper series, 2066. Retrieved from https://www.ecb.europa.eu/pub/pdf/scpwps/ecb.wp2066.en.pdf.
Desbordes, R. (2007). The sensitivity of U.S. multinational enterprises to political and macro-economic uncertainty: A sectoral analysis. International Business Review, 16(6), 732–750.doi:10.1016/j.ibusrev.2007.08.006
Djankov, S., Porta, R. L., Lopez de Silanes, F., & Shleifer, A. (2002). The regulation of entry.Quarterly Journal of Economics, 117(1), 1–37. doi:10.1162/003355302753399436
Donaubauer, J., Meyer, B., & Nunnenkamp, P. (2016). Aid, Infrastructure, and FDI: Assessingthe transmission channel with a new index of infrastructure. World Development, 78,230–245. doi:10.1016/j.worlddev.2015.10.015
Dornean, A., Isan, V. & Oanea D. C. (2012). The impact of the recent global crisis on foreigndirect investment. Evidence from Central and Eastern European Countries. ProcediaEconomics and Finance, 3(3), 1012–1017. doi:10.1016/S2212-5671(12)00266-3
Dunning, J. H. (1980). Towards an eclectic theory of international production: Some empiricaltests. Journal of International Business Studies, 11(1), 9–31. doi:10.1057/palgrave.jibs.8490593
Dunning, J. H., & Lundan, S. M. (2008a). Multinational Enterprises and the Global Economy(2nd ed.). Cheltenham, UK: Edward Elgar. Retrieved from https://www.google.com/url?sa=t&rct=j&q=&esrc=s&source=web&cd=1&ved=2ahUKEwiw5dLc087lAhWstYsKHZEwCsUQFjAAegQIARAC&url=https%3A%2F%2Fdipiufabc.files.wordpress.com%2F2015%2F06%2Fdunning_multinational-enterprises-and-global-economy.pdf&usg=AOvVaw0u7ldyFZJHNzL3vNtzTiWv.
Dunning, J. H., & Lundan, S. M. (2008b). Institutions and the OLI paradigm of the multi-national enterprise. Asia Pacific Journal of Management, 25(4), 573–593. doi:10.1007/s10490-007-9074-z
Egger, P., & Winner, H. (2005). Evidence on corruption as an incentive for foreign directinvestment. European Journal of Political Economy, 21(4), 932–952. doi:10.1016/j.ejpoleco.2005.01.002
Ellahi, N. (2011). Exchange rate volatility and foreign direct investment (FDI) behaviour inPakistan: A time series analysis with auto regressive distributed lag (ARDL) application.African Journal of Business Management, 11, 656–661. doi:10.5897/AJBM11.1676
ECONOMIC RESEARCH-EKONOMSKA ISTRAŽIVANJA 263
Eurostat. (2017). Eurostat - Your key to European statistics. Brussels: Eurostat. Retrieved fromhttp://ec.europa.eu/eurostat/data/database.
Ghinamo, M., Panteghini, P. M., & Revelli, F. (2010). FDI determination and corporate taxcompetition in a volatile world. International Tax and Public Finance, 17(5), 532–555. doi:10.1007/s10797-009-9127-y
Godinez, J. R., & Liu, L. (2015). Corruption distance and FDI flows into Latin America.International Business Review, 24(1), 33–42. doi:10.1016/j.ibusrev.2014.05.006
Hansmann, H., & Kraakman, R. (2000). The end of history for corporate law (SSRN ScholarlyPaper No. ID 204528). Rochester, NY: Social Science Research Network. Retrieved fromhttps://papers.ssrn.com/abstract=204528.
Hermes, N., & Lensink, R. (2003). Foreign direct investment, financial development and eco-nomic growth. The Journal of Development Studies, 40(1), 142–163. doi:10.1080/00220380412331293707
Herrera-Echeverri, H., Haar, J., & Est�evez-Bret�on, J. B. (2014). Foreign direct investment, insti-tutional quality, economic freedom and entrepreneurship in emerging markets. Journal ofBusiness Research 67(9), 1921–1932. doi:10.1016/j.jbusres.2013.11.020
IMF. (1993). Balance of payments manual 5th edition. Washington DC: Author, p. 191.Retrieved from https://www.imf.org/external/pubs/ft/bopman/bopman.pdf.
Jayasuriya, D. (2011). Improvements in the World Bank’s ease of doing business rankings: Dothey translate into greater foreign direct investment inflows? The World Bank. Retrievedfrom 10.1596/1813-9450-5787.
Jeong, H.-G. (2014). The determinants of foreign direct investment in the business servicesindustry. International Economic Journal, 28(3), 475–495. doi:10.1080/10168737.2014.913651
Jia, N., Han, Y., Peng, K., & Lei, H. (2019). FDI and labour share of home-country: Empiricalevidence from micro data of Chinese enterprises. Economic Research-EkonomskaIstra�zivanja, 32(1), 1320–1335. doi:10.1080/1331677X.2019.1628652
Kalotay, K. (2008). FDI in Bulgaria and Romania in the wake of EU accession. Journal of East-West Business, 14(1),5–40. doi:10.1300/J097v14n01_02
Kamal, M. A., Ullah, A., Zheng, J., Zheng, B., & Xia, H. (2019). Natural resource or marketseeking motive of China’s FDI in Asia. New evidence at income and subregional level.Economic research-Ekonomska istra�zivanja, 32(1), 3869–3894. doi:10.1080/1331677X.2019.1674679
Krugman, P. R., & Obstfeld, M. (2009). International economics: theory & policy (8th ed.).Boston, Mass: Pearson, Addison-Wesley. Retrieved from http://media.obvsg.at/p-AC06672064-1001.
Lane, D. (2007). Post-state socialism: A diversity of capitalisms? In D. Lane & M. Myant(Eds.), Varieties of Capitalism in Post-Communist Countries (p. 13–39). London: PalgraveMacmillan. Retrieved from 10.1057/9780230627574_2.
Li, Z. Huan Z. & Dong, H. (2019). The influential factors on outward foreign direct invest-ments. Evidence from the “Belt and Road”. Emerging Markets Finance and Trade, 55(14),3211–3226. doi:10.1080/1540496X.2019.1569512
Limao, N. V., & Anthony, J. (2001). Infrastructure, geographical disadvantage, transport costs,and trade. World Bank Economic Review, 15(3), 451–479. doi:10.1093/wber/15.3.451
Mackton, W. S., A. Odondo & D. Nyongesa. (2018). Real effective exchange rate volatility andits impact on foreign direct investment in Kenya. Asian Journal of Economics, Business andAccounting, 6(4), 29–67. DOI: 0.9734/AJEBA/2018/38008. doi:10.9734/AJEBA/2018/38008
Mahbuba, T., Jongwanich, J. (2019). Determinants of foreign direct investment (FDI) in thepower sector: A case study of Bangladesh. Energy Strategy Reviews, 24(1), 178–192. doi:10.1016/j.esr.2019.03.001
Makuyana, G. & Odhiambo, N. M. (2018). Public and private investment and economicgrowth in Malawi: an ARDL-bounds testing approach. Economic Research-Ekonomska istra-�zivanja 32, (1),673–689. doi:10.1080/1331677X.2019.1578677
Mishkin, F. S. (2007). Inflation dynamics. International Finance, 10(3), 317–334.
264 M. VUČKOVIĆ ET AL.
Morris, R. & Aziz, A. (2011). Ease of doing business and FDI inflows to Sub-Saharan Africaand Asian countries. Cross Cultural Management: An International Journal, 18(4), 400–411.doi:10.1108/13527601111179483
National Institute of Statistics – Romania. (2019). Tempo online – Statistical data. Retrievedfrom http://statistici.insse.ro:8077/tempo-online/#/pages/tables/insse-table.
N€olke, A., & Vliegenthart, A. (2009). Enlarging the varieties of capitalism: The emergence ofdependent market economies in East Central Europe. World Politics, 61(4), 670–702. doi:10.1017/S0043887109990098
North, D. C. (1994). Economic performance through time. The American Economic Review,84(3), 359–368.
Nyarko, P. A., Nketiah-Amponsah, E. & Barnor, C. (2011). Effects of exchange rate regimes onFDI inflows in Ghana. International Journal of Economics and Finance, 3(3), 277–286. doi:10.5539/ijef.v3n3p277
OECD. (1996). OECD Benchmark Definition of Foreign Direct Investment - Thrid Edition.Paris: Author. Retrieved from https://archive.org/details/bub_gb_brjncJGuEyAC.
Omorokunwa O. G. & Ikponmwosa, N. (2014). Exchange rate volatility and foreign privateinvestment in Nigeria. Asian Journal of Business Management 6(4), 146–154. doi:10.19026/ajbm.6.5157
Peng, M. W., Wang, D. Y. L., & Jiang, Y. (2008). an institution-based view of internationalbusiness strategy: A focus on emerging economies. Journal of International Business Studies,39(5), 920–936. doi:10.1057/palgrave.jibs.8400377
Peres, M., Ameer, W. & Xu, H. (2018). The impact of institutional quality on foreign directinvestment inflows: evidence for developed and developing countries. Economic research -Ekonomska istra�zivanja, 31(1), 626–644. doi:10.1080/1331677X.2018.1438906
Phillips, S., & Ahmadi-Esfahani, F. Z. (2008). Exchange rates and foreign direct investment:Theoretical models and empirical evidence. Australian Journal of Agricultural and ResourceEconomics, 52(4), 505–525. doi:10.1111/j.1467-8489.2008.00431.x
Pietrucha, J. & �Zelazny, R. (2019). TFP spill-over effects via trade and FDI channels. Economicresearch-Ekonomska istra�zivanja. doi:10.1080/1331677X.2019.1629327
Popescua, R. G. (2013). The regional location decision of foreign direct investments inRomania. Economic Research – Ekonomska Istra�zivanja, 26(1),33–48.
Poulsen, L.& Hufbauer, G. (2011). Foreign direct investment in times of crisis. PetersonInstitute of International Economics. Retrieved from http://www.aessweb.com/journals/5002/December2014.
Pruefer, P., & Tondl, G. (2008). The FDI-growth nexus in Latin America: The role of sourcecountries and local conditions (SSRN Scholarly Paper No. ID 1154914). Rochester, NY:Social Science Research Network. Retrieved from https://papers.ssrn.com/abstract=1154914.
Republic of Bulgaria, National Statistical Institute. (2019). Macroeconomic statistics. Retrievedfrom https://www.nsi.bg/en/content/11236/macroeconomic-statistics.
Republic of Slovenia Statistical Office. (2019). Data. Retrieved from https://www.stat.si/StatWeb/en.
S�anchez-Mart�ın, M. E., de Arce, R., & Escribano, G. (2014). Do changes in the rules of thegame affect FDI flows in Latin America? A look at the macroeconomic, institutional andregional integration determinants of FDI. European Journal of Political Economy, 34(1),279–299. doi:10.1016/j.ejpoleco.2014.02.001
Sayek. S. (2009). Foreign direct investment and inflation. Southern Economic Journal, 76(2),419–443. doi:10.4284/sej.2009.76.2.419
Sondermann, D. & Vansteenkiste, I. (2019). Did the Euro change the nature of FDI flowsamong member states? European Central Bank Working Paper Series, 2275. Retrieved fromhttps://www.ecb.europa.eu/pub/pdf/scpwps/ecb.wp2275�ece268a0e3.en.pdf.
Statistical Office of the Republic of Serbia. (2019). Statistics by theme. Retrieved from: https://www.stat.gov.rs/en-us/#.
Statistics Poland. (2019). Basic data. Retrieved from https://stat.gov.pl/en/basic-data/.
ECONOMIC RESEARCH-EKONOMSKA ISTRAŽIVANJA 265

Stoddard, O. & Noy, I. (2015). Fire-sale FDI? The impact of financial crises on foreign directinvestment. Review of Development Economics, 19(2), 387–399. doi:10.1111/rode.12149
The World Bank. (2017a). Doing business – Measuring business regulations. Washington.Retrieved from http://www.doingbusiness.org/.
The World Bank. (2017b). World development indicators. Washington. Retrieved from http://databank.worldbank.org/data/.
Todaro, M. P., & Smith, S. C. (2015). Economic Development-12th Edition. Harlow: Pearson.Retrieved from https://www.google.com/url?sa=t&rct=j&q=&esrc=s&source=web&cd=9&ved=2ahUKEwjD1fXI3NjlAhVvoYsKHQ8AAfAQFjAIegQIAxAC&url=https%3A%2F%2Fmediasrv.aua.gr%2Feclass%2Fmodules%2Fdocument%2Ffile.php%2FAOA215%2FEconomic%2520Development%2520-%2520Todaro%2520and%2520Smith.pdf&usg=AOvVaw3dFqAP8xYDTorK1SBNVfDi.
Twimukye, E. (2006). An econometric analysis of determinants of foreign direct investment: Apanel data study for Africa. Retrieved from https://tigerprints.clemson.edu/all_dissertations/20.
UNCTAD. (2017). FDI statistics. Geneva, Switzerland. Retrieved from http://unctad.org/en/Pages/DIAE/FDI%20Statistics/FDI-Statistics.aspx.
Vaughan-Whitehead, D. (2003). EU enlargement versus social Europe? The uncertain future ofthe european social model. Cheltenham: Edward Elgar.
Veingerl �Ci�c, �Z., Mulej, M., & �Sarotar �Zi�zek, S. (2016). Requisitely holistic development methodsfor improving human resource performance. Teorija in praksa: revija za dru�zbena vpra�sanja53(4), 1000–1017. Retrieved from dk.fdv.uni-lj.si/db/pdfs/TiP2016_4_Veingerl-CicMulejSarotar-Zizek.pdf.
Wheeler, D., & Mody, A. (1992). International investment location decisions. Journal ofInternational Economics, 33(1), 57–76. doi:10.1016/0022-1996(92)90050-T
Wooldridge, J. (2013). Introductory econometrics: A modern approach, Fifth Edition. Mason:South-Western. Retrieved from https://www.google.com/url?sa=t&rct=j&q=&esrc=s&source=web&cd=2&ved=2ahUKEwiOi5uNy87lAhXS0qYKHSR0ChQQFjABegQIAxAC&url=https%3A%2F%2Feconomics.ut.ac.ir%2Fdocuments%2F3030266%2F14100645%2FJeffrey_M._Wooldridge_Introductory_Econometrics_A_Modern_Approach__2012.pdf&usg=AOvVaw0bvJ2TEgFjB3w-KX05Or1s.
World Economic Forum. (2018). Annual Report 2017-2018. Geneva: World Economic Forum.Retrieved from www.weforum.org.
Zhang, J. (2014). Foreign direct investment, governance, and the environment in China.London: Palgrave Macmillan. 10.1057/9781137318657_6.
Zvezdanovi�c, J., Ma�cek, A., Ovin, R. (2014). Institutional setting as a determinant of FDIattraction: Example of Serbia. V: PETROVI�C, Pero (ur.). In International ThematicProceedings Possibilities and Perspectives for Foreign Direct Investments in the Republic ofSerbia, November 13–14, 2013, pp. 17–41. Belgrade: Institute of International Politics andEconomics. doi:10.5772/60978
266 M. VUČKOVIĆ ET AL.