Business Cycles, Patterns and Trends Version 6 PDF
473
Abiliti: Future Systems
-
Upload
nigel-tebbutt- -
Category
Documents
-
view
37 -
download
1
Transcript of Business Cycles, Patterns and Trends Version 6 PDF

Abiliti: Future Systems

Business Cycles, Patterns and Trends
Throughout eternity, all that is of like form comes around again –
everything that is the same must return in its own everlasting cycle.....
• Marcus Aurelius – Emperor of Rome •
Many Economists and Economic Planners have arrived at the same
conclusion – that most organizations have not yet widely developed, nor
adapted, sophisticated Economic Modelling and Forecasting systems – let
alone integrated their model outputs into core Strategic Planning and
Financial Management process.....


Stoicism – a branch of Philosophy
“All human actions share one or more of these causes: -
chance, reason, nature, habit, delusion, desire, passion and obsession.....”
• Marcus Aurelius – Emperor of Rome •

Stoicism – Motivation for Human Actions
Reason – logic
Human Actions
chance
reason
obsession
passion
habit
nature
delusion
desire
Human Nature – (good and evil)
altruism, heroism
curiosity, inquiry,
ignorance, malice
Desire – need, want
Passion – love, fixation
Obsession – compulsion Serendipity – randomness, chaos
Ritual, ceremony, repetition Primal Instinct–
anxiety, fear, anger, hate
Stochastic
Emotional Deterministic
Reactionary

• Marcus Aurelius • Emperor of Rome
• “Throughout eternity, all
that is of like form will
come around again –
everything that is the same
must always return in its
own everlasting cycle.....”
• “Look back over time, with
past empires that in their
turn rise and fall – through
changing history you may
also see the future.....”
• Marcus Aurelius followed
• Stoic Philosophy •

Business Cycles, Patterns and
Trends • This Slide Pack forms part of a Futures Study Training Module - the purpose of which
is to provide cross-functional support to those client stakeholders who are charged by their
organisations with thinking about the future – research, analysis, planning and strategy: -
– Finance, Corporate Planners and Strategists – authorise and direct the Futures Study.
– Product Innovation, Research & Development – plan and lead the Futures Study.
– Marketing and Product Engineering – review and mentor the Futures Research Study.
– Economists, Data Scientists and Researchers – undertakes the detailed Research Tasks.
– Research Aggregator – examines hundreds of related Academic Papers, “Big Data” & other
relevant global internet content - looking for hidden or missed findings and extrapolations.
– Author – compiles, documents, edits and publishes the Futures Study Research Findings.
– Business Analysts / Enterprise Architects – provide the link into Business Transformation.
– Technical Designers / Solution Architects – provide the link into Technology Refreshment.

Business Cycles, Patterns and
Trends • The purpose of a Futures Study Training Module is based on the need to enable clients
to anticipate, prepare for and manage the future - by guiding them towards understanding
of how the future might unfold. This involves planning, organising and running Futures
Studies and presenting the results via Workshops, Seminars and CxO Forums – working
with key client executives responsible for Stakeholder Relationships, Communications and
Benefits Realisation Strategies by helping to influence and shape organisational change
and driving technology innovation to enable rapid business transformation, ultimately to
facilitate the achievement of stakeholder’s desired Business Outcomes – and scoping,
envisioning and designing the Future Systems required to support client objectives -
integrating BI / Analytics and “Big Data” Futures Study and Strategy Analysis outputs
into their core Corporate Planning and Financial Management processes.....
– CxO Forums – executive briefings on new and emerging technologies & trends
– Workshops – discovery workshops to explore future SWAT and PEST matrices
– Seminars – presents the detailed Futures Study findings and extrapolations.
– Special Interest Groups (SIGs) – for stakeholder Subject Matter Experts (SMEs)

Abiliti: Future Systems
• Abiliti: Origin Automation is part of a global consortium of Digital Technologies Service Providers and Future Management Strategy Consulting firms for Digital Marketing and Multi-channel Retail / Cloud Services / Mobile Devices / Big Data / Social Media
• Graham Harris Founder and MD @ Abiliti: Future Systems
– Email: (Office) – Telephone: (Mobile)
• Nigel Tebbutt 奈杰尔 泰巴德
– Future Business Models & Emerging Technologies @ Abiliti: Future Systems – Telephone: +44 (0) 7832 182595 (Mobile) – +44 (0) 121 445 5689 (Office) – Email: [email protected] (Private)
• Ifor Ffowcs-Williams CEO, Cluster Navigators Ltd & Author, “Cluster Development” – Address : Nelson 7010, New Zealand (Office)
– Email : [email protected]
Abiliti: Origin Automation Strategic Enterprise Management (SEM) Framework ©
Cluster Theory - Expert Commentary: -


Creative Destruction – drives Disruptive Change
Disruptive Futurism as the "gales of creative destruction" forecast by Austrian economist Joseph Schumpeter in the 1940s - are blowing just
as hard today as they ever were.....
The twin disruptive forces of a severe economic environment and technology-driven innovation are giving birth to novel products and
services, new markets and new opportunities.
• Joseph Schumpeter – Economist •

Joseph Schumpeter
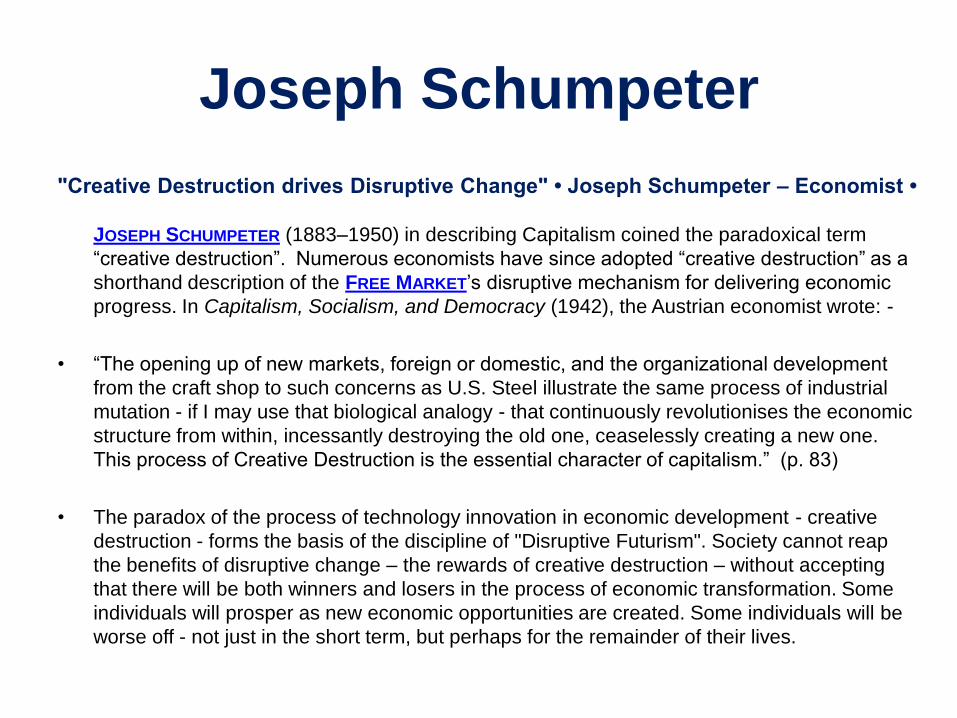
"Creative Destruction drives Disruptive Change" • Joseph Schumpeter – Economist •
JOSEPH SCHUMPETER (1883–1950) in describing Capitalism coined the paradoxical term
“creative destruction”. Numerous economists have since adopted “creative destruction” as a
shorthand description of the FREE MARKET’s disruptive mechanism for delivering economic
progress. In Capitalism, Socialism, and Democracy (1942), the Austrian economist wrote: -
• “The opening up of new markets, foreign or domestic, and the organizational development
from the craft shop to such concerns as U.S. Steel illustrate the same process of industrial
mutation - if I may use that biological analogy - that continuously revolutionises the economic
structure from within, incessantly destroying the old one, ceaselessly creating a new one.
This process of Creative Destruction is the essential character of capitalism.” (p. 83)
• The paradox of the process of technology innovation in economic development - creative
destruction - forms the basis of the discipline of "Disruptive Futurism". Society cannot reap
the benefits of disruptive change – the rewards of creative destruction – without accepting
that there will be both winners and losers in the process of economic transformation. Some
individuals will prosper as new economic opportunities are created. Some individuals will be
worse off - not just in the short term, but perhaps for the remainder of their lives.

Joseph Schumpeter
"Creative Destruction drives Disruptive Change" • Joseph Schumpeter – Economist •
• Joseph Alois Schumpeter was an Austria-American economist and political scientist, and a
member of the Austrian (Real) School of Economics. He briefly served as Finance Minister of
Austria in 1919. In 1932 he became a professor at Harvard University where he remained
until the end of his career. Schumpeter said that "the process of creative destruction is the
essence of capitalism.”
• 'Creative Destruction' is a term that was coined by Joseph Schumpeter in his work entitled
"Capitalism, Socialism and Democracy" (1942) to denote a "process of industrial mutation
constantly changing the economic structure from within, incessantly destroying the old
economy, incessantly creating a new economy.“
• Disruptive Futurists discover, analyse and interpret the "gales of creative destruction" which
were forecast by Austrian economist Joseph Schumpeter in the 1940s – and are blowing
harder today than ever before. The twin disruptive forces of the globalisation of a dynamic
and chaotic economy coupled with technology-driven innovation are giving birth to emerging
digital markets which generate new business models and revenue streams, novel products
and services – accompanied by clear and present dangers - as well as hidden threats.

Joseph Schumpeter
"Creative Destruction drives Disruptive Change" • Joseph Schumpeter – Economist •
• Although Schumpeter devoted only a six-page chapter to “The Process of Creative
Destruction,” in which he described CAPITALISM as “the perennial gale of creative destruction,”
it has become the centrepiece of economic thinking on how modern economies evolve.
Schumpeter and the other Austrian School economists who adopt his succinct theory of the
free market’s ceaseless churning - echo capitalism’s critics, such as Karl Marx, in recognising
that lost jobs, ruined companies, and vanishing industries are the result of the inherent
consequences of the disruptive mechanism of economic growth.
• The corollary is that wealth springs eternal from the turmoil and chaos. Those societies that
allow creative destruction to operate in a free market economy with less state intervention –
tend, over time, to be more productive, grow faster and acquire more wealth. In those
societies where increased wealth is retained by Entrepreneurs – such as in the UK and USA
– there has been no real increase in the standard of living of the workforce for nearly sixty
years (forty years in the UK) – as measured by the number of Mars chocolate bars which may
be purchased on the average wage. In those societies where wealth is shared more equally
– such as in Northern Europe – their citizens work in new industries, have access to novel
and innovative products and services, and reap the benefits of shorter working hours, better
health, wealth, education and jobs, along with increased wages and higher living standards.
Joseph Schumpeter
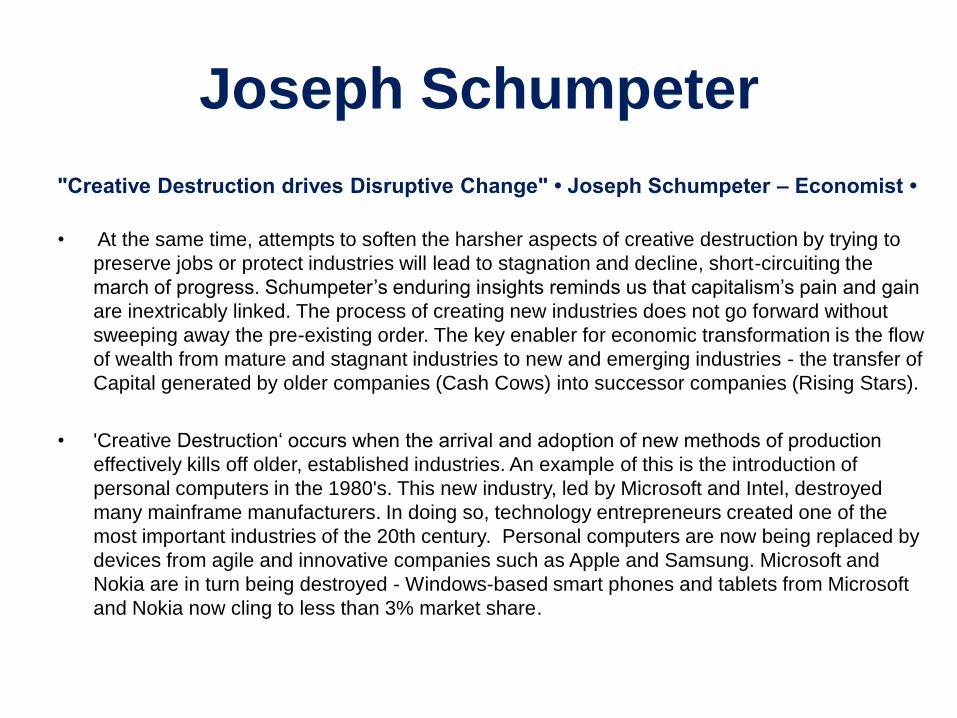
"Creative Destruction drives Disruptive Change" • Joseph Schumpeter – Economist •
• At the same time, attempts to soften the harsher aspects of creative destruction by trying to
preserve jobs or protect industries will lead to stagnation and decline, short-circuiting the
march of progress. Schumpeter’s enduring insights reminds us that capitalism’s pain and gain
are inextricably linked. The process of creating new industries does not go forward without
sweeping away the pre-existing order. The key enabler for economic transformation is the flow
of wealth from mature and stagnant industries to new and emerging industries - the transfer of
Capital generated by older companies (Cash Cows) into successor companies (Rising Stars).
• 'Creative Destruction‘ occurs when the arrival and adoption of new methods of production
effectively kills off older, established industries. An example of this is the introduction of
personal computers in the 1980's. This new industry, led by Microsoft and Intel, destroyed
many mainframe manufacturers. In doing so, technology entrepreneurs created one of the
most important industries of the 20th century. Personal computers are now being replaced by
devices from agile and innovative companies such as Apple and Samsung. Microsoft and
Nokia are in turn being destroyed - Windows-based smart phones and tablets from Microsoft
and Nokia now cling to less than 3% market share.

Joseph Schumpeter
"Creative Destruction drives Disruptive Change" • Joseph Schumpeter – Economist •
• Companies show the same pattern of destruction and rebirth over many industrial cycles. Only
five of today’s hundred largest public companies were among the top hundred in 1917. Half of
the top hundred of 1970 had been replaced in the rankings by 2000. The Power of Technology
Innovation – driven by ENTREPRENEURSHIP and competition – drives the process of creative
destruction through the flow of capital from older, stagnant industries to new and emerging
industries. Schumpeter summed up the process of economic transformation as follows: -
• “The fundamental spark that sets up and keeps the economic engine in motion comes from
innovation – arranging existing resources in new and different ways to create novel and
innovative products and services. Entrepreneurial endeavour creates the new consumer
products and services, new markets, innovative methods of production, distribution or transport,
and new forms of industrial organization which drives economic growth.“ (p. 83)
• Entrepreneurs introduce new products and technologies with an eye toward making themselves
better off—the profit motive. New goods and services, new firms, and new industries compete
with existing ones in the marketplace, taking customers by offering lower prices, better
performance, new features, catchier styling, faster service, more convenient locations, higher
status, more aggressive marketing, or more attractive packaging. In another seemingly
contradictory aspect of creative destruction, the pursuit of self-interest ignites the progress that
makes others better off.

Joseph Schumpeter
"Creative Destruction drives Disruptive Change" • Joseph Schumpeter – Economist •
• Producers survive by streamlining production with newer and better tools that make workers
more productive. Companies that no longer deliver what consumers want at competitive prices
lose customers, and eventually wither and die. The market’s “invisible hand” - a phrase owing
not to Schumpeter but to ADAM SMITH - shifts resources from declining sectors to more valuable
uses as workers, inputs, and financial capital seek their highest returns.
• The source of Joseph Schumpeter's dynamic, change-oriented, and innovation-based
economics was the Historical School of economics. Although Schumpeter’s writings could be
critical of the School, Schumpeter's work on the role of innovation and entrepreneurship can be
seen as a continuation of ideas originated by the Historical School – especially from the work of
Gustav von Schmoller and Werner Sombart. Schumpeter's scholarly learning is readily apparent
in his posthumous publication of the History of Economic Analysis – but many of his views
now appear to be somewhat idiosyncratic – and some even seem to be downright cavalier......
• Schumpeter criticized John Maynard Keynes and David Ricardo for the "Ricardian vice." Ricardo
and Keynes often reasoned in terms of abstract economic models, where they could isolate,
freeze or ignore all but a few major variables. According to Schumpeter, they were then free to
argue that one factor impacted on another in a simple monotonic cause-and-effect fashion. This
has led to the mistaken belief that one could easily deduce effective real-world economic policy
conclusions directly from a highly abstract and simplistic theoretical economic model.

Joseph Schumpeter
• Schumpeter thought that the greatest 18th century economist was Turgot, not Adam Smith, as
many economists believe today, and he considered Léon Walras to be the "greatest of all
economists", beside whom other economists' theories were just "like inadequate attempts to
capture some particular aspects of the Walrasian truth".
• Schumpeter's relationships with the ideas of other economists were quite complex - following
the views of neither Walras nor Keynes. There was actually some considerable professional
rivalry between Schumpeter and his peers. Schumpeter starts his most important contribution
to economic analysis The Theory of Economic Development – which describes business
cycles and economic development – with a treatise on circular flow in which he postulates that
slow or stationary economic growth occurs whenever innovation wave input from technology
research and development activities is reduced - or simply ceases. This form of stagnation in
economic development is, according to Schumpeter, described by Walrasian equilibrium.
• In developing the Economic Wave theory, Schumpeter postulated the idea that the
entrepreneur is the primary catalyst of industrial activity which develops in a cyclic fashion
along several discrete and interacting timelines – connecting generation waves with
entrepreneurship and capital funding, technology innovation with manufacturing process
improvements, and industrial investment cycles with economic growth These cycles acts to
stimulate the status-quo in an otherwise stagnant economic equilibrium or stationary economic
growth into a circular flow Thus the true hero of his story is the entrepreneur..
Joseph Schumpeter
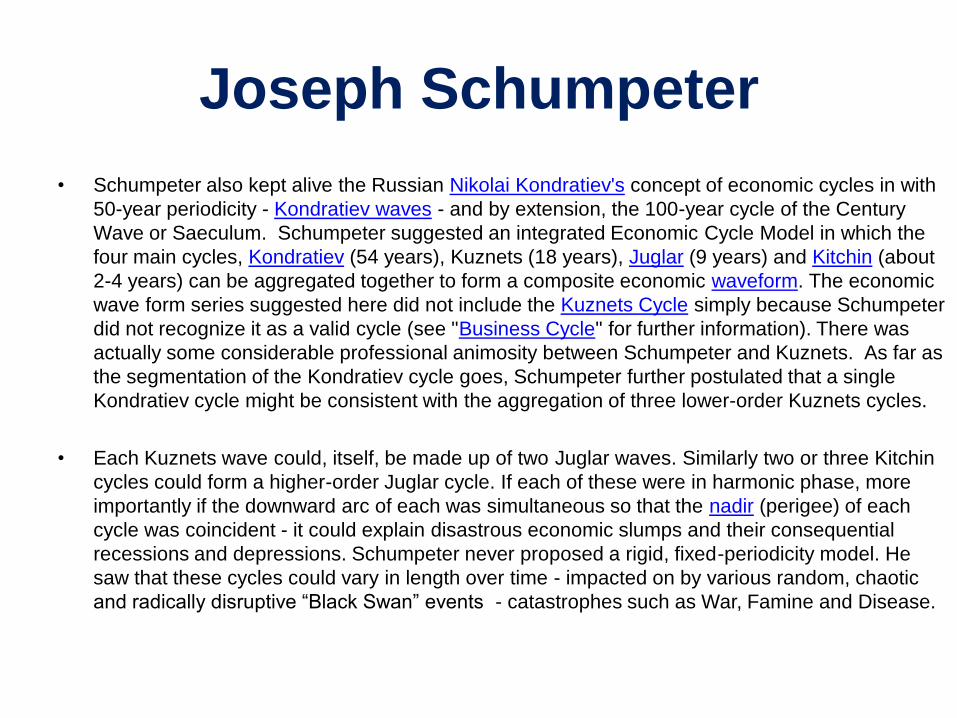
• Schumpeter also kept alive the Russian Nikolai Kondratiev's concept of economic cycles in with
50-year periodicity - Kondratiev waves - and by extension, the 100-year cycle of the Century
Wave or Saeculum. Schumpeter suggested an integrated Economic Cycle Model in which the
four main cycles, Kondratiev (54 years), Kuznets (18 years), Juglar (9 years) and Kitchin (about
2-4 years) can be aggregated together to form a composite economic waveform. The economic
wave form series suggested here did not include the Kuznets Cycle simply because Schumpeter
did not recognize it as a valid cycle (see "Business Cycle" for further information). There was
actually some considerable professional animosity between Schumpeter and Kuznets. As far as
the segmentation of the Kondratiev cycle goes, Schumpeter further postulated that a single
Kondratiev cycle might be consistent with the aggregation of three lower-order Kuznets cycles.
• Each Kuznets wave could, itself, be made up of two Juglar waves. Similarly two or three Kitchin
cycles could form a higher-order Juglar cycle. If each of these were in harmonic phase, more
importantly if the downward arc of each was simultaneous so that the nadir (perigee) of each
cycle was coincident - it could explain disastrous economic slumps and their consequential
recessions and depressions. Schumpeter never proposed a rigid, fixed-periodicity model. He
saw that these cycles could vary in length over time - impacted on by various random, chaotic
and radically disruptive “Black Swan” events - catastrophes such as War, Famine and Disease.
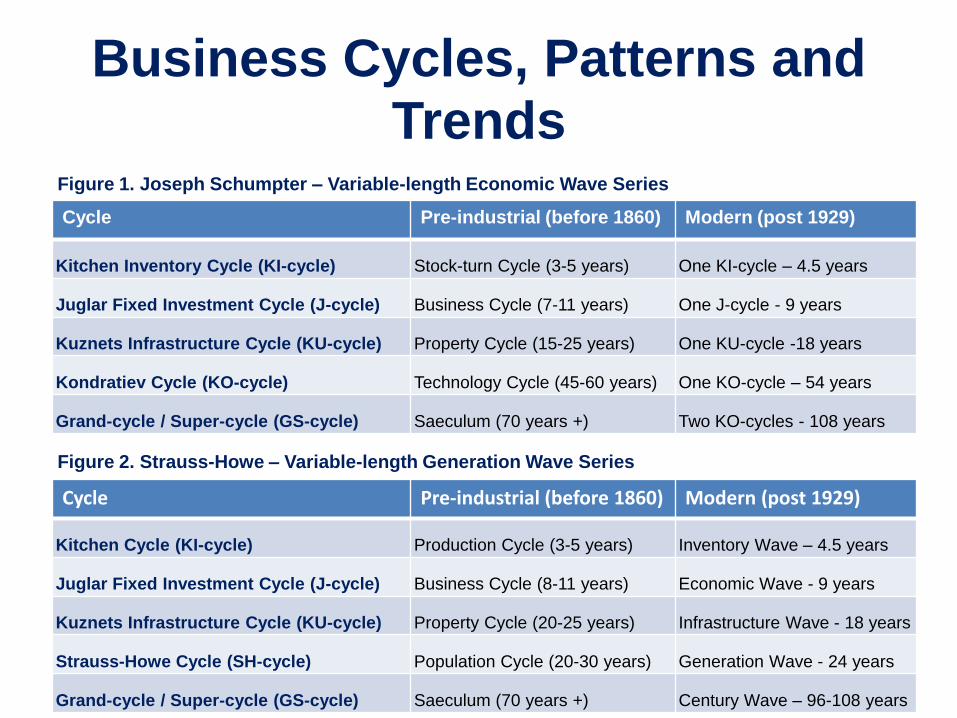
Business Cycles, Patterns and
Trends Figure 1. Joseph Schumpter – Variable-length Economic Wave Series
Figure 2. Strauss-Howe – Variable-length Generation Wave Series
Cycle Pre-industrial (before 1860) Modern (post 1929)
Kitchen Inventory Cycle (KI-cycle) Stock-turn Cycle (3-5 years) One KI-cycle – 4.5 years
Juglar Fixed Investment Cycle (J-cycle) Business Cycle (7-11 years) One J-cycle - 9 years
Kuznets Infrastructure Cycle (KU-cycle) Property Cycle (15-25 years) One KU-cycle -18 years
Kondratiev Cycle (KO-cycle) Technology Cycle (45-60 years) One KO-cycle – 54 years
Grand-cycle / Super-cycle (GS-cycle) Saeculum (70 years +) Two KO-cycles - 108 years
Cycle Pre-industrial (before 1860) Modern (post 1929)
Kitchen Cycle (KI-cycle) Production Cycle (3-5 years) Inventory Wave – 4.5 years
Juglar Fixed Investment Cycle (J-cycle) Business Cycle (8-11 years) Economic Wave - 9 years
Kuznets Infrastructure Cycle (KU-cycle) Property Cycle (20-25 years) Infrastructure Wave - 18 years
Strauss-Howe Cycle (SH-cycle) Population Cycle (20-30 years) Generation Wave - 24 years
Grand-cycle / Super-cycle (GS-cycle) Saeculum (70 years +) Century Wave – 96-108 years

Strauss–Howe Generation Wave
• The Strauss–Howe Generation Wave theory, created by authors William Strauss and Neil Howe, identifies a recurring generational cycle in European and American history. Strauss and Howe lay the groundwork for the theory in their 1991 book Generations, which retells the history of America as a series of generational biographies going back to 1584. In their 1997 book The Fourth Turning, the authors expand the theory to focus on a fourfold cycle of generational types and recurring mood eras in American history. Their consultancy, Life Course Associates, has expanded on the concept in a variety of publications since then.
• The Strauss–Howe Generation Wave theory was developed to describe the history of the United States, including the founding 13 colonies and their Anglo-Saxon antecedents, and this is where the most detailed research has been done. However, the authors have also examined generational trends elsewhere in the world and identified similar cycles in several developed countries. The books are best-sellers and the theory has been widely influential and acclaimed in the USA. Eric Hoover has called the authors pioneers in a burgeoning industry of consultants, speakers and researchers focused on generations.
• Academic response to the theory has been somewhat mixed - some American authorities applauding Strauss and Howe for their "bold and imaginative thesis," and others (mostly European) criticizing the theory for the lack of any rigorous empirical evidence for their claims,
and a perception that many aspects of their “one size fits all” argument gloss over real differences within the population of each generation. What is apparent is that Strauss and Howe have failed miserably to grasp the importance of Generation Waves driving Technology Innovation in the economy – instead, referring to weak and insipid hypotheses of “Spiritual Awareness” and suchlike driving Generational Change through the saeculum (Century Wave).

Strauss–Howe Generation Waves
1. Arthurian Generation (1433–1460) (H)
2. Humanist Generation (1461–1482) (A)
3. Reformation Generation (1483–1511) (P)
4. Reprisal Generation (1512–1540) (N)
5. Elizabethan Generation (1541–1565) (H)
6. Parliamentary Generation (1566–1587) (A)
7. Puritan Generation (1588–1617) (P)
8. Cavalier Generation (1618–1647) (N)
9. Glorious Generation (1648–1673) (H)
10. Enlightenment Generation (1674–1700) (A)
11. Awakening Generation (1701–1723) (P)
12. Liberty Generation (1724–1741) (N)
13. Republican Generation (1742–1766) (H)
14. Compromise Generation (1767–1791) (A)
15. Transcendental Generation (1792–1821) (P)
16. Gilded Generation (1822–1842) (N)
17. Progressive Generation (1843–1859) (A)
18. Missionary Generation (1860–1882) (P)
19. Lost Generation (1883–1900) (N)
20. G.I. Generation (1901–1924) (H)
21. Silent Generation (1925–1942) (A)
22. Baby Boom Generation (1943–1960) (P)
23. Generation X (Gen X) (1961–1981) (N)
24. Millennial Generation (Gen Y) (1982–2004) (H)
25. Homeland Generation (Gen Z) (2005-present) (A)

Generation and Century Waves Saeculum McLaughlin
Cycle
Spiritual Age High, Awakening,
Secular Crisis
Strauss-Howe
Generation
Generation
Date / Type
1415 - 1514 Pre-Columbian Renaissance
(1517-1539) Retreat from France
Arthurian Generation 1433–1460) (H)
Wars of the Roses
(1455-1487) War of the Roses
Humanist Generation 1461–1482) (A)
High: Tudor Renaissance Reformation Generation 1483–1511) (P)
1515 - 1614 Columbian Reformation
(1517-1539)
Awakening: Protestant
Reformation
Reprisal Generation 1512–1540) (N)
Spanish Armada
(1580-1588) Intolerance and Martyrdom
Elizabethan Generation 1541–1565) (H)
Crisis: Armada Crisis Parliamentary Generation 1566–1587) (A)
High: Merrie England Puritan Generation 1588–1617) (P)
1615 - 1714 Colonial Early Enlightenment
(1610-1640)
English Civil War
(1675-1704)
Cavalier Generation 1618–1647) (N)
Glorious Generation 1648–1673) (H)
Enlightenment Generation 1674–1700) (A)
1715 - 1814 Revolutionary Late Enlightenment
(1730-1760)
American Revolution
(1773-1794)
Awakening Generation 1701–1723) (P)
Liberty Generation 1724–1741) (N)
Republican Generation 1742–1766) (H)
Compromise Generation 1767–1791) (A)

Generation and Century Waves Saeculum McLaughlin
Cycle
Spiritual Age High, Awakening,
Secular Crisis
Strauss-Howe
Generation
Generation
Date / Type
1815 - 1914 Victorian Transcendental
(1800-1830)
Napoleonic Wars
(1860-1865)
Transcendental Generation 1792–1821) (P)
Gilded Generation 1822–1842) (N)
Progressive Generation 1843–1859) (A)
Missionary Generation 1860–1882) (P)
Lost Generation 1883–1900) (N)
1915 - 2014 Loss of Empires Missionary Awakening
(1890-1920)
WWI, Depression & WWII
(1929-1946)
G.I. Generation 1901–1924) (H)
Silent Generation 1925–1942) (A)
Baby Boom Generation 1943–1960) (P)
Cold War Baby Boom Awakening
(1960-1980)
Regional Wars, Terrorism,
Insecurity
Generation X (Generation X) 1961–1981) (N)
Millennial 21st century Awakening
(2000 - 2020)
Regional Wars, Terrorism,
Insecurity
Millennial Generation (Gen Y) 1982–2004) (H)
Regional Wars, Terrorism,
Insecurity
Homeland Generation (Gen Z) 2005–2025 (A)
2015-2114 Post-Millennial 21st century Apocalypse
(2020 - 2040)
Global Food, Energy and
Water (FEW) Crisis
Apocalyptic Generation (Gen A) 2025–2050 (P)
Post-Apocalyptic
Realisation (2040 - 2060)
Wars, Disease, Famine ,
Terrorism and Insecurity
Post-Apocalyptic Generation
(Gen B)
2050–2070 (N)
Post-Apocalyptic Recovery
(2040 - 2060)
Wars, Disease, Famine ,
Terrorism and Insecurity
Recovery Generation (Gen C) 2070–2090) (H)

Business Cycles, Patterns and Trends – Innovation and Capital
Complex Market Phenomena are simply: - "the outcomes of endless conscious, purposeful human actions, by countless
individuals exercising personal choices and preferences - each of whom is trying as best they can to optimise their
circumstances in order to achieve various needs and desires. Individuals, through economic activity strive to attain their
preferred outcomes - whilst at the same time attempting to avoid any unintended consequences leading to unforeseen
outcomes.....”
• Ludwig von Mises – Economist •
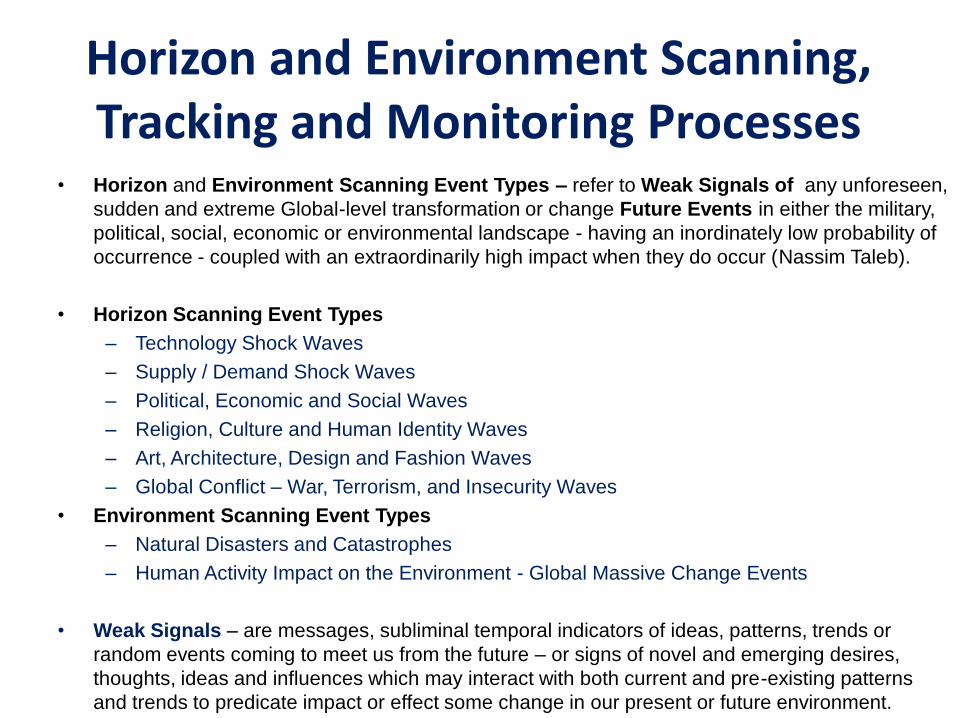
Horizon and Environment Scanning, Tracking and Monitoring Processes
• Horizon and Environment Scanning Event Types – refer to Weak Signals of any unforeseen,
sudden and extreme Global-level transformation or change Future Events in either the military,
political, social, economic or environmental landscape - having an inordinately low probability of
occurrence - coupled with an extraordinarily high impact when they do occur (Nassim Taleb).
• Horizon Scanning Event Types
– Technology Shock Waves
– Supply / Demand Shock Waves
– Political, Economic and Social Waves
– Religion, Culture and Human Identity Waves
– Art, Architecture, Design and Fashion Waves
– Global Conflict – War, Terrorism, and Insecurity Waves
• Environment Scanning Event Types
– Natural Disasters and Catastrophes
– Human Activity Impact on the Environment - Global Massive Change Events
• Weak Signals – are messages, subliminal temporal indicators of ideas, patterns, trends or
random events coming to meet us from the future – or signs of novel and emerging desires,
thoughts, ideas and influences which may interact with both current and pre-existing patterns
and trends to predicate impact or effect some change in our present or future environment.

HUMAN ACTIVITY CYCLES
SHORT PERIOD HUMAN ACTIVITY WAVES
• Price Curves – short-term, variable Market Trends,
• Seasonal Activities – Farming, Forestry and Fishing
• Trading and Fiscal Cycles – Diurnal to Annual (1 day to 1 year)
MEDIUM PERIOD HUMAN ACTIVITY WAVES – Joseph Schumpter Series
• Kitchin inventory cycle of 3–5 years (after Joseph Kitchin);
• Juglar fixed investment cycle of 7–11 years (often referred to as simply 'the business cycle’);
• Kuznets infrastructural investment cycle of 15–25 years (after Simon Kuznets);
• Generation Wave – 15, 20, 25 or 30 years (four or five per Saeculum and Innovation Wave)
• Innovation Wave – Major Scientific, Technology and Industrial Innovation Cycles of about 80 years
– Sub-Innovation Waves – Minor Technology Innovation Cycles @ 40 years (2 x Kuznets Waves ?)
• Kondratiev wave or long technological cycle of 45–60 years (after Nikolai Kondratiev)
• Saeculum or Century Wave – Major Geo-political rivalry and conflict waves of about 100 years
– Sub-Century Waves – Minor Geo-political Cycles @ 50 years (Kondratiev long technological wave)
HUMAN ACTIVITY CYCLES
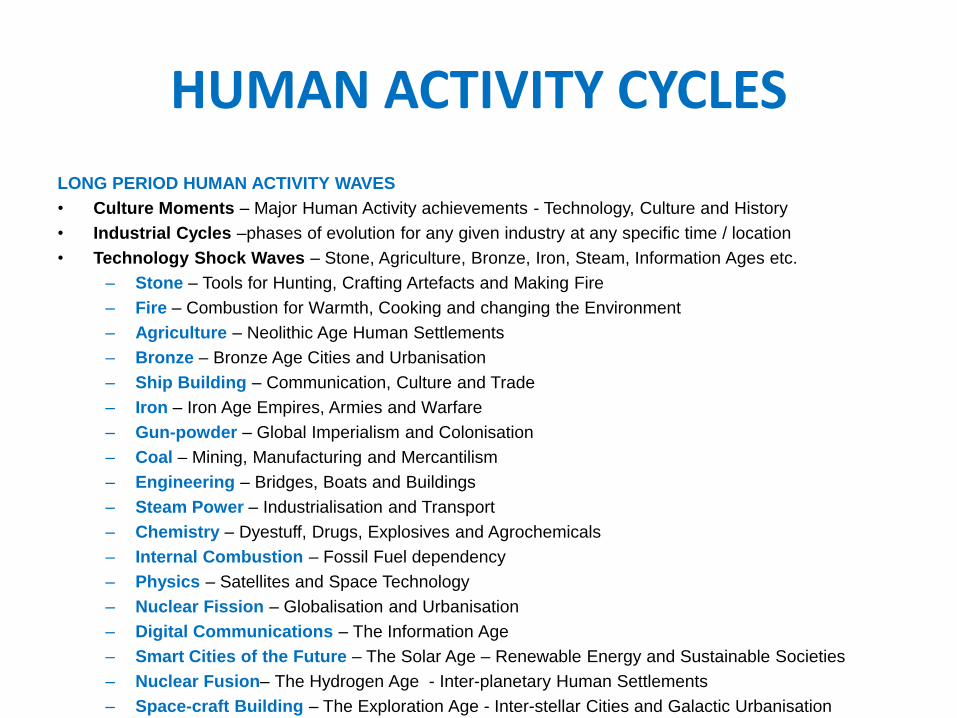
LONG PERIOD HUMAN ACTIVITY WAVES
• Culture Moments – Major Human Activity achievements - Technology, Culture and History
• Industrial Cycles –phases of evolution for any given industry at any specific time / location
• Technology Shock Waves – Stone, Agriculture, Bronze, Iron, Steam, Information Ages etc.
– Stone – Tools for Hunting, Crafting Artefacts and Making Fire
– Fire – Combustion for Warmth, Cooking and changing the Environment
– Agriculture – Neolithic Age Human Settlements
– Bronze – Bronze Age Cities and Urbanisation
– Ship Building – Communication, Culture and Trade
– Iron – Iron Age Empires, Armies and Warfare
– Gun-powder – Global Imperialism and Colonisation
– Coal – Mining, Manufacturing and Mercantilism
– Engineering – Bridges, Boats and Buildings
– Steam Power – Industrialisation and Transport
– Chemistry – Dyestuff, Drugs, Explosives and Agrochemicals
– Internal Combustion – Fossil Fuel dependency
– Physics – Satellites and Space Technology
– Nuclear Fission – Globalisation and Urbanisation
– Digital Communications – The Information Age
– Smart Cities of the Future – The Solar Age – Renewable Energy and Sustainable Societies
– Nuclear Fusion– The Hydrogen Age - Inter-planetary Human Settlements
– Space-craft Building – The Exploration Age - Inter-stellar Cities and Galactic Urbanisation
Business Cycles, Patterns and Trends – Economic Boom and Bust
Business Cycles, Patterns and Trends – Innovation and Capital
• The purpose of this section is to examine the nature and content of Clement Juglar’s contribution
to Business Cycle Theory and then to compare and contrast it with that of Joseph Schumpeter’s
analysis of cyclical economic fluctuations. There are many similarities evident - but there are
also some important differences between the two competing theories. Schumpeter’s classical
Business Cycle is driven by a series of multiple co-dependent technology innovations of low to
medium impact - whereas according to Juglar the trigger for a runaway bull markets is market
speculation fuelled by the over-supply of credit. A deeper examination of Juglar’s business
cycles can reveal the richness of Juglar’s original and very interesting approach. Indeed Juglar,
without having proposed a complete theory of business cycles, nevertheless provides us with an
original Money Supply theory of economic boom cycles supporting a more detailed comparison
and benchmarking between these two co-existing and compatible theories of business cycles.
• In a specific economic context characterised by the rapid development of both industry and
trade, Juglar's theory interconnects the development of new markets with credit availability for
speculative investments – and the bank’s behaviours in response to the various phases of the
Business Cycle – Crisis, Liquidation, Recovery, Growth and Prosperity, . The way that the
money supply, credit availability and industrial development interact to create business cycles is
quite different in Juglar’s viewpoint than that expressed by Schumpeter in his theory of economic
development – growth driven by innovation - but does not necessarily express any fundamental
contradiction. Entrepreneurs, through innovation , attract capital funding from investors for start-
ups and scale-ups. Compared and contrasted, these two different approaches refer to market
phenomena which are both separate and different – but still entirely compatible and co-existent.

Price Index Inflation

Waves, Cycles, Patterns and Trends
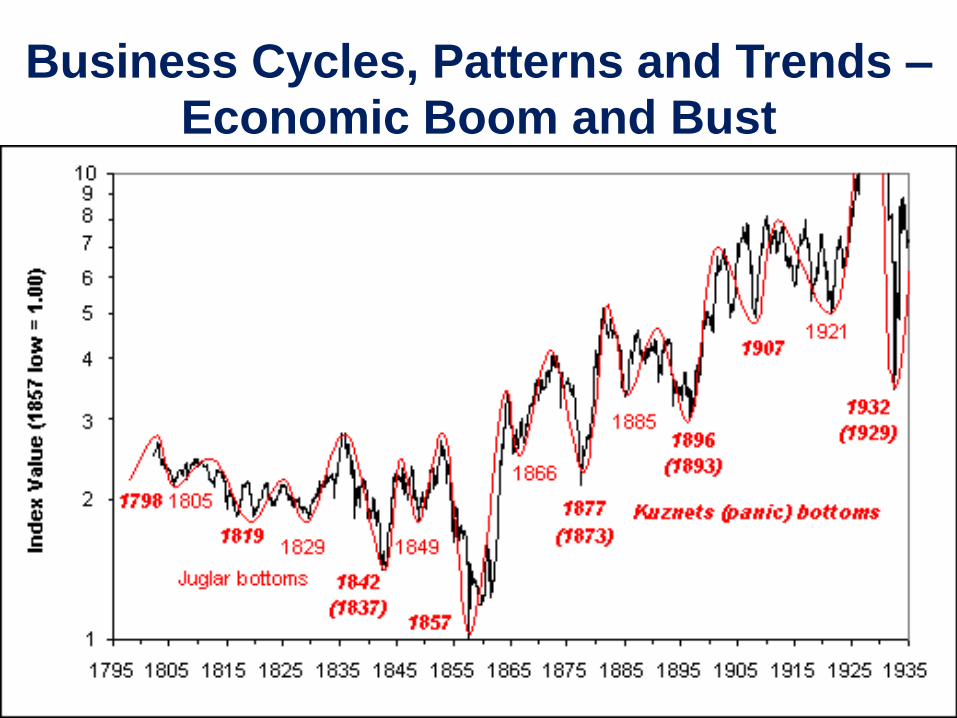
• Business Cycles were once thought to be an economic phenomenon due to periodic fluctuations in economic activity. These mid-term economic cycle fluctuations are usually measured using Real (Austrian) Gross Domestic Product (rGDP). Business Cycles take place against a long-term background trend in Economic Output – growth, stagnation or recession – which affects Money Supply as well as the relative availability and consumption (Demand v. Supply and Value v. Price) of other Economic Commodities. Any excess of Money Supply may lead to an economic expansion or “boom”, conversely shortage of Money Supply (Money Supply shocks – the Liquidity Trap) may lead to economic contraction or “bust”. Business Cycles are recurring, fluctuating levels of economic activity experiences in an economy over a significant timeline (decades or centuries).
• The five stages of Business Cycles are growth (expansion), peak, recession (contraction), trough and recovery. Business Cycles were once widely thought to be extremely regular, with predictable durations, but today’s Global Market Business Cycles are now thought to be unstable and appear to behave in irregular, random and even chaotic patterns – varying in frequency, range, magnitude and duration. Many leading economists now also suspect that Business Cycles may be influenced by fiscal policy as much as market phenomena - even that Global Economic “Wild Card” and “Black Swan” events are actually triggered by Economic Planners in Government Treasury Departments and in Central Banks as a result of manipulating the Money Supply under the interventionist Fiscal Policies adopted by some Western Nations.

Scenario Planning and Impact Analysis

• Many Economists and Economic Planners have widely arrived at the consensus that a large
majority of organizations have yet to develop sophisticated Economic Modelling systems and
integrated their outputs into the strategic planning process. The objective of this paper is to
shed some light into the current state of the business and economic environmental scanning,
tracking, monitoring and forecasting function in organizations Impacted by Business Cycles.
• Major periodic changes in business activity are due to recurring cyclic phases in economic
expansion and contraction - classical “bear” and “bull” markets, or “boom and bust” cycles.
The time series decomposition necessary to explain this complex phenomenon presents us
with many interpretive difficulties – due to background “noise” and interference as multiple
business cycles, patterns and trends interact and impact upon each other. We are now able
to compare cyclical movements in output levels, deviations from trend, and smoothed growth
rates of the principal measures of aggregate economic activity - the quarterly Real (Austrian)
GDP and the monthly U.S. Coincident Index - using the phase average trend (PAT).
• This section provides a study of business cycles - which are defined as periodic sequences of
expansion and contraction in the general level of economic activity. The proposed Wave-
form Analytics approach helps us to identify discrete Cycles, Patterns and Trends in Big Data.
This approach may be characterised as periodic sequences of high and low business activity
resulting in cyclic phases of increased and reduced output trends – supporting an integrated
study of disaggregated economic cycles that does not require repeated multiple and iterative
processes of trend estimation and elimination for every possible business cycle duration..
Economic Waves, Cycles, Patterns and Trends
• Real (Austrian) business cycle theory assigns a central role to shock waves as the primary source of economic fluctuations or disturbances. As King and Rebelo (1999) discuss in .Resuscitating Real Business Cycles, when persistent technology shocks are fed through a standard real business cycle model – then the simulated economy displays impact patterns which are similar to those exhibited by actual business cycles. While the last decade has seen the addition of other types of shocks in these models - such as monetary policy and government spending - none has been shown to be a central impulse to business cycles.
• A trio of recent papers has called into question the theory that technology shocks have anything to do with the fundamental shape of business cycles. Although they use very different methods, Galí (1999), Shea (1998) and Basu, Kimball, and Fernald (1999) all present the same result: positive technology shocks appear to lead to declines in labour input.1 Galí identifies technology shocks using long-run restrictions in a structural VAR; Shea uses data on patents and R&D; and Basu, Kimball and Fernald identify technology shocks by estimating Hall-style regressions with proxies for utilization.
• In all cases, they find significant negative correlations of hours with the technology shock waves, Gail's paper also studies the effects of the non-technology shocks – such as Terrorism, Insecurity and Military Conflicts, as well as Monetary Supply and Commodity-price Shocks - which he suggests might be interpreted as demand / supply shocks. These shocks produce the typical business cycle co-movement between output and hours. In response to a positive shock, both output and hours show a rise in the typical hump-shaped pattern. Productivity also rises - but with only temporarily economic effect – modifying Business Cycles rather than radically altering them.
Economic Waves, Cycles, Patterns and Trends

Wholesale Price Index – 1790-1640

Introduction - Business Cycles,
Patterns and Trends • Prior to widespread international industrialisation (Globalisation), the Kondratiev Cycle (KO-
cycle) represented phases of industrialisation – successive waves of incremental development in
the fields of Technology and Innovation – which, in turn could be resolved into a further series of
nested Population Cycles (Human Generation Waves – popularised by Strauss and Howe). The
economic impact of Generation Waves was at least partially influenced by the generational war
cycle, with its impact on National Fiscal Policy (government finances). Shorter economic cycles
appeared to fit into the longer KO-cycle, rather existing independently - possibly harmonic in
nature. Hence financial panics followed a real estate cycle of about 18 years, denoted as the
Kuznets Cycle (KU-cycle) . Slumps occurring in between the Kuznets cycle at a half-cycle that
were of similar length to the “Boom-Bust” Business Cycles first identified by Clement Juglar.
• Business Cycles were apparently of random length - up to a full Juglar Business Cycle in the
range of 8 to 11 years . With the arrival of industrialisation, the ordinary Business Cycle was
now joined by a new Economic phenomenon – the Inventory Cycle, or Kitchen Cycle (KI-cycle)
with a range of 3-5 years duration – which was later challanged by a new, decreased and lower,
more uniform length (average 40 months). The Kuznets Cycle (KU-cycle) and Kondratiev Cycles
carried on much as before. From the changes induced by industrialisation, the Robert Bronson
SMECT structure emerged, in which sixteen 40 month Kitchen cycles "fit" into a standard
Kondratiev cycle – and the KO-cycle subdivided into 1/2, 1/4 and 1/8-length sub-cycles.

Innovation Waves
Business Cycles, Patterns and
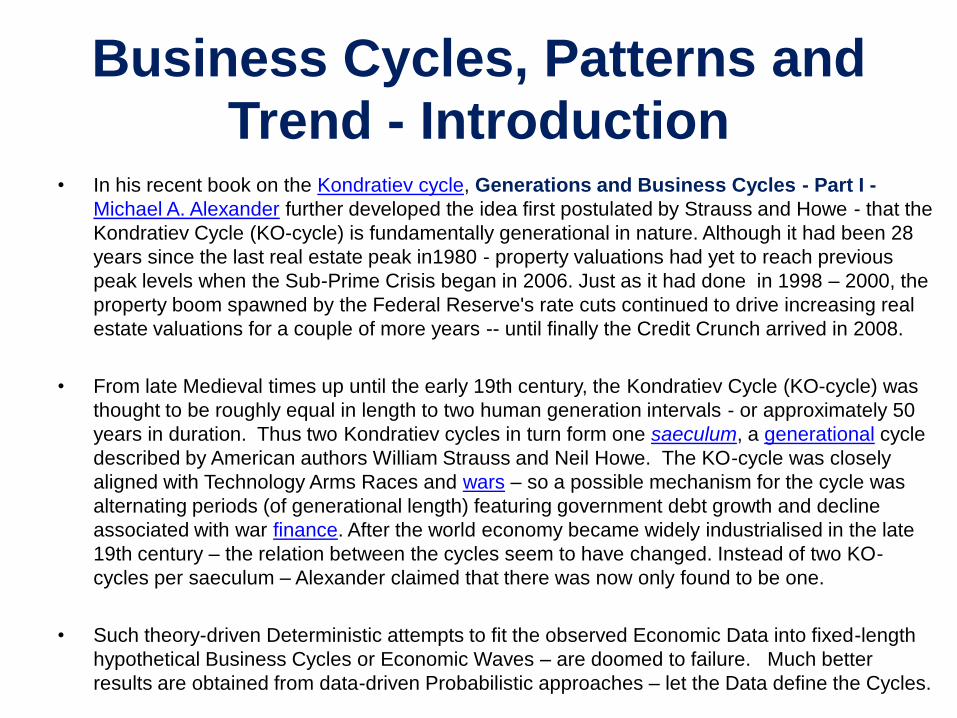
Trend - Introduction • In his recent book on the Kondratiev cycle, Generations and Business Cycles - Part I -
Michael A. Alexander further developed the idea first postulated by Strauss and Howe - that the
Kondratiev Cycle (KO-cycle) is fundamentally generational in nature. Although it had been 28
years since the last real estate peak in1980 - property valuations had yet to reach previous
peak levels when the Sub-Prime Crisis began in 2006. Just as it had done in 1998 – 2000, the
property boom spawned by the Federal Reserve's rate cuts continued to drive increasing real
estate valuations for a couple of more years -- until finally the Credit Crunch arrived in 2008.
• From late Medieval times up until the early 19th century, the Kondratiev Cycle (KO-cycle) was
thought to be roughly equal in length to two human generation intervals - or approximately 50
years in duration. Thus two Kondratiev cycles in turn form one saeculum, a generational cycle
described by American authors William Strauss and Neil Howe. The KO-cycle was closely
aligned with Technology Arms Races and wars – so a possible mechanism for the cycle was
alternating periods (of generational length) featuring government debt growth and decline
associated with war finance. After the world economy became widely industrialised in the late
19th century – the relation between the cycles seem to have changed. Instead of two KO-
cycles per saeculum – Alexander claimed that there was now only found to be one.
• Such theory-driven Deterministic attempts to fit the observed Economic Data into fixed-length
hypothetical Business Cycles or Economic Waves – are doomed to failure. Much better
results are obtained from data-driven Probabilistic approaches – let the Data define the Cycles.
Innovation Waves

Business Cycles, Patterns and
Trends Figure 3. Robert Bronson's Deterministic SMECT System of Fixed-length Cycle Periodicity
Figure 4. Michael Alexander – Fixed-length Business Cycle and Bear Market Cycle Periodicity
Cycle Pre-industrial (before 1860) Modern (post 1929)
Juglar Cycle (J-cycle) Business Cycle (8-11 years) Economic Wave - 9 years
K0-trend / Infrastructure Wave Property Cycle (20-25 years) Infrastructure Wave - 18 years
K0-wave / Generation Wave Population Cycle (20-30 years) Generation Wave - 36 years
K0-cycle / Innovation Wave Technology Cycle (45-60 years) Innovation Wave - 72 years
Grand-cycle / Super-cycle (GS-cycle) Saeculum (70 years +) Century Wave - 108 years
Cycle Pre-industrial (before 1860) Modern (post 1929)
Kitchen Cycle (KI-cycle) Production Cycle (3-5 years) Inventory Wave- 40 months
Juglar Cycle (J-cycle) Business Cycle (8-11 years) Economic Wave - 9 years
Kuznets Cycle (KU-cycle) Property Cycle (20-25 years) Infrastructure Wave -18 years
Strauss-Howe Cycle (SH-cycle) Population Cycle (20-30 years) Generation Wave - 36 years
Kondratiev Cycle (KO-cycle) Technology Cycle (45-60 years) Innovation Wave - 72 years

Periodicity - Business Cycles,
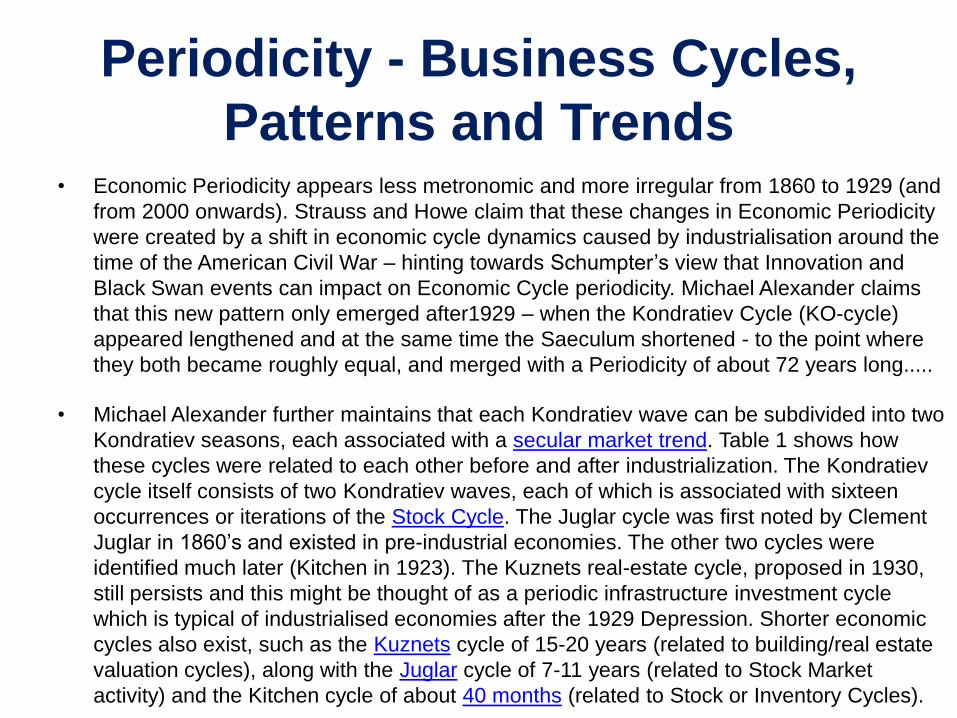
Patterns and Trends • Economic Periodicity appears less metronomic and more irregular from 1860 to 1929 (and
from 2000 onwards). Strauss and Howe claim that these changes in Economic Periodicity
were created by a shift in economic cycle dynamics caused by industrialisation around the
time of the American Civil War – hinting towards Schumpter’s view that Innovation and
Black Swan events can impact on Economic Cycle periodicity. Michael Alexander claims
that this new pattern only emerged after1929 – when the Kondratiev Cycle (KO-cycle)
appeared lengthened and at the same time the Saeculum shortened - to the point where
they both became roughly equal, and merged with a Periodicity of about 72 years long.....
• Michael Alexander further maintains that each Kondratiev wave can be subdivided into two
Kondratiev seasons, each associated with a secular market trend. Table 1 shows how
these cycles were related to each other before and after industrialization. The Kondratiev
cycle itself consists of two Kondratiev waves, each of which is associated with sixteen
occurrences or iterations of the Stock Cycle. The Juglar cycle was first noted by Clement
Juglar in 1860’s and existed in pre-industrial economies. The other two cycles were
identified much later (Kitchen in 1923). The Kuznets real-estate cycle, proposed in 1930,
still persists and this might be thought of as a periodic infrastructure investment cycle
which is typical of industrialised economies after the 1929 Depression. Shorter economic
cycles also exist, such as the Kuznets cycle of 15-20 years (related to building/real estate
valuation cycles), along with the Juglar cycle of 7-11 years (related to Stock Market
activity) and the Kitchen cycle of about 40 months (related to Stock or Inventory Cycles).

Economic Models
• At the onset of the Great Depression 1927-29, many economists believed that : -
“left alone, markets were self-correcting and would return to an ‘equilibrium’ that efficiently
utilised capital, workers and natural resources… this was the inviolate and core axiom of
‘scientific economics’ itself…
• A month after the Great Crash, economists at Harvard University, had made a statement (from
Richard Parker - John Kenneth Galbraith: his life, politics and economics, 2005, p.12) that : -
“a severe depression like that of 1920-21 is outside the range of probability.”
• They could not have been more wrong. In a new theory, Neo-liberal Keynesianism, which
emerged with the publication of John Maynard Keynes’ “The General Theory of Employment,
Interest and Money.” - Keynes had made use of a radically different set of assumptions, which
could lead to a startling new possibility of an alternative economic equilibrium consisting of
simultaneous high unemployment and low income – a stark and different equilibrium condition
where the economy could be forced into a deep state of inefficient economic equilibrium - or
stagnation - where the economy would stagnate (get stuck in a deep trough) – a condition from
which it was very difficult to escape. In Neo-classical Economic theory – this economic condition
was thought to be both implausible and impossible.
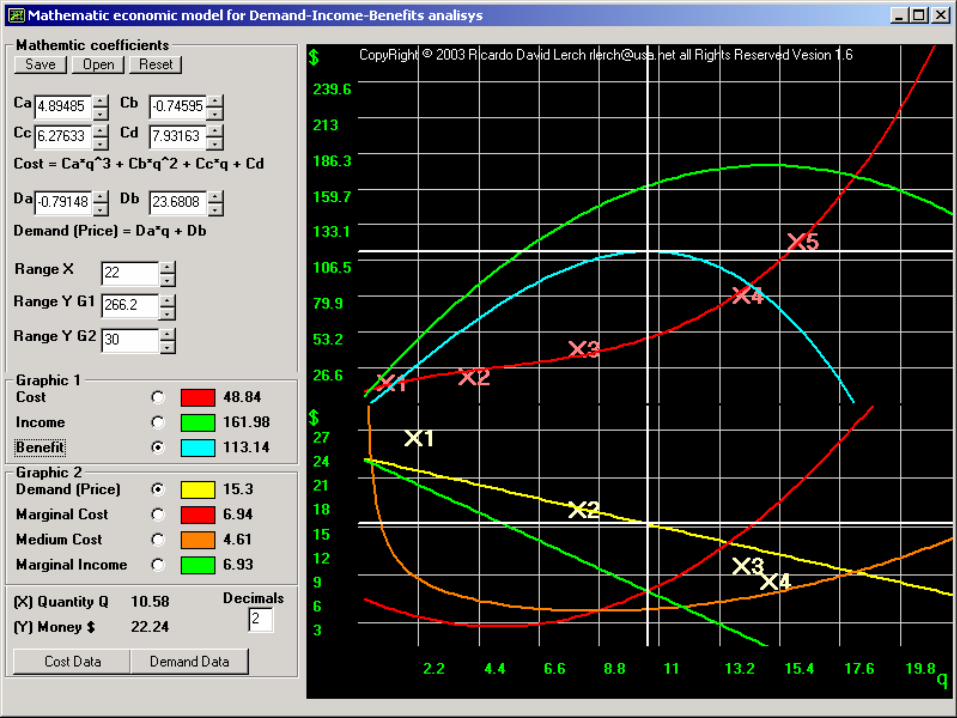
Economic Modelling and Long-range
Forecasting – Boom and Bust • The way that we think about the future must mirror how the future actually
unfolds. We have learned from recent experience, that the future is not a straightforward extrapolation of simple, single-domain trends. We now have to consider ways in which random, chaotic and radically disruptive events may be factored into enterprise threat assessment and risk management frameworks - and incorporated into enterprise decision-making structures and processes.
• Economic Modelling and Long-range Forecasting is driven by Data Warehouse Structures and Economic Models containing both Historic (up to 20 years daily closing prices for LNG and all grades of crude) and Future values (daily forecast and weekly projected price curves, monthly and quarterly movement predictions, and so on for up to 20 years into the future – giving a total timeline of 40-year (+ / - 20 years Historic and Future trends summary, outline movements and highlights). Forecast results are obtained using Economic Models - Quantitative (Technical) Analysis (Monte Carlo Simulation, Pattern and Trend Analysis - Economic growth . contraction and Recession / Depression shapes along with Commodity Price Curve Data Sets) – in turn driving Qualitative (Narrative) Scenario Planning and Impact Analysis techniques.

Robert Bronson's SMECT Forecasting Model
Each thing is of like form from everlasting and comes round again in its cycle - Marcus Aurelius
Alongside Joseph Schumpter’s Economic Wave Series and Strauss and Howe’s Generation Waves - is Robert
Bronson's SMECT Forecasting Model - which integrates both multiple Business and Stock-Market
Cycles into its structure.....
Robert Bronson SMECT System
• Alongside Joseph Schumpter’s Economic Wave Series and Strauss and Howe’s Generation Waves is Robert Bronson's SMECT Forecasting Model - which Integrates Multiple Business and Stock-Market Cycles in its structure.. After 1933, the Kondratiev cycle, representing Technology and Innovation Waves still persisted - but its length gradually increased to about 72 years - as it remains today. The Kuznets real estate cycle continued, but was much weaker for about 40 years until the 1970's when something like the old cycle was reactivated again in the economy.
• A number of ears ago, Bob Bronson, principal of Bronson Capital Markets Research, developed a useful model for predicting certain aspects of the occurrence characteristics of both Business cycles (stock-market price curves) and Economic cycles (Fiscal Policies). The template for this model graphically illustrates that the model not only explains the interrelationship of these past cycles with a high degree of accuracy - a minimum condition for any meaningful modelling tool, but it also has been, and should continue to be, a reasonably accurate forecasting mechanism.
• Robert Bronson's SMECT System is a Forecasting Model that integrates multiple Business (Stock-Market Movement) and Economic Cycles. Since there is an obvious interrelationship between short-term business cycles and short-term stock-market cycles, it is useful to be able to discover and understand their common elements - in order to develop an economic theory that explains the underlying connections between them and, in our case, to form meaningful, differentiating forecasts - especially over longer-term horizons. By pulling back from the close-up differences and viewing the cycles from a longer-term perspective, their common features become more apparent , Business Cycles are also subject to unexpected impact from external or “unknown” forces - Random Events – which are analogous to Uncertainty Theory in the way that they become manifest - but are subject to different interactions and feedback mechanisms.
Robert Bronson SMECT System
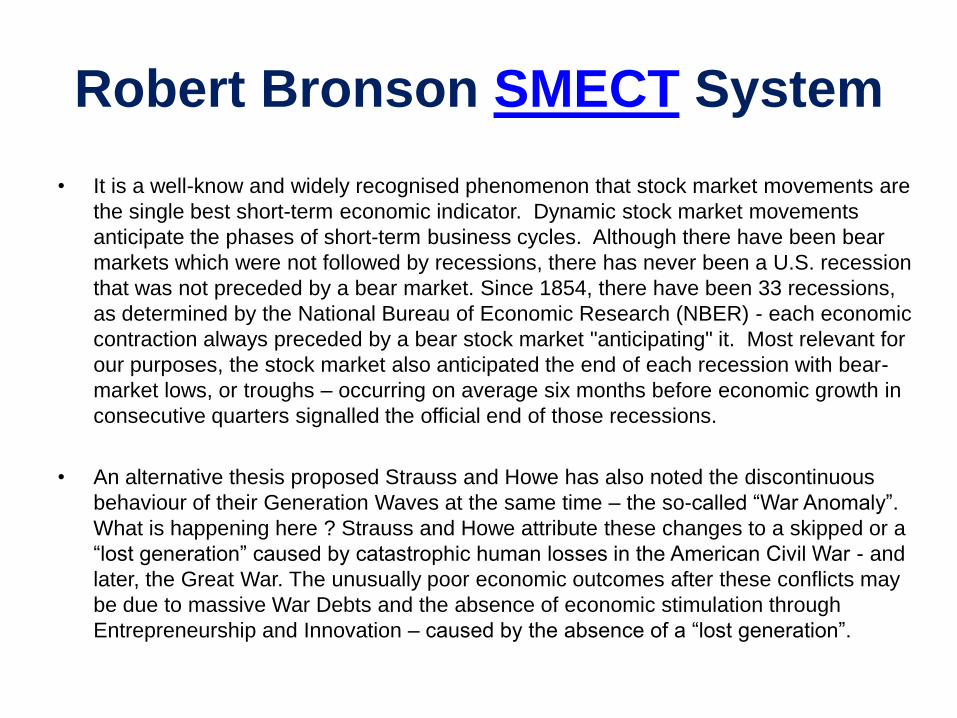
• It is a well-know and widely recognised phenomenon that stock market movements are
the single best short-term economic indicator. Dynamic stock market movements
anticipate the phases of short-term business cycles. Although there have been bear
markets which were not followed by recessions, there has never been a U.S. recession
that was not preceded by a bear market. Since 1854, there have been 33 recessions,
as determined by the National Bureau of Economic Research (NBER) - each economic
contraction always preceded by a bear stock market "anticipating" it. Most relevant for
our purposes, the stock market also anticipated the end of each recession with bear-
market lows, or troughs – occurring on average six months before economic growth in
consecutive quarters signalled the official end of those recessions.
• An alternative thesis proposed Strauss and Howe has also noted the discontinuous
behaviour of their Generation Waves at the same time – the so-called “War Anomaly”.
What is happening here ? Strauss and Howe attribute these changes to a skipped or a
“lost generation” caused by catastrophic human losses in the American Civil War - and
later, the Great War. The unusually poor economic outcomes after these conflicts may
be due to massive War Debts and the absence of economic stimulation through
Entrepreneurship and Innovation – caused by the absence of a “lost generation”.

Wave-form Analytics in Econometrics

Wave-form Analytics
Track and Monitor
Investigate and
Analyse
Scan and Identify
Separate and Isolate
Communicate Discover
Verify and Validate Disaggregate
Background Noise
Individual Wave
Composite Waves
Wave-form Characteristics

Wave-form Analytics in Econometrics
• Biological, Sociological, Economic and Political systems all tend to demonstrate
Complex Adaptive System (CAS) behaviour - which appears to be more similar
in nature to biological behaviour in a living organism than to Disorderly, Chaotic,
Stochastic Systems (“Random” Systems). For example, the remarkable
adaptability, stability and resilience of market economies may be demonstrated by
the impact of Black Swan Events causing stock market crashes - such as oil price
shocks (1970-72) and credit supply shocks (1927- 1929 and 2008 onwards).
Unexpected and surprising Cycle Pattern changes have historically occurred
during regional and global conflicts being fuelled by technology innovation-driven
arms races - and also during US Republican administrations (Reagan and Bush -
why?). Just as advances in electron microscopy have revolutionised biology -
non-stationary time series wave-form analysis has opened up a new space for
Biological, Sociological, Economic and Political system studies and diagnostics.
• The Wigner-Gabor-Qian (WGQ) spectrogram method demonstrates a distinct
capability for identifying revealing multiple and complex superimposed cycles or
waves within dynamic, noisy and chaotic time-series data sets – without the need
for using repetitive individual wave-form estimation and elimination techniques.

Wave-form Analytics in Econometrics
• Wave-form Analytics – characterised as periodic sequences of regular, recurring
high and low activity resulting in cyclic phases of increased and reduced periodic
trends – supports an integrated study of complex, compound wave forms in
order to identify hidden Cycles, Patterns and Trends in Economic Big Data.
• The existence of fundamental stable characteristic frequencies found within large
aggregations of time-series economic data sets (“Big Data”) provides us with
strong evidence and valuable insights about the inherent structure of Business
Cycles. The challenge found everywhere in business cycle theory is how to
interpret very large scale / long period compound-wave (polyphonic) time series
data sets which are in nature dynamic (non-stationary) such as the Schumpter
Economic Wave series - Kitchen, Juglar, Kusnets, Kondriatev - along with other
geo-political and economic waves - the Saeculum Century Wave and Strauss /
Howe Generation Waves.
Wave-form Analytics in Econometrics
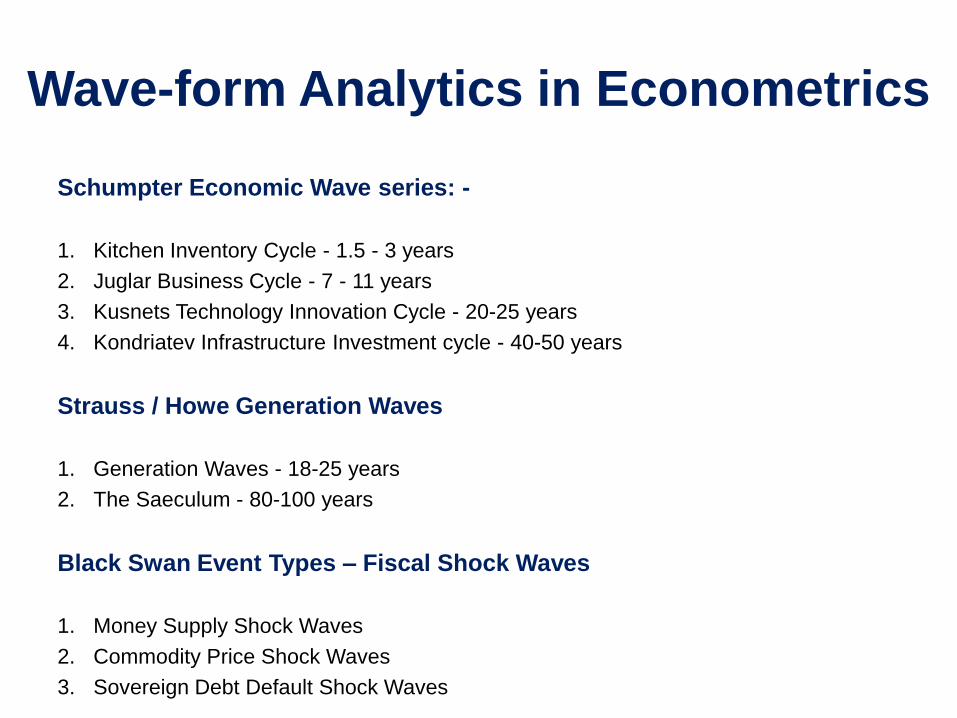
Schumpter Economic Wave series: -
1. Kitchen Inventory Cycle - 1.5 - 3 years
2. Juglar Business Cycle - 7 - 11 years
3. Kusnets Technology Innovation Cycle - 20-25 years
4. Kondriatev Infrastructure Investment cycle - 40-50 years
Strauss / Howe Generation Waves
1. Generation Waves - 18-25 years
2. The Saeculum - 80-100 years
Black Swan Event Types – Fiscal Shock Waves
1. Money Supply Shock Waves
2. Commodity Price Shock Waves
3. Sovereign Debt Default Shock Waves
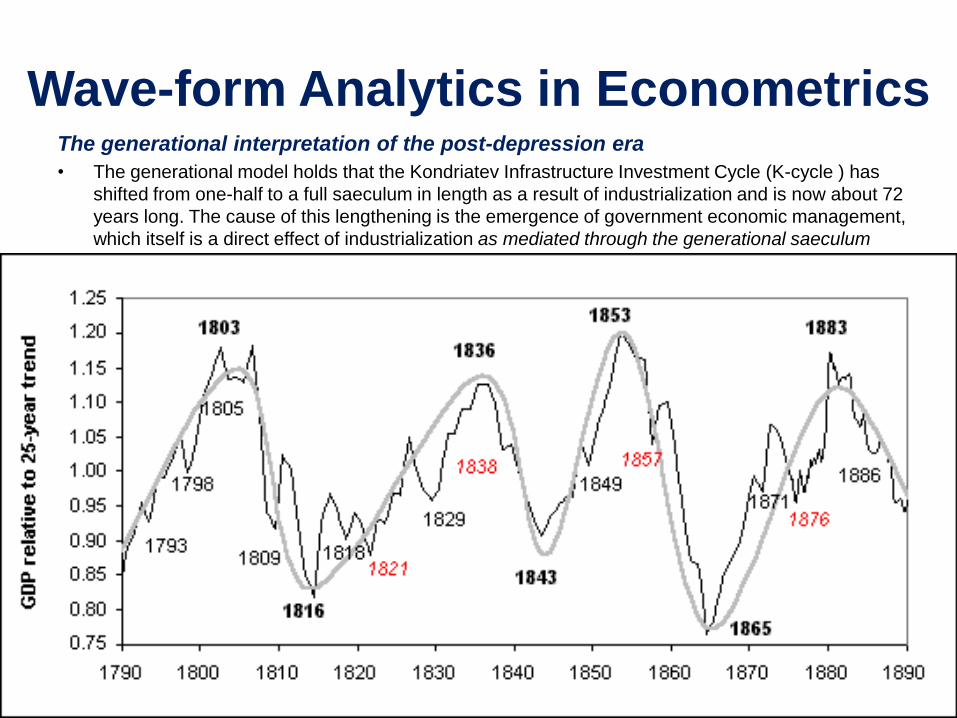
Wave-form Analytics in Econometrics The generational interpretation of the post-depression era
• The generational model holds that the Kondriatev Infrastructure Investment Cycle (K-cycle ) has
shifted from one-half to a full saeculum in length as a result of industrialization and is now about 72
years long. The cause of this lengthening is the emergence of government economic management,
which itself is a direct effect of industrialization as mediated through the generational saeculum
cycle.

Wave-form Analytics in Econometrics
The generational interpretation of the post-depression era
• The generational model holds that the Kondriatev Infrastructure Investment Cycle (K-cycle ) has shifted from one-half to a full saeculum in length as a result of industrialization and is now about 72 years long. The cause of this lengthening is the emergence of government economic management, which itself is a direct effect of industrialization as mediated through the generational saeculum cycle. The rise of the industrial economy did more than simply introduce the Kitchen cycle. It also increased the intensity of the generation- related Kitchen, Kuznets and Kondratiev cycles - all of which had already been part of the pre-industrial economy.
• Thus, while the Kuznets-related Panic of 1819 was the first panic to make it into the history books, it was a pretty mild bear market. The Panic of 1837 was worse and the one in 1857 worse yet. The Panic of 1873 ushered in the second worst bear market of all time. The depression following the Panic of 1893 was the worst up to that time. This depression was the first to take place with a majority of the population involved in non-agricultural occupations. Although hard times on the farm were a frequent occurrence, depressions did not usually mean hunger. Yet for the large numbers of urban workers thrown onto "the industrial scrap heap" the depression of the 1890's produced a level of suffering unprecedented for a business fluctuation.


Saeculum or Century Waves
• Long-term Economic
and Geopolitical Wave
Series – 50-100 years
• Regional and Global
Geopolitical Rivalry –
Human Conflict fuelling
Technology Arms Races
• Entrepreneurial-driven
Generation Waves
creating Technology
Innovation and driving
Economic Growth.
Natural v. Human Activity Cycles
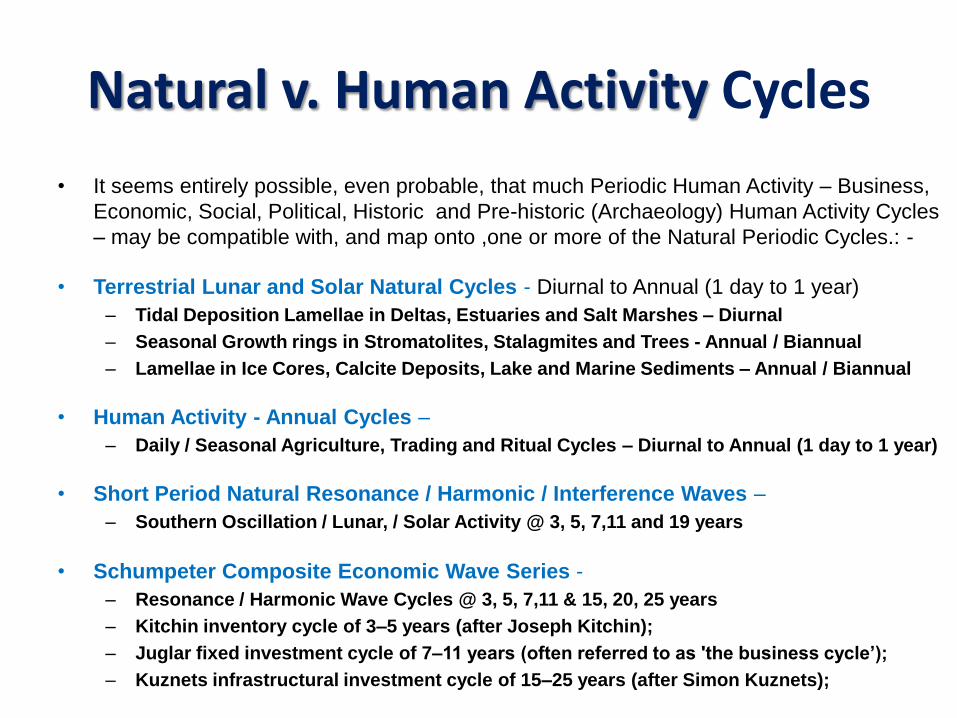
• It seems entirely possible, even probable, that much Periodic Human Activity – Business,
Economic, Social, Political, Historic and Pre-historic (Archaeology) Human Activity Cycles
– may be compatible with, and map onto ,one or more of the Natural Periodic Cycles.: -
• Terrestrial Lunar and Solar Natural Cycles - Diurnal to Annual (1 day to 1 year)
– Tidal Deposition Lamellae in Deltas, Estuaries and Salt Marshes – Diurnal
– Seasonal Growth rings in Stromatolites, Stalagmites and Trees - Annual / Biannual
– Lamellae in Ice Cores, Calcite Deposits, Lake and Marine Sediments – Annual / Biannual
• Human Activity - Annual Cycles –
– Daily / Seasonal Agriculture, Trading and Ritual Cycles – Diurnal to Annual (1 day to 1 year)
• Short Period Natural Resonance / Harmonic / Interference Waves –
– Southern Oscillation / Lunar, / Solar Activity @ 3, 5, 7,11 and 19 years
• Schumpeter Composite Economic Wave Series -
– Resonance / Harmonic Wave Cycles @ 3, 5, 7,11 & 15, 20, 25 years
– Kitchin inventory cycle of 3–5 years (after Joseph Kitchin);
– Juglar fixed investment cycle of 7–11 years (often referred to as 'the business cycle’);
– Kuznets infrastructural investment cycle of 15–25 years (after Simon Kuznets);

Natural v. Human Activity Cycles
• It appears that many Human Activity Cycles - Business, Social, Political, Economic, Historic and Pre-
historic (Archaeology) Cycles - may be compatible with, and map onto the twenty-six iterations of
Dansgaard Oeschger and Bond Cycles Climatic Series with major periodicity 1470 years (and 800
to 1000 years) Oceanic Climate Forcing - Bond Climatic Cycles - 1470 years (and 800 to 1000 years) –
• Solar Climate Forcing - Milankovitch Cycles – Solar Insolation driving Pleistocene Ice Ages: –
– Neanderthal Culture
– Solutrean Culture
– Clovis Culture
– Neolithic Agricultural Revolution
• Oceanic Climate Forcing - Dansgaard-Oeschger and Bond Cycles - driving the duration of Civilisations
– Bronze Age City States
– Iron Age Mercantile Armies and Empires
– Western Roman Empire (300 BC – 500 AD
– Eastern Roman Empire (500 – 1300 AD)
– Islamic Empire – (800 - 1300 AD)
– Vikings and Normans - Nordic Ascendency (700-1500 AD) (Medieval “mini Ice Age”)
– The Anglo-French Rivalry – Norman Conquest to Entente Cordial (1066 -1911)
– Pre-Columbian Americas – Mayan, Inca and Aztec Civilisations
– Pueblo Indians (Anastasia) – drought in South-Western USA
– Asian Civilisation – Han, Chin, Ming Chinese Dynasties, Aryan, Mongol and Khmer (Amkor)
– Pacific – Polynesian Expansion – from Hawaii to Easter Island and New Zealand

Wave Theory Of Human Activity
• Wave-Form Analytics and Cycle Mapping - It also appears that many Human Activity
Cycles - Social, Business, Political, Economic, Historic & Archaeology (Pre-historic)
Cycles - may be compatible with, and map incrementally onto one another, over time .....
• Schumpter Business Cycles –
– Kitchen, Juglar, and Kuznets Business Cycles map onto
– Strauss and Howe Generation Wave Series (20-25 years)
• Industry Cycles –
– Strauss and Howe Generation Wave Series (20-25 years) which map onto
– Innovation waves (40-80 years) - and Generation Waves may also map onto
– Kondratiev - long technology innovation investment cycle (50 years)
• Economic Waves –
– Kondratiev long infrastructure investment cycle (50 years) maps onto
– Saeculum Century Waves – Geo-political cycles (100 years)
• Saeculum Century Waves –
– Saeculum Century Waves – Geo-political cycles map onto Civilisations (variable)
– Civilisations (variable) map onto Technology Shock waves (variable)
• Technology Shock Waves – Stone, Agriculture, Bronze, Iron, Wind Power, Water Power,
Steam Power, Internal Combustion, Nuclear Fission, Nuclear Fusion etc.

Human Activity Cycles
SHORT PERIOD HUMAN ACTIVITY WAVES
• Price Curves – short-term, variable Market Trends,
• Seasonal Activities – Farming, Forestry and Fishing
• Trading and Fiscal Cycles – Diurnal to Annual (1 day to 1 year)
MEDIUM PERIOD HUMAN ACTIVITY WAVES – Joseph Schumpter Series
• Kitchin inventory cycle of 3–5 years (after Joseph Kitchin);
• Juglar fixed investment cycle of 7–11 years (often referred to as 'the business cycle’);
• Kuznets infrastructural investment cycle of 15–25 years (after Simon Kuznets);
• Generation Wave – 15, 20, 25 or 30 years (four or five per Saeculum and Innovation Wave)
• Innovation Wave – Major Scientific, Technology and Industrial Innovation Cycles of about 80 years
– Sub-Innovation Waves – Minor Technology Innovation Cycles @ 40 years (2 x Kuznets Waves ?)
• Kondratiev wave or long technological cycle of 45–60 years (after Nikolai Kondratiev)
• Saeculum or Century Wave – Major Geo-political rivalry and conflict waves of about 100 years
– Sub-Century Waves – Minor Geo-political Cycles @ 50 years (Kondratiev long technological wave)

Wave Theory Of Human Activity
• Saeculum or Century Waves – Human Conflict, Technology and Innovation waves
– Industrial / Technology Arms Race Cycles – 25 year cycles (four per Saeculum)
• American Civil War 1863
• Anglo-Chinese Opium War - 1888
• The Great War - 1914
• The Second World War – European Theatre 1939
– Geo-political Rivalry and Conflict – 20 year cycles (four per Saeculum)
– Olympics Years - even decades
• The Second World War – Pacific Theatre 1940
• Malayan Emergency - 1960
• Russian War in Afghanistan - 1980
• Balkan Conflict - 2000
• Culminating in a future Middle East Conflict before 2020 ?
– Geo-political Rivalry and Conflict – 20 year cycles (four per Saeculum)
– World Cup years - odd decades
• Korean War - 1950
• Vietnam War - 1970
• 1st Gulf War - 1990
• “Arab Spring” Uprisings - 2010
• Culminating in a future Trade War between USA and China before 2030 ?

Wave Theory Of Human Activity
1. Arthurian Generation (1433–1460) (H)
2. Humanist Generation (1461–1482) (A)
3. Reformation Generation (1483–1511) (P)
4. Reprisal Generation (1512–1540) (N)
5. Elizabethan Generation (1541–1565) (H)
6. Parliamentary Generation (1566–1587) (A)
7. Puritan Generation (1588–1617) (P)
8. Cavalier Generation (1618–1647) (N)
9. Glorious Generation (1648–1673) (H)
10. Enlightenment Generation (1674–1700) (A)
11. Awakening Generation (1701–1723) (P)
12. Liberty Generation (1724–1741) (N)
13. Republican Generation (1742–1766) (H)
14. Compromise Generation (1767–1791) (A)
15. Transcendental Generation (1792–1821) (P)
16. Gilded Generation (1822–1842) (N)
17. Progressive Generation (1843–1859) (A)
18. Missionary Generation (1860–1882) (P)
19. Lost Generation (1883–1900) (N)
20. G.I. Generation (1901–1924) (H)
21. Silent Generation (1925–1942) (A)
22. Baby Boom Generation (1943–1960) (P)
23. Generation X (Gen X) (1961–1981) (N)
24. Millennial Generation (Gen Y) (1982–2004) (H)
25. Homeland Generation (Gen Z) (2005-present) (A)
• Industrial / Technology Arms Races – 25 years
– American Civil War - 1863
– Anglo-Chinese Opium War - 1888
– The Great War - 1914
– The Second World War – 1939
• Geo-political Rivalry and Conflict – 20 years
(Olympic Games Years - even decades)
– The Second World War - 1940
– Malayan Emergency - 1960
– Russian War in Afghanistan - 1980
– Balkan Conflict – 2000
– Culminating in a future Middle East Conflict by
2020 ?
• Geo-political Rivalry and Conflict – 20 years
(Football World Cup years - odd decades)
– Korean War - 1950
– Vietnam War - 1970
– 1st Gulf War - 1990
– “Arab Spring” Uprisings – 2010
– Culminating in a future Trade War between USA
and China by 2030 ?
Generation and Century Waves – Human Conflict:- Technology and Innovation waves

Human Activity Cycles
LONG PERIOD HUMAN ACTIVITY WAVES
• Culture Moments – Major Human Activity achievements - Technology, Culture and History
• Industrial Cycles –phases of evolution for any given industry at a specific location / time
• Technology Shock Waves – Stone, Agriculture, Bronze, Iron, Steam, Information Ages etc.
– Stone – Tools for Hunting, Crafting Artefacts and Making Fire
– Fire – Combustion for Warmth, Cooking and changing the Environment
– Agriculture – Neolithic Age Human Settlements
– Bronze – Bronze Age Cities and Urbanisation
– Ship Building – Communication, Culture and Trade
– Iron – Iron Age Empires, Armies and Warfare
– Gun-powder – Global Imperialism and Colonisation
– Coal – Mining, Manufacturing and Mercantilism
– Engineering – Bridges, Boats and Buildings
– Steam Power – Industrialisation and Transport
– Chemistry – Dyestuff, Drugs, Explosives and Agrochemicals
– Internal Combustion – Fossil Fuel dependency
– Physics – Satellites and Space Technology
– Nuclear Fission – Globalisation and Urbanisation
– Digital Communications – The Information Age
– Smart Cities of the Future – The Solar Age – Renewable Energy and Sustainable Societies
– Nuclear Fusion– The Hydrogen Age - Inter-planetary Human Settlements
– Space-craft Building – The Exploration Age - Inter-stellar Cities and Galactic Urbanisation
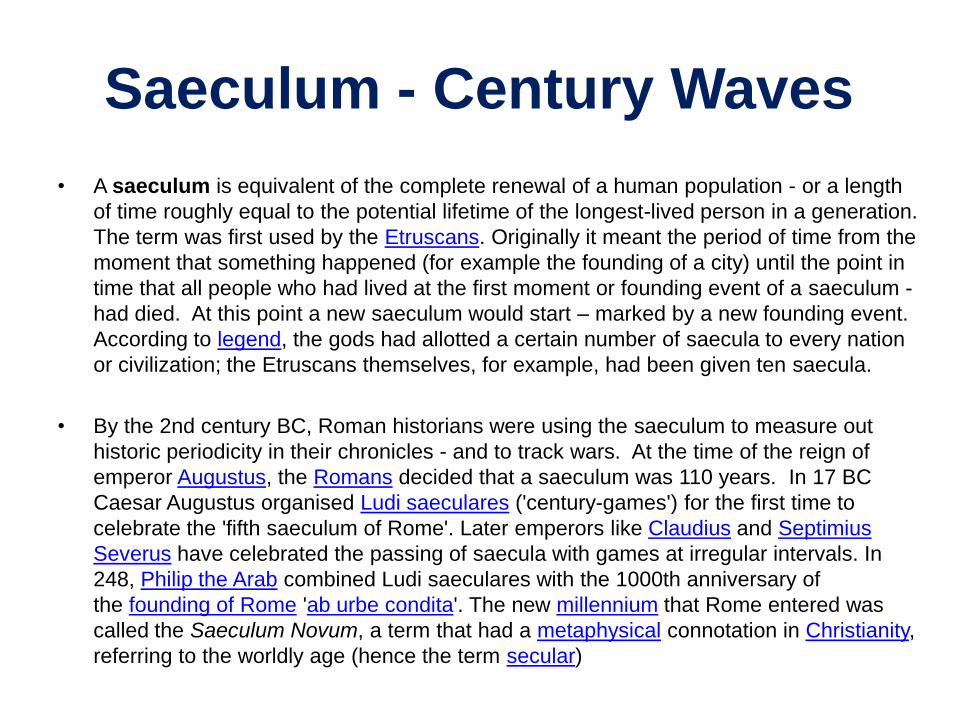
• A saeculum is equivalent of the complete renewal of a human population - or a length
of time roughly equal to the potential lifetime of the longest-lived person in a generation.
The term was first used by the Etruscans. Originally it meant the period of time from the
moment that something happened (for example the founding of a city) until the point in
time that all people who had lived at the first moment or founding event of a saeculum -
had died. At this point a new saeculum would start – marked by a new founding event.
According to legend, the gods had allotted a certain number of saecula to every nation
or civilization; the Etruscans themselves, for example, had been given ten saecula.
• By the 2nd century BC, Roman historians were using the saeculum to measure out
historic periodicity in their chronicles - and to track wars. At the time of the reign of
emperor Augustus, the Romans decided that a saeculum was 110 years. In 17 BC
Caesar Augustus organised Ludi saeculares ('century-games') for the first time to
celebrate the 'fifth saeculum of Rome'. Later emperors like Claudius and Septimius
Severus have celebrated the passing of saecula with games at irregular intervals. In
248, Philip the Arab combined Ludi saeculares with the 1000th anniversary of
the founding of Rome 'ab urbe condita'. The new millennium that Rome entered was
called the Saeculum Novum, a term that had a metaphysical connotation in Christianity,
referring to the worldly age (hence the term secular)
Saeculum - Century Waves

Saeculum – Strauss & Howe Generation Type Birth years Formative era
Late Medieval Saeculum
Arthurian Generation Hero (Civic) 1433-1460 (27) Unravelling: Retreat from France
Humanist Generation Artist (Adaptive) 1461–1482 (21) Crisis: War of the Roses
Reformation Saeculum (104)
Reformation Generation Prophet (Idealist) 1483–1511 (28) High: Tudor Renaissance
Reprisal Generation Nomad (Reactive) 1512–1540 (28) Awakening: Protestant Reformation
Elizabethan Generation Hero (Civic) 1541–1565 (24) Unraveling: Intolerance and Martyrdom
Parliamentary Generation Artist (Adaptive) 1566–1587 (21) Crisis: Armada Crisis
New World Saeculum (112)
Puritan Generation Prophet (Idealist) 1588–1617 (29) High: Merrie England
Cavalier Generation Nomad (Reactive) 1618–1647 (29) Awakening: Puritan Awakening
Glorious Generation Hero (Civic) 1648–1673 (25) Unraveling: Reaction and Restoration
Enlightenment Generation Artist (Adaptive) 1674–1700 (26) Crisis: King Philip's War, Glorious Revolution
Revolutionary Saeculum (90)
Awakening Generation Prophet (Idealist) 1701–1723 (22) High: Augustan Age of Empire
Liberty Generation Nomad (Reactive) 1724–1741 (17) Awakening: Great Awakening
Republican Generation Hero (Civic) 1742–1766 (24) Unraveling: French and Indian War
Compromise Generation Artist (Adaptive) 1767–1791 (24) Crisis: American Revolution
Civil War Saeculum (67)
Transcendental Generation Prophet (Idealist) 1792–1821 (29) High: Era of Good Feeling
Gilded Generation Nomad (Reactive) 1822–1842 (20) Awakening: Transcendental Awakening
Progressive Generation Hero (Civic) 1843–1859 (16) Unravelling: Slavery abolished - British Empire
Missionary Generation Artist (Adaptive) 1860–1882 (22) Crisis: American Civil War

Saeculum – Strauss & Howe Generation Type Birth years Formative era
Great Power Saeculum (85)
Missionary Generation Prophet (Idealist) 1860–1882 (22) High: Reconstruction/Gilded Age
Lost Generation Nomad (Reactive) 1883–1900 (17) Awakening: Missionary Awakening
G.I. Generation Hero (Civic) 1901–1924 (23) Unravelling: World War I/Prohibition
Silent Generation Artist (Adaptive) 1925–1942 (17) Crisis: Great Depression/World War II
Millennial Saeculum (65+)
Baby Boom Generation Prophet (Idealist) 1943–1960 (17) High: Superpower America
Generation X1
"13th Generation" Nomad (Reactive) 1961–1981 (20) Awakening: Consciousness Revolution
Millennial Generation2 Hero (Civic) 1982–2004 (22) Unravelling: Culture Wars, Postmodernism
Homeland Generation3,4 Artist (Adaptive) 2005–present Crisis: Climate Change, War on Terror,
Global Financial Crisis
The current saeculum runs from the start of WWI in 1914 and so ends in 2015 – the same
time as the current 50-year Kondriatev Wave also ends. The new saeculum can mark the
beginning of a new period of unprecedented growth and prosperity – or global crisis. Strauss
and Howe have defined all of the saeculae over the past 600 years based on Anglo-American
history, from the start of the Protestant Reformation until the present day. In common usage,
a saeculum is not usually allocated to any fixed time period, but any duration from 80 up to
100 years. Saeculae may be divided into four "seasons" or generations of 15-30 years each;
Strauss and Howe represent these seasons as youth, rising adulthood, midlife, and old age.
The basis of the Strauss and Howe saeculum definition is, however, somewhat debatable.....

Saeculum - Century Waves
• In their book Generations, William Strauss and Neil Howe introduce a fascinating theory
that interprets the whole of Western history in terms of a repeating series of four basic
types of generations. Innovation Generations create technology, which drives economies,
and the wealth created in turn influences the social and political ambitions of their peers. In
their follow-up work, The Fourth Turning, Strauss and Neil Howe propose that history
moves in long cycles or waves, each of four or five generations duration, which they call
the saeculum, after the ancient Etruscan cycle of a similar length. The saeculum contains
four or five periods, called turnings, or a sequence of generations - each associated with
a unique set of Technology Shock Waves - a clustered series of technology Innovations
that are discovered, developed, exploited, plateau and are then replaced and phased out.
• The Lost generation, born at the end of the nineteenth century, and Generation X have
similar peer personalities, making them the same generation type. The Lost generation
were the conservative elders of the Edwardian Period, who tended to be conservative not
because they were old - but because they had been born into a more conservative society.
Similarly, today's elder generation are more liberal because they were born (baby boom)
and grew up (1960s) in a more liberal post-war society. Strauss and Howe might argue
that the move towards the political right over the last couple of decades, and the liberal era
before that - simply reflect the impact of different combinations of generations in the adult
stages of life occupying the Power-bases in Political, Economic and Social Structures.

Saeculum - Century Waves
• Table 2 illustrates this by comparing Strauss and Howe Social Moment turnings (the period
of generational length that encompass Social Moments) with McLoughlin's awakenings.
Strauss and Howes’ Awakening turnings are located 16-27 years from the nearest secular
crisis with an average spacing of 23 years, close to their standard 22 year generation.
• In contrast, McLoughlin's dates are located 6-35 years from the nearest secular crisis and
can hardly be said to be spaced a generation apart from crisis eras. That is, a saeculum
which is defined by McLoughlin Awakenings isn't very regular - suggesting either that such a
regular century cycle may not exist - or at least cannot easily be revealed by a simplistic
survey of a timeline of major historical events.....
Saeculum Spiritual Awakenings Secular Crises*
Strauss and Howe* McLoughlin6
1515 - 1614 1621-1649 1610-1640 1569-1594
1615 - 1714 1727-1746 1730-1760 1675-1704
1715 - 1814 1822-1844 1800-1830 1773-1794
1815 - 1914 1886-1908 1890-1920 1860-1865
1915 - 2014 1964-1984 1960-0000 1929-1946

Social Generations
• Strauss and Howe define a social generation as the aggregate of all people born
over a span of roughly twenty years or about the length of one phase of life:
childhood, young adulthood, midlife, and old age. Generations are identified
(from first year-of-birth to last) by looking for cohort groups of this length that
share three criteria. First, members of a generation share what the authors call
an age location in history: they encounter key historical events and social trends
while occupying the same phase of life. In this view, members of a generation
are shaped in lasting ways by the eras they encounter as children and young
adults and they share certain common beliefs and behaviours. Aware of the
experiences and traits that they share with their peers, members of a generation
would also share a sense of common perceived membership in that generation.
• Strauss and Howe say they based their definition of a generation on the work of
various writers and social thinkers, from ancient writers such as Polybius and Ibn
Khaldun to modern social theorists like José Ortega y Gasset, Karl Mannheim,
John Stuart Mill, Émile Littré, Auguste Comte, and François Mentré.[19]

Saeculum - Century Waves
Saeculum Spiritual Awakenings Secular Crises*
Strauss and Howe* McLoughlin6
1515 - 1614 1621-1649 1610-1640 1569-1594
1615 - 1714 1727-1746 1730-1760 1675-1704
1715 - 1814 1822-1844 1800-1830 1773-1794
1815 - 1914 1886-1908 1890-1920 1860-1865
1915 - 2014 1964-1984 1960-0000 1929-1946
Saeculum Strauss-Howe
Cycle
Spiritual Awakening Secular Crisis
1415 - 1514 Pre-Columbian Renaissance (1517-1539) Wars of the Roses (1455-1487)
1515 - 1614 Columbian Reformation (1517-1539) Spanish Armada (1580-1588)
1615 - 1714 Colonial Puritan Awakening (1621-1640) Glorious Revolution (1675-1692)
1715 - 1814 Revolutionary Great Awakening (1734-1743) American Revolution (1773-1789)
1815 - 1914 Victorian Transcendental Awakening (1822-1837) American Civil War (1857-1865)
1915 - 2014 Great Power Missionary Awakening (1886-1903) WWI, Depression & WWII (1932-1945)
Cold War Baby Boom Awakening (1967-1980) Regional War, Terrorism and Insecurity
Millennial Post-Cold War Awakening (2000-2014) Regional War, Terrorism and Insecurity

Generational Archetypes and Turnings
Turnings • While writing Generations, Strauss and Howe discovered a pattern in the historical generations they examined which
revolved around generational events which they call turnings. In Generations, and in greater detail in The Fourth Turning,
they identify the four-stage cycle of social or mood eras (i.e. turnings).
High • According to Strauss and Howe, the First Turning is a High. This is a post-Crisis era when institutions are strong and
individualism is weak. Society is confident about where it wants to go collectively, though those outside the majoritarian
centre often feel stifled by the conformity.[20]
• According to the authors, America’s most recent First Turning was the post-World War II American High, beginning in
1946 and ending with the assassination of President John F. Kennedy on November 22, 1963. The Silent Generation
(Artist archetype, born 1925 to 1942) came of age during this era. Known for their caution, conformity, and institutional
trust, Silent young adults epitomized the mood of the High. Most married early, sought stable corporate jobs, and moved
into new suburbs.[21]
Awakening • According to the theory, the Second Turning is an Awakening. This is an era when institutions are attacked in the name
of personal and spiritual autonomy. Just when society is reaching its high tide of public progress, people suddenly tire of
social discipline and want to recapture a sense of personal authenticity. Young activists look back at the previous High as
an era of cultural and spiritual poverty.[22]
• America’s most recent Awakening was the “Consciousness Revolution,” which spanned from the campus and inner-city
revolts of the mid-1960s to the reelection of Ronald Reagan. The Boom Generation (Prophet archetype, born 1943 to
1960) came of age during this era. Their idealism and search for authentic self-expression epitomized the mood of the
Awakening.[23]

Generational Archetypes and Turnings
Unraveling • According to Strauss and Howe, the Third Turning is an Unraveling. The mood of this era is in many ways the
opposite of a High: Institutions are weak and distrusted, while individualism is strong and flourishing. Highs come after
Crises, when society wants to coalesce and build. Unravelings come after Awakenings, when society wants to atomize
and enjoy.
• America’s most recent Unraveling was the Long Boom and Culture War, beginning in the mid-1980s and ending in the
late 2000s. The era began during the second term of (Reagan’s “Morning in America”), which eventually developed
into a "debased" popular culture, a pervasive distrust of institutions and leaders, and the splitting of national consensus
into competing “values” camps. Generation X (Nomad archetype, born 1961–1981) came of age during this era.
Crisis • According to the authors, the Fourth Turning is a Crisis. This is an era in which institutional life is destroyed and rebuilt
in response to a perceived threat to the nation’s survival. Civic authority revives, cultural expression redirects towards
community purpose, and people begin to locate themselves as members of a larger group. Fourth Turnings have all
been new “founding moments” in America’s history, moments that redefined the national identity.[25] America’s most
recent Fourth Turning began with the stock market crash of 1929 and climaxed with the end of World War II. The G.I.
Generation (a Hero archetype, born 1901 to 1924) came of age during this era. Their confidence, optimism, and
collective outlook epitomized the mood of the era.[26] Today’s youth, the Millennial Generation (Hero archetype, born
1982 to 2004), show many traits similar to those of the G.I. youth, including rising civic engagement, improving
behavior, and collective confidence.[27]

Saeculum - Century Waves
• The situation for spiritual awakenings is even more problematic. The spiritual awakenings in
Table 1 roughly correspond to periods of religious fervour identified by historian William
McLoughlin in his book Revivals, Awakenings and Reform..
• McLoughlin defines awakenings as periods of cultural revision caused by a crisis in value
and belief systems - producing a reorientation in those values and beliefs. McLoughlin
identifies awakenings in 1610-40, 1730-60, 1800-30, and 1890-1920.6 Comparison of these
dates with those for spiritual awakenings in Table 1 shows a rough correspondence. The
spiritual awakenings are subsets of the McLoughlin Cycles and tend to be located midway
between secular crises so that a regular pattern of alternating social moments is evident.
Saeculum McLaughlin Cycle Spiritual Awakening Secular Crisis
1415 - 1514 Pre-Columbian Renaissance (1517-1539) Wars of the Roses (1455-1487)
1515 - 1614 Columbian The Reformation (1517-1539) Spanish Armada (1569-1594)
1615 - 1714 Colonial Early Enlightenment (1610-1640) English Civil War (1675-1704)
1715 - 1814 Revolutionary Late Enlightenment (1730-1760) American Revolution (1773-1794)
1815 - 1914 Victorian Transcendental (1800-1830) Napoleonic Wars (1860-1865)
1915 - 2014 Loss of Empires Missionary Awakening (1890-1920) WWI, Depression & WWII (1929-1946)
Cold War Baby Boom Awakening (1960-1980) Regional Wars, Terrorism, Insecurity
Millennial 21st century Awakening (2000 - 2014) Regional Wars, Terrorism, Insecurity

Saeculum - Century Waves
Saeculum - Century Waves – Human Conflict, Technology Arms Race & Innovation cycles: -
• Industrial / Technology Arms Race Saeculum – 100 years / generation intervals @ 25 years
– American Civil War - 1863
– Anglo-Chinese Opium War - 1888
– The Great War - 1914
– The Second World War – European Theatre 1939
• Cold War Geo-political Rivalry and Conflict – @ 20 years (Olympic Games - even decades)
– The Second World War – Pacific Theatre 1940
– Malayan Emergency - 1960
– Russian War in Afghanistan - 1980
– Balkan Conflict – 2000
– Culminating in a future Middle East Conflict by 2020 ?
• Cold War Geo-political Rivalry and Conflict – @ 20 years (Soccer World Cup - odd decades)
– Korean War - 1950
– Vietnam War - 1970
– 1st Gulf War - 1990
– “Arab Spring” Uprisings – 2010
– Culminating in a future Trade War between USA and China by 2030 ?

Wave Theory Of Human Activity
1. Arthurian Generation (1433–1460) (H)
2. Humanist Generation (1461–1482) (A)
3. Reformation Generation (1483–1511) (P)
4. Reprisal Generation (1512–1540) (N)
5. Elizabethan Generation (1541–1565) (H)
6. Parliamentary Generation (1566–1587) (A)
7. Puritan Generation (1588–1617) (P)
8. Cavalier Generation (1618–1647) (N)
9. Glorious Generation (1648–1673) (H)
10. Enlightenment Generation (1674–1700) (A)
11. Awakening Generation (1701–1723) (P)
12. Liberty Generation (1724–1741) (N)
13. Republican Generation (1742–1766) (H)
14. Compromise Generation (1767–1791) (A)
15. Transcendental Generation (1792–1821) (P)
16. Gilded Generation (1822–1842) (N)
17. Progressive Generation (1843–1859) (A)
18. Missionary Generation (1860–1882) (P)
19. Lost Generation (1883–1900) (N)
20. G.I. Generation (1901–1924) (H)
21. Silent Generation (1925–1942) (A)
22. Baby Boom Generation (1943–1960) (P)
23. Generation X (Gen X) (1961–1981) (N)
24. Millennial Generation (Gen Y) (1982–2004) (H)
25. Homeland Generation (Gen Z) (2005-present) (A)
• Industrial / Technology Arms Races – 25 years
– American Civil War - 1863
– Anglo-Chinese Opium War - 1888
– The Great War - 1914
– The Second World War – 1939
• Geo-political Rivalry and Conflict – 20 years
(Olympic Games Years - even decades)
– The Second World War - 1940
– Malayan Emergency - 1960
– Russian War in Afghanistan - 1980
– Balkan Conflict – 2000
– Culminating in a future Middle East Conflict by
2020 ?
• Geo-political Rivalry and Conflict – 20 years
(Football World Cup years - odd decades)
– Korean War - 1950
– Vietnam War - 1970
– 1st Gulf War - 1990
– “Arab Spring” Uprisings – 2010
– Culminating in a future Trade War between USA
and China by 2030 ?
Generation and Century Waves – Human Conflict:- Technology and Innovation waves

Generation Wave Archetypes
Prophet • Abraham Lincoln, born in 1809. Strauss and Howe would identify him as a member of the Transcendental generation.
• Prophet generations are born near the end of a Crisis, during a time of rejuvenated community life and consensus
around a new societal order. Prophets grow up as the increasingly indulged children of this post-Crisis era, come of
age as self-absorbed young crusaders of an Awakening, focus on morals and principles in midlife, and emerge as
elders guiding another Crisis.[44]
• Due to their location in history, such generations tend to be remembered for their coming-of-age fervor and their
values-oriented elder leadership. Their main societal contributions are in the area of vision, values, and religion. Their
best-known historical leaders includeJohn Winthrop, William Berkeley, Samuel Adams, Benjamin Franklin, James
Polk, Abraham Lincoln, Herbert Hoover, and Franklin Roosevelt. These people were principled moralists who waged
idealistic wars and incited others to sacrifice. Few of them fought themselves in decisive wars, and they are
remembered more for their inspiring words than for great actions. (Example among today’s living generations: Baby
Boomers.)
Nomad • Nomad generations are born during an Awakening, a time of social ideals and spiritual agendas, when young adults
are passionately attacking the established institutional order. Nomads grow up as under-protected children during this
Awakening, come of age asalienated, post-Awakening adults, become pragmatic midlife leaders during a Crisis, and
age into resilient post-Crisis elders.[44]
• Due to their location in history, such generations tend to be remembered for their adrift, alienated rising-adult years
and their midlife years of pragmatic leadership. Their main societal contributions are in the area of liberty,
survival and honor. Their best-known historical leaders include Nathaniel Bacon, William Stoughton, George
Washington, John Adams, Ulysses Grant, Grover Cleveland, Harry Truman, and Dwight Eisenhower. These were
shrewd realists who preferred individualistic, pragmatic solutions to problems. (Example among today’s living
generations: Generation X.[45])
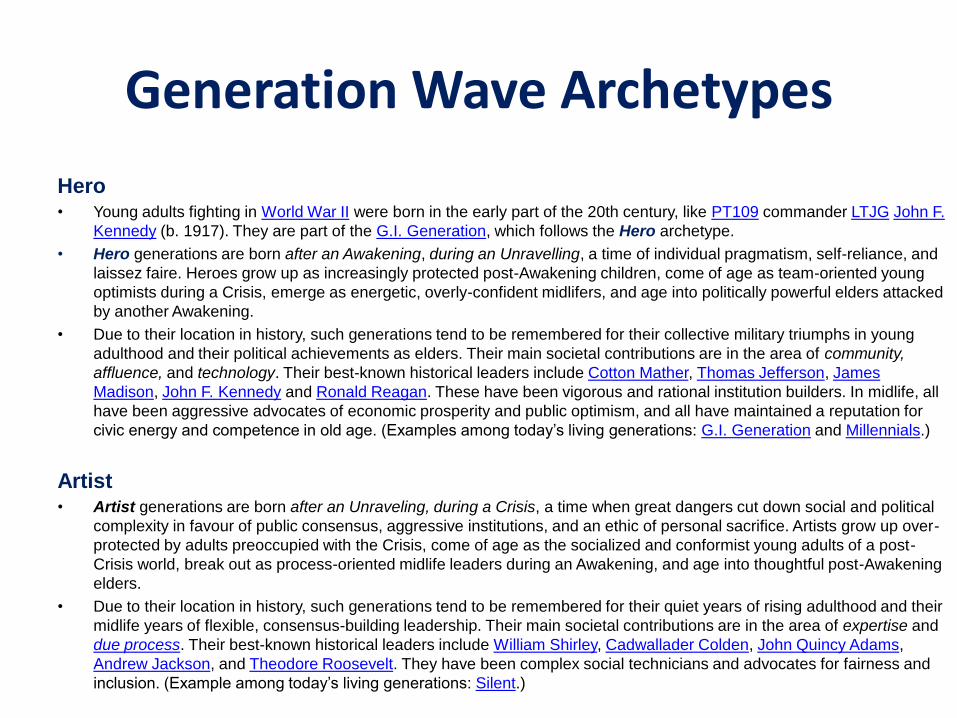
Generation Wave Archetypes
Hero • Young adults fighting in World War II were born in the early part of the 20th century, like PT109 commander LTJG John F.
Kennedy (b. 1917). They are part of the G.I. Generation, which follows the Hero archetype.
• Hero generations are born after an Awakening, during an Unravelling, a time of individual pragmatism, self-reliance, and
laissez faire. Heroes grow up as increasingly protected post-Awakening children, come of age as team-oriented young
optimists during a Crisis, emerge as energetic, overly-confident midlifers, and age into politically powerful elders attacked
by another Awakening.
• Due to their location in history, such generations tend to be remembered for their collective military triumphs in young
adulthood and their political achievements as elders. Their main societal contributions are in the area of community,
affluence, and technology. Their best-known historical leaders include Cotton Mather, Thomas Jefferson, James
Madison, John F. Kennedy and Ronald Reagan. These have been vigorous and rational institution builders. In midlife, all
have been aggressive advocates of economic prosperity and public optimism, and all have maintained a reputation for
civic energy and competence in old age. (Examples among today’s living generations: G.I. Generation and Millennials.)
Artist • Artist generations are born after an Unraveling, during a Crisis, a time when great dangers cut down social and political
complexity in favour of public consensus, aggressive institutions, and an ethic of personal sacrifice. Artists grow up over-
protected by adults preoccupied with the Crisis, come of age as the socialized and conformist young adults of a post-
Crisis world, break out as process-oriented midlife leaders during an Awakening, and age into thoughtful post-Awakening
elders.
• Due to their location in history, such generations tend to be remembered for their quiet years of rising adulthood and their
midlife years of flexible, consensus-building leadership. Their main societal contributions are in the area of expertise and
due process. Their best-known historical leaders include William Shirley, Cadwallader Colden, John Quincy Adams,
Andrew Jackson, and Theodore Roosevelt. They have been complex social technicians and advocates for fairness and
inclusion. (Example among today’s living generations: Silent.)

Generation and Century Waves Saeculum McLaughlin
Cycle
Spiritual Age High, Awakening,
Secular Crisis
Strauss-Howe
Generation
Generation
Date / Type
1415 - 1514 Pre-Columbian Renaissance
(1517-1539) Retreat from France
Arthurian Generation 1433–1460) (H)
Wars of the Roses
(1455-1487) War of the Roses
Humanist Generation 1461–1482) (A)
High: Tudor Renaissance Reformation Generation 1483–1511) (P)
1515 - 1614 Columbian Reformation
(1517-1539) Protestant Reformation
Reprisal Generation 1512–1540) (N)
Spanish Armada
(1580-1588) Intolerance and Martyrdom
Elizabethan Generation 1541–1565) (H)
Crisis: Armada Crisis Parliamentary Generation 1566–1587) (A)
High: Merrie England Puritan Generation 1588–1617) (P)
1615 - 1714 Colonial Early Enlightenment
(1610-1640)
English Civil War
(1675-1704)
Cavalier Generation 1618–1647) (N)
Reaction and Restoration Glorious Generation 1648–1673) (H)
Crisis: King Philip's War,
Glorious Revolution Enlightenment Generation 1674–1700) (A)
1715 - 1814 Revolutionary Late Enlightenment
(1730-1760)
American Revolution
(1773-1794)
Awakening Generation 1701–1723) (P)
Great Awakening Liberty Generation 1724–1741) (N)
French and Indian War Republican Generation 1742–1766) (H)
Crisis: American Revolution Compromise Generation 1767–1791) (A)
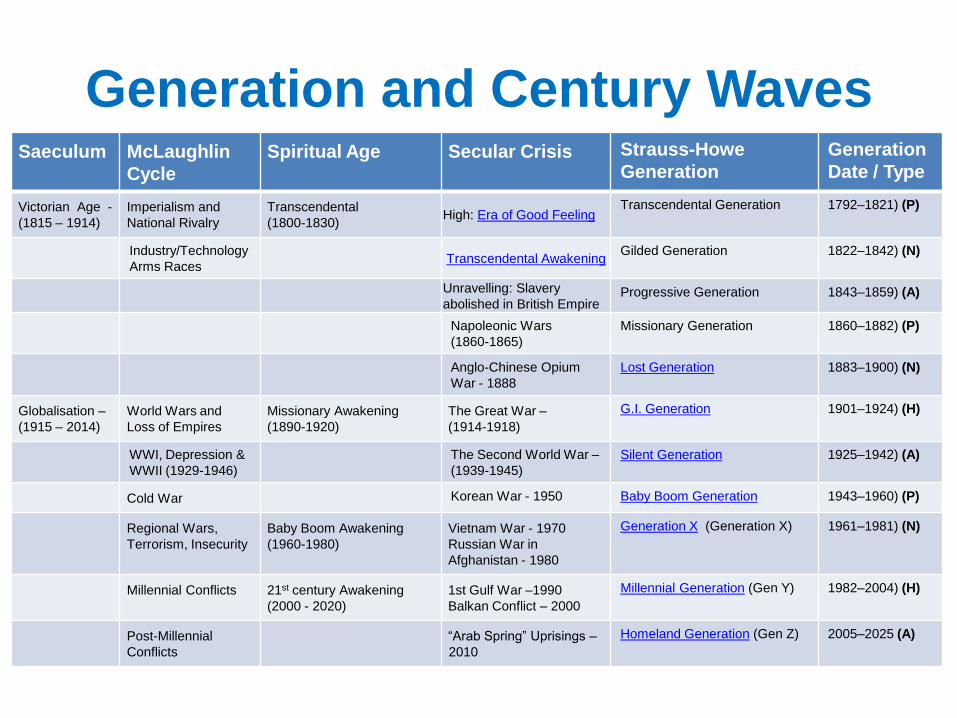
Generation and Century Waves Saeculum McLaughlin
Cycle
Spiritual Age Secular Crisis Strauss-Howe
Generation
Generation
Date / Type
Victorian Age -
(1815 – 1914)
Imperialism and
National Rivalry
Transcendental
(1800-1830) High: Era of Good Feeling
Transcendental Generation 1792–1821) (P)
Industry/Technology
Arms Races Transcendental Awakening
Gilded Generation 1822–1842) (N)
Unravelling: Slavery
abolished in British Empire Progressive Generation 1843–1859) (A)
Napoleonic Wars
(1860-1865)
Missionary Generation 1860–1882) (P)
Anglo-Chinese Opium
War - 1888
Lost Generation 1883–1900) (N)
Globalisation –
(1915 – 2014)
World Wars and
Loss of Empires
Missionary Awakening
(1890-1920)
The Great War –
(1914-1918)
G.I. Generation 1901–1924) (H)
WWI, Depression &
WWII (1929-1946)
The Second World War –
(1939-1945)
Silent Generation 1925–1942) (A)
Cold War Korean War - 1950 Baby Boom Generation 1943–1960) (P)
Regional Wars,
Terrorism, Insecurity
Baby Boom Awakening
(1960-1980)
Vietnam War - 1970
Russian War in
Afghanistan - 1980
Generation X (Generation X) 1961–1981) (N)
Millennial Conflicts 21st century Awakening
(2000 - 2020)
1st Gulf War –1990
Balkan Conflict – 2000
Millennial Generation (Gen Y) 1982–2004) (H)
Post-Millennial
Conflicts
“Arab Spring” Uprisings –
2010
Homeland Generation (Gen Z) 2005–2025 (A)

Generation and Century Waves Saeculum McLaughlin
Cycle
Spiritual Age High, Awakening,
Secular Crisis
Strauss-Howe
Generation
Generation
Date / Type
2015-2114 Post-Millennial 21st century Apocalypse
(2020 - 2040)
Global Food, Energy and
Water (FEW) Crisis
Apocalyptic Generation (Gen A) 2025–2050 (P)
Post-Apocalyptic
Realisation (2040 - 2060)
Wars, Disease, Famine ,
Terrorism and Insecurity
Post-Apocalyptic Generation
(Gen B)
2050–2070 (N)
Post-Apocalyptic Recovery
(2040 - 2060)
Wars, Disease, Famine ,
Terrorism and Insecurity
Recovery Generation (Gen C) 2070–2090) (H)
The current saeculum starts at the beginning of WWI in 1914, and so ends 100 years later in
2015 – which is the same time as the current 50-year Kondriatev Infrastructure Investment Wave
also ends. A new saeculum can mark the beginning of a either a period of unprecedented growth
and prosperity – or of global crisis. From 2015, a number of Economic Cycles rise together.
Strauss and Howe have based their definition of all of the saecula during the past 600 years on
Anglo-American history - from the start of the Protestant Reformation until the present day. In
common usage, the term saeculum is not usually allocated to any fixed period of time, but may
be of any duration from 80 up to 100 years. Saecula may be divided into four generations or
"seasons" varying between15-30 years each; Strauss and Howe represent these seasons as
youth, rising adulthood, midlife, and old age. This basis for Strauss and Howe generations and
saecula definition is somewhat arbitrary and debatable. McLaughlin, however, makes a much
better fist of his definition of generations and saecula.

Saeculum - Century Waves
• One example of the effect of succession changing generational membership is the
decline in community spirit across American society over the post-war decades. In
his intriguing book Bowling Alone, Robert Putnam proposes that the succession
of a civic-minded pre-war generation and gradual replacement with the markedly
more individualistic, self-confident and self-centric baby boomers is responsible for
about half of this decline. In a particularly striking figure, Putnam documents
downward trends in eight measures of Civic Engagement by year-of-birth.
• For seven of the eight measures, this decline either begins or accelerates in the
late 1920's to early 1930's period. People born after the early 1930's are less
active in their community than those born before, and this trend towards less
engagement accelerates with more recent birth years. Strauss and Howe would
explain the trends that Putnam describes as being the result of the succession of
generations having peer personalities characterized by decreasing levels of civic-
responsibility and public-orientation. Their GI generation (b 1901-24) has a peer
personality of a particularly civic-minded type - in stark contrast to the GI's are the
Baby Boomers Generation X and Generation Z – all of which have highly-focused
and individualistic peer personalities, as evidenced by the growth in Social Media.


Saeculum - Century Waves
• The peer personality of a particular generation is shaped by the generation's historical
location relative to a social moment. A social moment is an era, typically lasting about a
decade, when people perceive that historical events are radically altering their social
environment. Thus, a generation's peer personality (what makes it a particular kind of
generation) depends on when they were born relative to particularly eventful periods in
history. There are two types of social moments: secular crises, when society focuses on
reordering the outer world of institutions and public behaviour; and spiritual awakenings,
when society focuses on changing the inner world of values and private behaviour.
• What constitutes the saeculum is not the regularly repeating series of social moments –
but technology innovation. If succession moments occurred sporadically, a regular series
of generations would not be created and there would be no saeculum. Strauss and Howe
list six spiritual awakenings and five secular crises (Table 1) spaced 88 years apart on
average as their primary evidence for the existence of regularly spaced social moments.
• They propose generations reflect the experience of living through a social moment which
is triggered at a particular phase of life by economic wealth from innovation. The phases of
life are youth (age 0-21), rising adulthood (age 22-43), maturity (age 44-65) and elderhood
(age 66-87). They are 22 years in length and four of them comprise an 88-year saeculum,
which neatly dovetails with the average spacing of social moments of the same type.
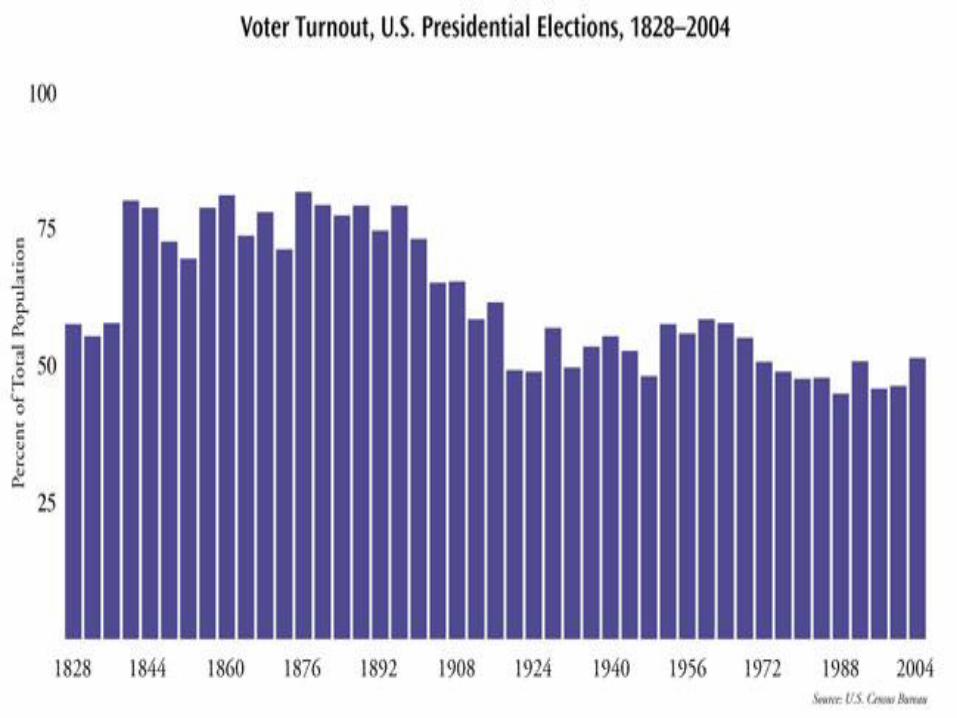

Robert Putnam
• The effect of
succession-
changing
generational
membership on
trends in Social
Connectivity
• Have Smart
Apps and
Social Media
replaced Face-
2-face human
contact and
attending group
social events in
creating and
maintaining
Social Networks ?

BIBLOGRAPHY
Bohm-Bawerk, Eugen. 1891. The Positive Theory of Capital. London: Macmillan and Co.
Garrison, Roger. 2001. Time and Money: the Macroeconomics of Capital Structure. New York: Routledge.
Garrison, Roger. 2007. “Capital-Based Macroeconomics,” on-line slide show,
http://www.slideshare.net/fredypariapaza/capitalbased-macroeconomics, accessed 10/6/07.
Hayek, Friedrich A. [1931] 1966a. Prices and Production. New York: Augustus M. Kelley Publishers.
Hayek, Friedrich A. [1933] 1966b. Monetary Theory and the Trade Cycle. New York: Augustus M. Kelley.
Hayek, Friedrich A. 1995. Contra Keynes and Cambridge: Essays, Correspondence. Edited by Bruce Caldwell.
Chicago: University of Chicago.
Hoppe, Hans-Hermann. 1993. The Economics and Ethics of Private Property. Boston: Kluwer Academic.
Keynes, John M. 1931. “The Pure Theory of Money. A Reply to Dr. Hayek.” Economica (11) 34, 387-397.
Kurz, Heinz D. 1990. Capital, Distribution and Effective Demand: Studies in the “Classical Approach” to Economic
Theory. Cambridge, UK: Polity Press.
Kurz, Heinz and Salvadori, Neri. 1992. Theory of Production I. Milan: Instituto di ricera sulla Dinamica dei Sistemi
Economoci (IDSE).
Menger, Carl. [1871] 1950. Principles of Economics. Glencoe, IL: Free Press.
Mises, Ludwig. [1932] 1990. “The Non-Neutrality of Money”, in Money, Method and the Market Process, Richard M.
Ebeling, ed., from lecture given to New York City Economics Club. Norwell, MA: Kluwer Academic Publishers.
Mulligan, Robert F. 2006. “An Empirical Examination of Austrian Business Cycle Theory.” Quarterly Journal of Austrian
Economics 9 (2), 69-93.
Schumpeter, Joseph R. 1950. Capitalism, Socialism and Democracy. New York: Harper & Row.
Econometrics
How should the progress and development of a Sovereign Nation States
be measured and compared ?


Econometrics
• Econometrics is the application of statistical and mathematical techniques to
competing economic theories for the purpose of forecasting future trends and
risks. This takes economic models and time-series data sets through
statistical trials in order to test, verify and validate alternative hypotheses.
Collaboration between academia, government and the financial services
industry is improving the understanding of economic theory and econometric
modelling and advancing the homogeneity and integration of competing
economic theories and models, especially wherever suitable time-series data
sets exist to support model evaluation and benchmarking.
Competing theories and conflicting models underling fiscal policy analysis and
market risk evaluation are now being given a more sympathetic treatment and
satisfactory integration. Even now, attempts are being made to resolve those
factors of heterogeneity and conflict in economic modelling – an essential
condition for the development of a “standard economic theory” integrating
macro- and micro-economic views within a universally valid “standard
economic risk framework”.

Econometrics
• Economic theory makes statements or hypotheses that are mostly qualitative in nature. For example, microeconomic theory states that, other things remaining the same, a reduction in the price of a commodity is expected to increase the quantity demanded of that commodity. Thus, economic theory postulates a negative or inverse relationship between the price and quantity demanded of a commodity. But the theory itself does not provide any numerical measure of the relationship between the two; that is, it does not tell by how much the quantity will go up or down as a result of a certain change in the price of the commodity. It is the job of the econometrician to provide such numerical estimates. Stated differently, econometrics gives empirical content to most economic theory.
• The main concern of mathematical economics is to express economic theory modelled in mathematical form (equations) without regard to measurability or empirical verification of the theory. Econometrics, as noted previously, is mainly interested in the empirical verification of economic theory. As we shall see, the econometrician often uses the mathematical equations proposed by the mathematical economist but translates, transposes and transforms these equations in such a form that they lend themselves to empirical testing, verification and validation. This conversion of econometric theories and hypotheses into mathematical and statistical models and equations requires a great deal of ingenuity and practical skill.

Econometrics
• Economic statistics is mainly concerned with collecting, processing, and presenting highly aggregated and summarised economic data in the form of charts and tables. The low volume, highly summarised economic data collected by the Economic Statistician is not, therefore, the same in either structure or content as the very large volumes of raw atomic-level data required for econometric work.
• Whereas the economic statistician does not go beyond packaging, presenting and publishing their results – not being concerned with using the data collected to test the validity of economic theories – the econometrician analyses the statistical and mathematical equations proposed by the economic statistician and translates, transposes and transforms those equations in such a way as to lend themselves to empirical testing, verification and validation of econometric time-series data sets.
• There are several important implications for empirical modelling in econometrics. Firstly, in econometrics the modeller is, of course, faced with observational time-series historic data - as opposed to experimental data, Second, the modeller is required to master very different skill sets from those needed for manipulating experimental data in the physical sciences. Finally, the segregation of the roles of data collector and data analyst requires that the modeller becomes thoroughly familiar with the nature, structure and content of econometric time-series data sets.
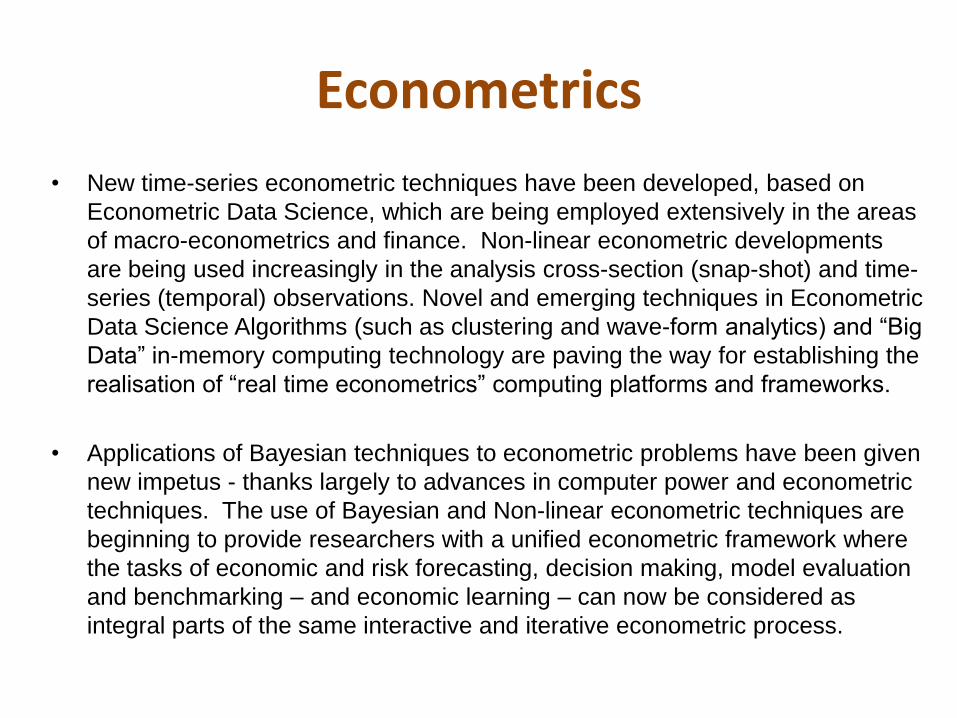
Econometrics
• New time-series econometric techniques have been developed, based on
Econometric Data Science, which are being employed extensively in the areas
of macro-econometrics and finance. Non-linear econometric developments
are being used increasingly in the analysis cross-section (snap-shot) and time-
series (temporal) observations. Novel and emerging techniques in Econometric
Data Science Algorithms (such as clustering and wave-form analytics) and “Big
Data” in-memory computing technology are paving the way for establishing the
realisation of “real time econometrics” computing platforms and frameworks.
• Applications of Bayesian techniques to econometric problems have been given
new impetus - thanks largely to advances in computer power and econometric
techniques. The use of Bayesian and Non-linear econometric techniques are
beginning to provide researchers with a unified econometric framework where
the tasks of economic and risk forecasting, decision making, model evaluation
and benchmarking – and economic learning – can now be considered as
integral parts of the same interactive and iterative econometric process.

Econometrics
• When a governmental agency (e.g., the U.K. Office of Statistics or the U.S. Department of
Commerce) collects economic data, it does not necessarily have any economic theory in
mind as an explanation of the observed data. How does one know that the data really
supports a specific economic theory – such as the Keynesian theory of consumption ?
Is it because the Keynesian consumption function (i.e., the regression line) shown in
Figure I.3 is extremely close to the actual data points? Is it possible that another
consumption model (hypothesis, theory) might equally fit the observed data as well ?
• For example, Milton Friedman developed a model of consumption, called the permanent
income hypothesis. Robert Hall has also developed a model of consumption, called the
life-cycle permanent income hypothesis. Could one or both of these models also fit the
observed data ? In practice, the question facing an economic researcher is how to select
models of a given economic phenomenon among competing economic theories and
hypotheses, such as the nature of the relationship between consumption and income.
• As Miller contends:
• “Any encounter with data is step towards genuine confirmation whenever the hypothesis
does a better job of coping with the data than some natural rival. . . . What strengthens a
hypothesis is a victory which, at the same time, is a defeat for a plausible rival model.....”

Econometrics Methods
• How then does one choose among competing models or hypotheses? Here is the advice given
by Clive Granger. I would like to suggest that in the future, when you are presented with a new
piece of theory or empirical model, it is worth keeping in mind to ask these questions in relation
to the Problem / Opportunity Domain of comparing alternative theories or models: –
1. What is its purpose – which economic phenomena is it attempting to illuminate ?
2. What economic problem, opportunities, risks or decisions does it help to resolve?
3. What evidence is being presented that allows model quality / voracity evaluation ?
• We often come across several competing hypotheses when trying to explain various economic
phenomena. Economics students are familiar with the concept of the production function, which
is basically a relationship between production output and inputs (e.g. capital and labour). Two of
the best known production functions are the Cobb–Douglas function and the constant elasticity
of substitution function. Given data sets on production inputs and outputs, we will need to
discover which of the two production functions - if any – best supports the observed data.
• The multi-step classical econometric methodology discussed below is neutral in the sense that it
can be used to test any of these rival hypotheses. Is it possible to develop an econometric
framework that is comprehensive enough to include the testing, verification and validation of
competing economic theories or hypotheses? This is a much involved and controversial topic.

Econometrics Methods
• There are two important implications for empirical modelling in econometrics. First,
the modeller is required to master very different skill sets from those needed for
analyzing experimental data in the physical sciences. Second, the separation of the
roles of data collector and the data analyst requires that the modeller to becomes
thoroughly familiar with the nature and structure of econometric time-series data sets.
PROBLEM DOMAIN ANALYSIS METHOD
1. Selection of the problem / opportunity domain
2. Description of economic theory or hypothesis.
3. Analysis of the underlying economic principles,
actors and econometric processes of the theory
4. Specification of the logical econometric model
5. Obtaining the time-series / cross-section data
6. Estimation of the scope of the economic theory
7. Hypothesis testing, validation and verification
8. Hypothesis refining and enhancement
9. Economic forecasting and prediction
10. Publishing and communicating the theory
PROBLEM DOMAIN MODELLING METHOD
1. Selection of the Model Framework
2. Definition of the theory or hypothesis.
3. Development of the data model and parameters
4. Design of the mathematical / statistical process
5. Construction of the econometric model functions
6. Data Loading and Model initiation
7. History Matching Runs
8. Model testing, validation and verification
9. Model Tuning Runs
10. Forecasting and Prediction Runs
11. Using the output for risk and policy decisions

Econometrics Methods
• The following diagram outlines the relationship between Theoretical and Applied
Techniques and shows how Theoretical and Applied Techniques are mirrored: -
Linear Systems
Dynamic Systems
Phase Space
Non-linear Systems
CHAOS
Complex Systems
Theoretical Techniques Applied Techniques
1. Classical Economics
2. Scenarios
3. Probability, Voracity
4. Profiling
5. Business Cycles
6. Black Swan Events
1. Determinism – Human Actions
2. Monte Carlo Simulation
3. Bayesian Statistics
4. Clustering Algorithms
5. Wave-form Algorithms
6. Stochastic Events
Differential Equations
Adaptive Systems
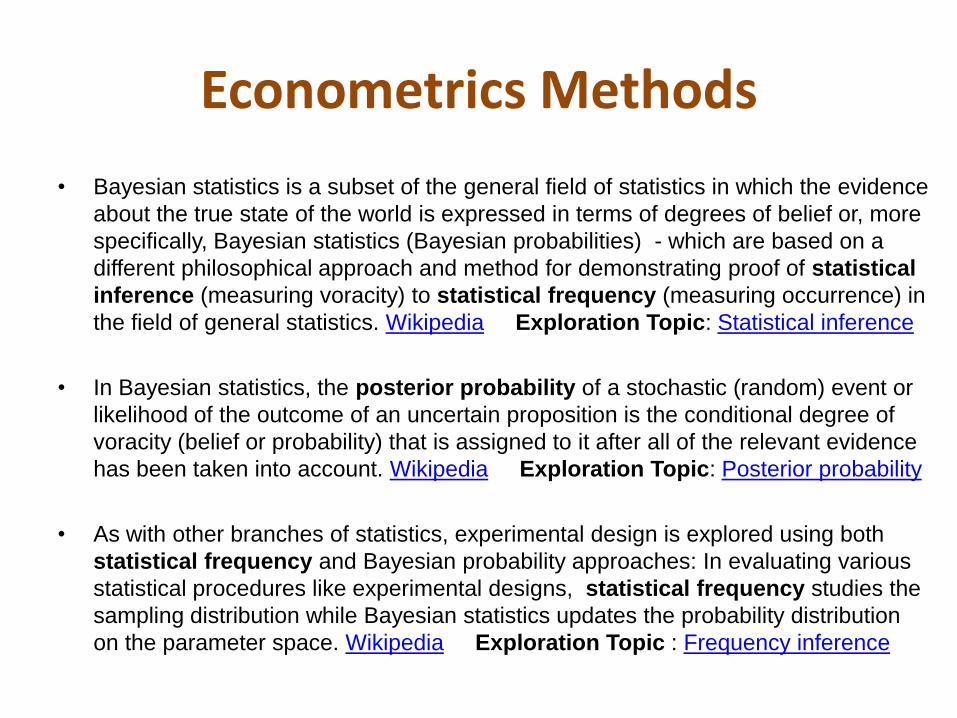
Econometrics Methods
• Bayesian statistics is a subset of the general field of statistics in which the evidence
about the true state of the world is expressed in terms of degrees of belief or, more
specifically, Bayesian statistics (Bayesian probabilities) - which are based on a
different philosophical approach and method for demonstrating proof of statistical
inference (measuring voracity) to statistical frequency (measuring occurrence) in
the field of general statistics. Wikipedia Exploration Topic: Statistical inference
• In Bayesian statistics, the posterior probability of a stochastic (random) event or
likelihood of the outcome of an uncertain proposition is the conditional degree of
voracity (belief or probability) that is assigned to it after all of the relevant evidence
has been taken into account. Wikipedia Exploration Topic: Posterior probability
• As with other branches of statistics, experimental design is explored using both
statistical frequency and Bayesian probability approaches: In evaluating various
statistical procedures like experimental designs, statistical frequency studies the
sampling distribution while Bayesian statistics updates the probability distribution
on the parameter space. Wikipedia Exploration Topic : Frequency inference
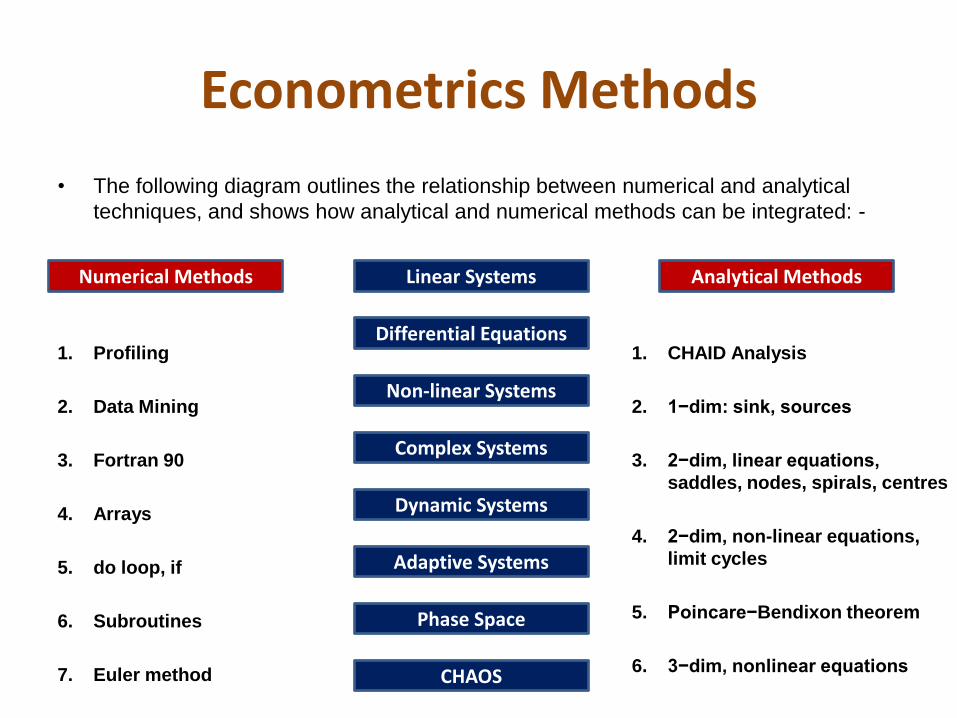
Econometrics Methods
• The following diagram outlines the relationship between numerical and analytical
techniques, and shows how analytical and numerical methods can be integrated: -
Linear Systems
Dynamic Systems
Phase Space
Non-linear Systems
CHAOS
Complex Systems
Numerical Methods Analytical Methods
1. Profiling
2. Data Mining
3. Fortran 90
4. Arrays
5. do loop, if
6. Subroutines
7. Euler method
1. CHAID Analysis
2. 1−dim: sink, sources
3. 2−dim, linear equations,
saddles, nodes, spirals, centres
4. 2−dim, non-linear equations,
limit cycles
5. Poincare−Bendixon theorem
6. 3−dim, nonlinear equations
Differential Equations
Adaptive Systems
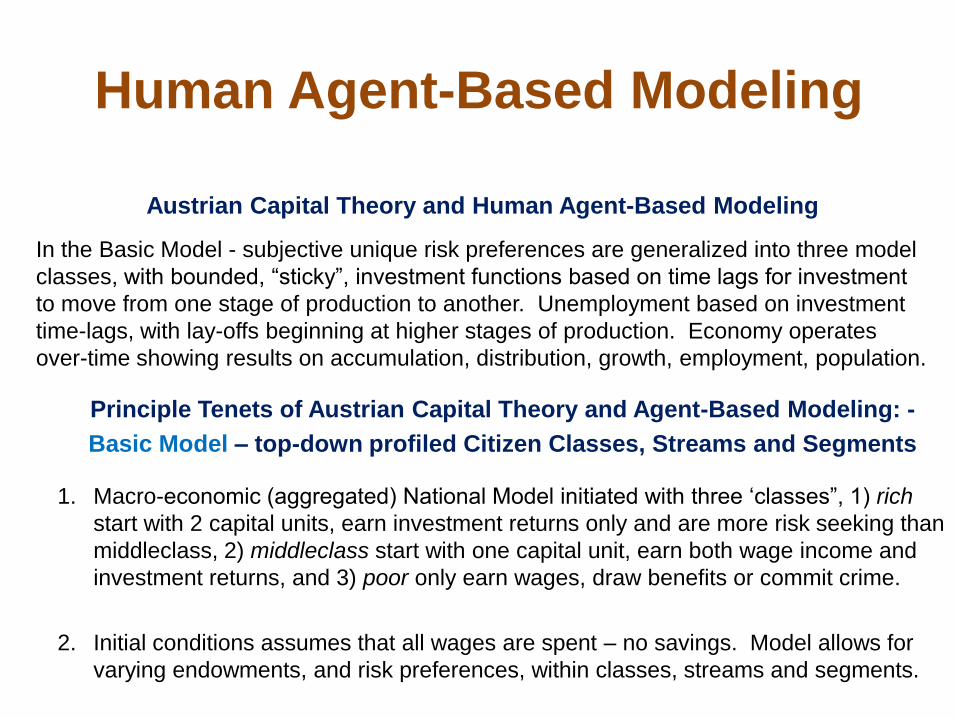
Human Agent-Based Modeling
Principle Tenets of Austrian Capital Theory and Agent-Based Modeling: -
Basic Model – top-down profiled Citizen Classes, Streams and Segments
1. Macro-economic (aggregated) National Model initiated with three ‘classes”, 1) rich
start with 2 capital units, earn investment returns only and are more risk seeking than
middleclass, 2) middleclass start with one capital unit, earn both wage income and
investment returns, and 3) poor only earn wages, draw benefits or commit crime.
2. Initial conditions assumes that all wages are spent – no savings. Model allows for
varying endowments, and risk preferences, within classes, streams and segments.
Austrian Capital Theory and Human Agent-Based Modeling
In the Basic Model - subjective unique risk preferences are generalized into three model
classes, with bounded, “sticky”, investment functions based on time lags for investment
to move from one stage of production to another. Unemployment based on investment
time-lags, with lay-offs beginning at higher stages of production. Economy operates
over-time showing results on accumulation, distribution, growth, employment, population.

Human Agent-Based Modeling
Principle Tenets of Austrian Capital Theory and Agent-Based Modeling: -
Basic Model – top-down profiled Citizen Classes, Streams and Segments
3. Models are populated using income / expenditure from standard socio-economic /
demographic profile classes, streams and segments from Experian / Census Data.
4. Timing differences - interest rate change take three periods - moving from lower to
higher stages of production – before being fully integrated into investment decisions.
5. Rich upper-class agents use Working Capital as wages in order to hire employees.
Each capital worker unit is initially allocated in economy according to weight of stage
of production in the capital structure of economy.
6. Wealthy, middle-class agents move to rich after accumulating second capital unit.
7. Poor, working-class agents move to middle class after 20 periods of work; when poor
moves to middle-class, then another poor agent is born. Each agent lives 40 years.
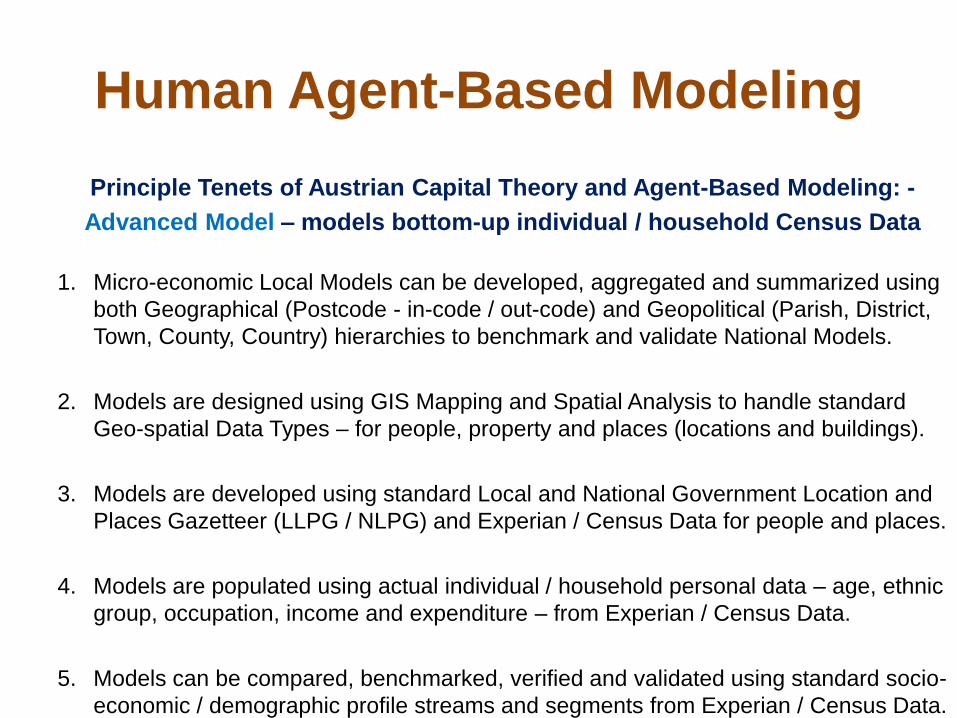
Human Agent-Based Modeling
Principle Tenets of Austrian Capital Theory and Agent-Based Modeling: -
Advanced Model – models bottom-up individual / household Census Data
1. Micro-economic Local Models can be developed, aggregated and summarized using
both Geographical (Postcode - in-code / out-code) and Geopolitical (Parish, District,
Town, County, Country) hierarchies to benchmark and validate National Models.
2. Models are designed using GIS Mapping and Spatial Analysis to handle standard
Geo-spatial Data Types – for people, property and places (locations and buildings).
3. Models are developed using standard Local and National Government Location and
Places Gazetteer (LLPG / NLPG) and Experian / Census Data for people and places.
4. Models are populated using actual individual / household personal data – age, ethnic
group, occupation, income and expenditure – from Experian / Census Data.
5. Models can be compared, benchmarked, verified and validated using standard socio-
economic / demographic profile streams and segments from Experian / Census Data.
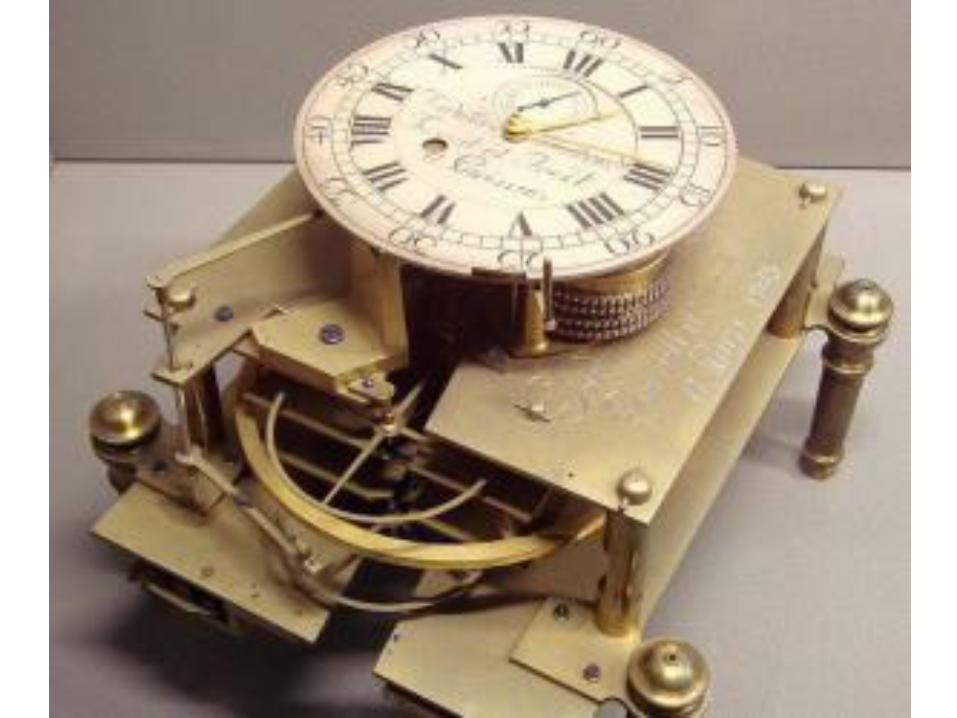

The Austrian Vision
• The Austrian School of Real Economics was the forerunner of laissez-faire
unrestrained free market (libertarian) economics, and its central tenet or main
concept is that the coordination of human effort can be achieved only through
the combined decisions and judgments of individuals (human actions) - and
cannot be forced by an external agency such as a government. It emphasizes
complete freedom of association and sovereignty of individual property rights.
• Its other main tenets include (1) abolishment of central banks and return to the
gold standard, elimination of bank deposit insurance schemes so that bank
failures punish bad investments, (3) institution of an information system that
make real-time prices data available to everyone, abandonment of mathematical
models as too rigid and limited to be of any use. Most of its recommendations
are fiercely opposed by mainstream economists (both capitalist and socialist)
economists who call the Austrian School 'anarchist economics' – and barely
acknowledging its very existence. The Austrian School does not, however,
support unrestricted laissez-faire capitalism. Hayek went as far as to advocate
the re-distributing of wealth in the form of negative income tax

The Austrian Vision
• The Austrian School of Real Economics body of thought was founded in 1871 in
Vienna by Carl Menger (1840-1921) who developed marginal utility theory of value
and carried on by Friedrich von Wiesner (1851-1926) who developed the concept
of opportunity cost. This was further elaborated by Eugen von Böhm-Bawerk
(1851-1914) who developed a capital and interest rate theory, Ludwig Edler von
Mises (1881-1973) and Joseph Schumpeter (1883-1950) who developed a
business cycle theory, and the 1974 Nobel laureate in economics, Friedrich August
von Hayek (1899-1992) who unified the vast body of works of his predecessors.
• This diverse mix of intellectual traditions in economic science is even more obvious
in contemporary Austrian school economists, who have been influenced by modern
figures in economics. These include ARMEN ALCHIAN, JAMES BUCHANAN, RONALD
COASE, Harold Demsetz, Axel Leijonhufvud, DOUGLASS NORTH, Mancur
Olson,VERNON SMITH, Gordon Tullock, Leland Yeager, and Oliver Williamson, as
well as Israel Kirzner and Murray Rothbard.

The Austrian Vision
• The Austrian Vision. The Austrian School of Real Economics very much owes its
uniqueness to its attention to the role of human actions in a free market and the
economy's capital structure. Theories of measuring the value of capital, about the
periodic business cycle influence on the structure of capital invested in production,
and about temporal market mechanisms that facilitate inter-cycle adjustments to
the capital structure has constituted a significant part of the research agenda for
the early as well as the modern Austrian school. Yet, fundamental differences in
economic standpoints and views emerged during the early developments in
Austrian capital theory – a dichotomy which even today is not yet fully resolved.
• Capital theory is beset with many perplexities and ambiguities. Most of the
theoretical difficulties stem from the fact that capital has a monetary unit of
measure corresponding to worker-hours of labour and acres of land. The "quantity
of capital," then, has no clear empiric meaning. If capital is accounted for in
physical terms, then gauging the total quantity of Liquid and Fixed Assets involves
an insurmountable aggregation problem; if it is reckoned in monetary value terms,
then the quantity of capital becomes dependent upon its own notional price. Similar
difficulties are associated with the measurement of production efficiency or the
degree of comparative efficiency of production processes.

The Austrian Vision
• If two processes are compared strictly in terms of their respective merits, it
may be unclear which of the two blueprints is the more robust; if capital
values are used in gauging the comparative degrees of efficiency, then the
comparison will depend in a critical way on the rate of interest used to
calculate the capital values. Attempts to spell out the precise relationship
between the rate of interest and the degree of sustainability of a process are
bound to run afoul of these difficulties—as was roundly demonstrated during
the controversies of the 1960s over "technique switching" and "capital
reversing."
• Such perplexities and ambiguities, however, are largely if not wholly
irrelevant to the early development of capital theory. What is important about
the theoretical developments over the final thirty years of the nineteenth
century is the new vision of capital and of a capital-using economy. Essential
to this new vision were the ideas that using capital takes time, that time, in
fact, is one of the dimensions of the economy's capital structure. Production
time, or the degree of efficiency, was recognized—and highlighted—as an
object of choice to be dealt with by economic theory.

The Austrian Vision
• Some treatment of the time element can be found in British economics,
particularly in Ricardo's discourse on machinery, and even in early French
writing such as that of Turgot. But the Austrian ideas about capital and time
constitute a significant break from Classical economic doctrine and from the
corresponding vision of capital. Dominated as it was by agricultural
production, Classical economics treated the time element in production
simply as a datum point along a temporal continuum (timeline).
• The very nature of agriculture dictated that the production period, the period
for which wages had to be "advanced" from capitalists to farm workers, was
one year. Formal economic theory was required to take this time constraint
into account, but it was not required to account for the timing difference itself.
The new vision required the treatment of time as a fundamental variable in
any theory of a capitalist economy. Characterizing it further requires that we
speak of visions and recognize the differences between the early visionaries -
particularly between Menger and Böhm-Bawerk.

The Austrian Vision
• Menger's and Böhm-Bawerk's contributions can be assessed in the light of the
distinction made by Ludwig Lachmann [1969, pp. 89-103 and 1978, pp. 8ff and
passim] between two opposing methods of economic analysis: subjectivism
(qualitative, narrative) and formalism (structured, technical, quantitative). For
subjectivists, economic phenomena can be made intelligible only in terms of the
intentions and plans of market participants; for formalists, economic measures
(econometrics), such as inputs, outputs, and production time, can be related to
one another without specific reference to the plans and actions of individuals.
• Menger's harsh assessment of Böhm-Bawerk's contribution is well reported in
modern literature: "[T]he time will come when people will realize that Böhm-
Bawerk's theory is one of the greatest errors ever committed" [Schumpeter,
1954, 847, n. 8]. Schumpter was well know for vigorously attacking his rivals
(e.g. Nicolai Kondriatev) and dismissing both their standpoints and views.
Although the context in which this statement was made remains a matter for
conjecture, a prevalent—and plausible—interpretation of this comment is that
Böhm-Bawerk may have strayed too far from the subjective value theory outlined
by Menger [Endres, 1987, p. 291 and passim, Kirzner, 1976, pp. 54-58, von
Mises, 1966, pp. 479ff, and Streissler and Weber, 1973, p. 232].

The Austrian Vision
• One of the reasons for the “Austrian School of Economics” loss of prominence during
the 1930s is that Austrian School macroeconomic theory could not be adequately
formalized within a mathematical framework - as was John Maynard Keynes's
General Theory of Economics.
• Lachmann's distinction between the two approaches of subjectivism and formalism,
yields some insights into understanding the development and history of Austrian
capital theory: -
– Menger was a thoroughgoing subjectivist
– Böhm-Bawerk straddled the fence between subjectivism and formalism
– Pawel Ciompa, Ragnar Frisch and Joseph Schumpter favoured formalism
• Böhm-Bawerk‘s formalism underlies what Menger saw as one of the greatest
errors; his subjectivism allows for a new mathematical interpretation of economic
theory which is, nonetheless, still thoroughly consistent with the subjectivism of
Menger's own work.

The Austrian Vision
• The present temporal interpretation considers Menger's judgment as it applies to the
treatment of the time element in the structure of capital. It is now argued that the
subsequent development of Austrian capital theory along quantitative and objective lines
(e.g. by Wicksell) - rather than along qualitative and subjective lines (e.g. by von
Mises) provides some small justification for Menger's use of the superlative: "one of the
greatest errors."
• F.A. Hayek won the Nobel Prize in 1973 for his work in unifying Austrian School
Economics by integrating these competing economic theories – a foundation step
towards a future Standard Economic Model. Economic Research today into the
Austrian School Theory of Capital and Business Cycles is a validation and continuation
of this resurgence of interest in the Austrian School.
• There are several related, but not perfectly synonymous methodological contrast evident
between the two opposing methods of economic analysis: subjectivism (narrative,
qualitative analysis) versus formalism (structured, technical, quantitative analysis): -
– causal-layer analysis (CLA) versus simultaneous determinacy (human actions)
– market-process analysis versus equilibrium theory
– microeconomic analysis versus macroeconomic modelling.
The Austrian Vision
• The Austrian School can be seen as an economic methodology or approach
which is wary of the unintended consequences of government intervention and its
effect on the price system - which is seen as the coordinating and regulating
factor in a society’s economy.
• The Austrian School methodology prioritizes subjectivism (logical reasoning) over
formalism (empirical analysis) because it assumes the economy is too complex to
model causality, and, that many institutions exist because they evolved as society
developed - and thus belonged in society for a reason
• The Austrian School considers the individual as entrepreneur as basis for
analytical approach and the subjectivity of decision-making. It is thus skeptical of
the validity of other economic schools of thought, especially those using
generalized aggregations.
• Hayek later in life lost faith in general equilibrium theory, thus in recent years
agent-based modeling has taken front and centre stage as a valid method for
empirical evaluation of many of the concepts and theories of the Austrian School.

Human Actions
• Human Action is the execution of purposeful behaviour in order to
achieve a more satisfactory state of affairs in an effort to improve a
less satisfactory situation. The history of the life of man is simply an
incessant sequence of Human Actions accumulated over a lifetime.

Human Actions
• There is in modern Chinese folklore, an urban legend about a fast food peddler who set
up his shop at the gate of the Chinese stock exchange and ended up making a killing on
both stocks and shares and his own food products, come rain or shine in any market
conditions. When pressed about his secret of success, he said,
• “Well, it's simple. When my stand gets really crowded with traders, I know that stock
market volume is falling, and so is probably heading towards a price adjustment - so I
sell my stocks. When there is barely any food sales for a long time, I know market
volume is rising, driving prices up - so it's time to buy“.....
•
What does this fable tell us? While the exact scenarios of the ebbs and flows of each
business cycle may vary: from the gold rush of yesteryears to the sub prime crisis, but
one thing is certain that we as a species always go overboard when it comes to greed
and fear - the masses' "maniac" index. Digital technology is now being used to measure
and forecast changes in market sentiment.
• When there is unmistakable over-exuberance in the air, ring all the alarm bells.....

The Nature of Randomness
Classical Mechanics (Newtonian Physics)
– governs the behaviour of everyday objects
– any apparent randomness is as a result of Unknown Forces, either internal or external,
acting upon a System.
Quantum Mechanics
– governs the behaviour of unimaginably small objects (such as sub-atomic particles)
– all events are truly and intrinsically both symmetrical and random (Hawking Paradox).
Relativity Theory
– governs the behaviour of impossibly super-massive cosmic structures
– any apparent randomness or asymmetry is as a result of Unknown Forces acting early
in the history of Time-space
Wave Mechanics (String Theory)
– integrates the behaviour of every size and type of object
– any apparent randomness or asymmetry is as a result of Unknown Dimensions acting
in the Membrane or in Hyperspace

Economics - Understanding Human Actions

Classical Economists
Four of the most important founding Classical Economists were Adam
Smith, Thomas Malthus, David Ricardo and John Stuart Mill
Each was a highly original thinker, each discovered fundamental
economic principles and each developed important economic theories
that transformed global economic systems over many generations.....

Classical Economists
Human Population – Thomas Malthus Adam Smith – the Invisible Hand
Free Market Economy – David Ricardo Utilitarianism – John Stuart Mill

The Classical Theory of Economics
• Of the great classical economists - Adam Smith, Thomas Malthus, David Ricardo
and John Stuart Mill are widely recognised as being the most gifted and influential
founding fathers of Classical Economic Theory.
• In the late eighteenth and early nineteenth centuries – Adam Smith was the first
philosopher to establish the Classical Theory of Economics, Thomas Malthus
published his theory of population dynamics and its relationship with the availability
of scarce resources, David Ricardo is credited as being the first to rationalise,
standardise and systemise the study of economic science - whilst John Stewart Mill
published a large number of books on philosophy and economics, which include: – A
System of Logic (1843), Principles of Political Economy (1848), On Liberty (1859),
Considerations on Representative Government (1861) and Utilitarianism (1861).
• These noted economists have all proposed important economic theories that have
advanced both the scientific theory and applied practice of economics – as well as
contributing towards building the body of academic knowledge in economics. In this
section, we will examine the history of classical economics, important principles and
theories and their impact within the context of our exploration of business and
economic waves, cycles, patterns and trends.

The Classical Theory of Economics
The Classical Theory of Economics • The fundamental principle of The Classical Theory of Economics is that
the economy is a self‐regulating system – guided only by the invisible hand of the free market. Classical economists maintain that the economy is always capable of achieving the natural level of real GDP or output, which is the level of real GDP that is obtained when the economy's resources are fully employed.
• While circumstances arise from time to time that cause the economy to fall below or to exceed the natural level of real GDP self-adjustment mechanisms exist within the market system that work to bring the economy back to the natural equilibrium level of real GDP. The classical doctrine - which is that the free market economy is always at or near the natural level of real GDP - is based on two firmly held beliefs: Say's Law and the belief that prices, wages, and interest rates are flexible.
• Say's Law. According to Say's Law, when an economy produces a certain level of real GDP, it also generates the income needed to purchase that level of real GDP. The economy is thus always capable of demanding all of the output that its workers and firms choose to produce - hence, the economy is always capable of achieving the natural level of real GDP.
The Classical Theory of Economics
• The achievement of the natural level of real GDP is not as simple as Say's
Law would seem to suggest. While it is true that the income obtained from
producing a certain level of real GDP must be sufficient to purchase that level
of real GDP, there is no guarantee that all of this income will be spent. Some
of this income will be saved. Income that is saved is not used to purchase
consumption goods and services, implying that the demand for these goods
and services will be less than the supply.
• If the level of aggregate demand falls below aggregate supply due to
aggregate saving, suppliers will cut back on their production and reduce the
number of resources that they employ. When employment of the economy's
resources falls below the full employment level, the equilibrium level of real
GDP also falls below its natural level. Consequently, the economy may not
achieve the natural level of real GDP if there is aggregate saving.
• The classical theorists' response is that the funds from aggregate saving are
eventually borrowed and turned into investment expenditures, which are a
component of real GDP. Hence, aggregate saving need not lead to a
reduction in real GDP.

The Classical Theory of Economics
• Consider, however, what happens when the funds from aggregate saving
exceed the needs of all borrowers in the economy. In this situation, real GDP
will fall below its natural level because investment expenditures will be less
than the level of aggregate saving. This situation is illustrated in Figure 1.

The Classical Theory of Economics
The Classical Theory of Economics
• Aggregate saving, represented by the curve S, is an upward‐sloping function of the interest rate; as the interest rate rises, the economy tends to save more. Aggregate investment, represented by the curve I, is a downward‐sloping function of the interest rate; as the interest rate rises, the cost of borrowing increases and investment expenditures decline. Initially, aggregate saving and investment are equivalent at the interest rate, i. If aggregate saving were to increase, causing the Scurve to shift to the right to S′, then at the same interest rate i, a gap emerges between investment and savings. Aggregate investment will be lower than aggregate saving, implying that equilibrium real GDP will be below its natural level
• Flexible interest rates, wages, and prices. Classical economists believe that under these circumstances, the interest rate will fall, causing investors to demand more of the available savings. In fact, the interest rate will fall far enough—from i toi′ in Figure —to make the supply of funds from aggregate saving equal to the demand for funds by all investors. Hence, an increase in savings will lead to an increase in investment expenditures through a reduction of the interest rate, and the economy will always return to the natural level of real GDP. The flexibility of the interest rate as well as other prices is the self‐adjusting mechanism of the classical theory that ensures that real GDP is always at its natural level. The flexibility of the interest rate keeps the money market, or the market for Credit (loan funds), in equilibrium all the time and thus prevents real GDP from falling below its natural level.

The Classical Theory of Economics
• Graphical illustration of the classical theory as it relates to a
decrease in aggregate demand. Figure considers a decrease in
aggregate demand from AD 1to AD 2.

The Classical Theory of Economics
• Similarly, flexibility of the wage rate keeps the labour market, or the market for
workers, in equilibrium all the time. If the supply of workers exceeds firms' demand
for workers, then wages paid to workers will fall so as to ensure that the work force is
fully employed. Classical economists believe that any unemployment that occurs in
the labour market or in other resource markets should be considered voluntary
unemployment. Voluntarily unemployed workers are unemployed because they
refuse to accept lower wages. If they would only accept lower wages, firms would be
eager to employ them.
• The immediate, short‐term effect is that the economy moves down along the SAS
curve labelled SAS 1, causing the equilibrium price level to fall from P 1 to P 2, and
equilibrium real GDP to fall below its natural level of Y 1 to Y 2. If real GDP falls below
its natural level, the economy's workers and resources are not being fully employed.
• When there are unemployed resources, the classical theory predicts that the wages
paid to these resources will fall. With the fall in wages, suppliers will be able to
supply more goods at lower cost, causing the SAS curve to shift to the right from
SAS 1 to SAS 2. The end result is that the equilibrium price level falls to P 3, but the
economy returns to the natural level of real GDP.
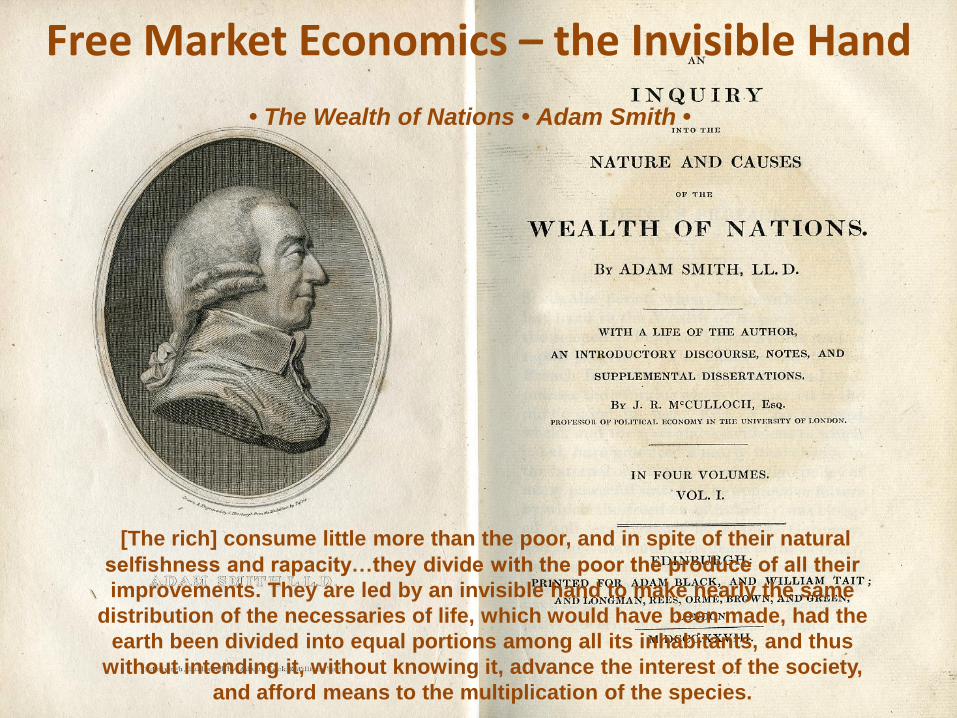
Free Market Economics – the Invisible Hand
[The rich] consume little more than the poor, and in spite of their natural
selfishness and rapacity…they divide with the poor the produce of all their
improvements. They are led by an invisible hand to make nearly the same
distribution of the necessaries of life, which would have been made, had the
earth been divided into equal portions among all its inhabitants, and thus
without intending it, without knowing it, advance the interest of the society,
and afford means to the multiplication of the species.
• The Wealth of Nations • Adam Smith •

Adam Smith
Adam Smith and the Invisible Hand of the Free Market
• Adam Smith, who lived from about 1723 to 1790, was an Economist. a Philosopher
and a Scot. He is considered to be the founder of modern economics. Smith, who's
exact date of birth is unknown, was baptised on 5 June 1723. His father, a customs
officer in Kirkcaldy, died before he was born. Adam Smith studied at Glasgow and
Oxford Universities. He returned to Kircaldy in 1746 and two years later was asked
to give a series of public lectures in Edinburgh - which established his reputation.
• In 1751, Smith was appointed professor of logic at Glasgow University and a year
later became professor of moral philosophy. He became a member of a brilliant
intellectual circle that included David Hume, John Home, Lord Hailes and William
Robertson. During 1764, Smith left Glasgow to travel to the Continent as a tutor to
Henry, the future Duke of Buccleuch. While travelling, Smith met a number of leading
European intellectuals and Philosophers, including Voltaire, Rousseau and Quesnay.
• In 1776, Smith moved to London where he published a volume which he intended to
be the first part of a complete theory of society, covering theology, ethics, politics and
law. This volume, 'Inquiry into the Nature and Causes of the Wealth of Nations',
was the first major work in the science of political, social and geographic economics.

Adam Smith
Adam Smith and the Invisible Hand of the Free Market • At the time of Adam Smith, the Enlightenment, philosophy was a study of the human
condition and the circumstances under which man lived - an all-encompassing inquiry into the nature and meaning of existence. A deep examination of the affairs of the world of commerce led Smith to the conclusion that collectively individuals in society - each acting in his or her own self-interest - managed to purchase the raw materials and produce the goods and services that collectively society requires.
• Smith called the mechanism by which this self-regulation occurs “the invisible hand” of the free market in his groundbreaking book, The Wealth of Nations, published in 1776 - the same year as America's Declaration of Independence. Smith argued forcefully against Government regulation of commerce and trade, and wrote “if all people were set free to better themselves, it would encourage greater economic prosperity for all”. Surely the 13 Colonies would have remained British.....
• While Smith couldn't demonstrate directly the empiric existence of the “invisible hand” of market forces, he presented many instances and examples of its influence in society. Essentially, the butcher, the baker, and the candlestick maker individually go about their business. Each produces the amount of meat, bread, and candlesticks he judges to be correct. Each buys the amount of meat, bread, and candlesticks that his household needs. All of this happens without their consulting one another - and without all the king's men telling them how much to produce and when to produce it .

Adam Smith
Adam Smith and the Invisible Hand of the Free Market • In discovering the “invisible hand” of the free market as a self‐regulating system
Smith founded of Classical Economics – both as a Human Philosophy and as an important Economic Principle –- as the guiding principle and fundamental premise of the science of The Classical Theory of Economics This important guiding principle was to be revisited and expanded upon by future generations of economists.
• The key doctrine of classical economics is the philosophy of a “light hand” of minimal intervention by central government - laissez-faire - so the “invisible hand” of free market economics will guide market participants in their economic endeavours, in order to create the greatest economic good for the greatest number of people, and foster economic growth. Smith also explored the dynamics of the labour market, wealth accumulation, and productivity growth. His work gave later generations of economists much to think about, debate and expand upon – not least members and acolytes of the Austrian School of Real Economics - Joseph Schumpter, Ludwig von Mises and Friedrich Hayek.
• In 1778, Smith was appointed commissioner of customs in Edinburgh. In 1783, he became a founding member of the Royal Society of Edinburgh. Adam Smith died in the city of Edinburgh on 17 July 1790.

Production and Exchange of Value
• Adam Smith opens The Wealth of Nations by explaining that the production and exchange of
value (wealth), and that the contribution of value production and exchange to national income.
Using the example of a pin factory, Smith shows how specialisation – breaking down the
production process into small tasks which can be performed repetitively by one person in one
place at one time - can enormously boost overall manufacturing capacity and productivity.
• Through specialisation, Labourers can optimise the return on their efforts by reputedly
performing a task based on an acquire skill - in order to maximise their earnings over any given
period of time. Factory owners may also employ labour-saving machinery to increase production
capacity – and thus increase the capacity to create wealth. Specialist products manufactured in
this way may then be sold or exchanged for money or bartered for other goods - thus spreading
the benefits of specialisation of labour and machinery across the wider population as a whole.
• How far and how fast the benefit of wealth creation spreads through society depends on how
widespread and efficient is the market. Market participants may try to artificially influence market
conditions - and call upon governments to sanction restrictive practices in order in order to help
them “rig markets” –even lobbying governments to pass protectionist legislation to better serve
their own selfish interests – such as imposing an import tax on goods originating from foreign
competitors. The best interests of all the participants in a free market are served if policymakers
avoid such restrictive market interventions - and promote fair and open competition.

Capital - the Accumulation of Wealth
• Smith goes on to identify that the accumulation of wealth (building up capital) - is an essential condition for economic progress. The acquisition of wealth – by saving some of the value that is produced instead of consuming all of it immediately – allows, over time, the investment of that capital in different ways. Thus capital investment might allow us to design and build new, dedicated, labour-saving machinery in order to improve manufacturing process – or to combine existing resources in novel and innovative ways in order to produce new products and services. As we increase our capital investment in manufacturing, we might expect our total unit production output (capacity) to soar dramatically – and in doing so production process become cheaper and more efficient per unit of production.
• Thanks to this growth of capital, prosperity becomes an expanding pie: everyone becomes richer. It is a virtuous circle. - but capital can also be lost, through mistakes and errors of judgement, fraud, theft, as a result of war, acts of terrorism or civil disorder - or via taxation and profligate government spending. Governments should aim to allow people to build up capital in the confidence that they will enjoy its fruits, and should be aware that their own taxation and spending will eat into the nation’s productive capital.

Economic Policy and the role of the Free Market
• Just as individuals gain from specialisation, says Smith, so do nations. There is no point in
trying to grow grapes to produce wine in Scotland - when grapes grow in abundance in
the warmer climes of France. Wheat and Oates and Barley grow plentifully in the cooler,
wetter Scottish climate. Scottish Farmers sell Barley to Whiskey producers – who ferment
the Barley to create worst and distil the worst into Whisky. Scottish merchants can then
transport Whiskey to France and sell it to French Consumers – and are then able to buy
French Wine - which they transport back home and sell to wine merchants in Scotland.
• Trading Economies should do what they are best at – which is to manufacture and trade
their specialised goods for transport to those Markets in those Countries where there is a
strong demand for them. Restrictions on international trade inevitably make both Countries
poorer. Legislators think too much of themselves if they believe that by their intervention in
the free market process - they can direct economic production better than market forces.

Economic Policy and the role of Government
• Smith is critical of government and officialdom - but is no champion of laissez-faire. He
believes that the market economy he has described can function and deliver its benefits
only when its rules are observed – when property is secure and contracts are honoured.
The maintenance of justice and the rule of law is therefore vital. So is defence - if property
can be stolen by raiders or looted by a foreign power, we are no better off than if our own
neighbours make off with it. Adam Smith sees a role for education and public works too, in
as much that as these collective projects make it easier for trade and markets to operate.
• Where tax has to be raised for these purposes, it should be levied in proportion to the
people’s ability to pay, and it should be at set rat fixed rates rather than arbitrary, it should
be easy to pay, and it should aim to have minimal side effects. Governments should avoid
taxing capital, which is essential to the nation’s productivity. Most Government spending is
for current-year consumption – so Governments should also avoid building up large fiscal
debts, which draws a nations capital away from future production – thus impoverishing it.

Human Population – Thomas Malthus
Population, when unchecked, goes on doubling itself every 25 years or
increases in a geometrical ratio.
• An Essay on the Principle of Population • Thomas Malthus •

Human Population – Thomas Malthus
• Few economists have had such controversial ideas, and generated a debate on such a
scale as Thomas Malthus. In “An Essay on the Principle of Population”, published in
1798, the English economist made public his theory on population dynamics and its
relationship with the availability of scarce resources. This essay was the result of his
scepticism towards positivist theorists, praising the perfectibility of man and greeting the
advances and diffusion of human knowledge as a source of welfare and freedom for future
generations. Disagreeing with such Utopian perspectives, Malthus maintained that the
development of mankind was severely limited by the pressure that population growth
exerted on the availability of scarce resources – Food, Energy and Water (FEW).
• The foundation of Malthus' theory relies on two assumptions that he views as fixed,
namely that food and passion between sexes are both essential for human's existence.
Malthus believed that the world's population tends to increase at a faster rate than does its
food supply. Whereas population grows at a geometric (exponential) rate, the production
capacity only grows at a linear rate (arithmetically). Therefore, in the absence of consistent
checks on population growth, Malthus made the gloomy prediction that in a short period of
time, scarce resources will have to be shared among an increasing number of individuals.
However, such checks that ease the pressure of population explosion do exist, and
Malthus distinguishes between two categories, the preventive check and the positive
check. The preventive check consists of voluntary limitations of population growth. .
Human Population – Thomas Malthus
• The positive check consists of limitations to population growth by war,
famine and disease. Malthus distinguishes between two categories, the
preventive check and the positive one. The preventive check consists of
voluntary limitations of population growth. Individuals, before getting
married and building a family, make rational decisions based on the
income they expect to earn and the quality of life they anticipate to
maintain in the future for themselves and their families. The positive check
to population is a direct consequence of the lack of a preventive check.
• When society does not limit population growth voluntarily, then diseases,
famines and wars act to reduce population size and establish the
necessary balance of population with resources. According to Malthus, the
positive check acts more intensively in lower classes, where infant
mortality rates are higher and unhealthy conditions are more common.
• The preventive and positive checks, by controlling population growth,
eventually close the mismatch between the level of population and the
availability of resources, but the latter at a cost of creating misery and
wretchedness that are unavoidable and are beyond the control of man.
Human Population – Thomas Malthus
• Under this perspective, technological improvements that contribute to the
increase in agricultural yields will only produce a temporary increase in living
standards, but will be offset in the long run by a correspondent increase in
population size that will cancel the temporary relief. Migrations could alleviate
the effects of the positive check, but Malthus considers this possibility
unfeasible, as general conditions were too harsh in possible receiving countries
• Malthus was strongly opposed to monetary transfers from richer to poorer
individuals. According to him, increasing the welfare of the poor by giving them
more money would eventually worsen their living conditions, as they would
mistakenly be lead to think that they can support a bigger family, which would in
turn depress the preventive check and generate higher population growth. At
the end of this process, the same amount of resources has to be split between
a larger population, triggering the work of the positive check to populations.
Moreover, immediately after such a transfer, people can afford buying more
food, bidding its price up and decreasing real wages, which hurt poor
individuals whose main income comes from their labour.

Human Population – Thomas Malthus
• For these reasons, Malthus, together with other distinguished economists like David Ricardo, were opposed the English Poor Laws - legislation that gave relief to poor and unemployed people, and played a central role in the Poor Laws reform in 1834. He held that it is better for a family to foresee its lack of ability to support children before having them – than having to deal with subsequent famine, diseases and infant mortality. In other words, taking for granted that checks on populations are unavoidable, it is better to use the preventive check rather than the positive check.
• Malthus realised that it was implicit in his model that if real wages were determined by the free market – they would always be pinned down to the subsistence level. If real wages were above this level, population would begin to grow, inducing a decline in nominal wages as a result of firms having a larger supply of labour available. Moreover, the larger population would result in an increase in the demand for goods, which would force prices to go up and real wages to decrease to their subsistence level.
• This concept was known as the Iron Law of Wages, and, although first conceptually formalized by Ricardo in 1817, it was a theme constantly present in Malthus's work. We can still see this Iron Law of Wages in operation in Western Society today – where wages have not risen in real terms in the USA for over Forty years – and have been static for over Twenty years in the UK

Free Market Economy – David Ricardo
"The proportions, too, in which the capital that is to support labour, and the capital that is invested in tools, machinery and buildings, may
be variously combined."
• Principles of Political Economy and Taxation • David Ricardo •

David Ricardo
• David Ricardo (1772-1823) was a British political economist and one of the most
influential of the classical economists who has often been credited with rationalising,
standardising and systemising the theory of economic science - along with Thomas
Malthus, Adam Smith, and John Stuart Mill David Ricardo was also a member of
Parliament, Businessman, financier and speculator, who amassed a considerable
personal fortune. Perhaps his most important contribution to the economics science
was the theory of comparative advantage - a fundamental argument in favour of
both free trade among countries and of specialisation of labour among individuals.
• Ricardo was born in London on 19 April 1772, the third son of a Dutch Jew who had
made a fortune on the London Stock Exchange. At the age of just 14, Ricardo joined
his father's business and quickly demonstrated a strong grasp of economic principles
in business affairs. In 1793 Ricardo married Priscilla Anne Wilkinson - a Quaker -
and Ricardo converted to Christianity to become a Unitarian. This caused a breach
with his father and obliged Ricardo to establish business on his own - continuing as a
member of the stock exchange, where his ability won him the support of an eminent
banking house. Ricardo prospered to such an extent that in a few years he acquired
a substantial fortune. Financial independence enabled him to pursue his interests in
literature and science - particularly in mathematics, chemistry, and geology.
David Ricardo
• In 1799 David Ricardo read Adam Smith's Wealth of Nations and for the next ten years he studied economics. His first pamphlet was published in 1810: entitled The High Price of Bullion, a Proof of the Depreciation of Bank Notes, as an extension of the letters that Ricardo had published in the Morning Chronicle in 1809. Ricardo argued in favour of a sterling paper currency backed by the gold standard – thus providing a fresh stimulus to the controversy around the fiscal policies of the Bank of England. The Money Supply crisis created by Wars with France (1792-1815) has in 1797 caused Pitt's government to suspend the annual cash interest payments by the Bank of England to Government Bond holders. Consequently, there had been an increase in the volume of lending and the printing of paper currency. This created a climate of inflation. Ricardo said that inflation affected foreign exchange rates as well as the flow of gold bullion.
• In 1814, at the age of 42, Ricardo retired from business and took up residence at Gatcombe Park in Gloucestershire, where he had extensive landholdings. In 1819 he became MP for Portarlington. He did not speak often, but his free-trade views were received with respect - although they opposed the economic thinking of the day. Parliament was made up mostly of wealthy landowners who wished to maintain the Corn Laws in order to protect the income from their estates.
David Ricardo
• David Ricardo became friends with a number of eminent intellectuals, among
whom were the philosopher and economist James Mill (father of John Stuart
Mill), the Utilitarian philosopher Jeremy Bentham and Thomas Malthus, who
was best known for his pamphlet, Principles of Population published in 1798.
Ricardo accepted Malthus' ideas on population growth. In 1815 another
controversy arose over the Corn Laws, when the government passed new
legislation that was intended to raise further the duties on imported wheat.
• In 1815 Ricardo responded to the Corn Laws by publishing his Essay on the
Influence of a Low Price of Corn on the Profits of Stock, in which he
argued that raising the duties on imported grain had the effect of increasing
the price of corn and hence increasing the income of landowners and the
aristocracy at the expense of the ability of the rising industrial working classes
to afford Bread. Ricardo said that the abolition of the Corn Laws would help to
distribute the national income towards the most productive groups in society.

David Ricardo
• In 1817, Ricardo published Principles of Political Economy and Taxation in
which he analysed the distribution of money among the landlords, workers, and
owners of capital. He found the relative domestic values of commodities were
dominated by the quantities of labour required in their production, rent being
eliminated from the costs of production. He concluded that profits vary inversely
with wages, which move with the cost of necessaries, and that rent tends to
increase as population grows, rising as the costs of cultivation rise. He was
concerned about the population growing too rapidly, in case it depressed wages
to the subsistence level, reduce profits and checked capital formation.
• The Bullion Committee was appointed by the House of Commons in 1819: it
confirmed Ricardo's views and recommended the repeal of the Bank Restriction
Act. In 1814, at the age of 42, Ricardo retired from business and took up
residence at Gatcombe Park in Gloucestershire, where he had extensive
landholdings. In 1819 he became MP for Portarlington. He did not speak often
but his free-trade views were received with respect, although they opposed the
economic thinking of the day. Parliament was made up of landowners who
wished to maintain the Corn Laws in order to protect their profits.

David Ricardo
• David Ricardo discovered and formulated the law of comparative advantage -
probably somewhere around the first two weeks of October 1816. The date itself is
not significant, but his letters at the time reveal how Ricardo’s mind was working
when he postulated the law. These letters show how his mind ranged over much of
the terrain of trade and market theory - from factor price equalisation conditions to
the Ricardian Economic Model . We may also conjecture that the hardest part of
his discovery may well have been defining the key assumption of Factor Immobility.
• Ricardo postulated that there is a mutual benefit from trade (or exchange) - even if
one party (e.g. a resource-rich country, in a high-technology, free market economy
with a highly skilled artisan workforce) is more productive in every possible way than
its polar opposite trading counterparty (e.g. a resource-poor country, with a relatively
low technology base and a Government-controlled centrally-planned and regulated
market economy featuring a largely unskilled labour force) – just as long as each
trading counterparty concentrates on exploiting those resources and manufacturing
activities where it has obtained a relative productivity advantage.

David Ricardo
• The Ricardian Economic Model refers to the economic theories of David Ricardo,
an English political economist who was born in 1772 and made a fortune as a banker
loan broker and stockbroker. At the age of 27, Ricardo read An Inquiry into the
Nature and Causes of Wealth of Nations by Adam Smith and was fascinated by
Smiths theories of economics. Ricardo's’ main economic theories are outlined in his
work On the Principles of Political Economy and Taxation (1817). This sets out a
series of social and economic theories which would later become the underpinnings
of Marx's Das Kapital and Marshallian economics - including the theory of rent, the
labour theory of value and above all the theory of comparative advantage.
• Ricardo wrote his first economic article ten years after reading Adam Smith and
ultimately, the "bullion controversy " gave him fame in the economic community for
his theory on inflation in 19th-century England. This economic principle became
known as monetarism - the economic theory that an excess of currency (Money
Supply) leads to inflation. Ricardo was also a founding father in creating and
formalising the principles of classical economics – and as such, he advocated a free
market economy - free trade and free competition - without the burden of government
interference of enforcing market economy restrictions. or protective trade laws

Utilitarianism – John Stuart Mill
“It is better to be a human being dissatisfied than a pig satisfied;
better to be Socrates dissatisfied than a fool satisfied. And if the
fool, or the pig, are of a different opinion, it is only because they
know only their own side of the question.”
• Utilitarianism • John Stuart Mill •

John Stuart Mill
• John Stuart Mill, the eldest son of the philosopher, James Mill and Harriet
Barrow (whose influence on Mill was vastly overshadowed by that of his
father), was born in London on 20th May, 1806. Educated a home by his
father, the young John Stuart Mill had studied the works of Aristotle, Plato,
Jeremy Bentham, Thomas Hobbes, David Ricardo and Adam Smith by the
time he had reached the age of twelve.
• James Mill, a struggling man of letters, wrote a definitive History of British
India (1818), and the work landed him a coveted position in the East India
Company, where he rose to the post of chief examiner. When not carrying out
his administrative duties, James Mill spent considerable time educating his son
John, who began to learn Greek at age three and Latin at age eight. By the
age of 14, John was extremely well versed in the Greek and Latin classics;
had studied world history, logic and mathematics; and had mastered the basics
of economic theory, all of which was part of his father’s plan to make John
Stuart Mill a young proponent of the views of the philosophical radicals.
John Stuart Mill
• Under the tutelage of his imposing father, himself a historian and economist, John
Stuart Mill began his intellectual journey at an early age, starting his study of Greek
at the age of three and Latin at eight. Mill’s father was a proponent of Jeremy
Bentham’s philosophy of utilitarianism, and John Stuart Mill began embracing it
himself in his middle teens. Later, he started to believe that his rigorous analytical
training had weakened his capacity for emotion, that his intellect had been nurtured
but his feelings had not. This perhaps led to his expansion of Bentham’s utilitarian
thought, his development of the “harm theory,” and his writings in the defence of the
rights of women, all of which cemented his reputation as a major thinker of his day.
• Mill was especially impressed by the work of Jeremy Bentham. He agreed with
Bentham when he argued in Introduction to the Principles of Morals and Legislation
(1789), that the proper objective of all conduct and legislation is "the greatest
happiness of the greatest number". Mill became a Utilitarian and at the age of
seventeen formed a discussion group called the Utilitarian Society.

John Stuart Mill
• By his late teens, Mill spent many hours editing Jeremy Bentham’s
manuscripts, and he threw himself into the work of the philosophic radicals (still
guided by his father). He also founded a number of intellectual societies and
began to contribute to periodicals, including the Westminster Review (which
was founded by Jeremy Bentham and James Mill). In 1823, his father secured
him a junior position in the East India Company, and he, like his father before
him, rose in the ranks, eventually taking his father's position of chief examiner.
• Mill also began having articles published in the Westminster Review, a journal
founded by Jeremy Bentham and James Mill to propagate Radical views. John
Stuart Mill also wrote for other newspapers and journals including the Morning
Chronicle and Parliamentary History & Review. Jeremy Bentham took an
active role in the campaign for parliamentary reform, and was one of the first to
suggest that women should have the same political rights as men.
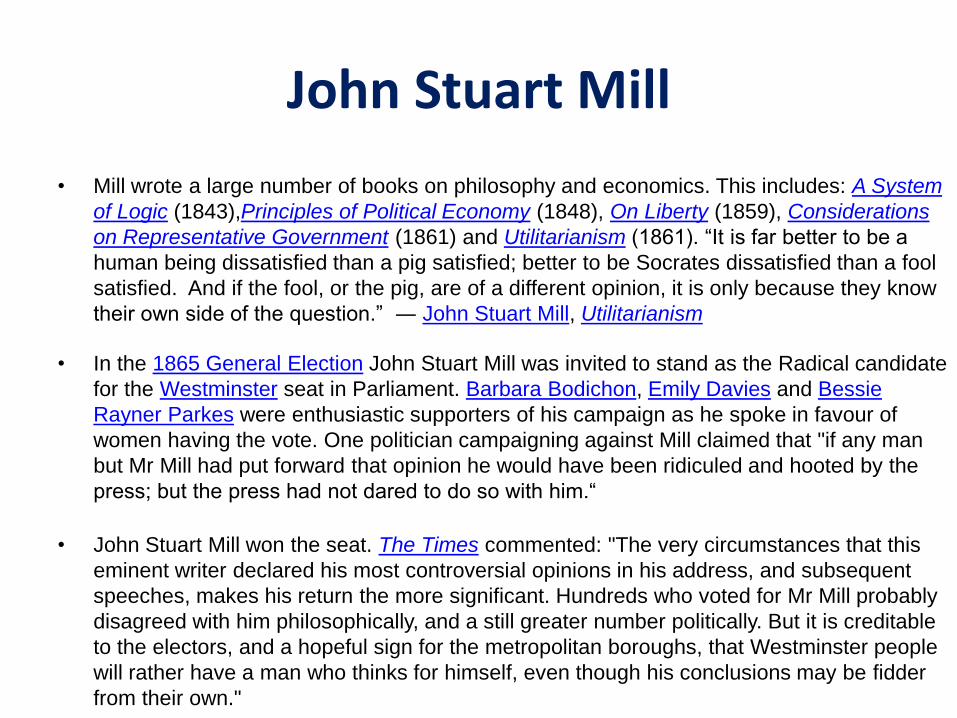
John Stuart Mill
• Mill wrote a large number of books on philosophy and economics. This includes: A System
of Logic (1843),Principles of Political Economy (1848), On Liberty (1859), Considerations
on Representative Government (1861) and Utilitarianism (1861). “It is far better to be a
human being dissatisfied than a pig satisfied; better to be Socrates dissatisfied than a fool
satisfied. And if the fool, or the pig, are of a different opinion, it is only because they know
their own side of the question.” ― John Stuart Mill, Utilitarianism
• In the 1865 General Election John Stuart Mill was invited to stand as the Radical candidate
for the Westminster seat in Parliament. Barbara Bodichon, Emily Davies and Bessie
Rayner Parkes were enthusiastic supporters of his campaign as he spoke in favour of
women having the vote. One politician campaigning against Mill claimed that "if any man
but Mr Mill had put forward that opinion he would have been ridiculed and hooted by the
press; but the press had not dared to do so with him.“
• John Stuart Mill won the seat. The Times commented: "The very circumstances that this
eminent writer declared his most controversial opinions in his address, and subsequent
speeches, makes his return the more significant. Hundreds who voted for Mr Mill probably
disagreed with him philosophically, and a still greater number politically. But it is creditable
to the electors, and a hopeful sign for the metropolitan boroughs, that Westminster people
will rather have a man who thinks for himself, even though his conclusions may be fidder
from their own."

John Stuart Mill
• Frances Power Cobbe commented that Mill's attitude towards Helen Taylor was "beautiful
to witness, and a fine exemplification on his own theories of the rightful position of
women". As well as helping Mill with his books and articles, Helen Taylor was active in
the women's suffrage campaign. In December 1868, Mill and his step-daughter, resigned
from the Manchester National Society in protest against the leadership of Lydia Becker.
• Mill retained his interest in women's suffrage and on 7th October 1869, he wrote: "The
cause has now reached a point at which it has become extremely desirable that the ladies
who lead the movement should make themselves visible to the public, their very
appearance being a refutation of the vulgar nonsense talked about women's rights
women.“
• Although he was in favour of universal suffrage he was against it being mixed with
women's suffrage. He wrote to Charles Dilke on 28th May 1870: "Women's suffrage has
quite enemies enough, without adding to the number all the enemies of universal suffrage.
To combine the two questions would practically suspend the fight for women's equality,
since universal suffrage is sure to be discussed almost solely as a working men's question:
and when at last victory, comes, there is sure to be a compromise, by which the working
men would be enfranchised without the women."

Early 20th Century Economists
Karl Marx, John Maynard Keynes (later Lord Keynes), John
Kenneth Galbraith and Milton Friedman are widely recognized as
being the foremost and most influential of the early 20th century
Economists
Each was a gifted academic, and each developed competing
economic theories that transformed the world's economic systems
during the 20th Century.....

Economic Overview – 20th Century
• Many noted economists have proposed important economic theories which have advanced the science and practice of economics - well as the contributing towards the academic body of economic knowledge. In this section, we will examine some of the important early 20th century economists and their economic theories as they impact upon our exploration of business and economic cycles, patterns and trends.
• Karl Marx, John Maynard Keynes (later Lord Keynes), John Kenneth Galbraith and Milton Friedman are all widely recognized as being amongst the most influential Economists in the early 20th century – Karl Marx because he challenged capitalism and had such a forceful impact on the relationship between economics, society and politics - and John Maynard Keynes because he introduced new economic theories and policies in relation to the Money Supply – in doing so, prompted the adoption of new Government Policies in the pursuit of Economic Development. Keynes also played a key role in the founding of the International Monetary Fund and in other political and economic measures introduced at the end of World War II.
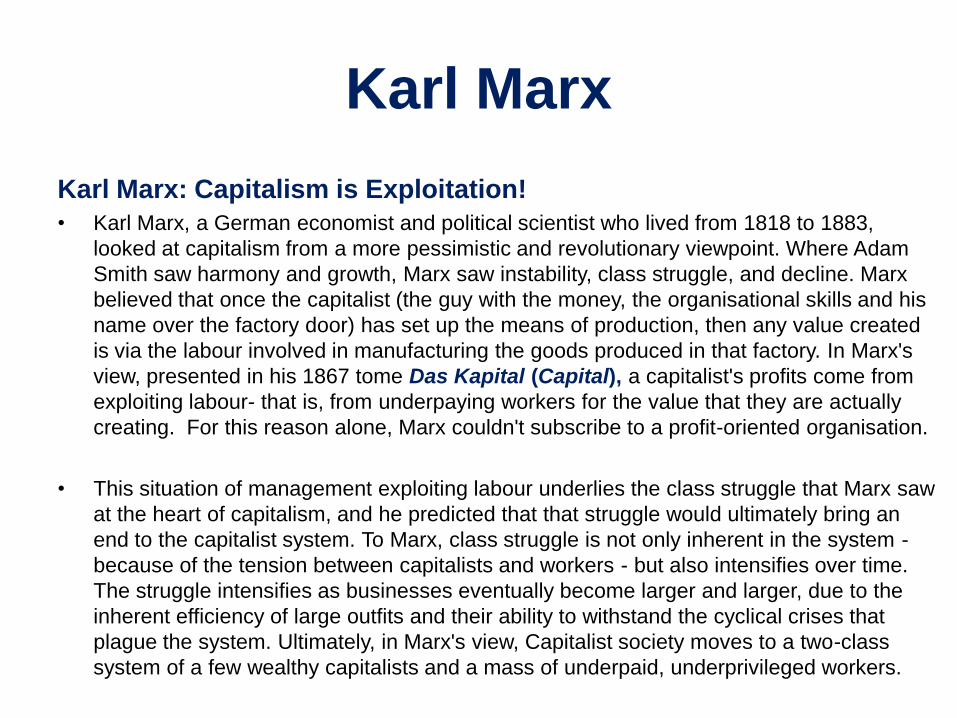
Karl Marx
Karl Marx: Capitalism is Exploitation!
• Karl Marx, a German economist and political scientist who lived from 1818 to 1883,
looked at capitalism from a more pessimistic and revolutionary viewpoint. Where Adam
Smith saw harmony and growth, Marx saw instability, class struggle, and decline. Marx
believed that once the capitalist (the guy with the money, the organisational skills and his
name over the factory door) has set up the means of production, then any value created
is via the labour involved in manufacturing the goods produced in that factory. In Marx's
view, presented in his 1867 tome Das Kapital (Capital), a capitalist's profits come from
exploiting labour- that is, from underpaying workers for the value that they are actually
creating. For this reason alone, Marx couldn't subscribe to a profit-oriented organisation.
• This situation of management exploiting labour underlies the class struggle that Marx saw
at the heart of capitalism, and he predicted that that struggle would ultimately bring an
end to the capitalist system. To Marx, class struggle is not only inherent in the system -
because of the tension between capitalists and workers - but also intensifies over time.
The struggle intensifies as businesses eventually become larger and larger, due to the
inherent efficiency of large outfits and their ability to withstand the cyclical crises that
plague the system. Ultimately, in Marx's view, Capitalist society moves to a two-class
system of a few wealthy capitalists and a mass of underpaid, underprivileged workers.

Karl Marx
Karl Marx: Capitalism is Exploitation!
• Marx predicted the fall of capitalism and movement of society toward communism, in
which “the people” (that is, the workers) own the means of production and thus have no
need to exploit labour for profit. Clearly, Marx's thinking had a tremendous impact on many
societies, particularly the USSR (Union of Soviet Socialist Republics) in the 20th century.
• In practice, however, two historical trends have undermined Marx's theories. Firstly,
socialist, centrally planned economies have proven far less efficient at producing and
delivering goods and services - that is, at creating the greatest good for the greatest
number of people - than have capitalist systems. Secondly, right up until the 1970’s,
workers' incomes in the West had risen over time, which challenges the theory that labour
is exploited in the name of profit. If workers' incomes are rising, they are clearly sharing in
the growth of the economy – so in a very real sense, they are sharing in the profits.
• That being so, real Labour Wages in the USA have remained static for the last forty years
– the massive wealth created over this period has mostly been retained by the owners of
the Capital - entrepreneurs and shareholders. Has Marx’s warnings and predictions about
capitalism come true - ultimately, has society in the USA become a two-class system - few
wealthy capitalists – the one percent “super-rich” – amongst a mass of poorly educated,
underpaid, underprivileged workers unable to pay for pensions, healthcare or education ?

Karl Marx
Karl Marx: Capitalism is Exploitation! • Marx even has something to say about weaknesses in capitalistic systems such
as monopolistic economies. While Marx's theories have been largely discredited, they are still fascinating and worth knowing about – not least because although Marx criticised Capitalism, he failed to propose or suggest any viable alternative.
• Large companies enjoy certain advantages over smaller ones and are able to manipulate market conditions in order to undercut or absorb their smaller rivals, as demonstrated by examples such as Standard Oil (now ExxonMobil) and General Motors, ConAgra and Dole in agriculture. and more recently Microsoft and IBM, in high technology, In addition to this, the distribution of wealth in the U.S.-style capitalism, which is a less regulated form of capitalism, more liable to market manipulation and corruption than that in Europe - tends to create a two-tier class system of “have's” and “have not‘s” by allowing wealth to be retained by the owners of Capital - in the hands of entrepreneurs and shareholders
• Labour Wages in the USA – as measured by consumer spending power – have remained stagnant for the last forty years (for over twenty years in the UK) as the massive wealth created through technology innovation over the previous four decades has been largely retained by Capitalists themselves - entrepreneurs and shareholders. Have Marx's warnings and predictions of capitalism creating under-privileged workers and an over-privileged “super-rich” come true at last?

John Maynard Keynes
John Maynard Keynes: The role of Government intervention in the Economy
• A new economic theory - Neo-liberal Keynesianism - appeared with the publication of
John Maynard Keynes’ “The General Theory of Employment, Interest and Money”.
Keynes had embraced a radically different set of economic assumptions, which lead to the
startling possibility of a strikingly new and different economic equilibrium - where the
economy could get stuck in a deep trough (stagnate) of simultaneous high unemployment
and high inflation – an economic condition from which it was very difficult to escape. Neo-
classical Economic theory presumed that this economic equilibrium – a stark alternative
economic condition compared with the norm, where the economy spiralled into a deep
state of inefficient economic equilibrium or stagnation – was implausible, and impossible .
• Keynes believed that there was only one way out of stagnation - for the government to
stimulate the economy by boosting Public Spending in order to increase money supply
which would flow into the into the private-sector and thus drive up demand for goods and
services. President Franklin D. Roosevelt lent this theory credibility when he launched his
“New Deal”, a massive public works programme to kick-start a stagnant economy. This
experiment was interrupted by the entry of the United States into World War II - creating a
war effort which simultaneously took millions of men out of the dole queue and into the
armed forces - as well as creating a host of new manufacturing jobs at extremely high levels of economic production for weapons, ammunition, ships and trucks and planes.
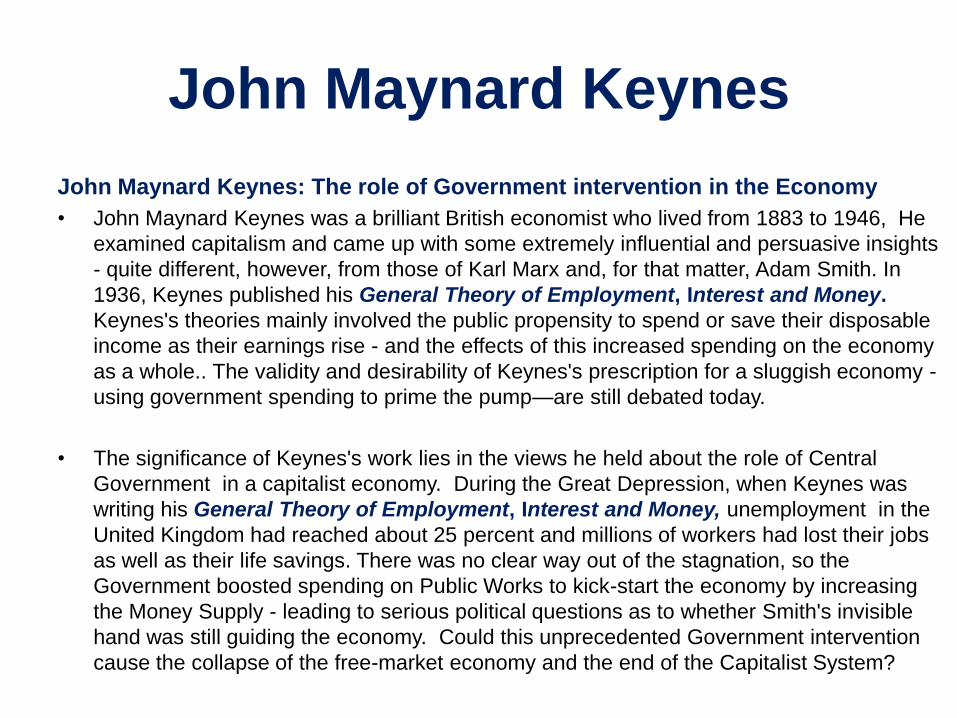
John Maynard Keynes
John Maynard Keynes: The role of Government intervention in the Economy
• John Maynard Keynes was a brilliant British economist who lived from 1883 to 1946, He
examined capitalism and came up with some extremely influential and persuasive insights
- quite different, however, from those of Karl Marx and, for that matter, Adam Smith. In
1936, Keynes published his General Theory of Employment, Interest and Money.
Keynes's theories mainly involved the public propensity to spend or save their disposable
income as their earnings rise - and the effects of this increased spending on the economy
as a whole.. The validity and desirability of Keynes's prescription for a sluggish economy -
using government spending to prime the pump—are still debated today.
• The significance of Keynes's work lies in the views he held about the role of Central
Government in a capitalist economy. During the Great Depression, when Keynes was
writing his General Theory of Employment, Interest and Money, unemployment in the
United Kingdom had reached about 25 percent and millions of workers had lost their jobs
as well as their life savings. There was no clear way out of the stagnation, so the
Government boosted spending on Public Works to kick-start the economy by increasing
the Money Supply - leading to serious political questions as to whether Smith's invisible
hand was still guiding the economy. Could this unprecedented Government intervention
cause the collapse of the free-market economy and the end of the Capitalist System?
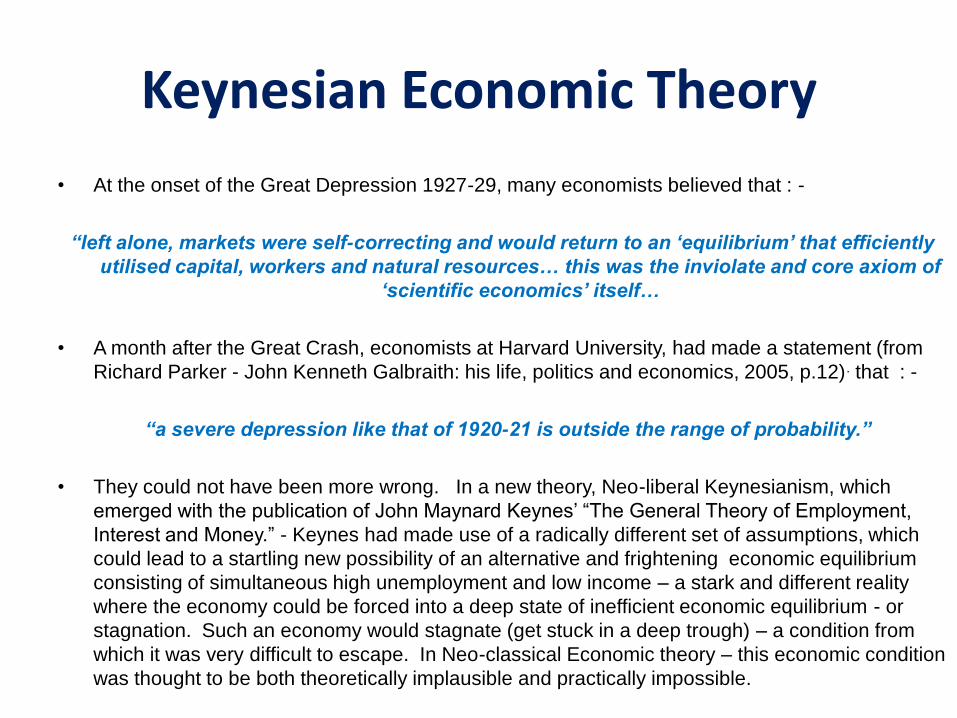
Keynesian Economic Theory
• At the onset of the Great Depression 1927-29, many economists believed that : -
“left alone, markets were self-correcting and would return to an ‘equilibrium’ that efficiently
utilised capital, workers and natural resources… this was the inviolate and core axiom of
‘scientific economics’ itself…
• A month after the Great Crash, economists at Harvard University, had made a statement (from
Richard Parker - John Kenneth Galbraith: his life, politics and economics, 2005, p.12). that : -
“a severe depression like that of 1920-21 is outside the range of probability.”
• They could not have been more wrong. In a new theory, Neo-liberal Keynesianism, which
emerged with the publication of John Maynard Keynes’ “The General Theory of Employment,
Interest and Money.” - Keynes had made use of a radically different set of assumptions, which
could lead to a startling new possibility of an alternative and frightening economic equilibrium
consisting of simultaneous high unemployment and low income – a stark and different reality
where the economy could be forced into a deep state of inefficient economic equilibrium - or
stagnation. Such an economy would stagnate (get stuck in a deep trough) – a condition from
which it was very difficult to escape. In Neo-classical Economic theory – this economic condition
was thought to be both theoretically implausible and practically impossible.


Austrian School Economists
Joseph Schumpter, Ludwig von Mises and Frederich Hayek are
amongst the most important of the Austrian School Economists
Each was a “Master of Money” - a highly original thinker, each of whom
developed competing economic theories that transformed the world's
economic systems, and each attracted a strong following amongst
politicians and economic planners right up until the present day.....


Economic Overview – Austrian School
• Many noted economists have proposed important economic theories
which have advanced the science and practice of economics well as
developing and enriching the academic body of economic knowledge.
• In this section, we will examine the significance of the Austrian School
of Real Economics and the roles of the important economic heroes of
the movement – the “Masters of Money” – as they feature in context with
our exploration of business and economic cycles, patterns and trends.
• Of the Austrian School Economists – Joseph Schumpter was the first
to rationalise, standardise and integrate the theory of Business Cycles,
Ludwig von Mises published his theory of the principle of Human
Actions, and Frederich Hayek is credited as driving the last major
attempt to rationalise, standardise and integrate the body of knowledge
of modern economic science into the lucid Economic Theories of today.
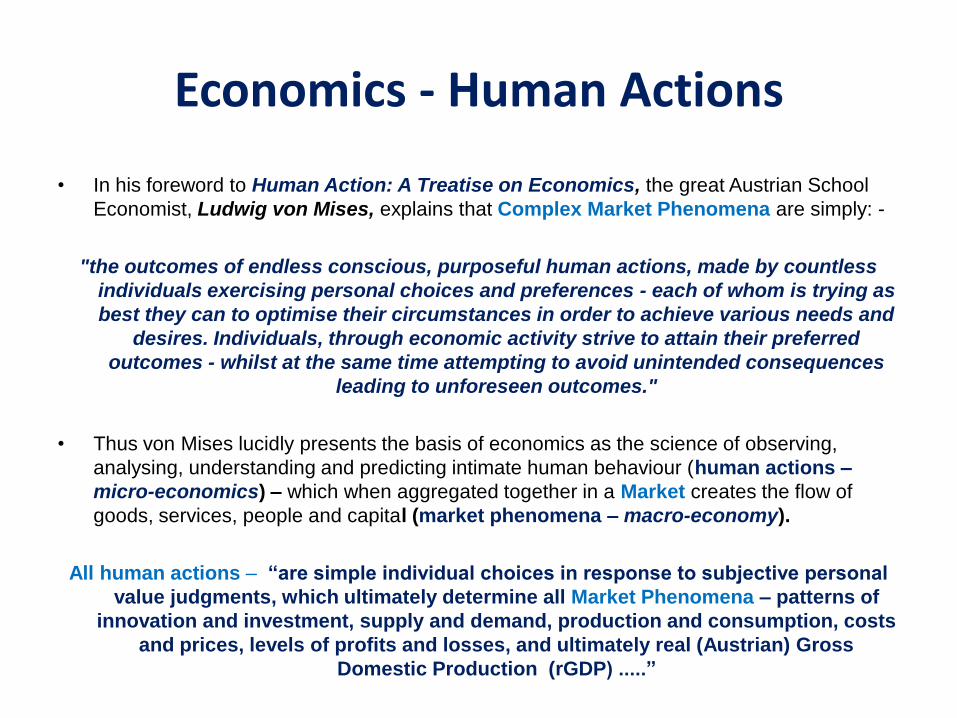
Economics - Human Actions
• In his foreword to Human Action: A Treatise on Economics, the great Austrian School
Economist, Ludwig von Mises, explains that Complex Market Phenomena are simply: -
"the outcomes of endless conscious, purposeful human actions, made by countless
individuals exercising personal choices and preferences - each of whom is trying as
best they can to optimise their circumstances in order to achieve various needs and
desires. Individuals, through economic activity strive to attain their preferred
outcomes - whilst at the same time attempting to avoid unintended consequences
leading to unforeseen outcomes."
• Thus von Mises lucidly presents the basis of economics as the science of observing,
analysing, understanding and predicting intimate human behaviour (human actions –
micro-economics) – which when aggregated together in a Market creates the flow of
goods, services, people and capital (market phenomena – macro-economy).
All human actions – “are simple individual choices in response to subjective personal
value judgments, which ultimately determine all Market Phenomena – patterns of
innovation and investment, supply and demand, production and consumption, costs
and prices, levels of profits and losses, and ultimately real (Austrian) Gross
Domestic Production (rGDP) .....”

Economics - Human Actions
All human actions – “are simple individual choices in response to
subjective personal value judgments, which ultimately determine
all Market Phenomena – patterns of innovation and investment,
supply and demand, production and consumption, costs and
prices, levels of profits and losses, and ultimately real (Austrian)
Gross Domestic Production (rGDP) .....”
• Human Action: A Treatise on Economics • Ludwig von Mises •
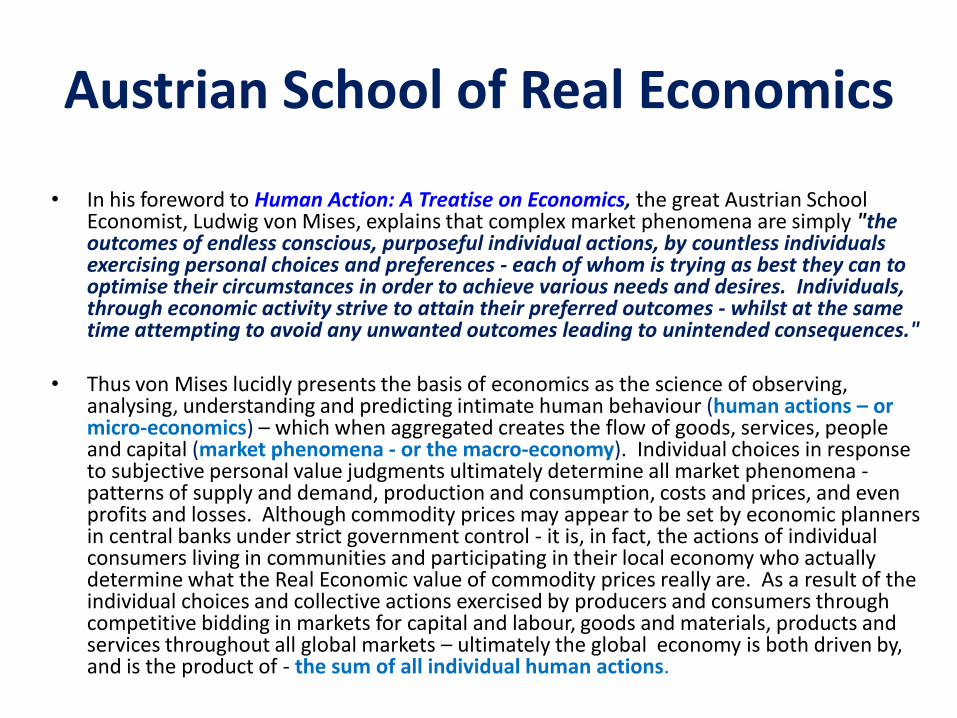
• In his foreword to Human Action: A Treatise on Economics, the great Austrian School Economist, Ludwig von Mises, explains that complex market phenomena are simply "the outcomes of endless conscious, purposeful individual actions, by countless individuals exercising personal choices and preferences - each of whom is trying as best they can to optimise their circumstances in order to achieve various needs and desires. Individuals, through economic activity strive to attain their preferred outcomes - whilst at the same time attempting to avoid any unwanted outcomes leading to unintended consequences."
• Thus von Mises lucidly presents the basis of economics as the science of observing, analysing, understanding and predicting intimate human behaviour (human actions – or micro-economics) – which when aggregated creates the flow of goods, services, people and capital (market phenomena - or the macro-economy). Individual choices in response to subjective personal value judgments ultimately determine all market phenomena - patterns of supply and demand, production and consumption, costs and prices, and even profits and losses. Although commodity prices may appear to be set by economic planners in central banks under strict government control - it is, in fact, the actions of individual consumers living in communities and participating in their local economy who actually determine what the Real Economic value of commodity prices really are. As a result of the individual choices and collective actions exercised by producers and consumers through competitive bidding in markets for capital and labour, goods and materials, products and services throughout all global markets – ultimately the global economy is both driven by, and is the product of - the sum of all individual human actions.
Austrian School of Real Economics

Value Creation vs. Value Consumption
• We live in a natural world which once, at the birth of civilisation, was brimming to the full with innumerable and diverse natural resources. It is important to realise that Wealth was never bestowed on us “for free“ - simply as a bonanza of that abundant feedstock of natural resources.
• Throughout History, Wealth has always been extracted or created through Human Actions – the result of countless men executing primary Value Creation Processes throughout the last 200,000 years - Hunting and Gathering, Fishing and Forestry, Agriculture and Livestock, Mining and Quarrying, Refining and Manufacturing. Those Secondary Added Value Processes - such as Transport and Trading, Shipping and Mercantilism – serve only to Add Value to primary Wealth which was originally created by the labour of others executing primary Value Chain Processes.
• The Economic Wealth that we enjoy today as an advanced globalised society is not generated “magically” through discovery, intellectual effort or technology innovation - nor through market phenomena created by the efforts of brokers and traders - or even by monetarist intervention from economic planners or central bankers. Economic Wealth is as a result of the effort of man - Human Actions and primary Value Chain Processes generating Utility or Exchange Value
• Vast amounts of Wealth can also be created (and destroyed.....) via Market Phenomena - the “Boom” and “Bust” Business Cycles of Economic Growth and Recession which act to influence the Demand / Supply Models and Price Curves of Commodities, Bonds, Stocks and Shares in Global Markets. Market Phenomena are simply the sum of all Human Actions – the aggregated activity of Traders and Brokers, Buyers and Sellers participating in that particular marketplace.

Value Creation in Business
• As an introduction to this special topic of the Value Chain - we have defined value
creation in terms of: “Utility Value” which is contrasted with “Exchange Value” -
1. “Utility Value” – skills, learning, know-how, intellectual property and acquired knowledge
2. “Exchange Value” – land, property, capital, goods, traded instruments, commodities and
accumulated wealth.
• Some of the key issues related to the study of Value are discussed - including the
topics of value creation, capture and consumption. All Utility and Exchange Value is
derived from fundamental Human Actions. Although this definition of value creation is
common across multiple levels of activity and analysis, the process of value creation
will differ based on its origination or source - whether that economic value is created
by an individual, a community, an enterprise - or due to Market Phenomena.
• We explore the concepts of Human Actions, competition for scarce resources and
market isolating mechanisms which drive Business Cycles and Market Phenomena in
the Global Economy - using Value Chain analysis in order to explain how value may
be created, exchanged and captured – or consumed, dissipated and lost – as a result
of different activities using different processes at various levels within the Value Chain
Value Creation in Business
• In order to develop a theory of value creation by enterprises, it is useful to first characterise the value creation process. In the next two sections of this document we develop a framework that builds upon Schumpeter's arguments to show: -
1. In any economy, the Creation of Value is solely as a consequence of Human Actions
2. As a result of Human Actions, Value may be created, captured, stockpiled or consumed
3. Also, in any economy, every Individual and Organisation competes with each other for the sole use of scare resources – land, property, capital, labour, machinery, traded instruments and commodities – which may be either raw materials or finished goods
4. New and innovative combinations of resources gives the potential to create new value
5. Mercantilism – shipping, transport, sales, trading, battering and exchange of these new combinations of resources - accounts for the actual realization of this potential value
• In other words - resource combination and exchange lie at the heart of the value creation process and in sections II and III we both describe how this process functions - and also identify the conditions that facilitate and encourage, or slow down and impede, each of these five elements of the Value Creation process.
Value Creation in Business
• This framework establishes the theoretical infrastructure for the analysis of the roles firms play in this value creation process and of how both firms and markets collectively influence the process of economic development – which is derived from Human Actions: -
1. Value Creation – primary Wealth Creation Processes
2. Value Capture – the Acquisition of Wealth by means other than Value Creation
3. Value Stockpiling – the Accumulation of Wealth
4. Value-added Services – Mercantilism, shipping, transport, sales, trading, battering , exchange
5. Value Consumption – the depletion of Resources or the exhaustion of Wealth
• As our analysis of the requirements for effective resource combination and exchange reveals, global market phenomena alone are able to create only a very small fraction of the total value that can be created out of the stock of resources available in economies. The very different institutional nature and context of enterprises, operating in a state of creative tension within global markets, substantially enhance the fraction of the total potential value that can be obtained out of nature’s resources. We describe this process of value creation by firms and, in section V, we integrate the firm's role with that of markets to explain why both firms and markets are needed to ensure that economies develop and progress in a way that achieves what Douglass North (1990) has described as "adaptive efficiency."'
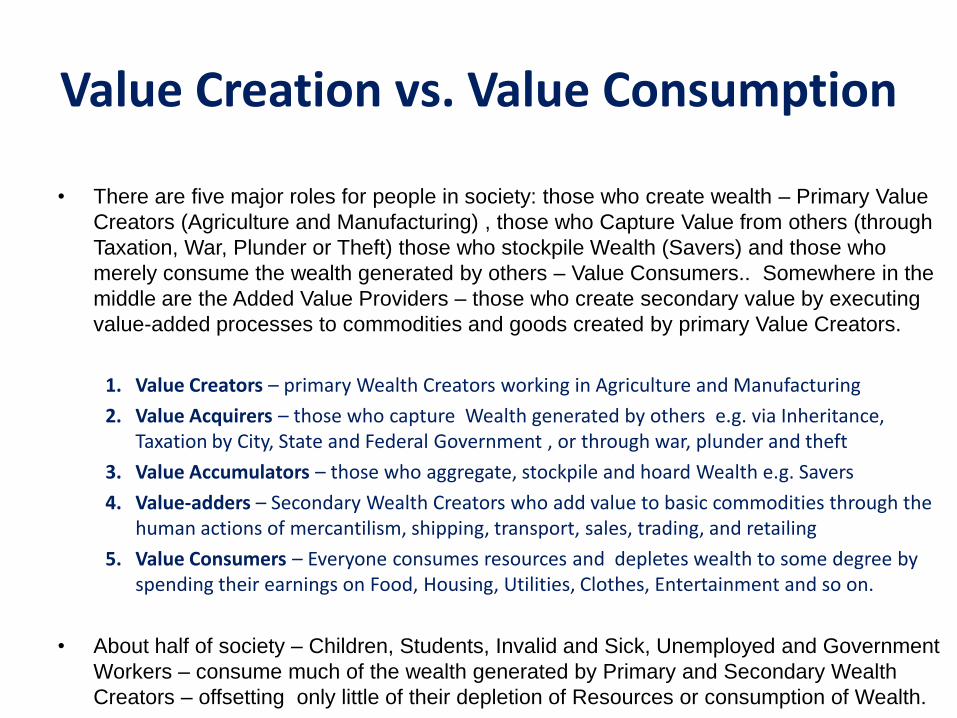
Value Creation vs. Value Consumption
• There are five major roles for people in society: those who create wealth – Primary Value
Creators (Agriculture and Manufacturing) , those who Capture Value from others (through
Taxation, War, Plunder or Theft) those who stockpile Wealth (Savers) and those who
merely consume the wealth generated by others – Value Consumers.. Somewhere in the
middle are the Added Value Providers – those who create secondary value by executing
value-added processes to commodities and goods created by primary Value Creators.
1. Value Creators – primary Wealth Creators working in Agriculture and Manufacturing
2. Value Acquirers – those who capture Wealth generated by others e.g. via Inheritance, Taxation by City, State and Federal Government , or through war, plunder and theft
3. Value Accumulators – those who aggregate, stockpile and hoard Wealth e.g. Savers
4. Value-adders – Secondary Wealth Creators who add value to basic commodities through the human actions of mercantilism, shipping, transport, sales, trading, and retailing
5. Value Consumers – Everyone consumes resources and depletes wealth to some degree by spending their earnings on Food, Housing, Utilities, Clothes, Entertainment and so on.
• About half of society – Children, Students, Invalid and Sick, Unemployed and Government
Workers – consume much of the wealth generated by Primary and Secondary Wealth
Creators – offsetting only little of their depletion of Resources or consumption of Wealth.

Friedrich Hayek
• You may be forgiven for thinking that the current financial crisis was caused by
allowing markets - especially global financial markets – far too much freedom.
Followers of the Austrian economist Friedrich Hayek would say exactly the opposite.
In their view, the crisis happened because the markets weren't free enough.
• Friedrich Hayek was one of the greatest free-market thinkers, who in the 1930s
famously debated with Keynes over the role of government intervention in the
economy. Although Hayek did not share Keynes' charismatic powers of argument
and persuasion (his thick Austrian accent didn't help) – what Hayek did have in
abundance was the intellectual firepower to take on Keynes on the debating floor.
• Keynes constantly and persistently articulated to politicians that intervention by
economic policymakers could, and would, improver adverse economic conditions -
whereas Hayek maintained that Government intervention, in the long term, could,
and would - only make things worse. Hayek was frequently exasperated by the
inconsistencies in Keynes' body of academic work and his tendency to change his
mind - something that the Cambridge economist did quite regularly, and not only "when the facts changed". In the end, this factor made all the difference.

Friedrich Hayek
• Friedrich Hayek wrote The Road to Serfdom, shortly after World War II - a best-
selling polemic railing against centralised economic planning. In it, he warned that
the dead hand of the bureaucrat could threaten the future of a free society almost as
much as the most feared “man of steel “ - Stalin. After that, Hayek suffered many
years in the intellectual wilderness, while Keynesian Economics bestrode the post-
war world. There was at last, a great burst of fame and influence in the 1970s, when
Hayek was awarded a Nobel Prize for economics and feted by free-market politicians
on both sides of the Atlantic. Lord Patten reports how Margaret Thatcher would pull
from out of her handbag – her favourite Hayek quotations at key moments during
cabinet meetings. So far, so good - but what can Hayek say to us right now?
Market Complexity
• There are modern monetarists who have interesting things to say about the current
crisis. Milton Friedman has been profiled and lauded many times over the years.
Hayek, like Keynes - and unlike Milton Friedman – had focused on the great
complexity of markets and their inherent unpredictability. And why choose Hayek for
nomination as a Master of Money, and not the other great free-market economist,
Milton Friedman - who almost certainly wielded more influence than Hayek ?
Friedrich Hayek
• Many Politicians shared some sympathy with this view in the 1930s, when Hayek's arguments on market complexity and inherent unpredictability often enjoyed a better reception than those of Keynes'. This lesson, however, has often been lost on post-war Politicians – even those who claimed to hold free-market economic values. Politicians might pay lip service to liberalising the economy and setting markets free, but in practice it has been difficult for them to truly relinquish the urge to meddle in economic affairs - even when they are privately convinced of the intellectual case and economic benefits of doing so.
• Hayek, unlike Keynes or Friedman, did not believe that Central Bankers and Economic Policymakers could master Market Complexity sufficiently to steer the economy in the right – or even any - direction. Hayek said that more often than not, political intervention in the economy, in the long term, would only make matters worse – for example, the decision of the US Government to rescue people who had invested in Mexican bonds in the "Tequila Crisis" of 1994.
• The free-market economist and Federal Reserve Chairman, Alan Greenspan, supported a massive US-IMF rescue package for Mexico, even though he had warned previously that the cost of protecting speculators from the unintended consequences of their own actions would - by encouraging investors and institutions to continue taking excessive risks – build up problems in the future.

Friedrich Hayek
• We only have to consider an earlier example - the "Tequila Crisis" of 1994 – to find a precedent for the Financial Crisis of 2008 and the decision of the US and UK Government's to rescue in the failed Banks and Insurance companies and bail out investors. The financial system might have seemed free, these critics argue, but in reality it was a dangerous hybrid. The banks were free to do just about anything that they wanted – in the certain knowledge that Governments would not allow them to fail and endanger investors in large numbers.
• This encouraged Bankers to take on Sub-prime Mortgage Products, which were some pretty risky bets, and it all ended up costing us all very, very dear. So, lest there be any doubt about it, lets make it it be very, very clear,– the safety net of Government intervention was always there - as witnessed by the massive bailouts of 2008. All of which explains why Hayek and some other Austrian economists have now acquired a new generation of followers - including the Governor of California and next Republican presidential candidate Paul Rubio. They find both a convincing explanation of the financial crisis and a bracing solution to future Financial Markets misadventures in Hayek's theories.
• In seeking examples of interventionist Government - witness today the current difficulties that Conservative-Liberal coalition ministers in the British Parliament have in letting go of day-to-day power over the National Health Service or the BBC – lat alone devolving authority to de-centralised Government.

Friedrich Hayek
Leave well alone? • The Hayek Austrian School explanation for the Financial Crisis of 2008 is that it
is all down to Government interference – tampering with free market risk and reward, the very worst possible kind of government meddling – where economic policymakers fail to grant financial markets the freedom of control of action and consequence. Hayek thought that this policy originated in the government's grim determination to control the price of money and the money supply – by fixing interest rates and controlling the availability of credit (money) in the marketplace.
• In the Austrian view, the US Federal Reserve and other central banks helped cause the financial crisis, by persistently cutting interest rates whenever the economy showed any signs of faltering; for example, after the bursting of the dotcom bubble in 2000. That might have staved off a more serious downturn - but only at the cost of encouraging people to take on debts they couldn't afford (through excess of money supply) - and granting banks an insurance policy to take excessive risks.
• This, in effect, is the same argument that Hayek made against Keynes in the late 1920s and 1930s. He maintained that the Federal Reserve caused the crash, by keeping interest rates too low and encouraging a lot of "malinvestment" - investment in those projects or assets which made no business sense – in that they were neither financially viable nor economically worthwhile.
Friedrich Hayek
• Hayek commented that greater efforts to stimulate the economy would only make
economic conditions worse - especially if those measures required further borrowing by
the government The difference between Milton Friedman and John Maynard Keynes -
much exaggerated in the historical record - was that Friedman advocated an increase in
the Money Supply (Quantitative Easing), whilst Keynes saw a major role for fiscal policy
too - in increased Public Spending - particularly in the aftermath of financial crises.
• When it comes to the 1930s, economic history has not always looked kindly on Hayek's
arguments. The neo-classical viewpoint of the depression by Milton Friedman and Anna
Schwartz, decades later, made a convincing case that it was caused by the US central
bank pumping too little money into the economy, rather than too much. This is a bit like
the NRA saying that the culture of violence in the USA is due to there not being enough
guns in civilian hands – rather than too many.....
• What is most interesting to note is that the Monetary Theories of both Milton Friedman
and John Maynard Keynes are on the same side of the argument - both the neo-classic
and neo-liberal viewpoints are united against the non-interventionist standpoint of
Friedrich Hayek. Given the experience of an economic downturn, Friedman and Keynes
each thought that economic policymakers could come to the rescue. Both men thought
that, in normal times, monetary policy was the best way to deal with a recession.
Friedrich Hayek
• What makes Hayek a radically different kind of free-market economist is the
distrusted that he harbours for both sets of economic policy machinery - monetary
and fiscal - for guiding the economy. Hayek's view has great resonance for anyone
who feels uneasy about governments bailing out bankers and central banks pumping
hundreds of billions of dollars into the economy.
• In the 1920s, Hayek had lived through hyperinflation as a young adult in Austria, and
as a result he simply would not believe that governments should or could iron out the
peaks and troughs in the economic cycle. The only government power he had any
confidence in was the power of economic intervention to make things worse - by
devaluing the currency through Quantitative Easing.
• We can easily understand why so many are turning to Austrian School economists
like Hayek for a radical and different kind of solution to today's economic problems .
Whether any government or mainstream politician is really prepared to step back,
and let the system "heal itself" - whatever the short-term consequences - is quite
another matter. None were able to in 2008.
Monetary and Fiscal Policy
Difference Between Monetary and Fiscal Policy Tejvan Pettinger on September 16, 2011 in economics
• Monetary Policy and Fiscal Policy are both used as tools to pursue dual
economic policies of controlling economic growth and managing inflation. Monetary Policy features varying the interest rate and influencing the availability of credit – the Money Supply – whereas Fiscal Policy involves the government changing tax rates and manipulating levels of government public spending in order to influence aggregate demand in the economy.
Monetary Policy • Monetary policy is usually conducted by Economic Planners in Central
Banks and their Political Masters in Treasury Authorities, and involves: -
– Setting interest base rates (e.g. LIBOR and Bank of England in the UK and the Federal Reserve in USA)
– Influencing the Money Supply (availability and flow of Credit) e.g. Policy of quantitative easing to increase the supply of money .
Monetary and Fiscal Policy
How Monetary Policy Works
• The Central Bank may have an inflation target of, say, 2%. If they feel that inflation is going to go above the inflation target, due to economic growth being too quick, then they will increase interest rates. Higher interest rates increase borrowing costs and reduce consumer spending and investment - leading to lower aggregate demand and lower inflation. If the economy lurches into recession, the Central Bank would cut interest rates (see Cutting interest rates).
Fiscal Policy
• Fiscal Policy is carried out by the government and involves changing: -
– Level of government spending
– Levels of taxation
• To increase demand and economic growth - the government will cut tax and increase spending (leading to an increase in budget deficit)
• To reduce demand and reduce inflation - the government can increase tax rates and cut spending (leading to a decrease in budget deficit)

Monetary and Fiscal Policy
Example of Expansionary Fiscal Policy
• In a recession, the government may decide to increase borrowing and spend
more on infrastructure spending. The idea of this is to increase in government
spending – which creates an injection of money into the economy and helps
to create jobs. There may also be a multiplier effect, where the initial injection
into the economy causes a further round of higher spending. This increase in
total aggregate demand can kick-start the economy to get out of recession.
• Increased borrowing to fund public expenditure on infrastructure projects is
an inflationary fiscal policy (as is lowering the general level of taxation so as
to increase consumer spending) - which may cause the economy to become
over-heated – and in turn lead to an increase in the average rate of inflation.
• Should f the government felt that inflation was a problem, then they could
pursue a deflationary fiscal policy (higher tax and lower spending) in order to
reduce the rate of economic growth. See more at: Expansionary fiscal policy

Monetary and Fiscal Policy
Which is More Effective Monetary or Fiscal Policy?
In recent decades, monetary policy has become more popular because: -
• Monetary policy is set by Central Banks, and therefore reduces political influence (e.g.
politicians may cut interest rates in order to boost the economy before a general election)
• Fiscal Policy can have more supply side effects on the wider economy. E.g. to reduce
inflation – higher tax and lower spending would not be popular and the government may
be reluctant to purse this. Also lower spending could lead to reduced public services and
the higher income tax could create disincentives to work.
• Monetarists argue expansionary fiscal policy (larger budget deficit) is likely to cause
crowding out – higher government spending reduces private sector spending, and higher
government borrowing pushes up interest rates. (However, this analysis is disputed)
• Expansionary fiscal policy (e.g. more government spending) may lead to special interest
groups pushing for spending which isn’t really helpful and then proves difficult to reduce
when recession is over.
• Monetary policy is quicker to implement. Interest rates can be set every month. A decision
to increase government spending may take time to decide where to spend the money.
Monetary and Fiscal Policy
• The current recession demonstrates that Monetary Policy has too many limitations.
– Targeting inflation alone is far too narrow. This meant Central Banks ignored an
unsustainable boom in the housing market and bank lending.
– Liquidity Trap. In a recession, cutting interest rates may prove insufficient to
boost demand because banks don’t want to lend and consumers are too nervous
to spend. Interest rates were cut from 5% to 0.5% in March 2009 - but this didn’t
solve recession in UK – as Banks could place Deposits in Asia earning over 5%
– Even Quantitative Easing – creating money may be ineffective if the banks just
want to keep the extra money in their balance sheets – especially if at the dame
time, Regulators are forcing Banks to increase Liquidity (Capital Adequacy).
– Government spending directly creates demand in the economy and can provide
a kick-start to get the economy out of recession. In a deep recession, reliance on
monetary policy alone, will be insufficient to restore equilibrium in the economy.
– In a Liquidity Trap, any expansionary fiscal policy will not cause crowding out
because the government is making use of surplus savings to inject demand into
the economy.
– In a deep recession, expansionary fiscal policy may be important for confidence
– but only if monetary policy has proved to be ineffective – or a complete failure.
Monetary and Fiscal Policy
• Whether it's the European Central Bank lending trillions to European national
banks, or a third bout of quantitative easing by the Federal Reserve Bank –
currently running at $85 billion per month – it just feels that too many financial
institutions are simply deferring the moment of truth - rather than dealing directly
with core structural economic problems. This includes the International Monetary
Fund, the European Central Bank and the Federal Reserve Bank.


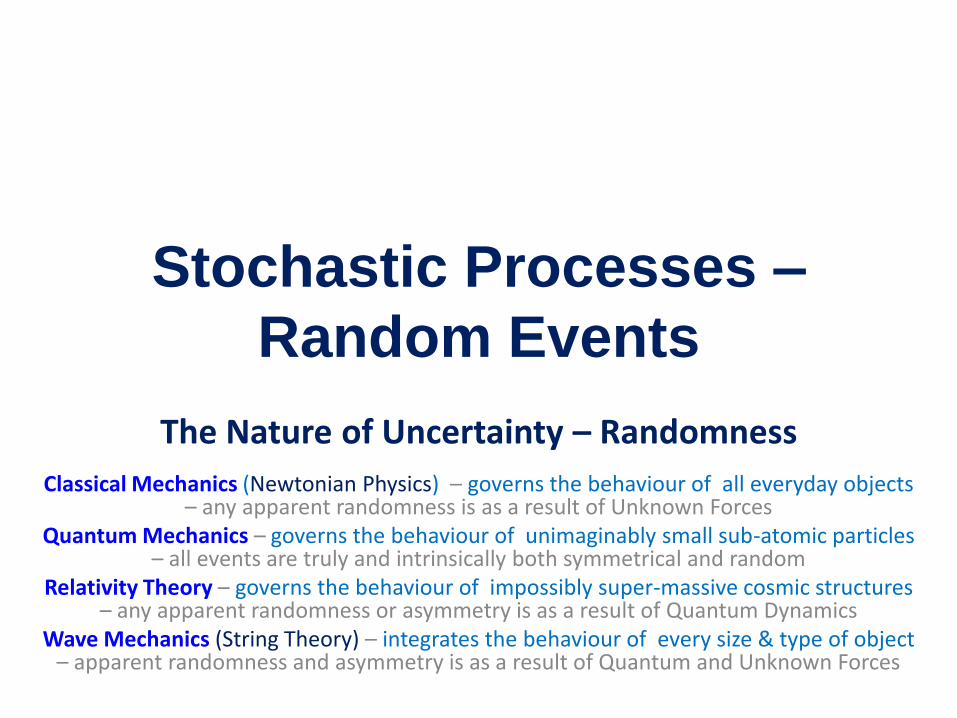
Stochastic Processes –
Random Events
The Nature of Uncertainty – Randomness
Classical Mechanics (Newtonian Physics) – governs the behaviour of all everyday objects – any apparent randomness is as a result of Unknown Forces
Quantum Mechanics – governs the behaviour of unimaginably small sub-atomic particles – all events are truly and intrinsically both symmetrical and random
Relativity Theory – governs the behaviour of impossibly super-massive cosmic structures – any apparent randomness or asymmetry is as a result of Quantum Dynamics
Wave Mechanics (String Theory) – integrates the behaviour of every size & type of object – apparent randomness and asymmetry is as a result of Quantum and Unknown Forces

The Nature of Randomness
Classical Mechanics (Newtonian Physics)
– governs the behaviour of everyday objects
– any apparent randomness is as a result of Unknown Forces, either internal or external,
acting upon a System.
Quantum Mechanics
– governs the behaviour of unimaginably small objects (such as sub-atomic particles)
– all events are truly and intrinsically both symmetrical and random (Hawking Paradox).
Relativity Theory
– governs the behaviour of impossibly super-massive cosmic structures
– any apparent randomness or asymmetry is as a result of Unknown Forces acting early
in the history of Time-space
Wave Mechanics (String Theory)
– integrates the behaviour of every size and type of object
– any apparent randomness or asymmetry is as a result of Unknown Dimensions acting
in the Membrane or in Hyperspace

Randomness
Stochastic Processes – Random Events
• A tradition that begins with the classical Greek natural philosophers (circa 600 -
200 BC) and continues through contemporary science - holds that change and
the order of nature are the result of natural forces. What is the role of random,
stochastic processes in a universe that exhibits such order? When we examine
the heavens there seems to be a great deal of order to the appearance and
movement of the celestial bodies - galaxies, stars, planets, asteroids, etc.
• Since the dawn of our species, humans have speculated on how these bodies
were formed and on the meaning of their movements. Most observations of
natural phenomena support the contention that nature is ordered. The force
that brought about this order differs depending upon the source of the historic
explanation of how this order came to be. For most of human history, super-
natural forces were credited with the imposition of order on nature.
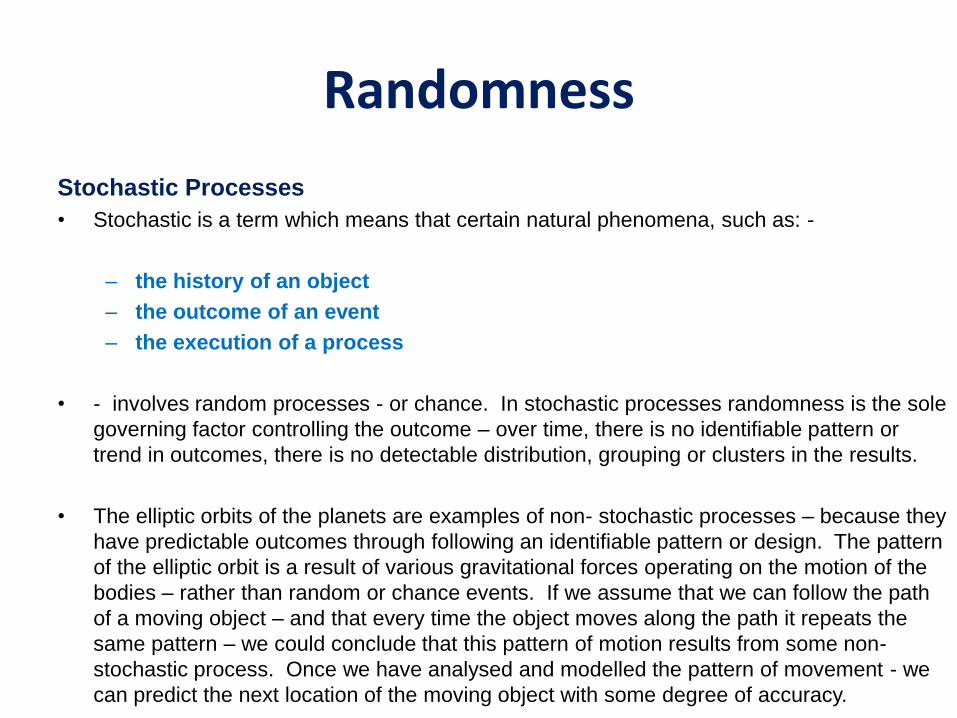
Randomness
Stochastic Processes
• Stochastic is a term which means that certain natural phenomena, such as: -
– the history of an object
– the outcome of an event
– the execution of a process
• - involves random processes - or chance. In stochastic processes randomness is the sole
governing factor controlling the outcome – over time, there is no identifiable pattern or
trend in outcomes, there is no detectable distribution, grouping or clusters in the results.
• The elliptic orbits of the planets are examples of non- stochastic processes – because they
have predictable outcomes through following an identifiable pattern or design. The pattern
of the elliptic orbit is a result of various gravitational forces operating on the motion of the
bodies – rather than random or chance events. If we assume that we can follow the path
of a moving object – and that every time the object moves along the path it repeats the
same pattern – we could conclude that this pattern of motion results from some non-
stochastic process. Once we have analysed and modelled the pattern of movement - we
can predict the next location of the moving object with some degree of accuracy.

Randomness
• If the movement of an object resulted from the operation of stochastic
processes, a repeating pattern of motion would not occur - and we would not
be able to predict with any accuracy the next location of the object as it move
down its path. Examples of stochastic processes include: - the translational
motion of atomic or molecular substances, such as the hydrogen ions in the
core of the sun; the outcomes from flipping a coin; etc. Stochastic processes
govern the outcome of games of chance – unless those games are “fixed”.
• Disruptive Future paradigms in Future Studies, when considered along with
Wave (String) Theory in Physics – alert us to the possibility of chaotic and
radically disruptive Random Events that generate ripples which propagate
outwards from the causal event like a wave – to flow across Space-Time.
Different waves might travel through the Time-Space continuum at slightly
different speeds due to the “viscosity” (granularity) in the substance of the
Space-Time Continuum (dark energy and dark matter).
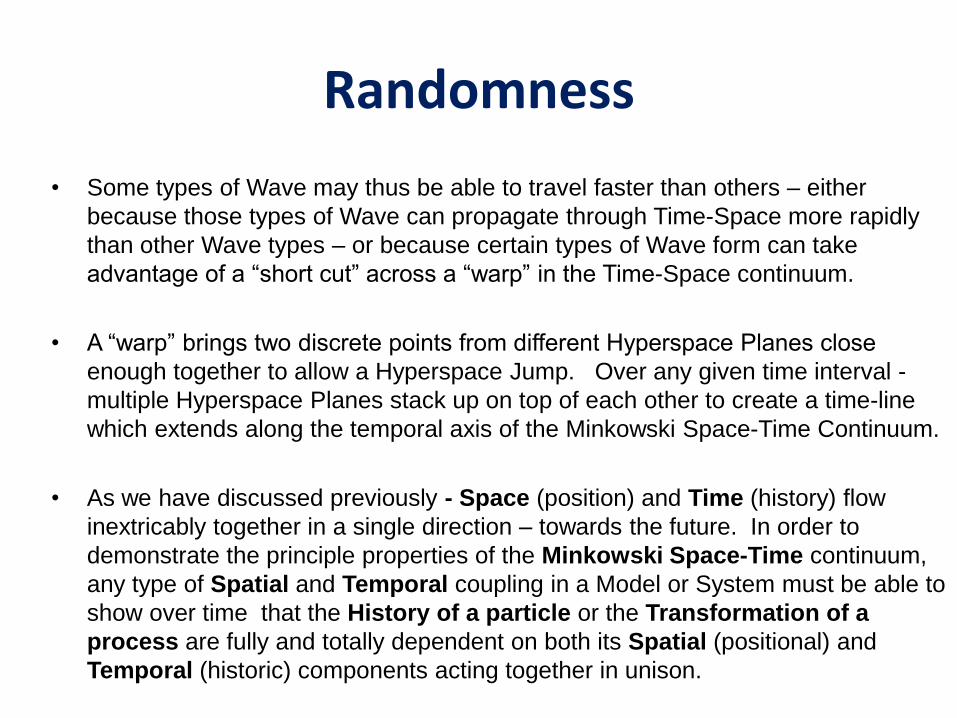
Randomness
• Some types of Wave may thus be able to travel faster than others – either
because those types of Wave can propagate through Time-Space more rapidly
than other Wave types – or because certain types of Wave form can take
advantage of a “short cut” across a “warp” in the Time-Space continuum.
• A “warp” brings two discrete points from different Hyperspace Planes close
enough together to allow a Hyperspace Jump. Over any given time interval -
multiple Hyperspace Planes stack up on top of each other to create a time-line
which extends along the temporal axis of the Minkowski Space-Time Continuum.
• As we have discussed previously - Space (position) and Time (history) flow
inextricably together in a single direction – towards the future. In order to
demonstrate the principle properties of the Minkowski Space-Time continuum,
any type of Spatial and Temporal coupling in a Model or System must be able to
show over time that the History of a particle or the Transformation of a
process are fully and totally dependent on both its Spatial (positional) and
Temporal (historic) components acting together in unison.

Randomness
• Neither data-driven nor model-driven representations of the future are capable
alone, and by themselves, of dealing with the effects of chaos (uncertainty). We
therefore need to consider and factor in further novel and disruptive system
modelling approaches in order to help us to understand how Natural Systems
(Cosmology, Climate) and Human Activity Systems (Economics, Sociology)
perform. Random, Chaotic and Disruptive Wild Card or Black Swan events
may thus be factored into our System Models in order to account for uncertainty.
• Horizon Scanning, Tracking and Monitoring techniques offer us the possibility to
manage uncertainty by searching for, detecting and identifying Weak Signals –
which are messages from Random Events coming towards us from the future.
Faint seismic disturbances warn us of coming of Earth-quakes and Tsunamis.
Weak Signals (seismic disturbances) may often be followed by Strong Signals
(changes in topology), Wild Card (volcanic eruptions) or Black Swan (pyroclastic
cloud and ocean wave events), Horizon Scanning may help us to use Systems
Modelling to predict Natural Events like Earth-quakes and Tsunamis – as well as
Biological processes such as the future of Ecosystems, and Human Processes
such as the cyclic rise and fall of Commodity, Stocks and Shares market prices.

The Nature of Randomness – Uncertainty
• Randomness makes any precise prediction of future outcomes impossible.
We are unable to predict any future outcome with any significant degree of
confidence or accuracy – due to the inherent presence of uncertainty
associated with Complex Systems. Randomness in Complex Systems
introduces chaos and disorder – causing disruption. Events no longer continue
to unfold along a smooth, predictable linear course leading towards an
inevitable outcome – instead, we experience surprises.
• What we can do, however, is to identify the degree of uncertainty present in
those Systems, based on known, objective measures of System Order and
Complexity - the number and nature of elements present in the system, and the
number and nature of relationships which exist between those System
elements. This in turn enables us to describe the risk associated with possible,
probable and alternative Scenarios, and thus equips us to be able to forecast
risk and the probability of each of those future Scenarios materialising.

Complex Systems and Chaos Theory
Complex Systems and Chaos Theory has been used extensively in the field of Futures Studies, Strategic
Management, Natural Sciences and Behavioural Science. It is applied in these domains to understand
how individuals within populations, societies, economies and states act as a collection of loosely
coupled interacting systems which adapt to changing environmental factors and random events – bio-ecological, socio-economic or geo-political.....

Linear and Non-linear Systems
Linear Systems – all system outputs are directly and proportionally related to system inputs
• Types of linear algebraic function behaviours; examples of Simple Systems include: -
– Game Theory and Lanchester Theory
– Civilisations and SIM City Games
– Drake Equation (SETI) for Galactic Civilisations
Non-linear Systems – system outputs are asymmetric and not proportional or related to inputs
• Types of non-linear algebraic function behaviours: examples of Complex / Chaotic Systems are: -
– Complex Systems – large numbers of elements with both symmetric and asymmetric relationships
– Complex Adaptive Systems (CAS) – co-dependency and co-evolution with external systems
– Multi-stability – alternates between multiple exclusive states.(lift status = going up, down, static)
– Chaotic Systems
• Classical chaos – the behaviour of a chaotic system cannot be predicted.
• A-periodic oscillations – functions that do not repeat values after a certain period (# of cycles)
– Solitons – self-reinforcing solitary waves - due to feedback by forces within the same system
– Amplitude death – any oscillations present in the system cease after a certain period (# of cycles)
due to feedback by forces in the same system - or some kind of interaction with external systems.
– Navis-Stokes Equation for the motion of a fluid: -
• Weather Forecasting
• Plate Tectonics and Continental Drift
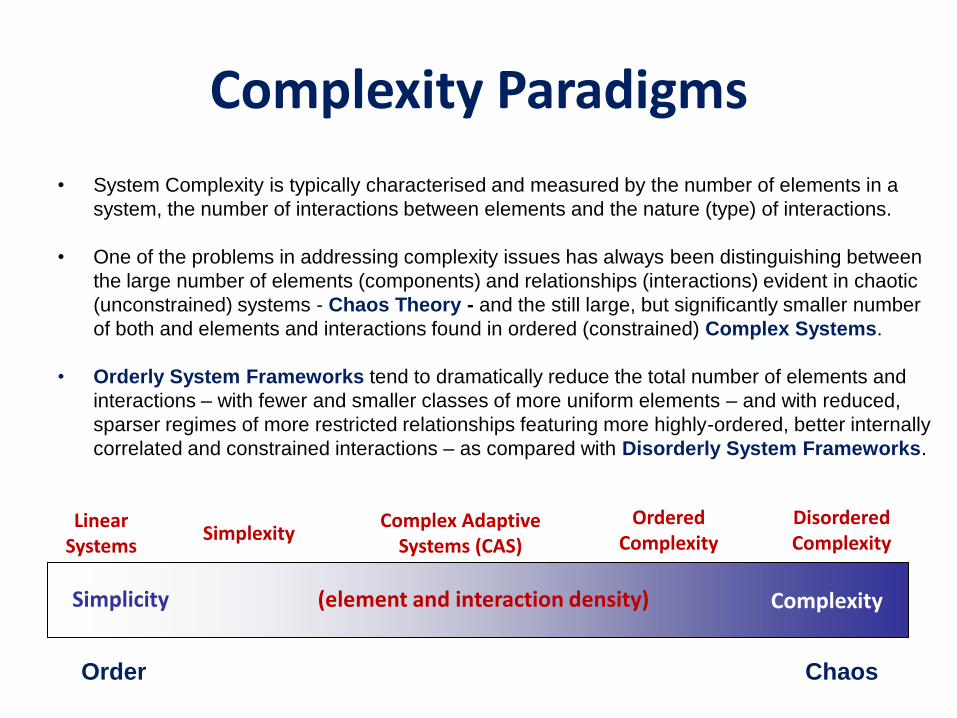
Complexity Paradigms
• System Complexity is typically characterised and measured by the number of elements in a
system, the number of interactions between elements and the nature (type) of interactions.
• One of the problems in addressing complexity issues has always been distinguishing between
the large number of elements (components) and relationships (interactions) evident in chaotic
(unconstrained) systems - Chaos Theory - and the still large, but significantly smaller number
of both and elements and interactions found in ordered (constrained) Complex Systems.
• Orderly System Frameworks tend to dramatically reduce the total number of elements and
interactions – with fewer and smaller classes of more uniform elements – and with reduced,
sparser regimes of more restricted relationships featuring more highly-ordered, better internally
correlated and constrained interactions – as compared with Disorderly System Frameworks.
Complexity Simplicity
Simplexity Ordered
Complexity Disordered Complexity
Complex Adaptive Systems (CAS)
Linear Systems
(element and interaction density)
Chaos Order
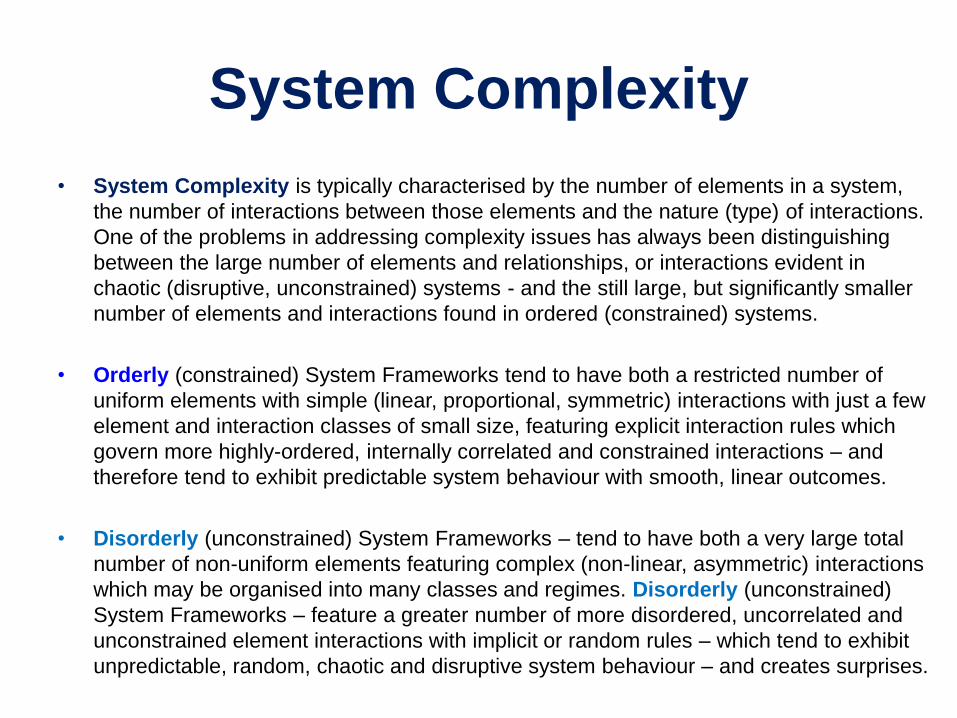
System Complexity
• System Complexity is typically characterised by the number of elements in a system,
the number of interactions between those elements and the nature (type) of interactions.
One of the problems in addressing complexity issues has always been distinguishing
between the large number of elements and relationships, or interactions evident in
chaotic (disruptive, unconstrained) systems - and the still large, but significantly smaller
number of elements and interactions found in ordered (constrained) systems.
• Orderly (constrained) System Frameworks tend to have both a restricted number of
uniform elements with simple (linear, proportional, symmetric) interactions with just a few
element and interaction classes of small size, featuring explicit interaction rules which
govern more highly-ordered, internally correlated and constrained interactions – and
therefore tend to exhibit predictable system behaviour with smooth, linear outcomes.
• Disorderly (unconstrained) System Frameworks – tend to have both a very large total
number of non-uniform elements featuring complex (non-linear, asymmetric) interactions
which may be organised into many classes and regimes. Disorderly (unconstrained)
System Frameworks – feature a greater number of more disordered, uncorrelated and
unconstrained element interactions with implicit or random rules – which tend to exhibit
unpredictable, random, chaotic and disruptive system behaviour – and creates surprises.
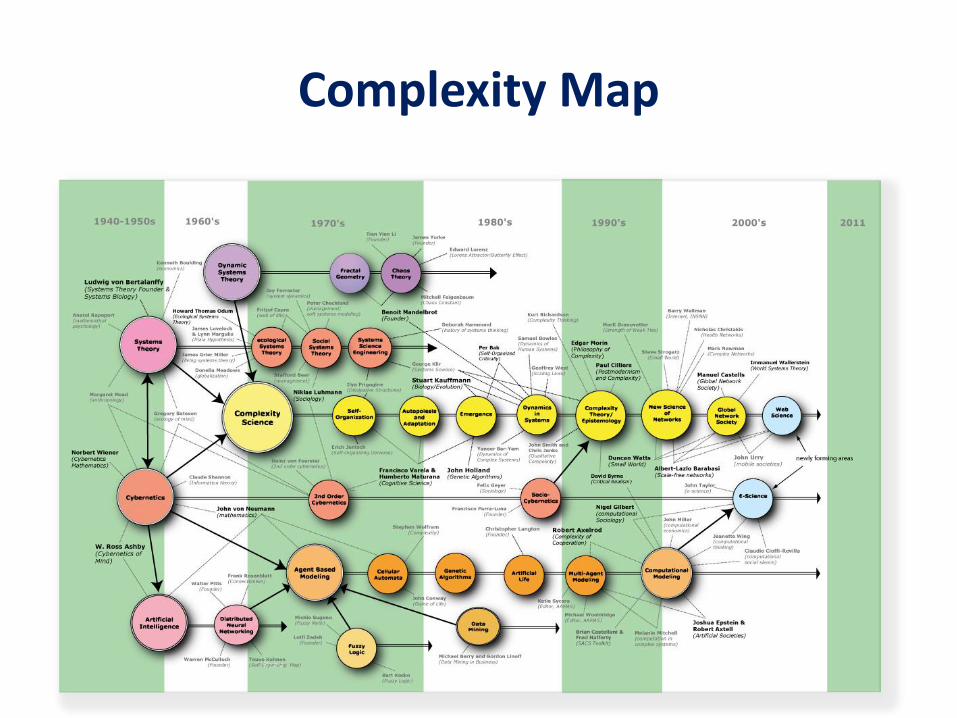
Complexity Map

Complex Systems and Chaos Theory
• A system may be defined as simple or linear whenever its evolution sensitively is fully
independent of its initial conditions – and may also be described as deterministic
whenever the behaviour of a simple (linear) systems can be accurately predicted and
when all of the observable system outputs are directly and proportionally related to
system inputs. We can expect smooth, linear, highly predictable outcomes to simple
systems which are driven by linear algebraic functions.
• A system may be described as chaotic whenever the system evolution sensitively is
fully dependant upon its initial conditions – and may also be defined as probabilistic –
whenever the behaviour of that stochastic system cannot be predicted. This property
of dependency on initial conditions in chaotic systems implies that from any two invisibly
different starting points or variations in starting conditions – then their trajectories begin
to diverge – and the degree of separation between the two trajectories increases
exponentially over the course of time. In this way, over numerous System Cycles –
invisibly small differences in initial conditions are amplified until they become radically
divergent, eventually producing totally unexpected results with unpredictable outcomes.
Instead of smooth, linear outcomes – we experience surprises. This is why complex,
chaotic systems such as weather and the economy – are impossible to accurately
predict. What we can do, however, is to describe possible, probable and alternative
future scenarios – and calculate the probability of each of those scenarios materialising.
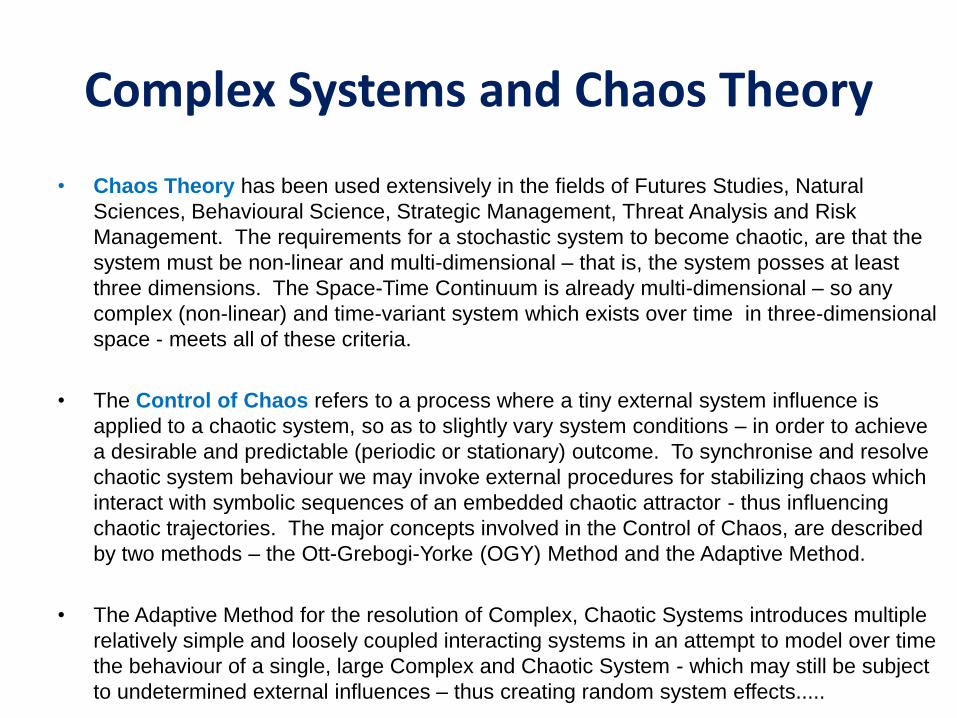
Complex Systems and Chaos Theory
• Chaos Theory has been used extensively in the fields of Futures Studies, Natural
Sciences, Behavioural Science, Strategic Management, Threat Analysis and Risk
Management. The requirements for a stochastic system to become chaotic, are that the
system must be non-linear and multi-dimensional – that is, the system posses at least
three dimensions. The Space-Time Continuum is already multi-dimensional – so any
complex (non-linear) and time-variant system which exists over time in three-dimensional
space - meets all of these criteria.
• The Control of Chaos refers to a process where a tiny external system influence is
applied to a chaotic system, so as to slightly vary system conditions – in order to achieve
a desirable and predictable (periodic or stationary) outcome. To synchronise and resolve
chaotic system behaviour we may invoke external procedures for stabilizing chaos which
interact with symbolic sequences of an embedded chaotic attractor - thus influencing
chaotic trajectories. The major concepts involved in the Control of Chaos, are described
by two methods – the Ott-Grebogi-Yorke (OGY) Method and the Adaptive Method.
• The Adaptive Method for the resolution of Complex, Chaotic Systems introduces multiple
relatively simple and loosely coupled interacting systems in an attempt to model over time
the behaviour of a single, large Complex and Chaotic System - which may still be subject
to undetermined external influences – thus creating random system effects.....
Complex Adaptive Systems Adaption and Evolution
When Systems demonstrate properties of Complex
Adaptive Systems (CAS) - often defined as a
collection or set of relatively simple and loosely
connected interacting systems exhibiting co-adapting
and co-evolving behaviour - then those systems are
much more likely to adapt successfully to their
environment and, thus better survive the impact of both
gradual change and of sudden random events.
Complex Adaptive Systems
• Complex Adaptive Systems (CAS) and Chaos Theory has also been
used extensively in the field of Futures Studies, Strategic Management,
Natural Sciences and Behavioural Science. It is applied in these domains
to understand how individuals within populations, societies, economies and
states act as a collection of loosely coupled interacting systems which
adapt to changing environmental factors and random events – biological,
ecological, socio-economic or geo-political.
• Complex Adaptive Systems (CAS) and Chaos Theory treats individuals,
crowds and populations as a collective of pervasive social structures which
may be influenced by random individual behaviours – such as flocks of
birds moving together in flight to avoid collision, shoals of fish forming a
“bait ball” in response to predation, or groups of individuals coordinating
their behaviour in order to respond to external stimuli – the threat of
predation or aggression – or in order to exploit novel and unexpected
opportunities which have been discovered or presented to them.

Complex Adaptive Systems
• When Systems demonstrate properties of Complex Adaptive Systems (CAS) - which is
often defined as a collection or set of relatively simple and loosely connected interacting
systems exhibiting co-adapting and co-evolving behaviour (sub-systems or components
changing together in response to the same external stimuli) - then those systems are
much more likely to adapt successfully to their environment and, thus better survive the
impact of both gradual change and of sudden random events. Complexity Theory
thinking has been present in biological, strategic and organisational system studies since
the first inception of Complex Adaptive Systems (CAS) as an academic discipline.
• Complex Adaptive Systems are further contrasted compared with other ordered and
chaotic systems by the relationship that exists between the system and the agents and
catalysts of change which act upon it. In an ordered system the level of constraint means
that all agent behaviour is limited to the rules of the system. In a chaotic system these
agents are unconstrained and are capable of random events, uncertainty and disruption.
In a CAS, both the system and the agents co-evolve together; the system acting to
lightly constrain the agents behaviour - the agents of change, however, modify the
system by their interaction. CAS approaches to behavioural science seek to understand
both the nature of system constraints and change agent interactions and generally takes
an evolutionary or naturalistic approach to crowd scenario planning and impact analysis.

Complex Adaptive Systems
• Biological, Sociological, Economic and Political systems all tend to demonstrate
Complex Adaptive System (CAS) behaviour - which appears to be more similar
in nature to biological behaviour in an population than to truly Disorderly, Chaotic,
Stochastic Systems (“Random” Systems). For example, the remarkable long-term
adaptability, stability and resilience of market economies may be demonstrated by
the impact of Black Swan Events causing stock market crashes - such as oil price
shocks (1970-72) and credit supply shocks (1927- 1929 and 2008 onwards) – by
the ability of Financial markets to rapidly absorb and recover from these events.
• Unexpected and surprising Cycle Pattern changes have historically occurred during
regional and global conflicts being fuelled by technology innovation-driven arms
races - and also during US Republican administrations (Reagan and Bush - why?).
Just as advances in electron microscopy have revolutionised the science of biology
- non-stationary time series wave-form analysis has opened up a new space for
Biological, Sociological, Economic and Political system studies and diagnostics.
Crowd Behaviour – the Swarm
• An example of Random Clustering is a Crowd or Swarm. There are a various forces
which contribute towards Crowd Behaviour – or Swarming. In any crowd of human
beings or a swarm of animals, individuals in the crowd or swarm are closely connected
so that they share the same mood and emotions (fear, greed, rage) and demonstrate
the same or very similar behaviour (fight, flee or feeding frenzy). Only the initial few
individuals exposed to the Random Event or incident may at first respond strongly and
directly to the initial “trigger” stimulus, causal event or incident (opportunity or threat –
such as external predation, aggression or discovery of a novel or unexpected
opportunity to satisfy a basic need – such as feeding, reproduction or territorialism).
• Those individuals who have been directly exposed to the initial “trigger” event or incident -
the system input or causal event that initiated a specific outbreak of behaviour in a crowd or
swarm – quickly communicate and propagate their swarm response mechanism and share
with all the other individuals – those members of the Crowd immediately next to them – so
that modified Crowd behaviour quickly spreads from the periphery or edge of the Crowd.
• Peripheral Crowd members in turn adopt Crowd response behaviour without having been
directly exposed to the “trigger”. Members of the crowd or swarm may be oblivious to the
initial source or nature of the trigger stimulus - nonetheless, the common Crowd behaviour
response quickly spreads to all of the individuals in or around that core crowd or swarm.

Crowd Behaviour – the Swarm
• One of the dangers posed by human crowd behaviour is that of “de-individualisation” in a
crowd, where a group of random individuals aggregate together and begin acting in concert
- adopting common behaviour, aims and objectives – and may begin to exhibit uninhibited
crowd responses to external information and stimuli. Crowd participants in this state begin
to respond without the usual constraints of their normal social, ethical, moral, religious and
behavioural rules. These are the set of circumstances which led to events such as the Arab
Spring and London Riots - which spread rapidly through deprived communities across the
country, both urban and rural. This type of collective group behaviour – such as a “feeding
frenzy” – has been observed in primates and carnivores - and even in rodents and fish.....
• Crowd behaviour is not just the domain of Demonstrators and Protesters - it can also be
seen in failing economies with the actions of Economic Planners in Central Banks - along
with their Political Masters – who also behave as a group of individuals acting together in
concert without the usual constraints – and thus, under extreme psychological stress as
systems such as the economy begins to collapse unpredictably – start to demonstrate "de-
individualisation" - collective uninhibited responses to external information and stimuli,
without the constraints of their normal political, economic, social, ethical, moral and
behavioural rules. These circumstances may lead to further panic and crowd behaviour
across Towns and Cities, Banks and Financial Institutions, ultimately Municipal, State and
Federal government departments - causing the failure of Global Markets or the fall of
Governments – as was recently witnessed in both the Arab Spring and the Euro Crisis.
Wave-form Analytics in Cycles
• Wave-form Analytics is a powerful new analytical tool “borrowed” from spectral
wave frequency analysis in Physics – which is based on Time-frequency analysis –
a technique which exploits the wave frequency and time symmetry principle. This is
introduced here for the first time in the study of natural and human activity waves,
and in the field of economic cycles, business cycles, market patterns and trends.
• Trend-cycle decomposition is a critical technique for testing the validity of multiple
(compound) dynamic wave-form models competing in a complex array of
interacting and inter-dependant cyclic systems in the study of complex cyclic
phenomena - driven by both deterministic and stochastic (probabilistic) paradigms.
In order to study complex periodic economic phenomena there are a number of
competing analytic paradigms – which are driven by either deterministic methods
(goal-seeking - testing the validity of a range of explicit / pre-determined / pre-
selected cycle periodicity value) and stochastic (random / probabilistic / implicit -
testing every possible wave periodicity value - or by identifying actual wave
periodicity values from the “noise” – harmonic resonance and interference patterns).
Wave-form Analytics in Cycles
• A fundamental challenge found everywhere in business cycle theory is how to
interpret very large scale / long period compound-wave (polyphonic) time series data
sets which are dynamic (non-stationary) in nature. Wave-form Analytics is a new
analytical too based on Time-frequency analysis – a technique which exploits the
wave frequency and time symmetry principle. The role of time scale and preferred
reference from economic observation are fundamental constraints for Friedman's
rational arbitrageurs - and will be re-examined from the viewpoint of information
ambiguity and dynamic instability.
• The Wigner-Gabor-Qian (WGQ) spectrogram demonstrates a distinct capability for
revealing multiple and complex superimposed cycles or waves within dynamic, noisy
and chaotic time-series data sets. A variety of competing deterministic and
stochastic methods, including the first difference (FD) and Hodrick-Prescott (HP)
filter - may be deployed with the multiple-frequency mixed case of overlaid cycles
and system noise. The FD filter does not produce a clear picture of business cycles
– however, the HP filter provides us with strong results for pattern recognition of
multiple co-impacting business cycles. The existence of stable characteristic
frequencies in large economic data aggregations (“Big Data”) provides us with strong
evidence and valuable information about the structure of Business Cycles.

Wave-form Analytics in Cycles
Wave-form Analytics in Natural Cycles
• Solar, Oceanic and Atmospheric Climate Forcing systems demonstrate Complex Adaptive
System (CAS) behaviour – behaviour which is more similar to an organism than that of
random and chaotic “Stochastic” systems. The remarkable long-term stability and
sustainability of cyclic climatic systems contrasted with random and chaotic short-term
weather systems are demonstrated by the metronomic regularity of climate pattern
changes driven by Milankovich Solar Cycles along with 1470-year Dansgaard-Oeschger
and Bond Cycles – regular and predictable and Oceanic Forcing Climate Sub-systems.
Wave-form Analytics in Human Activity Cycles
• Economic systems also demonstrate Complex Adaptive System (CAS) behaviour - more
similar to an ecology than chaotic “Random” systems. The capacity of market economies
for cyclic “boom and bust” – financial crashes and recovery - can be seen from the impact
of Black Swan Events causing stock market crashes - such as the failure of sovereign
states (Portugal, Ireland, Greece, Iceland, Italy and Spain) and market participants
(Lehman Brothers) due to oil price shocks, money supply shocks and credit crises.
Surprising pattern changes occurred during wars, arm races, and during the Reagan
administration. Like microscopy for biology, non-stationary time series analysis opens up
a new space for business cycle studies and policy diagnostics.

The Temporal Wave
• The Temporal Wave is a novel and innovative method for Visual Modelling and Exploration
of Geospatial “Big Data” - simultaneously within a Time (history) and Space (geographic)
context. The problems encountered in exploring and analysing vast volumes of spatial–
temporal information in today's data-rich landscape – are becoming increasingly difficult to
manage effectively. In order to overcome the problem of data volume and scale in a Time
(history) and Space (location) context requires not only traditional location–space and
attribute–space analysis common in GIS Mapping and Spatial Analysis - but now with the
additional dimension of time–space analysis. The Temporal Wave supports a new method
of Visual Exploration for Geospatial (location) data within a Temporal (timeline) context.
• This time-visualisation approach integrates Geospatial (location) data within a Temporal
(timeline) data along with data visualisation techniques - thus improving accessibility,
exploration and analysis of the huge amounts of geo-spatial data used to support geo-
visual “Big Data” analytics. The temporal wave combines the strengths of both linear
timeline and cyclical wave-form analysis – and is able to represent data both within a Time
(history) and Space (geographic) context simultaneously – and even at different levels of
granularity. Linear and cyclic trends in space-time data may be represented in combination
with other graphic representations typical for location–space and attribute–space data-
types. The Temporal Wave can be used in roles as a time–space data reference system,
as a time–space continuum representation tool, and as time–space interaction tool.


Horizon and Environment Scanning, Tracking and Monitoring Processes
• Horizon and Environment Scanning Event Types – refer to Weak Signals of any unforeseen,
sudden and extreme Global-level transformation or change Future Events in either the military,
political, social, economic or environmental landscape - having an inordinately low probability of
occurrence - coupled with an extraordinarily high impact when they do occur (Nassim Taleb).
• Horizon Scanning Event Types
– Technology Shock Waves
– Supply / Demand Shock Waves
– Political, Economic and Social Waves
– Religion, Culture and Human Identity Waves
– Art, Architecture, Design and Fashion Waves
– Global Conflict – War, Terrorism, and Insecurity Waves
• Environment Scanning Event Types
– Natural Disasters and Catastrophes
– Human Activity Impact on the Environment - Global Massive Change Events
• Weak Signals – are messages, subliminal temporal indicators of ideas, patterns, trends or
random events coming to meet us from the future – or signs of novel and emerging desires,
thoughts, ideas and influences which may interact with both current and pre-existing patterns
and trends to predicate impact or effect some change in our present or future environment.

Natural Cycle Types
• Cosmic Processes – ultra long-term Astronomic changes (e.g. galactic and solar system events)
• Geological Processes – very long-term global change e.g. Mountain Building, Volcanic Activity
• Biological Processes – Evolution (terra-forming effects) Carbon, Nitrogen, Oxygen and Sulphur Cycles
• Solar Forcing – long-term periodic change in Insolation (solar radiation) due to Milankovitch Cycles
• Oceanic Forcing – Oceanic Cycles - currents and climate systems – temperature, salinity, oscillation,
• Atmospheric Forcing – rapid change in air temperature - weather systems and Ice / melt-water Cycles
• Human Processes – Human Activity (agriculture, industrialisation) and impact on Climate Change
• Atomic / Sub-atomic Processes –
– Classical Mechanics (Newtonian Physics) – governs the behaviour of all everyday objects
– Quantum Mechanics – governs the behaviour of unimaginably small sub-atomic particles
– Relativity Theory – governs the behaviour of impossibly super-massive cosmic structures
– Wave Mechanics (String Theory) – integrates the behaviour of every size & type of object

Wave Theory – Natural Cycles
Milankovitch Solar Orbit Climate Cycles • Milankovitch Cycles are a Composite Harmonic Wave Series built up from individual wave-forms with
periodicity of 20-100 thousand years - exhibiting multiple wave harmonics, resonance and interference
patterns. Over very long periods of astronomic time Milankovitch Cycles and Sub-cycles have been
beating out precise periodic waves, acting in concert together, like a vast celestial metronome.
• From the numerous geological examples found in Nature including ice-cores, marine sediments and
calcite deposits, we know that Composite Wave Models such as Milankovitch Cycles behave as a
Composite Wave Series with automatic, self-regulating control mechanisms - and demonstrate
Harmonic. Resonance and Interference Patters with extraordinary stability in periodicity through
many system cycles over durations measured in tens of millions of years.
• Climatic Change and the fundamental astronomical and climatic cyclic variation frequencies are
coherent, strongly aligned and phase-locked with the predictable orbital variation of 20-100 k.y
Milankovitch Climatic Cycles – which have been modeled and measured for many iterations, over a
prolonged period of time, and across many levels of temporal tiers - each tier hosting different types of
geological processes, which in turn influence different layers of Human Activity.
• Milankovitch Cycles - are precise astronomical cycles with periodicities of 22, 41, 100 and 400 k.y
– Precession (Polar Wandering) - 22,000 year cycle
– Eccentricity (Orbital Ellipse) 100,000 and 400,000 year cycles
– Obliquity (Axial Tilt) - 41,000-year cycle
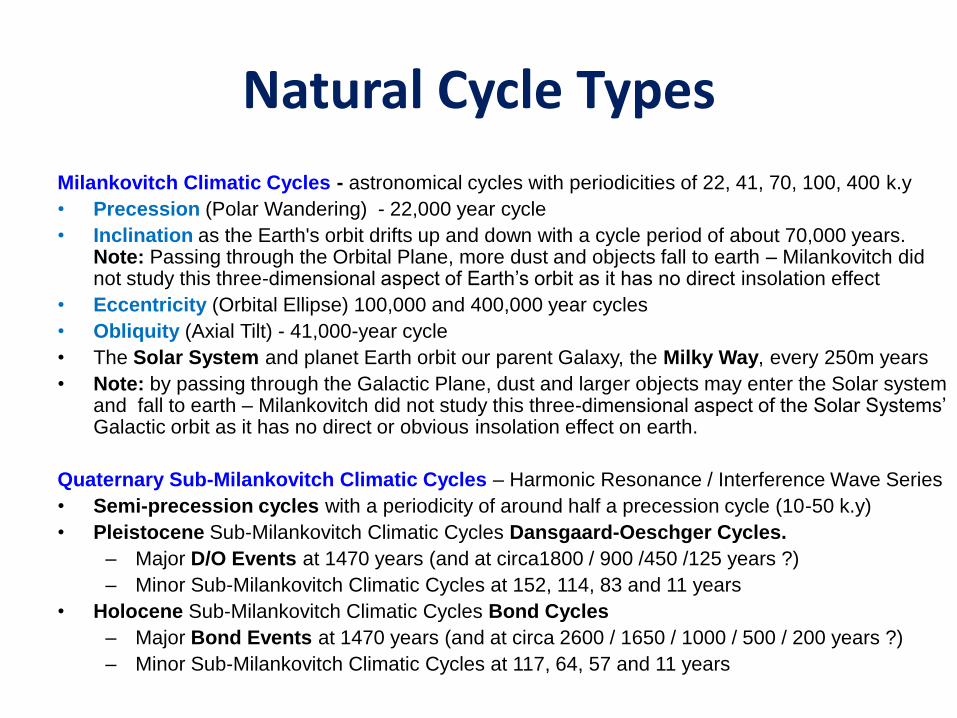
Natural Cycle Types
Milankovitch Climatic Cycles - astronomical cycles with periodicities of 22, 41, 70, 100, 400 k.y
• Precession (Polar Wandering) - 22,000 year cycle
• Inclination as the Earth's orbit drifts up and down with a cycle period of about 70,000 years. Note: Passing through the Orbital Plane, more dust and objects fall to earth – Milankovitch did not study this three-dimensional aspect of Earth’s orbit as it has no direct insolation effect
• Eccentricity (Orbital Ellipse) 100,000 and 400,000 year cycles
• Obliquity (Axial Tilt) - 41,000-year cycle
• The Solar System and planet Earth orbit our parent Galaxy, the Milky Way, every 250m years
• Note: by passing through the Galactic Plane, dust and larger objects may enter the Solar system and fall to earth – Milankovitch did not study this three-dimensional aspect of the Solar Systems’ Galactic orbit as it has no direct or obvious insolation effect on earth.
Quaternary Sub-Milankovitch Climatic Cycles – Harmonic Resonance / Interference Wave Series
• Semi-precession cycles with a periodicity of around half a precession cycle (10-50 k.y)
• Pleistocene Sub-Milankovitch Climatic Cycles Dansgaard-Oeschger Cycles.
– Major D/O Events at 1470 years (and at circa1800 / 900 /450 /125 years ?)
– Minor Sub-Milankovitch Climatic Cycles at 152, 114, 83 and 11 years
• Holocene Sub-Milankovitch Climatic Cycles Bond Cycles
– Major Bond Events at 1470 years (and at circa 2600 / 1650 / 1000 / 500 / 200 years ?)
– Minor Sub-Milankovitch Climatic Cycles at 117, 64, 57 and 11 years

Natural Cycle Types
STELLIUM – Major Multi-planetary Conjunctions – 40 years
• Planetary orbital periods (in earth Years)
– Mercury – 0.24 Years
– Venus - 0.52
– Earth - 1
– Mars - 1.88
– Jupiter – 11.86
– Saturn – 29.46
– Uranus – 84.01
– Neptune – 184.80
Natural Cycles in Astronomy – the Solar System
• Solar Activity Cycle – Sunspot Cycles – 11 years
• Southern Oscillation - El Nino / La Nina (Warm / Cold Water Periodicity in the Pacific @ 3, 5 & 7 years)
• Natural Seasonal Cycles – Diurnal to Annual (1 day to 1 year)
– Tidal – Diurnal (twice daily), 12 hours (Earth Rotation + Moon Orbit)
– Day-Night Cycle – Daily, 24 hours (Earth Rotation)
– Lunar Month – Monthly, 28 Days (Moon Orbit of the Earth)
– Solar Year - Seasonal Cycle – Annual, 1 Year (Earth Orbit of the Sun)

Wave Theory – Natural Cycles
Sub-Milankovitch Climatic Cycles • Sub-Milankovitch Climatic Cycles are less well understood – varying from Sun Cycles of 11 years
to Climatic Variation Trends of up to 1470 years intervals, may also impact on Human Activity –
short-term Economic Patterns, Cycles and Innovation Trends – to long-term Technology Waves and
the rise and fall of Civilizations. A possible explanation might be found in Resonance Harmonics of
Milankovitch-Cycles 20-100 ky / sub-Cycle Periodicity - resulting in Interference Phenomenon from
periodic waves being re-enforced and cancelled. Dansgaard-Oeschger (D/O) events – with precise
1470 years intervals - occurred repeatedly throughout much of the late Quaternary Period.
Dansgaard-Oeschger (D/O) events were first reported in Greenland ice cores by scientists Willi
Dansgaard and Hans Oeschger. Each of the 25 observed D/O events in the Quaternary Glaciation
Time Series consist of an abrupt warming to near-interglacial conditions that occurred in a matter of
decades - followed by a long period of gradual cooling down again over thousands of years
• Sub-Milankovitch Climatic Cycles - Harmonic. Resonance and Interference Wave Series
– Solar Forcing Climatic Cycle at 300-Year, 36 and 11 years
• Grand Solar Cycle at 300 years with 36 and 11 year Harmonics
• Sunspot Cycle at 11years
– Oceanic Forcing Climatic Cycles at 1470 years (and at 490 / 735 / 980 years ?)
• Dansgaard-Oeschger Cycles – Quaternary
• Bond Cycles - Pleistocene
– Atmospheric Forcing Climatic Cycles at 117, 64, 57 and 11 years
• North Atlantic Climate Anomalies
• Southern Oscillation - El Nino / La Nina
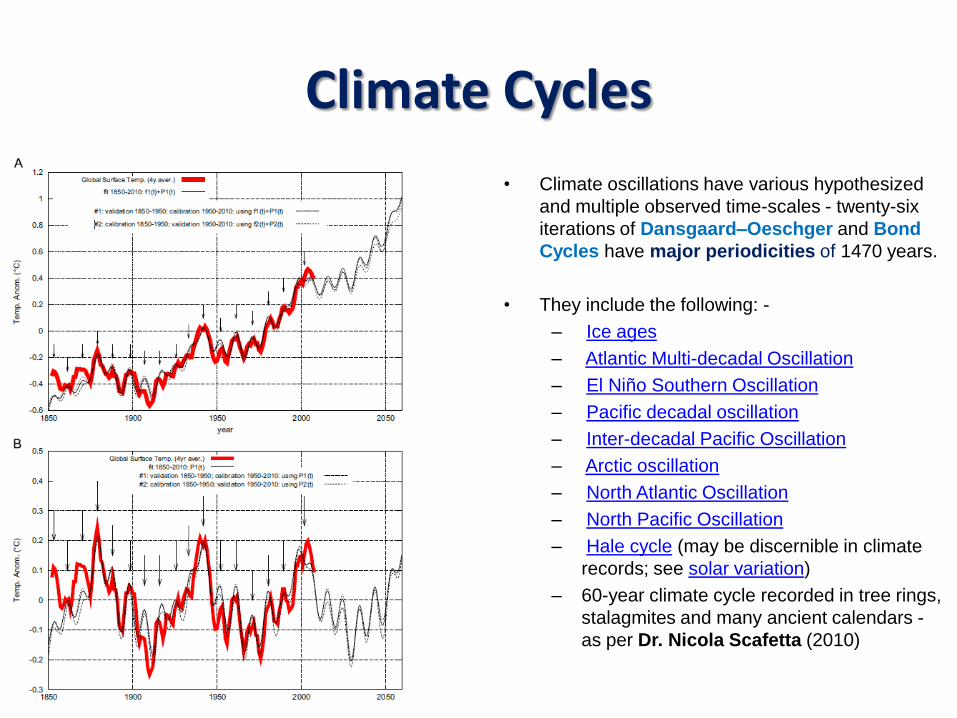
Climate Cycles
• Climate oscillations have various hypothesized
and multiple observed time-scales - twenty-six
iterations of Dansgaard–Oeschger and Bond
Cycles have major periodicities of 1470 years.
• They include the following: -
– Ice ages
– Atlantic Multi-decadal Oscillation
– El Niño Southern Oscillation
– Pacific decadal oscillation
– Inter-decadal Pacific Oscillation
– Arctic oscillation
– North Atlantic Oscillation
– North Pacific Oscillation
– Hale cycle (may be discernible in climate
records; see solar variation)
– 60-year climate cycle recorded in tree rings,
stalagmites and many ancient calendars -
as per Dr. Nicola Scafetta (2010)

Natural Cycles and Human Activity
Dr. Nicola Scafetta - solar-lunar cycle climate forecast -v- global temperature
• Dr. Nicola Scafetta has developed novel statistical techniques for studying the scaling
exponents of time series-analysis and their fractal/multi-fractal scaling properties. For
example, the Diffusion Entropy Analysis, when used together with more traditional
variance-based methodologies, allows the discrimination among fractal noises generated
by alternative dynamics such as fractal Brownian motion and Levy-walk signals.
• In his recent publications, Dr. Nicola Scafetta has proposed a harmonic wave model to
explain recent observed changes in the global climate - comprised of four major decadal
and multi-decadal cycles (periodicity 9.1, 10.4, 20 and 60 years) - which are not only
consistent with the four major solar / lunar / astronomical cycles – including a corrected
anthropogenic net warming contribution – plus they demonstrate surprising approximate
coincidence with Business Cycles from Joseph Schumpters Economic Wave Series
• The model was not only able to reconstruct the historic decadal patterns of the
temperature since 1850 better than any general circulation model (GCM) adopted by the
IPCC in 2007, but it is apparently able to better forecast the actual temperature pattern
observed since 2000. Note that since 2000 the proposed model is a full forecast. Will the
forecast hold, or is the proposed model is just another failed attempt to forecast climate
change? Only time will tell.....
Scafetta on his latest paper: Harmonic climate model versus the IPCC general circulation climate models


NATURAL CYCLES and HUMAN ACTIVITY
• Infinitesimally small differences may be imperceptible to the point of invisibility - how tiny can
influences be to have any effect ? Such influences may take time to manifest themselves –
perhaps not appearing as a measurable effect until many system cycle iterations have been
completed – such is the nature of the "strange attractor." effect. This phenomenon is captured in
the Climate Change “butterfly scenario” example, which is described elsewhere.
• Climate change is not uniform – some areas of the globe (Arctic and Antarctica) have seen a
dramatic rise in average annual temperature whilst other areas have seen lower temperature
gains. The original published temperature record for Climate Change is in red, while the updated
version is in blue. The black curve is the proposed harmonic component plus the proposed
corrected anthropogenic warming trend. The figure shows in yellow the harmonic component
alone made of the four cycles, which may be interpreted as a lower boundary limit for the natural
variability. The green area represents the range of the IPCC 2007 GCM projections.
• The astronomical / harmonic model forecast since 2000 looks in good agreement with the data
gathered up to now, whilst the IPCC model projection is not in agreement with the steady
temperature observed since 2000. This may be due to other effects, such as cooling due to
increased water evaporation (humidity has increased about 4% since measurements began in the
18th centaury) or cloud seeded by jet aircraft condensation trails – which reduce solar forcing by
reflecting energy back into space. Both short-term solar-lunar cycle climate forecasting and
long-term Milankovitch solar forcing cycles point towards a natural cyclic phase of gradual
cooling - which partially off-sets those Climate Change factors (Co2 etc.) due to Human Actions.
Scafetta on his latest paper: Harmonic climate model versus the IPCC general circulation climate models


Climate Cycles
• It also appears that many Human Activity Waves - Business, Social, Political, Economic, Historic and
Pre-historic (Archaeology) Cycles - may be compatible with, and map onto, the twenty-six iterations of
Dansgaard–Oeschger and Bond Cycles with major periodicity 1470 years (and 800 to 1000 years): -
• Oceanic Climate Forcing Cycles: – Duration of Civilisations: -
– Bronze Age City States (2100 – 900 BC)
– Iron Age Mercantile City States – Armies and Empires – (Iron Age Cold Epoch - 900 BC to about 300 BC)
– Western Roman Empire (300 BC – 500 AD)
– Eastern Roman Empire (500 – 1300 AD)
– Islamic Empire – (800 - 1300 AD)
– Vikings and Normans - Nordic Ascendency (700-1500 AD – Medieval Climate Anomaly or “mini Ice Age”)
– The British Empire - Anglo-French Rivalry – Norman Conquest to Entente Cordial (1066 -1911)
– The America s- Mayan, Inca and Aztec Civilisations and Pueblo Indians (Anastasia) – drought in South-Western USA
– Asia - Chinese, Indus Valley and Khmer Civilisation (Amkor)
– Pacific -Polynesian Expansion- Hawaii to Easter Island and New Zealand
• Solar Climate Forcing - Milankovitch Cycles – Solar Insolation driving Quaternary Ice Age Cycles: –
• Pleistocene and Holocene Ice Age Cycles – long, gradual cooling (Ice-ages - Pluvials) followed by rapid Climate Warming
(inter-pluvials) - causing the extinction of Mammoths, Mastodons – with Clovis, Soloutrean and Neanderthal Cultures
• Major Geological Extinction-level Events - Global Kill Moments
– Pre-Cambrian and Cambrian Extinction Events – 1000-542 million years ago
– Permian-Triassic Boundary (PTB) Event – 251.4 million years ago
– Cretaceous – Tertiary Boundary Event – 65 million years ago
– Global Massive Change – Impact of Human Activity – 20,000 years ago to present day (ongoing)
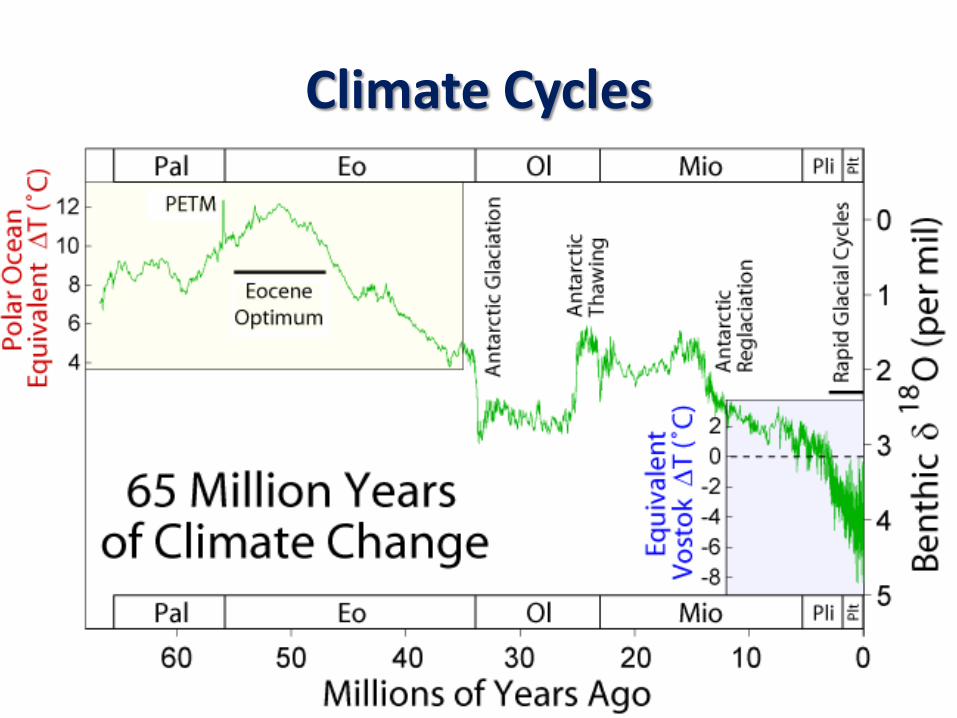
Climate Cycles

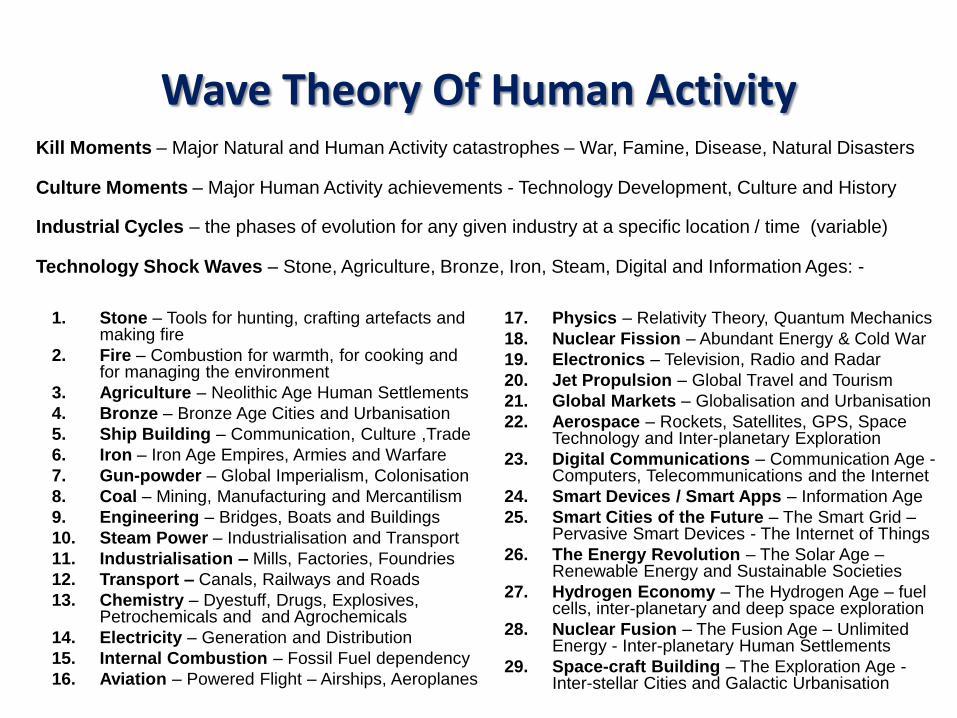
Wave Theory Of Human Activity
1. Stone – Tools for hunting, crafting artefacts and making fire
2. Fire – Combustion for warmth, for cooking and for managing the environment
3. Agriculture – Neolithic Age Human Settlements
4. Bronze – Bronze Age Cities and Urbanisation
5. Ship Building – Communication, Culture ,Trade
6. Iron – Iron Age Empires, Armies and Warfare
7. Gun-powder – Global Imperialism, Colonisation
8. Coal – Mining, Manufacturing and Mercantilism
9. Engineering – Bridges, Boats and Buildings
10. Steam Power – Industrialisation and Transport
11. Industrialisation – Mills, Factories, Foundries
12. Transport – Canals, Railways and Roads
13. Chemistry – Dyestuff, Drugs, Explosives, Petrochemicals and and Agrochemicals
14. Electricity – Generation and Distribution
15. Internal Combustion – Fossil Fuel dependency
16. Aviation – Powered Flight – Airships, Aeroplanes
17. Physics – Relativity Theory, Quantum Mechanics
18. Nuclear Fission – Abundant Energy & Cold War
19. Electronics – Television, Radio and Radar
20. Jet Propulsion – Global Travel and Tourism
21. Global Markets – Globalisation and Urbanisation
22. Aerospace – Rockets, Satellites, GPS, Space Technology and Inter-planetary Exploration
23. Digital Communications – Communication Age -Computers, Telecommunications and the Internet
24. Smart Devices / Smart Apps – Information Age
25. Smart Cities of the Future – The Smart Grid – Pervasive Smart Devices - The Internet of Things
26. The Energy Revolution – The Solar Age – Renewable Energy and Sustainable Societies
27. Hydrogen Economy – The Hydrogen Age – fuel cells, inter-planetary and deep space exploration
28. Nuclear Fusion – The Fusion Age – Unlimited Energy - Inter-planetary Human Settlements
29. Space-craft Building – The Exploration Age - Inter-stellar Cities and Galactic Urbanisation
Kill Moments – Major Natural and Human Activity catastrophes – War, Famine, Disease, Natural Disasters
Culture Moments – Major Human Activity achievements - Technology Development, Culture and History
Industrial Cycles – the phases of evolution for any given industry at a specific location / time (variable)
Technology Shock Waves – Stone, Agriculture, Bronze, Iron, Steam, Digital and Information Ages: -

Wave Theory Of Human Activity
About 8,000 BC:
• The end of the last Ice Age - the last Ice age ended when the great ice sheets finally retreated from Scandinavia and the last glaciers disappeared in Scotland.
• Plants, Animals and People from the south now invaded the new ecosystem after snow and ice had disappeared from the surface of the land. Part of the North Sea basin remains dry to allow continued contact with continental Europe.
• Many of the surviving ice-age mega-fauna – Sabre-toothed Tiger, Dire Wolf, Giant Cave Bear, Mammoth, Mastodon, Giant Elk, Woolly Rhinoceros – started to fall in numbers and become extinct

Wave Theory Of Human Activity
8,000 - 7000 BC:
• Age of the Hunter Gatherers. The European climaye, environment and ecology became transformed: the boreal forests (coniferous forests) were pushed back to Scandinavia, tundra and steppe were all but removed from the landscape. The dominant vegetation type was now mixed deciduous forest - covering over 80% of the land bordering the North Sea. Humans followed the northward migration of temperate vegetation – along with the animals which browsed upon it – to re-colonise northern Europe.
Technology Shock Wave - Pottery

Wave Theory Of Human Activity
7,500 BC:
• The melting of the ice sheets resulted in the flooding of the North Sea
basin and the disappearance of the land bridge connecting Britain to the
continent by 8000 years ago. This prevented many tree and plant
species from entering Britain and explains, for example, why we have
only three native species of conifer – the Juniper, Yew and Scots Pine.
6,000 - 2,500 BC:
• Holocene Climate Optimum - the Sea level reached a slightly higher
level than today coinciding with the warmest period during the past
10,000 years - with temperatures about 2 degrees C higher than today.
This was followed by the Iron Age Climate anomaly – over-grazing and
gradual cooling drove man and beast off the high fells, peaks and moors.

Wave Theory Of Human Activity
Impact of Mesolithic peoples - 8,000-5.000 BC • Mesolithic1 Europeans altered the landscape through fire more thoroughly than their
predecessors. By doing so they created a more predictable environment for themselves.
• Burning grasses helped rejuvenate their environments over a period of five to six years, attracting game, especially if open areas were maintained near water sources. It probably through the use of fire and other land management techniques that created large open areas which is probably most important environmental legacy of the Mesolithic peoples.
• Europeans learned to manipulate their environments and created a mosaic of woodlands and open land that they so favoured for food gathering and hunting. Manipulation could be extreme: it was Mesolithic hunter-gatherers who first deforested the western Isles of Scotland. By 3000 years ago there was no tree left on these isles
Technology Shock Wave - Forestry

Wave Theory Of Human Activity
Arrival of agriculture, ca 5000-4000 BC Farming, including crops like emmer and einkorn along with domesticated animals, reached north-western Europe via south-eastern and central Europe by ca. 4,800 BC during the Neolithic2 period.
• It is likely that the aboriginal European peoples were not replaced and pushed into the extreme North and West by immigrant farming populations, rather observed and adapted to the new way of life: agriculture. Immigrants would have set examples and pushed hunter-gatherers into agriculture. That must not have been hard since many hunter-gatherers had managed wild life and plant resources in a way that can be described as proto-agriculture. It is also likely that agriculture sprang up independently in some locations and was later supplemented by the grains and animals arriving from the Middle East.
Technology Shock Wave - Agriculture
Technology Shock Wave - Farming
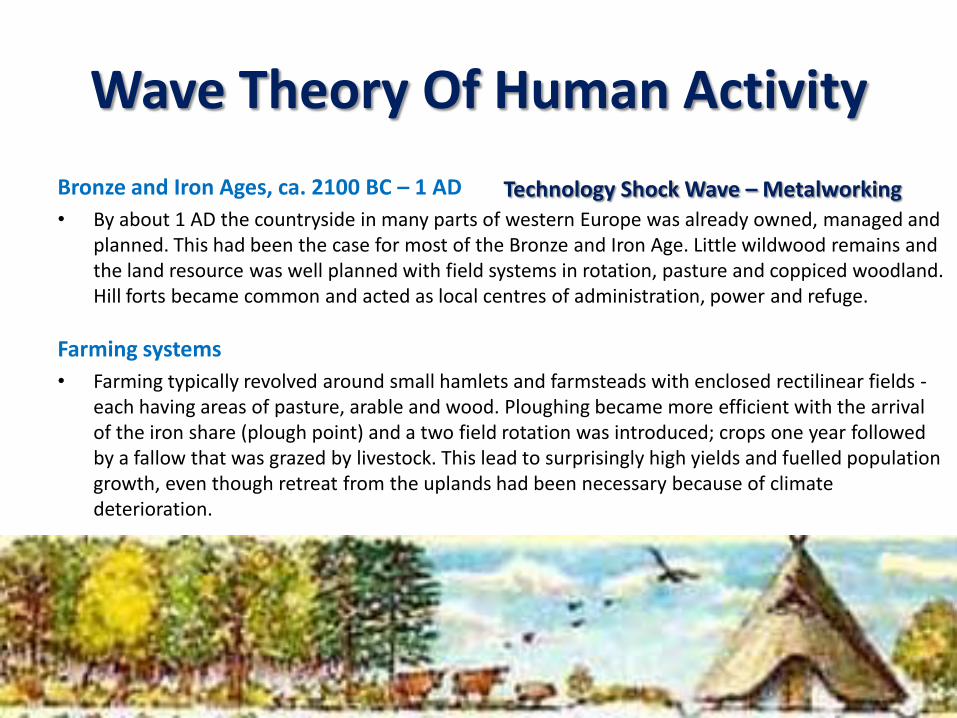
Wave Theory Of Human Activity
Bronze and Iron Ages, ca. 2100 BC – 1 AD
• By about 1 AD the countryside in many parts of western Europe was already owned, managed and planned. This had been the case for most of the Bronze and Iron Age. Little wildwood remains and the land resource was well planned with field systems in rotation, pasture and coppiced woodland. Hill forts became common and acted as local centres of administration, power and refuge.
Farming systems
• Farming typically revolved around small hamlets and farmsteads with enclosed rectilinear fields - each having areas of pasture, arable and wood. Ploughing became more efficient with the arrival of the iron share (plough point) and a two field rotation was introduced; crops one year followed by a fallow that was grazed by livestock. This lead to surprisingly high yields and fuelled population growth, even though retreat from the uplands had been necessary because of climate deterioration.
Technology Shock Wave – Metalworking

Business Cycles, Patterns and Trends in “Big Data”
Complex Market Phenomena are simply: - "the outcomes of endless conscious, purposeful human actions, by countless
individuals exercising personal choices and preferences - each of whom is trying as best they can to optimise their
circumstances in order to achieve various needs and desires. Individuals, through economic activity strive to attain their
preferred outcomes - whilst at the same time attempting to avoid any unintended consequences leading to unforeseen
outcomes.....”
• Ludwig von Mises – Economist •

The Temporal Wave
• The Temporal Wave is a novel and innovative method for Visual Modelling and Exploration
of Geospatial “Big Data” simultaneously within a Time (history) and Space (location)
context. The problems encountered in exploring and analysing vast volumes of spatial–
temporal Information in today's data-rich landscape – are becoming increasingly difficult to
manage effectively. In order to overcome the problem of data volume and scale in a Time
(history) and Space (location) context requires not only traditional location–space and
attribute–space analysis common in GIS Mapping and Spatial Analysis - but now the
additional dimension of time–space analysis. The Temporal Wave supports a new method
of Visual Exploration for Geospatial (location) data within a Temporal (historic) context.
• This time-visualisation approach integrates data visualisation techniques with spatial an
temporal data, thus improving accessibility, exploration and analysis of the huge amounts
of geo-spatial data used to support geo-visual analytics. The temporal wave combines the
strengths of both linear timeline and cyclical wave-form analysis – and is able to represent
both Time (history) and Space (location) data simultaneously, even at different levels of
granularity. Both linear and cyclic trends in space-time data may be represented in
combination with other graphic representations typical for location–space and attribute–
space data-types. The temporal wave can be used in its role as time–space data reference
system, as a time–space continuum representation tool, and as time–space interaction
tool.

Wave-form Analytics in “Big Data”
• Wave-form Analytics is a new analytical tool “borrowed” from spectral wave
frequency analysis in Physics – and is based on Time-frequency analysis – a
technique which exploits the wave frequency and time symmetry principle. This is
introduced here for the first time in the study of human activity waves, and in the
field of economic cycles business cycles, patterns and trends.
• Trend-cycle decomposition is a critical technique for testing the validity of multiple
(compound) dynamic wave-form models competing in a complex array of
interacting and inter-dependant cyclic systems in the study of complex cyclic
phenomena - driven by both deterministic and stochastic (probabilistic) paradigms.
In order to study complex periodic economic phenomena there are a number of
competing analytic paradigms – which are driven by either deterministic methods
(goal-seeking - testing the validity of a range of explicit / pre-determined / pre-
selected cycle periodicity value) and stochastic (random / probabilistic / implicit -
testing every possible wave periodicity value - or by identifying actual wave
periodicity values from the “noise” – harmonic resonance and interference patterns).

Wave-form Analytics in “Big Data”
• A fundamental challenge found everywhere in business cycle theory is how to
interpret very large scale / long period compound-wave (polyphonic) time series data
sets which are dynamic (non-stationary) in nature. Wave-form Analytics is a new
analytical too based on Time-frequency analysis – a technique which exploits the
wave frequency and time symmetry principle. The role of time scale and preferred
reference from economic observation are fundamental constraints for Friedman's
rational arbitrageurs - and will be re-examined from the viewpoint of information
ambiguity and dynamic instability.
• The Wigner-Gabor-Qian (WGQ) spectrogram demonstrates a distinct capability for
revealing multiple and complex superimposed cycles or waves within dynamic, noisy
and chaotic time-series data sets. A variety of competing deterministic and
stochastic methods, including the first difference (FD) and Hodrick-Prescott (HP)
filter - may be deployed with the multiple-frequency mixed case of overlaid cycles
and system noise. The FD filter does not produce a clear picture of business cycles
– however, the HP filter provides us with strong results for pattern recognition of
multiple co-impacting business cycles. The existence of stable characteristic
frequencies in large economic data aggregations (“Big Data”) provides us with strong
evidence and valuable information about the structure of Business Cycles.

Wave-form Analytics in “Big Data”
• Complex Adaptive Systems (CAS) and Chaos Theory has also been
used extensively in the field of Futures Studies, Strategic Management,
Natural Sciences and Behavioural Science. It is applied in these domains
to understand how individuals within populations, societies, economies and
states act as a collection of loosely coupled interacting systems which
adapt to changing environmental factors and random events – bio-
ecological, socio-economic or geo-political.
• Complex Adaptive Systems (CAS) and Chaos Theory treats individuals,
crowds and populations as a collective of pervasive social structures which
may be influenced by random individual behaviours – such as flocks of
birds moving together in flight to avoid collision, shoals of fish forming a
“bait ball” in response to predation, or groups of individuals coordinating
their behaviour in order to respond to external stimuli – the threat of
predation or aggression – or in order to exploit novel and unexpected
opportunities which have been discovered or presented to them.

Wave-form Analytics in “Big Data”
• When Systems demonstrate properties of Complex Adaptive Systems (CAS) - which is
often defined as a collection or set of relatively simple and loosely connected interacting
systems exhibiting co-adapting and co-evolving behaviour (sub-systems or components
changing together in response to the same external stimuli) - then those systems are
much more likely to adapt successfully to their environment and, thus better survive the
impact of both gradual change and of sudden random events. Complexity Theory
thinking has been present in biological, strategic and organisational system studies since
the first inception of Complex Adaptive Systems (CAS) as an academic discipline.
• Complex Adaptive Systems are further contrasted compared with other ordered and
chaotic systems by the relationship that exists between the system and the agents and
catalysts of change which act upon it. In an ordered system the level of constraint means
that all agent behaviour is limited to the rules of the system. In a chaotic system these
agents are unconstrained and are capable of random events, uncertainty and disruption.
In a CAS, both the system and the agents co-evolve together; the system acting to
lightly constrain the agents behaviour - the agents of change, however, modify the
system by their interaction. CAS approaches to behavioural science seek to understand
both the nature of system constraints and change agent interactions and generally takes
an evolutionary or naturalistic approach to crowd scenario planning and impact analysis.
Wave-form Analytics in “Big Data”
• Biological, Sociological, Economic and Political systems all tend to demonstrate
Complex Adaptive System (CAS) behaviour - which appears to be more similar
in nature to biological behaviour in an population than to truly Disorderly, Chaotic,
Stochastic Systems (“Random” Systems). For example, the remarkable long-term
adaptability, stability and resilience of market economies may be demonstrated by
the impact of Black Swan Events causing stock market crashes - such as oil price
shocks (1970-72) and credit supply shocks (1927- 1929 and 2008 onwards) – by
the ability of Financial markets to rapidly absorb and recover from these events.
• Unexpected and surprising Cycle Pattern changes have historically occurred during
regional and global conflicts being fuelled by technology innovation-driven arms
races - and also during US Republican administrations (Reagan and Bush - why?).
Just as advances in electron microscopy have revolutionised the science of biology
- non-stationary time series wave-form analysis has opened up a new space for
Biological, Sociological, Economic and Political system studies and diagnostics.

Composite Economic Wave Series
• Economic systems tend to demonstrate Complex Adaptive System (CAS) behaviour – rather than a simple series of chaotic “Random Events” – very similar to the behaviour of living organisms. The remarkable long-term stability and resilience of market economies is demonstrated by the impact and subsequent recovery from Wild Card and Black Swan Events. Surprising pattern changes occur during wars, arm races, and during Republican administrations, causing unexpected stock market crashes - such as oil price shocks and credit crises. Wave-form Analytics for non-stationary time series analysis opens up a new and remarkable opportunity for business cycle studies and economic policy diagnostics.
• The role of time scale and preferred reference from economic observation is explored in detail. For example - fundamental constraints for Friedman's rational arbitrageurs are re examined from the view of information ambiguity and dynamic instability. Alongside Joseph Schumpter’s Economic Wave Series and Strauss and Howe’s Generation Waves, we also discuss Robert Bronson's SMECT Forecasting Model - which integrates both Business and multiple Stock-Market Cycles into its structure.....
• Composite Economic Wave Series
– Saeculum - Century Waves
– Generation Waves (Strauss and Howe)
– Joseph Schumpter’s Economic Wave Series
– Robert Bronson’s SMECT Forecasting Model
Weak Signals, Wild Cards and
Black Swan Event Scenarios • In this section, we examine empiric evidence from global “Big Data” on how shock waves
to geo-political economic and business systems impact on business cycles, patterns and
trends. We first review Gail's work (1999), which uses long-running restrictions to identify
shock waves, and examine whether the identified shocks can be plausibly interpreted: -
• Wild card and Black Swan Event Types
– Technology Shock Waves
– Supply / Demand Shock Waves
– Political, Economic and Social Change
– Global Conflict – War, Terrorism, and Insecurity
– Natural Disasters and Catastrophes – Global Massive Change Events
• We do this in three ways. Firstly, we derive additional long-run restrictions and use them as
identification tests. Secondly, we compare the qualitative implications from the model with the
impulse responses of variables such as production, wages and consumption. Third, we test
whether some standard .exogenous. variables predicate the shock events. We discovered that
that Weak Signals may predicate coming technology shock waves, oil price shocks, and military
conflict. We then show ways in which a standard DGE model can be modified to fit Gail's finding
that a positive technology shock may lead to lower labour input. Finally, we re-examine the
properties of the other key shocks to the economic system and demonstrate the impact of oil
price shocks and military conflict .

Price Index Inflation

Waves, Cycles, Patterns and Trends
• Business Cycles were once thought to be an economic phenomenon due to periodic fluctuations in economic activity. These mid-term economic cycle fluctuations are usually measured using Real (Austrian) Gross Domestic Product (rGDP). Business Cycles take place against a long-term background trend in Economic Output – growth, stagnation or recession – which affects Money Supply as well as the relative availability and consumption (Demand v. Supply and Value v. Price) of other Economic Commodities. Any excess of Money Supply may lead to an economic expansion or “boom”, conversely shortage of Money Supply (Money Supply shocks – the Liquidity Trap) may lead to economic contraction or “bust”. Business Cycles are recurring, fluctuating levels of economic activity experiences in an economy over a significant timeline (decades or centuries).
• The five stages of Business Cycles are growth (expansion), peak, recession (contraction), trough and recovery. Business Cycles were once widely thought to be extremely regular, with predictable durations, but today’s Global Market Business Cycles are now thought to be unstable and appear to behave in irregular, random and even chaotic patterns – varying in frequency, range, magnitude and duration. Many leading economists now also suspect that Business Cycles may be influenced by fiscal policy as much as market phenomena - even that Global Economic “Wild Card” and “Black Swan” events are actually triggered by Economic Planners in Government Treasury Departments and in Central Banks as a result of manipulating the Money Supply under the interventionist Fiscal Policies adopted by some Western Nations.
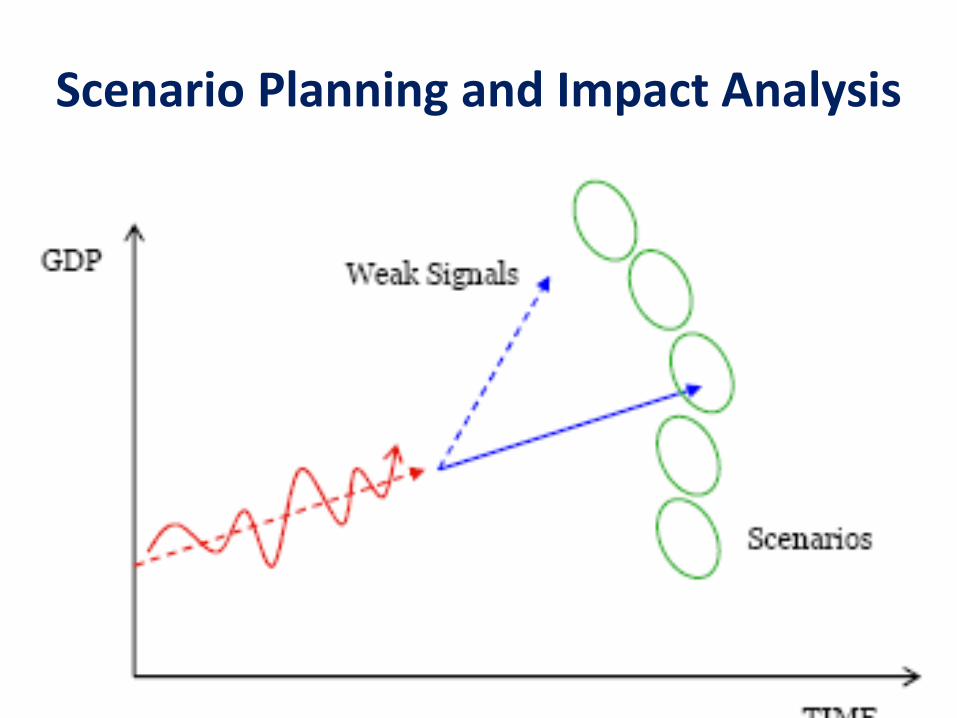
Scenario Planning and Impact Analysis

“Big Data”
Normal, daily routine activities from our everyday life generates vast amounts of data. Who owns this data, who has access to it, and what
they can do with it - is largely unknown, undisclosed and un-policed.....
Little-by-little, more and more aspects of our daily life are being monitored - meaning intimate details of what we do, where we go, and
who we see is now watched and recorded

“Big Data” Global Content Analysis
• “Big Data” refers to those aggregated datasets whose size and scope is beyond the capability of conventional transactional Database Management Systems and Enterprise Software Tools to capture, store, analyse and manage. This definition of “Big Data” is of necessity subjective and qualitative – “Big Data” is defined as a large collection of unstructured information, which, when initially captured, contains sparse or undiscovered internal references, links or data relationships.
• Data Set Mashing or “Big Data” Global Content Analysis – supports Strategic Foresight Techniques such as Horizon Scanning, Monitoring and Tracking by taking numerous, apparently un-related RSS and other Information Streams and Data Feeds, loading them into Very large Scale (VLS) DWH Structures and Unstructured Databases and Document Management Systems for interrogating using Data Mining and Real-time Analytics – that is, searching for and identifying possible signs of hidden data relationships (Facts/Events) – in order to discover and interpret previously unknown “Weak Signals” indicating emerging and developing Scenarios, Patterns and Trends - in turn predicating possible, probable and alternative transformations, catalysts and agents of change which may develop and unfold as future “Wild Card” or “Black Swan” events.
“Big Data” Global Content Analysis
• Biological, Sociological, Economic and Political systems all tend to demonstrate
Complex Adaptive System (CAS) behaviour - which appears to be more similar
in nature to biological behaviour in an organism than to Disorderly, Chaotic,
Stochastic Systems (“Random” Systems). For example, the remarkable
adaptability, stability and resilience of market economies may be demonstrated by
the impact of Black Swan Events causing stock market crashes - such as oil price
shocks (1970-72) and credit supply shocks (1927- 1929 and 2008 onwards).
Unexpected and surprising Cycle Pattern changes have historically occurred
during regional and global conflicts being fuelled by technology innovation-driven
arms races - and also during US Republican administrations (Reagan and Bush -
why?). Just as advances in electron microscopy have revolutionised biology -
non-stationary time series wave-form analysis has opened up a new space for
Biological, Sociological, Economic and Political system studies and diagnostics.
Wave-form Analytics in “Big Data”
• Wave-form Analytics is a new analytical tool “borrowed” from spectral wave
frequency analysis in Physics – and is based on Time-frequency analysis – a
technique which exploits the wave frequency and time symmetry principle. This is
introduced here for the first time in the study of human activity waves, and in the
field of economic cycles business cycles, patterns and trends.
• Trend-cycle decomposition is a critical technique for testing the validity of multiple
(compound) dynamic wave-form models competing in a complex array of
interacting and inter-dependant cyclic systems in the study of complex cyclic
phenomena - driven by both deterministic and stochastic (probabilistic) paradigms.
In order to study complex periodic economic phenomena there are a number of
competing analytic paradigms – which are driven by either deterministic methods
(goal-seeking - testing the validity of a range of explicit / pre-determined / pre-
selected cycle periodicity value) and stochastic (random / probabilistic / implicit -
testing every possible wave periodicity value - or by identifying actual wave
periodicity values from the “noise” – harmonic resonance and interference patterns).

Wave-form Analytics in “Big Data”
• A fundamental challenge found everywhere in business cycle theory is how to
interpret very large scale / long period compound-wave (polyphonic) time series data
sets which are dynamic (non-stationary) in nature. Wave-form Analytics is a new
analytical too based on Time-frequency analysis – a technique which exploits the
wave frequency and time symmetry principle. The role of time scale and preferred
reference from economic observation are fundamental constraints for Friedman's
rational arbitrageurs - and will be re-examined from the viewpoint of information
ambiguity and dynamic instability.
• The Wigner-Gabor-Qian (WGQ) spectrogram demonstrates a distinct capability for
revealing multiple and complex superimposed cycles or waves within dynamic, noisy
and chaotic time-series data sets. A variety of competing deterministic and
stochastic methods, including the first difference (FD) and Hodrick-Prescott (HP)
filter - may be deployed with the multiple-frequency mixed case of overlaid cycles
and system noise. The FD filter does not produce a clear picture of business cycles
– however, the HP filter provides us with strong results for pattern recognition of
multiple co-impacting business cycles. The existence of stable characteristic
frequencies in large economic data aggregations (“Big Data”) provides us with strong
evidence and valuable information about the structure of Business Cycles.

“Big Data”

“Big Data”
Normal, daily routine activities from our everyday life generates vast amounts of data. Who owns this data, who has access to it, and what they can do with it - is largely unknown, undisclosed and un-policed..... Little-by-little, more and more aspects of our daily life are being monitored - meaning intimate details of what we do, where we go, and who we see is now watched and recorded.

“Big Data” Definitions

The Emerging “Big Data” Stack
Targeting – Map / Reduce
Consume – End-User Data
Data Acquisition – High-Volume Data Flows
– Mobile Enterprise Platforms (MEAP’s)
Apache Hadoop Framework HDFS, MapReduce, Metlab “R” Autonomy, Vertica
Smart Devices Smart Apps Smart Grid
Clinical Trial, Morbidity and Actuarial Outcomes Market Sentiment and Price Curve Forecasting Horizon Scanning,, Tracking and Monitoring Weak Signal, Wild Card and Black Swan Event Forecasting
– Data Delivery and Consumption
News Feeds and Digital Media Global Internet Content Social Mapping Social Media Social CRM
– Data Discovery and Collection
– Analytics Engines - Hadoop
– Data Presentation and Display
Excel Web Mobile
– Data Management Processes Data Audit Data Profile Data Quality Reporting Data Quality Improvement Data Extract, Transform, Load
– Performance Acceleration GPU’s – massive parallelism SSD’s – in-memory processing DBMS – ultra-fast database replication
– Data Management Tools DataFlux Embarcadero Informatica Talend
– Info. Management Tools Business Objects Cognos Hyperion Microstrategy
Biolap Jedox Sagent Polaris
Teradata SAP HANA Netezza (now IBM) Greenplum (now EMC2) Extreme Data xdg Zybert Gridbox
– Data Warehouse Appliances
Ab Initio Ascential Genio Orchestra

“Big Data” Applications • Science and Technology
– Pattern, Cycle and Trend Analysis
– Horizon Scanning, Monitoring and Tracking
– Weak Signals, Wild Cards, Black Swan Events
• Multi-channel Retail Analytics – Customer Profiling and Segmentation
– Human Behaviour / Predictive Analytics
• Global Internet Content Management
– Social Media Analytics
– Market Data Management
– Global Internet Content Management
• Smart Devices and Smart Apps
– Call Details Records
– Internet Content Browsing
– Media / Channel Selections
– Movies, Video Games and Playlists
• Broadband / Home Entertainment
– Call Details Records
– Internet Content Browsing
– Media / Channel Selections
– Movies, Video Games and Playlists
• Smart Metering / Home Energy
– Energy Consumption Details Records
• Civil and Military Intelligence Digital Battlefields of the Future – Data Gathering
Future Combat Systems - Intelligence Database
Person of Interest Database – Criminal Enterprise,
Political organisations and Terrorist Cell networks
Remote Warfare - Threat Viewing / Monitoring /
Identification / Tracking / Targeting / Elimination
HDCCTV Automatic Character/Facial Recognition
• Security Security Event Management - HDCCTV, Proximity
and Intrusion Detection, Motion and Fire Sensors
Emergency Incident Management - Response
Services Command, Control and Co-ordination
• Biomedical Data Streaming Care in the Community
Assisted Living at Home
Smart Hospitals and Clinics
• SCADA Operational Technology SCADA Remote Sensing, Monitoring and Control
Smart Grid Data (machine generated data)
Vehicle Telemetry Management
Intelligent Building Management
Smart Homes Automation

Exploitation – “Big Data”
• There has been much speculation about how industries will cash in on “Big Data” In a nutshell “Big Data” occurs in volumes or structures that exceeds the functionality / capacity of conventional hardware, database platforms and analytical tools.
• Social media and search are leading the way with big data applications. As “Big Data” tools and methods enter the mainstream we will see businesses make use of the "data exhaust" that today doesn't get exploited To put it bluntly, most companies are failing to leverage their data assets by failing to realise the benefits of the huge volumes of data they are already generating.

Big Data Analytics Goes Big Time
Big Data Analytics Goes Big Time • Organizations around the globe and across
industries have learned that the smartest business decisions are based on fact, not gut feel. That means they're based on analysis of data, and it goes way beyond the historical information held in internal transaction systems. Internet click-streams, sensor data, log files, mobile data rich with geospatial information, and social-network comments are among the many forms of information now pushing information stores into the big-data league above 10 terabytes.
• Trouble is, conventional data warehousing deployments can't scale to crunch terabytes of data or support advanced in-database analytics. Over the last decade, massively parallel processing (MPP) platforms and column-store databases have started a revolution in data analysis. But technology keeps moving, and we're starting to see upgrades that are blurring the boundaries of known architectures. What's more, a whole movement has emerged around NoSQL (not only SQL) platforms that take on semi-structured and unstructured information.
This info-graph presents from 2011 to 2013 update on what's available, with options including ExtremeData xdb, EMC's Greenplum appliance, Hadoop and MapReduce, HP's recently acquired the Autonomy and Vertica platforms, IBM's separate DB2-based Smart Analytic System and Netezza offerings, and Microsoft's Parallel Data Warehouse. Smaller, niche database players include Infobright, Kognitio and ParAccel. Teradata reigns at the top of the market, picking off high-end defectors from industry giant Oracle. SAP's Sybase unit continues to evolve Sybase IQ, the original column-store database. In short, there's a platform for every scale level and analytic focus

Big Data Partnership
Training - For more information on Big Data Partnership’s training offerings, please visit the Training page. Feel free to Contact Us directly to discuss your specific needs.

Big Data Partnership 3D Approach
• Discovery - As enterprises move into this new age for data analytics, companies can often struggle to identify where in their large data architecture, big data software and techniques can be utilised. Big Data Partnership can help those organisations understand where those use cases are through short workshop engagements. These are typically 2-5 days long and will help not only identify where Big Data Analytics could help drive more customer insight and ROI but also educate on what tools are in the eco-system.
• Develop - Even with solid use cases and a good understanding of how Big Data software and techniques could help businesses, it is not always easy to prove the model and commit to the necessary investment to really make the positive transformation in an organisation. One way of doing this is to take a single use case and develop a Proof of Concept to prove the expected ROI and business benefit and also validate the technology. This level of engagement can typically be a month long and can help businesses not only take the big step towards big data but also help them understand whether the expected ROI is there.
• Deliver - Big Data Partnership are able to assist enterprises in fully realising their Big Data initiatives through offering fixed price and day-based consultancy to help deliver full data analytics projects. We understand that each customer has differing needs, therefore we tailor our approach specific to each client. Effective big data is not just about predetermined buckets or templates for business intelligence; it is about meaningful analysis and processing of information in a way that is highly relevant to the business. We have highly skilled Data Scientists as well as deep rooted Big Data Engineers who can help you fully make the most of your implementations and ensure success of your Big Data projects.

“Big Data”
• Put yourself in the Big Data driver’s seat.
• Today, companies are generating massive amounts of data—everything from web clicks, to customer transactions, to routine business events—and attempting to mine that data for trends that can inform better business decisions.
• Quantivo enables a new analytics experience that is bound only by imagination of the user - it’s a full stack for turning raw data into intelligence. The Quantivo platform features patented, pattern-based technology that efficiently integrates event data across multiple sources, in hours not weeks. Your query quest starts here.

“Big Data” Analytics
Quantivo sifts through mountains of data—and spots the patterns that matter.
• When faced with overwhelming amounts of data, looking for the big “aha” can be next to impossible. That is, unless you’ve got Quantivo on your side. Unlike the other vendors that overpromise and under-deliver, Quantivo hits the mark with pattern-based analytics that brings Big Data down to size by tracking relationships between attributes and ignoring redundancies. With easy-to-use tools, users can zero in on predictive and repeatable patterns and trends—without losing any of the original data. In addition, Quantivo pattern-based analytics: -
– Creates behavioural segments derived from a combination of contextually specific attributes and online/offline detailed event data
– Uncovers buried relationships that link attributes to behaviours
– Tracks how behaviors change over time—and identifies the trigger for these changes
– Helps you “learn what you don’t know” by intelligently auto-compiling lists of patterns existing in your data
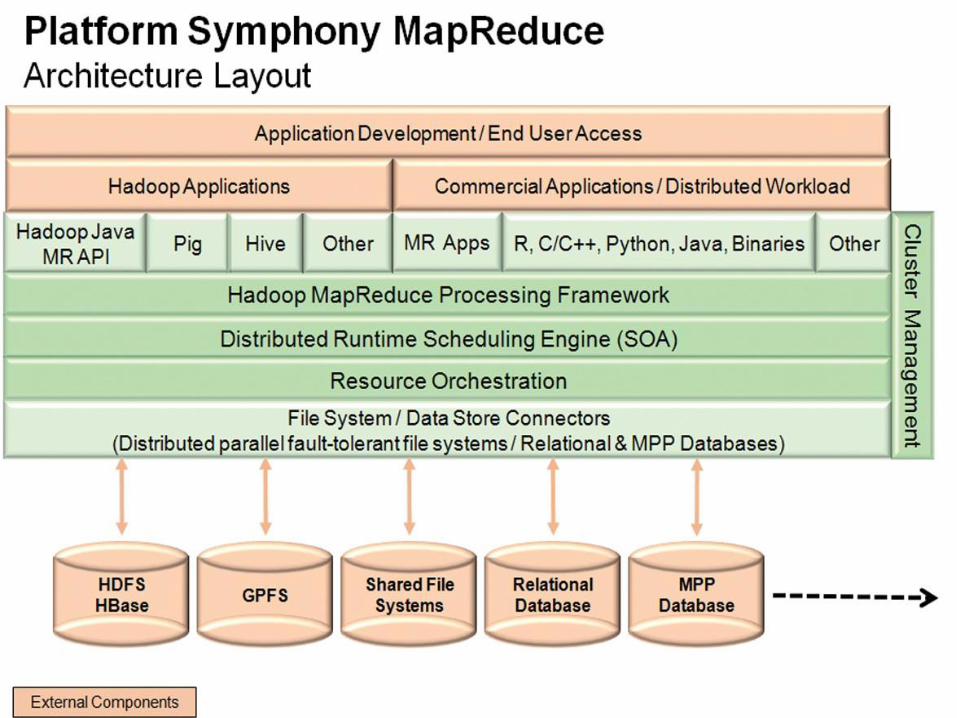

The Emerging “Big Data” Stack
Targeting – Map / Reduce
Consume – End-User Data
Data Acquisition – High-Volume Data Flows
– Mobile Enterprise Platforms (MEAP’s)
Apache Hadoop Framework HDFS, MapReduce, Metlab “R” Autonomy, Vertica
Smart Devices Smart Apps Smart Grid
Clinical Trial, Morbidity and Actuarial Outcomes Market Sentiment and Price Curve Forecasting Horizon Scanning,, Tracking and Monitoring Weak Signal, Wild Card and Black Swan Event Forecasting
– Data Delivery and Consumption
News Feeds and Digital Media Global Internet Content Social Mapping Social Media Social CRM
– Data Discovery and Collection
– Analytics Engines - Hadoop
– Data Presentation and Display
Excel Web Mobile
– Data Management Processes Data Audit Data Profile Data Quality Reporting Data Quality Improvement Data Extract, Transform, Load
– Performance Acceleration GPU’s – massive parallelism SSD’s – in-memory processing DBMS – ultra-fast database replication
– Data Management Tools DataFlux Embarcadero Informatica Talend
– Info. Management Tools Business Objects Cognos Hyperion Microstrategy
Biolap Jedox Sagent Polaris
Teradata SAP HANA Netezza (now IBM) Greenplum (now EMC2) Extreme Data xdg Zybert Gridbox
– Data Warehouse Appliances
Ab Initio Ascential Genio Orchestra
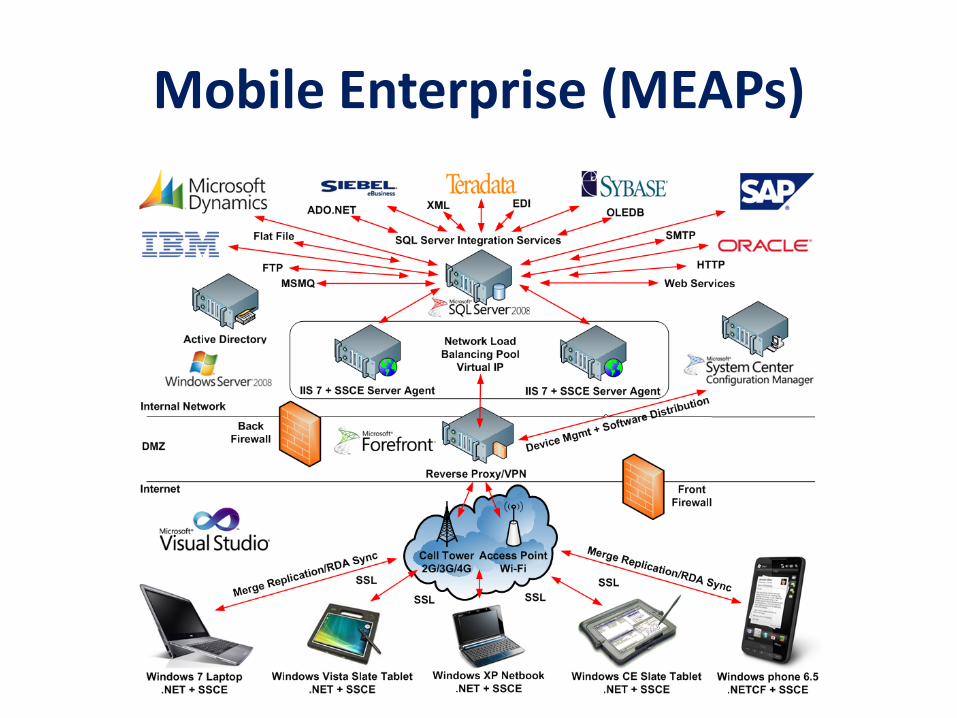
Mobile Enterprise (MEAPs)
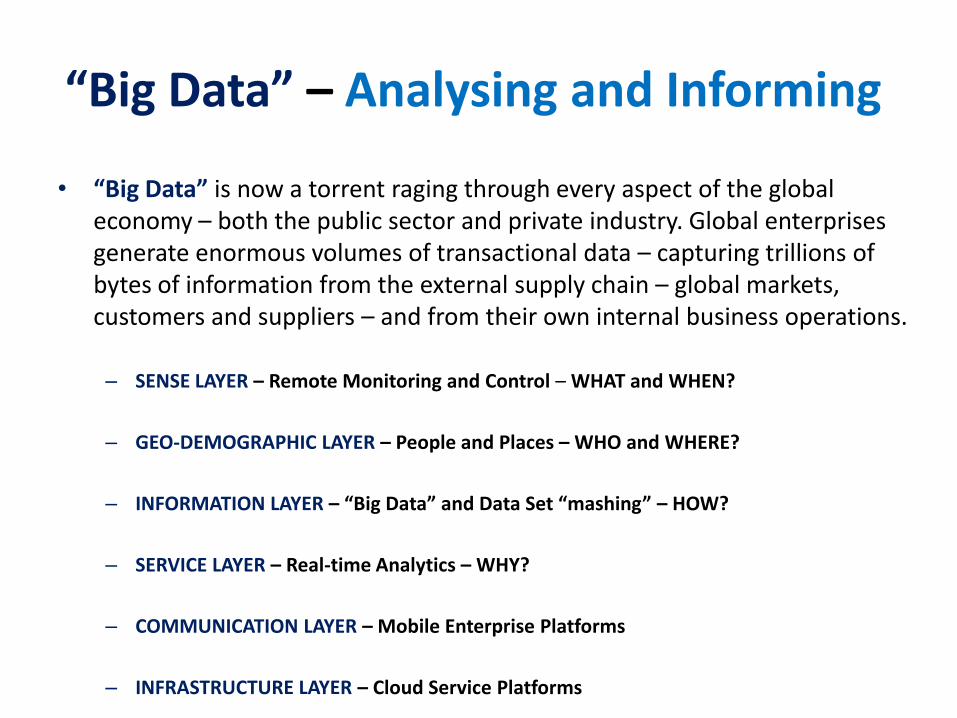
“Big Data” – Analysing and Informing
• “Big Data” is now a torrent raging through every aspect of the global economy – both the public sector and private industry. Global enterprises generate enormous volumes of transactional data – capturing trillions of bytes of information from the external supply chain – global markets, customers and suppliers – and from their own internal business operations.
– SENSE LAYER – Remote Monitoring and Control – WHAT and WHEN?
– GEO-DEMOGRAPHIC LAYER – People and Places – WHO and WHERE?
– INFORMATION LAYER – “Big Data” and Data Set “mashing” – HOW?
– SERVICE LAYER – Real-time Analytics – WHY?
– COMMUNICATION LAYER – Mobile Enterprise Platforms
– INFRASTRUCTURE LAYER – Cloud Service Platforms
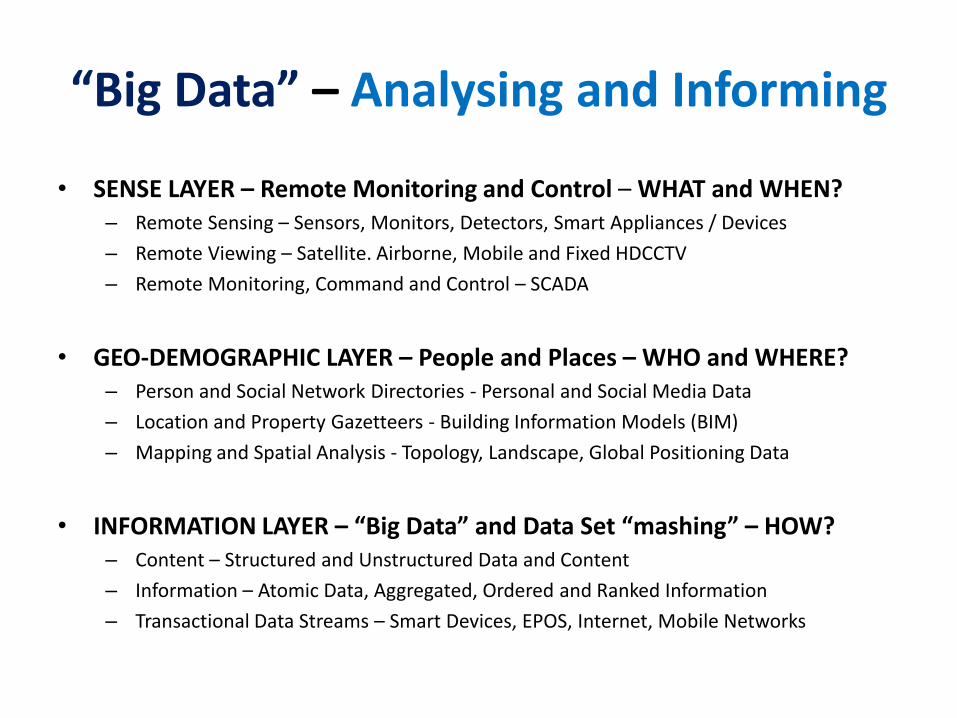
“Big Data” – Analysing and Informing
• SENSE LAYER – Remote Monitoring and Control – WHAT and WHEN? – Remote Sensing – Sensors, Monitors, Detectors, Smart Appliances / Devices
– Remote Viewing – Satellite. Airborne, Mobile and Fixed HDCCTV
– Remote Monitoring, Command and Control – SCADA
• GEO-DEMOGRAPHIC LAYER – People and Places – WHO and WHERE? – Person and Social Network Directories - Personal and Social Media Data
– Location and Property Gazetteers - Building Information Models (BIM)
– Mapping and Spatial Analysis - Topology, Landscape, Global Positioning Data
• INFORMATION LAYER – “Big Data” and Data Set “mashing” – HOW? – Content – Structured and Unstructured Data and Content
– Information – Atomic Data, Aggregated, Ordered and Ranked Information
– Transactional Data Streams – Smart Devices, EPOS, Internet, Mobile Networks

“Big Data” – Analysing and Informing
• SERVICE LAYER – Real-time Analytics – WHY? – Global Mapping and Spatial Analysis
– Service Aggregation, Intelligent Agents and Alerts
– Data Analysis, Data Mining and Statistical Analysis
– Optical and Wave-form Analysis and Recognition, Pattern and Trend Analysis
• COMMUNICATION LAYER – Mobile Enterprise Platforms and the Smart Grid – Connectivity - Smart Devices, Smart Apps, Smart Grid
– Integration - Mobile Enterprise Application Platforms (MEAPs)
– Backbone – Wireless and Optical Next Generation Network (NGE) Architectures
• INFRASTRUCTURE LAYER – Cloud Service Platforms – Public, Mixed / Hybrid, Enterprise, Private, Secure and G-Cloud Cloud Models
– Infrastructure – Network, Storage and Servers
– Applications – COTS Software, Utilities, Enterprise Services
– Security – Principles, Policies, Users, Profiles and Directories, Data Protection

What Google Searches about the Future tell us about the Present...
• Internet Research published recently demonstrates how Internet Searches about future topics have a significant link to the economic success of the native country of the Search Requester.
• Google (GOOG) search data have become a statistical gold mine for academics, scientists, and number crunchers, who have used it for everything from predicting flu outbreaks to determining to what extent racial prejudice robbed Barack Obama of otherwise certain votes.
• Two academics in the U.K., Warwick Business School associate professor Tobias Preis and Dr. Helen Susannah Moat of University College London, analyzed more than 45 billion Google searches performed during 2012 and calculated the national ratio between searches that included “2013” and those that included “2011” for the native country of the Search Requester,
• They found that countries where “Internet users … search for more information about the future tend to have a higher per-capita GDP,” says Preis, who created a stir in 2010 when he used a similar data-crunching approach to quantify and model stock price fluctuations of companies on the Standard & Poor’s 500 index. “The more a country is looking to the future using Internet Searches, then the more successful economically the country is.”
• The rational is, when the economy is humming along nicely, it is easier to be optimistic—to plan vacations, buy season tickets, investigate investment opportunities, etc.
• Of all nations, the Germans are the most forward-looking, knocking Britons from the top spot. Preis explained that the U.K. scored so highly a year earlier because of the high national expectation around the forthcoming 2012 London Olympic Games. This year, the Germans are looking forward to a pivotal federal election. Preis, a German national, declined to comment on whether Germany’s exuberance for the future bodes well for incumbent Angela Merkel.
• Interestingly, the U.S. ranks 11th, up from 15th a year earlier. The 2012 findings showed that entering an election year, more Americans were looking backward to 2010. Preis says that this year, Americans as a whole are more optimistic about 2013 than they were a year earlier,.
• Economic laggards Pakistan, Vietnam, and Kazakhstan round out the bottom of the list.


Clustering in “Big Data” “A Cluster is a grouping of the same, similar and equivalent, data
elements containing values which are closely distributed – or
aggregated – together”
Clustering is a technique used to explore content and understand
information in every business and scientific field that collects and
processes verify large volumes of data
Clustering is an essential tool for any “Big Data” problem

Clustering Phenomena in “Big Data”

• “Big Data” refers to vast aggregations (super sets) consisting of numerous individual
datasets (structured and unstructured) - whose size and scope is beyond the capability of
conventional transactional (OLTP) or analytics (OLAP) Database Management Systems
and Enterprise Software Tools to capture, store, analyse and manage. Examples of “Big
Data” include the vast and ever changing amounts of data generated in social networks
where we maintain Blogs and have conversations with each other, news data streams,
geo-demographic data, internet search and browser logs, as well as the ever-growing
amount of machine data generated by pervasive smart devices - monitors, sensors and
detectors in the environment – captured via the Smart Grid, then processed in the Cloud –
and delivered to end-user Smart Phones and Tablets via Intelligent Agents and Alerts.
• Data Set Mashing and “Big Data” Global Content Analysis – drives Horizon Scanning,
Monitoring and Tracking processes by taking numerous, apparently un-related RSS and
other Information Streams and Data Feeds, loading them into Very large Scale (VLS)
DWH Structures and Document Management Systems for Real-time Analytics – searching
for and identifying possible signs of relationships hidden in data (Facts/Events)– in order to
discover and interpret previously unknown Data Relationships driven by hidden Clustering
Forces – revealed via “Weak Signals” indicating emerging and developing Application
Scenarios, Patterns and Trends - in turn predicating possible, probable and alternative
global transformations which may unfold as future “Wild Card” or “Black Swan” events.
“Big Data”

“Big Data”

• The profiling and analysis of very large aggregated datasets in order to determine a
‘natural’ or implicit structure of data relationships or groupings – in order to discover
hidden data relationships driven by unknown factors where no prior assumptions
are made concerning the number or type of groups discovered or Cluster / Group
relationships, hierarchies or internal data structures – is a critically important starting
point – and forms the basis of many statistical and analytic applications.
• The subsequent explicit Cluster Analysis of discovered data relationships is an
important and critical technique which attempts to explain the nature, cause and
effect of unknown clustering forces driving implicit profile similarities, mathematical
or geographic distributions. Geo-demographic techniques are frequently used in
order to profile and segment Demographic and Spatial data by ‘natural’ groupings –
including common behavioural traits, Clinical Trial, Morbidity or Actuarial outcomes –
along with numerous other shared characteristics and common factors Cluster
Analysis attempt to understand and explain those natural group affinities and
geographical distributions using methods such as Causal Layer Analysis (CLA).....
Clustering in “Big Data”
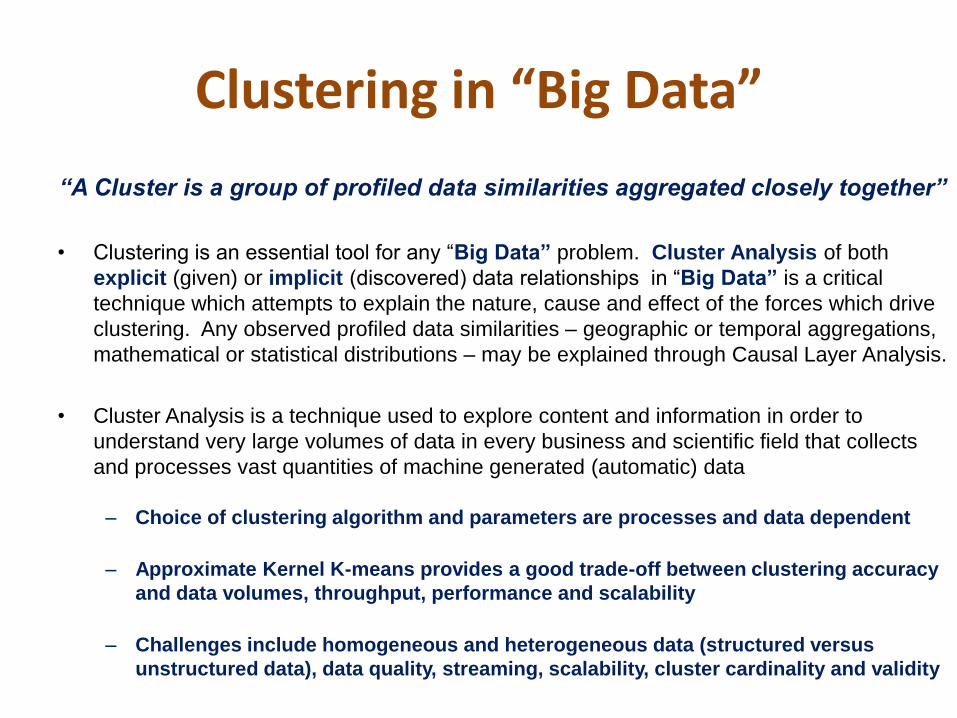
Clustering in “Big Data”
“A Cluster is a group of profiled data similarities aggregated closely together”
• Clustering is an essential tool for any “Big Data” problem. Cluster Analysis of both
explicit (given) or implicit (discovered) data relationships in “Big Data” is a critical
technique which attempts to explain the nature, cause and effect of the forces which drive
clustering. Any observed profiled data similarities – geographic or temporal aggregations,
mathematical or statistical distributions – may be explained through Causal Layer Analysis.
• Cluster Analysis is a technique used to explore content and information in order to
understand very large volumes of data in every business and scientific field that collects
and processes vast quantities of machine generated (automatic) data
– Choice of clustering algorithm and parameters are processes and data dependent
– Approximate Kernel K-means provides a good trade-off between clustering accuracy
and data volumes, throughput, performance and scalability
– Challenges include homogeneous and heterogeneous data (structured versus
unstructured data), data quality, streaming, scalability, cluster cardinality and validity

Cluster Types Deep Space Galactic Clusters
Hadoop Cluster – “Big Data” Servers
Molecular Clusters
Geo-Demographic Clusters
Crystal Clusters

Cluster Types DISCIPLINE CLUSTER TYPE CLUSTERS DIMENSIONS DATA TYPE DATA SOURCE CLUSTERING
FACTORS / FORCES
Astrophysics Distribution of Matter through the Universe across Space and Time
Star Systems Stellar Clusters Galaxies Galactic Clusters
Mass / Energy Space / Time
Astronomy Images Optical Telescope Infrared Telescope Radio Telescope X-ray Telescope
Gravity Dark Matter Dark Energy
Climate Change Temperature Changes Precipitation Changes Ice-mass Changes
Hot / Cold Dry / Wet More / Less ice
Temperature Precipitation Sea / Land Ice
Average Temperature Average Precipitation Greenhouse Gases %
Weather Station Data Ice Core Data Tree-ring Data
Solar Forcing Oceanic Forcing Atmospheric Forcing
Actuarial Science Morbidity Epidemiology
Place / Date of birth Place / Date of death Cause of Death
Birth / Death Longevity Cause of Death
Medical Events Geography Time
Biomedical Data Demographic Data Geographic data
Register of Births Register of Deaths Medical Records
Health Wealth Demographics
Price Curves Economic Modelling Long-range Forecasting
Economic growth Economic recession
Bull markets Bear markets
Monetary Value Geography Time
Real (Austrian) GDP Foreign Exchange Rates Interest Rates Price movements Daily Closing Prices
Government Central Banks Money Markets Stock Exchange Commodity Exchange
Business Cycles Economic Trends Market Sentiment Fear and Greed Supply / Demand
Business Clusters Retail Parks Digital / Fin Tech Leisure / Tourism Creative / Academic
Retail Technology Resorts Arts / Sciences
Company / SIC Geography Time
Entrepreneurs Start-ups Mergers Acquisitions
Investors NGAs Government Academic Bodies
Capital / Finance Political policy Economic policy Social policy
Elite Team Sports Performance Science
Winners Loosens
Team / Athlete Sport / Club League Tables Medal Tables
Sporting Events Team / Athlete Sport / Club Geography Time
Performance Data Biomedical Data
Sports Governing Bodies RSS News Feeds Social Media Hawk-Eye Pro-Zone
Technique Application Form / Fitness Ability / Attitude Training / Coaching Speed / Endurance3
Future Management Human Activity Natural Events
Random Events Waves, Cycles, Patterns, Trends
Random Events Geography Time
Weak Signals Wild Card Events Black Swan Events
Global Internet Content / Big Data Analytics - Horizon Scanning, Tracking and Monitoring
Random Events Waves, Cycles, Patterns, Trends, Extrapolations

GIS MAPPING and SPATIAL DATA ANALYSIS
• A Geographic Information System (GIS) integrates hardware, software, and data capture devices for acquiring, managing, analysing, distributing and displaying all forms of geographically dependant location data – including machine generated data such as Computer-aided Design (CAD) data from land and building surveys, Global Positioning System (GPS) terrestrial location data - as well as all kinds of aerial and satellite image data.....
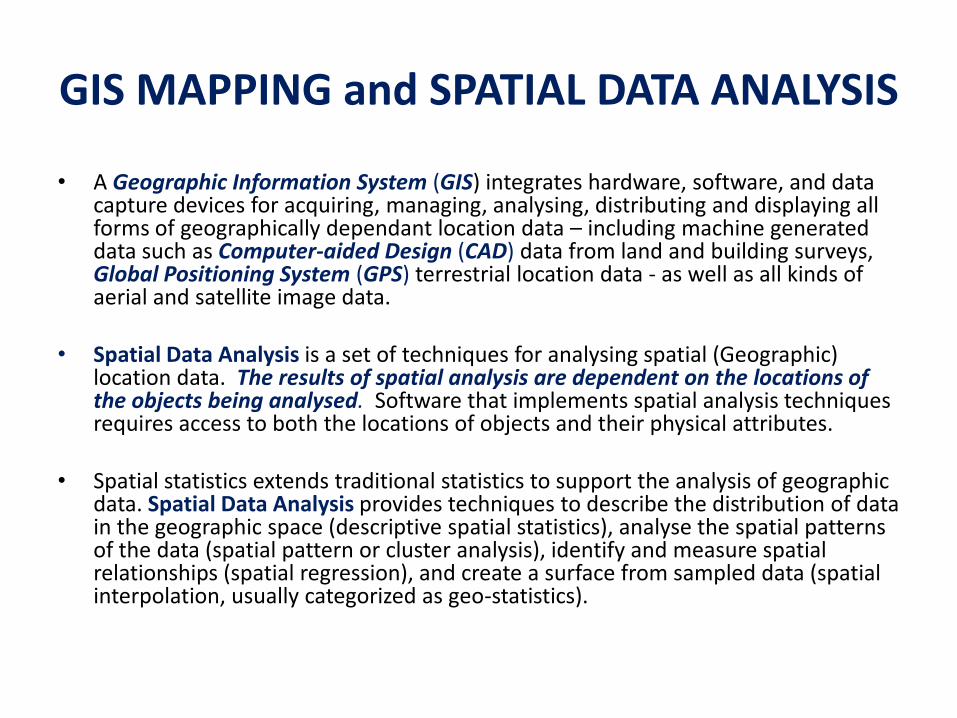
GIS MAPPING and SPATIAL DATA ANALYSIS
• A Geographic Information System (GIS) integrates hardware, software, and data capture devices for acquiring, managing, analysing, distributing and displaying all forms of geographically dependant location data – including machine generated data such as Computer-aided Design (CAD) data from land and building surveys, Global Positioning System (GPS) terrestrial location data - as well as all kinds of aerial and satellite image data.
• Spatial Data Analysis is a set of techniques for analysing spatial (Geographic) location data. The results of spatial analysis are dependent on the locations of the objects being analysed. Software that implements spatial analysis techniques requires access to both the locations of objects and their physical attributes.
• Spatial statistics extends traditional statistics to support the analysis of geographic data. Spatial Data Analysis provides techniques to describe the distribution of data in the geographic space (descriptive spatial statistics), analyse the spatial patterns of the data (spatial pattern or cluster analysis), identify and measure spatial relationships (spatial regression), and create a surface from sampled data (spatial interpolation, usually categorized as geo-statistics).

World-wide Visitor Count – GIS Mapping

Geo-Demographic Profile Data GEODEMOGRAPHIC INFORMATION – PEOPLE and PLACES
Age Dwelling Location / Postcode
Income Dwelling Owner / Occupier Status
Education Dwelling Number-of-rooms
Social Status Dwelling Type
Marital Status Financial Status
Gender / Sexual Preference Politically Active Indicator
Vulnerable / At Risk Indicator Security / Threat Indicator
Physical / Mental Health Status Security Vetting / Criminal Record Indicator
Immigration Status Profession / Occupation
Home / First language Professional Training / Qualifications
Race / ethnicity / country of origin Employment Status
Household structure and family members Employer SIC
Leisure Activities / Destinations Place of work / commuting journey
Mode of travel to / from Leisure Activities Mode of travel to / from work


BTSA Induction Cluster Map

Geo-Demographic Profile Clusters


Star Clusters
• New and
improved
understanding
of star cluster
physics brings
us within reach
of answering a
number of
fundamental
questions in
astrophysics,
ranging from
the formation
and evolution
of galaxies –
to intimate
details of the
star formation
process itself.
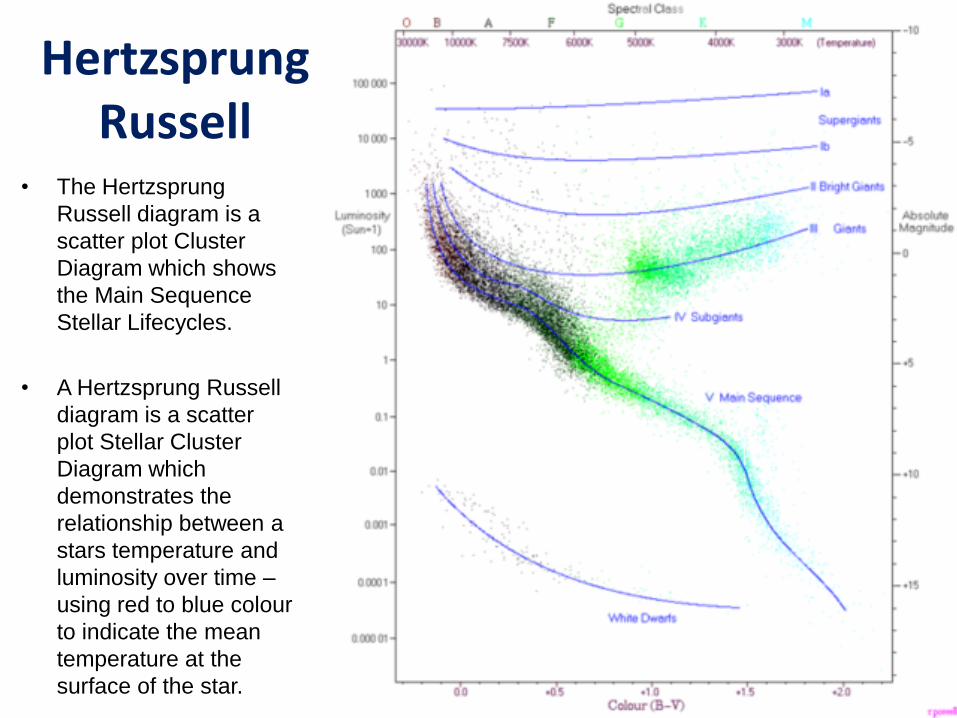
Hertzsprung Russell
• The Hertzsprung
Russell diagram is a
scatter plot Cluster
Diagram which shows
the Main Sequence
Stellar Lifecycles.
• A Hertzsprung Russell
diagram is a scatter
plot Stellar Cluster
Diagram which
demonstrates the
relationship between a
stars temperature and
luminosity over time –
using red to blue colour
to indicate the mean
temperature at the
surface of the star.
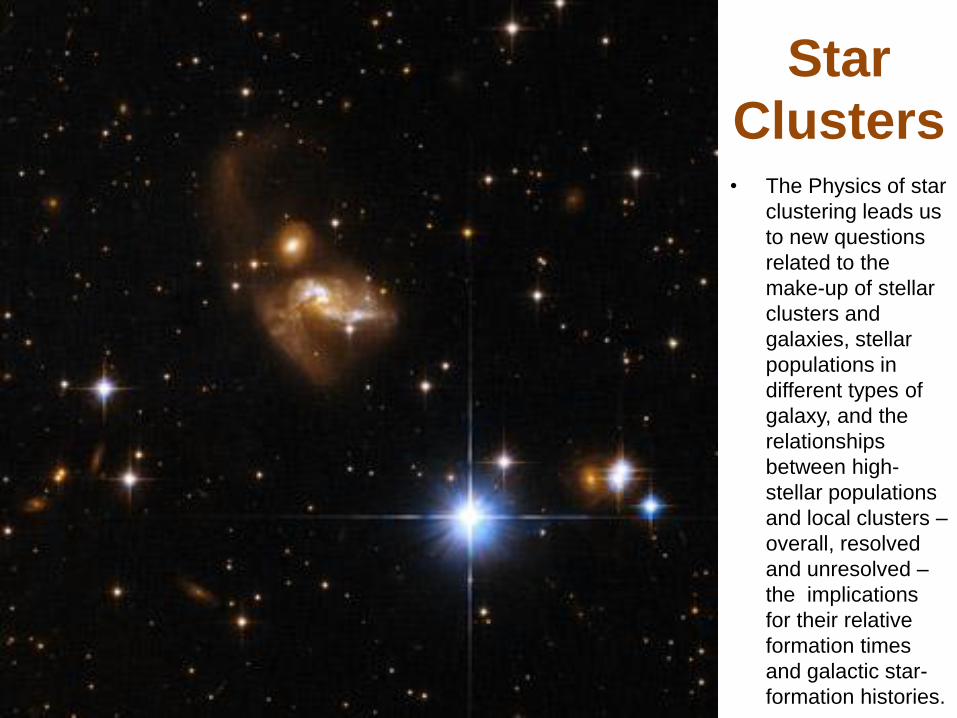
Star
Clusters • The Physics of star
clustering leads us
to new questions
related to the
make-up of stellar
clusters and
galaxies, stellar
populations in
different types of
galaxy, and the
relationships
between high-
stellar populations
and local clusters –
overall, resolved
and unresolved –
the implications
for their relative
formation times
and galactic star-
formation histories.

Cluster Analysis
• Data Representation – Metadata - identifying common Data Objects, Types and Formats
• Data Taxonomy and Classification – Similarity Matrix (labelled data)
– Grouping of explicit data relationships
• Data Audit - given any collection of labelled objects..... – Identifying relationships between discrete data items
– Identifying common data features - values and ranges
– Identifying unusual data features - outliers and exceptions
• Data Profiling and Clustering - given any collection of unlabeled objects..... – Pattern Matrix (unlabelled data)
– Discover implicit data relationships
– Find meaningful groupings (Clusters)
– Predictive Analytics – Event Forecasting
– Wave-form Analytics – Periodicity, Cycles and Trends
– Explore hidden relationships between discrete data features
Many big data problems feature unlabeled objects

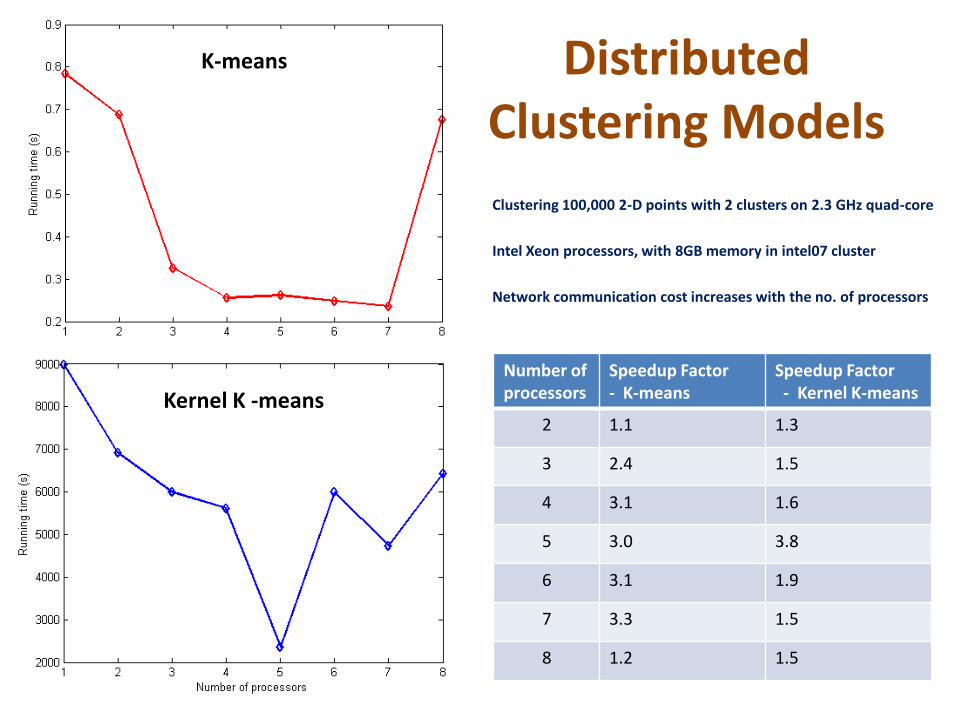
Distributed Clustering Models
Number of processors
Speedup Factor - K-means
Speedup Factor - Kernel K-means
2 1.1 1.3
3 2.4 1.5
4 3.1 1.6
5 3.0 3.8
6 3.1 1.9
7 3.3 1.5
8 1.2 1.5
K-means
Kernel K -means
Clustering 100,000 2-D points with 2 clusters on 2.3 GHz quad-core
Intel Xeon processors, with 8GB memory in intel07 cluster
Network communication cost increases with the no. of processors

Cluster Analysis
Clustering Algorithms
Hundreds of spatial, mathematical and statistical clustering algorithms are available –
many clustering algorithms are “admissible” – but no single algorithm alone is “optimal”
• K-means
• Gaussian mixture models
• Kernel K-means
• Spectral Clustering
• Nearest neighbour
• Latent Dirichlet Allocation
Challenges in “Big Data” Clustering
• Data quality
• Volume – number of data items
• Cardinality – number of clusters
• Synergy – measures of similarity
• Values – outliers and exceptions
• Cluster accuracy - validity and verification
• Homogeneous versus heterogeneous data (structured and unstructured data)

k-means/Gaussian-Mixture Clustering of Audio Segments
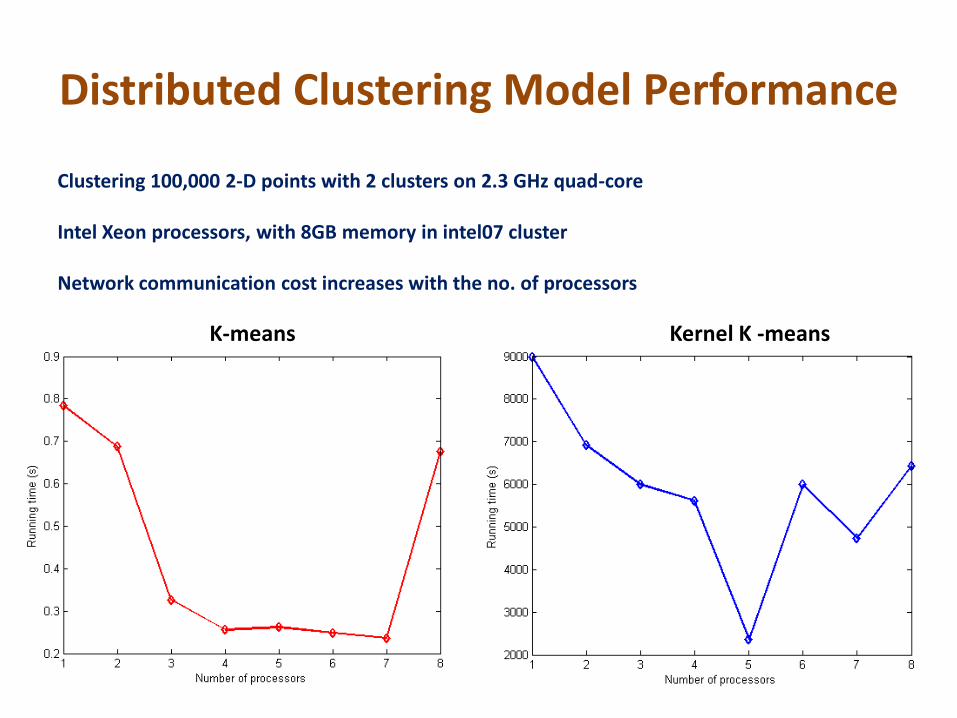
Distributed Clustering Model Performance
Clustering 100,000 2-D points with 2 clusters on 2.3 GHz quad-core Intel Xeon processors, with 8GB memory in intel07 cluster Network communication cost increases with the no. of processors
K-means Kernel K -means

HPCC Clustering Models
High Performance / High Concurrence Real-time Delivery (HPCC)

Distributed Clustering Models
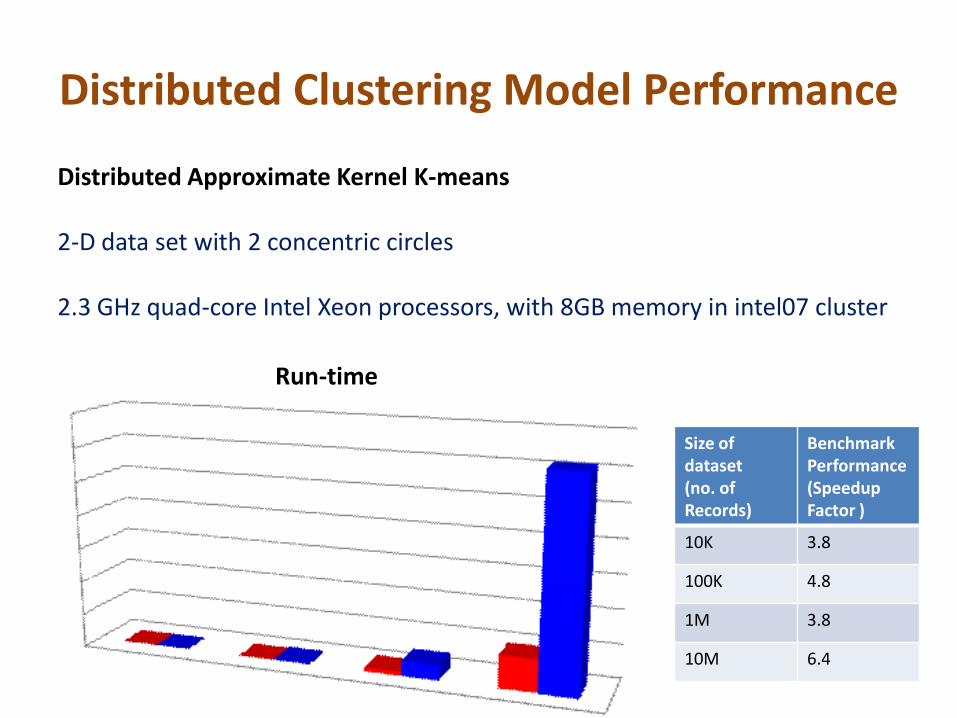
Distributed Clustering Model Performance
Distributed Approximate Kernel K-means
2-D data set with 2 concentric circles
2.3 GHz quad-core Intel Xeon processors, with 8GB memory in intel07 cluster
Run-time
Size of dataset (no. of Records)
Benchmark Performance (Speedup Factor )
10K 3.8
100K 4.8
1M 3.8
10M 6.4


Historic Economic Trends in “Big Data”

Sixty years ago, in the year 1950…
In 1950, nobody was taking China seriously as a global economic power – China was way off our economic “radar” - and remained so for a very long time indeed !
The United States was by far the largest economy in the world, in terms of GDP, challenged only by the former Soviet Union (USSR)
China was emerging as a much smaller economy - comparable to France in size (GDP), accounting for less than 5% of global economic activity
Created by the Forecasting Net www.forecastingnet.com October 2011
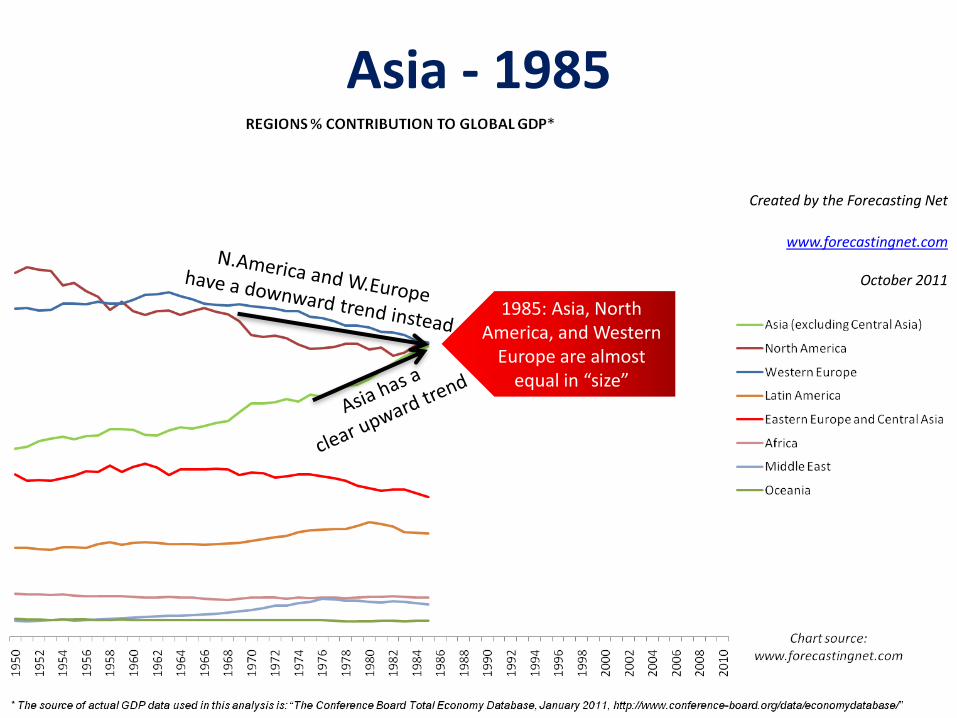
Asia - 1985
1985: Asia, North America, and Western
Europe are almost equal in “size”
Created by the Forecasting Net
www.forecastingnet.com
October 2011

How regions perform….. The rise of Asia…..
19
85

Sixty years on, in the year 2015…
Chinas’ economy has grown continuously – and is now challenging the leading economic position of the USA
China is the undisputed champion of world economic achievement - even during the crisis era, post 2008
China is by far the largest shareholder of U.S. debt
Asia has been substituting the West, in terms of percentage contribution to global GDP, for many decades, initiating a shift of the international balance of power
It all started with Japan’s economic miracle but it really took off with China’s and, to a lesser degree, India’s growth frenzy over the last few decades
This is not a temporary but a long term trend that we could have easily identified as early as the 1980s, if only we looked…
Created by the Forecasting Net www.forecastingnet.com October 2011

How countries perform…..
C
hin
a U
SA
Created by the Forecasting Net
www.forecastingnet.com October 2011
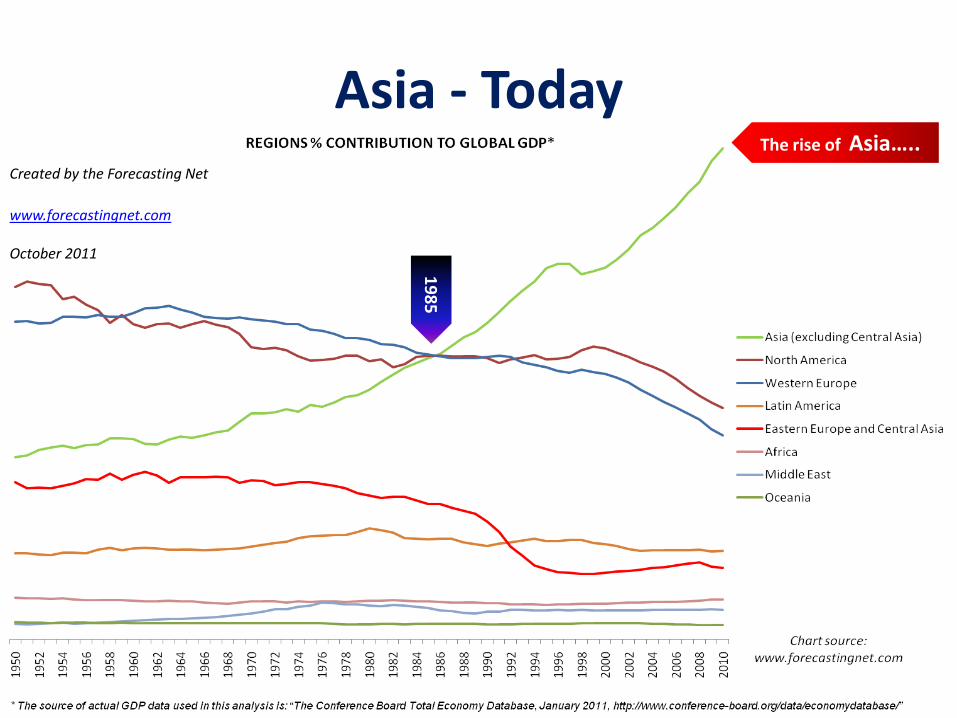
Asia - Today The rise of Asia…..
19
85
Created by the Forecasting Net
www.forecastingnet.com October 2011

The rise of the BRICs
China and to a lesser degree India are the long term winners of the economic growth “race”, in terms of percentage contribution to global GDP per year
The continuous long term decrease of the relative economic power-expressed as the percentage contribution to global GDP-of the United States and the largest Western European countries, Germany, United Kingdom, and France, is obvious after 1960
Japan’s end of the economic miracle in the early 1990s resulted to the sharp decline of its contribution to global GDP, after a growth frenzy that lasted many decades
The gradual deterioration of the relative economic power of the USSR-after 1960-that led to the collapse of the Soviet Union and the subsequent rise of the Russian Federation, is apparent
Brazil’s contribution to global GDP starts to decline after 1980. Some catching up is evident during the last three years following the start of the 2008 credit crunch
Created by the Forecasting Net www.forecastingnet.com October 2011

Future Trends in “Big Data”

Business Cycles, Patterns and Trends
All human actions – “are simple individual choices in response to subjective
personal value judgments – which ultimately determine all market phenomena
– patterns of innovation and investment, supply and demand, production and
consumption, costs and prices, levels of profits and losses and ultimately real
(Austrian) Gross Domestic Product (rGDP).....”
• Ludwig von Mises – Economist •


Abiliti: Future Systems
Slow is smooth, smooth is fast.....
.....advances in “Big Data” have lead to a revolution
in economic forecasting and predictive modelling –
but it takes both human ingenuity, and time, for
Economic Models to develop and mature.....


Abiliti: Future Systems
• Abiliti: Origin Automation is part of a global consortium of Digital Technologies Service Providers and Future Management Strategy Consulting firms – Digital Marketing and Multi-channel Retail / Cloud Services / Mobile Devices / Big Data / Social Media
• Graham Harris Founder and MD @ Abiliti: Future Systems
– Email: [email protected] (Office) – Telephone: +44 (0) 1527 591020 (Office)
• Nigel Tebbutt 奈杰尔 泰巴德
– Future Business Models & Emerging Technologies @ Abiliti: Future Systems – Telephone: +44 (0) 7832 182595 (Mobile) – +44 (0) 121 445 5689 (Office) – Email: [email protected] (Private)
• Ifor Ffowcs-Williams CEO, Cluster Navigators Ltd & Author, “Cluster Development” – Address : Nelson 7010, New Zealand (Office)
– Email : [email protected]
Abiliti: Origin Automation Strategic Enterprise Management (SEM) Framework ©
Cluster Theory - Expert Commentary: -


Business Cycles, Patterns and Trends: -
TECHNICAL APPENDICES
The Nature of Uncertainty – Randomness Classical Mechanics (Newtonian Physics) – governs the behaviour of everyday objects –
any apparent randomness is as a result of Unknown Forces
Quantum Mechanics – governs the behaviour of unimaginably small sub-atomic particles – all events are truly and intrinsically both symmetrical and random
Relativity Theory – governs the behaviour of impossibly super-massive cosmic structures – any apparent randomness or asymmetry is as a result of Quantum Dynamics
Wave Mechanics (String Theory) – integrates the behaviour of every type of object –randomness and asymmetry is a result of Unknown Forces and Quantum Dynamics

The Future of “Big Data” in Fin Tech

Financial Technology
Masters of a volatile Universe
Challenged by complexity and turbulence, leaders at the forefront of Financial Technology (Fin Tech) innovation are gaining an uncanny
ability to come up with the right solution at the right time.
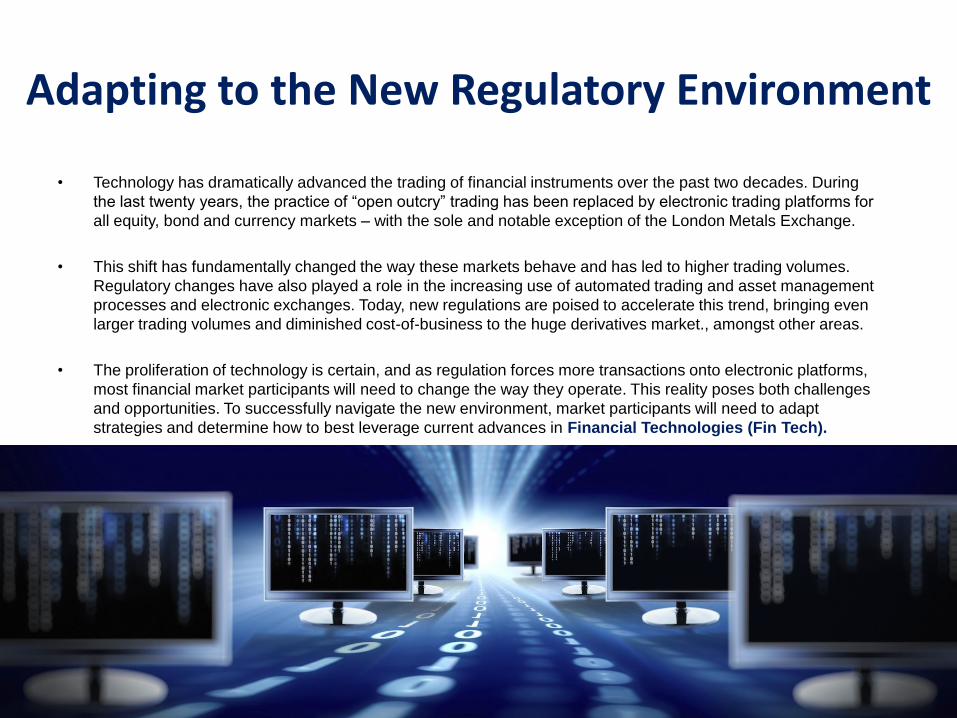
Adapting to the New Regulatory Environment
• Technology has dramatically advanced the trading of financial instruments over the past two decades. During
the last twenty years, the practice of “open outcry” trading has been replaced by electronic trading platforms for
all equity, bond and currency markets – with the sole and notable exception of the London Metals Exchange.
• This shift has fundamentally changed the way these markets behave and has led to higher trading volumes.
Regulatory changes have also played a role in the increasing use of automated trading and asset management
processes and electronic exchanges. Today, new regulations are poised to accelerate this trend, bringing even
larger trading volumes and diminished cost-of-business to the huge derivatives market., amongst other areas.
• The proliferation of technology is certain, and as regulation forces more transactions onto electronic platforms,
most financial market participants will need to change the way they operate. This reality poses both challenges
and opportunities. To successfully navigate the new environment, market participants will need to adapt
strategies and determine how to best leverage current advances in Financial Technologies (Fin Tech).
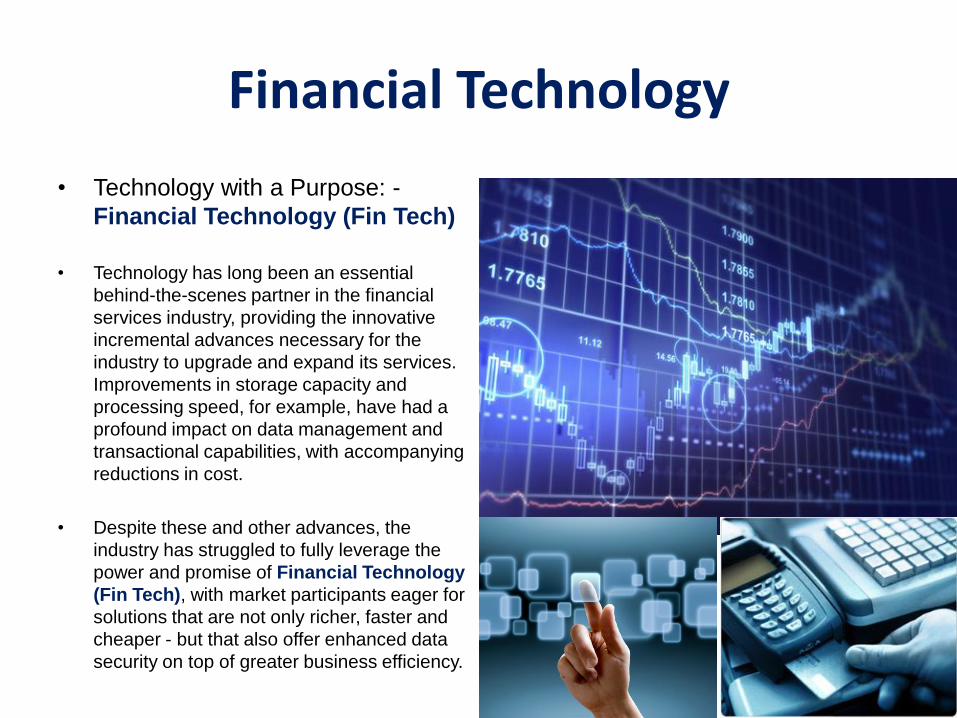
Financial Technology
• Technology with a Purpose: -
Financial Technology (Fin Tech)
• Technology has long been an essential
behind-the-scenes partner in the financial
services industry, providing the innovative
incremental advances necessary for the
industry to upgrade and expand its services.
Improvements in storage capacity and
processing speed, for example, have had a
profound impact on data management and
transactional capabilities, with accompanying
reductions in cost.
• Despite these and other advances, the
industry has struggled to fully leverage the
power and promise of Financial Technology
(Fin Tech), with market participants eager for
solutions that are not only richer, faster and
cheaper - but that also offer enhanced data
security on top of greater business efficiency.

Financial Technology Business Categories
Retail Banking
• Accounts
• Deposits
• Payments
• CRM
• Wealth Management
• Multi-channel Retail Platform
Merchant Banking
• Trade Desk / Automatic Trading
• Risk Management
• Asset Portfolio Management
• Finance
• Treasury
• Compliance
• Settlements
• Planning and Strategy
Financial Technology – Operational Regimes
Corporate Responsibility Regimes: -
• Business Principles Regime
• Enterprise Governance Regime
• Reporting and Controls Regime
• Enterprise Risk Management Regime
• Enterprise Performance Management Regime
Reporting and Controls Frameworks
• Accounting Standards • GAAP • IFRS •
Systemic / Operational Risk Frameworks
• Outsights • COSO •
Liquidity Risk Frameworks – Capital Adequacy
• Basle II - Banking
• Solvency II – Insurance


Financial Technology Architecture
Financial Technology Architecture
• The Fin Tech solution that is emerging across the
industry is not a technological abstraction, but rather
consists of several key elements that already lie within,
or close to, the realm of current capabilities.
• These include: -
– Efficiently quantify risk and return against asset portfolios.
– Proactive scenario analysis and “what if” capabilities
– Increased forward pricing management and enhanced
market risk performance with real-time analytics
– The ability to dramatically drive up business benefits
– The ability to dramatically drive down processing costs
– The ability to store, process, use and re-use information of
all types and from all sources quickly and make it
accessible anywhere - from multiple smart device types
– Automated low-maintenance platforms that allow for easy
data capture, streaming, replication and analysis
– New approaches to developing tightly integrated systems
which are based on best-of-class components
Financial Technology Road-map
• Technology innovation is increasingly viewed as a strategic imperative, rather than simply a support
function, as a game-changing chapter will begin to unfold across the whole of the financial services
industry. The idea of a seamlessly integrated approach to capturing, processing, managing, delivering
and correlating data has the potential to change not only the technology landscape but, much more
importantly, the entire business landscape as well.
• The bewildering array of technology tools available today, coupled with emerging new business models
and innovative approaches to compliance and risk geared to address current and future regulatory and
organisational challenges, can shift this idea from a future possibility to an actual solution for today.
Third-party providers, with their experience, expertise and deep resources, can help realise the future
Financial Technology vision - today. At the same time, although the stakes are high for solution
providers, the opportunities are enormous. Firms that excel at execution in achieving optimal computing
power and that have the capability to leverage it will be best-positioned to reap the benefits.
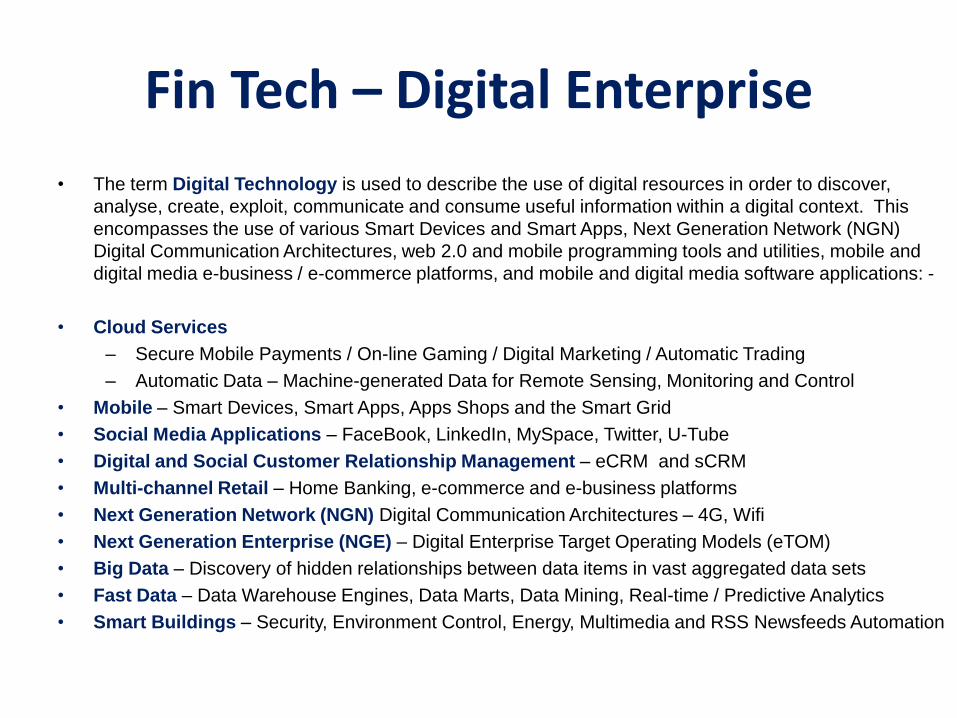
Fin Tech – Digital Enterprise
• The term Digital Technology is used to describe the use of digital resources in order to discover,
analyse, create, exploit, communicate and consume useful information within a digital context. This
encompasses the use of various Smart Devices and Smart Apps, Next Generation Network (NGN)
Digital Communication Architectures, web 2.0 and mobile programming tools and utilities, mobile and
digital media e-business / e-commerce platforms, and mobile and digital media software applications: -
• Cloud Services
– Secure Mobile Payments / On-line Gaming / Digital Marketing / Automatic Trading
– Automatic Data – Machine-generated Data for Remote Sensing, Monitoring and Control
• Mobile – Smart Devices, Smart Apps, Apps Shops and the Smart Grid
• Social Media Applications – FaceBook, LinkedIn, MySpace, Twitter, U-Tube
• Digital and Social Customer Relationship Management – eCRM and sCRM
• Multi-channel Retail – Home Banking, e-commerce and e-business platforms
• Next Generation Network (NGN) Digital Communication Architectures – 4G, Wifi
• Next Generation Enterprise (NGE) – Digital Enterprise Target Operating Models (eTOM)
• Big Data – Discovery of hidden relationships between data items in vast aggregated data sets
• Fast Data – Data Warehouse Engines, Data Marts, Data Mining, Real-time / Predictive Analytics
• Smart Buildings – Security, Environment Control, Energy, Multimedia and RSS Newsfeeds Automation

Fin Tech – Digital Enterprise
Digital Enterprise Planning Methodology: -
1. Understand business and technology environment–
Business Outcomes, Goals and Objectives domains
2. Understand business and technology challenges /
opportunities – Business Drivers and Requirements
3. Gather the evidence to quantify the impact of those
opportunities – Business Case
4. Quantify the business benefits of resolving the
opportunities – Benefits Realisation
5. Quantify the changes need to resolve the
opportunities – Business Transformation
6. Understand Stakeholder Management issues –
Communication Strategy
7. Understand organisational constraints –
Organisational Impact Analysis
8. Understand technology constraints – Technology
Strategy
Digital Enterprise Delivery Methodology: -
1. Understand success management – Scope, Budget,
Resources, Dependencies, Milestones, Timeline
2. Understand achievement measures – Critical Success
Factors / Key Performance Indicators / ROI
3. Produce the outline supporting planning documentation -
Business and Technology Roadmaps
4. Complete the detailed supporting planning documentation
– Programme and Project Plans
5. Design the solution options to solve the challenges –
Business and Solution Architectures
6. Execute the preferred solution implementation – using
Lean / Digital delivery techniques
7. Report Actual Progress, Issues, Risks and Changes
against Budget / Plan / Forecast
8. Delivery, Implementation and Go-live !
The Financial Technology driven Digital Enterprise is all about doing things better today in order to design and build a
better tomorrow. The Digital Enterprise is driven by rapid response to changing conditions so that we can create and maintain
a brighter future for our stakeholders to enjoy. The Digital Enterprise evolves from analysis, research and development into
long-term Strategy and Planning – ranging in scale from the formulation and shaping of Public-sector Political, Economic and
Social Policies to Private-sector Business Programmes, Work-streams and Projects for organisational change and business
transformation – enabling us to envision and achieve our desired future outcomes, goals and objectives

Portfolio Allocation and Modelling – A Technological Arms Race?
• Ever since the advent of Modern Portfolio Theory – asset managers have used computation and
mathematics to model risk and return against their portfolios. Being able to effectively quantify risk and
return against portfolios and markets has allowed managers to address the daily challenges of money
management with objective information and analysis — both of which have steadily increased in volume,
quality and granularity with the advance of computing power. While the application of technology to
portfolio management and asset allocation has helped drive the greatest accumulation of investment
assets in history, it has also had unintended consequences, effectively creating a kind of self-
perpetuating technological arms race that has been blamed for exacerbating the financial crisis.

Portfolio Allocation and Modelling
• Ever since the advent of Modern Portfolio Theory – asset managers have exploited computation
science and mathematics to model risk and return against their portfolios with proactive scenario
analysis and “what if” capabilities. Being so able to effectively quantify risk and return against
portfolios and markets has allowed managers to more effectively address the daily challenges of
money management with objective information and analysis – which in turn have steadily
increased in volume, quality and granularity with the advance of computing power. While the
application of technology to portfolio management and asset allocation has helped drive the
greatest accumulation of investment assets in history – it also has unintended consequences –
effectively creating a kind of self-perpetuating technological arms race which has been blamed
for both accelerating the pace and exacerbating the depth of the 2008 financial crisis.
• Although today’s risk managers enjoy computational tools with unprecedented power at low
costs, they must also navigate an ever-expanding investment universe as new emerging
markets enter the investment mainstream and new types of securities are created. As a result,
investors are confronting the challenges of comprehensively modelling portfolios and markets in
the face of dramatic increases in the scope, detail and timeliness of financial data.
• Accommodating all of these inputs demands ever increasing computational power, which in turn
leads to the further proliferation of data, markets and security types. While computational
capacity grows in line with Moore’s Law, the billions of possible scenarios in the investment
universe may expand at an even faster rate.
Portfolio Allocation and Modelling
• Perhaps even more important than advances in raw computing power are networks that
increase productivity through the global linking of workstations and the interoperability of
software, investment models and strategies. Thanks to the integration of capital markets
and the increased international regulatory cooperation, trading practices and software, a
risk assessment or alpha investment project that works in one market can rapidly be
adapted and deployed in another. With digital networks obliterating many traditional
geographical barriers, teams can exchange lessons learned, adapt strategies, rewrite code
and evolve models in a manner that was impossible even only a few years ago.
• This explosion of network-centric activity means that many asset owners and managers
will forge ahead with investments in IT infrastructure that can accommodate increasing
complexity. An illustration of this challenge can be found in technology-driven solutions to
some of the most important challenges of contemporary global asset management —
market crowding, pricing inefficiencies, risk and rebalancing. The solutions to these
problems are predicated on the notion that the effective application of computing power to
risk modelling and operational efficiency can be almost as important to portfolio
performance as the return characteristics of the underlying asset classes and investments
themselves. Of course, the technology must be used by financial professionals who
understand how best to apply it. Even the best tools in the wrong hands will not lead to
optimal outcomes - and so, the investment technology arms race moves steadily forward.

Financial Technology
Enterprise Risk Management
“No human action happens by pure chance unconnected with other happenings. None is incapable of explanation”
• Dr. Hans Gross (Criminologist) •
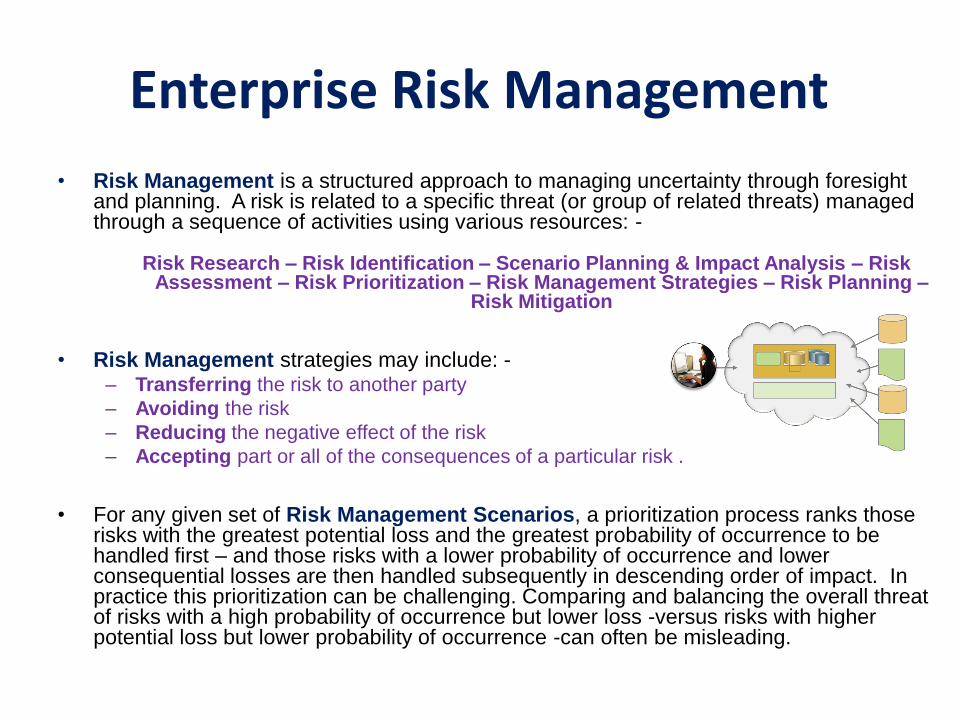
Enterprise Risk Management
• Risk Management is a structured approach to managing uncertainty through foresight and planning. A risk is related to a specific threat (or group of related threats) managed through a sequence of activities using various resources: -
Risk Research – Risk Identification – Scenario Planning & Impact Analysis – Risk Assessment – Risk Prioritization – Risk Management Strategies – Risk Planning –
Risk Mitigation
• Risk Management strategies may include: - – Transferring the risk to another party
– Avoiding the risk
– Reducing the negative effect of the risk
– Accepting part or all of the consequences of a particular risk .
• For any given set of Risk Management Scenarios, a prioritization process ranks those risks with the greatest potential loss and the greatest probability of occurrence to be handled first – and those risks with a lower probability of occurrence and lower consequential losses are then handled subsequently in descending order of impact. In practice this prioritization can be challenging. Comparing and balancing the overall threat of risks with a high probability of occurrence but lower loss -versus risks with higher potential loss but lower probability of occurrence -can often be misleading.

Enterprise Risk Management • Scenario Panning and Impact Analysis: - In any Opportunity / Threat Assessment
Scenario, a prioritization process ranks those risks with the greatest potential loss and the greatest probability of occurring to be handled first - subsequent risks with lower probability of occurrence and lower consequential losses are then handled in descending order. As a foresight concept, Wild Card or Black Swan events refer to those events which have a low probability of occurrence - but an inordinately high impact when they do occur.
– Risk Assessment and Horizon Scanning have become key tools in policy making and strategic planning for many governments and global enterprises. We are now moving into a period of time impacted by unprecedented and accelerating transformation by rapidly evolving catalysts and agents of change in a world of increasingly uncertain, complex and interwoven global events.
– Scenario Planning and Impact Analysis have served us well as a strategic planning tools for the last 15 years or so - but there are also limitations to this technique in this period of unprecedented complexity and change. In support of Scenario Planning and Impact Analysis new approaches have to be explored and integrated into our risk management and strategic planning processes.
• Back-casting and Back-sight: - “Wild Card” or “Black Swan” events are ultra-extreme manifestations with a very low probability of occurrence - but an inordinately high impact when they do occur. In any post-apocalyptic “Black Swan Event” Scenario Analysis, we can use Causal Layer Analysis (CLA) techniques in order to analyse and review our Risk Management Strategies – with a view to identifying those Weak Signals which may have predicated subsequent appearances of unexpected Wild Card or Black Swan events.

Risk Clusters and Connectivity
A
B
C
D
E
G
H
F
The above is an illustration of risks relationships - how risks might be connected. Any detailed and
intimate understanding of the connection between risks may help us to answer questions such as: -
• If risk A occurs does it make risk B or H more or less likely to occur ?
• If risk B occurs what effect does it have on Risks C,D,E, F and G ?
Answering questions such as these allows us to plan our risk management approach and mitigation
strategy – and to decide how better to focus our risk resources and effort
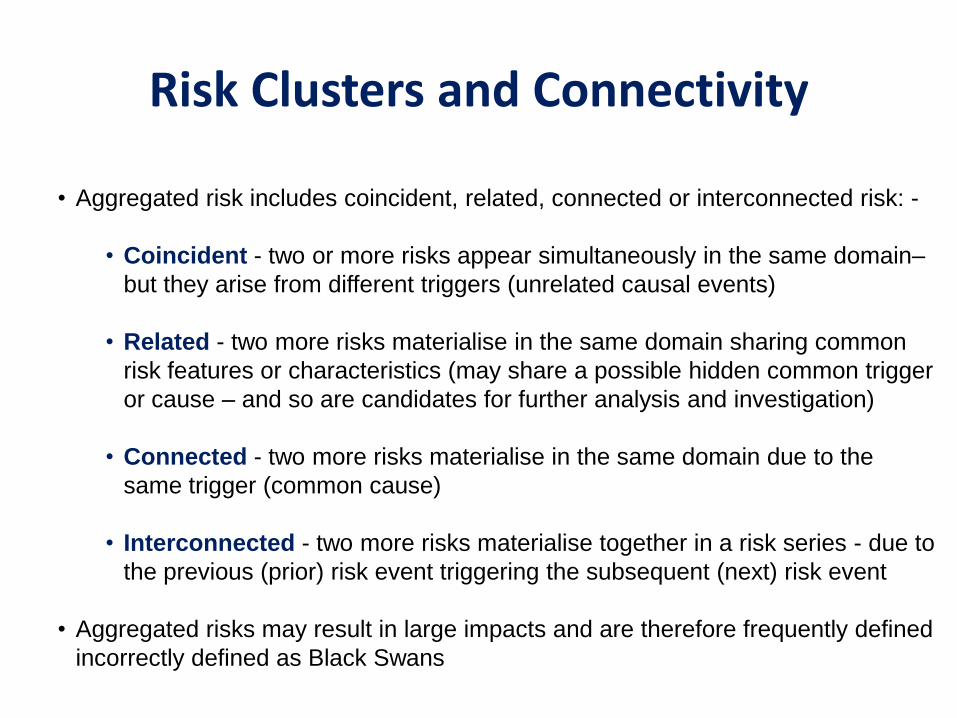
Risk Clusters and Connectivity
• Aggregated risk includes coincident, related, connected or interconnected risk: -
• Coincident - two or more risks appear simultaneously in the same domain–
but they arise from different triggers (unrelated causal events)
• Related - two more risks materialise in the same domain sharing common
risk features or characteristics (may share a possible hidden common trigger
or cause – and so are candidates for further analysis and investigation)
• Connected - two more risks materialise in the same domain due to the
same trigger (common cause)
• Interconnected - two more risks materialise together in a risk series - due to
the previous (prior) risk event triggering the subsequent (next) risk event
• Aggregated risks may result in large impacts and are therefore frequently defined
incorrectly defined as Black Swans

Aggregated Risk
A Trigger A
Coincident Risk
B Trigger B
Risk Event
Risk Event
C Trigger
Related Risk
D Trigger
Risk Event
Risk Event
E
Trigger
Connected Risk
Risk Event
Risk Event F
G Trigger
Inter-connected Risk
Risk Event
Risk Event
H


Risk Management Frameworks
Standard (Integrated) Risk Framework
• Eltville Model / Future Management Frameworks
• Systemic (external) Risk – Outsights
• Operational (internal) Risk – CLAS, SOX / COBIT
• Market (macro-economic) Risk – COSO, Basle II / Solvency II, BoE / FSA
• Trade (micro-economic) Risk – COSO, SOX / COBIT, GAAP / IFRS
Event Risk
• Event Risk is the threat of loss from unexpected events. Event Risk measurement systems seek to quantify the
actual or potential (realised or unrealised) exposure of the total asset portfolio to unexpected Wild Card or Black
Swan Events. Event Risk may arise from Systemic (external) sources – such as Natural Disaster, Geo-political
Crisis, or the collapse of Local, Regional or Global Markets or the failure of Sovereign Nation States - or Operational
(internal) sources – such as Rogue Trading or the failure of Compliance or Disclosure systems and processes.
Market Risk
• Market Risk is the threat of loss from movements in the level or volatility of Market Prices – such as interest rates,
foreign currencies, equities and commodities. Market Risk measurement systems seek to quantify the actual or
potential (realised or unrealised) exposure of the total asset portfolio
Trade Risk
• Trade Risk is the threat of loss from erosion in the attractiveness, desirability or value of specific traded instruments
from individual counterparties – including contracts for foreign currencies, equities and commodities. Trade Risk
measurement systems seek to quantify the actual or potential (realised or unrealised) value of specific contracts or
traded instruments, Trade Risk does not cover Incremental Risk Capital Charge (IRC) due to Toxic Asset lock-in.

Risk Management Frameworks
Credit Risk
• Credit Risk is the threat of loss from changes in the status or liquidity of individual external debtors – changes in their
ability to service debts due to movement in their credit status, capitalisation, liquidity or solvency – or their exposure
to consequential losses due to statutory, regulatory or legal action. Credit Risk measurement systems seek to
quantify the actual or potential (realised / unrealised) ability of a Creditor to fulfil their contractual obligations.
Liquidity Risk – Solvency II and Basle II
• Liquidity Risk is the threat of loss from changes in the status or liquidity of an organisation –changes in their ability to
service debts due to internal movement in their credit status, capitalisation, liquidity or solvency – or their exposure to
consequential losses due to external statutory, regulatory or legal action. Liquidity Risk measurement systems seek to
quantify actual or potential (realised / unrealised) ability of a Bank or Insurer to meet provided / exposed liabilities.
• Basle II and Solvency II are Rules-based, Quantitative Risk Frameworks. The overhaul of the capital adequacy and
solvency rules is now well under way for European Financial Services - Banking and insurance - Life and Pensions,
General Insurers, Underwriters and Re-insurers -. Key drivers for Basle II and Solvency II include the following: -
• Key drivers for Basle II and Solvency II: -
• – EC directive around capital adequacy of Financial Services Companies
• – Critical requirement to bolster capital and strengthen balance sheets
• – Need to have reporting systems in place to demonstrate compliance
• – Deadline is Q4 2010 – so aggressive timeline for implementation
• – Fines and imprisonment for non-compliance or non-disclosure
• – Major insurance companies will invest £100m + in Compliance Programmes
• – Strategy, Business Process, Architecture and Technology changes
• – Specialisations include compliance, risk, finance, actuarial science

Risk Management Frameworks
• Systemic Risk (external threats) - Eltville Model, Future Management Framework, Outsights
– Political Risk – Political Science, Futures Studies and Strategic Foresight
– Economic Risk – Fiscal Policy, Economic Analysis, Modelling and Forecasting
– Social Risk – Population Growth and Migration, Futures Studies and Strategic Foresight
– Environmental Risk – Climate Change, Environmental Analysis, Modelling and Forecasting
– Event Risk – exposure to unexpected local, regional or global events
• Wild Card Events – Horizon Scanning, Tracking and Monitoring – Weak Signals
• Black Swan Events – Scenario Planning and Impact Analysis – Future Management
• Market Risk (macro-economic threats) - COSO, Basle II / Solvency II, BoE / FSA
– Equity Risk – Traded Instrument Product Analysis, Valuation and Financial Management
– Currency Risk – FX Curves and Forecasting
– Commodity Risk – Price Curves and Forecasting
– Interest Rate Risk – Interest Rate Curves and Forecasting
• Trade Risk (micro-economic threats) - COSO, Basle II / Solvency II, BoE / FSA
– Credit Risk – Credit Rating, Balanced Scorecard, Debtor Forecasting and Analysis
– Contract Risk – Asset Valuation, Credit Default Propensity Modelling
– Liquidity Risk – Solvency and Capital Adequacy Rules (Solvency II / Basle II)
– Insurance Risk – Underwriting Due Diligence and Compliance
– Actuarial Risk – Geo-demographic profiling and Morbidity Analysis
– Counter-Party Risk – Counter-Party Threat Analysis and Risk Management
– Fraud Risk (Rogue Trading) – Real-time Analytics at Point-of-Contract-Execution
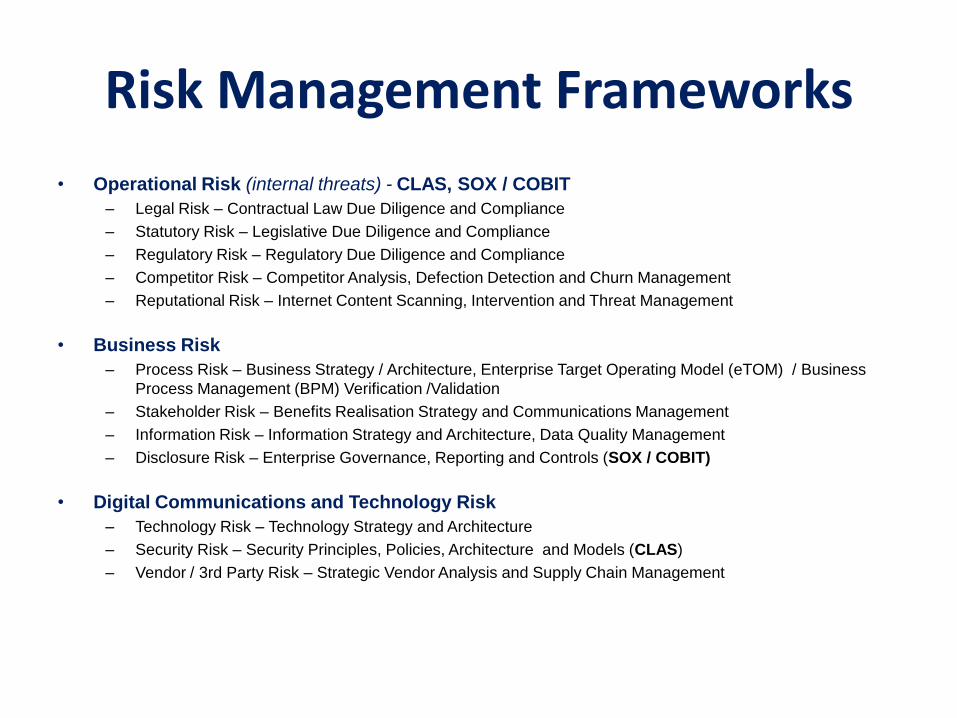
Risk Management Frameworks
• Operational Risk (internal threats) - CLAS, SOX / COBIT
– Legal Risk – Contractual Law Due Diligence and Compliance
– Statutory Risk – Legislative Due Diligence and Compliance
– Regulatory Risk – Regulatory Due Diligence and Compliance
– Competitor Risk – Competitor Analysis, Defection Detection and Churn Management
– Reputational Risk – Internet Content Scanning, Intervention and Threat Management
• Business Risk
– Process Risk – Business Strategy / Architecture, Enterprise Target Operating Model (eTOM) / Business
Process Management (BPM) Verification /Validation
– Stakeholder Risk – Benefits Realisation Strategy and Communications Management
– Information Risk – Information Strategy and Architecture, Data Quality Management
– Disclosure Risk – Enterprise Governance, Reporting and Controls (SOX / COBIT)
• Digital Communications and Technology Risk
– Technology Risk – Technology Strategy and Architecture
– Security Risk – Security Principles, Policies, Architecture and Models (CLAS)
– Vendor / 3rd Party Risk – Strategic Vendor Analysis and Supply Chain Management

Trading and Risk Management

Trading and Risk Management

• MARKET RISK •
Market Risk = Market Sentiment – Actual Results (Reality)
• The two Mood States – “Greed and Fear” are primitive human instincts which, until now,
we've struggled to accurately qualify and quantify. Social Networks, such as Twitter and
Facebook, burst on to the scene five years ago and have since grown into internet
giants. Facebook has over 900 million active members and Twitter over 250 million, with
users posting over 2 billion "tweets“ or messages every week. This provides hugely
valuable and rich insights into how Market Sentiment and Market Risk are impacting on
Share Support / Resistance Price Levels – and so is also a source of real-time data that
can be “mined” by super-fast computers to forecast changes to Commodity Price Curves
Info-graphic – Apple Historic Stock Data Analysis.....
• Investors and traders around the world have accepted the fact that financial markets are
driven by “greed and fear”. This info-graphic is an example of the kind of correlation we
see between historic stock price and social media sentiment data. A trading advantage
can arrive if you spot a significant change in sentiment which is a leading asset price
indicator. Derwent Capital Markets are pioneers in trading the financial markets using
global sentiment derived from large scale social media analysis.
Market Risk

MARKET RISK = MARKET SENTIMENT – ACTUAL RESULTS (REALITY)
Market Risk

Financial Markets around the world are driven by “greed and fear”.....
Derwent Capital Markets –
Market Risk = Market Sentiment – Actual Results (Reality).....
• Derwent Capital Markets used Twitter to figure out where the money is going - just like that. A hedge
fund that analyzed tweets to figure out where to invest its managed funds closed its doors to new
investors last year – after just one month in which it made 1.86% Profit – Annual Projection 21% reports
the Financial Times. “As a result we made the strategic decision to re-use the Social Market Sentiment
Engine behind the Derwent Absolute Return Fund – and invest directly in developing a Social Media on-
line trading platform” commented Derwent Capital Markets founder Paul Hawtin,
Mood states – “greed and fear”.....
• These two mood states are primitive human instincts which, until now, we've struggled to accurately
quantify. Social networks, such as Twitter and Facebook, burst on to the scene five years ago and have
since grown into internet giants. Facebook has over 900 million active members and Twitter over 250
million, with users posting over 2 billion "tweets“ or messages every week. This provides a hugely
valuable and rich source of real-time data that can be “mined” by super-fast computers.....
• Derwent Capital Markets - the sentiment analysis provider launched by Paul Hawtin in May
2012 following the dissolution of his "Twitter Market Sentiment Fund", sold yesterday to the highest
bidder at the end of a two-week online auction. The winning bid came from a Financial Technology (Fin
Tech) firm, which Hawtin declined to name. Hawtin had set a guide price of £5 million ($7.8m), but
claimed at the start of the auction process that any bid over and above the £350,000 ($543,000) cash
he had invested would represent a successful outcome.....
CFD Trading, Spread Betting and FX Trading using “Big Data”

Event Risk
• EVENT RISK •
Black Swan Event = extreme event with Low Probability and High Impact
• A 'Black Swan' Event – is an extreme, rare and unexpected occurrence or event,
with low probability and high impact - difficult to forecast or predict, with outcomes and
consequences deviating far beyond the normal expectations for any given situation –
Nassim Nicholas Taleb - Finance Professor, Author and former Wall Street Trader.
Market Risk = Market Sentiment – Actual Results (Reality)
• The two Mood States – “Greed and Fear” are primitive human instincts which, until
now, we've struggled to accurately qualify and quantify. Social Networks, such as Twitter
and Facebook, burst on to the scene five years ago and have since grown into internet
giants. Facebook has over 900 million active members and Twitter over 250 million, with
users posting over 2 billion "tweets“ or messages every week. This provides hugely
valuable and rich insights into how Market Sentiment and Market Risk are impacting on
Share Support / Resistance Price Levels – and so is also a source of real-time data that
can be “mined” by super-fast computers to forecast changes to Commodity Price Curves
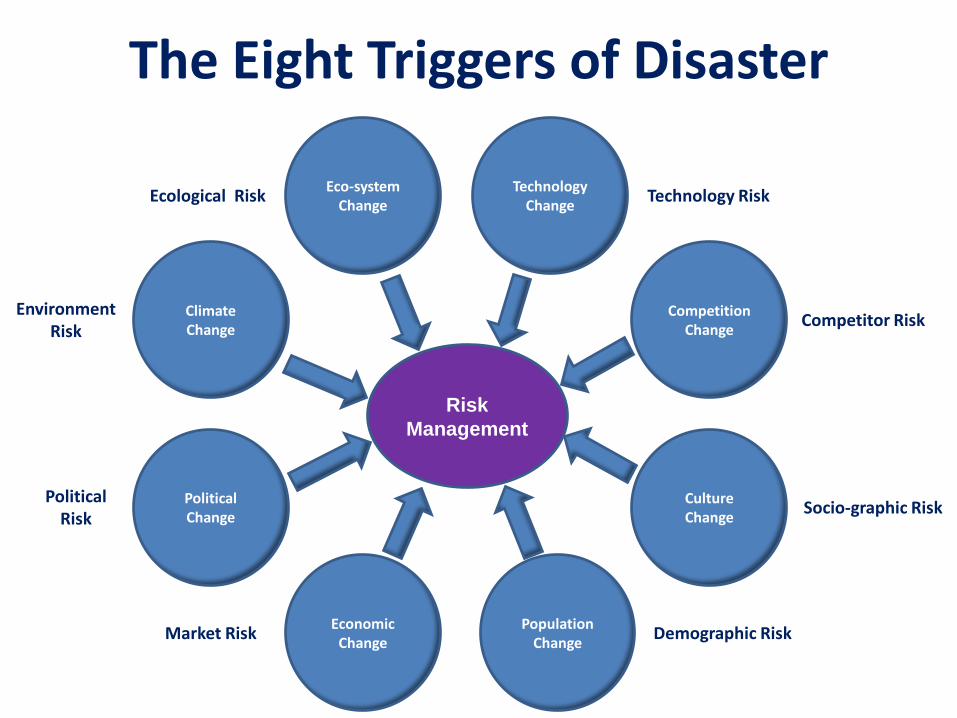
The Eight Triggers of Disaster
Socio-graphic Risk
Risk
Management
Technology Change
Competition Change
Eco-system Change
Climate Change
Population Change
Culture Change
Economic Change
Political Change
Competitor Risk
Political Risk
Environment Risk
Ecological Risk Technology Risk
Demographic Risk Market Risk

Weak Signals Wild Cards, Black Swans
Wild Card
Strong Signal
Random Event
Weak Signal
Communicate Discover
Understand Evaluate
Random Event
Strong Signal
Weak Signal
Wild Card
Black Swan
Runaway Wild Card Scenario
Stock Market Panic of 2008

Trigger D
USA Sub-Prime Mortgage Crisis
Trigger F
CDO Toxic Asset Crisis
K
E Trigger
K Sovereign
Debt Crisis
B Trigger
I
Money
Supply
Shock
C Trigger
H
Financial
Services
Sector
Collapse
D Trigger
G
L
A Trigger
J
Credit
Crisis
Global
Recession
Black Swan Events
Definition of a “Black Swan” Event
• A “Black Swan” Event is an event or
occurrence that deviates beyond what is
normally expected of any given situation
and that would be extremely difficult to
predict. The term “Black Swan” was
popularised by Nassim Nicholas Taleb, a
finance professor and former Investment
Fund Manager and Wall Street trader.
• Black Swan Events – are unforeseen,
sudden and extreme change events or
Global-level transformations in either the
military, political, social, economic or
environmental landscape. Black Swan
Events are a complete surprise when
they occur and all feature an inordinately
low probability of occurrence - coupled
with an extraordinarily high impact when
they do happen (Nassim Taleb). “Black Swan” Event Cluster or “Storm”
Stock Market
Panic of 2008

Enterprise Risk Management

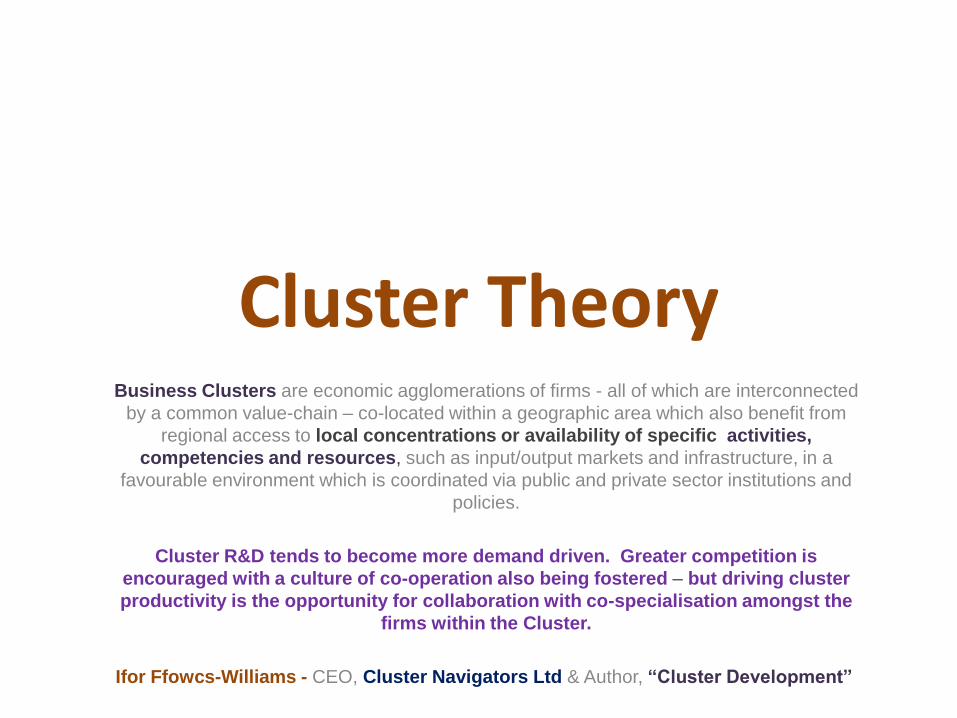
Cluster Theory Business Clusters are economic agglomerations of firms - all of which are interconnected
by a common value-chain – co-located within a geographic area which also benefit from
regional access to local concentrations or availability of specific activities,
competencies and resources, such as input/output markets and infrastructure, in a
favourable environment which is coordinated via public and private sector institutions and
policies.
Cluster R&D tends to become more demand driven. Greater competition is
encouraged with a culture of co-operation also being fostered – but driving cluster
productivity is the opportunity for collaboration with co-specialisation amongst the
firms within the Cluster.
Ifor Ffowcs-Williams - CEO, Cluster Navigators Ltd & Author, “Cluster Development”


Cluster Theory – Industry Sectors
• A Business Cluster is a Geographic Location where a local concentration or availability of specific
competencies and resources in a industry sector, develops favourable conditions that reach a critical
concentration or threshold level, sufficient to create a decisive sustainable competitive advantage –
over and above that of other competing locations – and may further evolve into a position of regional
or even global supremacy in that industry sector or competitive field (e.g. Silicon Valley, Hollywood).
• The fundamental concept of Geographical Economic Clusters – to which social geographers and
economists have also referred to as agglomeration economies – is very well documented by Alfred
Marshall in his work of 1890. The term Business Cluster, also known as an Industry Cluster,
Competitive Cluster, or Technology Cluster, was further popularised by Michael Porter in his book
The Competitive Advantage of Nations (1990). The importance of the role of clusters in economic
geography, or more correctly geographical economics, was also brought to the public attention by
Paul Krugman in his book Geography and Trade (1991). Cluster development has since become an
important focus for numerous government infrastructure and regional development programs.
• Michael Porter claims that clusters have the potential to affect competition in three ways – through
increasing the productivity of the companies in the cluster, by driving innovation in the cluster, and by
stimulating new businesses in the cluster. According to Porter, from 1990 onwards in the modern
global economy, comparative advantage – where certain locations enjoy favourable conditions for
example, cheap labour for Manufacturing (China) and harbour, faculties for Mercantilism (Hong Kong
and Singapore) - are becoming less relevant. Today, it is how companies make efficient use of inputs
to stream continuous innovation – that has achieved increased significance for competitive advantage
.

Cluster Theory – Industry Sectors
• Regional Clusters are created by the local availability or concentration of specific competencies and
resources. Cluster Theory states that any Regional Geographic concentration of any specific Industry
Sector may create a number of advantageous local conditions. The first effect is increased competition
– so greater efficiency is encouraged, leading to improved productivity and higher total profits which are
shared between all of the participating firms in that Industry Sector. It is also claimed that Business
Clustering drives increased Research, Development and Business Innovation (Michael Porter).
• Greater competition is encouraged, but also the opportunity for collaboration, and a culture of
co-operation is fostered – with co-specialisation amongst the firms within the cluster driving
productivity. Public R&D tends to become more demand driven – Ifor Ffowcs-Williams..
• Suppliers are attracted to co-locate into the Regional Cluster – thus shortening the Supply Chain and
improving Logistics. The presence of a wide choice of suppliers in the region leads to greater vendor
performance and thus reduced costs for collaborating firms. Those firms with a successful Business
Operating Model also tend to become more competitive, eventually leading to economies of scale being
derived from both vertical and horizontal integration – Business Agglomeration – that is, absorption of
smaller, less efficient competitors, customers and suppliers by expanding industry conglomerates. The
presence of a regional centre of excellence for any Industry Sector also attracts an increasingly Global
customer base seeking reliable Business Partners – this Globalisation effect in turn promotes both local
and inward investment and drives further business expansion and industry sector growth.

Cluster Theory – Industry Sectors
• Globalisation and localisation are two sides of the same coin. Merger and Acquisition activity is
healthily enhanced within a strong cluster - but needs to be continually fed by new start-ups and
spin-offs - Ifor Ffowcs-Williams..
• Concentrating related industries together in specific regions also creates greater demand in the local
Labour Market, leading over time to the development of a specialist regional skills base. This may
cause the spin-off of new businesses exploiting the skills available in the labour pool. Increased
employment opportunities also means increased Wages flowing into the Regional Economy and greater
Regional Taxation Revenues - which in turn yields multiple benefits across the region as a whole.
• 'Smart Specialisation' is the term being increasingly used by the European Union. Skills
development is often the main issue facing a high growth cluster - Ifor Ffowcs-Williams.
• Note that a cluster is not artificially confined within a rigid Geographic Area - e.g. Tech City lies both in
and around the boundaries of Shoreditch's. There are related Digital Clusters - e.g. The Science Park
north of Cambridge, and in the Innovation Campus around the BT Laboratories Hub at Adastral Park in
Martlesham Heath, near Ipswich.
Expert Commentator: -
• Ifor Ffowcs-Williams, CEO, Cluster Navigators Ltd and Author, “Cluster Development” – Address : Nelson 7010, New Zealand (Office)
– Email : [email protected]

Cluster Theory – Industry Sectors
Cluster Definitions
• Clusters are economic agglomerations of firms co-located within a geographic area - all connected by
a common value-chain – which benefit from regional access to local concentrations or availability of
specific activities, competencies and resources, such as input/output markets and infrastructure, in a
favourable environment which is coordinated via public and private sector institutions and policies.
• Clustering is the tendency of vertically and horizontally integrated firms in related lines of business to
concentrate together geographically (OECD, 2001). Clusters are geographically co-located groups of
interconnected companies and institutions which operate together in a specific field or industry sector
and are linked together by a number of common and complementary factors (Michael Porter, 1998).
• Clusters are co-located groups of Business Enterprises, Government Agencies and NGOs for whom a
close association is an important source of individual and collective competitive advantage – using
common factors such as Finance (venture capital) , Procurement (buyer-supplier relationships) and
Distribution (supply chain channels), that exploits shared activities, resources, technologies, skills,
knowledge and labour pools – which binds the cluster closely together (Bergman and Feser, 1999).
• Clusters are networks of strongly interdependent enterprises (customers and suppliers), all linked
together in an integrated production chain, in value-added activities or via business partnerships, (e.g
Automotive and Aerospace sector). In many types of Cluster enterprise relationships also encompass
strategic alliances with Government Agencies, universities, research institutes, bridging institutions and
knowledge providers (i.e. consultants, brokers, business services), (Roelandt / den Hertog, 1999)

NESTA
creative clusters
• NESTA have created the first ever map of the UK's most creative business clusters.
• This definitive work identifies all of the nation's top 'creative hotspots', - areas which host clusters of creative businesses which are promoting technology innovation and driving economic growth across their region.


Moore's Law

Moore's Law
• In 1965, the observation made by Gordon Moore, co-founder of Intel, is that the number
of transistors per square inch on integrated circuits had doubled every year since the integrated
circuit was invented. Moore predicted that this trend would continue for the foreseeable future. In
subsequent years, the pace of change has slowed down somewhat - but Data Storage Density
(gigabytes) has doubled approximately every 18 months - a definition which Moore himself has
blessed. The current definition of Moore's Law, accepted by most experts, including Disruptive
Futurists and Moore himself, is that Computing Power (gigaflops) will double about every two
years. Expect Moore's Law to hold good for at least another generation.....
• A forecast - and a challenge. Gordon Moore’s forecast for the pace of change in silicon
technology innovation - known as Moore's Law - essentially describes the basic business model
for the semiconductor industry. Intel, through investments in technology and manufacturing has
made Moore’s Law a reality. As transistor scale gets ever smaller Intel expects to continue to
deliver on Moore’s prediction well into the foreseeable future by using an entirely new transistor
formula that alleviates wasteful electricity leaks creating more energy-efficient processors.
• Exponential growth that continues today. Continuing Moore's Law means the rate of
progress in the semiconductor industry will far surpass that of nearly all other industries. The
future of Moore’s Law could deliver a magnitude of exponential capability increases, driving a
fundamental shift in computing, networking, storage, and communication devices to handle the
ever-growing digital content and Intel's vision of 15 billion intelligent, connected smart devices.


Research Philosophies
• This section aims to discuss Research Philosophies in detail, in order to develop a
general awareness and understanding of the options - and to describe a rigorous
approach to Research Methods and Scope as a mandatory precursor to the full
Research Design. Denzin and Lincoln (2003) and Kvale (1996) highlight how
different Research Philosophies can result in much tension amongst academics
• When undertaking any research of either a Scientific or Humanistic nature, it is most
important to consider, compare and contrast all of the varied and diverse Research
Philosophies and Paradigms available to the researcher and supervisor - along with
their respective treatment of ontology and epistemology issues.
• Since Research Philosophies and paradigms often describe perceptions, beliefs,
and assumptions about the nature of reality and truth (knowledge of that reality), they
can influence the way in which the research is undertaken, from design through to
outcomes and conclusions – so it is important to understand and discuss these
contrasting aspects in order that approaches congruent to the nature and aims of the
particular inquiry in question, are adopted - and to ensure that researcher and
supervisor biases are understood, exposed, and mitigated.

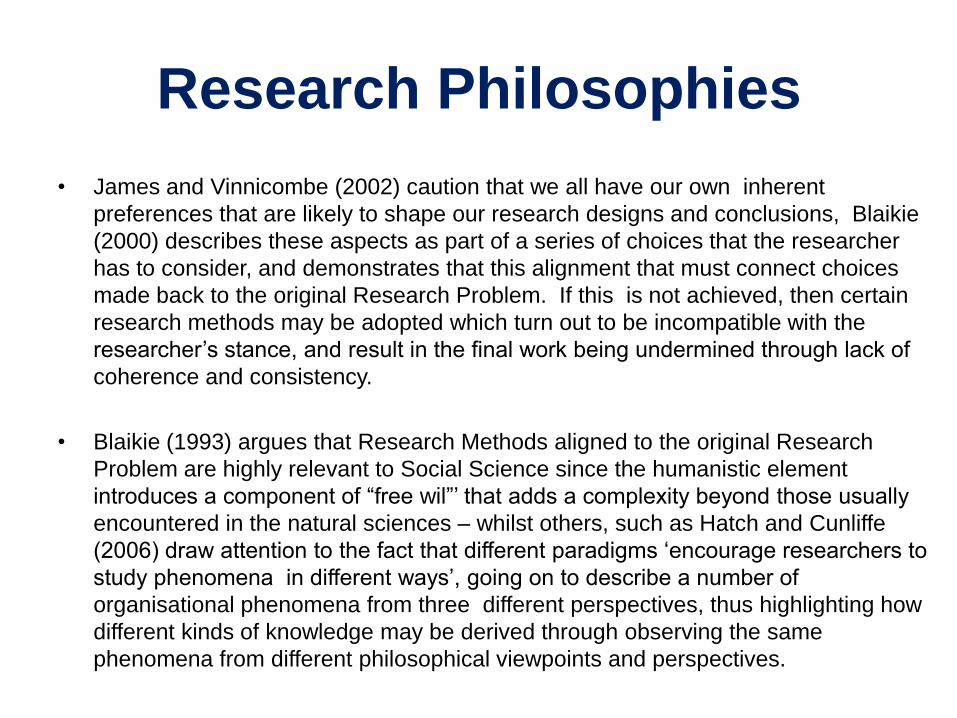
Research Philosophies
• James and Vinnicombe (2002) caution that we all have our own inherent
preferences that are likely to shape our research designs and conclusions, Blaikie
(2000) describes these aspects as part of a series of choices that the researcher
has to consider, and demonstrates that this alignment that must connect choices
made back to the original Research Problem. If this is not achieved, then certain
research methods may be adopted which turn out to be incompatible with the
researcher’s stance, and result in the final work being undermined through lack of
coherence and consistency.
• Blaikie (1993) argues that Research Methods aligned to the original Research
Problem are highly relevant to Social Science since the humanistic element
introduces a component of “free wil”’ that adds a complexity beyond those usually
encountered in the natural sciences – whilst others, such as Hatch and Cunliffe
(2006) draw attention to the fact that different paradigms ‘encourage researchers to
study phenomena in different ways’, going on to describe a number of
organisational phenomena from three different perspectives, thus highlighting how
different kinds of knowledge may be derived through observing the same
phenomena from different philosophical viewpoints and perspectives.

Research Methods
• When undertaking any research of either a Scientific or Humanistic nature, it is most important for the researcher and supervisor to consider, compare and contrast all of the varied and diverse Research Philosophies and Paradigms, Data Analysis Methods and Techniques available - along with the express implications of their treatment of ontology and epistemology issues....,
Research Philosophies
• Blaikie (1993) also describes the root definition of ontology as “the science or
study of being” and develops this existential description for the social sciences to
encompass “claims about what exists, what it looks like, what units it is made up
of, and how these units interact with each other”. In short, ontology describes
our own personal world view (whether as claims or assumptions) of the nature of
reality, and specifically - is this an objective reality that actually exists - or simply
a self created subjective reality, which exists only within our own minds..... ?
• All of us nurture our own deeply embedded and strongly held ontological views
and assumptions – which tends to affect whether we attribute the phenomenon
of existence to one set of things over another set of different things. Such views
and assumptions may also impact on what we perceive to be real – against what
truly does exist and what actual reality is. If these underlying assumptions and
biases are not identified, considered and mitigated – then the researcher may
take for granted, obscure, explicitly ignore, or even become totally unaware of -
certain critical phenomena or aspects of the inquiry. Since those critical aspects
or phenomena are implicitly assumed either to exist or not exist – they are as a
result, no longer open to question, discussion, review - or even consideration.....

Research Philosophies
• Hatch and Cunliffe (2006) quote both an everyday example, and a social
science example to illustrate this point. For the everyday example, they use
the instance of a workplace report – seeking to question whether the report
describes what is really going on – or only what the author thinks is going on.
• They go on to highlight the complexity which is introduced when considering
any phenomena such as culture, power or control, and whether any given
reality exists – or is simply an illusion. Further extending the discussion as to
how individuals (and groups) determine these realities, Hatch and Cunliffe
pose the following question:
– does any given phenomenon of reality exist only internally and through the subject’s
own thoughts and interpretation of their life and experiences (subjectivism) ?
– or does this specific phenomenon of reality fully and independently exist externally
of the individual as a demonstrable collective belief set or experience common to a
group or community of individuals who collectively perceive, own and live with this
specific reality (objectivism) – which can be documented by external observers ?
Future Management Methods and Techniques
Throughout eternity, all that is of like form comes around
again – everything that is the same must return again in
its own everlasting cycle.....
• Marcus Aurelius – Emperor of Rome •
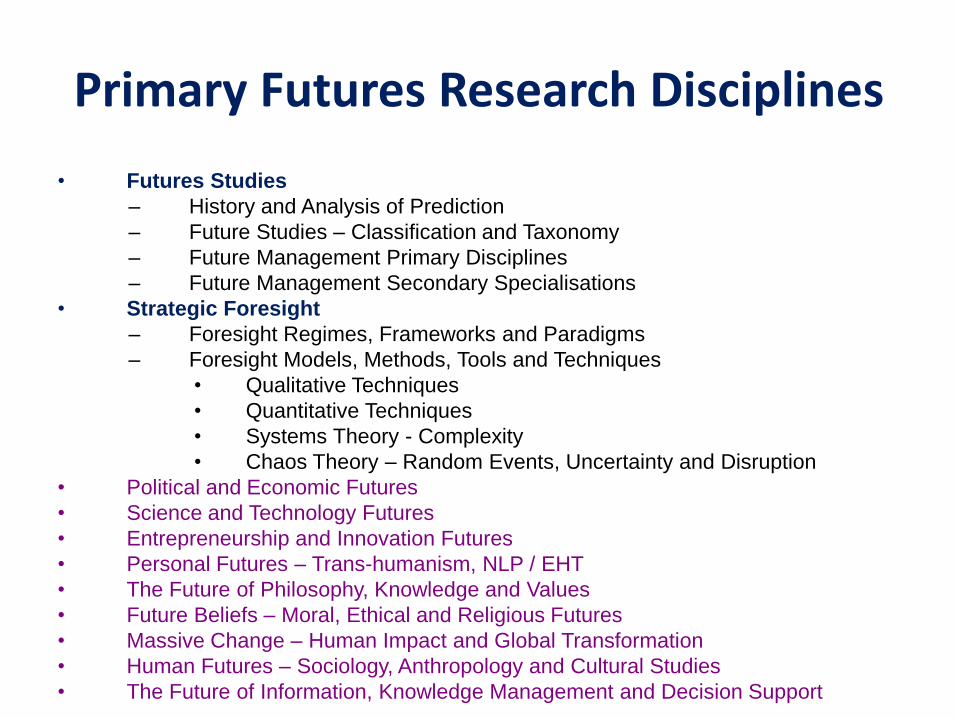
Primary Futures Research Disciplines
• Futures Studies
– History and Analysis of Prediction
– Future Studies – Classification and Taxonomy
– Future Management Primary Disciplines
– Future Management Secondary Specialisations
• Strategic Foresight
– Foresight Regimes, Frameworks and Paradigms
– Foresight Models, Methods, Tools and Techniques
• Qualitative Techniques
• Quantitative Techniques
• Systems Theory - Complexity
• Chaos Theory – Random Events, Uncertainty and Disruption
• Political and Economic Futures
• Science and Technology Futures
• Entrepreneurship and Innovation Futures
• Personal Futures – Trans-humanism, NLP / EHT
• The Future of Philosophy, Knowledge and Values
• Future Beliefs – Moral, Ethical and Religious Futures
• Massive Change – Human Impact and Global Transformation
• Human Futures – Sociology, Anthropology and Cultural Studies
• The Future of Information, Knowledge Management and Decision Support

DETERMINISTIC versus PROBABILISTIC PARADIGMS
• Utopian (Idealistic) Paradigm - Strategic Positivism
• Humanist (Instructional) Paradigm - Sceptic Futurism
• Dogmatic (Theosophical) Paradigm - Reactionary Futurism
• Utilitarian (Consequential) Paradigm – Egalitarian Futurism
• Extrapolative (Projectionist) Paradigm – Wave, Cycle, Pattern and Trend Analysis
• Steady State (La meme chose - same as it ever was) Paradigm – Constant Futurism
• Hellenistic (Classical) Paradigm – Future of Human Ethics, Morals, Values and Beliefs
• Pre-ordained (Pre-disposed, Stoic) Paradigm - Cognitive Analysis / Intuitive Assimilation
• Elitism (New World Order) - Goal Seeking, Leadership Studies and Stakeholder Analysis
• Existentialist Paradigm (Personal Futures) - Trans-humanism, The Singularity, NLP / EHT
• Empirical (Scientific Determinism, Theoretical Positivism) Paradigm – Hypothetical Futurism
• Predictive (Ordered, Systemic, Mechanistic, Enthalpy) Paradigm – Deconstructionist Futurism
DETERMINISTIC PHILOSOPHIES and FUTURE VIEWPOINTS

DETERMINISTIC versus PROBABILISTIC PARADIGMS
• Polemic (Rational) Paradigm - Enlightened Futurism
• Dystopian (Fatalistic) Paradigm – Probabilistic Negativism
• Postmodernism (Reactionary) Paradigm - Structural Futurism
• Complexity (Constructionist) Paradigm - Complex Systems and Chaos Theory
• Metaphysical (Naturalistic, Evolutionary, Adaptive) Paradigm - Gaia Hypothesis
• Mystic (Gnostic, Sophistic, Esoteric, Cathartic) Paradigm – Contemplative Futurism
• Uncertainty (Random, Chaotic, Disorderly, Enthalpy) Paradigm - Disruptive Futurism
• Experiential (Forensic, Deductive, Realist, “Blue Sky”) Paradigm – Pragmatic Futurism
• Qualitative (Narrative, Reasoned) Paradigm - Scenario Forecasting and Impact Analysis
• Simplexity (Reductionist) Paradigm – Loosely-coupled Linear Systems and Game Theory
• Interpretive (Ordered, Systemic, Mechanistic, Entropic) Paradigm – Constructive Futurism
• Quantitative (Logical, Technical) Paradigm - Mathematical Modelling & Statistical Analysis
PROBABILISTIC PHILOSOPHIES and FUTURE VIEWPOINTS

Secondary Future Specialties
• Monte Carlo Simulation • Forecasting and Foresight • Back-casting and Back-sight • Causal Layered Analysis (CLA) • Complex Adaptive Systems (CAS) • Political Science and Policy Studies • Linear Systems and Game Theory • War-gaming and Lanchester Theory • Complex Systems and Chaos Theory • Integral Studies and Future Thinking • Critical and Evidence-Based Thinking • Predictive Surveys and Delphi Oracle • Visioning, Spontaneity and Creativity • Foresight, Intuition and Pre-cognition • Developmental & Accelerative Studies • Systems & Technology Trends Analysis • Scenario Planning and Impact Analysis • Collaboration, Facilitation & Mentoring
• Black Swan Events - Weak Signals, Wild Cards, Chaos, Uncertainty & Disruption
• Economic Modelling & Planning • Financial Planning and Analysis • Ethics of Emerging Technology Studies • Horizon Scanning, Tracking & Monitoring • Intellectual Property and Knowledge • Critical Futures and Creative Thinking • Emerging Issues and Technology Trends • Patterns, Trends & Extrapolation Analysis • Linear Systems & Random Interactions • Cross Impact Analysis and Factors of
Global Transformation and Change • Preferential Surveys / Polls and Market
Research, Analysis and Prediction • The Future of Religious Beliefs - Theology,
Divinity, Ritual, Ethics and Value Studies • Theosophical, Hermetic, Mystic, Esoteric
and Enlightened Spiritual Practices

Secondary Future Specialties
• Science and Technology Futures • The Cosmology Revolution
– Dark Energy, Dark Mass – String Theory and the Nature of Matter
• SETI – The Search for Extra-Terrestrial Planetary Systems, Life and Intelligence
• Nano-Technology, Nuclear Physics and Quantum Mechanics
• The Energy Revolution - Nuclear Fusion Hydrolysis and Clean Energy
• Science and Society Futures – the Social Impact of Technology
• Smart Cities of the Future • The Information Revolution – Internet
Connectivity and the Future of the Always-on Digitally Connected Society
• Digital Connectivity, Smart Devices, the Smart Grid & Cloud Computing Futures
• Content Analysis (“Big Data”) – Data Set “mashing”, Data Mining & Analytics
• Earth and Life Sciences – the Future of Biology, Geology & Geographic Science
• Environmental Sustainability Studies – Climatology, Ecology and Geography
• Human Activity – Climate Change and Future Environmental Degradation – Desertification and De-forestation
• Human Populations - Profiling, Analysis, Streaming and Segmentation
• Human Futures - Population Drift and Urbanisation - Human Population Curves and Growth Limit Analysis
• The Future of Agriculture, Forestry, Fisheries, Agronomy & Food Production
• Terrain Mapping and Land Use – Future of Topology, Topography & Cartography
• Future Natural Landscape Planning, Environmental Modelling and Mapping
• Future Geographic Information Systems, Spatial Analysis & Sub-surface Modelling
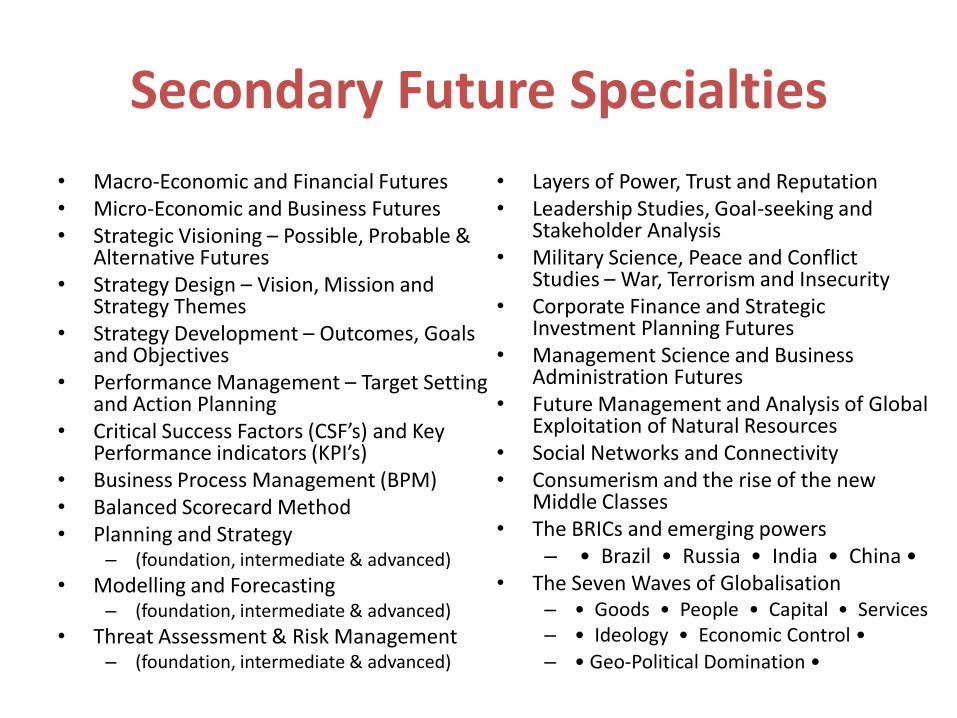
Secondary Future Specialties
• Macro-Economic and Financial Futures • Micro-Economic and Business Futures • Strategic Visioning – Possible, Probable &
Alternative Futures • Strategy Design – Vision, Mission and
Strategy Themes • Strategy Development – Outcomes, Goals
and Objectives • Performance Management – Target Setting
and Action Planning • Critical Success Factors (CSF’s) and Key
Performance indicators (KPI’s) • Business Process Management (BPM) • Balanced Scorecard Method • Planning and Strategy
– (foundation, intermediate & advanced)
• Modelling and Forecasting – (foundation, intermediate & advanced)
• Threat Assessment & Risk Management – (foundation, intermediate & advanced)
• Layers of Power, Trust and Reputation • Leadership Studies, Goal-seeking and
Stakeholder Analysis • Military Science, Peace and Conflict
Studies – War, Terrorism and Insecurity • Corporate Finance and Strategic
Investment Planning Futures • Management Science and Business
Administration Futures • Future Management and Analysis of Global
Exploitation of Natural Resources • Social Networks and Connectivity • Consumerism and the rise of the new
Middle Classes • The BRICs and emerging powers
– • Brazil • Russia • India • China • • The Seven Waves of Globalisation
– • Goods • People • Capital • Services – • Ideology • Economic Control •
– • Geo-Political Domination •

Secondary Future Specialties
• Human Values, Ethics and Beliefs • History, Culture and Human Identity • Human Geography & Industrial Futures • Human Factors and Behavioural Theory • Anthropology, Sociology and Factors of
Cultural Change • Human Rites, Rituals and Customs - the
Future of Cults, Sects and Tribalism • Ethnographic and Demographic Futures • Epidemiology, Morbidity and Actuarial
Science Futures • Infrastructure Strategy, Regional Master
Planning and Urban Renewal • Future Townscape Envisioning. Planning
Modelling and Virtual Terrain Mapping • The Future of Urban and Infrastructure
Master Planning, Zoning and Control • Architecture and Design Futures - living
in the Built Environment of the Future
• Trans-humanism – The Future Human State – Qualities, Capabilities, Capacities
• The Future of Medical Science, Bio-Technology and Genetic Engineering
• The Future of the Human Condition - Health, Wealth and Wellbeing
• The Future of Biomechanics, Elite Sports and Professional Athletics
• Personal Futures – Motivational Studies, Life Coaching and Personal Training
• Positive Thinking – Self-Awareness, Self-Improvement & Personal Development
• Positive Behavioural Psychology and Cognitive Therapy - NLP and EHT
• Intuitive Assimilation and Cognitive Analysis
• Predictive Envisioning and Foresight Development
• Contemplative Mediation and Psychic Methods
• Divination, Lexicology, Numerology and Theological Methods

Secondary Future Specialties
• Business Strategy, Transformation and Programme Management Futures
• Next Generation Enterprises (NGE) – Envisioning, Planning and Modelling
• Multi-tier Collaborative Future Business Target Operating Models (eTOM)
• Corporate Responsibility / Triple Bottom Line Management
• Regulatory Compliance - Enterprise Governance, Reporting and Controls
• Future Economic Modelling, Long-range Forecasting and Financial Analysis
• The Future of Organisational Theory and Operational Analysis
• Business Innovation and Product Planning Futures
• Technology Innovation and Product Design Futures
• Product Engineering and Production Planning Futures
• Enterprise Resource Planning and Production Management Futures
• Marketing Needs Analysis, Propositions and Product Life-cycle Management
• The Future of Marketing Services, Communications and Advertising
• The Future of Media, Entertainment and Multi-channel Communications
• The Future of Leisure, Travel & Tourism – Culture, Restaurants and Entertainment
• The Future of Spectator Events - Elite Team Sports and Professional Athletics
• The Future of Art, Literature and Music • The Future of Performance Arts, Theatre
and the Moving Image • Science Fiction & Images of the Future • Interpreting Folklore, Legends & Myths –
Theology, Numerology & Lexicography • Utopian and Dystopian Literature, Film
and Arts

Research Philosophies and Investigative Methods
Qualitative and Quantitative Investigative Methods
Qualitative Methods: –
tend to be deterministic, interpretive and subjective in nature.
Quantitative Methods: –
tend to be probabilistic, analytic and objective in nature.....

Qualitative and Quantitative Methods
Research Study Roles and Responsibilities
• Supervisor – authorises and directs the Research Study.
• Project Manager – plans and leads the Research Study.
• Moderator – reviews and mentors the Research Study.
• Researcher – undertakes the detailed Research Tasks.
• Research Aggregator – examines hundreds of related Research
papers - looking for hidden or missed Findings and Extrapolations.
• Author – compiles, documents and edits the Research Findings.
The Temporal Wave
• The Temporal Wave is a novel and innovative method for Visual Modelling and Exploration
of Geospatial “Big Data” - simultaneously within a Time (history) and Space (geographic)
context. The problems encountered in exploring and analysing vast volumes of spatial–
temporal information in today's data-rich landscape – are becoming increasingly difficult to
manage effectively. In order to overcome the problem of data volume and scale in a Time
(history) and Space (location) context requires not only traditional location–space and
attribute–space analysis common in GIS Mapping and Spatial Analysis - but now with the
additional dimension of time–space analysis. The Temporal Wave supports a new method
of Visual Exploration for Geospatial (location) data within a Temporal (timeline) context.
• This time-visualisation approach integrates Geospatial (location) data within a Temporal
(timeline) data along with data visualisation techniques - thus improving accessibility,
exploration and analysis of the huge amounts of geo-spatial data used to support geo-
visual “Big Data” analytics. The temporal wave combines the strengths of both linear
timeline and cyclical wave-form analysis – and is able to represent data both within a Time
(history) and Space (geographic) context simultaneously – and even at different levels of
granularity. Linear and cyclic trends in space-time data may be represented in combination
with other graphic representations typical for location–space and attribute–space data-
types. The Temporal Wave can be used in roles as a time–space data reference system,
as a time–space continuum representation tool, and as time–space interaction tool.

Linear and Non-linear Systems
Linear Systems – all system outputs are directly and proportionally related to system inputs
• Types of linear algebraic function behaviours; examples of Simple Systems include: -
– Game Theory and Lanchester Theory
– Civilisations and SIM City Games
– Drake Equation (SETI) for Galactic Civilisations
Non-linear Systems – system outputs are asymmetric and not proportional or related to inputs
• Types of non-linear algebraic function behaviours: examples of Complex / Chaotic Systems are: -
– Complex Systems – large numbers of elements with both symmetric and asymmetric relationships
– Complex Adaptive Systems (CAS) – co-dependency and co-evolution with external systems
– Multi-stability – alternates between multiple exclusive states.(lift status = going up, down, static)
– Chaotic Systems
• Classical chaos – the behaviour of a chaotic system cannot be predicted.
• A-periodic oscillations – functions that do not repeat values after a certain period (# of cycles)
– Solitons – self-reinforcing solitary waves - due to feedback by forces within the same system
– Amplitude death – any oscillations present in the system cease after a certain period (# of cycles)
due to feedback by forces in the same system - or some kind of interaction with external systems.
– Navis-Stokes Equation for the motion of a fluid: -
• Weather Forecasting
• Plate Tectonics and Continental Drift
Qualitative and Quantitative Methods
Qualitative and Quantitative Methods
Qualitative Methods - tend to be deterministic, interpretive and subjective in nature. • When we wish to design a research project to investigate large volumes of unstructured data
producing and analysing graphical image and text data sets with a very large sample or set of information – “Big Data” – then the quantitative method is preferred. As soon as subjectivity - what people think or feel about the world - enters into the scope (e.g. discovering Market Sentiment via Social Media postings), then the adoption of a qualitative research method is vital. If your aim is to understand and interpret people’s subjective experience and the broad range of meanings that attach to it, then interviewing, observation and surveying a range of non-numerical data (which may be textual, visual, aural) are key strategies you will consider. Research approaches such as using focus groups, producing case studies, undertaking narrative or content analysis, participant observation and ethnographic research are all important qualitative methods. You will also want to understand the relationship of qualitative data to numerical research. Any qualitative methods pose their own problems with ensuring the research produces valid and reliable results (see also: Analytics - Working with “Big Data”).
Quantitative Methods - tend to be probabilistic, analytic and objective in nature. • When we want to design a research project to tests a hypothesis objectively by capturing and
analysing numerical data sets with a large sample or set of information – then the quantitative method is preferred. There are many key issues to consider when you are designing an experiment or other research project using quantitative methods, such as randomisation and sampling. Also, quantitative research uses mathematical and statistical means extensively to produce reliable analysis of its results (see also: Cluster Analysis and Wave-form methods).

Qualitative (Narrative) Analysis
• Qualitative (Narrative) Analysis may involve the further processing of summarised
results generated by Quantitative (Technical) Analysis - using “Big Data” super sets
aggregated from many thousands of discrete, individual data sets. Methods such as
Monte Carlo Simulation – cycle model runs repeatedly through thousands of iterations –
minutely varying the starting conditions for every individual cycle run.
– Climate Forecasting – Global or Continental summarised weather cell data sets
– Weather Forecasting – Regional or Local detailed weather cell data sets
– Fiscal Output and Performance Forecasting - macro-economic data sets
– Industrial Output and Performance Forecasting - micro-economic data sets
– Market Sentiment Movement Forecasting – social media content data sets
– Commodity Price Curve Forecasting – Market Data - commodity price data sets
• Results appear as a scatter diagram consisting of thousands of individual points, for
example, commodity prices over a given time line. Instead of a random distribution – we
discover clusters of closely related results against a background of scattered outliers.
Each of these clusters represents a Scenario – which is analysed using Cluster Analysis
methods - Causal Layer Analysis (CLA), Scenario Planning and Impact Analysis– where
numeric results are explained as a narrative story about a possible future outcome –
along with the probability of that scenario materialising.
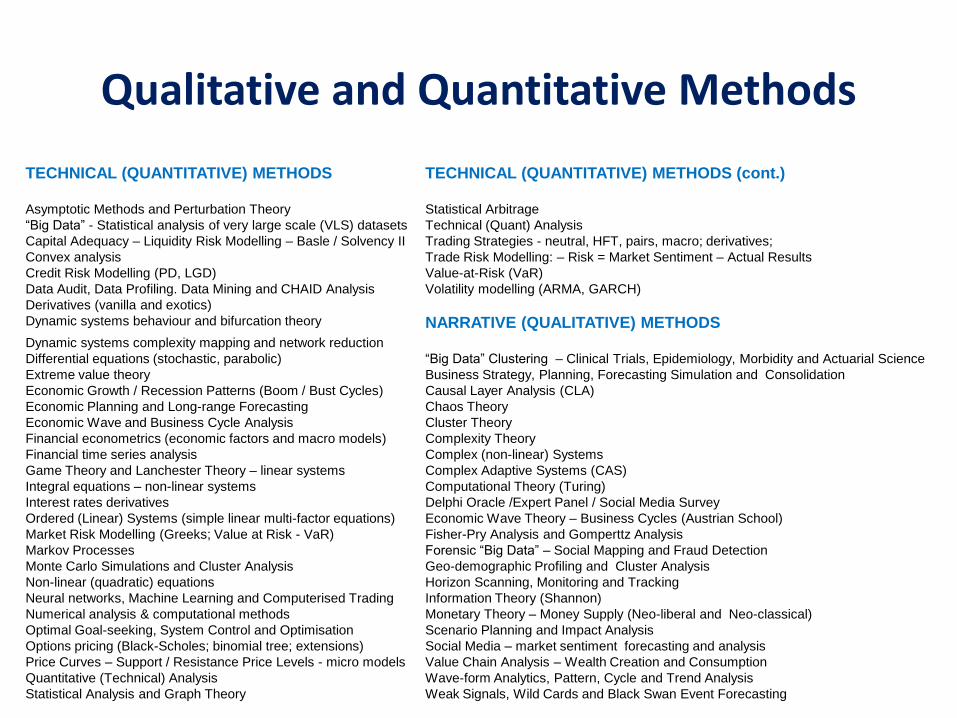
Qualitative and Quantitative Methods
TECHNICAL (QUANTITATIVE) METHODS TECHNICAL (QUANTITATIVE) METHODS (cont.)
Asymptotic Methods and Perturbation Theory Statistical Arbitrage
“Big Data” - Statistical analysis of very large scale (VLS) datasets Technical (Quant) Analysis
Capital Adequacy – Liquidity Risk Modelling – Basle / Solvency II Trading Strategies - neutral, HFT, pairs, macro; derivatives;
Convex analysis Trade Risk Modelling: – Risk = Market Sentiment – Actual Results
Credit Risk Modelling (PD, LGD) Value-at-Risk (VaR)
Data Audit, Data Profiling. Data Mining and CHAID Analysis Volatility modelling (ARMA, GARCH)
Derivatives (vanilla and exotics)
Dynamic systems behaviour and bifurcation theory NARRATIVE (QUALITATIVE) METHODS
Dynamic systems complexity mapping and network reduction
Differential equations (stochastic, parabolic) “Big Data” Clustering – Clinical Trials, Epidemiology, Morbidity and Actuarial Science
Extreme value theory Business Strategy, Planning, Forecasting Simulation and Consolidation
Economic Growth / Recession Patterns (Boom / Bust Cycles) Causal Layer Analysis (CLA)
Economic Planning and Long-range Forecasting Chaos Theory
Economic Wave and Business Cycle Analysis Cluster Theory
Financial econometrics (economic factors and macro models) Complexity Theory
Financial time series analysis Complex (non-linear) Systems
Game Theory and Lanchester Theory – linear systems Complex Adaptive Systems (CAS)
Integral equations – non-linear systems Computational Theory (Turing)
Interest rates derivatives Delphi Oracle /Expert Panel / Social Media Survey
Ordered (Linear) Systems (simple linear multi-factor equations) Economic Wave Theory – Business Cycles (Austrian School)
Market Risk Modelling (Greeks; Value at Risk - VaR) Fisher-Pry Analysis and Gomperttz Analysis
Markov Processes Forensic “Big Data” – Social Mapping and Fraud Detection
Monte Carlo Simulations and Cluster Analysis Geo-demographic Profiling and Cluster Analysis
Non-linear (quadratic) equations Horizon Scanning, Monitoring and Tracking
Neural networks, Machine Learning and Computerised Trading Information Theory (Shannon)
Numerical analysis & computational methods Monetary Theory – Money Supply (Neo-liberal and Neo-classical)
Optimal Goal-seeking, System Control and Optimisation Scenario Planning and Impact Analysis
Options pricing (Black-Scholes; binomial tree; extensions) Social Media – market sentiment forecasting and analysis
Price Curves – Support / Resistance Price Levels - micro models Value Chain Analysis – Wealth Creation and Consumption
Quantitative (Technical) Analysis Wave-form Analytics, Pattern, Cycle and Trend Analysis
Statistical Analysis and Graph Theory Weak Signals, Wild Cards and Black Swan Event Forecasting

Quantitative (Technical) Analysis
• Quantitative (Technical) Analysis in Economics involves studying detailed micro-economic models which process vast quantities of Market Data (commodity price data sets). This method utilises a form of historic data analysis technique which smoothes or profiles market trends into more predictable short-term price curves - which will vary over time within a specific market.
• Quantitative (Technical) Analysts can initiate specific market responses when prices reach support and resistance levels – via manual information feeds to human Traders or by tripping buying or selling triggers where autonomous Computer Trading is deployed. Technical Analysis is data-driven (experiential), not model-driven (empirical) because our current economic models do not support the observed market data. The key to both approaches, however, is in identifying, analysing, and anticipating subtle changes in the average direction of movement for Price Curves – which in turn reflect relatively short-term Market Trends.

Qualitative and Quantitative Methods
• The design of a research study begins with the selection of a topic and a paradigm. A
paradigm is essentially a worldview, a whole framework of beliefs, values and methods
within which research takes place. It is this world view within which researchers work.
• According to Cresswell (1994) "A qualitative study is defined as an inquiry process of
understanding a social or human problem, based on building a complex, holistic picture,
formed with words, reporting detailed views of informants, and conducted in a natural setting.
• Alternatively a quantitative study, consistent with the quantitative paradigm, is an inquiry into
a social or human problem, based on testing a theory composed of variables, measured with
numbers, and analyzed with statistical procedures, in order to determine whether the
predictive generalizations of the theory hold true.“
• The paradigm framework is made up of: -
– Philosophy
– Paradigms
– Ontology
– Epistemology
– Methodology
• (Source: University of Sheffield)

Qualitative and Quantitative Paradigms
• Qualitative and quantitative Paradigms are rooted in philosophical and scientific traditions with different epistemological and ontological assumptions.
• Philosophy - Fundamental principles about the nature of knowledge and existence which are derived from a shared world view or common belief system that belong to a readily identified philosophical or scientific school or community.
• Paradigms - Collections or sets of frameworks, models, methods, techniques which provide guidelines to a group of researchers within that community as to how they should act with regard to organising the research study or inquiry
• Ontology - concerns the philosophy of existence and the assumptions and beliefs that we hold about the nature of knowledge, being and existence.
• Epistemology - is the theory of knowledge and the assumptions and beliefs that we have about the nature of knowledge. How do we know and understand the world? What is the relationship between the inquirer and the known?
• Methodology - how we gain knowledge about the world or "an articulated, theoretically informed approach to the production of data" (Ellen, 1984, p. 9).

Qualitative and Quantitative Methods
Key Distinctions between Qualitative and Quantitative Research
• A summary of the Quantitative POEM (Scientific, Empiric) philosophy might be: -
– Philosophy – Scientific Empiricism
– Paradigms – Theories / Hypotheses, Mathematical Frameworks / Structures / Equations
– Ontology – Laws of nature
– Epistemology – Measurable “evidence” and observable “proof”
– Methodology – Experiment, large scale data collection, quantitative analysis
• A summary of the Qualitative POEM (Humanistic / Post Modern / Narrative) philosophy might be summarized as follows: -
– Philosophy – Humanistic / Post Modern / Narrative
– Paradigms – Homocentric reality as a social construct, contextual verities
– Ontology – The nature of the psyche, of perception, creativity, intelligence
– Epistemology – Self-verified evidence, grounded theory, recorded testimony
– Methodology – Phenomenology, ethnography, in-depth interviews

Qualitative and Quantitative Methods
1. Words and numbers
• Qualitative (Narrative) Analysis research projects place emphasis on material
understanding through looking closely at people's words, actions and records.
The traditional scientific approach to research (quantifies) the results (collected
data) from these observations. The scientific or Quantitative (Technical)
Analysis approach to research is to look past these words, actions and records
– fundamentally towards the data and its intrinsic mathematical significance.
2. Proof versus Discovery
• The traditional scientific or Quantitative (Technical) Analysis research projects
approach is to discover data relationships (cycles, patterns and trends) to either
Prove (or Disprove.....) a Hypothesis. The goal of a Qualitative (Narrative)
Analysis research projects is to discover data affinities (clusters or patterns) in
the Data which emerge after close observation, thoughtful analysis and careful
documentation of the research content. Qualitative (Narrative) Analysis
discovers contextual findings - not sweeping generalizations. This process of
discovery is basic to the philosophical underpinning of the qualitative approach.

Qualitative and Quantitative Methods
3. Content Analysis - Patterns in the Data versus Meaningful views
• Quantitative (Technical) Analysis research projects examine the patterns
which emerge from the data and to present those patterns for others to inspect.
The task of the Qualitative (Narrative) researcher is to find meanings within the
context of those words (and actions) – which are often presented in the subjects
or participants' own words - whilst at the same time staying as close possible to
the construction of the world as the subjects and participants originally provided.
4. Deterministic (Subjective) versus Probabilistic (Objective) views
• Qualitative (Narrative) research projects may be outcome-driven – that is, to
start out with some fixed ideas or deterministic viewpoint of the desired broad
outcomes, goals and objectives of the Project In contrast Quantitative
(Technical) research projects are data-driven – using Analytic techniques to
look for and discover patterns and trends which might emerge from the data –
often presented as Clusters in the Data. The role of the Quantitative researcher,
therefore, is to discover hidden or unseen Patterns and Trends within large
datasets and to present them for others to inspect, analyse, verify and validate.

Qualitative and Quantitative Methods
Definitions of Qualitative Research
Denzin and Lincoln (1994) define qualitative research:
• Qualitative research is multi-method in focus, involving an interpretive,
naturalistic approach to its subject matter. This means that qualitative
researchers study things in their natural settings, attempting to make sense
of or interpret phenomena in terms of the meanings people bring to them.
Qualitative research involves the studied use and collection of a variety of
empirical materials case study, personal experience, introspective, life story
interview, observational, historical, interactional, and visual texts-that
describe routine and problematic moments and meaning in individuals' lives.
Cresswell (1994) defines it as:
• Qualitative research is an inquiry process of understanding based on distinct
methodological traditions of inquiry that explore a social or human problem.
The researcher builds a complex, holistic picture, analyzes words, reports
detailed views of informants, and conducts the study in a natural setting.

Qualitative Methods
Characteristics of Qualitative Research
• An exploratory and Descriptive or Narrative focus
• Emergent Design
• Data Collection in the natural setting
• Emphasis on ‘human-as-instrument’
• Qualitative methods of data collection
• Early and On-going inductive analysis
Cresswell (1994) divides Qualitative Research into five main Qualitative Research Types and identifies the key challenges of each mode of inquiry: -
• The Biography
• Phenomenology
• Grounded Theory
• Ethnography
• Case Study

Qualitative Methods
Challenges of Biography
• The researcher needs to collect extensive information from and about the subject
of the biography.
• The investigator needs to have a clear understanding of historical, contextual
material to position the subject within the larger trends in society or in the culture.
• It takes a keen eye to determine the particular stories, slant, or angle that "works"
in writing a biography and to uncover the "figure under the carpet" (Edel, 1984) that
explains the multilayered context of a life.
• The writer, using an interpretive approach, needs to be able to bring himself or
herself into the narrative.
• A phenomenological study may be challenging to use \because: -
– The researcher requires a solid grounding in the philosophical precepts of
phenomenology.
– The participants in the study need to be carefully chosen to be individuals who
have experienced the phenomenon
• Bracketing personal experiences by the researcher may be difficult: -
– The researcher needs to decide how and in what way his or her personal
experiences will be introduced into the study.

Qualitative Methods
• A grounded Theory Study challenges researchers for the following reasons: -
– The investigator needs to set aside, as much as possible, theoretical ideas
or notions so that the analytic, substantive theory can emerge.
– Despite the evolving, inductive nature of this form of qualitative inquiry, the
researcher must recognize that this is a systematic approach to research
with specific steps in data analysis.
– The researcher faces the difficulty of determining when categories are
saturated or when the theory is sufficiently detailed.
• The researcher needs to recognize that the primary outcome of this study is a
theory with specific components: a central phenomenon, causal conditions,
strategies, conditions and context, and consequences. These are prescribed
categories of information in the theory.
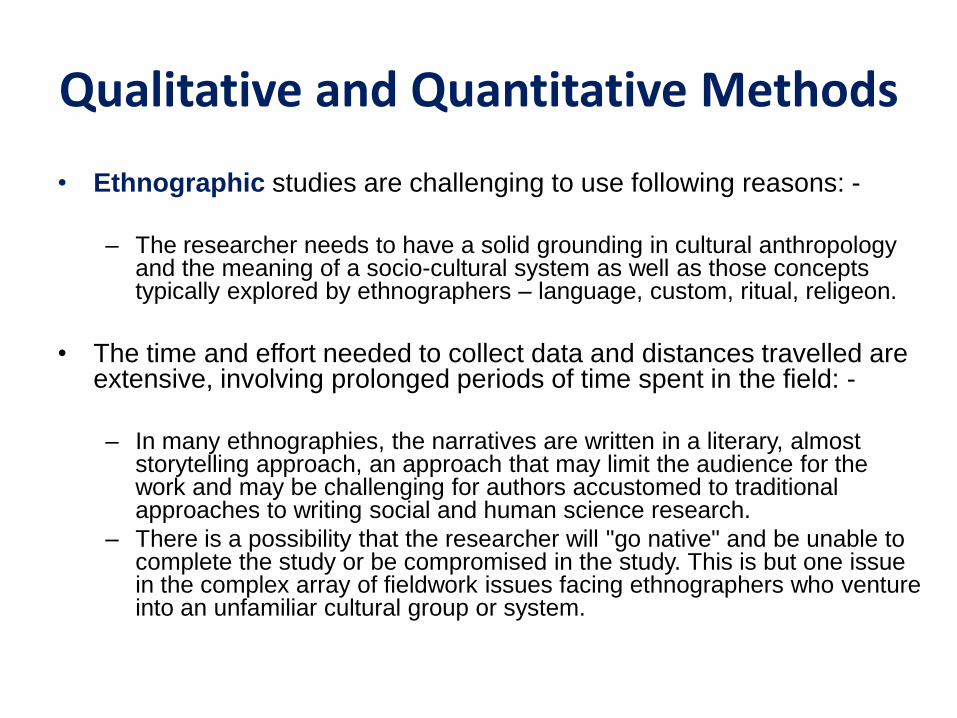
Qualitative and Quantitative Methods
• Ethnographic studies are challenging to use following reasons: -
– The researcher needs to have a solid grounding in cultural anthropology
and the meaning of a socio-cultural system as well as those concepts typically explored by ethnographers – language, custom, ritual, religeon.
• The time and effort needed to collect data and distances travelled are extensive, involving prolonged periods of time spent in the field: -
– In many ethnographies, the narratives are written in a literary, almost
storytelling approach, an approach that may limit the audience for the work and may be challenging for authors accustomed to traditional approaches to writing social and human science research.
– There is a possibility that the researcher will "go native" and be unable to complete the study or be compromised in the study. This is but one issue in the complex array of fieldwork issues facing ethnographers who venture into an unfamiliar cultural group or system.
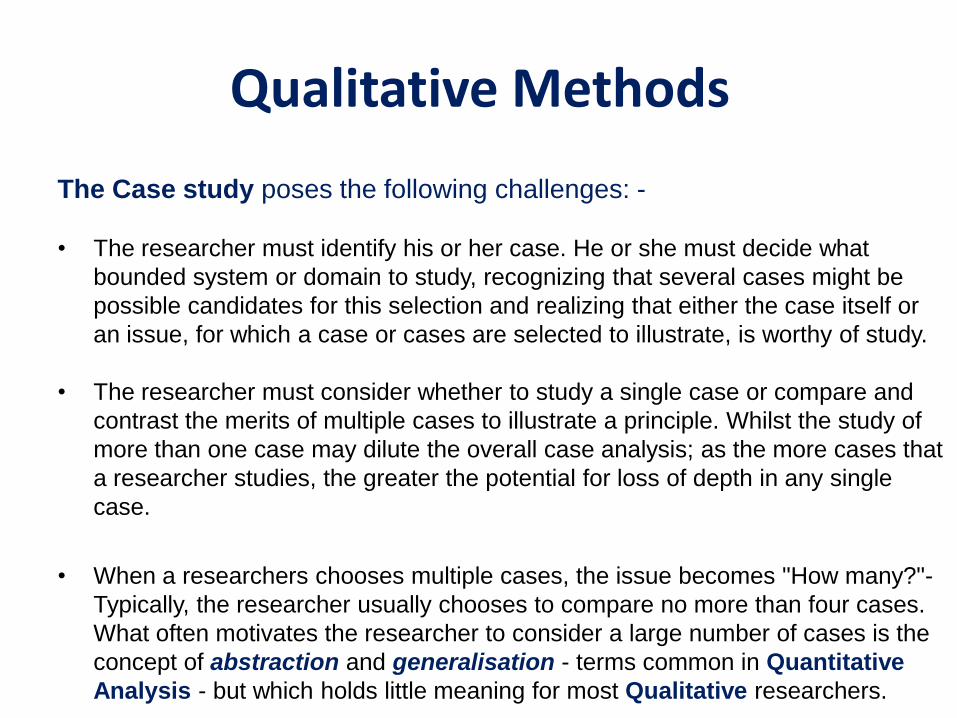
Qualitative Methods
The Case study poses the following challenges: -
• The researcher must identify his or her case. He or she must decide what
bounded system or domain to study, recognizing that several cases might be
possible candidates for this selection and realizing that either the case itself or
an issue, for which a case or cases are selected to illustrate, is worthy of study.
• The researcher must consider whether to study a single case or compare and
contrast the merits of multiple cases to illustrate a principle. Whilst the study of
more than one case may dilute the overall case analysis; as the more cases that
a researcher studies, the greater the potential for loss of depth in any single
case.
• When a researchers chooses multiple cases, the issue becomes "How many?"-
Typically, the researcher usually chooses to compare no more than four cases.
What often motivates the researcher to consider a large number of cases is the
concept of abstraction and generalisation - terms common in Quantitative
Analysis - but which holds little meaning for most Qualitative researchers.

Qualitative Methods
Qualitative Methods of Data Collection
• People’s words and actions represent the data of qualitative inquiry and this
requires methods that allow the researcher to capture language and
behaviour. The key ways of capturing these are: -
– The collection of relevant documents and other sources
– Observation – both participant and direct
– Audio Recordings
– Video Recordings
– Photographs
– Structured Interviews – one-to-one
– Group Interviews - Workshops

Qualitative Methods - the Interview
The Interview
• The interview is one of the major sources of data collection, and it is also one of
the most difficult ones to get right. In qualitative research the interview is a form of
discourse. According to Mischler (1986) its particular features reflect the
distinctive structure and aims of interviewing, namely, that it is discourse shaped
and organized by asking and answering questions. An interview is a joint
product of what interviewees and interviewers talk about together and how they
talk with each other. The record of an interview that we researchers make and
then use in our work of analysis and interpretation is a representation of that talk.
Interview Probes
• One of the key techniques in good interviewing is the use of investigative probes.
Patton (1990) identifies several types of interview probes:
– detail-oriented probes
– elaboration probes
– clarification probes
– confirmation probes

Qualitative Methods - the Interview
1. Detail-oriented probes. In our natural conversations we ask each other questions to get more
detail. These types of follow-up questions are designed to fill out the picture of whatever it is
we are trying to understand. We easily ask these questions when we are genuinely curious: -
– Who was with you?
– What was it like being there
– Where did you go then?
– When did this happen in your life?
– How are you going to try to deal with the situation?
2. Elaboration probes. Another type of probe is designed to encourage the interviewee to tell us
more. We indicate our desire to know more by such things as gently nodding our head as the
person talks, softly voicing 'un-huh' every so often, and sometimes by just remaining silent but
attentive. We can also ask for the interviewee to simply continue talking: -
– Tell me more about that.
– Can you give me an example of what you are talking about?
– I think I understand what you mean.
– Talk more about that, will you?
– I'd like to hear you talk more about that.

Qualitative Methods - the Interview
3. Clarification probes. There are likely to be times in an interview when the interviewer is unsure of
what the interviewee is talking about, what she or he means. In these situations the interviewer can
gently ask for clarification, making sure to communicate that it is the interviewer's difficulty in
understanding and not the fault of the interviewee.
– I'm not sure I understand what you mean by 'hanging out'. Can you help me understand what that
means?
– I'm having trouble understanding the problem you've described. Can you talk a little more about
that?
– I want to make sure I understand what you mean. Would you describe it for me again?
– I'm sorry. I don't quite get. Tell me again, would you?
4. Confirmation probes. There are also likely to be times in an interview when the interviewer has
conflicting information. either from the same interviewee – or between different interviewees. In these
situations the interviewer can seek confirmation - by asking the same question in a different way, .
– Repeating the same question at different times in the interview ?
– Re-phrasing the same question in different ways ?
– Cross-referencing the interviewee about his / her previous responses or information given by
others ?
– Challenging he interviewee about his / her previous responses or information given by others ?
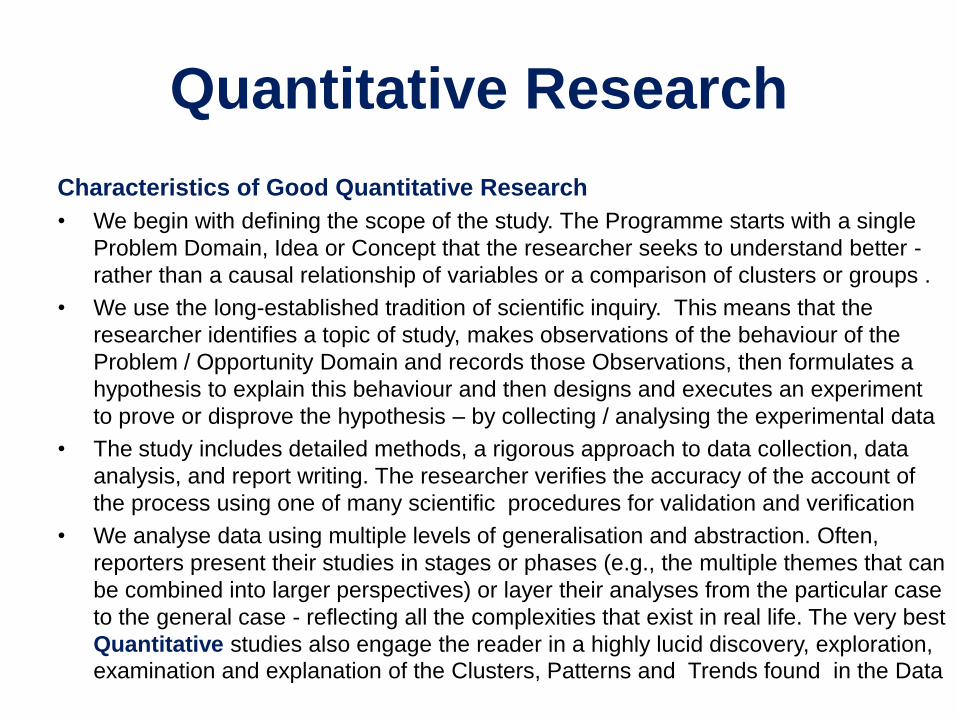
Quantitative Research
Characteristics of Good Quantitative Research
• We begin with defining the scope of the study. The Programme starts with a single
Problem Domain, Idea or Concept that the researcher seeks to understand better -
rather than a causal relationship of variables or a comparison of clusters or groups .
• We use the long-established tradition of scientific inquiry. This means that the
researcher identifies a topic of study, makes observations of the behaviour of the
Problem / Opportunity Domain and records those Observations, then formulates a
hypothesis to explain this behaviour and then designs and executes an experiment
to prove or disprove the hypothesis – by collecting / analysing the experimental data
• The study includes detailed methods, a rigorous approach to data collection, data
analysis, and report writing. The researcher verifies the accuracy of the account of
the process using one of many scientific procedures for validation and verification
• We analyse data using multiple levels of generalisation and abstraction. Often,
reporters present their studies in stages or phases (e.g., the multiple themes that can
be combined into larger perspectives) or layer their analyses from the particular case
to the general case - reflecting all the complexities that exist in real life. The very best
Quantitative studies also engage the reader in a highly lucid discovery, exploration, examination and explanation of the Clusters, Patterns and Trends found in the Data

Qualitative Research
Characteristics of Good Qualitative Research
• We begin with a single focus. The project begins by examining a primary Problem
Domain, Idea or Concept that the researcher seeks to validate, clarify or understand
better - rather than a causal relationship of variables or a comparison of groups .
• Although relationships between variables or or comparisons between groups might
evolve - these emerge later in the study after we have fully scoped (defined) and
documented (described) a single Problem / Opportunity Domain, Idea or Concept
• We use the long-established tradition of narrative inquiry, research and analysis.
This means that the researcher identifies, selects and deploys one or more of the
mainstream Qualitative Research and Analysis frameworks and sets of methods
• The study includes detailed methods, a rigorous approach to data collection, data
analysis, and report writing. This means that the researcher audits the accuracy of
the account using one or more of the many procedures for validation and verification.
• We write persuasively so that the reader experiences participation in the study
"being there.....“. Often, writers present their studies in steps or stages – reflecting
real life complexities (e.g., multiple themes that can be combined into larger stories,
epics and narratives) or layer their analysis from the specific to the general case.
• The very best Qualitative studies engage the reader in a lucid discovery, exploration, examination and explanation of the Themes, Stories and Epics found in the Data
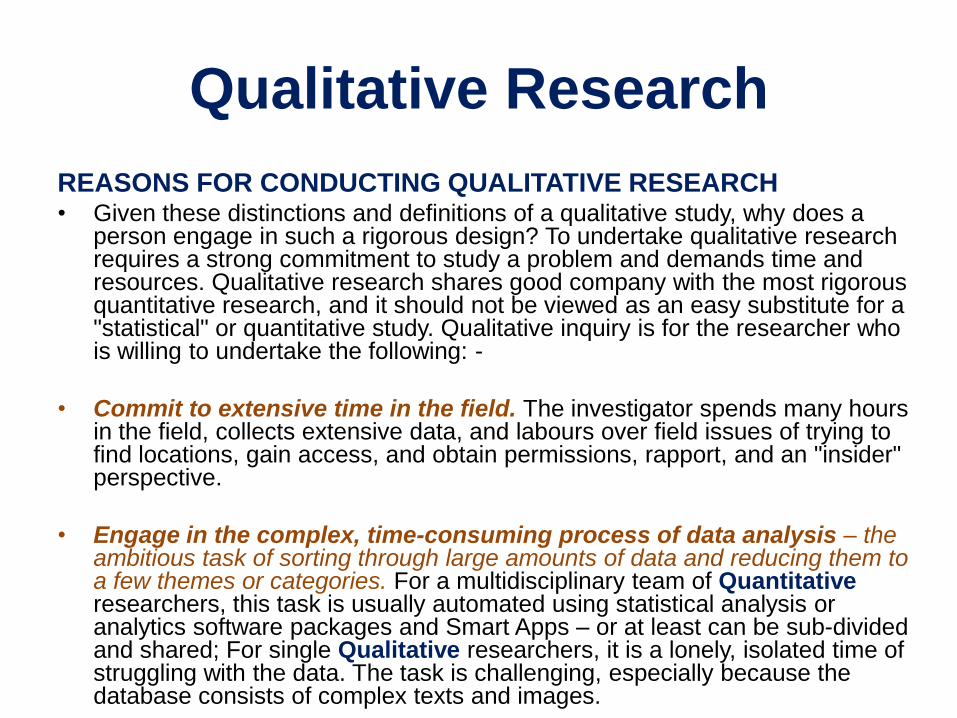
Qualitative Research
REASONS FOR CONDUCTING QUALITATIVE RESEARCH • Given these distinctions and definitions of a qualitative study, why does a
person engage in such a rigorous design? To undertake qualitative research requires a strong commitment to study a problem and demands time and resources. Qualitative research shares good company with the most rigorous quantitative research, and it should not be viewed as an easy substitute for a "statistical" or quantitative study. Qualitative inquiry is for the researcher who is willing to undertake the following: -
• Commit to extensive time in the field. The investigator spends many hours in the field, collects extensive data, and labours over field issues of trying to find locations, gain access, and obtain permissions, rapport, and an "insider" perspective.
• Engage in the complex, time-consuming process of data analysis – the ambitious task of sorting through large amounts of data and reducing them to a few themes or categories. For a multidisciplinary team of Quantitative researchers, this task is usually automated using statistical analysis or analytics software packages and Smart Apps – or at least can be sub-divided and shared; For single Qualitative researchers, it is a lonely, isolated time of struggling with the data. The task is challenging, especially because the database consists of complex texts and images.
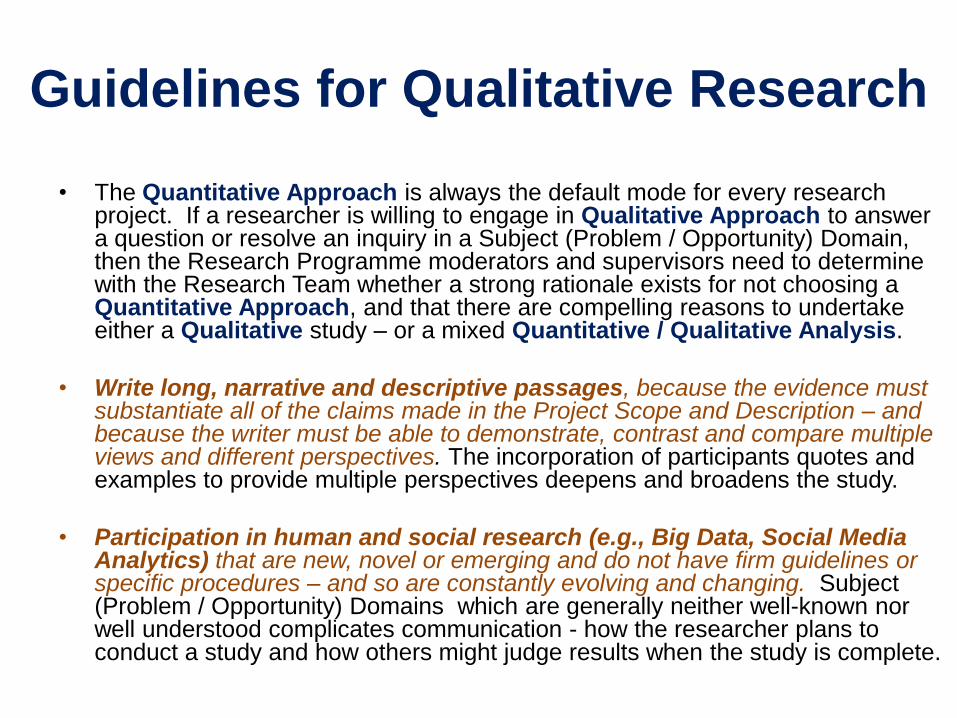
Guidelines for Qualitative Research
• The Quantitative Approach is always the default mode for every research project. If a researcher is willing to engage in Qualitative Approach to answer a question or resolve an inquiry in a Subject (Problem / Opportunity) Domain, then the Research Programme moderators and supervisors need to determine with the Research Team whether a strong rationale exists for not choosing a Quantitative Approach, and that there are compelling reasons to undertake either a Qualitative study – or a mixed Quantitative / Qualitative Analysis.
• Write long, narrative and descriptive passages, because the evidence must substantiate all of the claims made in the Project Scope and Description – and because the writer must be able to demonstrate, contrast and compare multiple views and different perspectives. The incorporation of participants quotes and examples to provide multiple perspectives deepens and broadens the study.
• Participation in human and social research (e.g., Big Data, Social Media Analytics) that are new, novel or emerging and do not have firm guidelines or specific procedures – and so are constantly evolving and changing. Subject (Problem / Opportunity) Domains which are generally neither well-known nor well understood complicates communication - how the researcher plans to conduct a study and how others might judge results when the study is complete.

Guidelines for Qualitative Research
GUIDLINES FOR CONDUCTING QUALITATIVE RESEARCH
• Write long, descriptive narrative passages to show how where the evidence
substantiates claims, and the writer needs to demonstrate multiple perspectives.
The study is expanded by incorporation of examples, illustrations and quotes to
provide evidence in support (or to challenge.....) multiple views / perspectives.
• Participate in a form of social and human science research that does not have
firm guidelines or specific procedures and is evolving and changing constantly.
This complicates communicating how the researcher plans to conduct a study
and how moderators and supervisors might judge the study when it is complete.
• If a researcher is willing to engage in qualitative inquiry, then the supervisor
needs to determine whether a strong rationale exists for choosing a qualitative
approach and that there are compelling reasons to undertake a qualitative study.
In this respect Cresswell (1994) offers the following advice:
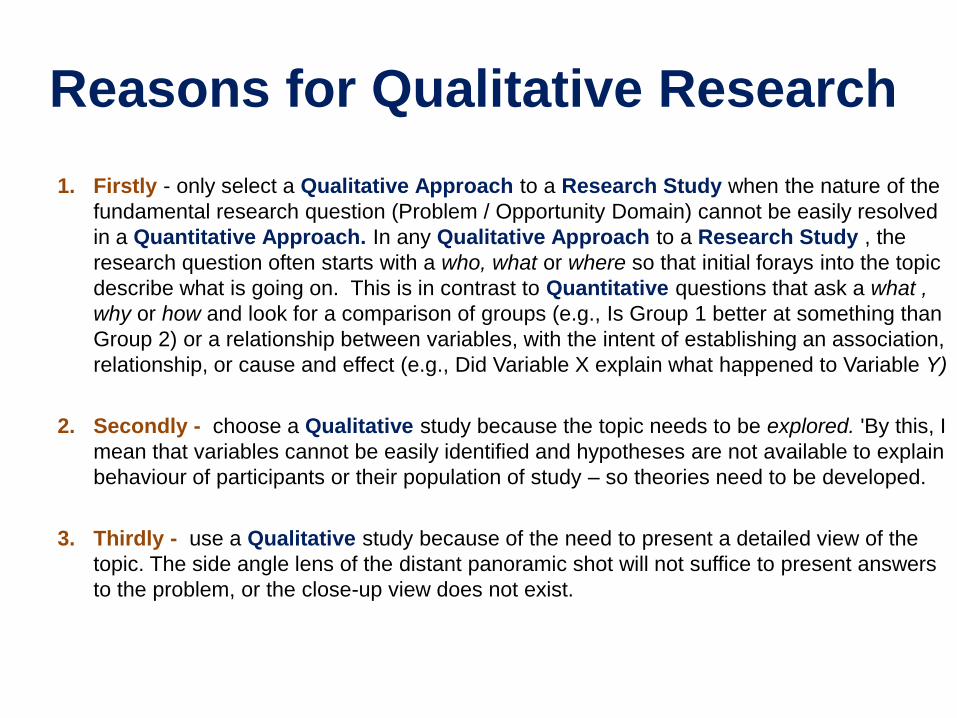
Reasons for Qualitative Research
1. Firstly - only select a Qualitative Approach to a Research Study when the nature of the
fundamental research question (Problem / Opportunity Domain) cannot be easily resolved
in a Quantitative Approach. In any Qualitative Approach to a Research Study , the
research question often starts with a who, what or where so that initial forays into the topic
describe what is going on. This is in contrast to Quantitative questions that ask a what ,
why or how and look for a comparison of groups (e.g., Is Group 1 better at something than
Group 2) or a relationship between variables, with the intent of establishing an association,
relationship, or cause and effect (e.g., Did Variable X explain what happened to Variable Y)
2. Secondly - choose a Qualitative study because the topic needs to be explored. 'By this, I
mean that variables cannot be easily identified and hypotheses are not available to explain
behaviour of participants or their population of study – so theories need to be developed.
3. Thirdly - use a Qualitative study because of the need to present a detailed view of the
topic. The side angle lens of the distant panoramic shot will not suffice to present answers
to the problem, or the close-up view does not exist.

Reasons for Qualitative Research
4. Fourthly - choose a Qualitative approach in order to study individuals in their natural
setting. This involves going out to the setting or field of study, gaining access, and
gathering material. If participants are removed from their setting, it leads to contrived
findings that are out of context.
5. Fifth - select a Qualitative approach because of interest in writing in a literary style; the
writer brings himself or herself into the study, the personal pronoun "I" is used, or perhaps
the writer engages a storytelling form of narration.
6. Sixth - employ a Qualitative study because of sufficient time and resources to spend on
extensive data collection in the field and detailed data analysis of "text" information.
7. Seventh - select a Qualitative approach because audiences are receptive to qualitative
research. This audience might be a graduate adviser or committee, a discipline inclusive of
multiple research methodologies, or publication outlets with editors receptive to qualitative
approaches.

Reasons for Qualitative Research
8. Eighth, employ a Qualitative approach to emphasize the researcher's role as
an active learner who can tell the story from the participants' view rather than as an
"expert" who passes judgment on subjects and other participants.
The Sculptor Michelangelo was once asked: -
"How do you create an object of such beauty from a rough piece of stone ?"
His Reply was: -
"I take a block of Marble - and remove everything that is unnecessary....."
9. Ninth, and finally, as it is with Sculpture - so it is with Editing Research Findings. We
should employ a Qualitative approach to Authoring in order to optimise the Writing-
up Process – particularly the ability to Edit and Structure Raw Text from a "Stream of
Data” into clean, crisp, simple, tight and elegant, incisive and intuitive blocks or units
of Text describing Research Scope, Objective, the nature of the Problem, the Method
used, the Findings and Conclusions – carefully choosing structure and content and
crafting it into clear and lucid Chapters, sections, paragraphs and sentences…..

Future Management Methods and Techniques
Throughout eternity, all that is of like form comes around
again – everything that is the same must return again in
its own everlasting cycle.....
• Marcus Aurelius – Emperor of Rome •
Summary
Futures Research Philosophies and Investigative Methods
Qualitative and Quantitative Investigative Methods
Qualitative Methods: –
tend to be deterministic, interpretive and subjective in nature.
Quantitative Methods: –
tend to be probabilistic, analytic and objective in nature.....

Qualitative and Quantitative Methods
Research Study Roles and Responsibilities
• Supervisor – authorises and directs the Futures Research Study.
• Project Manager – plans and leads the Futures Research Study.
• Moderator – reviews and mentors the Futures Research Study.
• Researcher – undertakes the detailed Futures Research Tasks.
• Research Aggregator – examines hundreds of related Research
papers - looking for hidden or missed Findings and Extrapolations.
• Author – compiles, documents and edits the Research Findings.


Qualitative and Quantitative Methods
Qualitative and Quantitative Methods
Qualitative Methods - tend to be deterministic, interpretive and subjective in nature. • When we wish to design a research project to investigate large volumes of unstructured data
producing and analysing graphical image and text data sets with a very large sample or set of information – “Big Data” – then the quantitative method is preferred. As soon as subjectivity - what people think or feel about the world - enters into the scope (e.g. discovering Market Sentiment via Social Media postings), then the adoption of a qualitative research method is vital. If your aim is to understand and interpret people’s subjective experience and the broad range of meanings that attach to it, then interviewing, observation and surveying a range of non-numerical data (which may be textual, visual, aural) are key strategies you will consider. Research approaches such as using focus groups, producing case studies, undertaking narrative or content analysis, participant observation and ethnographic research are all important qualitative methods. You will also want to understand the relationship of qualitative data to numerical research. Any qualitative methods pose their own problems with ensuring the research produces valid and reliable results (see also: Analytics - Working with “Big Data”).
Quantitative Methods - tend to be probabilistic, analytic and objective in nature. • When we want to design a research project to tests a hypothesis objectively by capturing and
analysing numerical data sets with a large sample or set of information – then the quantitative method is preferred. There are many key issues to consider when you are designing an experiment or other research project using quantitative methods, such as randomisation and sampling. Also, quantitative research uses mathematical and statistical means extensively to produce reliable analysis of its results (see also: Cluster Analysis and Wave-form methods).

Futures Research Philosophies
and Investigative Methods • This section aims to discuss Research Philosophies in detail, in order to develop a
general awareness and understanding of the options - and to describe a rigorous
approach to Research Methods and Scope as a mandatory precursor to the full
Research Design. Denzin and Lincoln (2003) and Kvale (1996) highlight how
different Research Philosophies can result in much tension amongst stakeholders.
• When undertaking any research of either a Scientific or Humanistic nature, it is most
important to consider, compare and contrast all of the varied and diverse Research
Philosophies and Paradigms available to the researcher and supervisor - along with
their respective treatment of ontology and epistemology issues.
• Since Research Philosophies and paradigms often describe dogma, perceptions,
beliefs and assumptions about the nature of reality and truth (and knowledge of that
reality) - they can radically influence the way in which the research is undertaken,
from design through to outcomes and conclusions. It is important to understand and
discuss these contrasting aspects in order that approaches congruent to the nature
and aims of the particular study or inquiry in question, are adopted - and to ensure
that researcher and supervisor biases are understood, exposed, and mitigated.

Futures Research Methods
• When undertaking any research of either a Scientific or Humanistic nature, it is most important for the researcher and supervisor to consider, compare and contrast all of the varied and diverse Research Philosophies and Paradigms, Data Analysis Methods and Techniques available - along with the express implications of their treatment of ontology and epistemology issues....,

Weak Signals and Wild Cards
• “Wild Card” or "Black Swan" manifestations are extreme and unexpected events which have a very low probability of occurrence, but an inordinately high impact when they do happen Trend-making and Trend-breaking agents or catalysts of change may predicate, influence or cause wild card events which are very hard - or even impossible - to anticipate, forecast or predict.
• In any chaotic, fast-evolving and highly complex global environment, as is currently developing and unfolding across the world today, the possibility of any such "Wild Card” or "Black Swan" events arising may, nevertheless, be suspected - or even expected. "Weak Signals" are subliminal indicators or signs which may be detected amongst the background noise - that in turn point us towards any "Wild Card” or "Black Swan" random, chaotic, disruptive and / or catastrophic events which may be on the horizon, or just beyond......
• Back-casting and Back-sight: - In any post-apocalyptic Black Swan Event Scenario, we can use Causal Layer Analysis (CLA) techniques in order to analyse and review our Risk Management Strategies to identify those Weak Signals which may have predicted, suggested, pointed towards or indicated subsequent Wild Cards or Black Swan Events – in order to discover changes and improvements to strengthen and improve Enterprise Risk Management Frameworks.
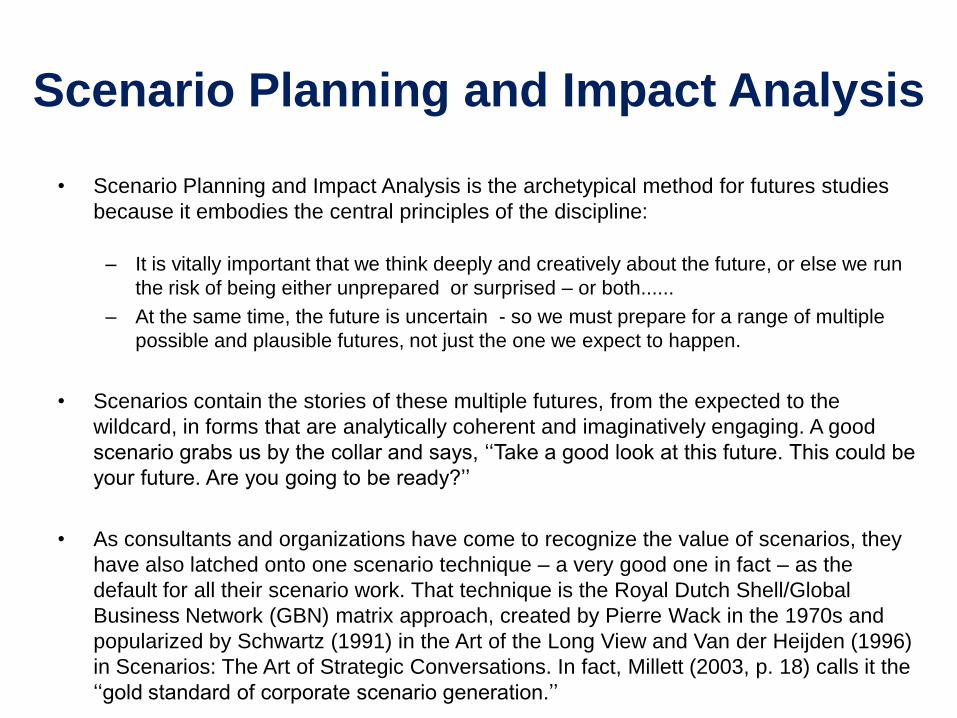
Scenario Planning and Impact Analysis
• Scenario Planning and Impact Analysis is the archetypical method for futures studies
because it embodies the central principles of the discipline:
– It is vitally important that we think deeply and creatively about the future, or else we run
the risk of being either unprepared or surprised – or both......
– At the same time, the future is uncertain - so we must prepare for a range of multiple
possible and plausible futures, not just the one we expect to happen.
• Scenarios contain the stories of these multiple futures, from the expected to the
wildcard, in forms that are analytically coherent and imaginatively engaging. A good
scenario grabs us by the collar and says, ‘‘Take a good look at this future. This could be
your future. Are you going to be ready?’’
• As consultants and organizations have come to recognize the value of scenarios, they
have also latched onto one scenario technique – a very good one in fact – as the
default for all their scenario work. That technique is the Royal Dutch Shell/Global
Business Network (GBN) matrix approach, created by Pierre Wack in the 1970s and
popularized by Schwartz (1991) in the Art of the Long View and Van der Heijden (1996)
in Scenarios: The Art of Strategic Conversations. In fact, Millett (2003, p. 18) calls it the
‘‘gold standard of corporate scenario generation.’’
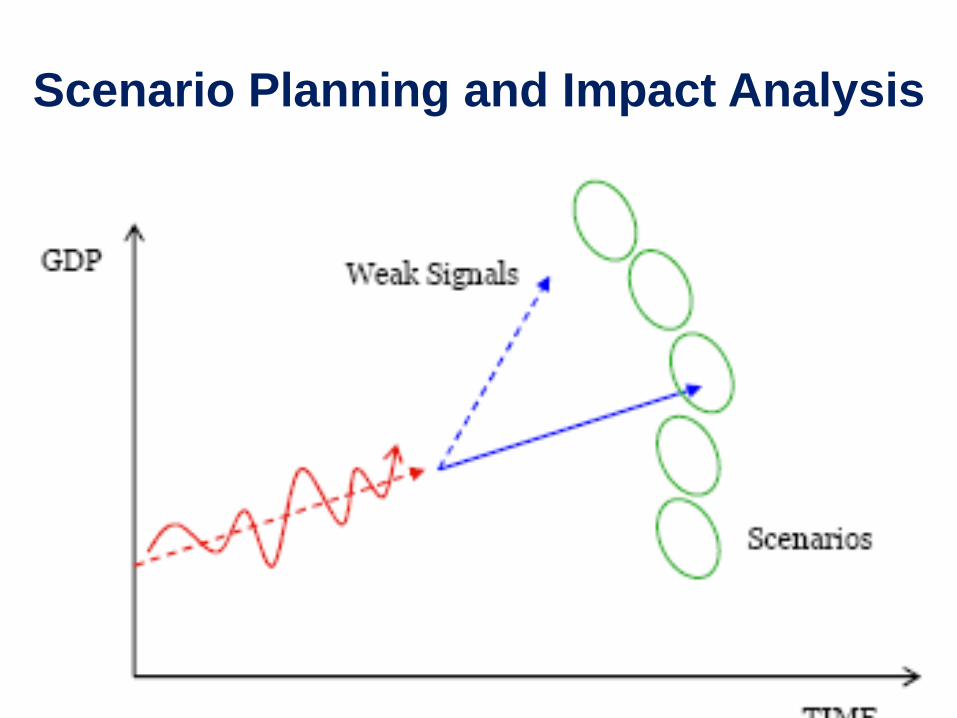
Scenario Planning and Impact Analysis
Outsights "21 Drivers for the 21st Century"
• Scenarios are specially constructed stories about the future - each one portraying
a distinct, challenging and plausible world in which we might one day live and work - and for which we need to anticipate, plan and prepare.
• The Outsights Technique emphasises collaborative scenario building with internal clients and stakeholders. Embedding a new way of thinking about the future in the organisation is essential if full value is to be achieved – a fundamental principle of the “enabling, not dictating” approach
• The Outsights Technique promotes the development and execution of purposeful action plans so that the valuable learning experience from “outside-in” scenario planning enables building profitable business change.
• The Outsights Technique develops scenarios at the geographical level; at the business segment, unit and product level, and for specific threats, risks and challenges facing organisations. Scenarios add value to organisations in many ways: - future management, business strategy, managing change, managing risk and communicating strategy initiatives throughout an organisation.

Outsights "21 Drivers for the 21st Century"
1. War, terrorism and insecurity 2. Layers of power 3. Economic and financial stability 4. BRICs and emerging powers • Brazil • Russia • India • China
5. The Five Flows of Globalisation • Ideas • Goods • People • Capital • Services
6. Intellectual Property and Knowledge 7. Health, Wealth and Wellbeing 8. Transhumanism – Geo-demographics,
Ethnographics and Social Anthropology 9. Population Drift, Migration and Mobility 10. Market Sentiment, Trust and Reputation 11. Human Morals, Ethics, Values and Beliefs
12. History, Culture, Religion and Human Identity 13. Consumerism and the rise of the Middle Classes 14. Social Media, Networks and Connectivity 15. Space - the final frontier
• The Cosmology Revolution - String Theory
16. Science and Technology Futures • The Nano Revolution • The Quantum Revolution • The Information Revolution • The Bio-Technology Revolution • The Energy Revolution • Oil Shale Fracking • • Kerogen • Tar Sands • Methane Hydrate • • The Hydrogen Economy • Nuclear Fusion •
17. Science and Society – the Social Impact of Disruptive Technology and Convergence
18. Natural Resources – availability, scarcity and control – Food, Energy and Water (FEW) crisis
19. Climate Change • Global Massive Change – the Climate Revolution
20. Environmental Degradation & Mass Extinction 21. Urbanisation and the Smart Cities of the Future

At the very Periphery of Corporate Vision and Awareness…..
• The Cosmology Revolution – new and exciting advances in Astrophysics and Cosmology (String Theory and star clustering) is leading Physicists towards new questions and answers concerning the make-up of stellar clusters and galaxies, stellar populations in different types of galaxy, and the relationships between high-stellar populations and local clusters. What are the implications for galactic star-formation histories and relative stellar formation times – overall, resolved and unresolved – and their consequent impact on the evolution of life itself ?.
• The Quantum Revolution – The quantum revolution could turn many ideas of science fiction into science fact - from meta-materials with mind-boggling properties such as invisibility, limitless quantum energy via room temperature superconductors an onwards and upwards to Arthur C Clarke's space elevator. Some scientists even forecast that in the latter half of the century everybody will have a personal fabricator that re-arranges molecules to produce everything from almost anything. How ultimately will we use this gift? Will we have the wisdom to match our mastery of matter like Solomon? Or will we abuse our technology strength and finally bring down the temple around our ears like Samson?
• The Nano-Revolution – Autonomous Fabrication and Construction micro-robots (and also De-Fabrication and De-construction micro-robots) built using novel and exciting nanotechnology meta-materials with strange properties - will roam freely across our Cities creating and maintaining the Built Environment of the Future.

At the very Periphery of Corporate Vision and Awareness…..
• The Energy Revolution • Oil Shale • Kerogen • Tar Sands • Methane Hydrate • The
Hydrogen Economy • Nuclear Fusion • Every year we consume the quantity of Fossil
Fuel energy which took nature 3 million tears to create. Unsustainable fossil fuel energy
dependency based on Carbon will eventually be replaced by the Hydrogen Economy
and Nuclear Fusion. The conquest of hydrogen technology, the science required to
support a Hydrogen Economy (to free up humanity from energy dependency) and
Nuclear Fusion (to free up explorers from gravity dependency) is the final frontier which,
when crossed, will enable inter-stellar voyages of exploitation across our Galaxy.
• Nuclear Fusion requires the creation and sustained maintenance of the enormous
pressures and temperatures to be found at the Sun’s core This is a most challenging
technology that scientists here on Earth are only now just beginning to explore and
evaluate its extraordinary opportunities. To initiate Nuclear Fusion requires creating the
same conditions right here on Earth that are found the very centre of the Sun. This
means replicating the environment needed to support quantum nuclear processes which
take place at huger temperatures and immense pressures in the Solar core – conditions
extreme enough to overcome the immense nuclear forces which resist the collision and
fusion of two deuterium atoms (heavy hydrogen – one proton and one neutron) to form a
single Helium atom – accompanied by the release of a vast amount of Nuclear energy.

At the very Periphery of Corporate Vision and Awareness…..
• Renewable Resources • Solar Power • Tidal Power • Hydro-electricity • Wind Power • The Hydrogen Economy • Nuclear Fusion • Any natural resource is a renewable resource if it is replenished by natural processes at a rate compatible with or faster than its rate of consumption by human activity or other natural uses or attrition. Some renewable resources - solar radiation, tides, hydroelectricity, wind – can also classified as perpetual resources, in that they can never be consumed at a rate which is in excess of their long-term availability due to natural processes of perpetual renewal. The term renewable resource also carries the implication of prolonged or perpetual sustainability for the absorption, processing or re-cycling of waste products via natural ecological and environmental processes.
• For the purposes of Nuclear Fission, Thorium may in future replaced enriched Uranium-235. Thorium is much more abundant, far easier to mine, extract and process and far less dangerous than Uranium. Thorium is used extensively in Biomedical procedures, and its radioactive decay products are much more benign.
• Sustainability is a characteristic of a process or mechanism that can be maintained indefinitely at a certain constant level or state – without showing any long-term degradation, decline or collapse.. This concept, in its environmental usage, refers to the potential longevity of vital human ecological support systems - such as the biosphere, ecology, the environment the and man-made systems of industry, agronomy, agriculture, forestry, fisheries - and the planet's climate and natural processes and cycles upon which they all depend.

At the very Periphery of Corporate Vision and Awareness…..
• Trans-humanism – advocates the ethical use of technology to extend current human form and function - supporting the use of future science and technology to enhance the human genome capabilities and capacities in order to overcome undesirable and unnecessary aspects of the present human condition.
• The Intelligence Revolution – Artificial Intelligence will revolutionise homes, workplaces and lifestyles. Augmented Reality will create new virtual worlds – such as the interior of Volcanoes or Nuclear Reactors, the bottom of the Ocean or the surface of the Moon, Venus or Mars - so realistic they will rival the physical world. Robots with human-level intelligence may finally become a reality, and at the ultimate stage of mastery, we'll even be able to merge human capacities with machine intelligence and attributes – via the man-machine interface.
• The Biotech Revolution – Genome mapping and Genetic Engineering is now bringing doctors and scientists towards first discovery, and then understanding, control, and finally mastery of human health and wellbeing. Digital Healthcare and Genetic Medicine will allow doctors and scientists to positively manage successful patient outcomes – even over diseases previously considered fatal. Genetics and biotechnology promise a future of unprecedented health, wellbeing and longevity. DNA screening could diagnose and gene therapy prevent or cure many diseases. Thanks to laboratory-grown tissues and organs, the human body could be repaired as easily as a car, with spare parts readily available to order. Ultimately, the ageing process itself could ultimately be slowed or even halted.

At the very Periphery of Corporate Vision and Awareness…..
• Global Massive Change is an evaluation of global capacities and limitations. It includes both utopian and dystopian views of the emerging world future state, in which climate, the environment, ecology and even geology are dominated by human manipulation –
1. Human Impact is now the major factor in climate change, environmental and
ecological degradation.
2. Environmental Degradation - man now moves more rock and earth than do all of the natural geological processes
3. Ecological Degradation – biological extinction rate - is currently greater than that of the Permian-Triassic boundary (PTB) extinction event
4. Food, Energy, Water (FEW) Crisis – increasing scarcity of Natural Resource
• Society’s growth-associated impacts on its own ecological and environmental support systems, for example intensive agriculture causing exhaustion of natural resources by the Mayan and Khmer cultures, de-forestation and over-grazing causing catastrophic ecological damage and resulting in climatic change – for example, the Easter Island culture, the de-population of upland moors and highlands in Britain from the Iron Age onwards – including the Iron Age retreat from northern and southern English uplands, the Scottish Highland Clearances and replacement of subsistence crofting by deer and grouse for hunting and sheep for wool on major Scottish Highland Estates and the current sub-Saharan de-forestation and subsequent desertification by semi-nomadic pastoralists

• The global shortage of Food, Energy and Water – the FEW Crisis...
FEW Crisis

At the very Periphery of Corporate Vision and Awareness…..
• FEW - Food, Energy, Water Crisis - as scarcity of Natural Resources (FEW - Food, Energy, Water) and increased competition from a growing population o obtain those scarce resources begins to limit and then reverse population growth, global population levels will continue expansion towards an estimated 8 or 9 billion human beings by the middle of this century – and then collapse catastrophically to below 1 billion – slowly recovering and stabilising out again at a sustainable population of about 1 billion human beings by the end of the century.
• Anthropogenic Impact (Human Activity) on the natural Environment - Global Massive Change Events. In their starkest warning yet, following nearly seven years of new research on the climate, the Intergovernmental Panel on Climate Change (IPCC) said it was "unequivocal" and that even if the world begins to moderate greenhouse gas emissions, warming is likely to cross the critical threshold of 2C by the end of this century. This will have serious environmental consequences, including sea level rises, heat-waves and changes to rainfall meaning dry regions get less and already wet areas receive more.
• In the past, many complex human societies (Neanderthal, Soloutrean, Clovis, Mayan, Khmer, Easter Island) have failed, died out or just simply disappeared - often as a result of either climate change or their own growth-associated impacts on ecological and environmental support systems. Thus there is a clear precedent for modern industrial societies - which continue to grow unchecked in terms of globalisation complexity and scale, population growth and drift, urbanisation and environmental impact – societies which are ultimately unsustainable, and so in turn must also be destined for sudden and catastrophic instability, failure and collapse.

The Food Energy and Water (FEW) Crisis

History and Future of Climate and Environmental Change
Anthropogenic Impact (Human Activity) on the natural Environment
• Global Massive Change Events – many Human Activity Cycles, such as Business, Social,
Political, Economic, Historic and Pre-historic (Archaeology) Human Activity Waves - may be
compatible with, and map onto – one or more Natural Cycles. In their starkest warning yet,
following nearly seven years of new research on the climate, the Intergovernmental Panel on
Climate Change (IPCC) said it was "unequivocal" and that even if the world begins to moderate
greenhouse gas emissions, warming is likely to cross the critical threshold of 2C by the end of
this century. That would have serious consequences, including sea level rises, heat-waves and
changes to rainfall meaning dry regions get less and already wet areas receive more.
Possible Mechanisms for driving Human Activity Cycles • Cosmic Processes – ultra long-term Astronomic changes (e.g. Inter- / Intra-gallactic and solar system events)
• Geological Processes – very long-term global change e.g. Orogonies (Mountain Building), Volcanic Activity
• Biological Processes – Evolution and Carbon, Nitrogen, Oxygen and Sulphur Cycles (terra-forming effects)
• Solar Forcing – long-term periodic change in Insolation (solar radiation) due to Milankovitch Orbital Cycles
• Oceanic Forcing – ocean currents and climate systems– oscillation, temperature, salinity – Bond Cycles
• Atmospheric Forcing – rapid change in air temperature and Ice Mass / Melt-water Cycles – Heinrich Events
• Human Processes – Human Activity (agriculture, industrialisation) and impact on Global Climate / Ecosystems
• Atomic / Sub-atomic Processes – Particle Physics, Quantum Mechanics, Wave Mechanics and String Theory


History and Future of Climate and Environmental Change
Climate Change and Environmental Futures
• Increased severity and frequency of extreme weather events – El Nino and La Nina – combined with rising sea levels and natural disasters - has already begun to threaten our low-lying coastal cities (New Orleans, Brisbane, Fucoshida, Bangkok), A combination of rising sea levels, storm surges of increased intensity and duration, tsunamis and flash floods – will flood land up to 90 km into the interior from the present coast much more frequently by 2040 – drowning many major cities along with much of our most productive agricultural land – washing away homes and soil in the process. Human Population Drift and Urbanisation causes the destruction of arable land – as it is consumed by urban settlers and property speculators to build more cities.
By 2050 we may well have achieved the end of the World as we know it.....
• .....Global Massive Change is an evaluation of global capacities and limitations. It includes both utopian and dystopian views of the emerging world future state, in which climate, the environment and geology are dominated by human manipulation –
– Human Activity is the major factor in climate change environmental and ecological degradation.
– Environment – man now moves more rock and earth than do all natural geological processes.
– Ecology – global extinction rate is currently greater than that of the PTB extinction event
– Natural Resources – Food, Energy and Water (FEW) Crisis – global shortage, natural resources

History and Future of Climate and Environmental Change
• For most of human existence our ancestors have led precarious lives as scavengers, hunters, and
gatherers, and there were fewer than 10 million human beings on Earth at any one time. Today, many
of our cities have more than 10 million inhabitants each - as global human populations continue to
grow unchecked. The total global human population stands today at 7 billion - with as many as two or
three billion more people arriving on the planet by 2050.
• Human Activity Cycles - Business, Social, Political, Economic, Historic and Pre-historic (Archaeology)
Waves - may be compatible with, and map onto - one or more Natural Cycles. Current trends in
Human Population Growth are unsustainable – we are already beginning to run out of Food, Energy
and Water (FEW) – which will first limit, then reverse human population growth. Over the long term,
ecological stability and sustainability will be preserved – but at the expense of the continued,
unchecked growth of human populations. There are eight major episodic threats to Human Society,
which are “Chill”, “Grill”, “Ill”, “Kill”, “Nil”, “Spill”, “Thrill” and “Till” Moments: -
• “Chill Moments” – periods of rapid cooling, e.g. Ice Age Glaciations (Pluvial Periods) causing
depopulation of early hominids in Northern Europe in Pleistocene Eolithic times, abandonment of the
high fells, moors and highlands in Britain during the Iron Age Climate Anomaly, and impact of the
medieval “mini Ice Age” on Danish settlers in Greenland. These events may be linked to the periodic
reduction or failure of the Gulf Stream current – which brings warm water (and air) from the Caribbean
to the North Atlantic.

History and Future of Climate and Environmental Change
• “Grill Moments” - rapidly rising temperatures such as found in Ice Age Inter-Glacial episodes (Inter-
pluvial Periods) – causing environmental and ecological change under heat stress and drought –
precipitating the disappearance of the Neanderthal, Solutrean and Clovis cultures, drying, deforestation
and desertification driving the migration of the Anastasia in SW America along with desertification
drifting south and impacting on Sub-Saharan cultures today.
• “Ill Moments” - Contact with an foreign civilization or alien population and their parasitic bio-cloud -
carrying contagious diseases, which in pandemics to which the native population under exposure has
little or no immunity. Examples are the Bubonic Plague - Black Death - arriving in Europe from Asia,
Spanish Explorers sailing up the Amazon and spreading Smallpox to Amazonian Basin Indians from the
Dark Earth - Terra Prate - Culture and Columbian Sailors returning to Europe introducing Syphilis from
the New World, the Spanish Flu Pandemic carried home by returning soldiers at the end of the Great
War – infecting 40% and killing more people than did all the military action during the whole of WWI.
• “Kill Moments” – Invasion, conquest and genocide by a foreign civilization or alien population with
superior technology – destruction of mega-fauna, Roman conquest of Celtic Tribes in Western Europe,
William the Conquerors’ “Harrying of the North” in England, Spanish conquistadores meet Aztecs and
Amazonian Indians in Central and South America, Cowboys v. Indians in the plains of North America…..
• “Nil Moments” – Singularity or Hyperspace Events where the Earth and Solar System are swallowed
up by a rogue Black Hole – or the dimensional fabric of the whole Universe is ripped apart when two
Membranes (Universes) collide in hyperspace and one dimension set is subsumed into the other – they
could then merge into a large multi-dimensional Membrane – or split up into two new Membranes?....
History and Future of Climate and Environmental Change
• “Spill Moments” - Local or Regional Natural Disasters e.g. Andesitic volcanic eruption at subduction
tectonic plate margins - Vesuvius eruption and pyroclastic cloud destroying the Roman cities of
Herculaneum and Pompeii, Volcanic eruption / collapse causing Landslides and Tsunamis - Stromboli
eruption / collapse weakening the Minoan Civilisation on Crete, Krakatau eruption causing Indonesian
Tsunamis, ocean-floor sediment slips causing in recent years the recent Pacific and Indian Oceanic, and
Japanese Tsunamis – resulting in widespread coastal flooding, inundation & destruction.
• “Thrill Moments” - Continental or Global Natural Disasters – Extinction-level Events (ELE) such as the
Deccan and Siberian Traps Basaltic Flood Vulcanicity, Asteroid and Meteorite Impacts, Gamma-ray
Bursts from nearby collapsing stars dying and going Supernova – which have all variously contributed
towards the late Pre-Cambrian “Frozen Globe”, Permian-Triassic and Cretaceous-Tertiary boundary
global mass extinction events,,,,,”
• “Till Moments” - Society’s growth-associated impacts on its own ecological and environmental support
systems, for example intensive agriculture causing exhaustion of natural resources by the Mayan and
Khmer cultures, de-forestation and over-grazing causing catastrophic environmental damage and
ecological disasters - resulting in climatic change – for example, the Easter Island culture, the de-
population of upland moors and highlands in Britain from the Iron Age onwards – including the Iron Age
retreat from northern and southern English uplands, the Scottish Highland Clearances and replacement
of subsistence crofting by deer and grouse for hunting and sheep for wool on major Scottish Highland
Estates and the current sub-Saharan de-forestation and subsequent desertification by semi-nomadic
pastoralists.....

History and Future of Climate and Environmental Change
• Current trends in Human Population Growth are unsustainable – today we are already beginning
to run out of Food, Energy and Water (FEW) – a crisis which will first limit, then reverse human
population growth. Ecological stability and sustainability may be preserved – but only at the
expense of the continued, unchecked growth of human populations. Most natural resources –
arable land, fertilisers, food, energy sources, even clean water – begin to run out by about 2040.
Worst-case Extrapolated Population Curves and Growth Limit Analysis scenarios indicate a
dramatic collapse in population from about 2040 onwards - with numbers falling to well below the
1bn mark and probably recovering and stabilising out at around 1bn by the end of the century.
• Socio-Anthropologists, Economists and Demographic / Ethnographic Geographers – based on
the principles of Thomas Malthus and Pierre Verhulst – have updated population growth limit
curve extrapolations, which tend to converge towards a Global Population Collapse scenario by
the middle of this century. There are over 7bn Humans on the Earth today – rising from 1.6bn at
the turn of the 20th century. Over one-half of that human population is now urbanised, living in
cities – most of which are built either on the coast or alongside inland waterways. By 2050,
upwards of two-thirds of the 8-9bn human population will now be dwelling in cities – built mostly
near the coast, estuaries and deltas, alongside rivers, lakes and inland waterways. Rising sea
levels and intensifying weather systems will periodically create storm surges and flash floods
which will inundate land as far as 90 km from the present coast into the interior – drowning those
cities, killing and carrying off their inhabitants and washing away valuable real-estate and
infrastructure systems – along with the most productive coastal and river valley agricultural land.

Human Activity Shock Waves
1. Stone – Tools for hunting, crafting artefacts and making fire
2. Fire – Combustion for warmth, cooking and for managing the environment
3. Agriculture – Neolithic Age Human Settlements
4. Bronze – Bronze Age Cities and Urbanisation
5. Ship Building – Communication, Culture ,Trade
6. Iron – Iron Age Empires, Armies and Warfare
7. Gun-powder – Global Imperialism, Colonisation
8. Coal – Mining, Manufacturing and Mercantilism
9. Engineering – Bridges, Boats and Buildings
10. Steam Power – Industrialisation and Transport
11. Industrialisation – Mills, Factories, Foundries
12. Transport – Canals, Railways and Roads
13. Chemistry – Dyestuff, Drugs, Explosives, Petrochemicals and and Agrochemicals
14. Electricity – Generation and Distribution
15. Internal Combustion – Fossil Fuel dependency
16. Aviation – Powered Flight – Airships, Aeroplanes
17. Physics – Relativity Theory, Quantum Mechanics
18. Nuclear Fission – Abundant Energy & Cold War
19. Electronics – Television, Radio and Radar
20. Jet Propulsion – Global Travel and Tourism
21. Global Markets – Globalisation and Urbanisation
22. Aerospace – Rockets, Satellites, GPS, Space Technology and Inter-planetary Exploration
23. Digital Communications – Communication Age -Computers, Telecommunications and the Internet
24. Smart Devices / Smart Apps – Information Age
25. Smart Cities of the Future – The Smart Grid – Pervasive Smart Devices - The Internet of Things
26. The Energy Revolution – The Solar Age – Renewable Energy and Sustainable Societies
27. Hydrogen Economy – The Hydrogen Age – fuel cells, inter-planetary and deep space exploration
28. Nuclear Fusion – The Fusion Age – Unlimited Energy - Inter-planetary Human Settlements
29. Space-craft Building – The Exploration Age - Inter-stellar Cities and Galactic Urbanisation
“Kill Moments” – Major Natural and Human Activity catastrophes – War, Famine, Disease, Natural Disasters
“Culture Moments” – Major Human Activity achievements - Technology Development, Culture and History
Industrial Cycles – the phases of evolution for any given industry at a specific location / time (variable)
Technology Shock Waves – Stone, Agriculture, Bronze, Iron, Steam, Digital and Information Ages: -

History and Future of Climate and Environmental Change
• When we look at possible, probable and likely future human outcomes, we often extrapolate Malthus / Verhulse population growth curves / economic limiting factors / patterns and trends from previous human civilisations– which in the past have all ended in collapse scenarios where human cultures and societies have emerged, developed, experienced rapid growth, plateaued, declined – and have finally failed, died out or just simply disappeared from the historic record: -
• Many complex human societies (Solutrean, Clovis, Mayan, Aztec, Khmer and Easter Island) have been displaced, over-run, lost or disappeared, often as a result of a catastrophic event – a natural disaster, climate change, disease, exposure to a culture with superior technology – or simply as a consequence of their own society’s growth-associated impacts on the destruction of ecological and environmental support systems – dangers that we all still vey much face today.
Inca (Peru)
Aztecs (Mexico)
Olmec Civilisation
Mayan Civilisation
Muisca and Tairona Cultures
Pueblo Indians (Anastasia) – South-Western USA
Amazonian Indians - Dark Earth (Terra Prate) Culture
Indus Valley (Ayrian) Civilisation
Khmer Civilisation (Amkor)
Easter Islanders
Greenland Vikings (Medieval “mini Ice Age”)
Eocene - early hominids
Neanderthals
Solutrean / Clovis Cultures
Scythes
Parthians
Mesopotamians
Babylonians
Assyrians
Minoan Civilisation
Phoenicians
Etruscans

Seeing in Multiple Horizons: - Connecting Strategy to the Future
• THE THREE HORIZONS MODEL describes a Strategic Foresight method called “Seeing in Multiple Horizons: - Connecting Strategy to the Futures " The current THREE HORIZONS MODEL differs significantly from the original version first described in management literature over a decade ago. This model enables a range of Futures Studies techniques to be integrated with Strategy Analysis methods in order to reveal powerful and compelling future insights – and may be deployed in various combinations, whenever or wherever the Futures Studies techniques and Strategy Analysis methods are deemed to support the futures domains, subjects, applications and data in the current study.
• THE THREE HORIZONS MODEL method connects the Present Timeline with deterministic (desired or proposed) futures, and also helps us to identify probabilistic (forecast or predicted) future scenarios which may emerge as a result of interaction between embedded present-day factors and emerging catalysts of change – thus presenting us with a range of divergent possible futures. The “Three Horizons” method connects to models of change developed within the “Social Shaping” Strategy Development Framework via the Action Link to Strategy Execution. Finally, it summarises a number of futures applications where this evolving technique has been successfully deployed.
• The new approach to “Seeing in Multiple Horizons: - Connecting Strategy to the Future” has several unique features. It can relate change drivers and trends-based futures analysis to emerging issues. It enables policy or strategy implications of futures to be identified – and links futures work to processes of change. In doing so this enables Foresight to be connected to existing and proposed underlying system domains and data structures, with different rates of change propagation impacting across different parts of the system, and also to integrate seamlessly with tools and processes which facilitate Strategic Analysis. This approach is especially helpful where there are complex transformations which are likely to be radically disruptive in nature - rather than simple incremental transitions.

Andrew Curry Henley Centre HeadlightVision
United Kingdom
Anthony Hodgson Decision Integrity United Kingdom
Seeing in Multiple Horizons: - Connecting Strategy to the Future
The Three Horizons

Horizon Scanning, Tracking and Monitoring Processes
• Horizon and Environment Scanning, Tracking and Monitoring processes exploit the
presence and properties of Weak Signals – their discovery, analysis and interpretation
were first described by Stephen Aguilar Milllan in the 1960’s, and later popularised by
Ansoff in the 1970’s. Horizon Scanning is defined as “a set of information discovery
processes which data scientists, environment scanners, researchers and analysts use
to prospect, discover and mine the truly massive amounts of internet global content -
innumerable news and data feeds - along with the vast quantities of information stored
in public and private document libraries, archives and databases.”
• All of this external data is found widely distributed across the internet as Global Content
– RSS News Feeds and Data Streams, Academic Research Papers and Datasets - is
processed in order to detect and identify the possibility of unfolding random events and
clusters – “to systematically reduce the level of exposure to uncertainty, to reduce risk
and gain future insights in order to prepare for adverse future conditions – or to exploit
novel and unexpected opportunities for innovation" (LESCA, 1994). As a management
support tool for strategic decision-making, horizon and environment scanning process
have some very special challenges that need to be taken into account by environment /
horizon scanners, researchers, data scientists and analysts - as well as stakeholders.

Horizon Scanning, Tracking and Monitoring Processes
• Horizon Scanning (Human Activity Phenomena) and Environment Scanning (Natural
Phenomena) are the broad processes of capturing input data to drive futures projects and
programmes - but they also refer to specific futures studies tool sets, as described below.
• Horizon Scanning, Tracking and Monitoring is a highly structured evidence-gathering
process which engages participants by asking them to consider a broad range of input
information sources and data sets - typically outside the scope of their specific expertise.
This may be summarised as looking back for historic Wave-forms which may extend into
the future (back-casting), looking further ahead than normal strategic timescales for wave,
cycle, pattern and trend extrapolations (forecasting), and looking wider across and beyond
the usual strategic resources (cross-casting). A STEEP structure, or variant, is often used.
• Individuals use sources to draw insights and create abstracts of the source, then share
these with other participants. Horizon scanning lays a platform for further futures activities
such as scenarios or roadmaps. This builds strategic analysis capabilities and informs
strategy development priorities. Once uncovered, such insights can be themed as key
trends, assessed as drivers or used as contextual information within a scenario narrative.
• The graphic image below illustrates how horizon scanning is useful in driving Strategy
Analysis and Development: -
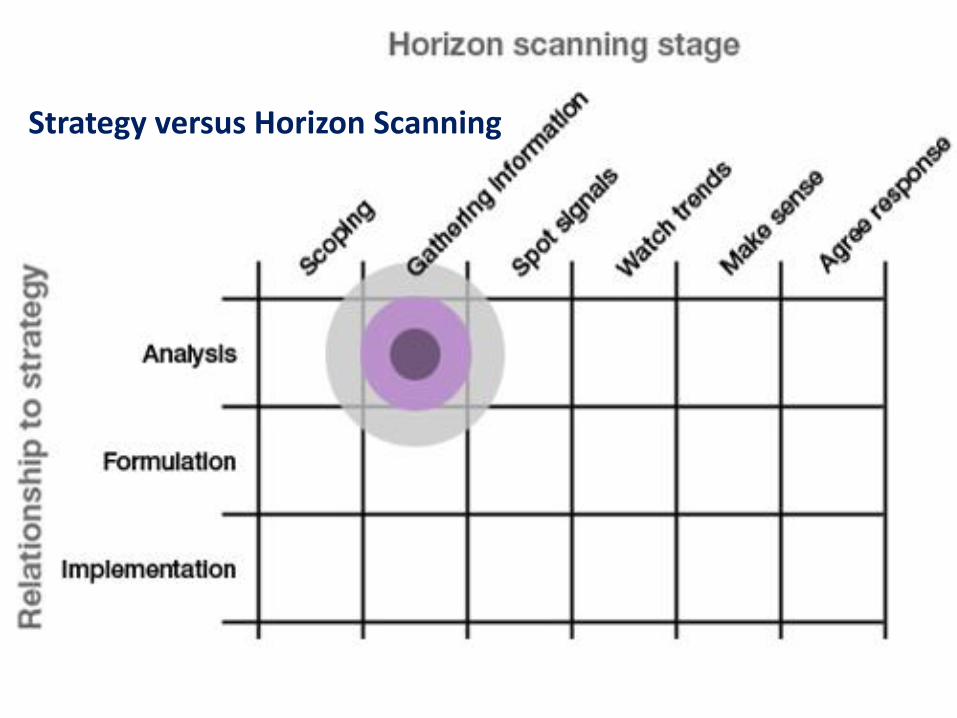
Strategy versus Horizon Scanning

Horizon Scanning, Tracking and Monitoring Processes
• Horizon Scanning, Tracking and Monitoring is the major input for unstructured “Big Data” to
be introduced into the Scenario Planning and Impact Analysis process (along with Monte
Carlo Simulation and other probabilistic models providing structured data inputs). In this
regard, Scenario Planning and Impact Analysis helps to create a conducive team working
environment. It allows consideration of a broad spectrum of input data – beyond the usual
timescales and sources – drawing information together in order to identify future challenges,
opportunities and trends. It looks for evidence at the margins of current thinking as well as in
more established trends. This allows the collective insights of the group to be integrated -
demonstrating the many differing ways which diverse sources contribute to these insights.
• Horizon Scanning, Tracking and Monitoring is ideal as an initial activity for collecting Weak
Signal data input into the Horizon Scanning, Tracking and Monitoring process to kick-off
major futures studies projects and future management programmes. Scenario Planning and
Impact Analysis is also useful as a sense-making and interaction tool for an integrated
future-focused team. Horizon Scanning, Tracking and Monitoring combined with Scenario
Planning and Impact Analysis works best if people external to the organisation are included
in the team - and are encouraged to help bring together new and incisive perspectives.
• The graphic image below illustrates how horizon scanning is useful in spotting weak signals
that might be otherwise difficult to see – and so risk being overlooked: -
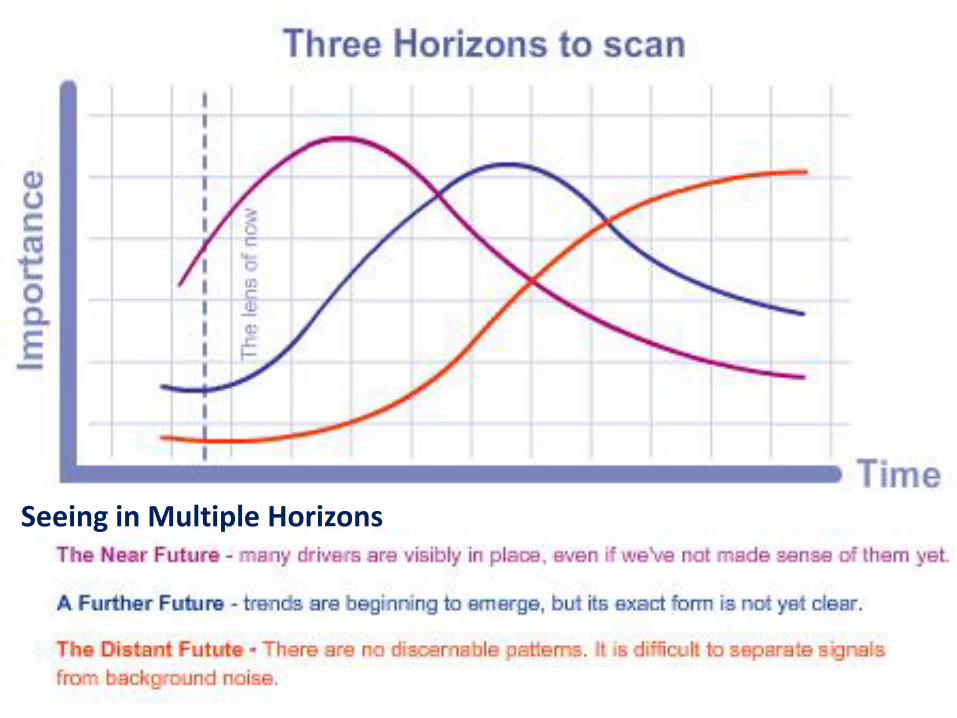
Seeing in Multiple Horizons
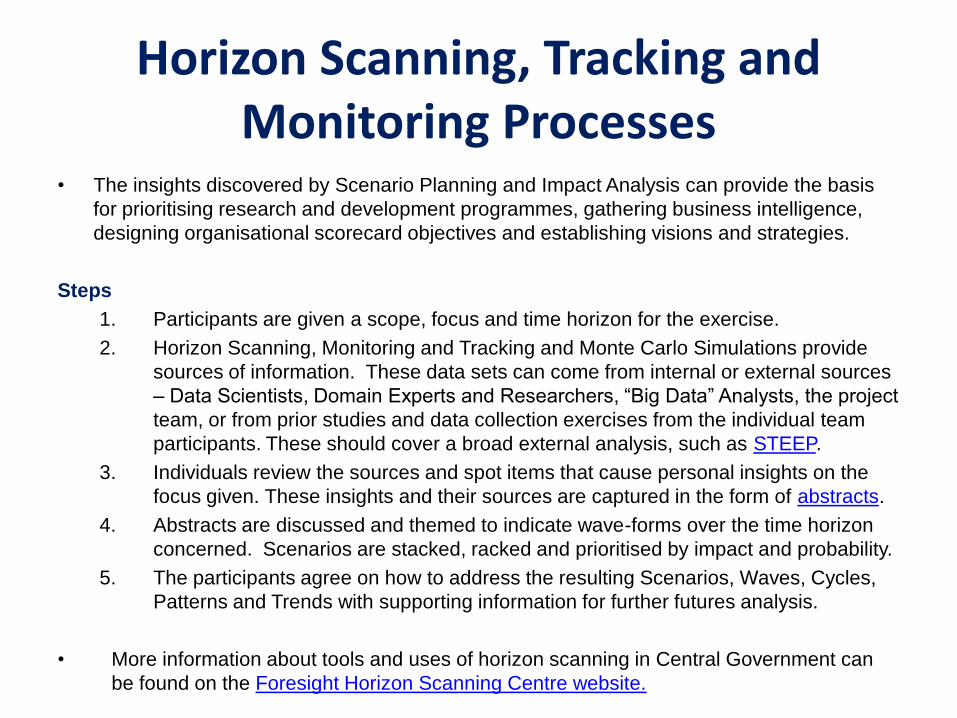
Horizon Scanning, Tracking and Monitoring Processes
• The insights discovered by Scenario Planning and Impact Analysis can provide the basis
for prioritising research and development programmes, gathering business intelligence,
designing organisational scorecard objectives and establishing visions and strategies.
Steps
1. Participants are given a scope, focus and time horizon for the exercise.
2. Horizon Scanning, Monitoring and Tracking and Monte Carlo Simulations provide
sources of information. These data sets can come from internal or external sources
– Data Scientists, Domain Experts and Researchers, “Big Data” Analysts, the project
team, or from prior studies and data collection exercises from the individual team
participants. These should cover a broad external analysis, such as STEEP.
3. Individuals review the sources and spot items that cause personal insights on the
focus given. These insights and their sources are captured in the form of abstracts.
4. Abstracts are discussed and themed to indicate wave-forms over the time horizon
concerned. Scenarios are stacked, racked and prioritised by impact and probability.
5. The participants agree on how to address the resulting Scenarios, Waves, Cycles,
Patterns and Trends with supporting information for further futures analysis.
• More information about tools and uses of horizon scanning in Central Government can
be found on the Foresight Horizon Scanning Centre website.

Horizon Scanning, Tracking and Monitoring
• Are you all at sea over your future.....?

Horizon and Environment Scanning, Tracking and Monitoring Processes
• Horizon and Environment Scanning Event Types – refer to Weak Signals of any unforeseen,
sudden and extreme Global-level transformation or change Future Events in either the military,
political, social, economic or environmental landscape - having an inordinately low probability of
occurrence - coupled with an extraordinarily high impact when they do occur (Nassim Taleb).
• Horizon Scanning Event Types
– Technology Shock Waves
– Supply / Demand Shock Waves
– Political, Economic and Social Waves
– Religion, Culture and Human Identity Waves
– Art, Architecture, Design and Fashion Waves
– Global Conflict – War, Terrorism, and Insecurity Waves
• Environment Scanning Event Types
– Natural Disasters and Catastrophes
– Human Activity Impact on the Environment - Global Massive Change Events
• Weak Signals – are messages, subliminal temporal indicators of ideas, patterns, trends or
random events coming to meet us from the future – or signs of novel and emerging desires,
thoughts, ideas and influences which may interact with both current and pre-existing patterns
and trends to predicate impact or effect some change in our present or future environment.


Forecasting and Predictive Analytics
• ECONOMIC MODELLING and LONG-RANGE FORECASTING •
• Economic Modelling and Long-range Forecasting is driven by atomic Data Warehouse
Structures and sophisticated Economic Models containing both Historic (up to 200 years daily
closing prices for Commodities, shares and bonds) and Future values (daily forecast and weekly
projected price curves, monthly and quarterly movement predictions, and so on for up to 50
years into the future – giving a total timeline of up to 250 years (Historic + 50 years Future trends
summary, outline movements and highlights). Forecast results are obtained using Economic
Models - Quantitative (technical) Analysis (Monte Carlo Simulation, Pattern and Trend Analysis -
Economic Growth and Recession / Depression shapes and Commodity Price Data Sets) in order
to construct a continuous 100 year “window” into Commodity Price Curves and Business Cycles
for Cluster Analysis and Causal Layer Analysis (CLA) – which in turn is used for driving out
Qualitative (narrative) Scenario Planning and Impact Analysis for describing future narrative epic
stories, scenarios and use-cases.
• PREDICTIVE ANALYITICS and EVENT FORECASTING •
• Predictive Analytics and Event Forecasting uses Horizon Scanning, Tracking and Monitoring
methods combined with Cycle, Pattern and Trend Analysis techniques for Event Forecasting and
Propensity Models in order to anticipate a wide range of business. economic, social and political
Future Events – ranging from micro-economic Market phenomena such as forecasting Market
Sentiment and Price Curve movements - to large-scale macro-economic Fiscal phenomena
using Weak Signal processing to predict future Wild Card and Black Swan Events - such as
Monetary System shocks.

Forecasting and Predictive Analytics
• MARKET RISK •
Market Risk = Market Sentiment – Actual Results (Reality)
• The two Mood States – “Greed and Fear” are primitive human instincts which, until now, we've
struggled to accurately qualify and quantify. Social Networks, such as Twitter and Facebook,
burst on to the scene five years ago and have since grown into internet giants. Facebook has
over 900 million active members and Twitter over 250 million, with users posting over 2 billion
"tweets“ or messages every week. This provides hugely valuable and rich insights into how
Market Sentiment and Market Risk are impacting on Share Support / Resistance Price Levels –
and so is also a source of real-time data that can be “mined” by super-fast computers to forecast
changes to Commodity Price Curves
• STRATEGIC FORESIGHT •
• Strategic Foresight is the ability to create and maintain a high-quality, coherent and functional
forward view, and to utilise Future Insights in order to gain Competitive Advantage - for example
to identify and understand emerging opportunities and threats, to manage risk, to inform
planning and forecasting and to shape strategy development. Strategic Foresight is a fusion of
Foresight techniques with Strategy Analysis methods – and so is of great value in detecting
adverse conditions, threat assessment, guiding policy and strategic decision-modelling, in
identifying and exploring novel opportunities presented by emerging technologies, in evaluating
new markets, products and services and in driving transformation and change.

Forecasting and Predictive Analytics
• INNOVATION •
• Technology Innovation is simply combining existing resources in new and different ways –
in order to create novel and innovative Products and Services. Understanding the impact
of Technology Convergence is the Key to driving Innovation. Many common and familiar
objects in use today exist only as a result of technology convergence - your average,
everyday passenger vehicle or laptop computer is the culmination of a series of technology
consolidation and integration events of a large number of apparently separate, unrelated
technological innovations and advancements. Light-weight batteries were developed to
provide independence from fixed power sockets and hard-disk drives were made compact
enough to be installed in portable devices. Then the smart phone and tablet resulted from
a further convergence of technologies such as cellular telecommunications, mobile
internet, and Smart Apps - mini-applications that do not need an on-board hard-disk drive.
• FUTURE MANAGEMENT •
• Providing future analysis and strategic advice to stakeholders so that they might
understanding how the Future may unfold - in order to anticipate, prepare for and manage
the Future, to resolve challenging business problems, to envision, architect, design and
deliver novel solutions in support of major technology refreshment and business
transformation programmes • Future Analysis • Innovation • Strategic Planning •
Business Transformation • Technology Refreshment •

Forecasting and Predictive Analytics
. • GEO-DEMOGRAPHICS •
• The profiling and analysis of large aggregated datasets in order to determine a ‘natural’ or
implicit structure of data relationships or groupings where no prior assumptions are made
concerning the number or type of groups discovered or group relationships, hierarchies or
internal data structures - in order to discover hidden data relationships - is an important starting
point forming the basis of many statistical and analytic applications. The subsequent explicit
Cluster Analysis as of discovered data relationships is a critical technique which attempts to
explain the nature, cause and effect of those implicit profile similarities or geographic
distributions. Geo-demographic techniques are frequently used in order to profile and segment
populations by ‘natural’ groupings - such as common behavioural traits, Clinical Trial, Morbidity
or Actuarial outcomes, along with many other shared characteristics and common factors –and
then attempt to understand and explain those natural group affinities and geographical
distributions using methods such as Causal Layer Analysis (CLA).....
• Social Media is the fastest growing category of user-provided global content and will eventually
grow to 20% of all internet content. Gartner defines social media content as unstructured data
created, edited and published by users on external platforms including Facebook, MySpace,
LinkedIn, Twitter, Xing, YouTube and a myriad of other social networking platforms - in addition
to internal Corporate Wikis, special interest group blogs, communications and collaboration
platforms. Social Mapping is the method used to describe how social linkage between
individuals defines Social Networks and to understand the nature and dynamics of intimate
relationships between individuals

Forecasting and Predictive Analytics
• GIS MAPPING and SPATIAL DATA ANALYSIS •
• A Geographic Information System (GIS) integrates hardware, software, and data capture devices for acquiring, managing, analysing, distributing and displaying all forms of geographically dependant location data – including machine generated data such as Computer-aided Design (CAD) data from land and building surveys, Global Positioning System (GPS) terrestrial location data - as well as all kinds of aerial and satellite image data.
• Spatial Data Analysis is a set of techniques for analysing spatial (Geographic) location data. The results of spatial analysis are dependent on the locations of the objects being analysed. Software that implements spatial analysis techniques requires access to both the locations of objects and their physical attributes. Spatial statistics extends traditional statistics to support the analysis of geographic data. Spatial Data Analysis provides techniques to describe the distribution of data in the geographic space (descriptive spatial statistics), analyse the spatial patterns of the data (spatial pattern or cluster analysis), identify and measure spatial relationships (spatial regression), and create a surface from sampled data (spatial interpolation, usually categorized as geo-statistics).

Forecasting and Predictive Analytics
• “BIG DATA” •
• “Big Data” refers to vast aggregations (super sets) of individual datasets whose size and
scope is beyond the capability of conventional transactional Database Management
Systems and Enterprise Software Tools to capture, store, analyse and manage. Examples
of Big Data include the vast and ever changing amounts of data generated in social
networks where we have (unstructured) conversations with each other, news data streams,
geo-demographic data, internet search and browser logs, as well as the ever-growing
amount of machine data generated by pervasive smart devices - monitors, sensors and
detectors in the environment – captured via the Smart Grid, then processed in the Cloud –
and delivered to end-user Smart Phones and Tablets via Intelligent Agents and Alerts.
• Data Set Mashing and “Big Data” Global Content Analysis – supports Horizon Scanning,
Monitoring and Tracking activities by taking numerous, apparently un-related RSS and
other Information Streams and Data Feeds, loading them into Very large Scale (VLS) DWH
Structures and Document Management Systems for Real-time Analytics – searching for
and identifying possible signs of relationships hidden in data (Facts/Events)– in order to
discover and interpret previously unknown “Weak Signals” indicating emerging and
developing Application Scenarios, Patterns and Trends - in turn predicating possible,
probable and alternative global transformations unfolding as future “Wild Card” or “Black
Swan” events.

Forecasting and Predictive Analytics
• WAVE-FORM ANAYITICS in “BIG DATA” •
• Wave-form Analytics help identify Cycles, Patterns and Trends in Big Data – characterised as
a sequence of high and low activity in time-series data – resulting in periodic increased and
reduced phases in regular, recurring cyclic trends. This approach supports an integrated study
of the impact of multiple concurrent cycles - and no longer requires iterative and repetitive
processes of trend estimation and elimination from the background “noise”.
• FORENSIC “BIG DATA” •
• Social Media Content and Spatial Mapping Data is used in order to understand intimate
personal relationships between individuals and to identify, locate and describe their participation
in various Global Social Networks. Thus the identification, composition, monitoring, tracking
,activity and traffic analysis of Social Networks Criminal Enterprises and Terrorist Cells – as
defined by common locations, business connections, social links and inter-personal
relationships – is used by Businesses to drive Influencer Programmes and by Government for
National Security, Counter-Terrorism, Anti-Trafficking, Criminal Investigation and Fraud
Prevention purposes.....
• Forensic “Big Data” combines the use of Social Media and Social Mapping Data in order to
understand intimate inter-personal relationships for the purpose of National Security, anti-
Trafficking and Fraud Prevention – through the identification, composition, activity analysis and
monitoring of Criminal Enterprises and Terrorist Cells.....


Business Cycles, Patterns and Trends
Throughout eternity, all that is of like form comes around again –
everything that is the same must return in its own everlasting cycle.....
• Marcus Aurelius – Emperor of Rome •
Many Economists and Economic Planners have arrived at the same
conclusion – that most organizations have not yet widely developed
sophisticated Economic Modelling and Forecasting systems – yet alone
integrated their model outputs into core Strategic Planning and Financial
Management process.....

Abiliti: Future Systems
Throughout eternity, all that is of like form comes around again – everything that is the same must return in its own everlasting
cycle.....
• Marcus Aurelius – Emperor of Rome •
Many Economists and Economic Planners have arrived at the same conclusion - that most organisations have not yet widely adopted
sophisticated Business Intelligence and Analytics systems – let alone integrated BI / Analytics and “Big Data” outputs into their core Strategic
Planning and Financial Management processes.....

Abiliti: Future Systems
• Abiliti: Origin Automation is part of a global consortium of Digital Technologies Service Providers and Future Management Strategy Consulting firms for Digital Marketing and Multi-channel Retail / Cloud Services / Mobile Devices / Big Data / Social Media
• Graham Harris Founder and MD @ Abiliti: Future Systems
– Email: (Office) – Telephone: (Mobile)
• Nigel Tebbutt 奈杰尔 泰巴德
– Future Business Models & Emerging Technologies @ Abiliti: Future Systems – Telephone: +44 (0) 7832 182595 (Mobile) – +44 (0) 121 445 5689 (Office) – Email: [email protected] (Private)
• Ifor Ffowcs-Williams CEO, Cluster Navigators Ltd & Author, “Cluster Development” – Address : Nelson 7010, New Zealand (Office)
– Email : [email protected]
Abiliti: Origin Automation Strategic Enterprise Management (SEM) Framework ©
Cluster Theory - Expert Commentary: -

Abiliti: Future Systems