
Business Attraction Retention Program Analysis Business Attraction & Retention Program Analysis...
69
Funded by: State of California Department of Housing and Community Development Economic Development and Planning/Technical Assistance Program Grant November 2009 Tehama County Business Attraction & Retention Program Analysis Prepared for the Tehama County Planning Department
Transcript of Business Attraction Retention Program Analysis Business Attraction & Retention Program Analysis...
Funded by: State of California Department of Housing and Community Development Economic Development and Planning/Technical Assistance Program Grant November 2009
Tehama County
Business Attraction &
Retention Program Analysis
Prepared for the Tehama County P lanning Department
1 Tehama County Attraction & Retention Program Analysis 1
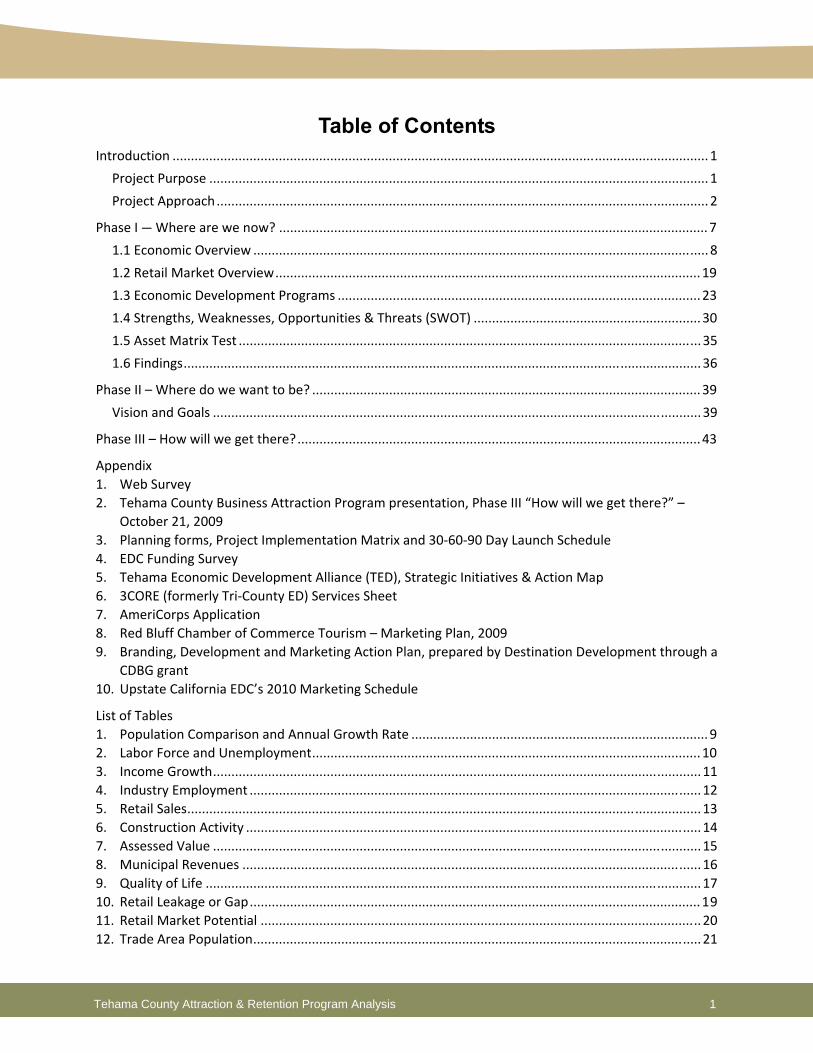
Table of Contents Introduction ..................................................................................................................................................1
Project Purpose ........................................................................................................................................1 Project Approach......................................................................................................................................2
Phase I ― Where are we now? .....................................................................................................................7 1.1 Economic Overview ............................................................................................................................8 1.2 Retail Market Overview....................................................................................................................19 1.3 Economic Development Programs ...................................................................................................23 1.4 Strengths, Weaknesses, Opportunities & Threats (SWOT) ..............................................................30 1.5 Asset Matrix Test ..............................................................................................................................35 1.6 Findings.............................................................................................................................................36
Phase II – Where do we want to be? ..........................................................................................................39 Vision and Goals .....................................................................................................................................39
Phase III – How will we get there?..............................................................................................................43
Appendix 1. Web Survey 2. Tehama County Business Attraction Program presentation, Phase III “How will we get there?” –
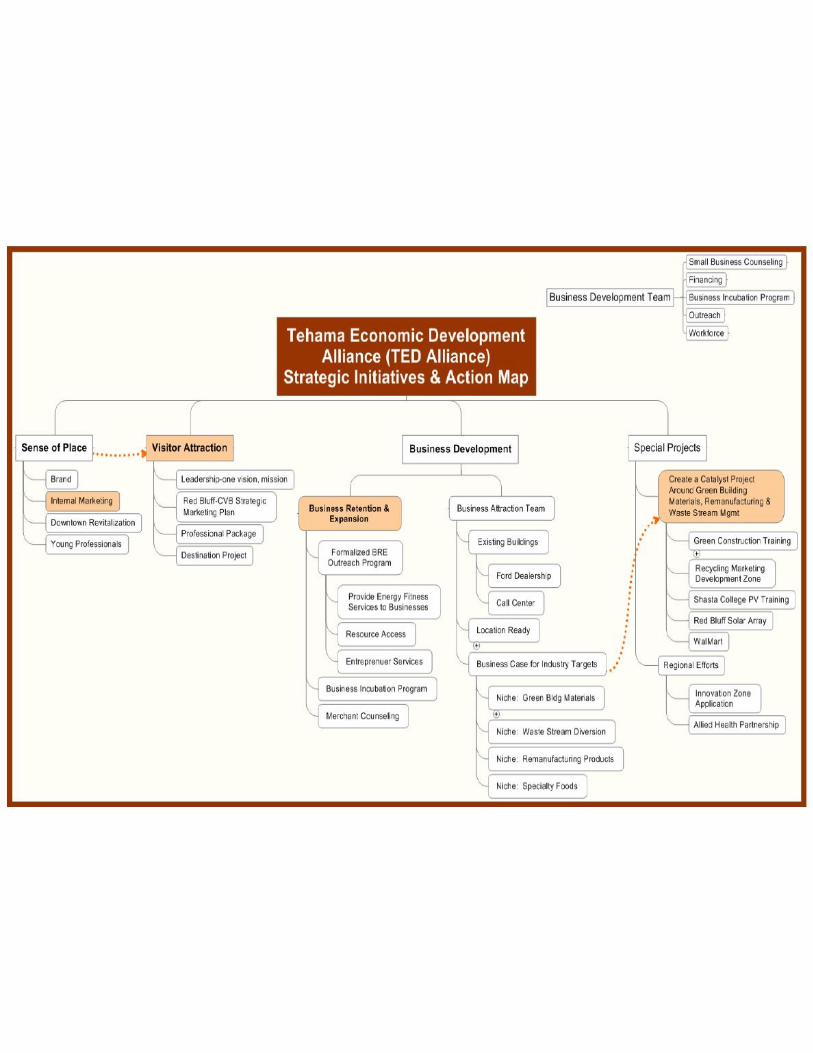
October 21, 2009 3. Planning forms, Project Implementation Matrix and 30‐60‐90 Day Launch Schedule 4. EDC Funding Survey 5. Tehama Economic Development Alliance (TED), Strategic Initiatives & Action Map 6. 3CORE (formerly Tri‐County ED) Services Sheet 7. AmeriCorps Application 8. Red Bluff Chamber of Commerce Tourism – Marketing Plan, 2009 9. Branding, Development and Marketing Action Plan, prepared by Destination Development through a
CDBG grant 10. Upstate California EDC’s 2010 Marketing Schedule
List of Tables 1. Population Comparison and Annual Growth Rate .................................................................................9 2. Labor Force and Unemployment..........................................................................................................10 3. Income Growth.....................................................................................................................................11 4. Industry Employment ...........................................................................................................................12 5. Retail Sales............................................................................................................................................13 6. Construction Activity ............................................................................................................................14 7. Assessed Value .....................................................................................................................................15 8. Municipal Revenues .............................................................................................................................16 9. Quality of Life .......................................................................................................................................17 10. Retail Leakage or Gap...........................................................................................................................19 11. Retail Market Potential ........................................................................................................................20 12. Trade Area Population..........................................................................................................................21
2 Tehama County Attraction & Retention Program Analysis 2
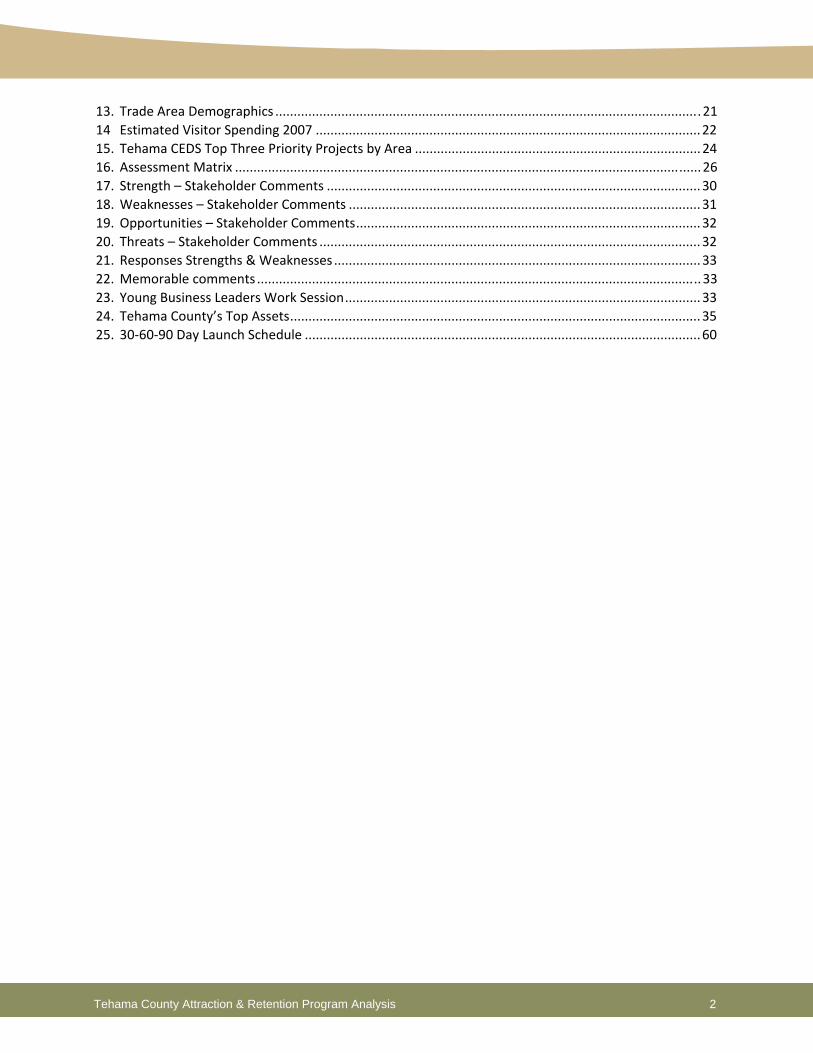
13. Trade Area Demographics ....................................................................................................................21 14 Estimated Visitor Spending 2007 .........................................................................................................22 15. Tehama CEDS Top Three Priority Projects by Area ..............................................................................24 16. Assessment Matrix ...............................................................................................................................26 17. Strength – Stakeholder Comments ......................................................................................................30 18. Weaknesses – Stakeholder Comments ................................................................................................31 19. Opportunities – Stakeholder Comments..............................................................................................32 20. Threats – Stakeholder Comments ........................................................................................................32 21. Responses Strengths & Weaknesses ....................................................................................................33 22. Memorable comments .........................................................................................................................33 23. Young Business Leaders Work Session.................................................................................................33 24. Tehama County’s Top Assets................................................................................................................35 25. 30‐60‐90 Day Launch Schedule ............................................................................................................60
1 Tehama County Attraction & Retention Program Analysis 1
Introduction Project Purpose The Business Attraction & Retention Program Analysis project is funded by a State of California, Community Development Block Grant – Technical Assistance Program.
The County of Tehama has experienced a higher percentage of economic distress than many other counties in the north state which has resulted in higher unemployment, decrease in income and decrease in government revenues. The ability to attract and retain commercial and industrial business through new development, reconstruction, and rehabilitation is seen by the County as a vital component to the overall economic health of the community.
The project goal was to provide an analysis of the economic development efforts undertaken on the county’s behalf and to develop a roadmap which would provide the community a better focus for its regional economic development efforts.
Project Goals
Complete a program assessment of the business attraction and retention efforts, including a Strengths, Weaknesses, Opportunities and Threats (SWOT) analysis.
Work with ED stakeholders to identify and update goals, issues and objectives for business retention and attraction.
Create an implementation strategy for business attraction and retention.
Identify potential funding sources to fund implementation strategies.
The lead agency for economic development for the County was the Tehama Economic Development Corporation (Tehama EDC). During the initial start of this project, Tehama EDC announced it would need to cease its operations due to lack of funding resources. Tehama EDC closed its doors and released full‐time staff and with its limited resources contracted with the Job Training Center (workforce development) to maintain critical services, such as, phone, website, response to inquiries and business requests. The project completion was coordinated with the Job Training Center.

2 Tehama County Attraction & Retention Program Analysis 2
Project Approach For this assessment and strategic planning a three step process was used:
1. Where are we now?
2. Where do we want to be?
3. How do we get there?
Phase I – Where are we today is also know as the Discovery Phase. This phase involves stakeholder interviews, analysis of the economic base, retail analysis, economic development assessment of basic services and service provider interviews.
Phase II – Where do we want to go is based on stakeholder interviews, goals and objectives for economic development activities and the community assets and opportunities that will create economic growth and activity.
Phase III – How do we get there is recommended activities based on the best opportunities to achieve the goals and objectives.
The following outlines the existing documents reviewed for the project assessment and stakeholders interviewed.
Extensive Outreach & Stakeholder Participation In addition to a review of existing plans and policies, many local stakeholders were engaged in this project through personal and telephone interviews. A standardized list of questions was asked of each participant pertaining to the county’s greatest economic assets and opportunities. A smaller number of people participated by completing an on‐line web based survey.
Stakeholders involved in the personal meeting interviews or phone interviews are listed below. An asterisk (*) indicates the individual is a member of the Tehama Economic Development Corporation [Tehama EDC].
George Robson, Planning Director, County of Tehama Kendall Pierson, Plant Manager, Sierra Pacific Robert Minch, Owner, Western Real Estate Dave David, Tehama County Planning Commissioner Mark Eidman, CEO, Tehama District Fair Grounds Kathy Schmitz, Job Training Center* Bill Moule, Moule’s Tehama County Glass* Steve Kimbrough, City Manager, City of Corning* Tom Orr, Shasta College* Bill Goodwin, CAO, County of Tehama* Brandon Tandy, Walmart DC* Tom Eubanks, General Building Contractor* Ken Robison, Re/Max Martin Nichols, City Manager, City of Red Bluff* Diane Ampi, Store Manager, Premier West Larry Champion, County Superintendent, Tehama County
3 Tehama County Attraction & Retention Program Analysis 3
Dewey Lucero, Owner, Lucero Olive Oil Burt Bundy, President, Tehama County Farm Bureau Don McKim, Owner, Nine Mile Ranch, Inc.* Gary Strack, Mayor, City of Corning John Crosby, Paskenta Band of Nomlaki Indians* Robert Auerbach, VP, Fidelity National Title Company* Ron Crain, Owner, Olive Pit Christine Maness, Flying J Chip McCoy, Owner, Hatfield’s on Solano Kyle Lauderdale, Manager, Premier West Bank
The following individuals completed a web based questionnaire1
Alan Abs, Air Quality Control, Solid Waste Administration, Tehama County Chuck Crain, Owner, Crain Walnut Shelling John Brewer, Public Works Director, City of Corning John Stoufer, Planning Director, City of Corning Kristin Behrens, Marketing Community Relations, St. Elizabeth Community Hospital Kristina Miller, Landfill Management, Tehama County Mitch Brehm, Plant Manager, Pactiv Venita Philbrook, State Theatre Beverley Anderson, Sacramento River Conservation Area Forum Scot Timboe, Planning Director, City of Red Bluff Gary Antone, Tehama County Public Works Director Janice Meehan, Tehama County Department of Social Services Brendon Flynn, Pacific Farms and Orchards, Inc. Eric Batten, Developer J.B. Stacy, Senior VP, Cornerstone Community Bank
Resource Partner Participants Telephone interviews were conducted with economic development and business service organizations and agencies that provide services to Tehama County businesses and residents. These organizations are important economic development resource partners, particularly with the closure of the Tehama Economic Development Corporation. Organizations providing services and interviewed include:
Sophie Konuawa, Small Business Development Center (SBDC) Dan Ripke, California State University, Chico (CSUC) Marc Nemanic, 3 Core (formerly named Tri‐County Economic Development Corporation Ryan Richardson, Superior California Economic Development Alison O’Sullivan, Upstate California
1 Appendix 1 – Web Survey
4 Tehama County Attraction & Retention Program Analysis 4
Young Business Leader Participants An evening work session was conducted by the Job Training Center to engage the young professionals and next generation leaders in providing input to their vision and goals for Tehama County. Attendees included:
1. Andrew Christ, Truman Christ Insurance 2. Kristina Miller, Tehama County Landfill 3. Melissa Mendonca, Tehama County Mentoring Program 4. RJ LaChance, LaChance Design, LLC 5. Pete Johnston, Signs and Banners 6. Brandon Grissom 7. Kate Grissom, Rolling Hills Casino 8. Becky Klinestecker, Bright Landscaping 9. Amy Gonczeruk, Sevillano Links 10. Chris Gonczeruk, Gonczeruk Custom Woodworking 11. Keith Thomas, State Farm Insurance 12. Alan Foley, Ameriprise Financial 13. Lindsay Miller Byrne, Vita Dermatology & Laser Institute 14. Matt Byrne, Omni Pipelines, Inc. 15. CJ Bartolomei, Lassen View Elementary School 16. Cori Bartolomei, CSU Chico Nursing Student 17. Dewey Lucero, Lucero Olive Oil 18. Greg Jones, Jones & Sons Orchards 19. Joe Vine, Copy Center
Observers:
Karla Stroman, Tehama County Department of Education/SERRF Audrey Taylor, Chabin Concepts Tonya Redamonti, United Country Allegiance Real Estate Kathy Schmitz, Job Training Center Kathy Garcia, Job Training Center
Plans, Studies and Reports Reviewed The following documents were reviewed as part of the Discovery Phase:
Tehama County General Plan Update, March 2008, Revised August, 2008 Tehama County Business Risk Report, Workforce Solutions, 2008 Strategic Marketing Plan, Red Bluff Chamber of Commerce, Convention & Visitors Bureau, May 2009 Quick Guide for Employer Needs Tehama Economic Development Corporation Tehama, Board Retreat Meeting Notes, June 2007 Tehama County EDC Work Plan, June 2008 Tehama EDC Committee Structure for 2007‐08 Tehama Trails Business Plan, July 2009 City of Red Bluff, Downtown Revitalization Plan, September 1999 Websites

5 Tehama County Attraction & Retention Program Analysis 5
Phase I ― Where are we today?

7 Tehama County Attraction & Retention Program Analysis 7
Phase I ― Where are we now? Phase I provides an analysis and assessment of:
1. Tehama County’s economy as compared to the Sacramento Region and State of California. This information provides a baseline to measure future economic activity.
2. Analysis of retail market, retail sales leakage and retail opportunity by market segment.
3. Assessment of economic development programs and Tehama County competitiveness for new job creation investments.
4. Strengths, weaknesses, opportunities & threats (SWOT)
8 Tehama County Attraction & Retention Program Analysis 8
1.1 Economic Overview The Economic Overview looks at key economic indicators for Tehama County to set a baseline for economic growth and strategic initiatives:
1. Population
2. Labor Force and Unemployment
3. Household Income
4. Economy
5. Retail Sales
6. Construction
7. Assessed Value
8. Municipal Revenues
9. Quality of Life
These indicators are set in context by comparing the economic indicators to other areas. For this review, the Sacramento Metro area and the State of California average was used. Reviewing other metropolitan areas and the state average provides a benchmark at which Tehama County should strive to set goals or use those areas as the benchmark for being equal to or better than, such as, the state average.
9 Tehama County Attraction & Retention Program Analysis 9
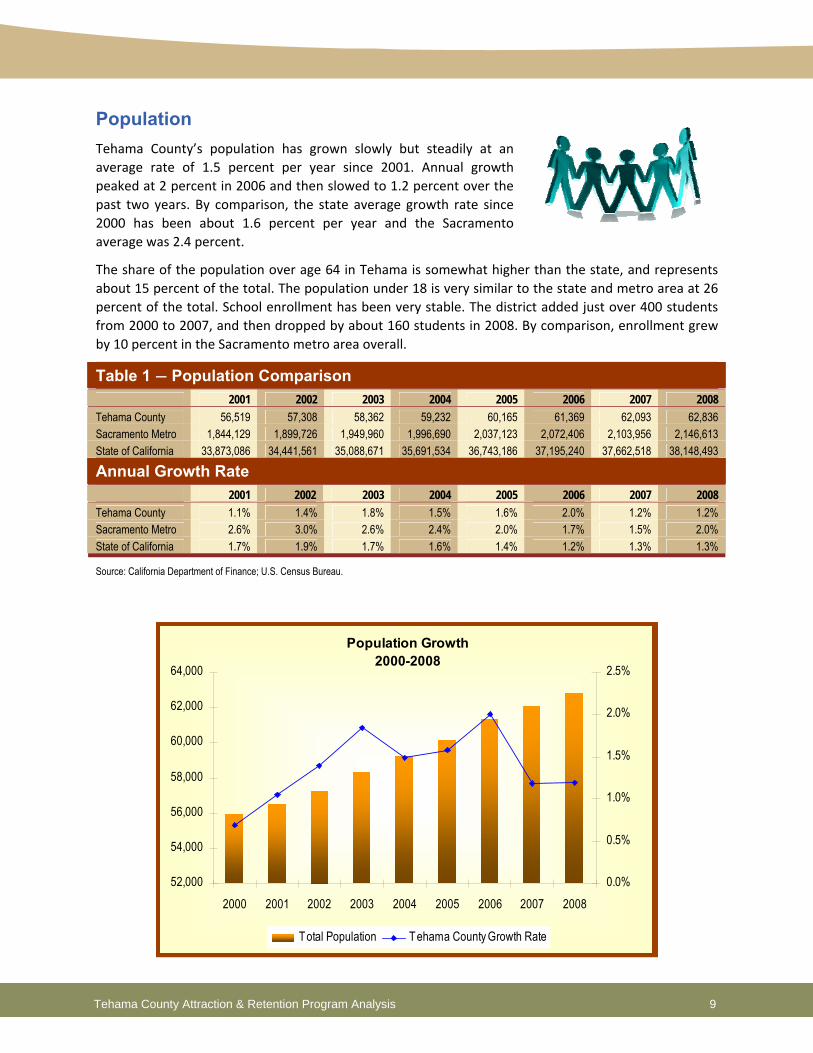
Population Tehama County’s population has grown slowly but steadily at an average rate of 1.5 percent per year since 2001. Annual growth peaked at 2 percent in 2006 and then slowed to 1.2 percent over the past two years. By comparison, the state average growth rate since 2000 has been about 1.6 percent per year and the Sacramento average was 2.4 percent.
The share of the population over age 64 in Tehama is somewhat higher than the state, and represents about 15 percent of the total. The population under 18 is very similar to the state and metro area at 26 percent of the total. School enrollment has been very stable. The district added just over 400 students from 2000 to 2007, and then dropped by about 160 students in 2008. By comparison, enrollment grew by 10 percent in the Sacramento metro area overall.
Table 1 ― Population Comparison 2001 2002 2003 2004 2005 2006 2007 2008 Tehama County 56,519 57,308 58,362 59,232 60,165 61,369 62,093 62,836 Sacramento Metro 1,844,129 1,899,726 1,949,960 1,996,690 2,037,123 2,072,406 2,103,956 2,146,613 State of California 33,873,086 34,441,561 35,088,671 35,691,534 36,743,186 37,195,240 37,662,518 38,148,493
Annual Growth Rate 2001 2002 2003 2004 2005 2006 2007 2008 Tehama County 1.1% 1.4% 1.8% 1.5% 1.6% 2.0% 1.2% 1.2% Sacramento Metro 2.6% 3.0% 2.6% 2.4% 2.0% 1.7% 1.5% 2.0% State of California 1.7% 1.9% 1.7% 1.6% 1.4% 1.2% 1.3% 1.3%
Source: California Department of Finance; U.S. Census Bureau.
Population Growth2000-2008
52,000
54,000
56,000
58,000
60,000
62,000
64,000
2000 2001 2002 2003 2004 2005 2006 2007 20080.0%
0.5%
1.0%
1.5%
2.0%
2.5%
Total Population Tehama County Growth Rate
10 Tehama County Attraction & Retention Program Analysis 10
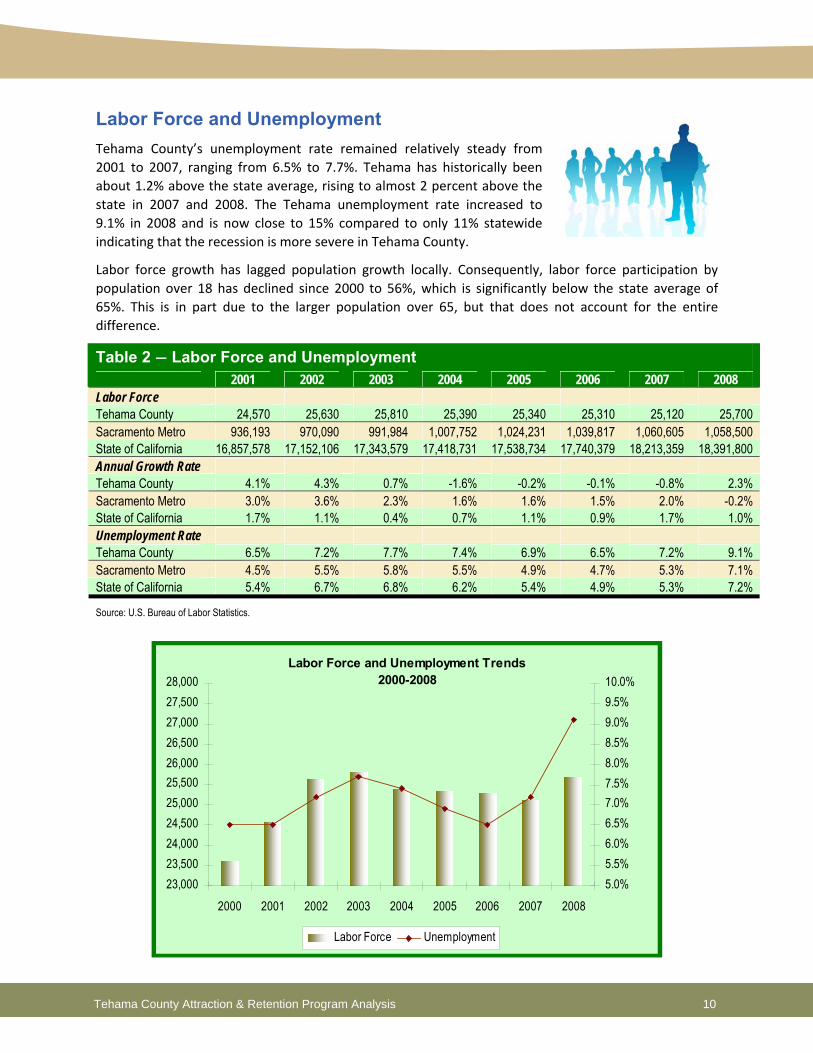
Labor Force and Unemployment Tehama County’s unemployment rate remained relatively steady from 2001 to 2007, ranging from 6.5% to 7.7%. Tehama has historically been about 1.2% above the state average, rising to almost 2 percent above the state in 2007 and 2008. The Tehama unemployment rate increased to 9.1% in 2008 and is now close to 15% compared to only 11% statewide indicating that the recession is more severe in Tehama County.
Labor force growth has lagged population growth locally. Consequently, labor force participation by population over 18 has declined since 2000 to 56%, which is significantly below the state average of 65%. This is in part due to the larger population over 65, but that does not account for the entire difference.
Table 2 ― Labor Force and Unemployment 2001 2002 2003 2004 2005 2006 2007 2008 Labor Force Tehama County 24,570 25,630 25,810 25,390 25,340 25,310 25,120 25,700 Sacramento Metro 936,193 970,090 991,984 1,007,752 1,024,231 1,039,817 1,060,605 1,058,500 State of California 16,857,578 17,152,106 17,343,579 17,418,731 17,538,734 17,740,379 18,213,359 18,391,800 Annual Growth Rate Tehama County 4.1% 4.3% 0.7% -1.6% -0.2% -0.1% -0.8% 2.3% Sacramento Metro 3.0% 3.6% 2.3% 1.6% 1.6% 1.5% 2.0% -0.2% State of California 1.7% 1.1% 0.4% 0.7% 1.1% 0.9% 1.7% 1.0% Unemployment Rate Tehama County 6.5% 7.2% 7.7% 7.4% 6.9% 6.5% 7.2% 9.1% Sacramento Metro 4.5% 5.5% 5.8% 5.5% 4.9% 4.7% 5.3% 7.1% State of California 5.4% 6.7% 6.8% 6.2% 5.4% 4.9% 5.3% 7.2%
Source: U.S. Bureau of Labor Statistics.
Labor Force and Unemployment Trends2000-2008
23,00023,50024,00024,50025,00025,50026,00026,50027,00027,50028,000
2000 2001 2002 2003 2004 2005 2006 2007 20085.0%5.5%6.0%6.5%7.0%7.5%8.0%8.5%9.0%9.5%10.0%
Labor Force Unemployment
11 Tehama County Attraction & Retention Program Analysis 11
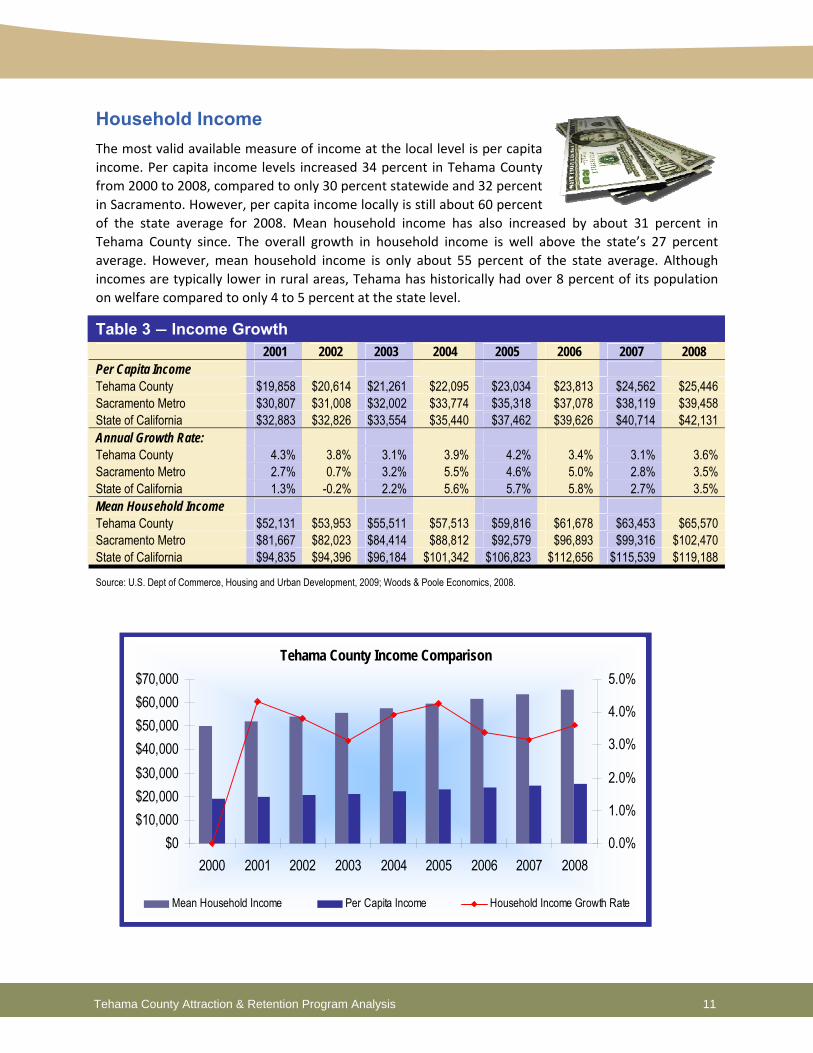
Household Income The most valid available measure of income at the local level is per capita income. Per capita income levels increased 34 percent in Tehama County from 2000 to 2008, compared to only 30 percent statewide and 32 percent in Sacramento. However, per capita income locally is still about 60 percent of the state average for 2008. Mean household income has also increased by about 31 percent in Tehama County since. The overall growth in household income is well above the state’s 27 percent average. However, mean household income is only about 55 percent of the state average. Although incomes are typically lower in rural areas, Tehama has historically had over 8 percent of its population on welfare compared to only 4 to 5 percent at the state level.
Table 3 ― Income Growth 2001 2002 2003 2004 2005 2006 2007 2008 Per Capita Income Tehama County $19,858 $20,614 $21,261 $22,095 $23,034 $23,813 $24,562 $25,446 Sacramento Metro $30,807 $31,008 $32,002 $33,774 $35,318 $37,078 $38,119 $39,458 State of California $32,883 $32,826 $33,554 $35,440 $37,462 $39,626 $40,714 $42,131 Annual Growth Rate: Tehama County 4.3% 3.8% 3.1% 3.9% 4.2% 3.4% 3.1% 3.6% Sacramento Metro 2.7% 0.7% 3.2% 5.5% 4.6% 5.0% 2.8% 3.5% State of California 1.3% -0.2% 2.2% 5.6% 5.7% 5.8% 2.7% 3.5% Mean Household Income Tehama County $52,131 $53,953 $55,511 $57,513 $59,816 $61,678 $63,453 $65,570 Sacramento Metro $81,667 $82,023 $84,414 $88,812 $92,579 $96,893 $99,316 $102,470 State of California $94,835 $94,396 $96,184 $101,342 $106,823 $112,656 $115,539 $119,188
Source: U.S. Dept of Commerce, Housing and Urban Development, 2009; Woods & Poole Economics, 2008.
Tehama County Income Comparison
$0$10,000$20,000$30,000$40,000$50,000$60,000$70,000
2000 2001 2002 2003 2004 2005 2006 2007 20080.0%
1.0%
2.0%
3.0%
4.0%
5.0%
Mean Household Income Per Capita Income Household Income Growth Rate
12 Tehama County Attraction & Retention Program Analysis 12
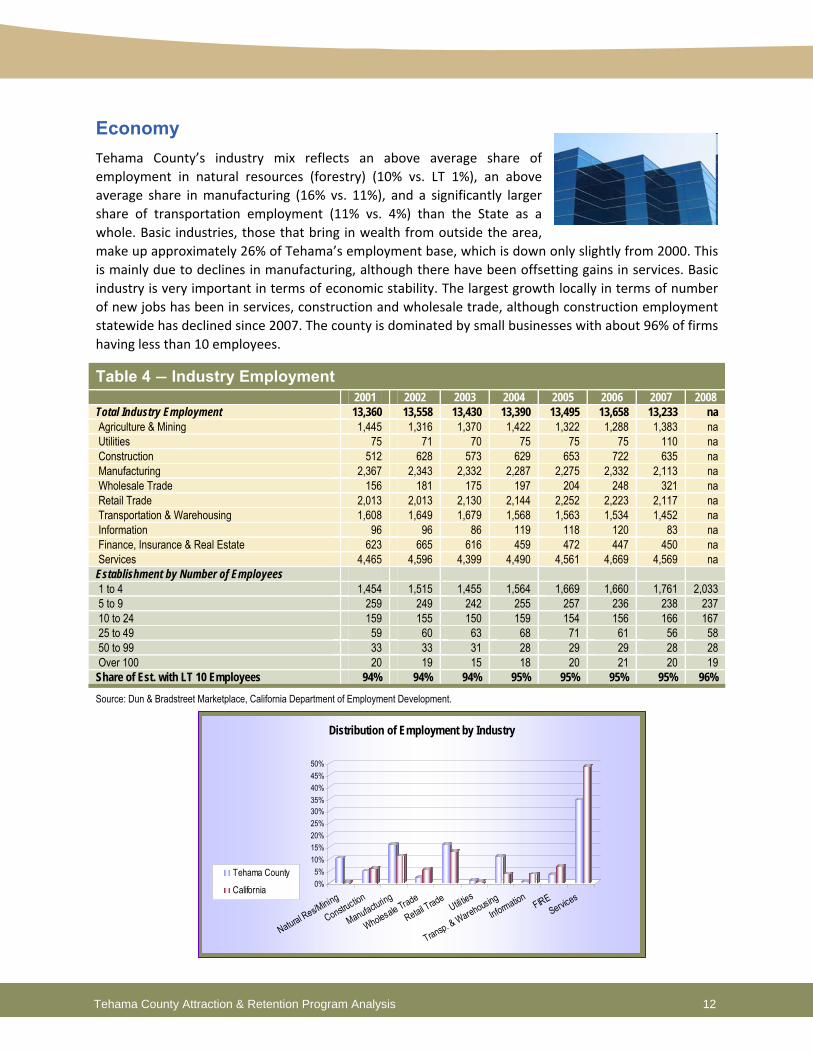
Economy Tehama County’s industry mix reflects an above average share of employment in natural resources (forestry) (10% vs. LT 1%), an above average share in manufacturing (16% vs. 11%), and a significantly larger share of transportation employment (11% vs. 4%) than the State as a whole. Basic industries, those that bring in wealth from outside the area, make up approximately 26% of Tehama’s employment base, which is down only slightly from 2000. This is mainly due to declines in manufacturing, although there have been offsetting gains in services. Basic industry is very important in terms of economic stability. The largest growth locally in terms of number of new jobs has been in services, construction and wholesale trade, although construction employment statewide has declined since 2007. The county is dominated by small businesses with about 96% of firms having less than 10 employees.
Table 4 ― Industry Employment 2001 2002 2003 2004 2005 2006 2007 2008
Total Industry Employment 13,360 13,558 13,430 13,390 13,495 13,658 13,233 na Agriculture & Mining 1,445 1,316 1,370 1,422 1,322 1,288 1,383 na Utilities 75 71 70 75 75 75 110 na Construction 512 628 573 629 653 722 635 na Manufacturing 2,367 2,343 2,332 2,287 2,275 2,332 2,113 na Wholesale Trade 156 181 175 197 204 248 321 na Retail Trade 2,013 2,013 2,130 2,144 2,252 2,223 2,117 na Transportation & Warehousing 1,608 1,649 1,679 1,568 1,563 1,534 1,452 na Information 96 96 86 119 118 120 83 na Finance, Insurance & Real Estate 623 665 616 459 472 447 450 na Services 4,465 4,596 4,399 4,490 4,561 4,669 4,569 na Establishment by Number of Employees 1 to 4 1,454 1,515 1,455 1,564 1,669 1,660 1,761 2,033 5 to 9 259 249 242 255 257 236 238 237 10 to 24 159 155 150 159 154 156 166 167 25 to 49 59 60 63 68 71 61 56 58 50 to 99 33 33 31 28 29 29 28 28 Over 100 20 19 15 18 20 21 20 19 Share of Est. with LT 10 Employees 94% 94% 94% 95% 95% 95% 95% 96%
Source: Dun & Bradstreet Marketplace, California Department of Employment Development.
0%5%
10%15%20%25%30%35%40%45%50%
Natural Res/Mining
Construction
Manufacturing
Wholesale Trade
Retail TradeUtilitie
s
Transp. & WarehousingInformation
FIREServices
Distribution of Employment by Industry
Tehama County
California
13 Tehama County Attraction & Retention Program Analysis 13
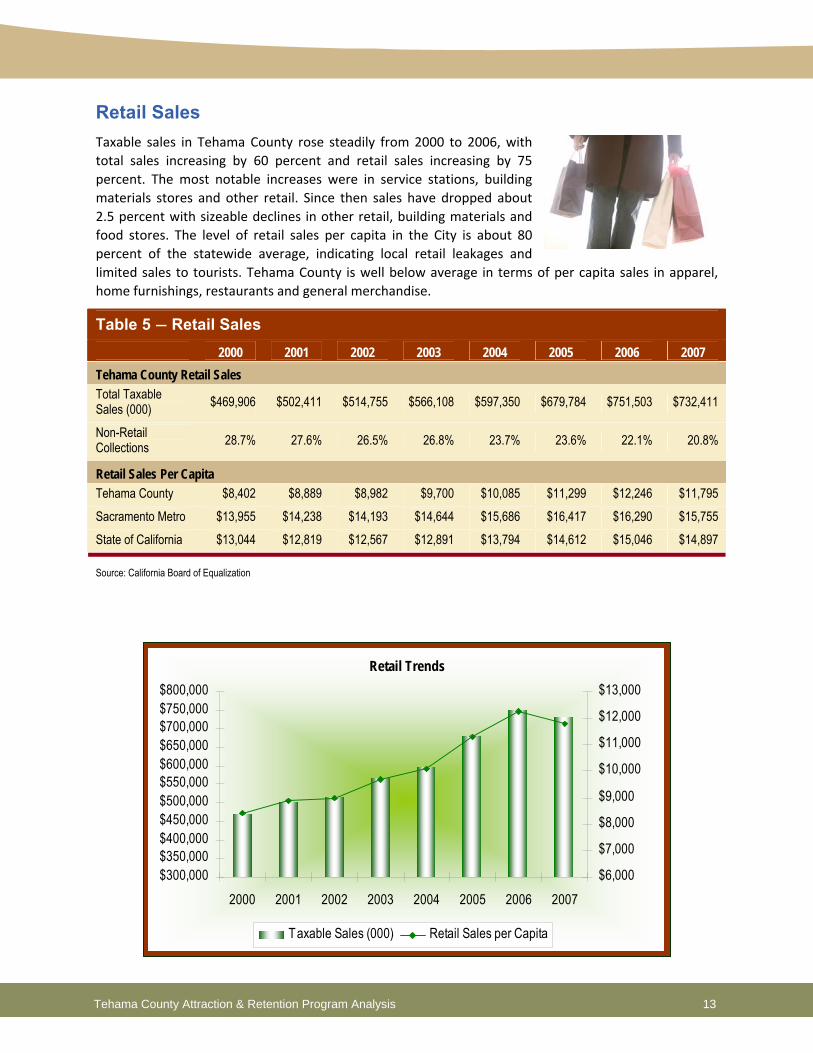
Retail Sales Taxable sales in Tehama County rose steadily from 2000 to 2006, with total sales increasing by 60 percent and retail sales increasing by 75 percent. The most notable increases were in service stations, building materials stores and other retail. Since then sales have dropped about 2.5 percent with sizeable declines in other retail, building materials and food stores. The level of retail sales per capita in the City is about 80 percent of the statewide average, indicating local retail leakages and limited sales to tourists. Tehama County is well below average in terms of per capita sales in apparel, home furnishings, restaurants and general merchandise.
Table 5 ― Retail Sales 2000 2001 2002 2003 2004 2005 2006 2007
Tehama County Retail Sales Total Taxable Sales (000) $469,906 $502,411 $514,755 $566,108 $597,350 $679,784 $751,503 $732,411
Non-Retail Collections 28.7% 27.6% 26.5% 26.8% 23.7% 23.6% 22.1% 20.8%
Retail Sales Per Capita Tehama County $8,402 $8,889 $8,982 $9,700 $10,085 $11,299 $12,246 $11,795 Sacramento Metro $13,955 $14,238 $14,193 $14,644 $15,686 $16,417 $16,290 $15,755 State of California $13,044 $12,819 $12,567 $12,891 $13,794 $14,612 $15,046 $14,897
Source: California Board of Equalization
Retail Trends
$300,000$350,000$400,000$450,000$500,000$550,000$600,000$650,000$700,000$750,000$800,000
2000 2001 2002 2003 2004 2005 2006 2007$6,000
$7,000
$8,000
$9,000
$10,000
$11,000
$12,000
$13,000
Taxable Sales (000) Retail Sales per Capita
14 Tehama County Attraction & Retention Program Analysis 14
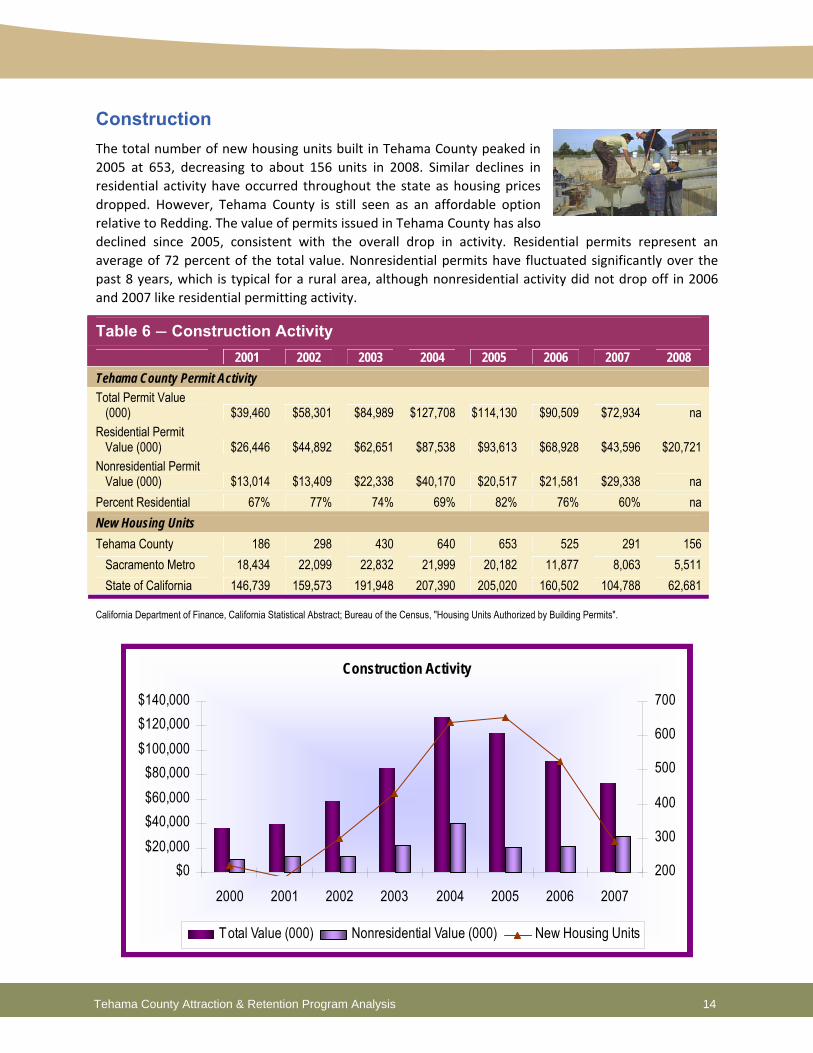
Construction The total number of new housing units built in Tehama County peaked in 2005 at 653, decreasing to about 156 units in 2008. Similar declines in residential activity have occurred throughout the state as housing prices dropped. However, Tehama County is still seen as an affordable option relative to Redding. The value of permits issued in Tehama County has also declined since 2005, consistent with the overall drop in activity. Residential permits represent an average of 72 percent of the total value. Nonresidential permits have fluctuated significantly over the past 8 years, which is typical for a rural area, although nonresidential activity did not drop off in 2006 and 2007 like residential permitting activity.
Table 6 ― Construction Activity 2001 2002 2003 2004 2005 2006 2007 2008
Tehama County Permit Activity Total Permit Value
(000) $39,460 $58,301 $84,989 $127,708 $114,130 $90,509 $72,934 na Residential Permit
Value (000) $26,446 $44,892 $62,651 $87,538 $93,613 $68,928 $43,596 $20,721 Nonresidential Permit
Value (000) $13,014 $13,409 $22,338 $40,170 $20,517 $21,581 $29,338 na Percent Residential 67% 77% 74% 69% 82% 76% 60% na New Housing Units Tehama County 186 298 430 640 653 525 291 156
Sacramento Metro 18,434 22,099 22,832 21,999 20,182 11,877 8,063 5,511 State of California 146,739 159,573 191,948 207,390 205,020 160,502 104,788 62,681
California Department of Finance, California Statistical Abstract; Bureau of the Census, "Housing Units Authorized by Building Permits".
Construction Activity
$0$20,000$40,000$60,000$80,000
$100,000$120,000$140,000
2000 2001 2002 2003 2004 2005 2006 2007200
300
400
500
600
700
Total Value (000) Nonresidential Value (000) New Housing Units
15 Tehama County Attraction & Retention Program Analysis 15
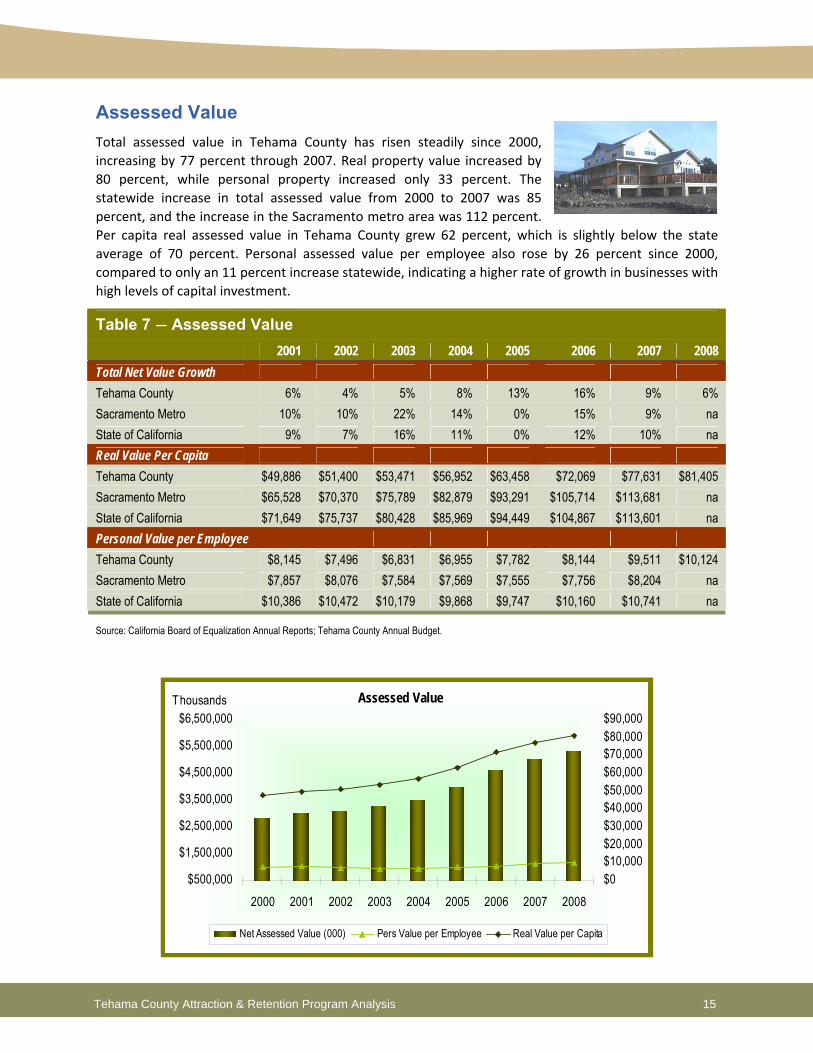
Assessed Value Total assessed value in Tehama County has risen steadily since 2000, increasing by 77 percent through 2007. Real property value increased by 80 percent, while personal property increased only 33 percent. The statewide increase in total assessed value from 2000 to 2007 was 85 percent, and the increase in the Sacramento metro area was 112 percent. Per capita real assessed value in Tehama County grew 62 percent, which is slightly below the state average of 70 percent. Personal assessed value per employee also rose by 26 percent since 2000, compared to only an 11 percent increase statewide, indicating a higher rate of growth in businesses with high levels of capital investment.
Table 7 ― Assessed Value 2001 2002 2003 2004 2005 2006 2007 2008 Total Net Value Growth Tehama County 6% 4% 5% 8% 13% 16% 9% 6% Sacramento Metro 10% 10% 22% 14% 0% 15% 9% na State of California 9% 7% 16% 11% 0% 12% 10% na Real Value Per Capita Tehama County $49,886 $51,400 $53,471 $56,952 $63,458 $72,069 $77,631 $81,405 Sacramento Metro $65,528 $70,370 $75,789 $82,879 $93,291 $105,714 $113,681 na State of California $71,649 $75,737 $80,428 $85,969 $94,449 $104,867 $113,601 na Personal Value per Employee Tehama County $8,145 $7,496 $6,831 $6,955 $7,782 $8,144 $9,511 $10,124 Sacramento Metro $7,857 $8,076 $7,584 $7,569 $7,555 $7,756 $8,204 na State of California $10,386 $10,472 $10,179 $9,868 $9,747 $10,160 $10,741 na
Source: California Board of Equalization Annual Reports; Tehama County Annual Budget.
Assessed Value
$500,000
$1,500,000
$2,500,000
$3,500,000
$4,500,000
$5,500,000
$6,500,000
2000 2001 2002 2003 2004 2005 2006 2007 2008$0$10,000$20,000$30,000$40,000$50,000$60,000$70,000$80,000$90,000
Net Assessed Value (000) Pers Value per Employee Real Value per Capita
Thousands
16 Tehama County Attraction & Retention Program Analysis 16
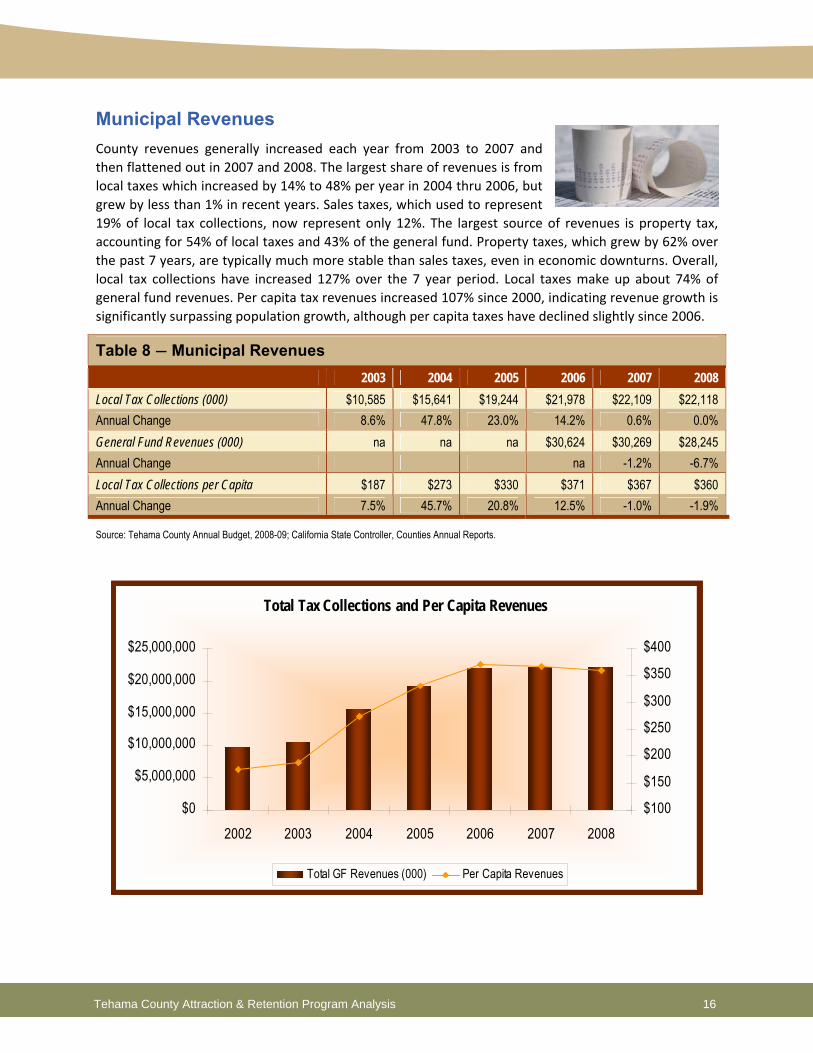
Municipal Revenues County revenues generally increased each year from 2003 to 2007 and then flattened out in 2007 and 2008. The largest share of revenues is from local taxes which increased by 14% to 48% per year in 2004 thru 2006, but grew by less than 1% in recent years. Sales taxes, which used to represent 19% of local tax collections, now represent only 12%. The largest source of revenues is property tax, accounting for 54% of local taxes and 43% of the general fund. Property taxes, which grew by 62% over the past 7 years, are typically much more stable than sales taxes, even in economic downturns. Overall, local tax collections have increased 127% over the 7 year period. Local taxes make up about 74% of general fund revenues. Per capita tax revenues increased 107% since 2000, indicating revenue growth is significantly surpassing population growth, although per capita taxes have declined slightly since 2006.
Table 8 ― Municipal Revenues 2003 2004 2005 2006 2007 2008 Local Tax Collections (000) $10,585 $15,641 $19,244 $21,978 $22,109 $22,118 Annual Change 8.6% 47.8% 23.0% 14.2% 0.6% 0.0% General Fund Revenues (000) na na na $30,624 $30,269 $28,245 Annual Change na -1.2% -6.7% Local Tax Collections per Capita $187 $273 $330 $371 $367 $360 Annual Change 7.5% 45.7% 20.8% 12.5% -1.0% -1.9%
Source: Tehama County Annual Budget, 2008-09; California State Controller, Counties Annual Reports.
Total Tax Collections and Per Capita Revenues
$0
$5,000,000
$10,000,000
$15,000,000
$20,000,000
$25,000,000
2002 2003 2004 2005 2006 2007 2008$100
$150
$200
$250
$300
$350
$400
Total GF Revenues (000) Per Capita Revenues
17 Tehama County Attraction & Retention Program Analysis 17
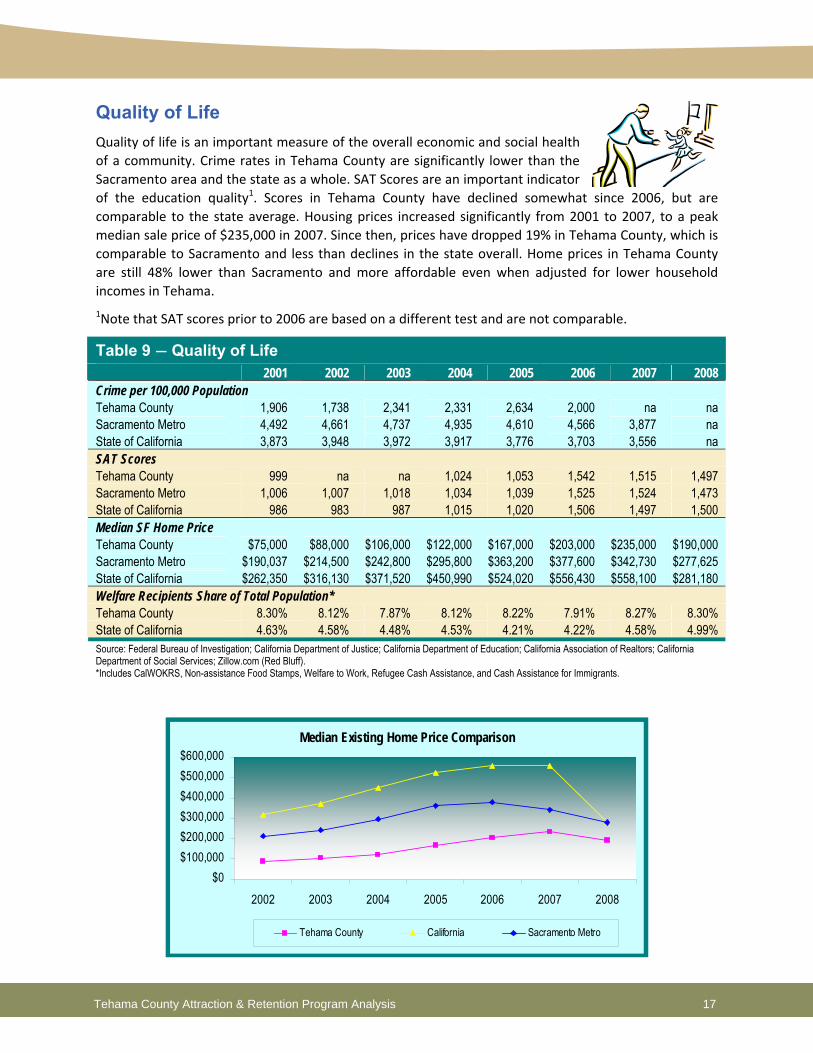
Quality of Life Quality of life is an important measure of the overall economic and social health of a community. Crime rates in Tehama County are significantly lower than the Sacramento area and the state as a whole. SAT Scores are an important indicator of the education quality1. Scores in Tehama County have declined somewhat since 2006, but are comparable to the state average. Housing prices increased significantly from 2001 to 2007, to a peak median sale price of $235,000 in 2007. Since then, prices have dropped 19% in Tehama County, which is comparable to Sacramento and less than declines in the state overall. Home prices in Tehama County are still 48% lower than Sacramento and more affordable even when adjusted for lower household incomes in Tehama.
1Note that SAT scores prior to 2006 are based on a different test and are not comparable.
Table 9 ― Quality of Life 2001 2002 2003 2004 2005 2006 2007 2008 Crime per 100,000 Population Tehama County 1,906 1,738 2,341 2,331 2,634 2,000 na na Sacramento Metro 4,492 4,661 4,737 4,935 4,610 4,566 3,877 na State of California 3,873 3,948 3,972 3,917 3,776 3,703 3,556 na SAT Scores Tehama County 999 na na 1,024 1,053 1,542 1,515 1,497 Sacramento Metro 1,006 1,007 1,018 1,034 1,039 1,525 1,524 1,473 State of California 986 983 987 1,015 1,020 1,506 1,497 1,500 Median SF Home Price Tehama County $75,000 $88,000 $106,000 $122,000 $167,000 $203,000 $235,000 $190,000 Sacramento Metro $190,037 $214,500 $242,800 $295,800 $363,200 $377,600 $342,730 $277,625 State of California $262,350 $316,130 $371,520 $450,990 $524,020 $556,430 $558,100 $281,180 Welfare Recipients Share of Total Population* Tehama County 8.30% 8.12% 7.87% 8.12% 8.22% 7.91% 8.27% 8.30% State of California 4.63% 4.58% 4.48% 4.53% 4.21% 4.22% 4.58% 4.99% Source: Federal Bureau of Investigation; California Department of Justice; California Department of Education; California Association of Realtors; California Department of Social Services; Zillow.com (Red Bluff). *Includes CalWOKRS, Non-assistance Food Stamps, Welfare to Work, Refugee Cash Assistance, and Cash Assistance for Immigrants.
Median Existing Home Price Comparison
$0$100,000$200,000$300,000$400,000$500,000$600,000
2002 2003 2004 2005 2006 2007 2008
Tehama County California Sacramento Metro

18 Tehama County Attraction & Retention Program Analysis 18
Existing Basic Industry Cluster Identifying concentrations of exporting businesses, those businesses producing products or services sold and distributed outside of the county, is part of the overall economy analysis. Existing industry clusters are industries that already have an established presence in the community and region including a developed supplier network. These industries are typically the focus of expansion and retention efforts as they provide the largest concentration to the economic base.
These basic industry clusters are also net exporters—i.e. they bring new wealth into the local economy. The high location quotients indicate that there is a higher concentration of these industries than is needed to serve the local market, and thus these industries primarily sell goods and services outside the local area.
The jobs and payroll that these basic industry clusters support in turn create demand for local serving businesses.
Historic Growth 2007 2007 ManufgEmployment 2001-07 Local Local Capacity Location
NAICS Description 2001 2007 Absolute Percent Firms Avg Wage Employment Output Utilization QuotientAgriculture and Food Processing
111000 Crop production 976 870 -106 -11% 107 $23,100 -1.80% 1.50% 13.28112000 Animal production 187 113 -74 -40% 33 $24,273 -1.80% 1.50% 4.46115000 Agriculture and forestry support activities 266 238 -28 -11% 25 $27,098 0.70% 3.40% 6.18311225 Fats and oils refining and blending 0 7 7 700% 1 $51,625 -1.60% 1.80% 79% 10.24311421 Fruit and vegetable canning 255 303 48 19% 1 $40,999 -1.30% 2.30% 49% 38.39311423 Dried and dehydrated food manufacturing 5 3 -2 -40% 2 $43,194 -1.30% 2.30% 73% 2.24424450 Confectionery Merchant Wholesalers 0 68 68 6800% 2 $22,758 0.70% 5.00% 11.53424520 Livestock Merchant Wholesalers 2 6 4 200% 2 $11,613 0.70% 5.00% 2.39424590 Other Farm Product Raw Material Wholesalers 0 21 21 2100% 1 $31,751 0.70% 5.00% 19.25423820 Farm and Garden Machinery Wholesalers 26 37 11 42% 1 $34,624 0.70% 5.00% 3.08221310 Water supply and irrigation systems 68 14 -54 -79% 5 $15,247 1.70% 2.70% 3.34
Forestry and Wood Products113200 Forest nursery and gathering forest products 0 23 23 2300% 1 $33,092 -2.90% 1.70% 74.56113300 Logging 132 103 -29 -22% 10 $43,823 -0.80% 1.40% 13.30321113 Sawmills 0 159 159 15900% 3 $45,722 -2.30% 0.00% 76% 12.29321911 Wood window and door manufacturing 0 651 651 65100% 1 $37,719 -0.60% 1.20% 60% 69.28321918 Other millwork, including flooring 1613 532 -1,081 -67% 0.3 $33,109 -0.60% 1.20% 70% 74.02322231 Die-cut paper office supplies manufacturing 126 61 -65 -52% 1 $50,121 -2.00% -0.30% 71% 46.50337129 Wood TV, radio, and sewing machine housings 0 1 1 100% 1 $34,669 -0.80% 1.20% 51% 3.25337212 Custom architectural woodwork and millwork 0 37 37 3700% 2 $46,046 -0.70% 2.00% 75% 17.93811310 Commercial machinery repair and maintenance 48 46 -2 -4% 6 $46,759 0.70% 4.40% 2.30
Miscellaneous Manufacturing326130 Laminated plastics plate, sheet, and shapes 7 28 21 300% 1 $43,711 0.20% 4.10% 63% 12.07331491 Nonferrous metal, except CU and AL, shaping 0 29 29 2900% 1 $47,825 -3.70% 0.20% 79% 16.98333922 Conveyor and conveying equipment mfg. 0 22 22 2200% 1 $57,601 -1.00% 1.70% 62% 6.30334290 Other communications equipment manufacturing 0 47 47 4700% 1 $101,168 0.00% 4.10% 68% 15.11335121 Residential electric lighting fixture mfg. 0 26 26 2600% 1 $49,586 -3.20% 0.60% 72% 16.50339911 Jewelry, except costume, manufacturing 37 7 -30 -81% 1 $18,475 -1.80% 3.80% 62% 2.01339942 Lead pencil and art good manufacturing 0 34 34 3400% 1 $21,974 -1.80% 3.80% 75% 35.59
Construction Suppliers423320 Brick, Stone and Construction Material Wholesalers 3 26 23 767% 2 $25,372 0.70% 5.00% 3.68423810 Construction and Mining Machinery Wholesalers 4 31 27 675% 1 $38,678 0.70% 5.00% 3.10
Logistics484121 General freight trucking, long-distance TL 83 301 218 263% 6 $62,666 1.00% 2.60% 4.85484220 Other specialized trucking, local 138 122 -16 -12% 11 $38,074 1.00% 2.60% 5.13493110 General warehousing and storage 10 741 731 7310% 5 $32,707 2.10% 3.80% 12.71
Professional and Technical Services541620 Environmental consulting services 1 26 25 2500% 1 $24,779 5.90% 6.40% 3.17541690 Other technical consulting services 9 42 33 367% 14 $32,035 5.90% 6.40% 4.01Source: IMPLAN ES202 data for Tehama County.
U.S. Growth 2006-2016
Existing industry clusters include basic industries with location quotients of 2 or more, meaning that the local concentration of these industries is more than twice the national average.
EXISTING BASIC INDUSTRY CLUSTERSTEHAMA COUNTY
Tehama Projected Annual
19 Tehama County Attraction & Retention Program Analysis 19
1.2 Retail Market Overview Given Tehama County’s location on I‐5 and the visitor opportunities within the county and the surrounding area, the retail market and related sales tax from expenditures is important to the local economy. This segment of the analysis looks at the retail sales potential.
Retail sales are consumer oriented and are typically generated from:
Local full‐time residents
Area employees/businesses
Visitors
Pass‐through traffic
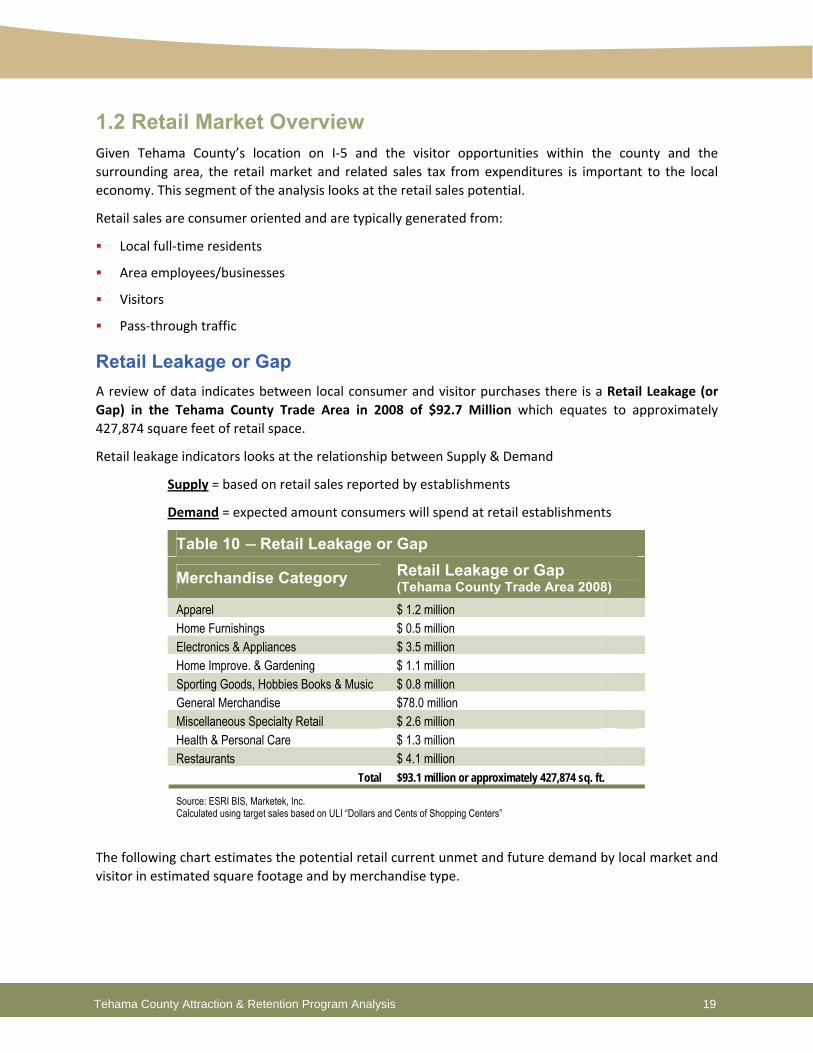
Retail Leakage or Gap A review of data indicates between local consumer and visitor purchases there is a Retail Leakage (or Gap) in the Tehama County Trade Area in 2008 of $92.7 Million which equates to approximately 427,874 square feet of retail space.
Retail leakage indicators looks at the relationship between Supply & Demand
Supply = based on retail sales reported by establishments
Demand = expected amount consumers will spend at retail establishments
Table 10 ― Retail Leakage or Gap
Merchandise Category Retail Leakage or Gap (Tehama County Trade Area 2008)
Apparel $ 1.2 million Home Furnishings $ 0.5 million Electronics & Appliances $ 3.5 million Home Improve. & Gardening $ 1.1 million Sporting Goods, Hobbies Books & Music $ 0.8 million General Merchandise $78.0 million Miscellaneous Specialty Retail $ 2.6 million Health & Personal Care $ 1.3 million Restaurants $ 4.1 million
Total $93.1 million or approximately 427,874 sq. ft.
Source: ESRI BIS, Marketek, Inc. Calculated using target sales based on ULI “Dollars and Cents of Shopping Centers”
The following chart estimates the potential retail current unmet and future demand by local market and visitor in estimated square footage and by merchandise type.
20 Tehama County Attraction & Retention Program Analysis 20
Table 11 ― Retail Market Potential ― Tehama County, 2009 - 2019
Merchandise Type Existing Unmet
Demand (Sf)
Future Market Area Demand (Sf)
Future Visitor
Demand (Sf) Total Potential New
Space (Sf)
Shopper Goods 408,903 66,148 25,653 500,704 Convenience Goods 3,454 36,113 5,683 45,250 Restaurants 15,516 24,820 44,465 84,801 Entertainment n/a 7,769 41,044 48,814 Personal Services n/a 10,724 --- 10,724 Total 427,874 145,574 116,845 690,293
Source: ESRI BIS; Urban Land Institute; Marketek, Inc.
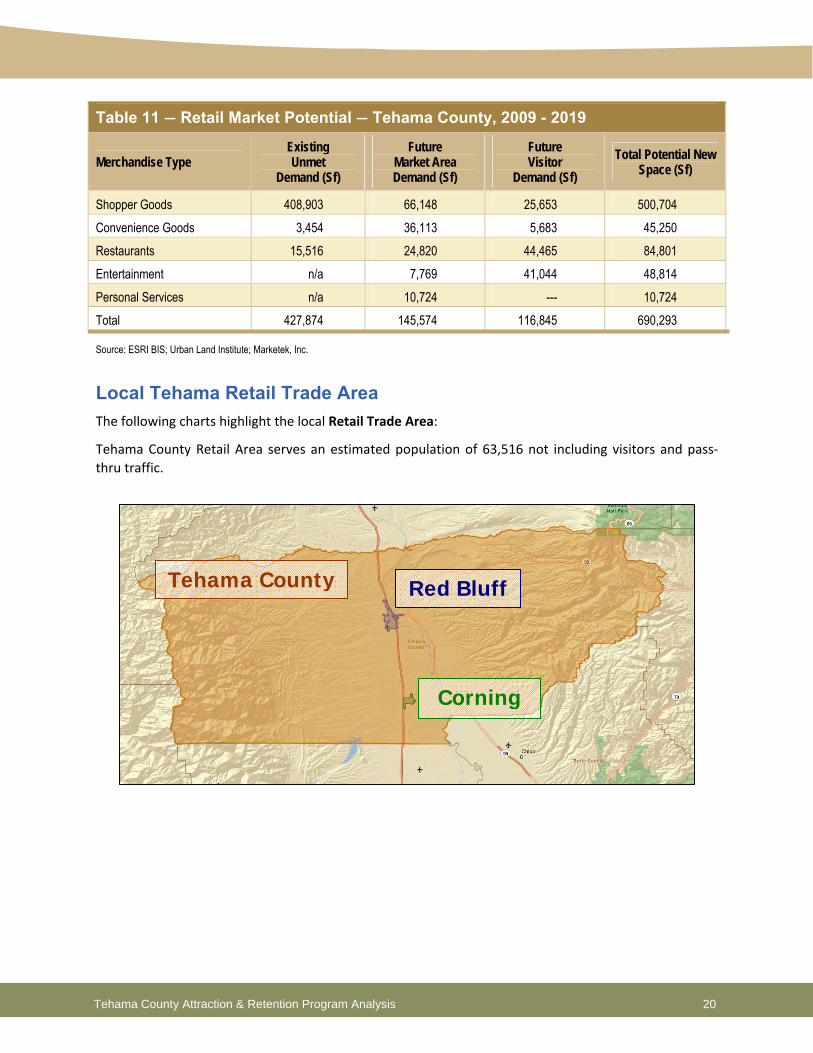
Local Tehama Retail Trade Area The following charts highlight the local Retail Trade Area:
Tehama County Retail Area serves an estimated population of 63,516 not including visitors and pass‐thru traffic.
Red Bluff
Corning
Tehama County
21 Tehama County Attraction & Retention Program Analysis 21
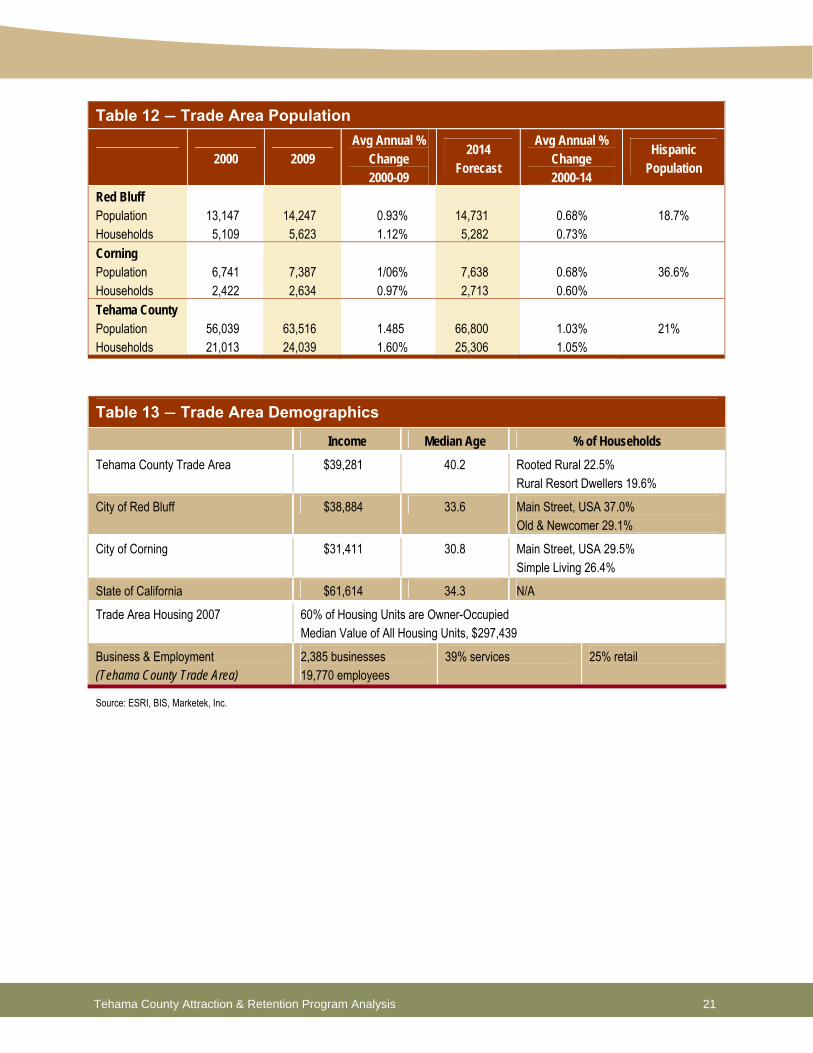
Table 12 ― Trade Area Population
2000 2009 Avg Annual %
Change 2000-09
2014 Forecast
Avg Annual % Change 2000-14
Hispanic Population
Red Bluff Population Households
13,147 5,109
14,247 5,623
0.93% 1.12%
14,731 5,282
0.68% 0.73%
18.7%
Corning Population Households
6,741 2,422
7,387 2,634
1/06% 0.97%
7,638 2,713
0.68% 0.60%
36.6%
Tehama County Population Households
56,039 21,013
63,516 24,039
1.485 1.60%
66,800 25,306
1.03% 1.05%
21%
Table 13 ― Trade Area Demographics
Income Median Age % of Households Tehama County Trade Area $39,281 40.2 Rooted Rural 22.5%
Rural Resort Dwellers 19.6%
City of Red Bluff $38,884 33.6 Main Street, USA 37.0% Old & Newcomer 29.1%
City of Corning $31,411 30.8 Main Street, USA 29.5% Simple Living 26.4%
State of California $61,614 34.3 N/A
Trade Area Housing 2007 60% of Housing Units are Owner-Occupied Median Value of All Housing Units, $297,439
Business & Employment (Tehama County Trade Area)
2,385 businesses 19,770 employees
39% services 25% retail
Source: ESRI, BIS, Marketek, Inc.
22 Tehama County Attraction & Retention Program Analysis 22
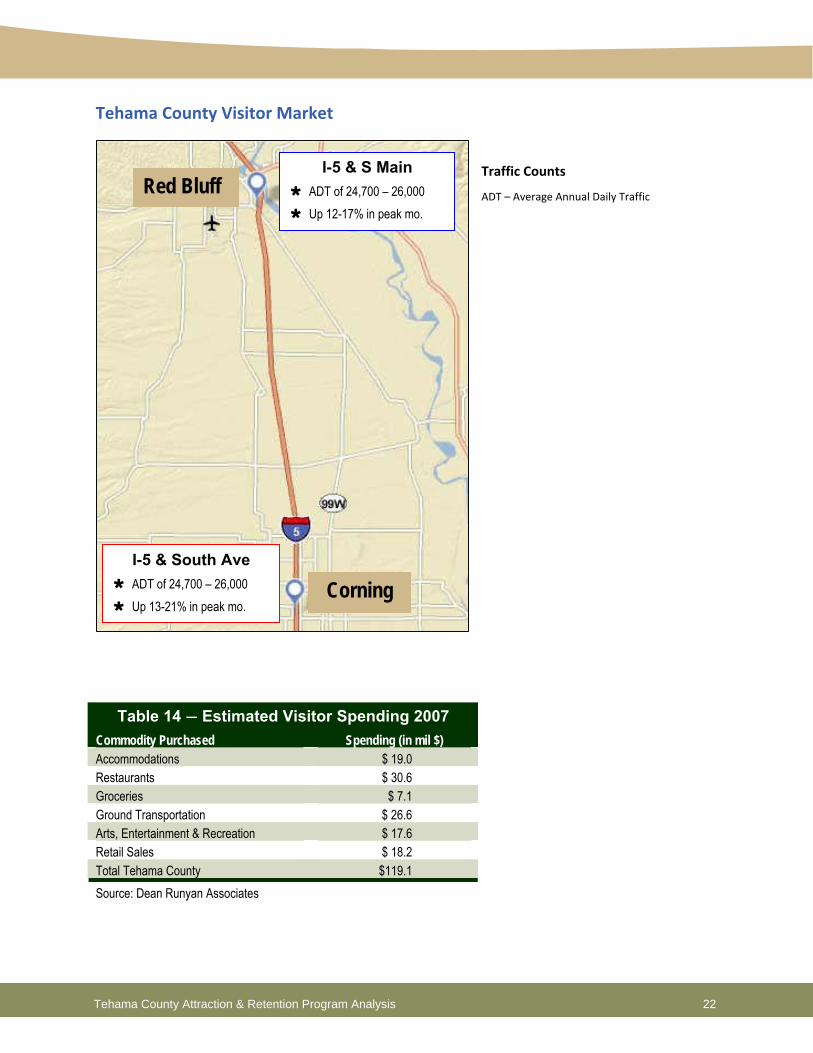
Tehama County Visitor Market
Traffic Counts
ADT – Average Annual Daily Traffic
Table 14 ― Estimated Visitor Spending 2007 Commodity Purchased Spending (in mil $) Accommodations $ 19.0 Restaurants $ 30.6 Groceries $ 7.1 Ground Transportation $ 26.6 Arts, Entertainment & Recreation $ 17.6 Retail Sales $ 18.2 Total Tehama County $119.1 Source: Dean Runyan Associates
I-5 & S Main ADT of 24,700 – 26,000 Up 12-17% in peak mo.
I-5 & South Ave ADT of 24,700 – 26,000 Up 13-21% in peak mo.
Red Bluff
Corning
23 Tehama County Attraction & Retention Program Analysis 23
1.3 Economic Development Programs Economic Development Corporations (EDCs) are most often focused on Business Attraction and/or Business Retention and Expansion programs. However, there are other activities that are considered integral parts of economic development given the community’s attributes and characteristics such as:
1. Marketing & Business Attraction
2. Business Retention & Expansion
3. Entrepreneurship & Innovation
4. Financing & Small Business Development
5. Visitor Attraction & Tourism
Downtown Retail Tourist Attractions
6. Workforce Development
7. Place Development
8. Physical sense of place
9. Infrastructure
Service Providers For Tehama County there are a number of organizations that provide services to the local businesses, city and county, including:
Tehama Economic Development Corporation (Tehama EDC) Due to lack of funding Tehama EDC has laid‐off staff and closed their doors. The Job Training Center is providing staff to maintain the organization – website, phones, responding to inquiries.
The Job Training Center Core services are workforce development assistance (e.g. recruitment, hiring, training, professional development). Job Training Center provides business services to local businesses specifically in the area of human resource (HR) functions (Job Training Center is renown throughout California for their excellent HR services and HR training). All other requests for business counseling or financing are referred to the economic development and business network, i.e., SBDC and 3Core (Tri‐County EDC).
There is an extensive outreach program to businesses for the HR services and job placement program.
Youth entrepreneurship training is also a program sponsored by the Job Training Center for young, school age, entrepreneurs.
With the closure of the Tehama EDC, Job Training Center will also manage an Incubation Program with 3Core (Tri‐County EDC), providing intensive business coaching to small entrepreneurial businesses. The program was proposed by 3Core and is funded through the Community Development Block Grant program.
24 Tehama County Attraction & Retention Program Analysis 24
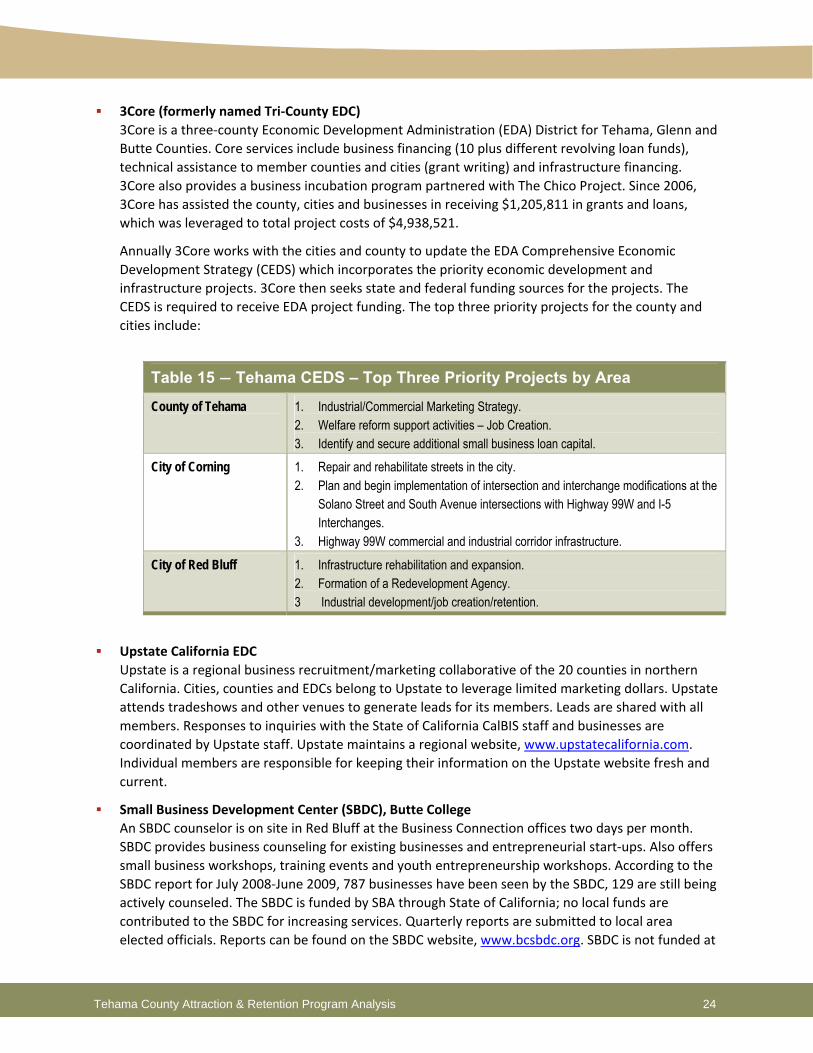
3Core (formerly named Tri‐County EDC) 3Core is a three‐county Economic Development Administration (EDA) District for Tehama, Glenn and Butte Counties. Core services include business financing (10 plus different revolving loan funds), technical assistance to member counties and cities (grant writing) and infrastructure financing. 3Core also provides a business incubation program partnered with The Chico Project. Since 2006, 3Core has assisted the county, cities and businesses in receiving $1,205,811 in grants and loans, which was leveraged to total project costs of $4,938,521.
Annually 3Core works with the cities and county to update the EDA Comprehensive Economic Development Strategy (CEDS) which incorporates the priority economic development and infrastructure projects. 3Core then seeks state and federal funding sources for the projects. The CEDS is required to receive EDA project funding. The top three priority projects for the county and cities include:
Table 15 ― Tehama CEDS – Top Three Priority Projects by Area
County of Tehama 1. Industrial/Commercial Marketing Strategy. 2. Welfare reform support activities – Job Creation. 3. Identify and secure additional small business loan capital.
City of Corning 1. Repair and rehabilitate streets in the city. 2. Plan and begin implementation of intersection and interchange modifications at the
Solano Street and South Avenue intersections with Highway 99W and I-5 Interchanges.
3. Highway 99W commercial and industrial corridor infrastructure.
City of Red Bluff 1. Infrastructure rehabilitation and expansion. 2. Formation of a Redevelopment Agency. 3 Industrial development/job creation/retention.
Upstate California EDC Upstate is a regional business recruitment/marketing collaborative of the 20 counties in northern California. Cities, counties and EDCs belong to Upstate to leverage limited marketing dollars. Upstate attends tradeshows and other venues to generate leads for its members. Leads are shared with all members. Responses to inquiries with the State of California CalBIS staff and businesses are coordinated by Upstate staff. Upstate maintains a regional website, www.upstatecalifornia.com. Individual members are responsible for keeping their information on the Upstate website fresh and current.
Small Business Development Center (SBDC), Butte College An SBDC counselor is on site in Red Bluff at the Business Connection offices two days per month. SBDC provides business counseling for existing businesses and entrepreneurial start‐ups. Also offers small business workshops, training events and youth entrepreneurship workshops. According to the SBDC report for July 2008‐June 2009, 787 businesses have been seen by the SBDC, 129 are still being actively counseled. The SBDC is funded by SBA through State of California; no local funds are contributed to the SBDC for increasing services. Quarterly reports are submitted to local area elected officials. Reports can be found on the SBDC website, www.bcsbdc.org. SBDC is not funded at

25 Tehama County Attraction & Retention Program Analysis 25
the local level.
Center for Economic Development (CED) The Center for Economic Development provides technical assistance, training, applied research and other support services (i.e. market analysis, professional development workshops, etc.) to businesses and local governments. CED produces an annual economic profile of all 20 counties in their service area, hosts a workshop series, economic forecast conference and is the lead on a broadband initiative.
Other entities providing services include: Rolling Hills Casino – Since the closure of the Tehama EDC, the Casino coordinates and manages
the Tehama Trails initiative. To date, the Casino, working with the Tehama Trails partners has developed a business plan, finalized and printed 25,000 brochures and distributed these brochures to partners, local hotels and visitor sites, and secured a new web address – www.Tehamatrails.com.
Golden Capital Network (GCN) – as part of the Northern California WIRED initiative, GCN provides workshops, counseling/mentoring and access to angel and venture capital. GCN is part of a national angel and venture capital network tapping a rich source of business expertise and brain trust that may not be available in the north state.
Superior California EDD – Provides access to various loan programs.
SBDC, Shasta College – In addition to Butte College SBDC, the Shasta College SBDC also provides workshops and counseling.
Red Bluff Chamber of Commerce and Tehama County Convention & Visitors Bureau – provides business networking opportunities and visitor promotion.
Corning Chamber of Commerce ‐ provides business networking opportunities and visitor promotion.
26 Tehama County Attraction & Retention Program Analysis 26
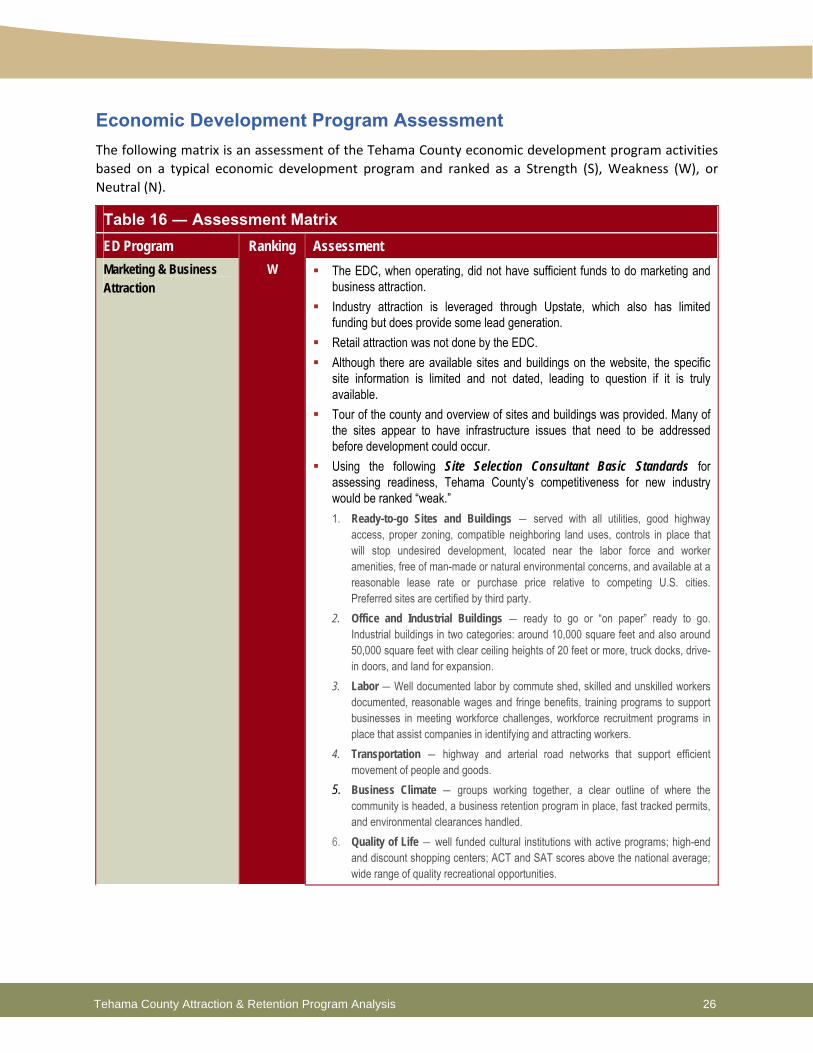
Economic Development Program Assessment The following matrix is an assessment of the Tehama County economic development program activities based on a typical economic development program and ranked as a Strength (S), Weakness (W), or Neutral (N).
Table 16 ― Assessment Matrix
ED Program Ranking Assessment Marketing & Business Attraction
W The EDC, when operating, did not have sufficient funds to do marketing and business attraction.
Industry attraction is leveraged through Upstate, which also has limited funding but does provide some lead generation.
Retail attraction was not done by the EDC. Although there are available sites and buildings on the website, the specific
site information is limited and not dated, leading to question if it is truly available.
Tour of the county and overview of sites and buildings was provided. Many of the sites appear to have infrastructure issues that need to be addressed before development could occur.
Using the following Site Selection Consultant Basic Standards for assessing readiness, Tehama County’s competitiveness for new industry would be ranked “weak.” 1. Ready-to-go Sites and Buildings ― served with all utilities, good highway
access, proper zoning, compatible neighboring land uses, controls in place that will stop undesired development, located near the labor force and worker amenities, free of man-made or natural environmental concerns, and available at a reasonable lease rate or purchase price relative to competing U.S. cities. Preferred sites are certified by third party.
2. Office and Industrial Buildings ― ready to go or “on paper” ready to go. Industrial buildings in two categories: around 10,000 square feet and also around 50,000 square feet with clear ceiling heights of 20 feet or more, truck docks, drive-in doors, and land for expansion.
3. Labor ― Well documented labor by commute shed, skilled and unskilled workers documented, reasonable wages and fringe benefits, training programs to support businesses in meeting workforce challenges, workforce recruitment programs in place that assist companies in identifying and attracting workers.
4. Transportation ― highway and arterial road networks that support efficient movement of people and goods.
5. Business Climate ― groups working together, a clear outline of where the community is headed, a business retention program in place, fast tracked permits, and environmental clearances handled.
6. Quality of Life ― well funded cultural institutions with active programs; high-end and discount shopping centers; ACT and SAT scores above the national average; wide range of quality recreational opportunities.
27 Tehama County Attraction & Retention Program Analysis 27
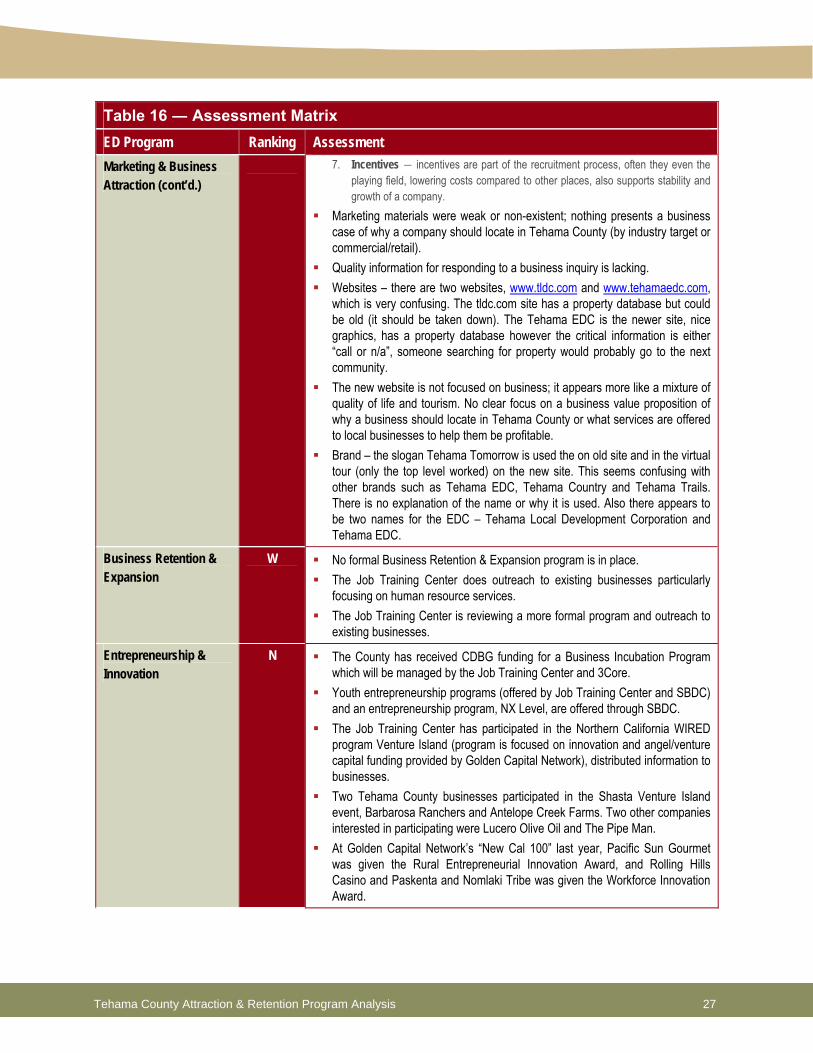
Table 16 ― Assessment Matrix
ED Program Ranking Assessment Marketing & Business Attraction (cont’d.)
7. Incentives ― incentives are part of the recruitment process, often they even the playing field, lowering costs compared to other places, also supports stability and growth of a company.
Marketing materials were weak or non-existent; nothing presents a business case of why a company should locate in Tehama County (by industry target or commercial/retail).
Quality information for responding to a business inquiry is lacking. Websites – there are two websites, www.tldc.com and www.tehamaedc.com,
which is very confusing. The tldc.com site has a property database but could be old (it should be taken down). The Tehama EDC is the newer site, nice graphics, has a property database however the critical information is either “call or n/a”, someone searching for property would probably go to the next community.
The new website is not focused on business; it appears more like a mixture of quality of life and tourism. No clear focus on a business value proposition of why a business should locate in Tehama County or what services are offered to local businesses to help them be profitable.
Brand – the slogan Tehama Tomorrow is used the on old site and in the virtual tour (only the top level worked) on the new site. This seems confusing with other brands such as Tehama EDC, Tehama Country and Tehama Trails. There is no explanation of the name or why it is used. Also there appears to be two names for the EDC – Tehama Local Development Corporation and Tehama EDC.
Business Retention & Expansion
W No formal Business Retention & Expansion program is in place. The Job Training Center does outreach to existing businesses particularly
focusing on human resource services. The Job Training Center is reviewing a more formal program and outreach to
existing businesses.
Entrepreneurship & Innovation
N The County has received CDBG funding for a Business Incubation Program which will be managed by the Job Training Center and 3Core.
Youth entrepreneurship programs (offered by Job Training Center and SBDC) and an entrepreneurship program, NX Level, are offered through SBDC.
The Job Training Center has participated in the Northern California WIRED program Venture Island (program is focused on innovation and angel/venture capital funding provided by Golden Capital Network), distributed information to businesses.
Two Tehama County businesses participated in the Shasta Venture Island event, Barbarosa Ranchers and Antelope Creek Farms. Two other companies interested in participating were Lucero Olive Oil and The Pipe Man.
At Golden Capital Network’s “New Cal 100” last year, Pacific Sun Gourmet was given the Rural Entrepreneurial Innovation Award, and Rolling Hills Casino and Paskenta and Nomlaki Tribe was given the Workforce Innovation Award.
28 Tehama County Attraction & Retention Program Analysis 28
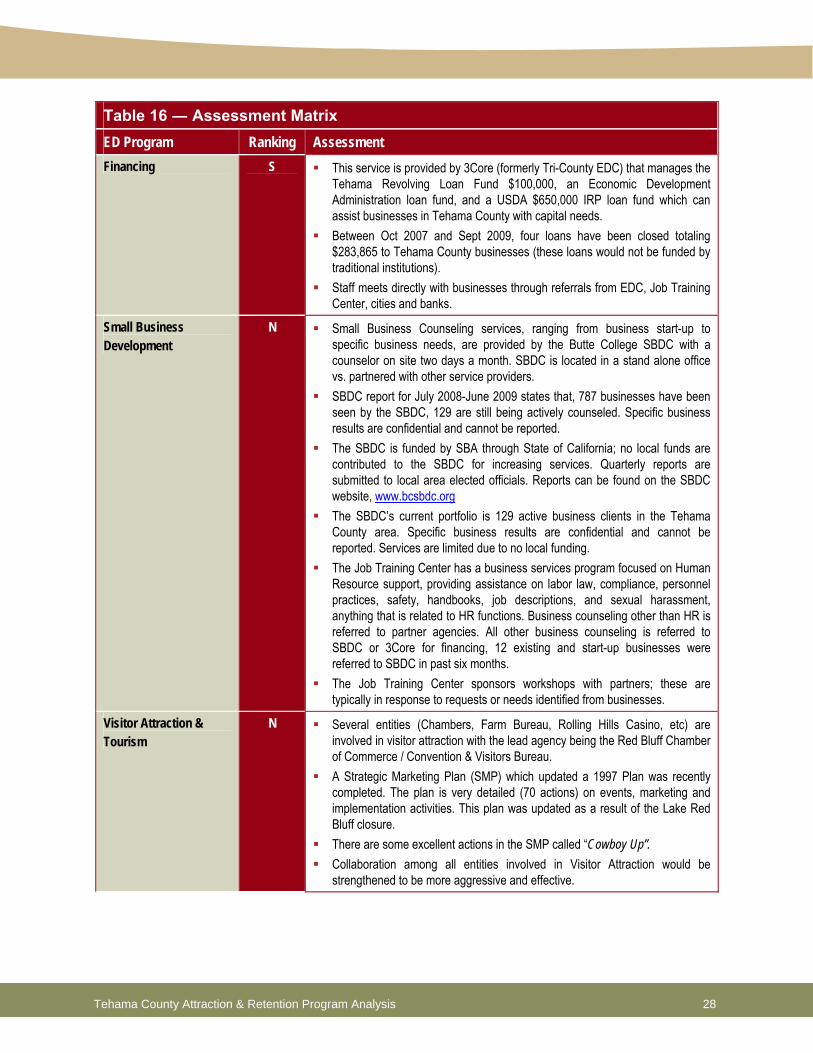
Table 16 ― Assessment Matrix
ED Program Ranking Assessment Financing S This service is provided by 3Core (formerly Tri-County EDC) that manages the
Tehama Revolving Loan Fund $100,000, an Economic Development Administration loan fund, and a USDA $650,000 IRP loan fund which can assist businesses in Tehama County with capital needs.
Between Oct 2007 and Sept 2009, four loans have been closed totaling $283,865 to Tehama County businesses (these loans would not be funded by traditional institutions).
Staff meets directly with businesses through referrals from EDC, Job Training Center, cities and banks.
Small Business Development
N Small Business Counseling services, ranging from business start-up to specific business needs, are provided by the Butte College SBDC with a counselor on site two days a month. SBDC is located in a stand alone office vs. partnered with other service providers.
SBDC report for July 2008-June 2009 states that, 787 businesses have been seen by the SBDC, 129 are still being actively counseled. Specific business results are confidential and cannot be reported.
The SBDC is funded by SBA through State of California; no local funds are contributed to the SBDC for increasing services. Quarterly reports are submitted to local area elected officials. Reports can be found on the SBDC website, www.bcsbdc.org
The SBDC’s current portfolio is 129 active business clients in the Tehama County area. Specific business results are confidential and cannot be reported. Services are limited due to no local funding.
The Job Training Center has a business services program focused on Human Resource support, providing assistance on labor law, compliance, personnel practices, safety, handbooks, job descriptions, and sexual harassment, anything that is related to HR functions. Business counseling other than HR is referred to partner agencies. All other business counseling is referred to SBDC or 3Core for financing, 12 existing and start-up businesses were referred to SBDC in past six months.
The Job Training Center sponsors workshops with partners; these are typically in response to requests or needs identified from businesses.
Visitor Attraction & Tourism
N Several entities (Chambers, Farm Bureau, Rolling Hills Casino, etc) are involved in visitor attraction with the lead agency being the Red Bluff Chamber of Commerce / Convention & Visitors Bureau.
A Strategic Marketing Plan (SMP) which updated a 1997 Plan was recently completed. The plan is very detailed (70 actions) on events, marketing and implementation activities. This plan was updated as a result of the Lake Red Bluff closure.
There are some excellent actions in the SMP called “Cowboy Up”. Collaboration among all entities involved in Visitor Attraction would be
strengthened to be more aggressive and effective.
29 Tehama County Attraction & Retention Program Analysis 29
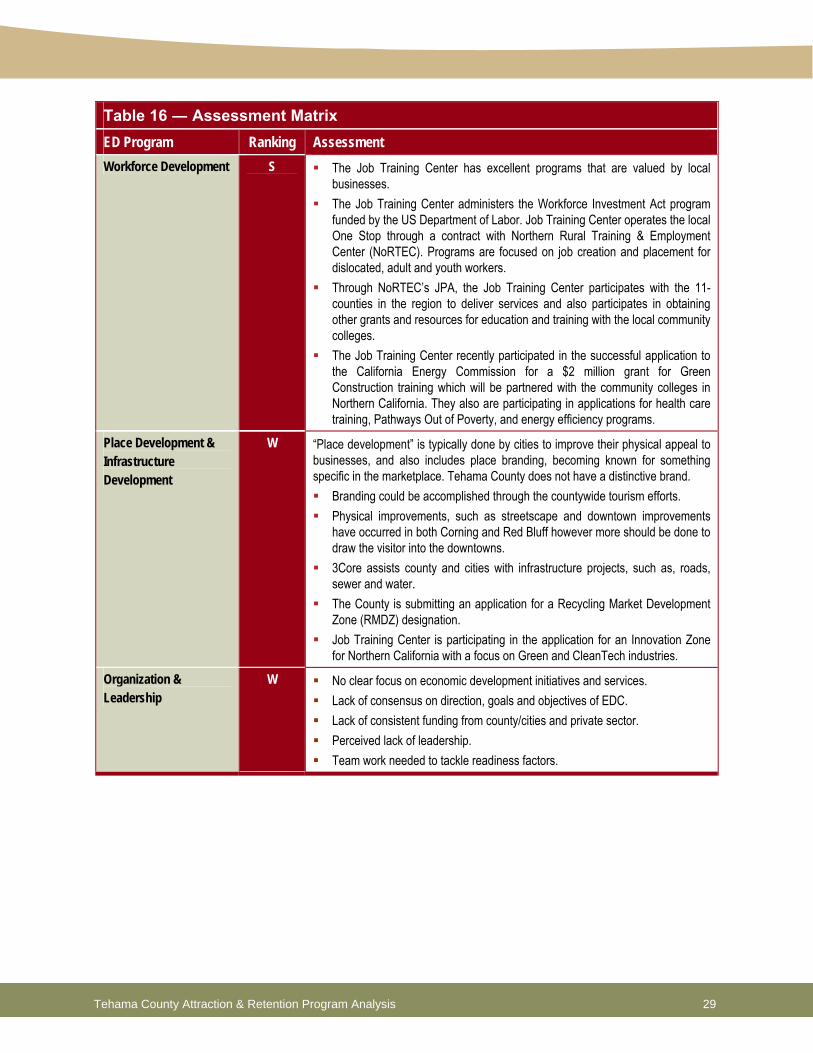
Table 16 ― Assessment Matrix
ED Program Ranking Assessment Workforce Development S The Job Training Center has excellent programs that are valued by local
businesses. The Job Training Center administers the Workforce Investment Act program
funded by the US Department of Labor. Job Training Center operates the local One Stop through a contract with Northern Rural Training & Employment Center (NoRTEC). Programs are focused on job creation and placement for dislocated, adult and youth workers.
Through NoRTEC’s JPA, the Job Training Center participates with the 11-counties in the region to deliver services and also participates in obtaining other grants and resources for education and training with the local community colleges.
The Job Training Center recently participated in the successful application to the California Energy Commission for a $2 million grant for Green Construction training which will be partnered with the community colleges in Northern California. They also are participating in applications for health care training, Pathways Out of Poverty, and energy efficiency programs.
Place Development & Infrastructure Development
W “Place development” is typically done by cities to improve their physical appeal to businesses, and also includes place branding, becoming known for something specific in the marketplace. Tehama County does not have a distinctive brand. Branding could be accomplished through the countywide tourism efforts. Physical improvements, such as streetscape and downtown improvements
have occurred in both Corning and Red Bluff however more should be done to draw the visitor into the downtowns.
3Core assists county and cities with infrastructure projects, such as, roads, sewer and water.
The County is submitting an application for a Recycling Market Development Zone (RMDZ) designation.
Job Training Center is participating in the application for an Innovation Zone for Northern California with a focus on Green and CleanTech industries.
Organization & Leadership
W No clear focus on economic development initiatives and services. Lack of consensus on direction, goals and objectives of EDC. Lack of consistent funding from county/cities and private sector. Perceived lack of leadership. Team work needed to tackle readiness factors.
30 Tehama County Attraction & Retention Program Analysis 30
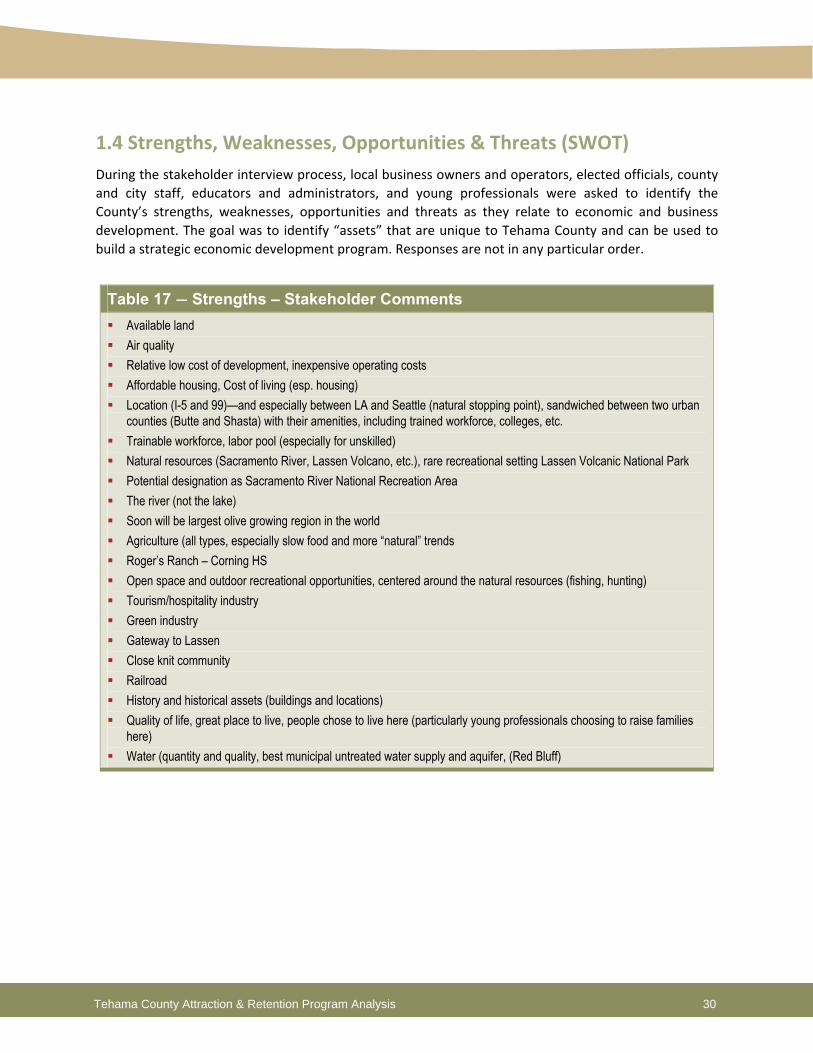
1.4 Strengths, Weaknesses, Opportunities & Threats (SWOT) During the stakeholder interview process, local business owners and operators, elected officials, county and city staff, educators and administrators, and young professionals were asked to identify the County’s strengths, weaknesses, opportunities and threats as they relate to economic and business development. The goal was to identify “assets” that are unique to Tehama County and can be used to build a strategic economic development program. Responses are not in any particular order.
Table 17 ― Strengths – Stakeholder Comments Available land Air quality Relative low cost of development, inexpensive operating costs Affordable housing, Cost of living (esp. housing) Location (I-5 and 99)—and especially between LA and Seattle (natural stopping point), sandwiched between two urban
counties (Butte and Shasta) with their amenities, including trained workforce, colleges, etc. Trainable workforce, labor pool (especially for unskilled) Natural resources (Sacramento River, Lassen Volcano, etc.), rare recreational setting Lassen Volcanic National Park Potential designation as Sacramento River National Recreation Area The river (not the lake) Soon will be largest olive growing region in the world Agriculture (all types, especially slow food and more “natural” trends Roger’s Ranch – Corning HS Open space and outdoor recreational opportunities, centered around the natural resources (fishing, hunting) Tourism/hospitality industry Green industry Gateway to Lassen Close knit community Railroad History and historical assets (buildings and locations) Quality of life, great place to live, people chose to live here (particularly young professionals choosing to raise families
here) Water (quantity and quality, best municipal untreated water supply and aquifer, (Red Bluff)
31 Tehama County Attraction & Retention Program Analysis 31
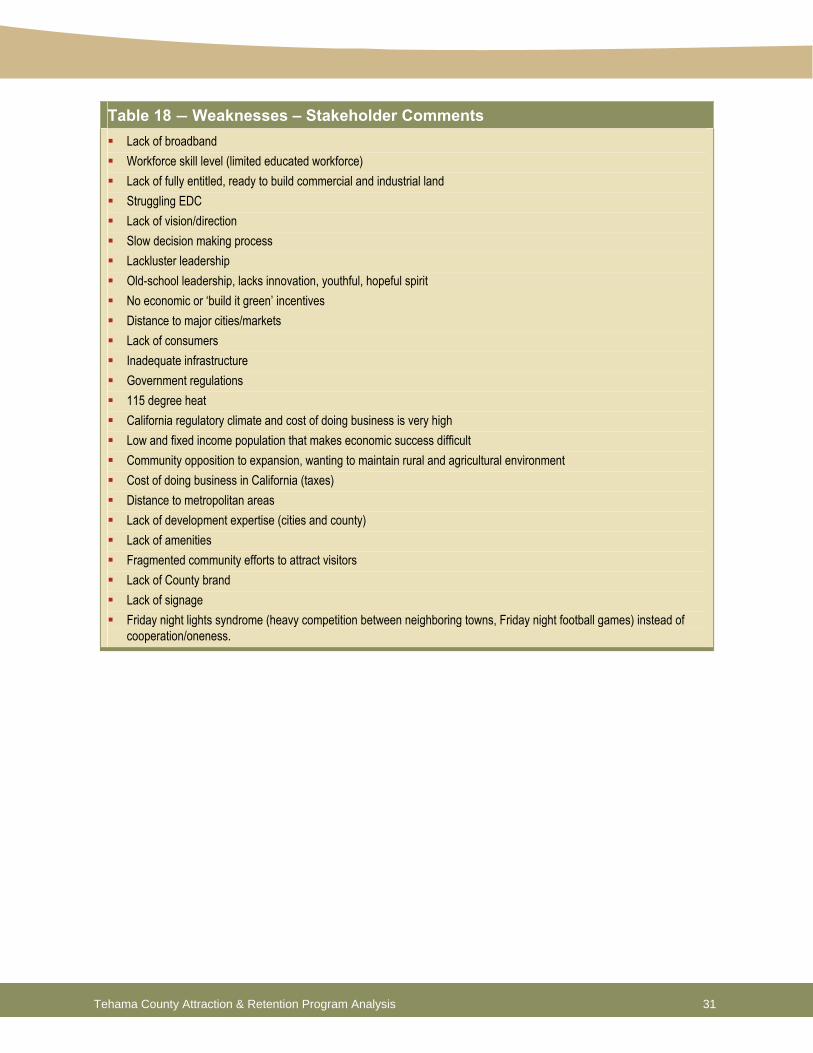
Table 18 ― Weaknesses – Stakeholder Comments Lack of broadband Workforce skill level (limited educated workforce) Lack of fully entitled, ready to build commercial and industrial land Struggling EDC Lack of vision/direction Slow decision making process Lackluster leadership Old-school leadership, lacks innovation, youthful, hopeful spirit No economic or ‘build it green’ incentives Distance to major cities/markets Lack of consumers Inadequate infrastructure Government regulations 115 degree heat California regulatory climate and cost of doing business is very high Low and fixed income population that makes economic success difficult Community opposition to expansion, wanting to maintain rural and agricultural environment Cost of doing business in California (taxes) Distance to metropolitan areas Lack of development expertise (cities and county) Lack of amenities Fragmented community efforts to attract visitors Lack of County brand Lack of signage Friday night lights syndrome (heavy competition between neighboring towns, Friday night football games) instead of
cooperation/oneness.
32 Tehama County Attraction & Retention Program Analysis 32
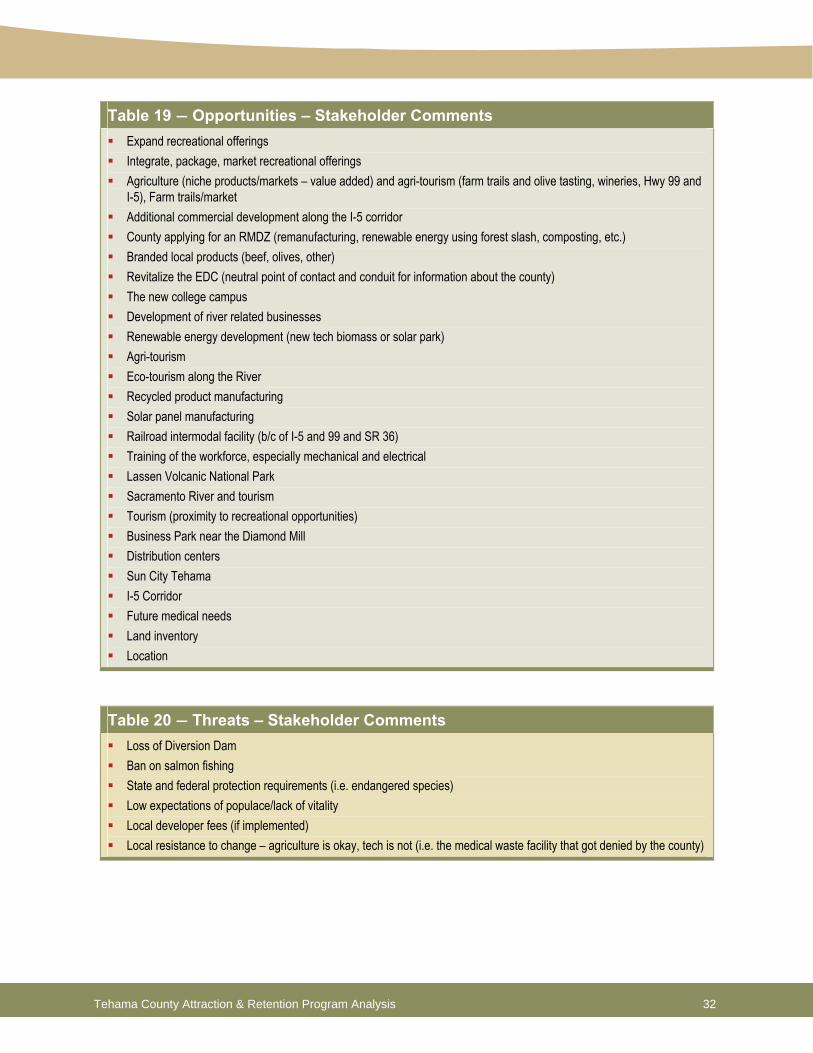
Table 19 ― Opportunities – Stakeholder Comments Expand recreational offerings Integrate, package, market recreational offerings Agriculture (niche products/markets – value added) and agri-tourism (farm trails and olive tasting, wineries, Hwy 99 and
I-5), Farm trails/market Additional commercial development along the I-5 corridor County applying for an RMDZ (remanufacturing, renewable energy using forest slash, composting, etc.) Branded local products (beef, olives, other) Revitalize the EDC (neutral point of contact and conduit for information about the county) The new college campus Development of river related businesses Renewable energy development (new tech biomass or solar park) Agri-tourism Eco-tourism along the River Recycled product manufacturing Solar panel manufacturing Railroad intermodal facility (b/c of I-5 and 99 and SR 36) Training of the workforce, especially mechanical and electrical Lassen Volcanic National Park Sacramento River and tourism Tourism (proximity to recreational opportunities) Business Park near the Diamond Mill Distribution centers Sun City Tehama I-5 Corridor Future medical needs Land inventory Location
Table 20 ― Threats – Stakeholder Comments Loss of Diversion Dam Ban on salmon fishing State and federal protection requirements (i.e. endangered species) Low expectations of populace/lack of vitality Local developer fees (if implemented) Local resistance to change – agriculture is okay, tech is not (i.e. the medical waste facility that got denied by the county)
33 Tehama County Attraction & Retention Program Analysis 33
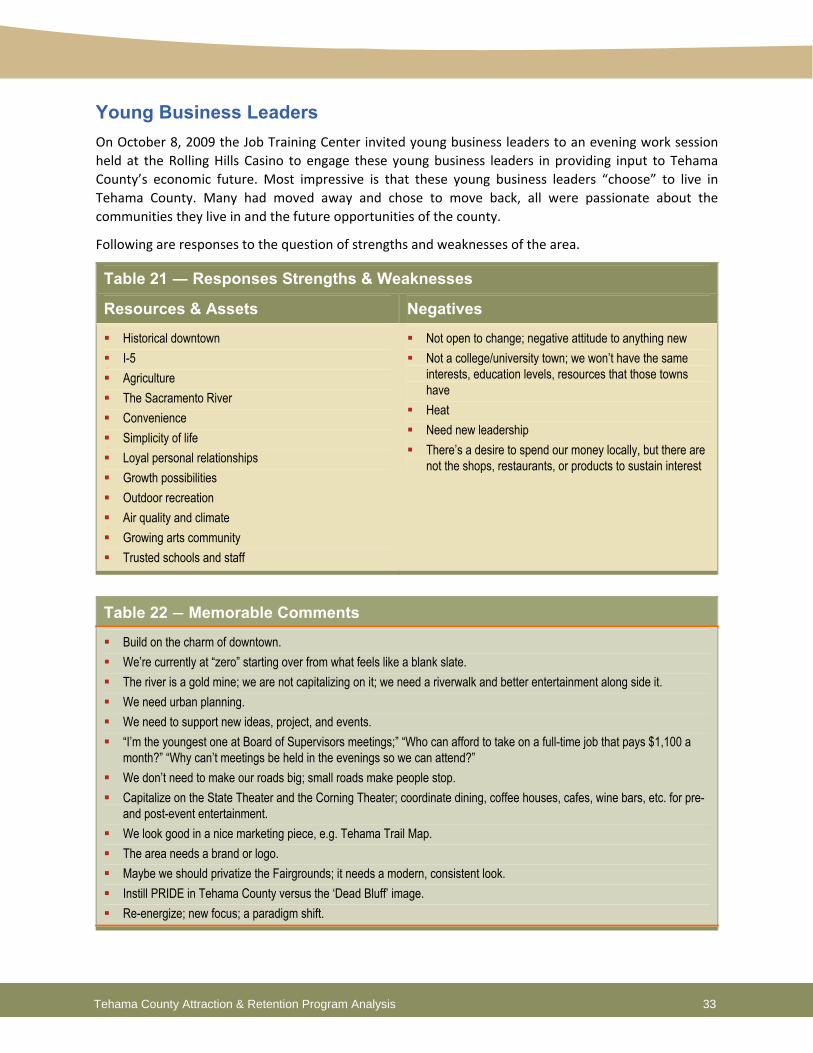
Young Business Leaders On October 8, 2009 the Job Training Center invited young business leaders to an evening work session held at the Rolling Hills Casino to engage these young business leaders in providing input to Tehama County’s economic future. Most impressive is that these young business leaders “choose” to live in Tehama County. Many had moved away and chose to move back, all were passionate about the communities they live in and the future opportunities of the county.
Following are responses to the question of strengths and weaknesses of the area.
Table 21 ― Responses Strengths & Weaknesses
Resources & Assets Negatives Historical downtown I-5 Agriculture The Sacramento River Convenience Simplicity of life Loyal personal relationships Growth possibilities Outdoor recreation Air quality and climate Growing arts community Trusted schools and staff
Not open to change; negative attitude to anything new Not a college/university town; we won’t have the same
interests, education levels, resources that those towns have
Heat Need new leadership There’s a desire to spend our money locally, but there are
not the shops, restaurants, or products to sustain interest
Table 22 ― Memorable Comments Build on the charm of downtown. We’re currently at “zero” starting over from what feels like a blank slate. The river is a gold mine; we are not capitalizing on it; we need a riverwalk and better entertainment along side it. We need urban planning. We need to support new ideas, project, and events. “I’m the youngest one at Board of Supervisors meetings;” “Who can afford to take on a full-time job that pays $1,100 a
month?” “Why can’t meetings be held in the evenings so we can attend?” We don’t need to make our roads big; small roads make people stop. Capitalize on the State Theater and the Corning Theater; coordinate dining, coffee houses, cafes, wine bars, etc. for pre-
and post-event entertainment. We look good in a nice marketing piece, e.g. Tehama Trail Map. The area needs a brand or logo. Maybe we should privatize the Fairgrounds; it needs a modern, consistent look. Instill PRIDE in Tehama County versus the ‘Dead Bluff’ image. Re-energize; new focus; a paradigm shift.
34 Tehama County Attraction & Retention Program Analysis 34
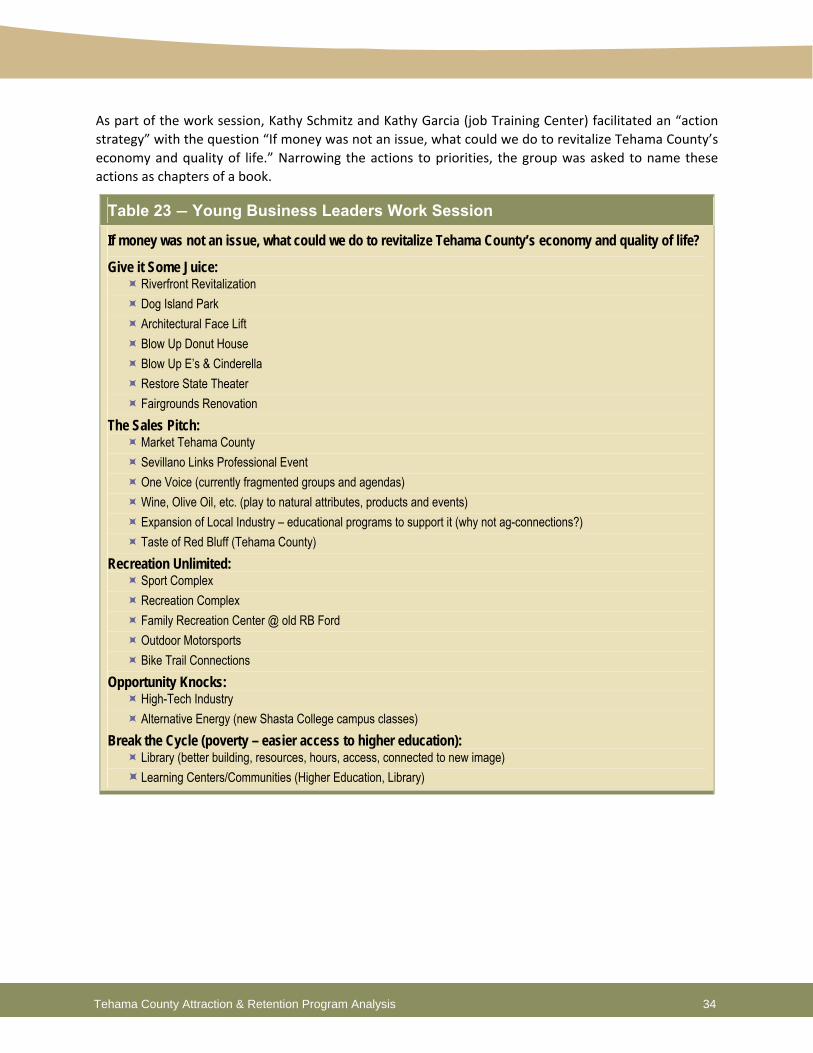
As part of the work session, Kathy Schmitz and Kathy Garcia (job Training Center) facilitated an “action strategy” with the question “If money was not an issue, what could we do to revitalize Tehama County’s economy and quality of life.” Narrowing the actions to priorities, the group was asked to name these actions as chapters of a book.
Table 23 ― Young Business Leaders Work Session
If money was not an issue, what could we do to revitalize Tehama County’s economy and quality of life?
Give it Some Juice: Riverfront Revitalization Dog Island Park Architectural Face Lift Blow Up Donut House Blow Up E’s & Cinderella Restore State Theater Fairgrounds Renovation
The Sales Pitch: Market Tehama County Sevillano Links Professional Event One Voice (currently fragmented groups and agendas) Wine, Olive Oil, etc. (play to natural attributes, products and events) Expansion of Local Industry – educational programs to support it (why not ag-connections?) Taste of Red Bluff (Tehama County)
Recreation Unlimited: Sport Complex Recreation Complex Family Recreation Center @ old RB Ford Outdoor Motorsports Bike Trail Connections
Opportunity Knocks: High-Tech Industry Alternative Energy (new Shasta College campus classes)
Break the Cycle (poverty – easier access to higher education): Library (better building, resources, hours, access, connected to new image) Learning Centers/Communities (Higher Education, Library)
35 Tehama County Attraction & Retention Program Analysis 35
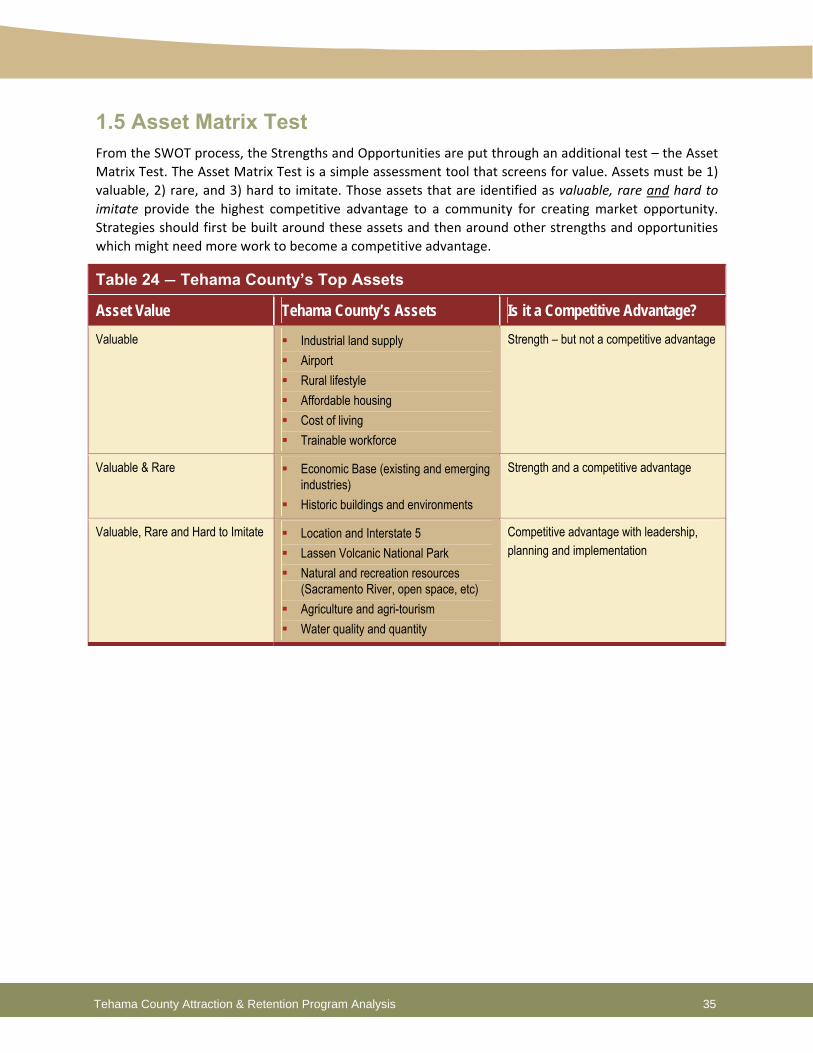
1.5 Asset Matrix Test From the SWOT process, the Strengths and Opportunities are put through an additional test – the Asset Matrix Test. The Asset Matrix Test is a simple assessment tool that screens for value. Assets must be 1) valuable, 2) rare, and 3) hard to imitate. Those assets that are identified as valuable, rare and hard to imitate provide the highest competitive advantage to a community for creating market opportunity. Strategies should first be built around these assets and then around other strengths and opportunities which might need more work to become a competitive advantage.
Table 24 ― Tehama County’s Top Assets
Asset Value Tehama County’s Assets Is it a Competitive Advantage? Valuable Industrial land supply
Airport Rural lifestyle Affordable housing Cost of living Trainable workforce
Strength – but not a competitive advantage
Valuable & Rare Economic Base (existing and emerging industries)
Historic buildings and environments
Strength and a competitive advantage
Valuable, Rare and Hard to Imitate Location and Interstate 5 Lassen Volcanic National Park Natural and recreation resources
(Sacramento River, open space, etc) Agriculture and agri-tourism Water quality and quantity
Competitive advantage with leadership, planning and implementation
36 Tehama County Attraction & Retention Program Analysis 36
1.6 Findings Tehama County has very passionate and committed individuals who want to see the area grow and prosper. They see the opportunity to position their location as a business and visitor destination built on the County’s unique assets.
Issues that need to be addressed:
Lack of a “place‐based” brand
Fragmented groups and agendas for marketing attributes
Not ready to “go to market” with business attraction (lack of ready‐to‐go sites, data, no focus on priority areas for new development)
Lack of consensus on direction for economic development and desired results
Limited public and private funding for strategic initiatives
Perceived lack of leadership
Despite the fact the Tehama EDC has closed it doors, there are still on‐going and new economic development activities. The County and Tehama EDC Board should provide some very clear goals for an economic development work plan including:
1. Clear direction and focus
2. Restructuring deployment of economic development programs and services
3. Promoting unique “destination” assets
4. Leveraging new programs to initiate strategies around green industry

37 Tehama County Attraction & Retention Program Analysis 37
Phase II ― Where do we want to be?

39 Tehama County Attraction & Retention Program Analysis 39
Phase II ― “Where do we want to be?” Phase II is defining where Tehama County wants to be in the future. This section is about vision and strategic goals that the communities and stakeholders feel are most important to create a healthy and prosperous economy. The vision statement is what we envision the future to be like to live, work and play. The goals are specifically related to strategic actions which will achieve desired outcomes of the vision.
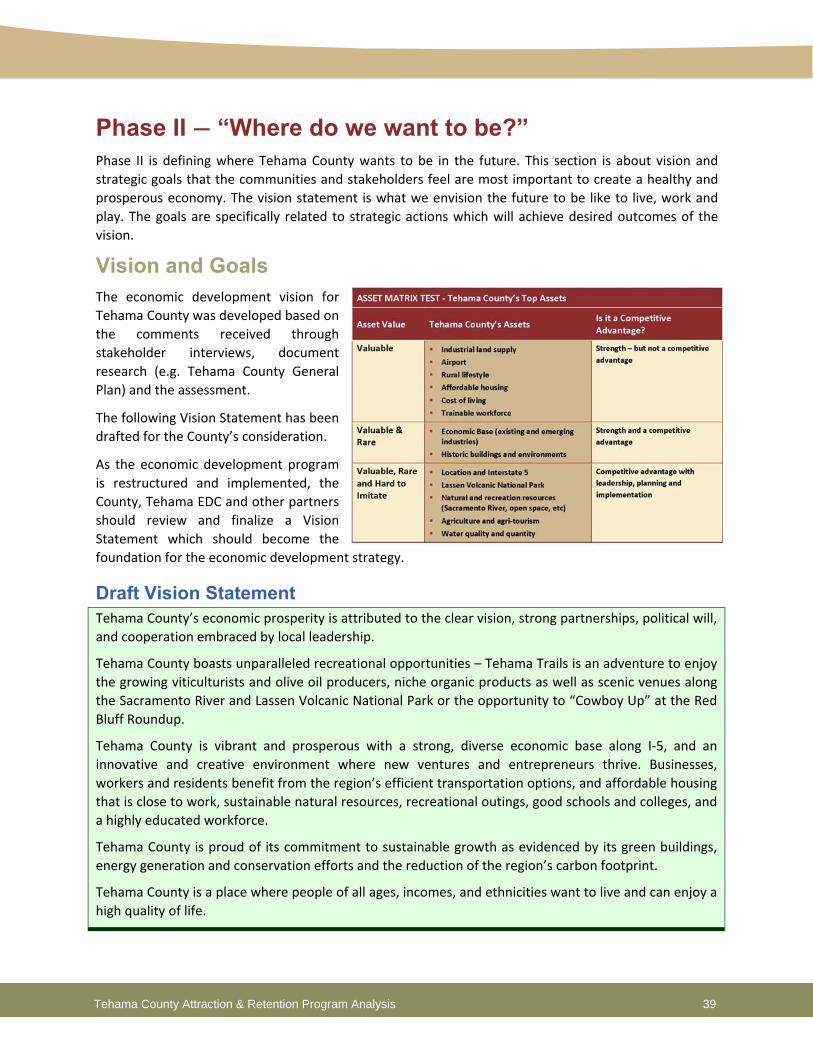
Vision and Goals The economic development vision for Tehama County was developed based on the comments received through stakeholder interviews, document research (e.g. Tehama County General Plan) and the assessment.
The following Vision Statement has been drafted for the County’s consideration.
As the economic development program is restructured and implemented, the County, Tehama EDC and other partners should review and finalize a Vision Statement which should become the foundation for the economic development strategy.
Draft Vision Statement Tehama County’s economic prosperity is attributed to the clear vision, strong partnerships, political will, and cooperation embraced by local leadership.
Tehama County boasts unparalleled recreational opportunities – Tehama Trails is an adventure to enjoy the growing viticulturists and olive oil producers, niche organic products as well as scenic venues along the Sacramento River and Lassen Volcanic National Park or the opportunity to “Cowboy Up” at the Red Bluff Roundup.
Tehama County is vibrant and prosperous with a strong, diverse economic base along I‐5, and an innovative and creative environment where new ventures and entrepreneurs thrive. Businesses, workers and residents benefit from the region’s efficient transportation options, and affordable housing that is close to work, sustainable natural resources, recreational outings, good schools and colleges, and a highly educated workforce.
Tehama County is proud of its commitment to sustainable growth as evidenced by its green buildings, energy generation and conservation efforts and the reduction of the region’s carbon footprint.
Tehama County is a place where people of all ages, incomes, and ethnicities want to live and can enjoy a high quality of life.
40 Tehama County Attraction & Retention Program Analysis 40
Economic Development Outcomes As outlined in the County’s Community Development Block Grant (CDBG) application and identified in the County’s General Plan:
The ability to attract and retain commercial and industrial business through new development, reconstruction, and rehabilitation is seen by the County as a vital component to the overall economic health of the community.
The outcomes desired include:
Economic Diversification
Private Sector Investment
Increased Job Opportunities
Taxable Sales Growth
These outcomes were supported by the input of numerous stakeholders which resulted in four main recommended goals as noted below:
Economic Development Goals 1. Create a Tehama County Brand that differentiates Tehama County from other Northern California
locations, particularly for the Visitor Market, sets it apart as a place to visit yet remains true to Tehama’s history and heritage.
2. Create an integrated and unified Visitor Attraction effort which involves all venues. Take advantage of Tehama’s unique location and recreation opportunities to package the County as a destination. Build on enhancing the visitor experience and increasing retail sales tax by revitalizing the downtowns and attract new destination developments.
3. Create a strong county‐wide Economic Development arm supported by both the public and private sector that consists of
Business Development Team focused on small business incubation, business retention and expansion and green business initiatives and
Business Attraction Team focused on ensuring the County is “location ready” to compete for new business investment and creating a business case targeted to the specific industries that match Tehama attributes.
4. Leverage resources with on‐going special projects and partnerships that will create unique opportunities for private sector investment and job creation.

41 Tehama County Attraction & Retention Program Analysis 41
Phase III ― How will we get there?


43 Tehama County Attraction & Retention Program Analysis 43
Phase III ― “How will we get there?” There is a much used phrase that reflects the importance of vision, goals and leadership “if you don’t know where you going, any road will take you there.” In Phase III are recommended strategic actions based on the findings and goals for creating economic prosperity in Tehama County.
Economic development activities that lead to job creation, capital investment, rising incomes and improved revenue streams are a result of two market drivers:
1) Export oriented businesses, and
2) Population serving businesses.
Tehama County has the unique opportunity to support both of these economic drivers. The following outlines recommended strategies and structure for implementing strategies.
Stakeholder & Leadership Work Session A work session was held on October 21, 2009 with the Tehama County Economic Development Board to present the key findings and recommended strategic actions2. Key stakeholders and the Strategies will be presented in a work session with the Tehama EDC Board on October 21, 2009 before finalizing.
The presentation focused on:
Findings – Where are we now?
Confirmation of recommended Goals
The critical need for being “Location Ready”
Recommended approach to strategic initiatives
Organizational structure
2 Appendix 2 – Tehama County Business Attraction & Retention Program Presentation, Phase III – How Do We Get There? October 21, 2009

44 Tehama County Attraction & Retention Program Analysis 44
The Board agreed with findings as well as recommendations for
goals,
organizational structure (re‐structure) and
strategic initiatives.
The Board felt the approach provided an excellent roadmap for the county, cities and EDC to implement and build support for transformational action to position Tehama County for economic growth.
The following outlines the Action Roadmap and priority strategic initiatives.
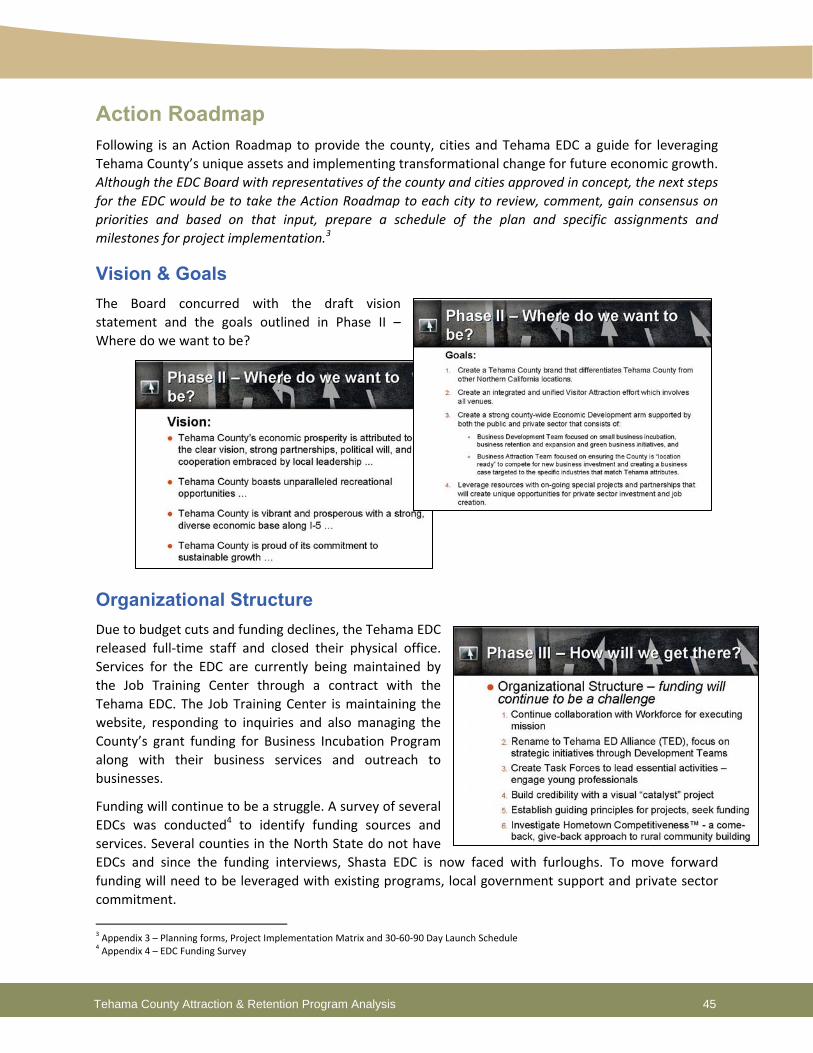
45 Tehama County Attraction & Retention Program Analysis 45
Action Roadmap Following is an Action Roadmap to provide the county, cities and Tehama EDC a guide for leveraging Tehama County’s unique assets and implementing transformational change for future economic growth. Although the EDC Board with representatives of the county and cities approved in concept, the next steps for the EDC would be to take the Action Roadmap to each city to review, comment, gain consensus on priorities and based on that input, prepare a schedule of the plan and specific assignments and milestones for project implementation.3
Vision & Goals The Board concurred with the draft vision statement and the goals outlined in Phase II – Where do we want to be?
Organizational Structure Due to budget cuts and funding declines, the Tehama EDC released full‐time staff and closed their physical office. Services for the EDC are currently being maintained by the Job Training Center through a contract with the Tehama EDC. The Job Training Center is maintaining the website, responding to inquiries and also managing the County’s grant funding for Business Incubation Program along with their business services and outreach to businesses.
Funding will continue to be a struggle. A survey of several EDCs was conducted4 to identify funding sources and services. Several counties in the North State do not have EDCs and since the funding interviews, Shasta EDC is now faced with furloughs. To move forward funding will need to be leveraged with existing programs, local government support and private sector commitment.
3 Appendix 3 – Planning forms, Project Implementation Matrix and 30‐60‐90 Day Launch Schedule 4 Appendix 4 – EDC Funding Survey
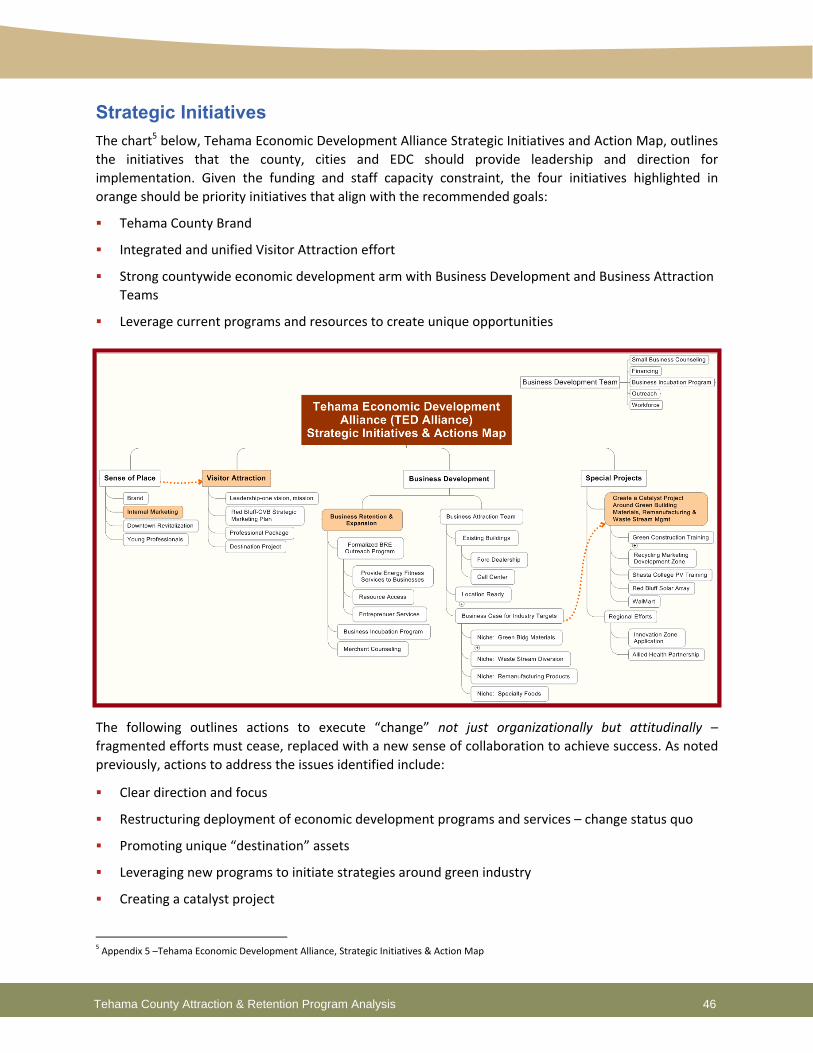
46 Tehama County Attraction & Retention Program Analysis 46
Strategic Initiatives The chart5 below, Tehama Economic Development Alliance Strategic Initiatives and Action Map, outlines the initiatives that the county, cities and EDC should provide leadership and direction for implementation. Given the funding and staff capacity constraint, the four initiatives highlighted in orange should be priority initiatives that align with the recommended goals:
Tehama County Brand
Integrated and unified Visitor Attraction effort
Strong countywide economic development arm with Business Development and Business Attraction Teams
Leverage current programs and resources to create unique opportunities
The following outlines actions to execute “change” not just organizationally but attitudinally – fragmented efforts must cease, replaced with a new sense of collaboration to achieve success. As noted previously, actions to address the issues identified include:
Clear direction and focus
Restructuring deployment of economic development programs and services – change status quo
Promoting unique “destination” assets
Leveraging new programs to initiate strategies around green industry
Creating a catalyst project
5 Appendix 5 –Tehama Economic Development Alliance, Strategic Initiatives & Action Map
47 Tehama County Attraction & Retention Program Analysis 47
The EDC Board will need to review and confirm action recommendations. Of the five Action Recommendations, the first three action recommendations are organizational and structural in nature, creating the infrastructure and support for moving these initiatives forward. Action recommendations 4 and 5 specifically address the goals outlined in Phase II – Where do we want to be? Below is a brief overview of Action Recommendation purposes:
Action 1: Organizational restructure – rename Tehama EDC to an alliance involving other organizations, adopt vision, charter and goals, establish clear direction and focus.
Action 2: Building capacity – staffing, partner organizations and creating Development Teams.
Action 3: Internal marketing – building local support and enthusiasm for vision, action plan and collaboration.
Action 4: Visitor attraction – a priority initiative. Create one brand, such as “Cowboy Up” and develop a unified Visitor Attraction strategy.
Action 5: Core economic development services – given limited funding, leverage existing programs to provide direct business services and identify potential catalyst projects.

48 Tehama County Attraction & Retention Program Analysis 48
Action 1: Rename and restructure the economic development organization to achieve a leadership structure that is supported by the community with a clear direction and focus for creating economic transformation. Tehama must control its future. Implementation Steps:
1. Tehama EDC Board should take action:
a. Rename the Tehama EDC to the Tehama Economic Development Alliance (TED). Purpose – focus strategic initiatives through collaborations with TED providing the leadership to focus on working together, leveraging resources and have common vision and goals.
b. Adopt a new Charter consistent with goals:
“TED will provide a unified voice focused on transformational actions to brand and create catalyst projects that align with Visitor Attraction and Business Development goals and establish a community endowment fund for projects that define Tehama County as a unique location in the Northern California to visit and locate.”
c. Review, revise and adopt specific goals such as set forth in this plan:
1. Create a Tehama County brand that differentiates Tehama County from other Northern California locations, particularly for the Visitor Market, sets it apart as a place to visit yet remains true to Tehama’s history and heritage.
2. Create an integrated and unified Visitor Attraction effort which involves all venues. Take advantage of Tehama’s unique location and recreation opportunities to package the County as a destination. Build on enhancing the visitor experience and increasing retail sales tax by revitalizing the downtowns and attracting new destination developments.
3. Create a strong countywide Economic Development arm supported by both the public and private sector that consists of:
i. A Business Development Team focused on small business incubation, business retention and expansion and green business initiatives, and
ii. A Business Attraction Team focused on ensuring the County is “location ready” to compete for new business investment and creating a business case targeted to the specific industries that match Tehama attributes.
4. Leverage resources with on‐going special projects and partnerships that will create unique opportunities for private sector investment and job creation.
d. Review and revise recommended action plan and flesh out organizational collaborations, determine who should be involved to accomplish goals, invite to table, set expected outcomes, timelines and roles/responsibilities.
49 Tehama County Attraction & Retention Program Analysis 49
e. Outline a 30‐60‐90 day plan of action, including:
1. Review goals and action plan with the county, cities and other organizations for consensus on Vision and Charter.
2. Prioritize, given staffing and budget, specific projects that can be implemented and achieved, recommended top priorities are:
Internal marketing to build TED’s credibility and spread message on strategic initiatives.
Brand and Visitor Attraction strategy that is focused and brings all fragmented efforts under one umbrella.
Business Retention & Expansion – leverage with Job Training Center’s business services and outreach.
Identify “catalyst” project around “green” building materials, remanufacturing and waste stream management – leverage with proposed Recycling Market Development Zone.
3. Develop key messages to promote the new Charter and focus.
4. Hold a public forum to introduce and solicit buy‐in for the Vision, Goals and Strategic Actions to focus on transformational change.
Lead Agency:
Board of Directors, Tehama EDC, facilitated by Job Training Center
Who needs to be Involved:
Board members
County and city representatives
Key organizations identified to be collaborators
Engage one‐two young professional representatives into process Timeline:
Goal: Complete by end of first quarter 2010
Measure Success:
Adoption of new structure, consensus among all entities, hold public forum to solicit support.
Budget:
Staffing time and expenses for Forum, which could be self‐funded.
50 Tehama County Attraction & Retention Program Analysis 50
Action 2: Staff core services, facilitate engagement of more partners in collaborative efforts and create business development teams to focus on specific initiatives.
Implementation Steps:
1. Organizational Staffing
a. Continue collaboration and contract with Job Training Center (JTC) to provide economic development, facilitation and promotional services. Leverage with JTC’s business services and outreach program. Note: many EDCs interviewed were partnered or had merged with the local Workforce Development.
b. Involve and contract, if needed, key organizations, such as, TriCounty EDC (3Core)6, Golden Capital Network and proposed Recycling Market Development Zone, to provide specialized services not provided by JTC.
c. Ensure activities being performed by partner organizations are part of the plan and linked back to the key initiatives, request reports to inform investors and community of services available and being provided to local businesses.
d. Apply for an AmeriCorps7 staff person to work with JTC on specific projects for the action plan.
e. Involve other organizations as initiatives are implemented.
2. Leverage Funding Sources to Accomplish Initiatives
a. Begin discussions with USDA and ETP to identify potential funding opportunities over the next year to support implementation of one of the initiatives and assist funding staff.
b. Identify with public agencies, work elements currently performed by county/cities that could be part of the action plan to help support implementation.
c. Investigate the HomeTown Competitiveness organization and their strategic approach to “a Come‐Back/Give‐Back Approach” to Rural Community Building, particularly their Charitable Asset Pillar, which is to strengthen and sustain charitable giving at the local level in order to build an endowment that will sustain local civic institutions and create a new source of opportunity capital for community economic development efforts. They have successfully worked in rural communities throughout the west and Midwest to build the local HomeTown competitiveness, which is built on four pillars – leadership, charitable assets, entrepreneurship and youth – many of the same values held by Tehama County and their residents. http://www.htccommunity.org/about
d. Leverage regional grant/program efforts to local area bringing programs, resources and services to local businesses which will also results in jobs or dislocated worker employment, such as, recent Clean Energy Workforce Training Program and California Energy Commission grant applications for energy efficiency programs.
e. Seek grant opportunities that support specific initiatives – not grant for grant sakes – grants should support specific initiatives or leverage resources to support initiatives.
3. Create Development Teams
Note: Given current lack of funding for economic development it will be difficult to launch any significant initiatives except Core Services that can be implemented by leveraging resources with other programs and
6 Appendix 6 – 3Core (formerly TriCounty EDC) Services Sheet 7 Appendix 7 – AmeriCorps Application

51 Tehama County Attraction & Retention Program Analysis 51
projects. Caution is recommended to be strategic during the early revitalization of this initiative to focus on building noticeable projects that will build TED’s creditability without having to do everything. TED should be very clear in its promotion that efforts are public‐private with focus on providing leadership, implementation will require staff and budget.
Development Teams or Task Forces are methods to engage individuals to lead essential activities. Three teams are recommended:
1. Visitor Attraction – this team should be TED Board of Directors, County, Cities and the Marketing Director of Rolling Hills Casino – purpose to provide the leadership to unify and bring together all groups doing visitor attraction marketing, facilitate a common vision, goals, outcomes and strategic collaborative approach to creating a unique brand and increase visitor attraction. This Team needs to be single‐minded on a unifying Visitor Attraction collaboration.
2. Business Development Team – Business Development is a priority core service which should be focused on small business incubation, business retention and expansion and green business initiatives. This team should be business and industry leaders (and partner organizations) who can help advise on strategic approaches, outreach and knowledge of how to link resources/opportunity to business (connect dots for new business opportunities for existing businesses, use the Business Team and then network to link businesses to TED, refer businesses to TED and lend their name to help promote TED’s Charter and new day of economic opportunity.
3. Business Attraction Team – This team should be established to create a “Red Team” which would come together to respond to any new business inquiry. This team’s short term focus needs to be on preparing Tehama to be “location‐ready”, not on business attraction. At this time, staff support would not be available. However, with the right public/private Team they could be addressing the weaknesses identified in the Assessment to get Tehama County “location ready”. Key for this Team is a leader motivated to this effort, who knows the market, real estate and planning and industry opportunities. The County and city planning directors should be a part of this Team (and could lead this Team).
4. Young Professionals Organization
The JTC held an initial meeting with a group of young professional which had an exceptional turn‐out of interested young business people. This effort should be continued to welcome and engage a new generation of business leaders.
Lead Agency:
Tehama EDC (TED), supported by the Job Training Center (JTC)
Who needs to be Involved:
This activity is administrative as well as organizational structure with outreach to other partner agencies/organizations and private sector. Action 2 should include many of those involved in Action 1.
Timeline:
Organizational staffing will be an on‐going activity as well as seeking funding. Team leaders should be identified by end of first quarter, 2010. Team leaders should recruit members (if funding is available a staff person should assist Team Leaders with administrative and organization support)
Measure Success:
Report to the Board on key partner network project accomplishments – who is doing what and how it is meeting TED’s initiatives
Application and approval for AmeriCorps staff

52 Tehama County Attraction & Retention Program Analysis 52
Report on funding opportunities and applications
Team Leads selected and work scope prepared for Year 1
Budget:
Job Training Center (JTC), as TED’s contractor, should review activities and provide an estimate of time and cost to facilitate and implement these activities.

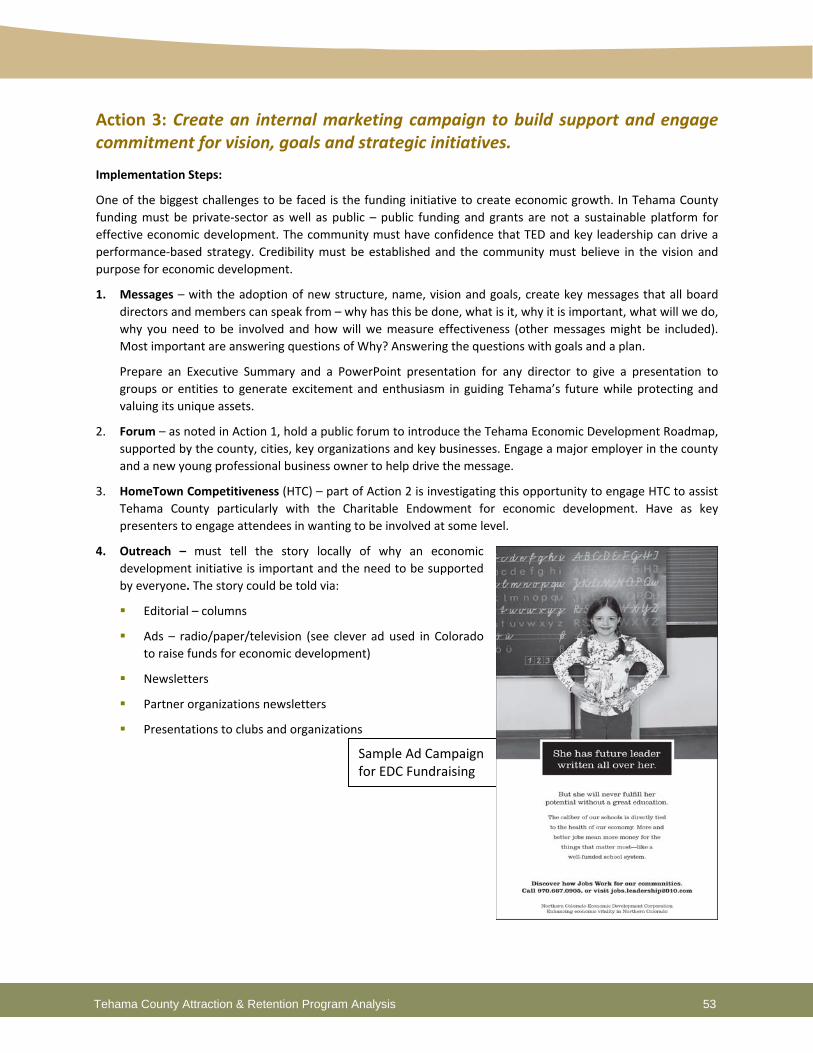
53 Tehama County Attraction & Retention Program Analysis 53
Action 3: Create an internal marketing campaign to build support and engage commitment for vision, goals and strategic initiatives.
Implementation Steps:
One of the biggest challenges to be faced is the funding initiative to create economic growth. In Tehama County funding must be private‐sector as well as public – public funding and grants are not a sustainable platform for effective economic development. The community must have confidence that TED and key leadership can drive a performance‐based strategy. Credibility must be established and the community must believe in the vision and purpose for economic development.
1. Messages – with the adoption of new structure, name, vision and goals, create key messages that all board directors and members can speak from – why has this be done, what is it, why it is important, what will we do, why you need to be involved and how will we measure effectiveness (other messages might be included). Most important are answering questions of Why? Answering the questions with goals and a plan.
Prepare an Executive Summary and a PowerPoint presentation for any director to give a presentation to groups or entities to generate excitement and enthusiasm in guiding Tehama’s future while protecting and valuing its unique assets.
2. Forum – as noted in Action 1, hold a public forum to introduce the Tehama Economic Development Roadmap, supported by the county, cities, key organizations and key businesses. Engage a major employer in the county and a new young professional business owner to help drive the message.
3. HomeTown Competitiveness (HTC) – part of Action 2 is investigating this opportunity to engage HTC to assist Tehama County particularly with the Charitable Endowment for economic development. Have as key presenters to engage attendees in wanting to be involved at some level.
4. Outreach – must tell the story locally of why an economic development initiative is important and the need to be supported by everyone. The story could be told via:
Editorial – columns
Ads – radio/paper/television (see clever ad used in Colorado to raise funds for economic development)
Newsletters
Partner organizations newsletters
Presentations to clubs and organizations
Sample Ad Campaign for EDC Fundraising

54 Tehama County Attraction & Retention Program Analysis 54
Lead Agency:
TED – Board of Directors and staff. This activity will take staff time. If successful in getting an AmeriCorps person they could have this responsibility, otherwise need to meet with Job Training Center to see if one of the staff could lead this particular initiative possibly as a co‐sponsor.
Who needs to be Involved:
Board of Directors and key staff person for implementation. This would be a priority activity to build the Vision and reputation of TED. Walmart’s foundation might also be interested in participating.
Timeline:
Conduct for a minimum of one year, launch late first quarter 2010.
Measure Success:
Support from public and private sector entities, provide funding for an endowment fund for economic development activities.
If a fund is started, the Board will need to establish guiding principles for the use of the funds that are aligned with the strategic initiatives, i.e., help with matching funds for a Visitor Attraction/Brand strategy.
Budget:
Some items can be done with just staff time. HomeTown Competitiveness (HTC) will have a cost that would be investigated in Action 2, however, the value in investing in HTC may be in establishing the Endowment Fund that would provide a better ROI in the long run, which might not otherwise be set up. A minimum of $10,000 should be set aside for internal marketing (preferably $25,000).

55 Tehama County Attraction & Retention Program Analysis 55
Action 4: Create a brand identity for Tehama that is universally used for Visitor Attraction which is supported by a unified Visitor Attraction strategy.
Addresses Goal 1: Create a Tehama County Brand that differentiates Tehama County from other Northern California locations, particularly for the Visitor Market, sets it apart as a place to visit yet remains true to Tehama’s history and heritage.
Addresses Goal 2: Create an integrated and unified Visitor Attraction effort which involves all venues. Take advantage of Tehama’s unique location and recreation opportunities to package the County as a destination. Build on enhancing the visitor experience and increasing retail sales tax by revitalizing the downtowns and attract new destination developments.
Implementation Steps:
As noted in the assessment, Tehama County because of its diverse geography and many recreational and cultural attractions (olive oil, historic downtown, gateway to Lassen, et al) has not created a “brand name”, instead of creating a distinction (which may only be one of the many assets) the message brand gets watered down as it attempts to send a variety of messages and themes instead of one strong one.
The Red Bluff Chamber of Commerce prepared a Strategic Marketing Plan8 which was an update of a 1997 plan. The plan has some excellent concepts, ideas and actions and it is an excellent start to developing a more formal Visitor Attraction plan such as the Angeles Camp, Ca – Branding, Development & Marketing Action Plan9.
1. TED Board of Directors and Visitor Attraction Team should provide leadership to this specific, priority effort to ensure that all entities/organizations are involved in one common, consensus driven Visitor Attraction Plan. Note: It was difficult to tell whether the Chamber plan included all areas and organizations in the County.
2. A key part of a Visitor Attraction strategy would be creating new, or “catalyst” destinations to attract visitors. Tehama County has some unique opportunities, if capitalized on, to create destination attractions.
3. Retain a firm, such as, Roger Brooks with Destination Development10 to take the plan to the next level and help facilitate all groups in developing a Visitor Attraction Strategy that includes Branding and potential identification of “destination” projects. Roger Brooks represents “destination” developers. County and cities could apply for CDBG funding for this activity.
4. In the interim, if funding is not available for a full retainer for the project, invite Roger Brooks as a speaker to discuss Tehama County’s potential development opportunities or engage him for one of his 1‐2‐day workshops. A great way to kick‐off this initiative.
5. Brand – the Chamber plan used the theme “Cowboy Up”, which could be perfect for Tehama County to use universally for promotions.
Lead Agency:
County and cities to provide the core leadership encouraging all entities of the importance to work together and brand Tehama County. Jointly apply for CDBG funding for preparing a Visitor Attraction & Destination Development Opportunity Strategy. This initiative needs a key chair of the Visitor Attraction Team, which should be a dynamic marketing person associated with one of the “visitor” businesses in Tehama County.
8 Appendix 8 – Red Bluff Chamber of Commerce Tourism – Marketing Plan, 2009 9 Appendix 9 – Branding, Development and Marketing Action Plan, prepared by Destination Development through a CDBG Grant 10 Roger Brooks, Destination Development, http://www.destinationdevelopment.com/

56 Tehama County Attraction & Retention Program Analysis 56
Who needs to be Involved:
All entities involved in tourism and visitor attraction, Chambers of Commerce, Fair, Casino, Downtown Association, Lassen Park, wine and olive oil industry, hotels, et al.
Timeline:
This is a priority activity, find a chair and at minimum host an initial meeting with all groups to present the Board’s (County and Cities) adopting this initiative as a priority, emphasize the need for collaboration and branding and provide some recommended next steps, such as, inviting Roger Brooks to Tehama County. First Quarter 2010.
Measure Success:
Organizing all groups to work together. Identifying a brand. Holding a workshop.
Budget:
$5,000 ‐ $10,000
57 Tehama County Attraction & Retention Program Analysis 57
Action 5: Leverage existing programs to provide Core Business Development Services and identify potential catalyst projects.
Addresses Goal 3: Create a strong county‐wide Economic Development arm supported by both the public and private sector that consists of
Business Development Team focused on small business incubation, business retention and expansion and green business initiatives and
Business Attraction Team focused on ensuring the County is “location ready” to compete for new business investment and creating a business case targeted to the specific industries that match Tehama attributes.
Addresses Goal 4: Leverage resources with on‐going special projects and partnerships that will create unique opportunities for private sector investment and job creation.
Implementation Steps:
The core business services for economic development are typically Business Retention/Expansion and Business Attraction, or specific activities that will assist in growing the economy and creating jobs. Today with unemployment rising, government cutbacks and individuals being dislocated because of the down economy, focus is on jobs. There are also new opportunities with the “green” economy taking root and stimulus dollars to help with recovery.
Given the limited budget for economic development in Tehama County, core services will need to be leveraged with other initiatives and assisted by the Business Development and Business Attraction Teams formed in Action 2. The Goal is to implement those initiatives, which create jobs and at the same time seek “catalysts” project that make transformational change.
1. Business Retention & Expansion (BRE) – Existing Program
Partner with Job Training Center (JTC) with their Layoff Aversion program and potential new BRE outreach program with tracking system for reporting.
Tie outreach to new energy program services for business, i.e., Energy Fitness and Retrofit.
Key with outreach is to ensure businesses that identify needs have been followed‐up with or referred to agencies that can help them (and those agencies follow‐up). If there are no resources to help a business they should be so advised. Link with regional program such as Entrepreneur Services provided by Golden Capital Network, loan services provided by 3Core and Small Business Development Center (SBDC). Note: A meeting should be held with SBDC and College to structure a better method for SBDC to report their assistance to existing businesses.
JTC will be implementing the Business Incubation Program with 3Core.
A merchant counseling program would be helpful to many of the small retail businesses, however, may not be eligible for funding.
2. Special Projects
There are a number of regional efforts that Tehama could participate and receive some benefit, these opportunities could also help identify “catalysts” projects: Clusters of Opportunity Grant – deeper research into cluster opportunities at a sub‐regional level –
identify how to leverage the data to business services and training.

58 Tehama County Attraction & Retention Program Analysis 58
Allied Health Partnership – Tehama has a growing and well‐known health niche, potential to assist the allied health with training and potential assistance in growing the market niche.
Application for Innovation Zone for the North State.
Create a catalyst project around the green economy, specifically in green building materials, remanufacturing and waste stream management Recycling Market Development Zone (RMDZ) designation (application submitted in Nov 2009), promote
when received.
Hold a meeting with manufacturers to discuss benefits to local businesses, local business practices around “green” and “sustainability” – what it means to them. Strategize other business opportunities to either form new business ventures around the green economy or attract businesses, utilizing key assets such as the RMDZ, Green Construction Training, Shasta College PV Training, potential renewable energy opportunities – solar arrays, remanufacturer from waste stream.
Create synergy around a project opportunity; find old building that can be reused for new product development – think out of the box to create opportunity and synergy between businesses.
3. Business Attraction
This activity will need to be driven by the Business Attraction Team. Focus should be on preparing Tehama’s product, identifying the prime sites for new business development, ensuring those properties are ready to go, i.e., “shovel‐ready” and improving the Tehama website with key data.
Should continue to be a member of Upstate, regional marketing entity for northern California, attending tradeshows and events that match Tehama business targets and properties. Upstate marketing schedule is attached.11
Respond to and follow‐up on all inquiries.
If the Board concurs, consider opening discussions with other counties along I‐5 to collaborate on an I‐5 marketing and attraction strategy.
Lead Agency:
TED supported by Job Training Center.
Who needs to be Involved:
Board, County, Cities, regional organizations and other entities that are providing services and resources to businesses, such as, Recycling Market Development Zone (if approved), Community Action Agency.
Timeline:
These projects may be driven by timelines of funding sources. Business outreach should begin first quarter 2010 and if energy grants are approved, be included in process by 2nd Quarter.
Measure Success:
Business connected, services provided.
Budget:
Budget should be developed by JTC considering how it can leverage with other resource programs.
11Appendix 10 – Upstate California’s 2010 Marketing Schedule

59 Tehama County Attraction & Retention Program Analysis 59
Recommended 30-60-90 Day Launch Schedule To help organize and assign priorities, and not become overwhelmed with the Roadmap, the 30‐60‐90 day Launch Schedule Form is a planning tool for organizing what can realistically be done in 30 day increments to launch the plan. As the Board reviews the plan, adjust and revise, add specific lead individuals, resources needed and milestones that need to be met. Following is provided as a starting point.
Table 25 ― 30-60-90 Day Launch Schedule
Month Objective & Action item schedule Lead Resources
Needed Milestones 30 days • Board reviews plan, makes revisions and refines timelines
and lead agencies, as needed • Board consensus on new charter and goals • Review charter, goals and plan with Supervisors, and
Council members of each city • Board members to identify individuals that will participate
on Development Teams • Invite one‐two new young professionals to participate
60 Days • Jointly (board, county, cities) adopt plan • Create key message platform and PowerPoint presentation
for board members to present to groups • Apply for AmeriCorps staff person • Begin planning a public forum to introduce plan • Identify key leaders to help present and support the launch
of a new Action Plan • Investigate HomeTown Competitiveness program • Identify speakers for public forum, to support the roll‐out
of the plan – someone from HomeTown Competitiveness or Roger Brooks.
• If approved by the state, announce RMDZ designation • Plan and begin internal marketing
90 Days • Hold a Forum • Launch outreach promoting Energy Fitness and services for
local businesses • Conduct meetings with Development Teams to identify
special projects • Continue internal marketing

60 Tehama County Attraction & Retention Program Analysis 60
Appendix 1. Web Survey
2. Tehama County Business Attraction Program presentation, Phase III “How will we get there?” – October 21, 2009
3. Planning forms, Project Implementation Matrix and 30‐60‐90 Day Launch Schedule
4. EDC Funding Survey
5. Tehama Economic Development Alliance (TED), Strategic Initiatives & Action Map
6. 3CORE (formerly Tri‐County ED) Services Sheet
7. AmeriCorps Application
8. Red Bluff Chamber of Commerce Tourism – Marketing Plan, 2009
9. Branding, Development and Marketing Action Plan, prepared by Destination Development through a CDBG grant
10. Upstate California EDC’s 2010 Marketing Schedule

2515 Ceanothus Suite 100 | Chico, CA 95973Phone: 530-345-0364, Fax: 530-345-6417, Toll Free: 800-676-8455 I www.chabinconcepts.com
About the Consulting Team Chabin Concepts’ core competency is in realistic, achievable and measurable actions.
We are more than a consulting group – we are a solutions network. We use our network to bring our clients the best practices of renowned experts in urban and rural economic development, site location analysis and hands‐on experience in implementing and managing competitive and results‐oriented economic development programs.
We value every client and project, respecting the characteristics, heritage and goals of each community, their stakeholders and their economic development team. We commit to integrating our values, integrity and philosophy to create success through:
Involvement of the community and all partner organizations.
Research that is tailored to specific areas of interest, program implementation or industry focus.
A team of experienced and diverse professionals to bring specialized techniques, knowledge, and expertise.
Innovative strategies and creative economic development tools.
Tactical plans designed for implementation.
Effective and successful economic development roadmaps – integrating resources, innovative tools and creative marketing – for communities to accomplish their goals consistent with their values.
The consulting team for Tehama County Business Attraction and Retention Program Analysis included Audrey Taylor, President, Chabin Concepts, Project Team Lead, Fawn McLaughlin (FJMcLaughlin and Associates), Mary Bosch (Marketek) and Sarah Murley (Applied Economics).
The consulting team would like to thank Tehama County Planning Director, George Robson, Tehama County Planning Director, Kathy Schmitz, Job Training Center, Claudia Martin, EDC Director, EDC staff and members of the Board of Directors for their assistance in providing the background and extensive data needed to complete this project.