Business and Application Based Capacity Management · PDF fileBusiness and Application Based...
43
© 2012 IBM Corporation Business and Application Based Capacity Management Ann Dowling, Senior IT Specialist, Technical Solution Owner Clea Zolotow, Senior Technical Staff Member, Delivery Technology & Engineering
Transcript of Business and Application Based Capacity Management · PDF fileBusiness and Application Based...

© 2012 IBM Corporation
Business and Application Based Capacity Management Ann Dowling, Senior IT Specialist, Technical Solution Owner
Clea Zolotow, Senior Technical Staff Member, Delivery Technology & Engineering
1
Please note
IBM’s statements regarding its plans, directions, and intent are subject to change or
withdrawal without notice at IBM’s sole discretion.
Information regarding potential future products is intended to outline our general product direction and it should not be relied on in making a purchasing decision.
The information mentioned regarding potential future products is not a commitment, promise,
or legal obligation to deliver any material, code or functionality. Information about potential future products may not be incorporated into any contract. The development, release, and
timing of any future features or functionality described for our products remains at our sole discretion.
Performance is based on measurements and projections using standard IBM benchmarks in
a controlled environment. The actual throughput or performance that any user will experience will vary depending upon many factors, including considerations such as the amount of multiprogramming in the user’s job stream, the I/O configuration, the storage
configuration, and the workload processed. Therefore, no assurance can be given that an individual user will achieve results similar to those stated here.
2
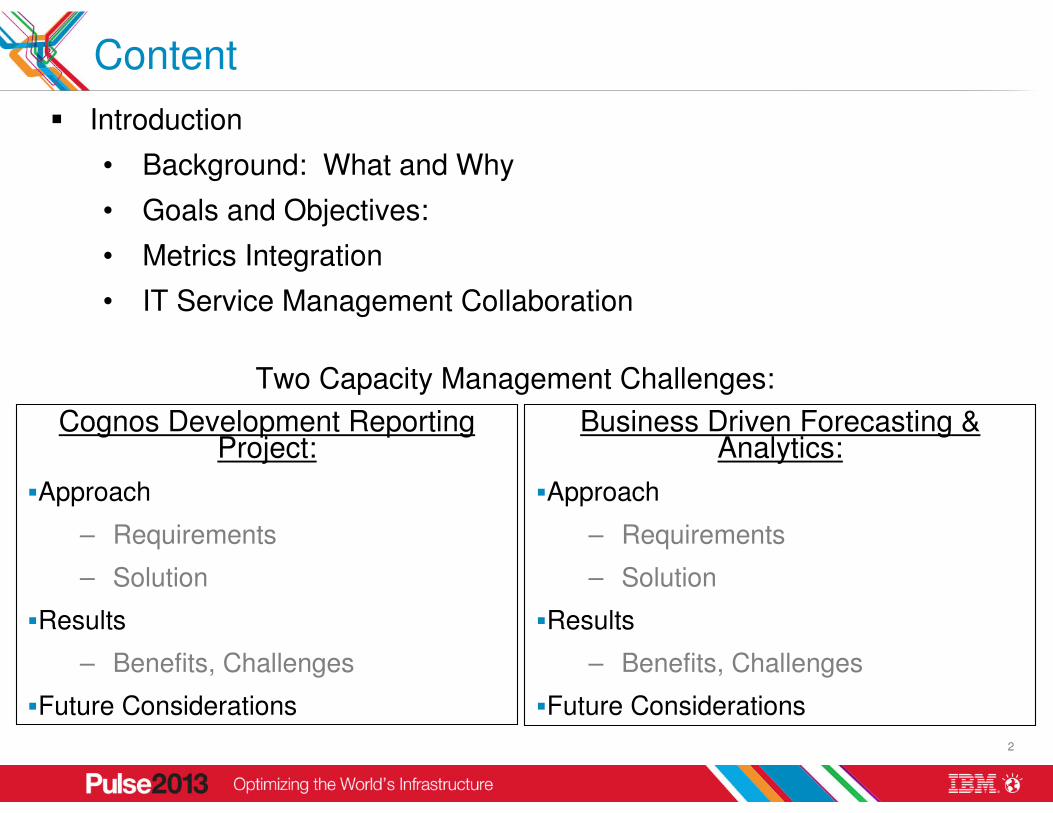
Content
Cognos Development Reporting Project:
�Approach
– Requirements
– Solution
�Results
– Benefits, Challenges
�Future Considerations
Business Driven Forecasting & Analytics:
�Approach
– Requirements
– Solution
�Results
– Benefits, Challenges
�Future Considerations
Two Capacity Management Challenges:
� Introduction
• Background: What and Why
• Goals and Objectives:
• Metrics Integration
• IT Service Management Collaboration

3
Introduction
4
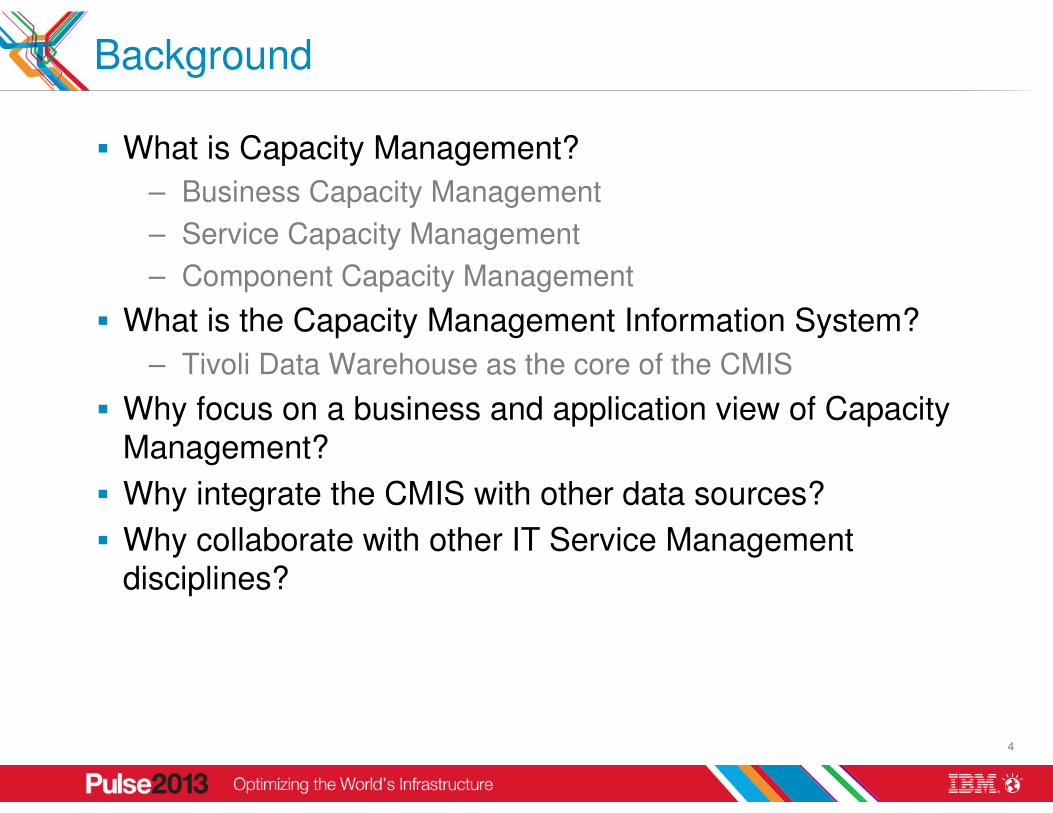
Background
� What is Capacity Management?
– Business Capacity Management
– Service Capacity Management
– Component Capacity Management
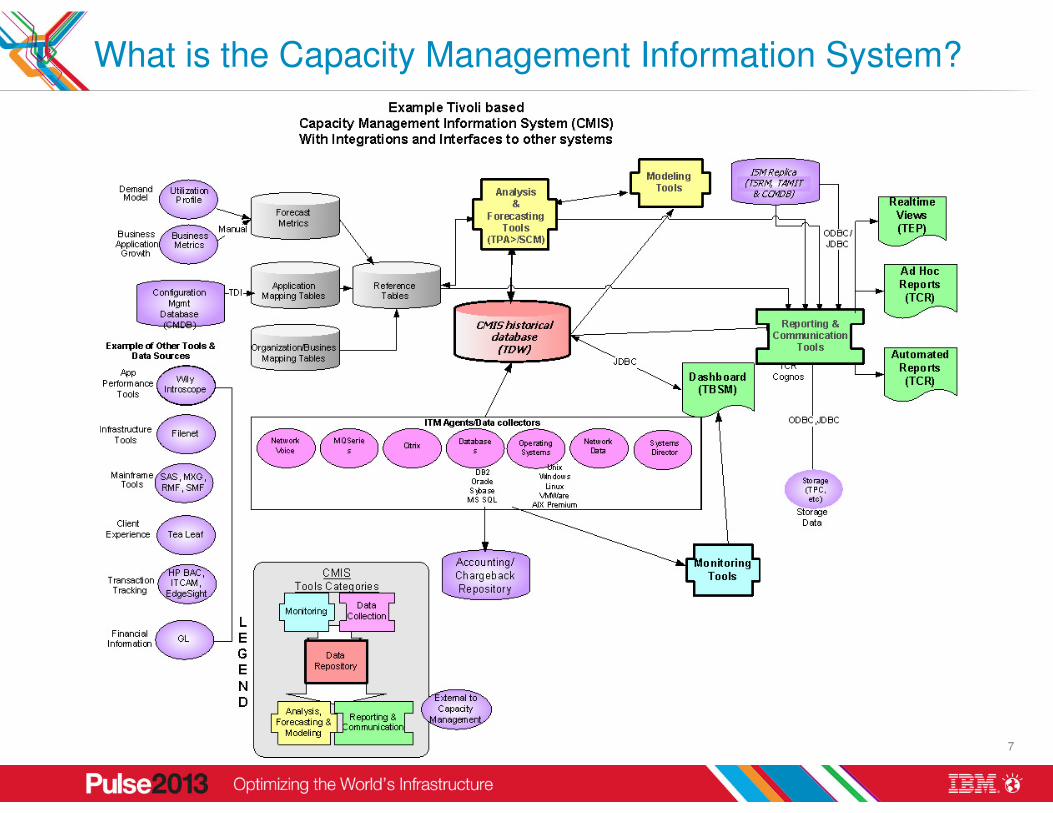
� What is the Capacity Management Information System?
– Tivoli Data Warehouse as the core of the CMIS
� Why focus on a business and application view of Capacity Management?
� Why integrate the CMIS with other data sources?
� Why collaborate with other IT Service Management disciplines?
5
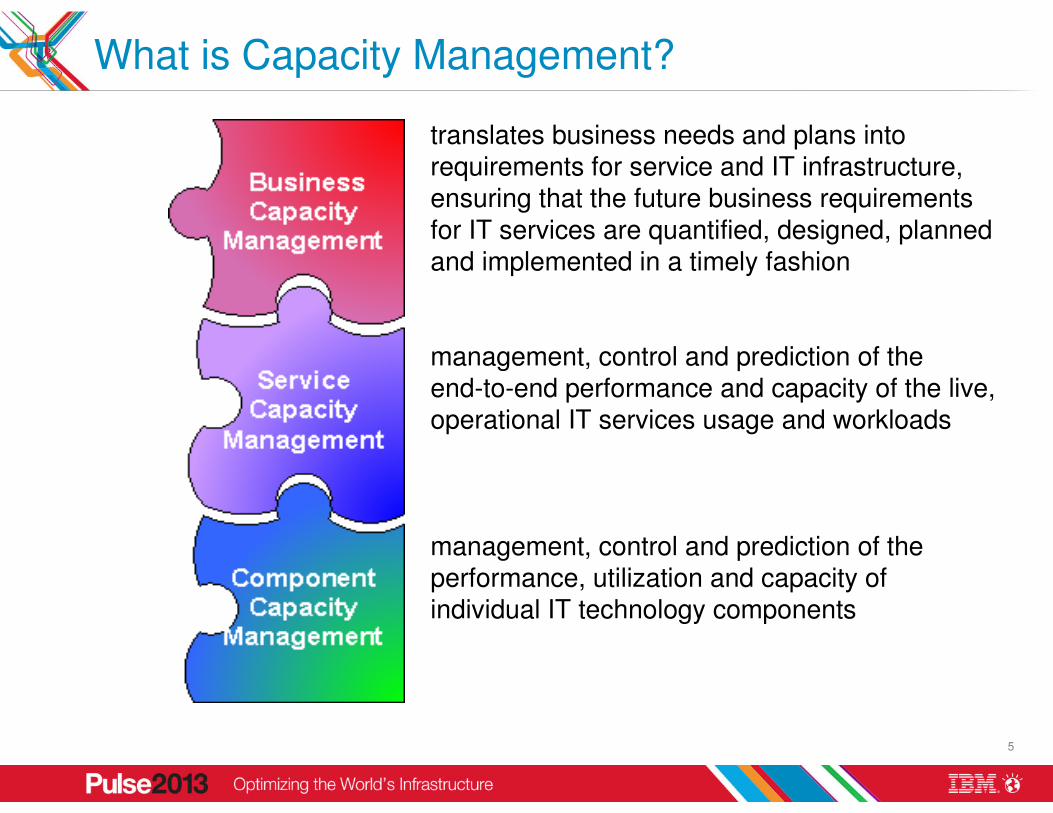
What is Capacity Management?
translates business needs and plans into requirements for service and IT infrastructure,
ensuring that the future business requirements
for IT services are quantified, designed, planned and implemented in a timely fashion
management, control and prediction of the
end-to-end performance and capacity of the live,
operational IT services usage and workloads
management, control and prediction of the
performance, utilization and capacity of
individual IT technology components
6
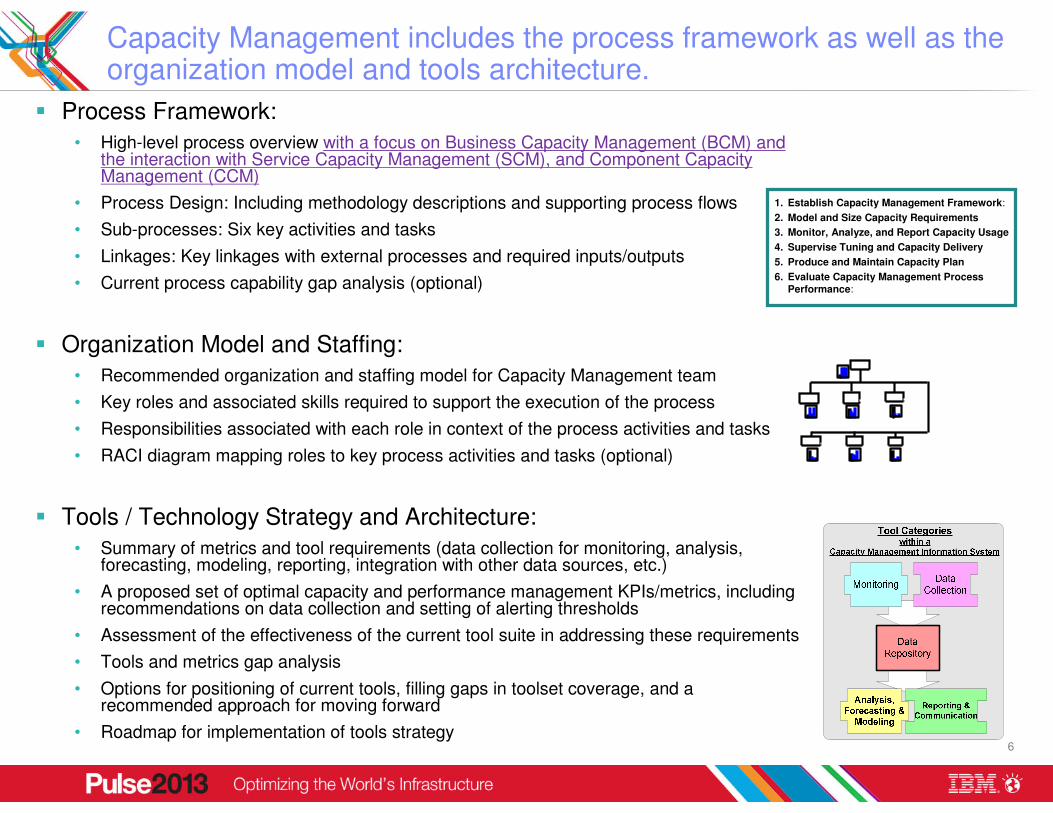
� Process Framework:
• High-level process overview with a focus on Business Capacity Management (BCM) and the interaction with Service Capacity Management (SCM), and Component Capacity Management (CCM)
• Process Design: Including methodology descriptions and supporting process flows
• Sub-processes: Six key activities and tasks
• Linkages: Key linkages with external processes and required inputs/outputs
• Current process capability gap analysis (optional)
� Organization Model and Staffing:
• Recommended organization and staffing model for Capacity Management team
• Key roles and associated skills required to support the execution of the process
• Responsibilities associated with each role in context of the process activities and tasks
• RACI diagram mapping roles to key process activities and tasks (optional)
� Tools / Technology Strategy and Architecture:
• Summary of metrics and tool requirements (data collection for monitoring, analysis, forecasting, modeling, reporting, integration with other data sources, etc.)
• A proposed set of optimal capacity and performance management KPIs/metrics, including recommendations on data collection and setting of alerting thresholds
• Assessment of the effectiveness of the current tool suite in addressing these requirements
• Tools and metrics gap analysis
• Options for positioning of current tools, filling gaps in toolset coverage, and a recommended approach for moving forward
• Roadmap for implementation of tools strategy
Capacity Management includes the process framework as well as the organization model and tools architecture.
1. Establish Capacity Management Framework:
2. Model and Size Capacity Requirements
3. Monitor, Analyze, and Report Capacity Usage
4. Supervise Tuning and Capacity Delivery
5. Produce and Maintain Capacity Plan
6. Evaluate Capacity Management Process Performance:
7
What is the Capacity Management Information System?
8
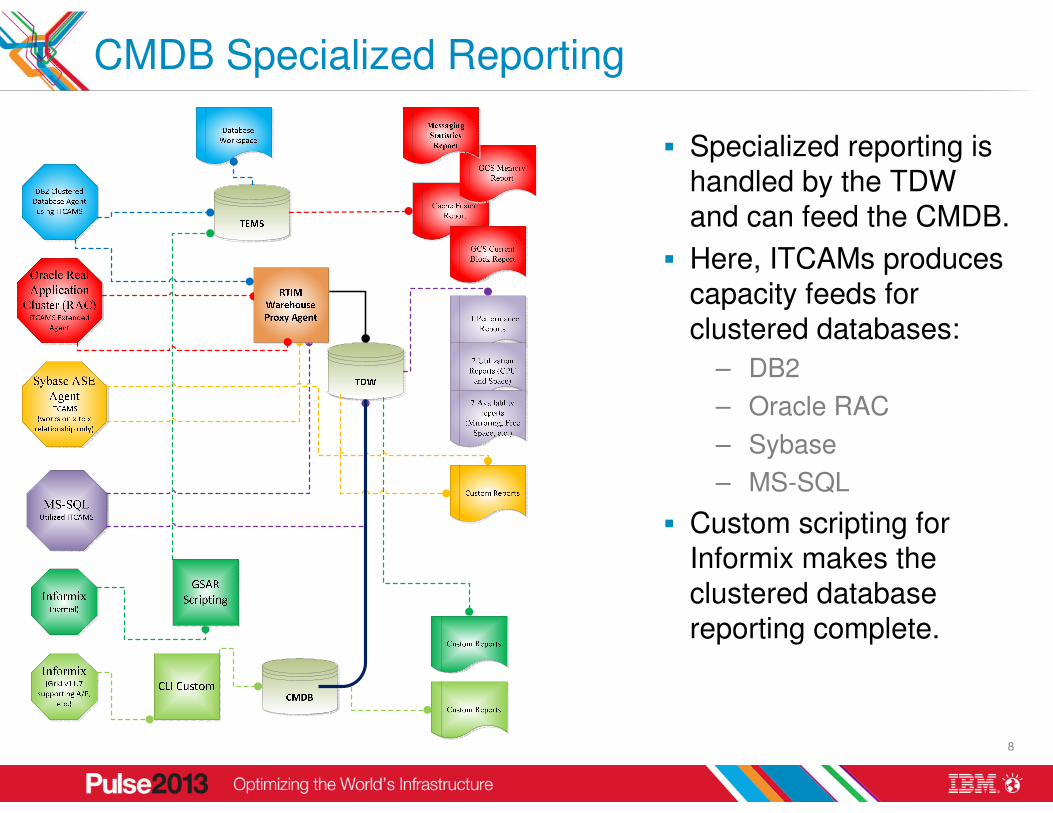
CMDB Specialized Reporting
� Specialized reporting is
handled by the TDW
and can feed the CMDB.
� Here, ITCAMs produces
capacity feeds for
clustered databases:
– DB2
– Oracle RAC
– Sybase
– MS-SQL
� Custom scripting for
Informix makes the
clustered database
reporting complete.
9
Goals and Objectives
� The main goal of the collaboration and metrics integration is to ensure the business based performance and capacity requirements are met.
� Mapping critical business applications to the infrastructure server components is essential:
– IT Service Management collaboration
– Metrics Integration – linking diverse data sources
10
Metrics Integration
� Tivoli Data Warehouse (TDW) is an ideal core data repository for a Capacity Management Information System (CMIS) tools architecture to enable an expert integrated set of solutions that merge:
– Business,
– Financial (capex and opex), and
– Capacity and performance requirements.
� These custom solutions utilize:
– Capacity and performance historical data in the CMIS (ITM/TDW),
– Incidents in the Configuration Management DataBase (CMDB),
– Auto-ticketing of incidents,
– Application to infrastructure mapping data, and
– Business driver metrics

11
Capex Avoidance utilizing the CMDB
� Rightsizing LPARs and optimizing frames (Opex) results in CPU and frame savings.
� Capex avoidance results as unneeded frames are reused or repurposed.
� This methodology has saved millions at IBM and their customers.

12
Metrics Integration: Auto-ticketing of incidents
Weekly
Exception
Reporting
Closed Loop
Reporting
Application
Problem
?
Take off ListYes
Return for
Ticketing
No
Already
Ticketed
?
Yes
No
Create Sev 3
Ticket to SA
Upgrade
Required
(root cause
determination
meeting)
Work Intake
(significant change)
Config Change or
Significant
Change Control
Process
Significant
Config
CMIS historical
database
(TDW)
� The CMIS used for both real
time performance tickets as
well as capacity planning
alerting.
� This system pre-alerted to
resource related outages so
well the real-time performance
tickets generated fell from
hundreds to 2 or three per
month.
� Hundreds of servers showing
non-green on CPU, Memory,
IO, etc. were resolved quickly

13
Metrics Integration for Business Driven Forecasting and Analytics
� The Business Driven
Forecasting
technique requires
data sources for
Business Data,
Service Data, and
Component Data
� Leveraging SPSS
allows for integration
of multiple and
varied data sources,
statistical analysis,
and a presentation
layer for
communication and
reporting

14
IT Service Management collaboration
� Defining interfaces between these multiple data sources involves collaboration from an IT Service Management perspective, linking:
– Capacity Management with
– Event Management,
– Incident Management,
– Configuration Management to enhance the services provided in support of a midrange server environment.
� Further enhancements can also involve:
– Demand Management,
– Change Management, and
– Performance Engineering

15
Cognos Development Reporting Project:
Approach

16
Approach: Requirements
� Deliverable: Customer reporting enhancements – IBM to guide the customer for reporting requirement's to manage the customers large server farm.
� The IBM Cognos development team created reports to manage large server farms with multiple operating systems.
� Phase 1 requirements created Cognos customer reports cloned from the current Brio reports.
� Phase 2 added customer report updates to the phase 1 developed IBM customer Cognos reports. The customer submitted 200 PTR’s with enhancements and changes to the reporting.
� These changes would allow for ease of use within the customers user base.

17
Approach: Release Information
� Production Cognos:
– Cognos 8.4 base release.
– Models are the ITM 6.2.2 Capacity and Performance design.
– TCR 1.3.
– Tivoli Data Warehouse.
� In progress Cognos:
– Cognos 8.4.1 base release.
– Models are the ITM 6.2.3 Capacity
and Performance design
– TCR 2.1.1
– Tivoli Data Warehouse

18
Approach: Solution� The Cognos team developed 27 reports by operating system including each area (CPU, Memory, Disk, & Network) for
capacity planning, performance, and exception reporting based from the Brio code and further enhanced with customer input.
� The team created on-line enhancements to Cognos to give the customer the ability to filter reports by applications and/or severs for their specific user departments.
� The team further included new report metrics and report format changes.
� The team closed a total of 900 PTRs: 700 PTRs during Phase 1 and 200 PTRs during Phase 2. These resulted in over 1000 changes to the reporting system.
� The team opened 15 PMRs to Tivoli.
� The below matrix shows the reports that were designed for Performance and Capacity Management teams in order to better review large server farms periodically and ensure important metrics were co-located.

19
Solution: Cognos Report Design Process and End-Product Features� Report Design Process:
– Two Cognos report developers managed all report changes and designs.– Capacity team lead assisted with report design and UAT.– Capacity team lead managed all time frames for completion.
– Versioning into source control designed to manage each phase of report source code. – Multiple phases have been developed to include many enhancements and changes.
� Report Design End-Product– Designed to be ‘like’ out of box reporting with prompts.– Reports include detailed and summary reports.– All reports designed the same to allow for ease of use across all platforms.– Reports contain multiple queries so all specific metrics are included into one report.– Models changed to include application mapping changes for customer data.– Initial reports are weekly reports utilizing hourly data.– Ad hoc and specialty reports developed and included with weekly reports.– Appendix pages added to all reports.– Column organization designed so all columns and metrics are in specific order for ease of use.

20
Cognos Development Reporting Project:
Results

21
Results: Benefits
� Cognos reporting has the capability to manage large server farms by providing reporting by operating systems. This customization project had the following impact:
� Decreased Manual Effort: Capacity and performance no longer has to write and run their own reports. Time can now be spent researching and reviewing technical problems due to the enhanced automation of the reports.
� Custom Reporting for Cost Savings – Reports were designed for rightsizing LPARs.
� Exception Reporting for Closed Loop – Closed Loop Ticketing process is supported by custom exception reporting.
� Custom Time Series in Reporting – Data is used for standard reporting at the hourly level, providing more granularity than the out-of-box reports.
� Customized Prompts for Time Selection – Choice of an hour or range of time can now be done in the on-line interface.
� Migrating from a sunset product (Brio).� Scalable reporting
These reports provide a level of automation and intellectual capital that should be reused across IBM and our Tivoli Customers

22
Results: Challenges
� The customer was a little
challenging.

23
Results: Customer Application Mapping Definition:
� Application Mapping Description:
– The customer requested that Cognos custom reports to include application mapping into the reporting. The metrics that are used in multiple reports.
– Most of the metrics used are for the businesses reference.
– The metrics for the application mapping is taken from the IBM TSRM data base and transposed into a Excel spread sheet. This spread sheet is then imported into a DB2 table by the DBA on a periodic basis.
– The original 8.4 Cognos models utilized application mapping in the dimensions tables and some of the query subjects.
� Application Mapping Metrics:
– Environment – Production, Test, Development, etc.
– Application Name – Primary application as defined on the servers, for example Websphere Marketing
– Virtual – If the server is virtualized or standalone
– OS Name – The name of the operating system (for example Windows 2003)
– Platform – Whether the application runs on xSeries, pSeries, or Solaris hardware.
– Application ID – Used in application definitions (as shown to the right)

24
Business Driven Forecasting and Analytics:
Approach

25
Approach for Business Driven Forecasting and Analytics: Requirements
Executives often want to know how a change in their business will impact IT demand and if they have sufficient capacity to satisfy the demand:
�We are bringing in four more hospitals over the next 6 months. Do we
have enough capacity in our infrastructure?
�With the new healthcare laws we expect significant growth in the
number of clients. Do we have enough capacity to handle the peak
enrollment period?
�We are shifting our bank tellers to an automated system that will allow
us to increase the number of customers we serve from our branch
locations. Will we have enough capacity in our infrastructure to handle
the increase in customers using new video, audio, and scanning
technology?

26
Business Driven Forecasting is a technique that can help address these questions.
Language difference between business and IT
– When the business launches a marketing campaign, the IT organization should be informed to take appropriate measures, for instance to increase the number of application servers because more customers will connect with the internet environment.
– The business cannot be expected, however, to tell the IT which components should be adjusted and how much. They even might not know at all which components are involved. For the same reason it will be difficult for IT to understand how a business statement like “we expect 30% more internet visitors” translates to more CPU, memory, disk space, etc.
Without the ability to use
business plans in Capacity
planning, one can only use historical information to
forecast the future demand.
This is essentially the same
as “driving a car while only
using the rear view mirror”.
� Raises the level of accuracy and objectivity associated with forecasting IT resource usage
� Minimizes associated risks
� Helps to better meet customer service and business requirements
� Helps Forecasting Specialists get in step with the business leaders
� Expands the scope of traditional Component Capacity Management by combining both technical and business issues, preferences and practices of the enterprise

27
Approach for Business Driven Forecasting and Analytics: Solution
� A Business Driven Forecasting methodology consists of eight basic steps:
1. Identify the major applications of interest to be included in the analysis2. Identify the candidate business metrics used in business planning and
operational measurements, and map these metrics to the selected applications and associated business transactions
3. Quantify the business driver values and associated IT performance metric levels over time
4. Evaluate the correlations between business drivers and IT metrics, and identify correlated sets of drivers and metrics
5. Develop a regression curve to define the relationship between the selected business drivers and IT metrics
6. Define the forecasted values for the selected business drivers
7. Translate the business driver forecasts into IT metric levels as a function of time
8. Assess the capability of the existing infrastructure to support forecasted business driver levels and identify infrastructure configuration changes required to achieve IT metric service level targets over time

28
Approach for Business Driven Forecasting and Analytics: Solution
� Prior techniques have relied heavily on manual data entry and analysis
using spreadsheet and basic statistical functions for correlation and
coefficients
� Recent Capacity Management services solutions are using an
innovative Use Case based approach to address stability, performance,
and scalability objectives:
� The solution involves development of a set of re-useable SPSS Models
to formalize the:
– Collection of multiple and varied data sources
– Integration of these data sources into a set of SPSS streams
– Statistical analysis for a variety of Use Cases
– Presentation of results
� One of the Use Cases is to “Estimate the impact of planned business
change” based on Business Driven Forecasting techniques
– Goal: Determine, via the SPSS Capacity Model, what the expected impact
is with respect to resource usage in an application chain when a change in usage of the chain is considered.

29
Business Driven Forecasting and Analytics:
Results

30
Business Driven ForecastingResults using traditional methods showed an acceptable correlation between Number of Visits and CPU Utilization
� Analysis validated that the number of visits is correlated with the server CPU utilization levels
– “Good” correlation for full month of data– Weekly data demonstrates clear and reasonably consistent correlation
– Correlations generally (but not always) somewhat stronger for Monday through Friday data– Keep in mind that we have a small number of data points per week where the server CPU utilization
is noticeably higher than anticipated given the number of visits (valid points or outliers?
� Conclusion: Number of visits should be a valid predictor of server CPU utilization levels– This is not to say that number of visits is the only valid, or the best, predictor of server CPU
utilization– May also want to consider visitor minutes, which measures the total number of minutes the website
is visited regardless of the number of visitors– This metric may provide a better correlation with the peak CPU utilization levels?
Correlation between number of visits and CPU utilization
Server ABC: 0.79

31
The next step was to project CPU Utilizations based on the forecasted business volumes
� Focus is on CPU utilization for server ABC � Business driver used as basis for projected CPU utilization: Number of visits� Model for CPU projection based on ~95th percentile peak hour average CPU
utilizations
� Server CPU utilization threshold level: peak hourly average of 70% � Business volume (number of visits per hour) growth ranging from 2.5% to 25% per
quarter
� Application profiles for March are consistent with and representative of the forecast period
� No major environmental changes which impact server CPU utilization levels

32
Business Driven Forecasting and Analytics: Results using SPSS Modeller
� Modernized traditional Capacity Management
techniques:
– Leveraged SPSS Modeling to manage and analyze
relationships of multiple data sources:
• Business metrics – candidate drivers of IT resource consumption
• IT component usage metrics:
– Capacity: cpu, memory, disk, bandwidth
– Performance: response time, throughput, latency
• Event and incident metrics – capacity shortage
related:
– Cpu, memory, io, buffer pools, threads
– Apply SPSS Statistics and develop algorithms:
• Application Profile of workload characterization – time
series based patterns of behavior
– Seasonal load (hourly, daily, weekly, monthly, annually)
– Event based peak load (marketing campaigns, M&A
– Major changes that will impact capacity, performance,
and scalability
• Impact of changes over time

33
Goal: Determine, via the Capacity Model, what the expected impact is with respect to resource usage in a application chain when a change in usage of the chain is considered.
Example: Use case 2: Estimate impact of planned business change
Maximum peak growth possible in Application abc123 and xyz456 usage is 90%.
Date and time
The Capacity Model is excellent:Predicted CPU values (red) are very near the actually measured CPU values (blue).
Predictions are made with abc123 and xyz456 activity as input parameters.
Used CPU
Growth of 90% in abd123 and xyz456 peak hour acitivity leads to 100% CPU usage
40%
20%
0%
The Capacity Model for CPU showing the predictors and their coefficients
� Analysis• Application abc123 * 0,00001445 +• xyz456_Agent * 0,0001091 +• xyz456_OfficeUser * 0,0001622 +• Xyz456_OperationUser * 0,0002455 +• 0,1014

34
Business Driven Forecasting and Analytics: Future opportunities
� Modernize traditional Capacity Management techniques using new
data, tools, and analytics capabilities:
– Develop industry templates
– Productize
– Automate
– Align Business Analytics with Infrastructure Analytics
� Leverage Capacity Planning functions in Tivoli’s Smart Cloud
Monitoring (SCM)
� Expand on the library of reusable SPSS models

35
Special Thanks.
� Thanks to the following individuals:– Chris Malone
– Hariet von Moltke
– James Jackson
– Joseph Caldwell
– Kinjal Patel
– Maris van Sprang
– Mike Scully
– Russ Egeland
– Wayne Peterson
� References– Pulse 2013 “Improving Service Availability by Proactive Capacity and Performance Analytics” by Mithkal Smadi’s
– IBM Corporation, IBM Tivoli Composite Application Manager for Applications documentation,
http://publib.boulder.ibm.com/infocenter/tivihelp/v24r1/index.jsp?topic=%2Fcom.ibm.itcama.doc_6.2.4%2Fwelcome.htm , retrieved February 2011.
– Oracle Corporation, ORACLE REAL APPLICATION CLUSTERS, http://www.oracle.com/technetwork/database/clustering/overview/ds-rac-11gr2-134513.pdf, retrieved February 2011
– IBM Corporation, Monitoring, Version 6.1,
http://pic.dhe.ibm.com/infocenter/tivihelp/v15r1/index.jsp?topic=%2Fcom.ibm.itm.doc_6.1%2Fitmintro.htm, retrieved February 2011
– Business-driven capacity planning for AIX, AIX update #111, January 2005
• https://docs.google.com/viewer?url=http%3A%2F%2Fwww.cbttape.org%2Fxephon%2Fxephona%2Faix0501.pdf
– Business-driven capacity planning for AIX: concepts and principles, AIX Update #109, November 2004:
• https://docs.google.com/viewer?url=http%3A%2F%2Fwww.cbttape.org%2Fxephon%2Fxephona%2Faix0411.pdf

36
Addendum
36

37
Approach: Solution – Phase 1
� Phase One: Initial Report Production
– Rewrite the Brio code utilizing COGNOS.
– Update the reports with customer requirements for filtering and prompting to allow for
individual customer departments requirements.
– Include metrics from the customer provided table for applications and sever description definitions.
– New on-line changes would allow for individual customer departments to filter for only
specific severs and LPARs.
– 700 PTRs closed.
37
Sample COGNOS report exported to Excel

38
Approach: Solution – Phase Two.
� Phase Two: Updating Reports to Customer Requirements
– Update all reports to include additional data requirements and refresh production
reports.
– Install customer-requested changes data items and formats to allow for more meaningful metrics to the individual departments.
– 200 PTRs closed.
38
Sample COGNOS report exported to Excel

39
Solution - Major Customization Points: Prompting and Dynamic Thresholds
� Prompt pages developed to allow for:
– Scheduling of reports.
– Reducing refining to with in an hour.
– Detailed metrics allowing reduction to specific areas.
– Scheduling and prompts for detailed metrics to allow users to reduce the reporting to specific areas.
� Dynamic thresholds have been built into report prompt pages and report columns which allow:
– The ability to be changed to meet customized requirements.
– Management at the prompt page.
– Thresholds have been built into report prompt pages and report columns.
– The ability to change to meet customer department adjustments. The threshold metrics can be at the prompt page.

40
Solution - Major Customization Points: Prompting and Dynamic Thresholds
� All prompt metrics are displayed on the report headers. This allows for:
– Inclusion and elimination of week days and week ends.
– Calculated shift metrics for flexibility.
– Thresholds from prompt are displayed with color coded metrics in the report header.
– Date count added to report header for ad hoc reporting. Displays on number of days used in the report.
� Report Output is designed for:
– Scheduling and emailing to users.
– Save a report copy in TCR for reuse
� Report Appendix is added:
– Consistently to all reports.
– Comes with report overview.
– Includes column definitions and often formula definitions.

41
Results: Future
� Cognos Reports Production and Development:
– Monthly reports with charts and metrics - Development stage.
– WAS (Web Application Systems) with
charts and metrics - Development Stage.
– Ad hoc reports in production and development stage.
– SPE weekly reports.� Additional Scheduled Cognos Projects:
– Update out of box reports with weekly report prompts.
– Add drill through to specific reports.– Add charts and graphs to specific
reports– Add trending and forecasting to
specific reports
– Add dashboards to specific reports.– Upgrade to TCR 3.1.1 and Cognos
10. � Next steps with the Tivoli team?

42
Acknowledgements and Disclaimers
© Copyright IBM Corporation 2013. All rights reserved.
� U.S. Government Users Restricted Rights - Use, duplication or disclosure restricted by GSA ADP Schedule Contract with IBM Corp.
IBM, the IBM logo, ibm.com, Cognos® , SPSS®, Tivoli®, and DB2® , FileNet® , Informix® , RMF™ are trademarks or registered trademarks of International Business Machines Corporation in the United States, other countries, or both. If these and other IBMtrademarked terms are marked on their first occurrence in this information with a trademark symbol (® or ™), these symbols indicate U.S. registered or common law trademarks owned by IBM at the time this information was published. Such trademarks may also be registered or common law trademarks in other countries. A current list of IBM trademarks is available on the Web at “Copyright and trademark information” at www.ibm.com/legal/copytrade.shtml
Other company, product, or service names may be trademarks or service marks of others: Citrix® EdgeSight™ , SAS® software
Availability. References in this presentation to IBM products, programs, or services do not imply that they will be available in all countries in which IBM operates.
The workshops, sessions and materials have been prepared by IBM or the session speakers and reflect their own views. They are provided for informational purposes only, and are neither intended to, nor shall have the effect of being, legal or other guidance or advice to any participant. While efforts were made to verify the completeness and accuracy of the information contained in thispresentation, it is provided AS-IS without warranty of any kind, express or implied. IBM shall not be responsible for any damages arising out of the use of, or otherwise related to, this presentation or any other materials. Nothing contained in this presentation is intended to, nor shall have the effect of, creating any warranties or representations from IBM or its suppliers or licensors, or altering the terms and conditions of the applicable license agreement governing the use of IBM software.
All customer examples described are presented as illustrations of how those customers have used IBM products and the results they may have achieved. Actual environmental costs and performance characteristics may vary by customer. Nothing contained in thesematerials is intended to, nor shall have the effect of, stating or implying that any activities undertaken by you will result in any specific sales, revenue growth or other results.