Business Analytics Expert Masters program - Simplilearn · PDF fileAbout The Master Course The...
17
BUSINESS ANALYTICS EXPERT
Transcript of Business Analytics Expert Masters program - Simplilearn · PDF fileAbout The Master Course The...

BUSINESS ANALYTICS EXPERT
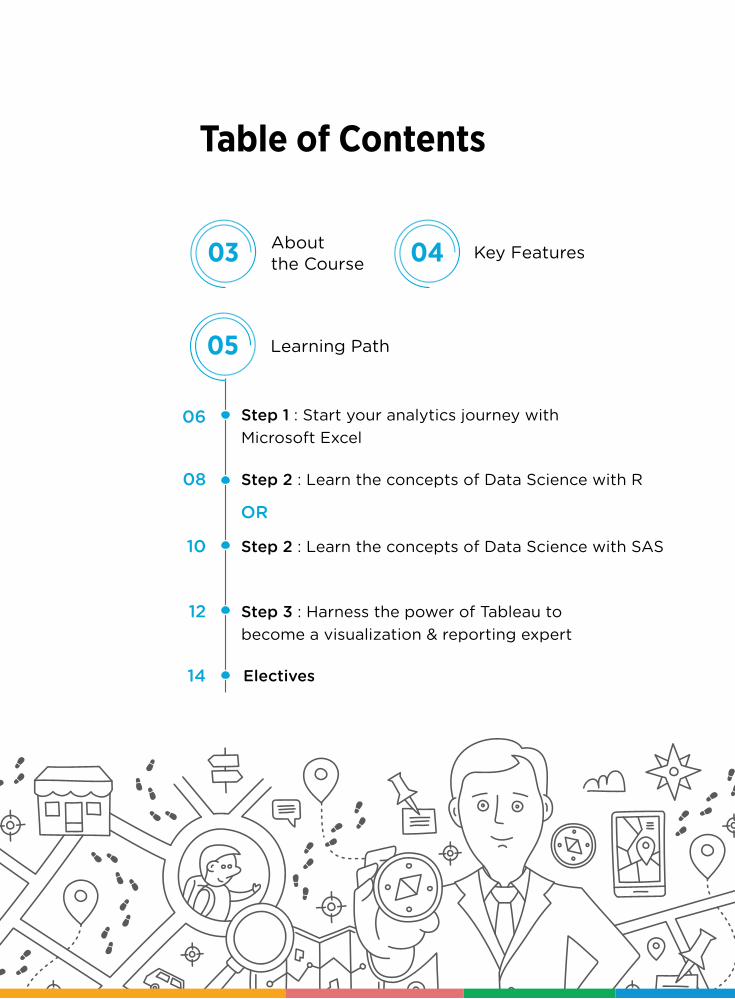
Table of Contents
Aboutthe Course
Step 1 : Start your analytics journey with Microsoft Excel
Step 2 : Learn the concepts of Data Science with R
OR
Step 3 : Harness the power of Tableau to become a visualization & reporting expert
Electives
03
06
08
12
14
Learning Path
Key Features04
Step 2 : Learn the concepts of Data Science with SAS10
05
About The Master Course
The Business Analytics Expert Masters program has been designed to introduce you to the world of business analytics and elevate your skills to ultimately become a business analyst. As business analyst, you must be able to work with multiple data formats and have knowledge of the algorithms that can help you extract useful data. If you are pursuing a career in analytics, this is the program for you.
03 | www.simplilearn.com
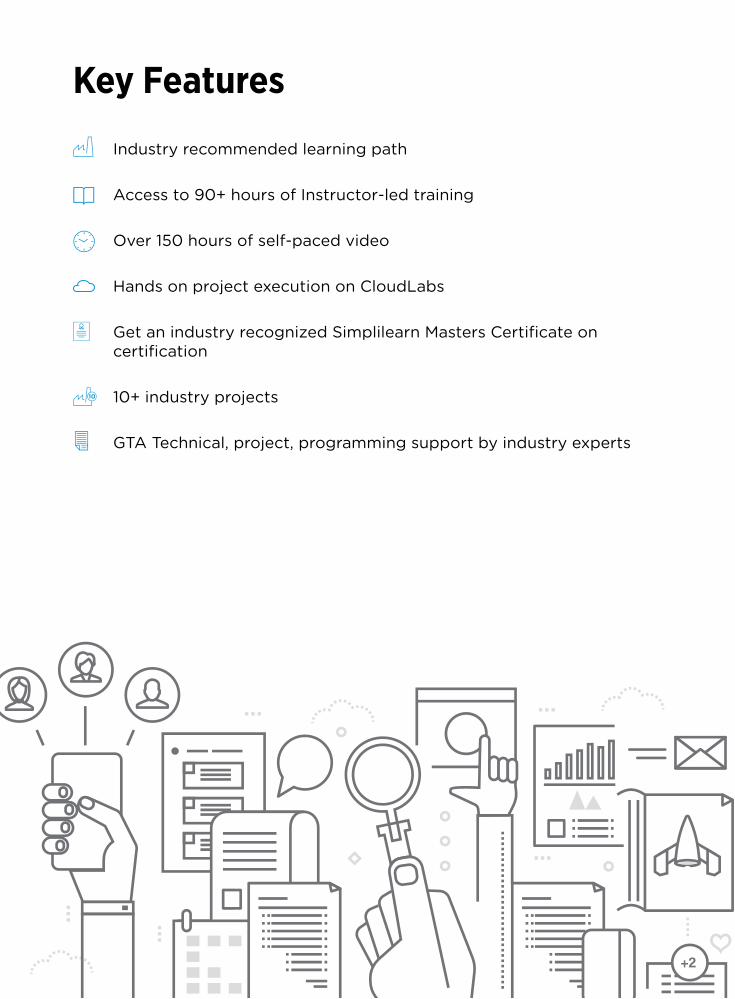
Key Features
Industry recommended learning path
Access to 90+ hours of Instructor-led training
Over 150 hours of self-paced video
Hands on project execution on CloudLabs
Get an industry recognized Simplilearn Masters Certificate on certification
10+ industry projects
GTA Technical, project, programming support by industry experts
10
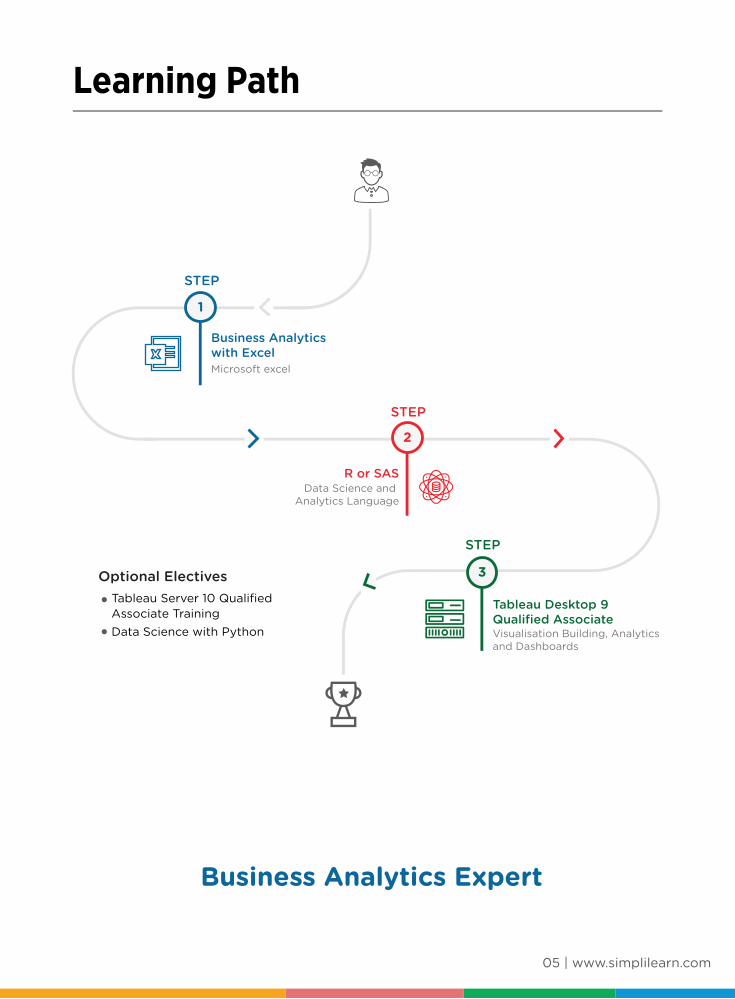
Learning Path
05 | www.simplilearn.com
Business Analytics Expert
Business Analytics with ExcelMicrosoft excel
Optional ElectivesTableau Server 10 Qualified Associate TrainingData Science with Python
R or SASData Science and
Analytics Language
STEP
2
STEP
1
Tableau Desktop 9 Qualified AssociateVisualisation Building, Analytics and Dashboards
STEP
3
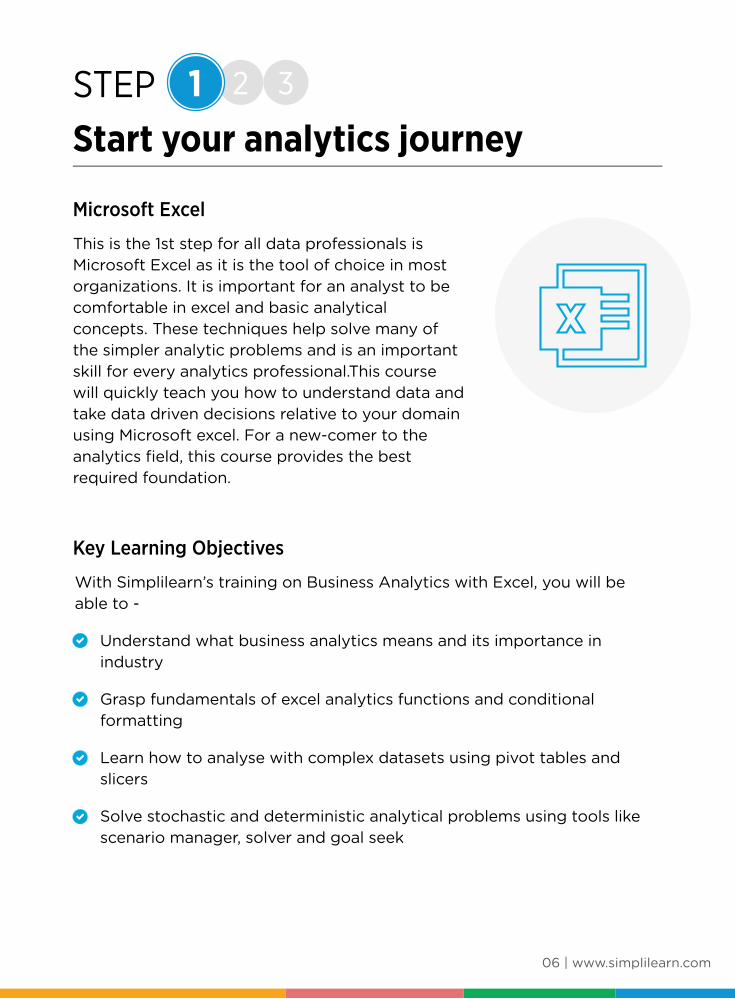
STEPStart your analytics journey
Microsoft Excel
1 2 3
This is the 1st step for all data professionals is Microsoft Excel as it is the tool of choice in most organizations. It is important for an analyst to be comfortable in excel and basic analytical concepts. These techniques help solve many of the simpler analytic problems and is an important skill for every analytics professional.This course will quickly teach you how to understand data and take data driven decisions relative to your domain using Microsoft excel. For a new-comer to the analytics field, this course provides the best required foundation.
Key Learning Objectives
With Simplilearn’s training on Business Analytics with Excel, you will be able to -
Understand what business analytics means and its importance in industry
Grasp fundamentals of excel analytics functions and conditional formatting
Learn how to analyse with complex datasets using pivot tables and slicers
Solve stochastic and deterministic analytical problems using tools like scenario manager, solver and goal seek
06 | www.simplilearn.com
Introduction to Business Analytics
Formatting Conditional Formatting and Important Functions
Analysing Data with Pivot Tables
Dash boarding
Business Analytics with Excel
Data Analysis Using Statistics
Power BI
Course Curriculum
Apply statistical tools and concepts like moving average, hypothesis testing, ANOVA and regression to data sets using excel
Represent your findings using charts and dashboards
Get introduced to the latest Microsoft analytic and visualization tools i.e. Power BI
STEPLearn the concepts of Data Science - the most used open source technology
Data Science with R
1 3
The next step to a business analytics expert is learning R - the upcoming and most in-demand open source technology. R is is an extremely powerful data science and analytics language which has a steep learning curve and a very vibrant community. This is why it is quickly becoming the technology of choice for organizations who are adopting the power of analytics for competitive advantage.
Key Learning Objectives
Simplilearn's Data Science with R programming certification has a clear focus on the vital concepts of business analytics and R programming. By the end of training, participants will be able to:
Work on data exploration, data visualization, and predictive modeling techniques with ease.
Gain fundamental knowledge on analytics and how it assists with decision making.
Work with confidence using the R language.
Understand and work on statistical concepts like linear & logistic regression, cluster analysis, and forecasting.
2
08 | www.simplilearn.com
Introduction to Analytics
Statistical Concepts And Their Application In Business
Basic Analytic Techniques - Using R
Data Exploration
Data Visualization
Diagnostic Analytics
Linear Regression
Logistic Regression
Cluster Analysis
Time Series Analysis
Course Curriculum
Develop a structured approach to use statistical techniques and the R language.
Perform sharp data analysis to make business decisions.
STEPStart your Analytics journey - the most popular analytics Platform
Data Science with SAS
1 3
As you progress in the field of analytics it is important to understand various statistical concepts and learn the latest technology to apply these tools. After completing this course you will be ready to work on analytics projects in some of the biggest companies in the world, as SAS is one of the most populat Data Science and analytics platforms.
Key Learning Objectives
After completing this course, you will be able to:
Outline what Data Science and how SAS can help implement it
Explain the di�erent methods used to combine and modify datasets
Explain what PROC SQL is and how it is used to retrieve data from single and multiple tables.
Describe how to use macro function to manipulate the character strings and text.
Explore the various testing techniques used in an inferential statistics.
List the various statistical procedures and learn how to create graphs and interpret the results.
2
10 | www.simplilearn.com
Analytics Overview
SAS Introduction
Combining/Modifying Datasets
PROC SQL
SAS Macros
Basic Statistics
Basic Statistical Procedures
Data Exploration
Advanced Statistical Techniques
Working with Time series Data
Data Optimization using SAS
Course Curriculum
Understand how SAS handles missing values in your datasets using various procedures.
Explain the ways to create a cluster and to perform cluster analysis on the dataset.
List the various time series models of SAS.
Illustrate the problems involved in optimization.
11 | www.simplilearn.com
STEPHarness the power of Tableau to become a visualization & reporting expert
Data Visualisation with Tableau
1 2
The final step to a business analytics expert is the ability to work with data visualization & reporting. The focus of the course is to help you learn Tableau Desktop 9 skills, such as visualisation building, analytics and dashboards. This Tableau course also ensures you are well-prepared to clear Tableau Desktop 9 Qualified Associate exam of Tableau. The course also contains 4 industry projects which will help you gain real world experience in Tableau Desktop 9 industry application.
Key Learning Objectives
With Simplilearn’s training on Tableau Desktop 9, you will be able to -
Grasp the concepts of Tableau Desktop 9 and become proficient with Tableau statistics and building interactive dashboards
Master data connections as well as organizing and simplifying data
Become expert in formatting, annotations and spatial analysis
Master Special Field Types and Tableau Generated Fields
12 | www.simplilearn.com
3
13 | www.simplilearn.com
Introduction
Field Types and Visual
Data Connection in Tableau
Organizing and Simplifying Data
Formatting and
Special Field Types
Tableau Generated Fields
Chart Types
Calculations
Creating and using Parameters
Mapping
Statistics
Dashboards
Case Studies
Course Curriculum
Understand the concepts of using charts including pareto, waterfall, gantt, box plots, sparkline and also perform market basket analysis
Become expert in fundamental calculations along with automatic and custom split, ad-hoc analytics, and LOD calculations
Master process of Creating and Using Parameters and gain command over mapping concepts such as custom geocoding and radial selections"
Other Electives:
Tableau Server 10 Qualified Associate Training
Master the various aspects of Tableau Server 10 and gain skills to implement, administer, and manage it. Learn how to navigate the server, manage content, workbooks, and views on Tableau server including command line tools, JavaScript API, and REST API. The course includes 2 industry-based projects on the education system and creating a development environment. It prepares you for Tableau Server 10 qualified associate exam.
Data Science with Python
Python is a general purpose multi-paradigm programming language for data science that has gained wide popularity because of its syntax simplicity and operability on di�erent eco-systems. This Python course can help programmers play with data by allowing them to do anything they need- data munging, data wrangling, website scraping, web application building, data engineering and more. The Python language makes it easy for programmers to write maintainable, large scale, and robust code.
14 | www.simplilearn.com
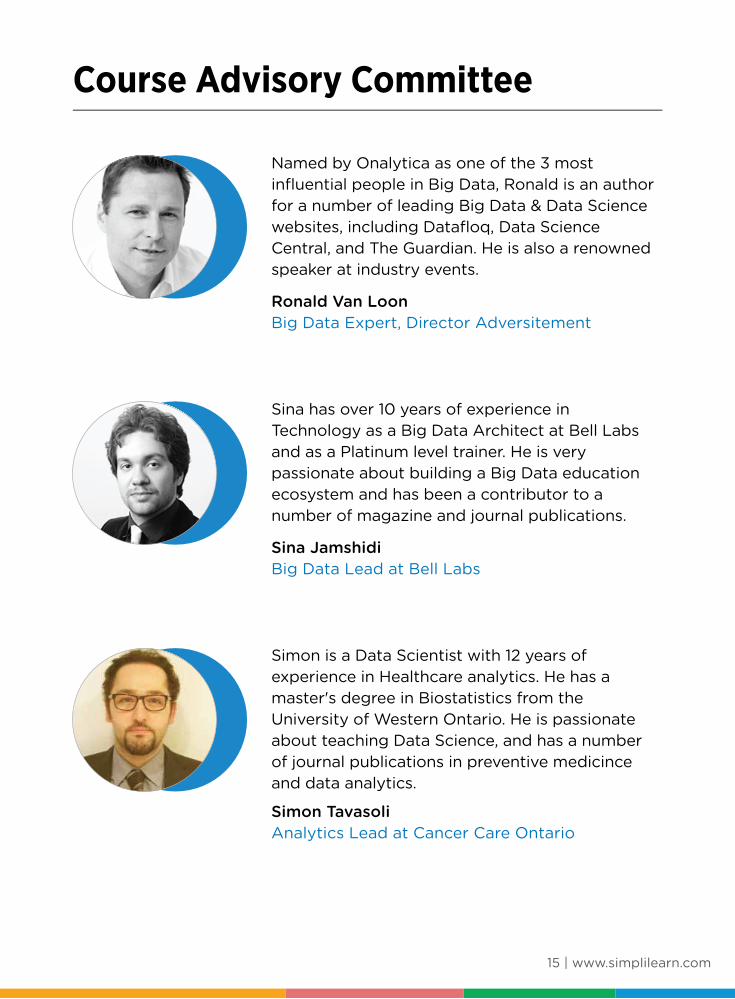
Course Advisory Committee
Named by Onalytica as one of the 3 most influential people in Big Data, Ronald is an author for a number of leading Big Data & Data Science websites, including Datafloq, Data Science Central, and The Guardian. He is also a renowned speaker at industry events.
Ronald Van LoonBig Data Expert, Director Adversitement
15 | www.simplilearn.com
Sina has over 10 years of experience in Technology as a Big Data Architect at Bell Labs and as a Platinum level trainer. He is very passionate about building a Big Data education ecosystem and has been a contributor to a number of magazine and journal publications.
Sina JamshidiBig Data Lead at Bell Labs
Simon is a Data Scientist with 12 years of experience in Healthcare analytics. He has a master's degree in Biostatistics from the University of Western Ontario. He is passionate about teaching Data Science, and has a number of journal publications in preventive medicince and data analytics.
Simon TavasoliAnalytics Lead at Cancer Care Ontario
Course Advisory Committee
Paul is a lead SAS Data Scientist at the Bank of Montreal. As an SAS Certified Predictive Modeler, SAS Statistical Business Analyst, and SAS Certified Advanced Programmer, Paul is passionate about sharing his knowledge on how Data Science can support data-driven business decisions.
Paul SharkovData Scientist at BMO Financial Group, Member of SAS Canada Community
Alvaro is a Data Scientist who founded Quant Company. He has also worked as a lead Economic Analyst in the Central Bank of Guatemala. He has a master's degree in Quantitative Economics and Applied Mathematics and is actively involved in consulting and training in the Data Science space.
Alvaro FuentesFounder and Data Scientist at Quant Company
USA Simplilearn Americas LLC201 Spear Street, Suite 1100, San Francisco, CA 94105United StatesPhone No: +1-844-532-7688
INDIA Simplilearn Solutions Pvt Ltd.# 53/1 C, Manoj Arcade, 24th Main,Harlkunte2nd Sector, HSR LayoutBangalore - 560102Call us at: 1800-102-9602
www.simplilearn.com