Busan - Marine Money...3. Distripark Development Project 4. Busan North Port Redevelopment Project...
34
Busan Busan Port’s Strategic Plans for 2017. 11 Busan Port Authority
Transcript of Busan - Marine Money...3. Distripark Development Project 4. Busan North Port Redevelopment Project...
BusanBusan Port’s Strategic Plans for
2017. 11
Busan Port Authority
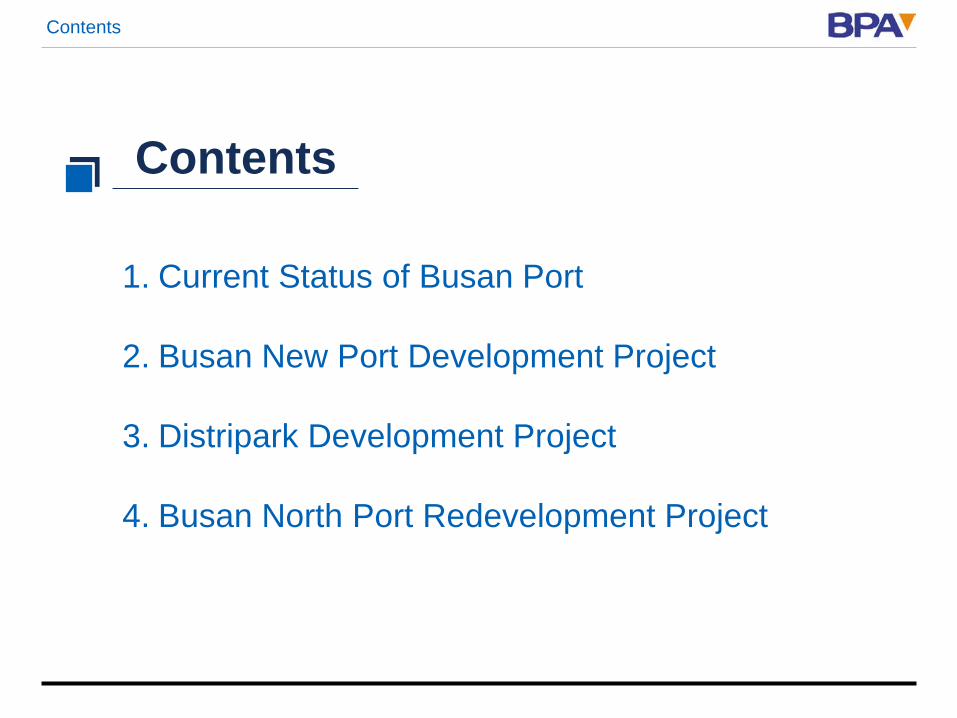
Contents
1. Current Status of Busan Port
2. Busan New Port Development Project
3. Distripark Development Project
4. Busan North Port Redevelopment Project
Contents
Current Status of Busan Port1
Past, Present and Future
of Busan Port by Numbers
4
Current Status of Busan Port

No.
Container Port in KoreaWorld No. Containe
Transshipmen
Targeting 50 Thousands Cruise
Passengers Network with 00 Ports in the World
World No. Container Port
1 76
Opening of Busan Port
201
Completion of the North Port
R d l t
Targeting
0 million Container T/P
19 8
Opening of the first
Container Port in Busan
Current Status of Busan Port
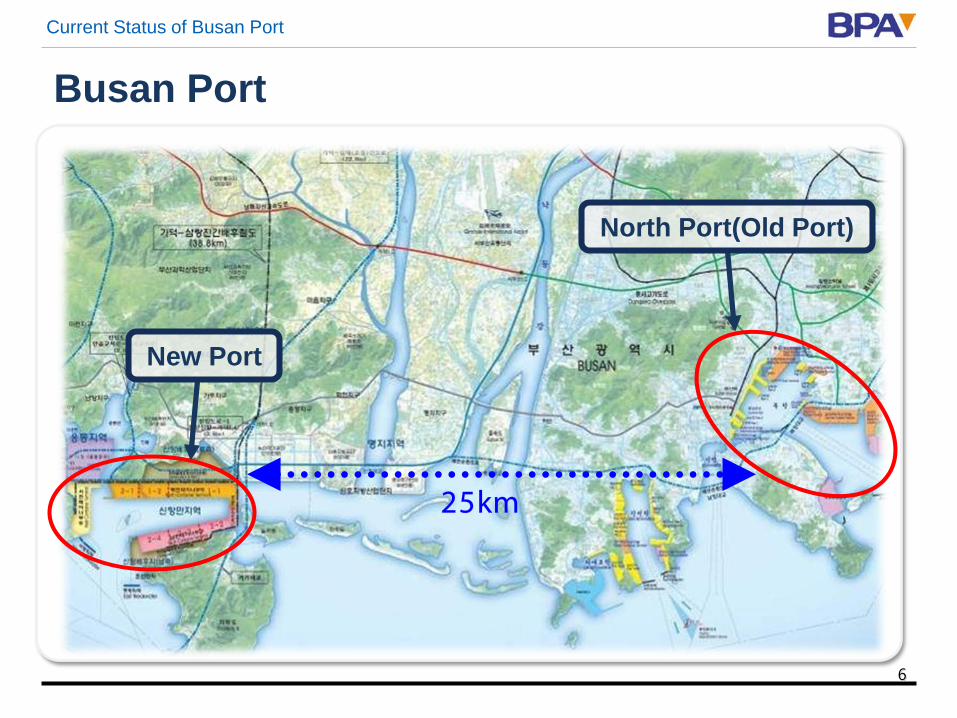
Busan Port
25km
6
North Port(Old Port)
New Port

Current Status of Busan Port
North Port & New Port
7
North Port◈ 4 CNTR Terminal Operators◈ 6.3m TEU H/Capacity◈ 17 berths
New Port◈ 5 CNTR Terminal Operators◈ 9.2m TEU H/Capacity◈ 23 berths

Current Status of Busan Port
Busan Port T/put (2012~2016)(Unit : ‘000 TEU)
0
5000
10000
15000
20000
25000
2012 2013 2014 2015 2016
Total Local T/S
8,8988,148(47.8%)
17,04617,686
8,938
8,748(49.5%)
18,683
9,2389,445(50.5%)
19,469
10,105(52%)
9,363
19,455
9,6209,835(50.6%)
L/C 2.7%
T/S -2.7%
Total -0.1%
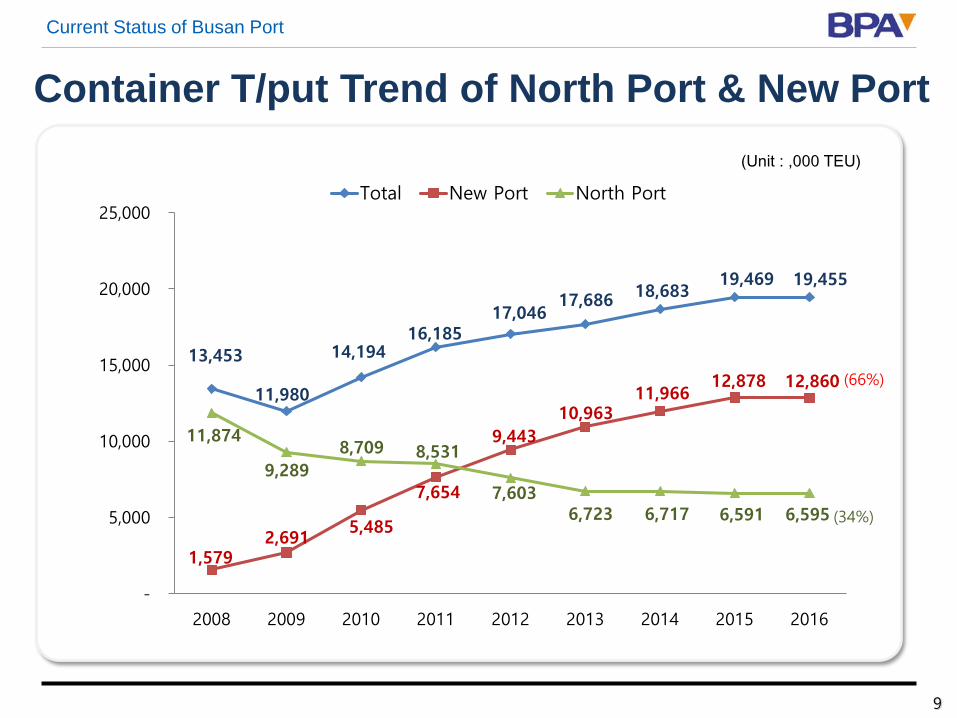
Container T/put Trend of North Port & New Port
9
(Unit : ,000 TEU)
Current Status of Busan Port
13,453
11,980
14,194 16,185
17,046 17,686 18,683
19,469 19,455
1,579 2,691
5,485
7,654
9,443 10,963
11,966 12,878 12,860
11,874
9,289 8,709 8,531
7,603 6,723 6,717 6,591 6,595
-
5,000
10,000
15,000
20,000
25,000
2008 2009 2010 2011 2012 2013 2014 2015 2016
Total New Port North Port
(66%)
(34%)

Current Status of Busan Port
World Container Volume Forecast
0
100,000
200,000
300,000
400,000
500,000
600,000
700,000
800,000
2015 2016 2017 2018 2019 2020
93 , 767 95 , 199 97 , 167 100 , 184 103 , 484 106 , 978
273 , 353 277 , 375 283 , 346 291 , 562 301 , 131 310 , 347
682,260 691,085 707,571728,773
752,017774,887
S.E. Asia
N.E. Asia
World
2015 2016 2017 2018 2019 2020
(Unit : ‘000 TEU)
(40.0%) (40.1%) (40.0%) (40.0%) (40.0%) (40.1%)
* Source : Drewry Forecaster & Annual Review 2016/17
10

Current Status of Busan Port
World’s Top 10 Container Ports
No. Port Country 2015 (Growth) 2016 (Growth)
1 Shanghai China 36.54 (3.5%) 37.13 (1.6%)
2 Singapore Singapore 30.92 (-8.7%) 30.90 (-0.1%)
3 Shenzhen China 24.20 (0.7%) 23.99 (-0.9%)
4 Ningbo-zhoushan China 20.63 (6.0%) 21.57 (4.6%)
5 Hong Kong China 20.08 (-9.7%) 19.63 (-2.2%)
6 Busan Korea 19.46 (4.0%) 19.45 (-0.1%)
7 Guangzhou China 17.57 (5.7%) 18.82 (6.2%)
8 Qingdao China 17.50 (5.3%) 18.01 (3.3%)
9 LA/LB USA 15.59 (2.3%) 15.63 (1.8%)
10 Jebel Ali UAE 15.35 (1.3%) 14.77 (-5.3%)
(Unit : million TEU)
• source : Port Authority Websites, Alphaliner
7 out of 10 world’s busiest ports are in N.E. ASIA
11
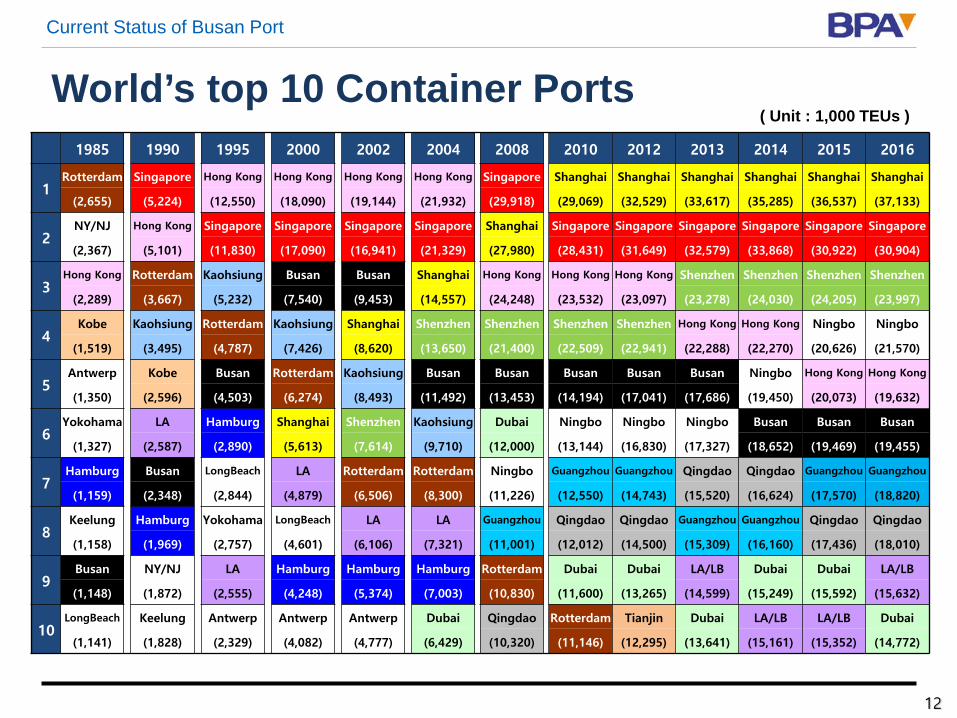
World’s top 10 Container Ports1985 1990 1995 2000 2002 2004 2008 2010 2012 2013 2014 2015 2016
1 Rotterdam Singapore Hong Kong Hong Kong Hong Kong Hong Kong Singapore Shanghai Shanghai Shanghai Shanghai Shanghai Shanghai
(2,655) (5,224) (12,550) (18,090) (19,144) (21,932) (29,918) (29,069) (32,529) (33,617) (35,285) (36,537) (37,133)
2 NY/NJ Hong Kong Singapore Singapore Singapore Singapore Shanghai Singapore Singapore Singapore Singapore Singapore Singapore
(2,367) (5,101) (11,830) (17,090) (16,941) (21,329) (27,980) (28,431) (31,649) (32,579) (33,868) (30,922) (30,904)
3 Hong Kong Rotterdam Kaohsiung Busan Busan Shanghai Hong Kong Hong Kong Hong Kong Shenzhen Shenzhen Shenzhen Shenzhen
(2,289) (3,667) (5,232) (7,540) (9,453) (14,557) (24,248) (23,532) (23,097) (23,278) (24,030) (24,205) (23,997)
4 Kobe Kaohsiung Rotterdam Kaohsiung Shanghai Shenzhen Shenzhen Shenzhen Shenzhen Hong Kong Hong Kong Ningbo Ningbo
(1,519) (3,495) (4,787) (7,426) (8,620) (13,650) (21,400) (22,509) (22,941) (22,288) (22,270) (20,626) (21,570)
5 Antwerp Kobe Busan Rotterdam Kaohsiung Busan Busan Busan Busan Busan Ningbo Hong Kong Hong Kong
(1,350) (2,596) (4,503) (6,274) (8,493) (11,492) (13,453) (14,194) (17,041) (17,686) (19,450) (20,073) (19,632)
6 Yokohama LA Hamburg Shanghai Shenzhen Kaohsiung Dubai Ningbo Ningbo Ningbo Busan Busan Busan
(1,327) (2,587) (2,890) (5,613) (7,614) (9,710) (12,000) (13,144) (16,830) (17,327) (18,652) (19,469) (19,455)
7 Hamburg Busan LongBeach LA Rotterdam Rotterdam Ningbo Guangzhou Guangzhou Qingdao Qingdao Guangzhou Guangzhou
(1,159) (2,348) (2,844) (4,879) (6,506) (8,300) (11,226) (12,550) (14,743) (15,520) (16,624) (17,570) (18,820)
8 Keelung Hamburg Yokohama LongBeach LA LA Guangzhou Qingdao Qingdao Guangzhou Guangzhou Qingdao Qingdao
(1,158) (1,969) (2,757) (4,601) (6,106) (7,321) (11,001) (12,012) (14,500) (15,309) (16,160) (17,436) (18,010)
9 Busan NY/NJ LA Hamburg Hamburg Hamburg Rotterdam Dubai Dubai LA/LB Dubai Dubai LA/LB
(1,148) (1,872) (2,555) (4,248) (5,374) (7,003) (10,830) (11,600) (13,265) (14,599) (15,249) (15,592) (15,632)
10LongBeach Keelung Antwerp Antwerp Antwerp Dubai Qingdao Rotterdam Tianjin Dubai LA/LB LA/LB Dubai
(1,141) (1,828) (2,329) (4,082) (4,777) (6,429) (10,320) (11,146) (12,295) (13,641) (15,161) (15,352) (14,772)
Current Status of Busan Port
( Unit : 1,000 TEUs )
12
Current Status of Busan Port
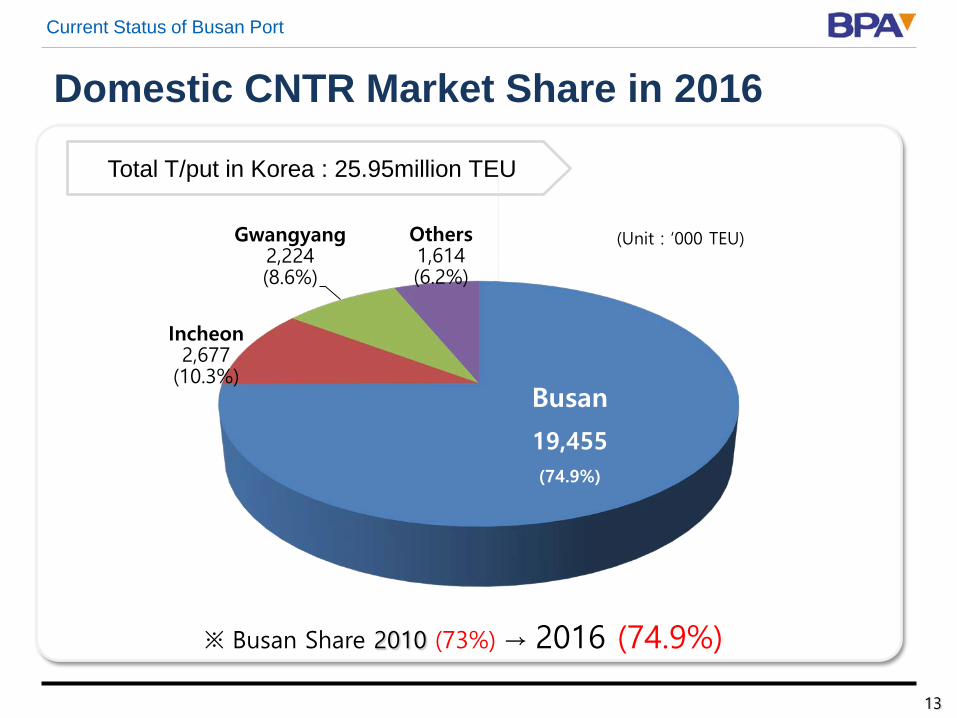
Domestic CNTR Market Share in 2016
Total T/put in Korea : 25.95million TEU
BUSAN19,467(75.8%)
Incheon(9.3%)
※ Busan Share 2010 (73%) → 2016 (74.9%)
BUSAN19,432
(Unit : ‘000 TEU)
13
Busan
19,455(74.9%)
Incheon2,677
(10.3%)
Gwangyang2,224(8.6%)
Others1,614(6.2%)
Current Status of Busan Port
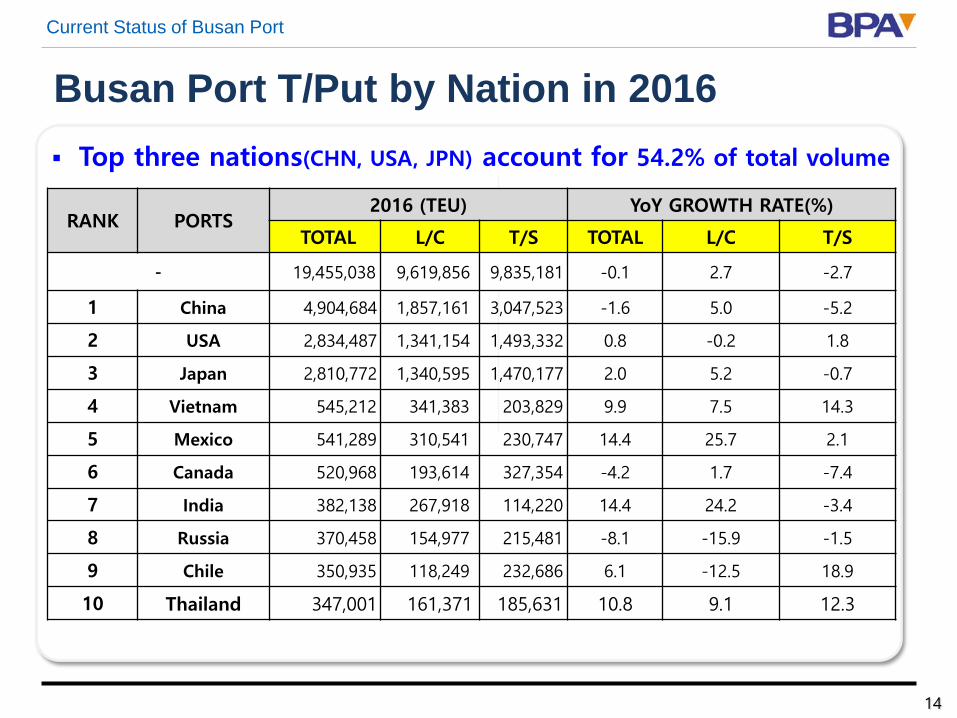
Busan Port T/Put by Nation in 2016
BUSAN19,432
14
▪ Top three nations(CHN, USA, JPN) account for 54.2% of total volume
- 19,455,038 9,619,856 9,835,181 -0.1 2.7 -2.7
1 China 4,904,684 1,857,161 3,047,523 -1.6 5.0 -5.2
2 USA 2,834,487 1,341,154 1,493,332 0.8 -0.2 1.8
3 Japan 2,810,772 1,340,595 1,470,177 2.0 5.2 -0.7
4 Vietnam 545,212 341,383 203,829 9.9 7.5 14.3
5 Mexico 541,289 310,541 230,747 14.4 25.7 2.1
6 Canada 520,968 193,614 327,354 -4.2 1.7 -7.4
7 India 382,138 267,918 114,220 14.4 24.2 -3.4
8 Russia 370,458 154,977 215,481 -8.1 -15.9 -1.5
9 Chile 350,935 118,249 232,686 6.1 -12.5 18.9
10 Thailand 347,001 161,371 185,631 10.8 9.1 12.3
Current Status of Busan Port
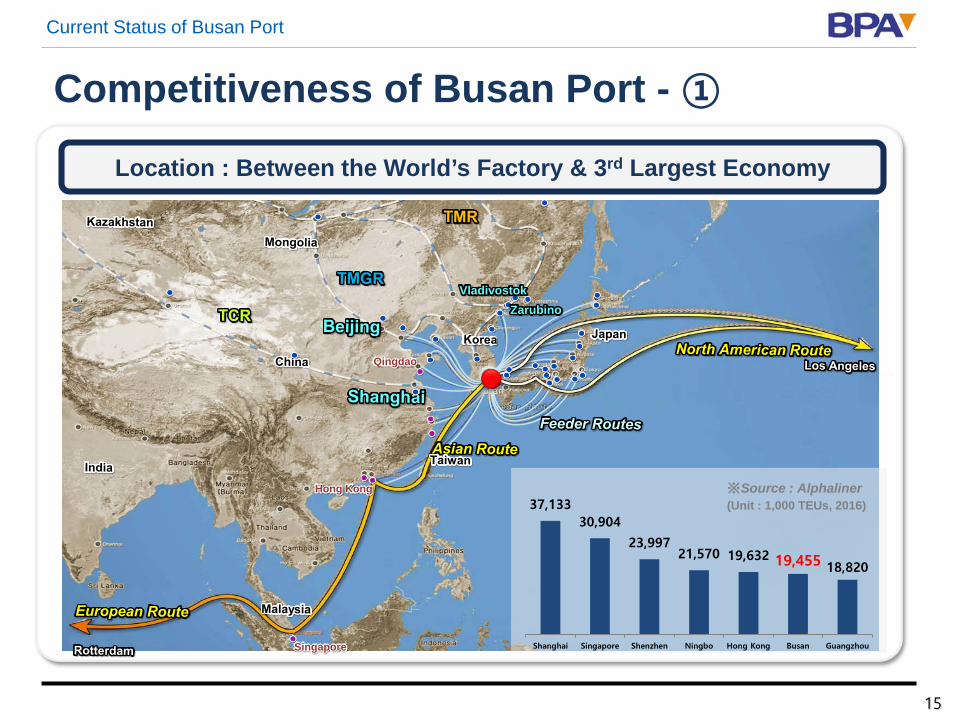
Location : Between the World’s Factory & 3rd Largest Economy
Competitiveness of Busan Port - ①
Singapore
Hong Kong
Qingdao
ZarubinoVladivostok
※Source : Alphaliner(Unit : 1,000 TEUs, 2016)37,133
30,904
23,99721,570 19,632 19,455 18,820
Shanghai Singapore Shenzhen Ningbo Hong Kong Busan Guangzhou
15
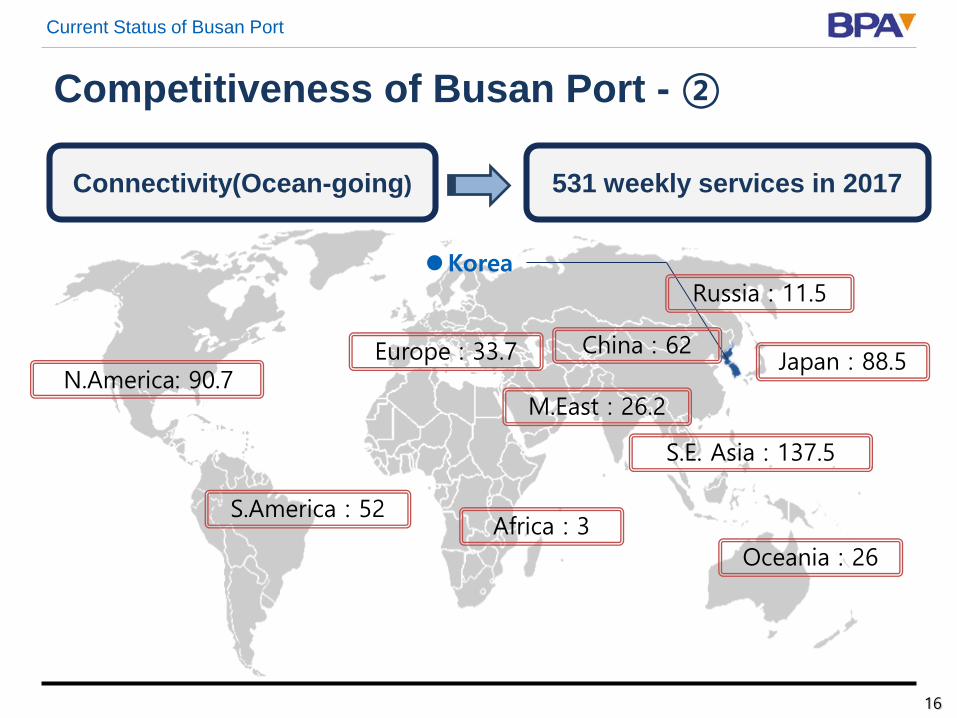
N.America: 90.7
Korea
S.America : 52
Russia : 11.5
China : 62
S.E. Asia : 137.5
Japan : 88.5Europe : 33.7
Oceania : 26
M.East : 26.2
Africa : 3
Connectivity(Ocean-going) 531 weekly services in 2017
Competitiveness of Busan Port - ②Current Status of Busan Port
16
Current Status of Busan Port
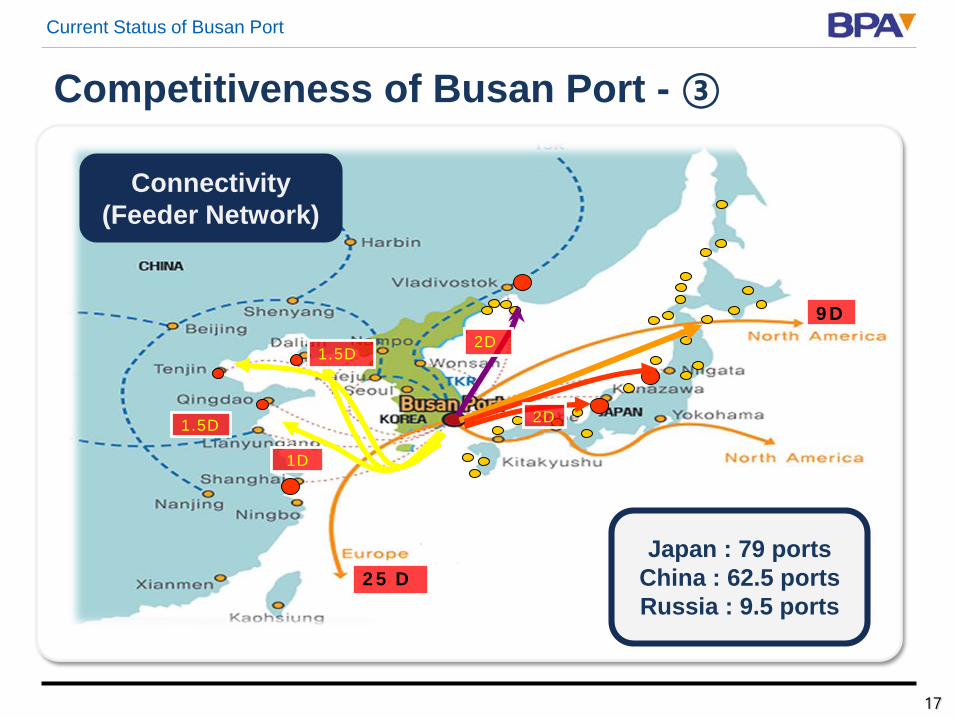
Competitiveness of Busan Port - ③
33,61732,579
23,27822,352
17,32715,520
Shanghai Singapore Shenzhen HongKong
Ningbo Qingdao
※Source : BPA(Unit : 1,000 TEUs, 2013)
1D
1.5D
1.5D
9D
25 D
2D
2D
Japan : 79 portsChina : 62.5 portsRussia : 9.5 ports
Connectivity (Feeder Network)
17

Current Status of Busan Port
Competitiveness of Busan Port - ④
33,61732,579
23,27822,352
17,327
Excellent Port Infrastructure
Service and Productivity
High Productivity and Service
Stable Labor Relationship
Gifted Natural Environment
18
Current Status of Busan Port
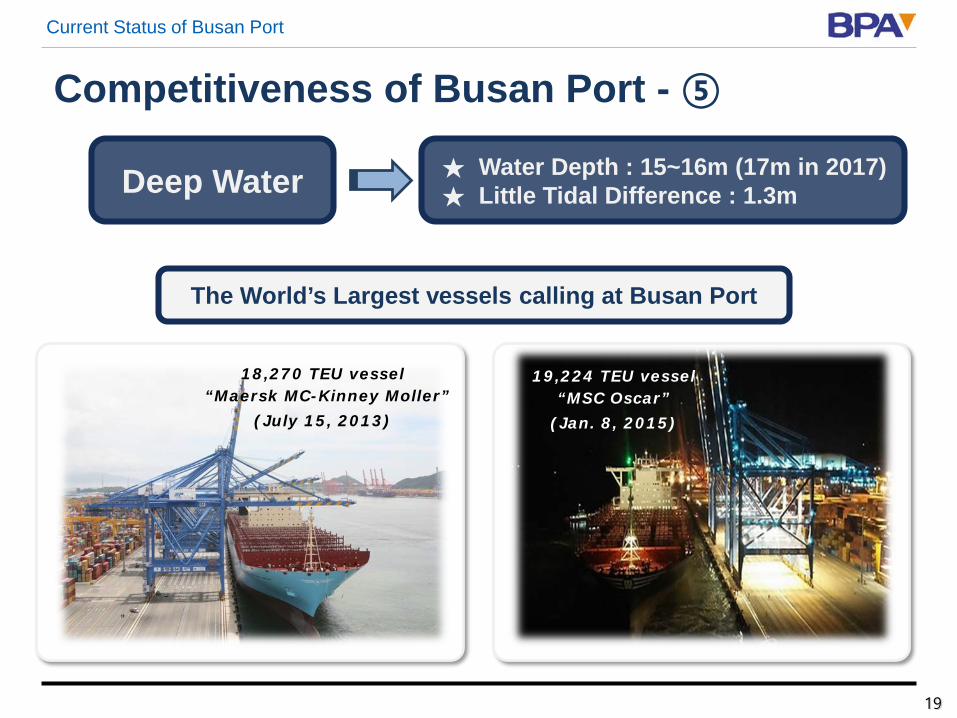
Competitiveness of Busan Port - ⑤
33,61732,579
23,27822,352
17,32715,520
Shanghai Singapore Shenzhen HongKong
Ningbo Qingdao
※Source : BPA(Unit : 1,000 TEUs, 2013)
Deep Water ★ Water Depth : 15~16m (17m in 2017)★ Little Tidal Difference : 1.3m
The World’s Largest vessels calling at Busan Port
18,270 TEU vessel“Maersk MC-Kinney Moller”
(July 15, 2013)
19,224 TEU vessel“MSC Oscar”
(Jan. 8, 2015)
19
Busan New Port Development Project
2
Busan New Port Development Project
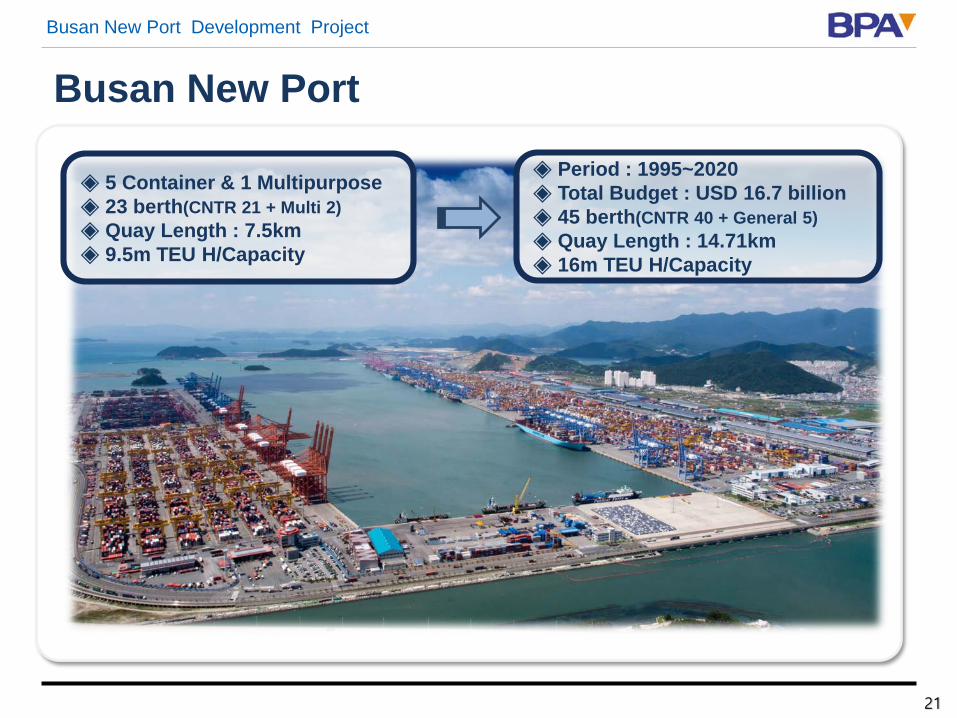
Busan New Port
33,61732,579
23,27822,352
17,32715,520
Shanghai Singapore Shenzhen HongKong
Ningbo Qingdao
※Source : BPA(Unit : 1,000 TEUs, 2013)
◈ 5 Container & 1 Multipurpose◈ 23 berth(CNTR 21 + Multi 2)◈ Quay Length : 7.5km◈ 9.5m TEU H/Capacity
◈ Period : 1995~2020◈ Total Budget : USD 16.7 billion◈ 45 berth(CNTR 40 + General 5)◈ Quay Length : 14.71km◈ 16m TEU H/Capacity
21
Busan New Port Development Project
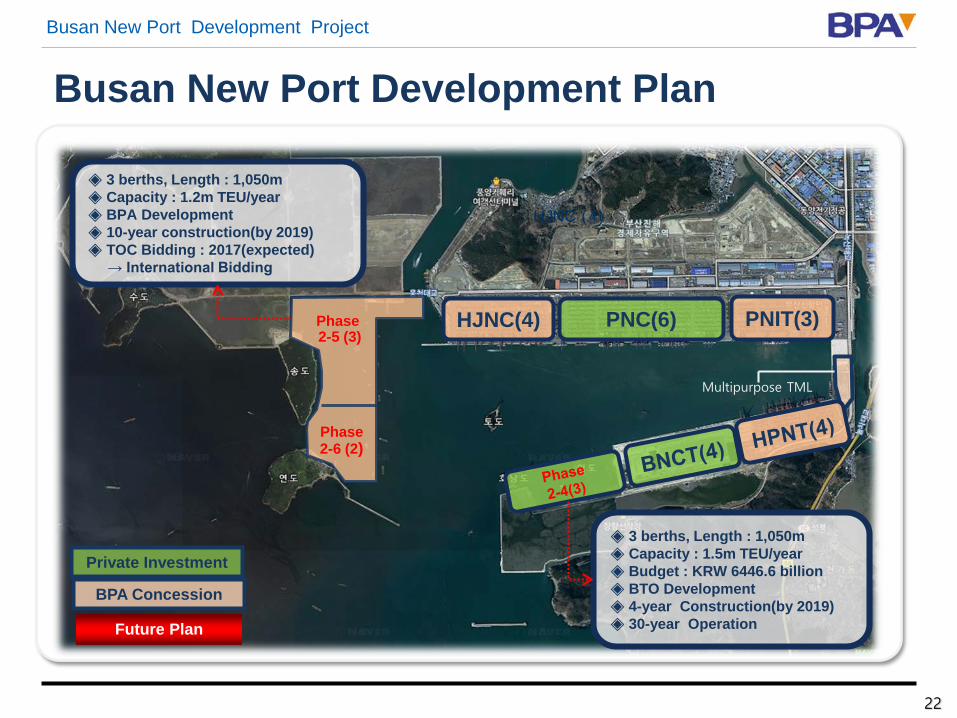
Busan New Port Development Plan
33,61732,579
23,27822,352
17,32715,520
Shanghai Singapore Shenzhen HongKong
Ningbo Qingdao
※Source : BPA(Unit : 1,000 TEUs, 2013)
Phase 2-5 (3)
Phase 2-6 (2)
BPA Concession
Private Investment
HJNC (4)
Future Plan
HJNC(4) PNC(6) PNIT(3)
Multipurpose TML
◈ 3 berths, Length : 1,050m◈ Capacity : 1.2m TEU/year◈ BPA Development◈ 10-year construction(by 2019)◈ TOC Bidding : 2017(expected)
→ International Bidding
◈ 3 berths, Length : 1,050m◈ Capacity : 1.5m TEU/year◈ Budget : KRW 6446.6 billion◈ BTO Development◈ 4-year Construction(by 2019)◈ 30-year Operation
22
Busan New Port Development Project
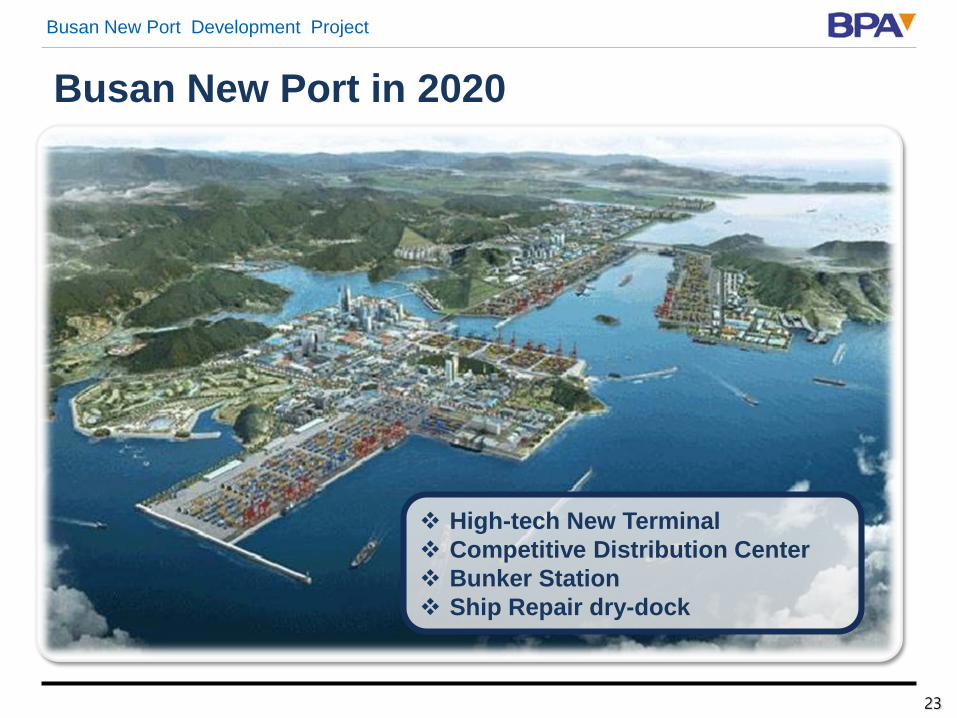
Busan New Port in 2020
High-tech New Terminal Competitive Distribution Center Bunker Station Ship Repair dry-dock
23

DistriparkDevelopment Project
3

Distripark Development Project
Business Model
Overseas Busan Port Distripark
(FTZ)
Overseas
25
Distripark Development Project
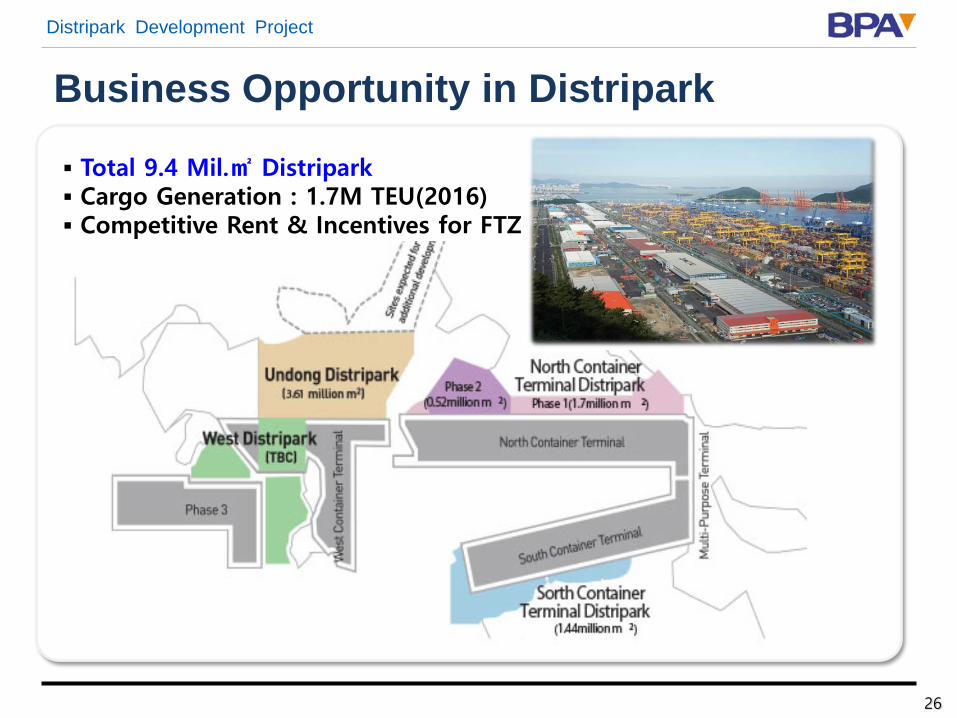
Business Opportunity in Distripark
26
▪ Total 9.4 Mil.㎡ Distripark▪ Cargo Generation : 1.7M TEU(2016)▪ Competitive Rent & Incentives for FTZ
Distripark Development Project
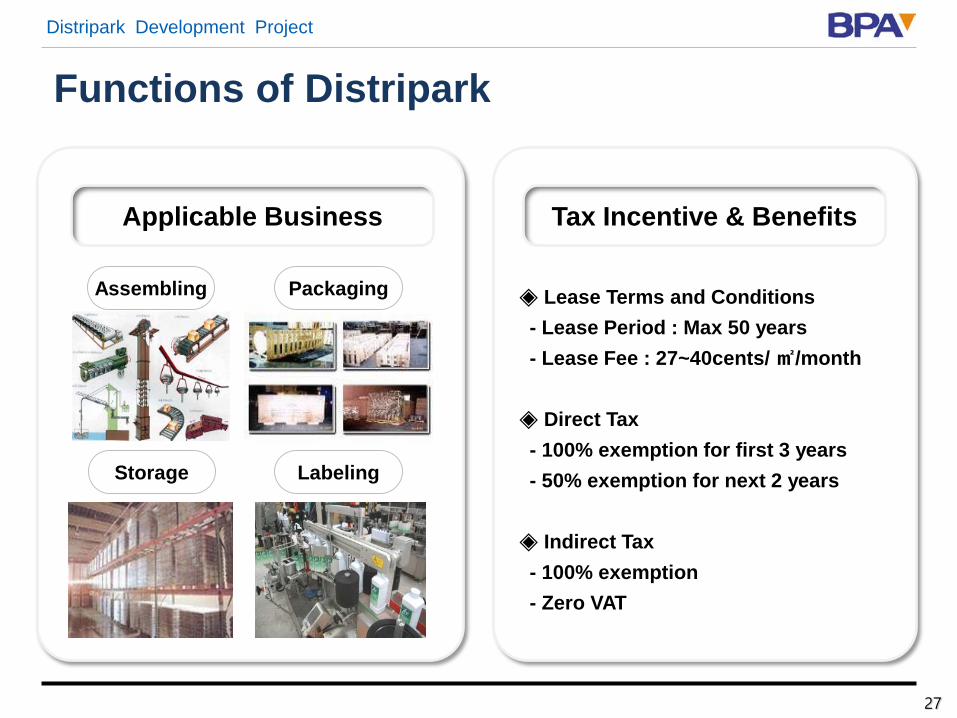
Functions of Distripark
Applicable Business Tax Incentive & Benefits
Assembling Packaging
Storage Labeling
◈ Lease Terms and Conditions- Lease Period : Max 50 years- Lease Fee : 27~40cents/ ㎡/month
◈ Direct Tax- 100% exemption for first 3 years- 50% exemption for next 2 years
◈ Indirect Tax- 100% exemption- Zero VAT
27

Distripark Development Project
Tenants in Distripark
28
Northern (phase 1-1~4)
30 46 48 1,010,33830 companies in operation
Ung-dong (phase 1-1~3)
38 63 42 1,336,184
32 companies in operation
and 6 companies in preparation for
operation
Total 68 119 90 2,346,522 -
< Foreign Investors >
▪ Japan (40 Companies, 44%), China (21, 23%), U.S./Canada/U.K (12,13%),
Singapore (6, 7%), Others (11, 12%)

Busan North PortRedevelopment Project
4

Busan North Port Redevelopment Project
Project Outline
HBCT
DPCTBPT
UTC
Pier 1
Pier 2
Central PierPier 3
Pier 4
◈ Size : 1,511,450㎡◈ Total Budget : USD 8.5 billion◈ Period : 2009~2019
(Infra + Superstructure)
Redevelopment Target Area
30

Busan North Port Redevelopment Project
Transformation of North Port – Cruise Infra
31
Busan North Port Redevelopment Project
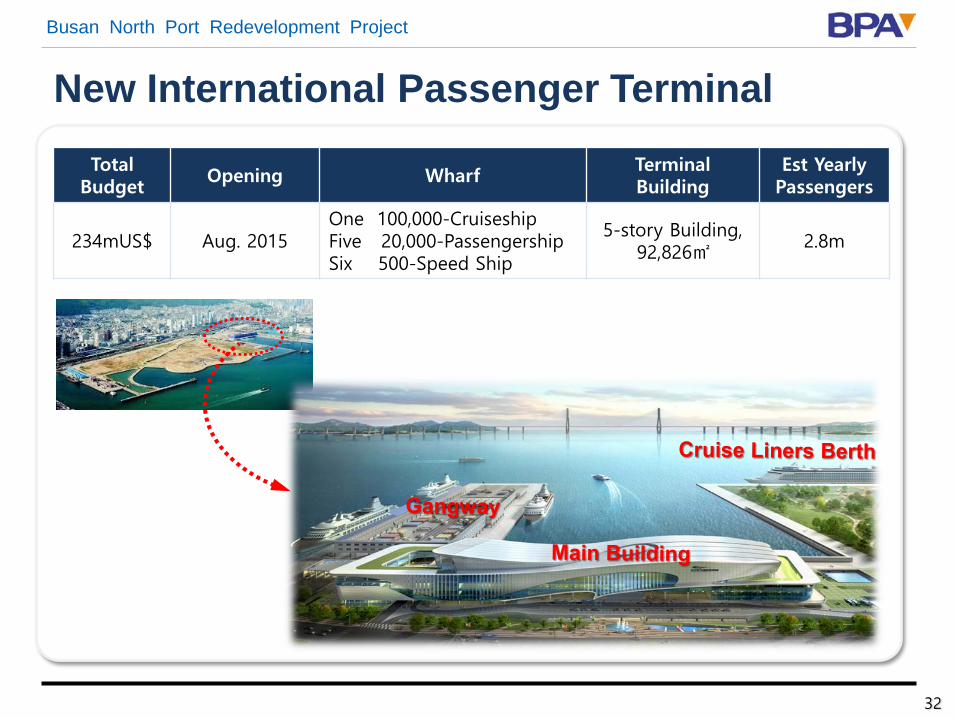
New International Passenger TerminalTotal
Budget Opening Wharf TerminalBuilding
Est Yearly Passengers
234mUS$ Aug. 2015One 100,000-CruiseshipFive 20,000-PassengershipSix 500-Speed Ship
5-story Building,92,826㎡
2.8m
32
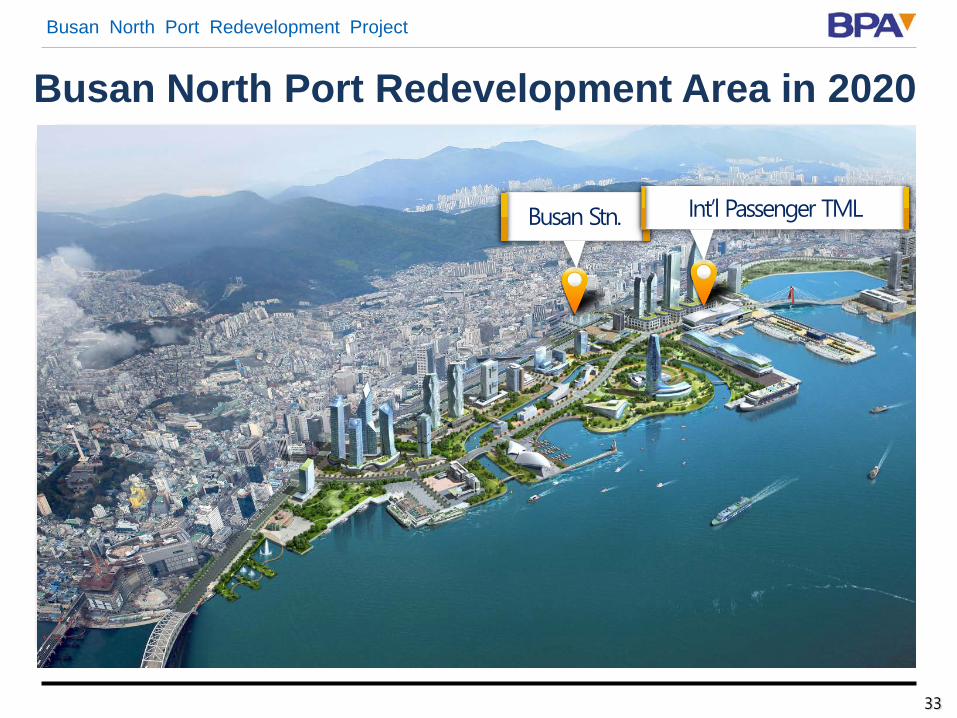
Busan North Port Redevelopment Project
Busan North Port Redevelopment Area in 2020
Busan Stn. Int’l Passenger TML
33

Thank you#