BUS STUDY - Metropolitan Transportation Authority · , Metropolitan Transportation Authority 1...
130
Northeast Queens BUS STUDY , METROPOLITAN TRANSPORTATION AUTHORITY SEPTEMBER 2015
Transcript of BUS STUDY - Metropolitan Transportation Authority · , Metropolitan Transportation Authority 1...

NortheastQueens
BUS STUDY
, METROPOLITAN TRANSPORTATION AUTHORITY SEPTEMBER 2015


, Metropolitan Transportation Authority
I
CONTENTS EXECUTIVE SUMMARY 1 1. INTRODUCTION 3 Methodology Characteristics of Northeast Queens 2. BUS SERVICE AND SCHEDULE 9 Current Service Service Coverage 2010 Service Changes Other Recent & Upcoming Service Changes Schedule Changes 3. BUS RIDERSHIP 23 3‐Year Ridership Trend 1‐Year Ridership Trend Senior/Student Ridership Bus Stop Usage Origins and Destinations Transfers Classifying Northeast Queens Bus Transfers 4. QUALITY OF SERVICE 42 PERFORMANCE Wait Assessment On‐Time Performance Running Time Road Reliability Bus Speeds Vision Zero COMFORT+ENVIRONMENT Passenger Environment Loading Guidelines Schedule Guidelines Bus Stop Furniture CUSTOMER COMMUNICATION 5. PUBLIC INPUT 55 Service Issues Schedules Issues Amenities and Facilities Issues Other Issues
6. RECOMMENDATIONS 65 SUMMARY OF CHANGES SHORT‐TERM RECOMMENDATIONS Service Change Schedule Changes LONG‐TERM RECOMMENDATIONS Service Changes Downtown Flushing Bus Terminal 7. NEXT STEPS 72 APPENDICES __ Appendix A ‐ Public Input Questions and Answers Appendix B – Route Profiles Appendix C – Additional Data

, Metropolitan Transportation Authority
II
LIST OF TABLES Table 1 – Travel Time to Work on Public
Transportation in NE Queens Table 2 – Bus Service Guidelines Table 3 – Bus Service Frequency Changes Table 4 – Bus Headway in Mins (2010) Table 5 – Change in Bus Headway in Mins Table 6 – Bus Headway in Mins (2015) Table 7 – Weekday Local & Limited 3‐Year Ridership Table 8 – Weekend Local & Limited 3‐Year
Ridership Table 9 – Weekday Express 3‐Year Ridership Table 10 – Weekend Express 3‐Year Ridership Table 11 – Weekday Local & Limited 1‐Year
Ridership Table 12 – Weekend Local & Limited 1‐Year
Ridership Table 13 – Weekday Express 1‐Year Ridership Table 14 – Weekend Express 1‐Year Ridership Table 15 – Weekday Senior/Disabled and Student
Ridership Table 16 – Ten Busiest Bus Stops in NE Queens Table 17 – Weekday Average Trip Comparisons Table 18 – Bus‐to‐Subway Weekday Transfers by
Bus Route Table 19 – Bus‐to‐Subway Weekday Transfers by
Station Table 20 – Highest Bus‐to‐Bus Transfers in
Northeast Queens Table 21 – Three‐Legged Transfers Table 22 – NE Queens Mode Transfers Table 23 – NE Queens Transfers by Bus Route Table 24 – Wait Assessment Table 25 – On‐Time Performance Table 26 – Peak Period Travel Performance Table 27 – Peak Period Travel Performance by
Route Table 28 – Express Bus Weekday Performance Table 29 – Express Bus Weekday Performance by
Route by Direction Table 30 – Express Bus Weekend Performance Table 31 – Express Bus Running Time to CBDs Table 32 – Express Bus Running Time Shortfalls Table 33 – Road Reliability Table 34 – Average Bus Speeds by Time of Day Table 35 – Vision Zero Priority Corridors Table 36 – Vision Zero Priority Intersections
Table 37 – Passenger Environment Survey – Local & Limited
Table 38 – Passenger Environment Survey ‐ Express Table 39 – Current Loading Levels Compared to
Loading Guidelines Table 40 – Bus Stop Shelters in NE Queens Table 41 – MetroCard Bus/Van Locations Table 42 – MetroCard Bus/Van Senior Locations Table 43 – Recommended Additional Trips LIST OF FIGURES Figure 1 – Study Area Map Figure 2 – Vehicles Available in NE Queens Figure 3 – Mode of Travel to Work in NE Queens Figure 4 – Travel Time to Work on Public
Transportation in NE Queens Figure 5 – Transit Dependency Figure 6 – Transit Usage to Work Figure 7 – Workers with Transit Commutes over 60
Mins Figure 8 – NE Queens Bus Map Figure 9 – Local/Limited Bus Weekday Coverage Figure 10 – Local/Limited Bus Weekend Coverage Figure 11 – Local/Limited Bus Overnight Coverage Figure 12 – Commuter Service Coverage Figure 13 – 2010 NE Queens Bus Map Figure 14 – Local Weekday Bus Boardings Figure 15 – Local Weekday Bus Alightings Figure 16 – Major Bus Stops Figure 17 – Express Bus Boardings in NE Queens Figure 18 – Origins and Destinations of NE Queens
Bus Trips by Neighborhood Figure 19 – Detailed Bus‐to‐Subway Transfers for
Busiest Stations Figure 20 – Bus‐to‐Subway Weekday Transfers for
NE Queens Bus Routes Figure 21 – Bus‐to‐Bus Weekday Transfers in NE
Queens Figure 22 – NE Queens Mode Transfers Figure 23 – NE Queens Transfers by Bus Route Figure 24 – Running Time Accuracy – Weekdays Figure 25 – Running Time Accuracy by Route ‐
Weekdays Figure 26 – Q65 Travel Path Modification in
Flushing Figure 27 – Stop Spacing Service Patterns Figure 28 – Future BRT Corridors

, Metropolitan Transportation Authority
1
EXECUTIVE SUMMARY The Northeast Queens Bus Study is a joint effort by the Metropolitan Transportation Authority (MTA) by two of its agencies, New York City Transit (NYCT) and the MTA Bus Company, to examine bus service in Northeast Queens. The study was requested by New York State Senator Tony Avella in 2014. A budget bill item provided funds to the MTA to study bus service in Northeast Queens neighborhoods. This comprehensive study reviewed bus service patterns and schedules, ridership data, performance indicators, and service guidelines. The study also solicited public input from community boards meetings and a public workshop. The Northeast Queens Bus Study is one the largest bus studies conducted by the MTA. The study area contains thirty‐nine local, limited, and express bus routes operated by New York City Transit and the MTA Bus Company. The MTA received public input from meetings with the Public Transit/Transportation Committees of Queens Community Boards 7, 8, 11, and 13 and from a public workshop held at Queensborough Community College in February 2015. Further public input was received from the Office of Senator Avella and his constituents. Key Findings
More than 99% of the Northeast Queens study area has local and limited bus service within one‐quarter mile (10 minute walk) on weekdays. Almost 98% of the Northeast Queens study area has local and limited bus service on weekends.
Bus service in Northeast Queens is generally at or better than the MTA Board approved guideline levels of service and generally exceeds the performance of buses throughout Queens and citywide. Some areas were identified for potential improvements and are included in the study recommendations.
Public input showed that most bus customers are concerned about the performance of existing routes, while fewer wanted new routes and services.
Most customers that were affected by the bus service changes that were implemented in 2010 have found transportation alternatives, including other bus routes.
Recent, Ongoing, and Upcoming Bus Service Changes
Since 2012, several changes have been made to bus service in the study area. Some of these changes were
the restoration of services that existed prior to 2010. Bus schedules are monitored often and adjustments
are made quarterly where necessary. The first Select Bus Service (SBS) routes in Northeast Queens will be
introduced in the next few months. Specific changes include:
In September 2012, Sunday service was added on the Q76 to provide seven days/week service along Francis Lewis Boulevard and 20th Avenue.
In January 2013, some Q30 trips were extended to Queensborough Community College to provide better service for students, staff, and residents.
In January 2013, the Q36 was extended to the Little Neck Long Island Rail Road station. This extension replaced the former Q79 and provides weekday service on Little Neck Parkway as well as a one‐seat ride to the F subway line on Hillside Avenue.
In March 2014, Bus Time was implemented, allowing customers to get real‐time information about the location and arrival time of buses at their bus stops.

, Metropolitan Transportation Authority
2
Additional weekday and weekend trips scheduled on most Northeast Queens bus routes since 2011.
Select Bus Service to provide transit between Jamaica and Flushing will be implemented on the Main Street corridor in late 2015 and on the Parsons/Kissena Boulevards corridor at a later date.
Report Organization
This report is organized in seven sections covering:
Introduction & Methodology
Bus Service & Schedule
Ridership
Quality of Service
Public Input
Recommendations
Next Steps
Study Recommendations
The study recommends some bus service and schedule changes in Northeast Queens, as well as a new
bus service pattern. While some of these recommendations can be implemented in the short term, many
of them require further analysis to determine their feasibility. Some recommendations can only be
implemented once additional funding becomes available.
Short‐Term Recommendations
Modify the Q65 travel path in Flushing to provide more reliable service and to provide all‐day service on Parsons Boulevard alongside the part‐time Q26
Continue to schedule additional trips such as those on the Q12, Q13, Q28, and Q58 that were added for Summer 2015 as part of ongoing schedule changes
In conjunction with the initiation of Q44 SBS, create 24‐hour service on the Q20A
Analyze the feasibility of overnight and all‐day service on the Q13, Q30, and Q88
Continue to adjust running time on all routes to improve schedule adherence
Long‐Term Recommendations
Implement a pilot program for limited‐zone bus service on a Northeast Queens bus route, possibly to include the Q12, Q17, Q27, Q43, Q46, or Q88
Analyze the feasibility of limited‐stop service on the Q12 and Q88 bus routes
Study alternatives to expand north‐south service throughout the study area
In addition to the two SBS routes along the Flushing‐Jamaica corridor, implement additional Select Bus Service along major transit corridors, possibly to include Hillside Avenue, Northern Boulevard, and Union Turnpike
Explore creation of a Downtown Flushing Bus Terminal in conjunction with new development and redevelopment occurring in the area

, Metropolitan Transportation Authority
3
1. INTRODUCTION Northeast Queens is a large collection of neighborhoods and contains a diverse population that relies on bus service for much of its transit needs. The study area has limited subway coverage. Train service is provided by the Port Washington Branch of the Long Island Rail Road. All bus routes in Northeast Queens connect to subway or commuter rail stations. There are thirty-nine bus routes that operate in the study area – creating a complex and expansive service coverage area. Twenty-three of these routes are operated by MTA New York City Transit and sixteen are operated by MTA Bus Company. Together, these organizations provide a range of local, limited, and express bus coverage that connect neighborhoods within Queens and to neighboring boroughs. New York City Transit was created in 1953 by the State of New York to take over operations then operated by the New York City Board of Transportation. In 1962 the State established the Manhattan and Bronx Surface Transit Operating Authority as a subsidiary of NYCT to take over bus operations then operated by two private companies, Fifth Avenue Coach Company and Surface Transit, Inc. After this, NYCT operated local bus service in all five boroughs. MTA Bus Company was created in September 2004 to merge into one organization the services formerly provided by seven private bus companies under franchise agreements with the City of New York. Those companies were: Command Bus, Green Bus Lines, Jamaica Bus, Liberty Lines, New York Bus Company, Triboro Coach, and Queens Surface. The transition of service began in January 2005 and was completed in February 2006. Since the merger into MTA Bus Company, the agency has instituted new maintenance practices, adjusted schedules and travel paths, and regularized service.

, Metropolitan Transportation Authority
4
Methodology This study evaluates current bus service in Northeast Queens using various sources of data and community input. These data primarily include Bus Time GPS data and Automatic Fare Collection MetroCard data. This study examined a large amount of archived Bus Time data, integrated with Automatic Fare Collection (AFC) data from MetroCards. The data were captured and analyzed to evaluate bus service, performance, and ridership. This methodology provided service planners with a comprehensive dataset based on 100% of actual data. Since the launch of Bus Time for Queens buses in 2014, real time automatic vehicle location information is available for all buses. These data are captured and stored to evaluate bus service, performance, and ridership, supplementing the prior system of manual data sampling with traffic counts. With the data captured from Bus Time, wait assessment and on‐time performance data are calculated. These metrics, along with service availability and passenger environment scores, were evaluated to determine quality of service. Automatic Fare Collection MetroCard data provided ridership and transfer information. Community input was received at meetings of the Public Transit/Transportation Committees of Queens Community Boards 7, 8, 11, and 13 between October 2014 and April 2015, as well as a public workshop held on February 26, 2015 at Queensborough Community College. More than 100 participants attended the Northeast Queens Bus Study Public Workshop. This provided an opportunity for community residents to speak directly to bus service planners about bus service in the area. Further comments were collected by the office of Senator Avella and forwarded to the MTA for consideration and analysis.
Characteristics of Northeast Queens Northeast Queens is a large area that covers 31 square miles. The study area is bounded by Flushing Bay and the Van Wyck Expressway to the west, Hillside Avenue to the south, the Nassau County line to the east, and the East River to the north. This study area is composed of the following neighborhoods: Flushing, Whitestone, Bay Terrace, Bayside, College Point, Oakland Gardens, Douglaston, Glen Oaks, Fresh Meadows, Little Neck, Mitchell‐Linden, Bowne Park, Beechhurst, Bellerose, Fort Totten, Malba, Robinwood, Auburndale, Floral Park, Hollis Hills, Queens Village, and New Hyde Park in addition to others. Northeast Queens spans Community Boards 7,8,11, and 13. Downtown Flushing is the major economic center and transportation hub within the area. Major educational institutions include Queens College, St. Johns University, and Queensborough Community College. There are also several large high schools within the study area. Schools are one of the largest generators of bus customers in Northeast Queens. Other community facilities and parks in the study area include Queens Botanical Garden, Kissena Park, Queens County Farm Museum and Alley Pond Park. Large institutions such as the NY Hospital Center of Queens, Long Island Jewish Hospital, Creedmoor State Hospital, and Flushing Hospital are also located in the area.

, Metropolitan Transportation Authority
5
Figure 1. Study Area Map
Population/Demographics There are 565,378 total residents living in the Northeast Queens study area, according to the 2010 Census. The area’s population increased 1.68% from 2000 to 2010, while Queens County grew 0.1% and New York City grew 2.1% over the same period. Almost 16% of Northeast Queens residents are 65 years of age and older. Only 12% of all NYC residents are in this age cohort. This age cohort grew at a faster rate in Northeast Queens than the total population from 2000 to 2010, increasing 2.34%. NYC’s elderly population grew 5.9% during this same period. Women accounted for 52% (295,531) of residents and men accounted for 48% (269,847). Northeast Queens has a very diverse population, where 41% of the population identified as Asian, 35% identified as

, Metropolitan Transportation Authority
6
White, 16% identified as Hispanic origin, 6% identified as African American, 2% identified as multiracial, and less than 1% identified as some other race. There were 204,449 total occupied housing units in Northeast Queens. More than 53% of housing units were owner occupied, which is significantly higher than the citywide average of 31%.
Journey to Work Automobile ownership is high in Northeast Queens. According to 2013 5‐Year American Community Survey data, 74.3% of households in the study area have a vehicle available, compared to 62.8% of Queens households and 44.6% of NYC households. Figure 2 shows detailed vehicle ownership in the study area. Among workers 16 years of age and older in Northeast Queens, private vehicles were the most common mode of travel to work. Only 38.7% of Northeast Queens workers use public transportation to commute to work. This is significantly lower than the entire Queens County and New York City, where 51.7% and 55.9% of workers use public transit to commute to work. Figure 3 shows the mode of travel to work for workers 16 years of age and older. Figure 2. Vehicles Available in NE Queens Figure 3. Mode of Travel to Work in NE Queens
More than three‐fifths of workers in Northeast Queens that use public transportation have a commute of 60 minutes or more, compared to 42.8% of Queens workers and 35.4% of workers citywide. Table 1 and Figure 4 show the travel time to work for workers 16 years of age or older that use public transportation.
Table 1. Travel Time to Work on Public Transportation in Northeast Queens
Figure 4. Travel Time to Work on Public Transportation in Northeast Queens
Travel Time In Minutes NYC Queens
NEQueens
Less Than 10 Mins 0.4% 0.4% 0.5%
10 To 14 Mins 1.0% 0.7% 0.8%
15 To 19 Mins 3.0% 1.9% 1.9%
20 To 24 Mins 7.0% 4.4% 3.1%
25 To 29 Mins 3.8% 2.5% 1.0%
30 To 34 Mins 17.5% 15.2% 9.1%
35 To 44 Mins 11.8% 11.5% 6.5%
45 To 59 Mins 19.90% 20.6% 16.8%
60 Or More Mins 35.40% 42.8% 60.3%

, Metropolitan Transportation Authority
7
Figure 5. Transit Dependency Transit Dependency is higher in the western areas of Northeast Queens. This is possible because of subway stations within walking distance. Figure 6. Transit Usage to Work The largest percentage of workers using public transportation is in Flushing, Briarwood, Jamaica, and Kew Garden Hills.

, Metropolitan Transportation Authority
8
Figure 7. Workers with Transit Commutes over 60 Minutes Transit commuters are traveling long distances, many into Manhattan. Many areas in Northeast Queens are primarily residential and therefore most of the workforce must travel outside of the area for work.

, Metropolitan Transportation Authority
9
2. BUS SERVICE AND SCHEDULE Current Service There are thirty‐nine bus routes operating in Northeast Queens. New York City Transit operates the Q1, Q12, Q13, Q15, Q15A, Q16, Q17, Q20A, Q20B, Q26, Q27, Q28, Q30, Q31, Q36, Q43, Q44, Q46, Q48, Q58, Q76, Q88, and X68 bus routes. MTA Bus Company operates the Q19, Q25, Q34, Q50, Q64, Q65, Q66, QM1, QM2, QM3, QM4, QM5, QM6, QM7, QM8, and QM20. In addition to these routes, Nassau Inter County Express (NICE) operates the N20, N21, N22, N22A, and N26 in the study area. Within Queens, NICE buses can only drop off customers coming from Nassau County and they can only pick up customers going to Nassau County. Please note that NICE buses are not operated by the MTA and for this reason are not included in the analysis for this study. Figure 8. Northeast Queens Bus Map
Most local and limited bus routes in Northeast Queens operate completely within the study area. These bus routes often use the same streets in denser residential and commercial areas. Main Street, Kissena Boulevard, Roosevelt Avenue, Hillside Avenue, Northern Boulevard, and Union Street are major bus corridors. The majority of local and limited bus routes that extend beyond the study area boundaries terminate in Downtown Jamaica (Q1, Q17, Q20B, Q25, Q30, Q31, Q34, Q36, Q43, Q44, Q65 and Q76). Most residents rely on the subway for crosstown service to Western Queens and Manhattan, but the Q19 and Q66 provide service to Astoria and Long Island City, respectively. The Q58 extends to Ridgewood and the Brooklyn border. The Q44 and Q50
, Metropolitan Transportation Authority
10
provide bus service to the Bronx. All express buses connect Northeast Queens to Midtown or Lower Manhattan.
Local Bus Service The following twenty‐seven routes provide local bus service: Q1, Q12, Q13, Q15, Q15A, Q16, Q17, Q19, Q20A, Q20B, Q25, Q26, Q27, Q28, Q30, Q31, Q34, Q36, Q43, Q46, Q48, Q58, Q64, Q65, Q66, Q76, and Q88. Local bus service constitutes the majority of bus routes in the study area. Local bus service makes all stops along a route. Most local service in Northeast Queens operates seven days a week, except the Q20B, Q26, and Q34. The Q1, Q12, Q17, Q25, Q27, Q28, Q36, Q43, Q44, Q46, Q58, Q64, Q65, and Q66 provide service at all times.
Limited Bus Service The following eight routes provide limited‐stop bus service: Q17, Q25, Q27, Q36, Q44, Q50, Q58, and Q65. All of these routes operate alongside an existing local service, except the Q50. Half of the limited bus routes in Northeast Queens operate only during the morning and evening peak periods on weekdays. The Q50 Limited and Q58 Limited operate most of the day, seven days a week. The Q44 Limited and Q65 Limited operate at all times, seven days a week. The Q44 Limited makes local stops during the overnight period.
Express Bus Service The following ten routes provide express bus service: QM1, QM2, QM3, QM4, QM5, QM6, QM7, QM8, QM20, and X68. These routes connect Northeast Queens to Midtown, except the QM7 and QM8, which serve Lower Manhattan. The QM2, QM4, QM5, and QM6 provide service 7 days a week, while the QM1, QM3, QM7, QM8, QM20, and X68 provide weekday‐only service. The QM3, QM7, QM8, and X68 provide peak direction only service in the mornings and afternoons.
Subway Access All local and limited bus service in Northeast Queens connects to the subway system. The Q12, Q13, Q15, Q15A, Q16, Q17, Q19, Q26, Q27, Q28, Q48, Q50, Q58, and Q66 all terminate in Downtown Flushing and connect to the 7 Flushing‐Main St station. The Q20A, Q20B, Q25, Q34,
Q44, and Q65 travel from Jamaica through Downtown Flushing, connecting to the 7 Flushing‐
Main St station. The Q20A, Q20B, Q25, Q30, Q31, Q34, Q43, Q44, and Q65 connect to the EJZ Sutphin Blvd‐
Archer Av‐JFK Airport station, Jamaica LIRR station, and Jamaica AirTrain station in Downtown Jamaica. All of these routes, except the Q43 also connect to the EJZ Jamaica Center‐
Parsons/Archer station. The Q1, Q36, Q43, and Q76 connect to the F Jamaica‐179 St and F 169
St stations, the Q30 and Q31 connect to the F 169 St station, and the Q25, Q34, and Q65 connect
to the F Parsons Blvd station. The Q46 connects to the EF Kew Gardens‐Union Tpke station in
Kew Gardens. The Q64 connects to the EFMR Forest Hills‐71 Ave station. The Q88 connects
to the MR Woodhaven Blvd station in Rego Park.
Railroad Access In addition to subway access, several bus routes also connect to Long Island Rail Road (LIRR) stations along the Port Washington branch in the Northeast Queens study area. The Q36 connects to the Little Neck LIRR station. The Q13 and Q31 connect to the Bayside LIRR station. The Q12, Q13, and Q28 connect to the Broadway LIRR station. The Q15 and Q15A connect to the Murray

, Metropolitan Transportation Authority
11
Hill LIRR station. The Q12, Q13, Q15, Q15A, Q16, Q17, Q19, Q20A, Q20B, Q25, Q26, Q27, Q28, Q34, Q44, Q48, Q50, Q58, Q65, and Q66 connect to the Flushing‐Main Street LIRR station in Downtown Flushing. The LIRR Hempstead Branch is just south of the study area. The Q36 connects to the Floral Park LIRR station along this branch. The Q1, Q27, Q36, and Q88 connect to the Queens Village LIRR station. Nine bus routes connect to the Jamaica LIRR station: the Q20A, Q20B, Q25, Q30, Q31, Q34, Q43, Q44, and Q65.

, Metropolitan Transportation Authority
12
Service Coverage MTA operates an extensive bus network in Northeast Queens with thirty‐nine local, limited and express bus routes. The extent of transit coverage is determined by Service Guidelines adopted by the MTA Board.
Guidelines The two most significant criteria in the service coverage guidelines are transit dependency and population density. Transit dependency, based on the percentage of households in an area without access to an automobile, displays an absolute need for accessible transit service. Population density, or the concentration of residents in a neighborhood, shows where service is most viable. MTA established the guidelines shown in Table 2 for local and limited bus route spacing:
Table 2. Bus Service Guidelines
Transit Dependency Population Density (Persons Per Square Mile)
(Percentage Of Households
W/O Automobiles) Greater Than 12,000 12,000 Or Less
Over 15% 2,000‐2,600 feet (3/8‐
1/2 mile) between routes 2,000‐2,600 feet (3/8‐
1/2 mile) between routes
15% And Under 2,000‐2,600 feet (3/8‐
1/2 mile) between routes
5,280 feet (1 mile) between
routes
Three percent of New York City Census block groups fall into the 1‐mile coverage category, with a population density less than 12,000 people per square mile and fifteen percent or less of households without a car. Average distance to a bus route is one‐half the distance between routes, or one‐half mile. The majority of Northeast Queens falls within the higher‐density category, one‐half mile between routes, based on transit dependency and population density. Average walking distance to a bus route is one‐half the distance between routes, or one‐quarter mile. Other criteria sometimes come into play when determining route spacing, including geographic factors (e.g., terrain, type of the existing street network) and demographic factors (e.g., employment density, population within walking distance of a stop, significant concentrations of elderly and/or disabled persons, presence of major destinations such as hospitals, schools, or shopping).
Coverage in Northeast Queens In the study area, bus coverage of inhabited areas was analyzed based on the one‐half mile distance between bus routes – green and open spaces were not included in the analysis. Customers within the bus coverage area are within one‐quarter mile (10 minute walk) of a bus route. Bus coverage in the study area was analyzed in four scenarios:
Local/Limited Weekday Coverage
Local/Limited Weekend Coverage
Local/Limited Overnight Coverage
Express/Subway/LIRR Coverage

, Metropolitan Transportation Authority
13
Figure 9. Local/Limited Bus Weekday Coverage On weekdays, more than 99 percent of Northeast Queens is covered by local and/or limited bus service.
Figure 10. Local/Limited Bus Weekend Coverage On weekends, almost 98 percent of Northeast Queens is covered by local and/or limited bus service.

, Metropolitan Transportation Authority
14
Figure 11. Local/Limited Bus Overnight Coverage During weekday overnight periods, 92.5% of Northeast Queens is covered by local and/or limited bus service.
Figure 12. Commuter Service Coverage On weekdays, 87 percent of Northeast Queens is covered by commuter service. Commuter service includes express bus, subway, and Long Island Rail Road service.

, Metropolitan Transportation Authority
15
2010 Service Changes In 2010, the MTA made service changes throughout the five boroughs. Nine routes in Northeast Queens were affected by these service changes. These routes were chosen for discontinuation, consolidation, or other adjustment for several reasons. These included duplication of service, low and declining ridership, and high operating costs. The service reductions allowed for a more efficient bus network to operate in Northeast Queens. Four services that were reduced or eliminated in 2010 have been restored. Figure 13. 2010 Northeast Queens Bus Map
Q14 During the 2010 service reduction planning, the Q14 was initially proposed for discontinuation. The route previously provided local weekday and weekend bus service from Downtown Flushing to Whitestone via Union Street, Willets Point Boulevard, 149th Street, and 150th Street. In response to public input, instead of full discontinuation, it was consolidated into a restructured Q15. The Q14 was renamed the Q15A and shares the Q15 terminals, but runs along 150th Street and 7th Avenue in Whitestone as the Q14 did. The Q15A also travels on Clintonville Street and 10th Avenue, two streets that previously did not have Q14 bus service, before rejoining the Q15 on 154th Street. Although bus service on 149th Street is no longer available, customers can walk one block east to 150th Street for more frequent Q15 and Q15A bus service, or two blocks west for the Q20A, Q20B, or Q44. Ridership on the Q15/Q15A has increased since 2010, but levels are

, Metropolitan Transportation Authority
16
still below the combined former Q14/Q15 ridership. Trips were also added in 2010 on the Q34 to accommodate Q14 customers on the lower portion of the Q14 route where the Q34 provides a nearby alternative through Parsons Boulevard and Willets Point Boulevard.
Q31 Weekend Service The Q31 provides local bus service from Downtown Jamaica to Bayside. Weekend service on the Q31 was discontinued in June 2010. Weekend service on the Q31 was restored in April 2014.
Saturday Q76 Service In June 2010, Saturday service on the Q76 was discontinued due to low ridership. Saturday service was restored in September 2012. Ridership has increased six percent above pre‐service reductions levels, with more than 1,900 customers per Saturday. The Q76 serves several major shopping centers in Downtown Jamaica, on Francis Lewis Boulevard, and on 20th Avenue in College Point. Additionally, Sunday service was introduced in 2013 (see next page for a description of Q76 Sunday service).
Q79 The entire Q79 route was eliminated during the 2010 service changes. The Q79 had the lowest average weekday and weekend ridership of any local NYCT bus route in Queens. The Q79 provided service between Floral Park and the Little Neck LIRR station along Little Neck Parkway. In January 2013, some weekday Q36 trips were extended to the Little Neck LIRR via the previous Q79 route to serve the Floral Park, Glen Oaks, and Little Neck neighborhoods. Ridership on the extended portion of the Q36 is still low, but the route provides bus service to areas that had limited viable transit alternatives. The Q36 extension also provides a direct connection to Downtown Jamaica and F subway service on Hillside Avenue, while the former Q79 required a transfer.
Off‐peak Q26 Service The Q26 travels from Downtown Flushing to Fresh Meadows via Parsons Boulevard, 46th Avenue, and Hollis Court Boulevard. In June 2010, off peak Q26 service was discontinued. Service remained during the busy morning and evening peak travel periods. This short route shares most if its route with other buses, particularly the Q27 on 46th Avenue. A change of the travel path of the Q65 as discussed in Section 6: Recommendations will restore all‐day service to the Parsons Boulevard portion of the corridor served by this route.
Q74 The Q74 connected Queens College to the EF Kew Gardens‐Union Tpke station on weekdays
and was discontinued in 2010 due to the availability of alternate routes. The Q74 travelled along Union Turnpike and Main Street before looping around Queens College via Horace Harding Expressway, Kissena Boulevard, and Melbourne Avenue. There were almost 2,100 average weekday customers on the Q74. Most customers have switched to other bus routes, including the Q20A/B, Q40, Q46, and Q64 bus routes.
Q75 The Q75 provided local weekday service between the Jamaica‐165th Street Bus Terminal and Oakland Gardens via Hillside Avenue, 188th Street, and 73rd Avenue. Almost 1,000 customers used the bus route on an average weekday. The route was discontinued in June 2010. More than half of the route duplicated service of the busier and more frequent Q17. Additionally, service on

, Metropolitan Transportation Authority
17
73rd Avenue is provided by the Q88. Most former Q75 customers have switched to these two routes.
X32 The X32 had three branches that connected Downtown Jamaica, Oakland Gardens, and Bay Terrace to Bronx High School of Science via the Whitestone Bridge. The entire route was eliminated during the 2010 Service Reductions. There were only 50 daily weekday riders combined for all three branches, almost exclusively students. Most customers switched to private buses and the Q44.
X51 The X51 was an express bus route from Auburndale and Flushing to Midtown Manhattan. There were several stops around Auburndale and Flushing before continuing non‐stop to Manhattan. The route was discontinued due to low ridership and because it duplicated 7 train service. Most
former X51 customers have switched to the 7 train or to other buses in the area.
Other Recent & Upcoming Service Changes Express Bus Route Names In June 2010, the QM1 and QM1A along Union Turnpike were renamed the QM1, QM5, QM6, QM7, QM8 to distinguish the different service patterns offered by the routes. The QM1, QM5, and QM6 connect Northeast Queens to Midtown Manhattan, while the QM7 and QM8 connect Northeast Queens to Lower Manhattan. In 2011, the QM2A was renamed the QM20 to distinguish it from the QM2. Both routes provide service from Bay Terrace to Midtown.
QBx1 The QBx1 provided local bus service between Flushing, Co‐op City, and Pelham Bay Park and the intermediate neighborhoods of College Point, Throgs Neck and Pelham Bay Park. The QBx1 had multiple short service patterns operating only between Pelham Bay Park and the high density residential development of Co‐op City. The multiple service patterns, which varied by time of day and day of week, were confusing and did not provide a uniform and marketable service, which discouraged ridership. The QBx1 was split into two separate services in September 2010: the limited‐stop Q50 service between Flushing and Co‐Op City, and the local Bx23 service between the 6 Pelham Bay Park
station and Co‐Op City. The Q50 route connects Downtown Flushing and Whitestone to areas in the Bronx including Middletown‐Pelham Bay, Baychester, and Co‐Op City. The travel path in Northeast Queens remains unchanged, but the Q50 previously had four different service patterns within the Co‐Op City section of the Bronx that have since been regularized. The service levels provided between the study area and the Bronx have increased to provide more service as ridership has increased.
Q30 to Queensborough Community College In January 2013, some Q30 trips were extended to Queensborough Community College. Previously, many of these trips terminated at Horace Harding Expressway and Springfield Boulevard, forcing students and staff of Queensborough Community College and Benjamin N. Cardoza High School to transfer to the Q27 or walk several long blocks to the campuses.

, Metropolitan Transportation Authority
18
Sunday Q76 Service In September 2012, Sunday service was added to the Q76 to complement the restoration of Saturday service on the route. The Q76 serves several major shopping centers in Downtown Jamaica, Francis Lewis Boulevard, and 20th Avenue. There are now almost 1,300 customers on an average Sunday.
Flushing to Jamaica Select Bus Service Corridors Select Bus Service is New York City's version of Bus Rapid Transit: a high quality service that offers fast, frequent, and reliable service on high‐ridership bus routes. Select Bus Service brings quick and cost‐effective improvements to New York City’s transit network, benefitting the entire city through improved mobility, cleaner air, reduced greenhouse gas emissions, and reduced congestion. Through a comprehensive planning study and an extensive ongoing public outreach process, the MTA and the New York City Department of Transportation (NYCDOT) have identified two high ridership corridors for Select Bus Service implementation: Main Street and the Parsons/Kissena Boulevard corridor. Bus trips on the Q20A/B and Q44 Limited on Main Street and the Q25 and Q34 on Parsons/Kissena Boulevards were characterized by the community as being very long and slow, a hindrance for the 68,000 daily riders that use these bus lines. The new Q44 SBS route will replace the Q44 Limited inter‐borough service between Jamaica and the Bronx Zoo via Main Street in late 2015. The Q25 Limited will be converted into an all‐day, all‐week SBS route on Parsons Boulevard and Kissena Boulevard, and will follow the Q44 implementation at a later date.
Schedule Changes In addition to service changes, there have been schedule changes since 2010/2011 that have affected the frequency of bus service. MTA staff continuously monitor ridership levels on all bus routes. As ridership increases, additional buses are added to the schedule to accommodate more passengers. As more buses are added, frequency is increased, so the headways, and therefore the waiting time, are decreased. Routes that increase in ridership thereby become more popular as more frequent service is provided, enticing even more passengers to ride the bus that comes along even more frequently.
Scheduled Trip Changes Most routes have seen at least moderate increases in the frequency of scheduled trips on weekdays and weekends. The Q50, Q30 and Q58 have seen the largest percentage increases in local and limited trips, 29%, 24%, and 17% respectively. The reduction in frequency of Q44 trips on weekdays and weekends can be attributed to the introduction of articulated buses on the route in 2013. The longer 60‐foot articulated buses can accommodate a higher number of customers on each bus and therefore requires fewer trips to handle the same ridership. There have been significant increases in the frequency of weekend trips on many routes in Northeast Queens. The largest Saturday frequency increases were on the Q65, Q30 and Q12 at 15%, 12% and 11% respectively. Other than the Q44, decreases in frequency were only made on

, Metropolitan Transportation Authority
19
the Q1, Q36, and Q76 on Saturdays. On Sundays, the Q65, Q88, and Q25/34 saw the largest increases in frequency. Table 3. Bus Service Frequency Changes (2011 to 2015)
Route Weekday Saturday Sunday Route Weekday Saturday Sunday
Q1 ‐2% ‐1% 0% Q48 0% 3% 0%
Q12 1% 11% 0% Q50 29% 3% 3%
Q13 4% 5% 6% Q58 17% 0% 9%
Q15/Q15A 3% 0% 0% Q64 4% 4% 14%
Q16 1% 0% 0% Q65 6% 15% 24%
Q17 1% 4% 0% Q66 ‐1% 0% 18%
Q19 2% 0% 0% Q76* ‐3% ‐4% ‐‐
Q25/34 1% 8% 15% Q88 6% 0% 21%
Q26 6% ‐‐ ‐‐ QM1 10% ‐‐ ‐‐
Q27 ‐1% 9% 2% QM2 ‐7% ‐6% 4%
Q28 0% 5% 0% QM3 0% ‐‐ ‐‐
Q30 24% 12% 0% QM4 4% 0% 4%
Q31 ‐6% 0% 0% QM5 ‐2% 0% ‐7%
Q36 2% ‐5% ‐7% QM6 5% ‐3% ‐7%
Q43 ‐3% 0% ‐2% QM7 12% ‐‐ ‐‐
Q44* ‐7% ‐13% ‐12% QM8 17% ‐‐ ‐‐
Q46 2% 0% 9% QM20 ‐2% ‐‐ ‐‐
Q48 0% 3% 0% X68 0% ‐‐ ‐‐
*Q20A/B combined with Q44 for Scheduled Trips *Q76 Sunday Service began in 2014
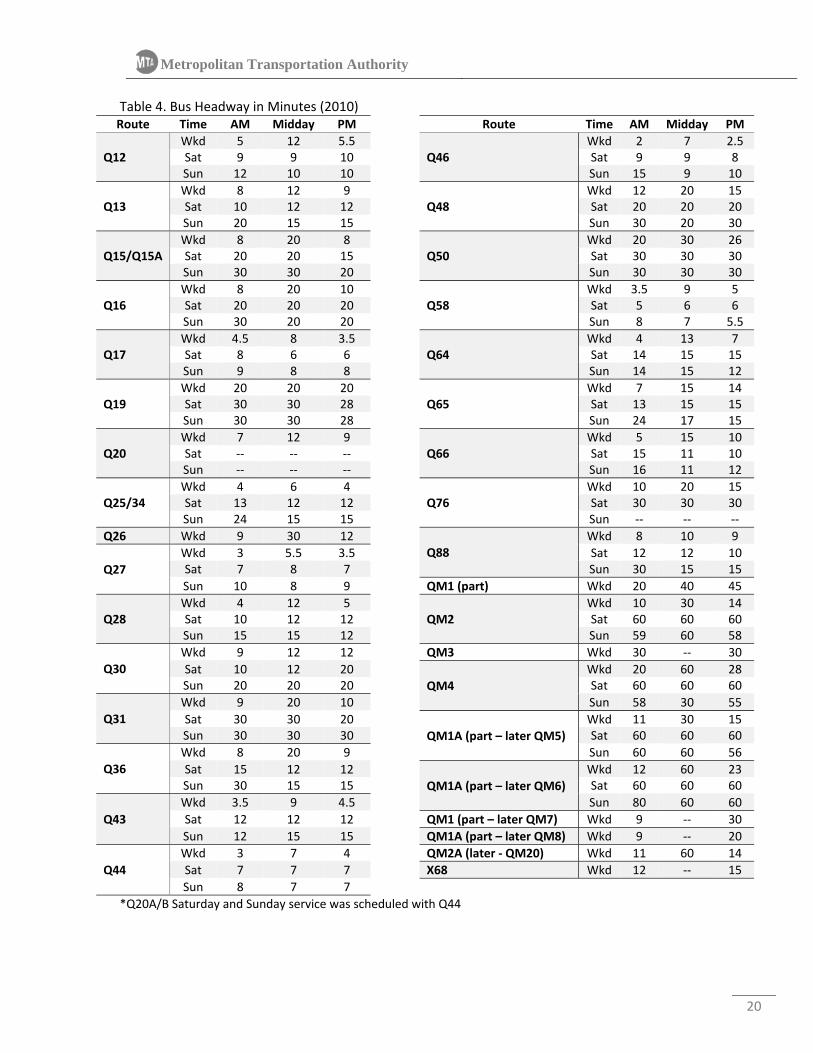
Headway Changes One measure of service is the frequency of buses. The more buses that are scheduled during an hour, the higher the frequency of bus service. Headways, which are minutes in between buses, are measured as the inverse of the frequency. The more buses that are scheduled during a given time period, the higher the frequency, and the lower the headways. Customers prefer frequent buses that arrive every few minutes so that they do not have to know when the next bus is scheduled to arrive. Bus Time allows customers waiting on less frequent buses to know how far away the bus is, also lowering anxiety about learning complex bus schedules. As part of the study, the average headways in 2015 were compared to the average headways from 2010 on all bus routes in Northeast Queens. Headways are presented in minutes and are based on the average time between scheduled trips during each period, and are not necessarily the exact time between scheduled trips.
, Metropolitan Transportation Authority
20
Table 4. Bus Headway in Minutes (2010) Route Time AM Midday PM Route Time AM Midday PM
Q12 Wkd 5 12 5.5
Q46 Wkd 2 7 2.5
Sat 9 9 10 Sat 9 9 8Sun 12 10 10 Sun 15 9 10
Q13 Wkd 8 12 9
Q48 Wkd 12 20 15
Sat 10 12 12 Sat 20 20 20Sun 20 15 15 Sun 30 20 30
Q15/Q15A Wkd 8 20 8
Q50 Wkd 20 30 26
Sat 20 20 15 Sat 30 30 30Sun 30 30 20 Sun 30 30 30
Q16 Wkd 8 20 10
Q58 Wkd 3.5 9 5
Sat 20 20 20 Sat 5 6 6Sun 30 20 20 Sun 8 7 5.5
Q17 Wkd 4.5 8 3.5
Q64 Wkd 4 13 7
Sat 8 6 6 Sat 14 15 15Sun 9 8 8 Sun 14 15 12
Q19 Wkd 20 20 20
Q65 Wkd 7 15 14
Sat 30 30 28 Sat 13 15 15Sun 30 30 28 Sun 24 17 15
Q20 Wkd 7 12 9
Q66 Wkd 5 15 10
Sat ‐‐ ‐‐ ‐‐ Sat 15 11 10Sun ‐‐ ‐‐ ‐‐ Sun 16 11 12
Q25/34 Wkd 4 6 4
Q76 Wkd 10 20 15
Sat 13 12 12 Sat 30 30 30Sun 24 15 15 Sun ‐‐ ‐‐ ‐‐
Q26 Wkd 9 30 12Q88
Wkd 8 10 9
Q27 Wkd 3 5.5 3.5 Sat 12 12 10Sat 7 8 7 Sun 30 15 15
Sun 10 8 9 QM1 (part) Wkd 20 40 45
Q28 Wkd 4 12 5
QM2 Wkd 10 30 14
Sat 10 12 12 Sat 60 60 60Sun 15 15 12 Sun 59 60 58
Q30 Wkd 9 12 12 QM3 Wkd 30 ‐‐ 30
Sat 10 12 20QM4
Wkd 20 60 28Sun 20 20 20 Sat 60 60 60
Q31 Wkd 9 20 10 Sun 58 30 55
Sat 30 30 20QM1A (part – later QM5)
Wkd 11 30 15Sun 30 30 30 Sat 60 60 60
Q36 Wkd 8 20 9 Sun 60 60 56
Sat 15 12 12QM1A (part – later QM6)
Wkd 12 60 23Sun 30 15 15 Sat 60 60 60
Q43
Wkd 3.5 9 4.5 Sun 80 60 60
Sat 12 12 12 QM1 (part – later QM7) Wkd 9 ‐‐ 30
Sun 12 15 15 QM1A (part – later QM8) Wkd 9 ‐‐ 20
Q44
Wkd 3 7 4 QM2A (later ‐ QM20) Wkd 11 60 14
Sat 7 7 7 X68 Wkd 12 ‐‐ 15
Sun 8 7 7 *Q20A/B Saturday and Sunday service was scheduled with Q44

, Metropolitan Transportation Authority
21
Table 5. Change in Bus Headway in Minutes (2010 to 2015) Route Time AM Midday PM Route Time AM Midday PM
Q12 Wkd ‐0.5 ‐2 ‐0.5
Q46 Wkd 0 ‐1 ‐0.5
Sat ‐1 0 ‐2 Sat ‐1 ‐1 0Sun 0 0 ‐1 Sun ‐5 0 ‐1
Q13 Wkd 0 ‐2 ‐3
Q48 Wkd 0 0 0
Sat 0 ‐2 ‐2 Sat ‐5 0 0Sun ‐5 0 ‐3 Sun 0 0 0
Q15/Q15A Wkd ‐2 0 0
Q50 Wkd ‐4 0 ‐10
Sat ‐5 0 0 Sat 0 0 0Sun 0 0 0 Sun 0 0 0
Q16 Wkd ‐2 0 ‐1
Q58 Wkd ‐1 ‐1 ‐0.5
Sat 0 0 0 Sat 0.5 0 ‐0.5Sun 0 0 0 Sun ‐2 ‐1.5 0
Q17 Wkd ‐0.5 ‐1 ‐0.5
Q64 Wkd 0 ‐3 ‐3
Sat 0 0 0 Sat 0 ‐3 ‐3Sun ‐1 0 ‐1 Sun 0 ‐3 0
Q19 Wkd ‐2 0 0
Q65 Wkd ‐3 ‐5 ‐8
Sat 0 0 2 Sat ‐1 ‐3 ‐3Sun 0 0 2 Sun 0 ‐2 0
Q20 Wkd 2 0 1
Q66 Wkd 0 ‐4 ‐3
Sat 12 12 12 Sat 0 0 0Sun 15 12 12 Sun 0 0 0
Q25/34 Wkd ‐1 0 ‐1
Q76 Wkd 2 0 0
Sat 0 ‐2 0 Sat 0 0 0Sun ‐6 ‐3 0 Sun 30 30 30
Q26 Wkd ‐1 ‐2Q88
Wkd 0 ‐2 0
Q27 Wkd ‐1 ‐0.5 ‐0.5 Sat 3 ‐3 0Sat ‐2 ‐2.5 ‐1 Sun ‐10 ‐3 ‐3
Sun ‐4 0 ‐1 QM1 Wkd 0 20 ‐17
Q28 Wkd ‐0.5 ‐2 1
QM2 Wkd 0 0 0
Sat 0 0 ‐2 Sat 0 0 0Sun 0 ‐3 0 Sun 1 0 2
Q30 Wkd ‐6 ‐5 ‐6.5 QM3 Wkd 0 ‐‐ 0
Sat 2 3 ‐5QM4
Wkd 0 0 0Sun 0 0 0 Sat 0 0 0
Q31 Wkd ‐2 0 0 Sun 2 30 5
Sat 0 0 0QM5
Wkd 0 0 0Sun 0 0 ‐10 Sat 0 0 0
Q36 Wkd ‐3 0 0 Sun 0 0 4
Sat 0 3 3QM6
Wkd ‐2 0 0Sun 0 5 5 Sat 0 0 0
Q43
Wkd ‐1 ‐1 ‐1 Sun ‐20 0 0
Sat ‐2 ‐2 ‐2 QM7 Wkd 1 ‐‐ ‐4
Sun 3 0 ‐3 QM8 Wkd 2 ‐‐ 0
Q44
Wkd 2 3 3 QM20 Wkd ‐2 0 2
Sat 1 2 1 X68 Wkd 3 ‐‐ ‐‐
Sun 0 2 2 *Q76 Sunday Service began in 2014

, Metropolitan Transportation Authority
22
Table 6. Bus Headway in Minutes (2015) Route Time AM Midday PM Route Time AM Midday PM
Q12 Wkd 4.5 10 5
Q46 Wkd 2 6 2
Sat 8 9 8 Sat 8 8 8Sun 12 10 9 Sun 10 9 9
Q13 Wkd 8 10 6
Q48 Wkd 12 20 15
Sat 10 10 10 Sat 15 20 20Sun 15 15 12 Sun 30 20 30
Q15/Q15A Wkd 6 20 8
Q50 Wkd 16 30 16
Sat 15 20 15 Sat 30 30 30Sun 30 30 20 Sun 30 30 30
Q16 Wkd 6 20 9
Q58 Wkd 2.5 8 4.5
Sat 20 20 20 Sat 5.5 6 5.5Sun 30 20 20 Sun 6 5.5 5.5
Q17 Wkd 4 7 3
Q64 Wkd 4 10 4
Sat 8 6 6 Sat 14 12 12Sun 8 8 7 Sun 14 12 12
Q19 Wkd 18 20 20
Q65 Wkd 4 10 6
Sat 30 30 30 Sat 12 12 12Sun 30 30 30 Sun 24 15 15
Q20 Wkd 9 12 10
Q66 Wkd 5 11 7
Sat 12 12 12 Sat 15 11 10Sun 15 12 12 Sun 16 11 12
Q25/34 Wkd 3 6 3
Q76 Wkd 12 20 15
Sat 13 10 12 Sat 30 30 30Sun 18 12 15 Sun 30 30 30
Q26 Wkd 8 ‐‐ 10Q88
Wkd 8 8 9
Q27 Wkd 2 5 3 Sat 15 9 10Sat 5 5.5 6 Sun 20 12 12
Sun 6 8 8 QM1 Wkd 20 60 28
Q28 Wkd 3.5 10 6
QM2 Wkd 10 30 14
Sat 10 12 10 Sat 60 60 60Sun 15 12 12 Sun 60 60 60
Q30 Wkd 3 7 5.5 QM3 Wkd 30 ‐‐ 30
Sat 12 15 15QM4
Wkd 20 60 28Sun 20 20 20 Sat 60 60 60
Q31 Wkd 7 20 10 Sun 60 60 60
Sat 30 30 20QM5
Wkd 11 30 15Sun 30 30 20 Sat 60 60 60
Q36 Wkd 5 20 9 Sun 60 60 60
Sat 15 15 15QM6
Wkd 10 60 23Sun 30 20 20 Sat 60 60 60
Q43
Wkd 2.5 8 3.5 Sun 60 60 60
Sat 10 10 10 QM7 Wkd 10 ‐‐ 26
Sun 15 15 12 QM8 Wkd 11 ‐‐ 20
Q44
Wkd 5 10 7 QM20 Wkd 9 60 16
Sat 8 9 8 X68 Wkd 15 ‐‐ 15
Sun 8 9 9

, Metropolitan Transportation Authority
23
3. BUS RIDERSHIP This section analyzes the actual regular use of bus service within Northeast Queens to provide an understanding of how transit in the area is utilized by the public, and potentially highlight areas for further analysis for service improvements.
3-Year Ridership Trend Weekday Local & Limited Ridership Local and limited weekday bus ridership in Northeast Queens grew 2.8% from 2011 to 2014. During the same period, citywide local and limited bus ridership was steady. The decline from 2.47 million average daily riders in 2011 to 2.45 million average daily riders in 2014 constitutes a 0.4% decline. Ridership on the Q50 increased 37.6% from 2011 to 2014. Also, Q19 and Q25 weekday ridership experienced 31% and 13% increases from 2011 to 2014, respectively. The largest percentage decline in ridership occurred on the Q31. Other routes that saw significant decreases in weekday ridership include the Q17, Q26, Q43, and Q13. Table 7. Weekday Local & Limited 3-Year Ridership (2011 to 2014)
Route
2011 Average Weekday Ridership
2014 Average Weekday Ridership
Change from 2011 to 2014
Citywide 2,465,142 2,454,461 -0.4%
Queens 704,979 714,570 0.01%
NE Queens 307,819 316,589 2.8%
Q1 4,731 4,709 -0.5%
Q12 10,828 10,815 -0.1%
Q13 9,111 8,706 -4.4%
Q15 5,615 5,738 2.2%
Q16 3,982 4,021 1.0%
Q17 19,105 17,530 -8.2%
Q19 2,365 3,088 30.6%
Q20 13,150 13,452 2.3%
Q25 17,336 19,567 12.9%
Q26 1,509 1,438 -4.7%
Q27 24,567 24,935 1.5%
Q28 9,956 9,905 -0.5%
Q30 9,679 10,155 4.9%
Q31 6,320 5,709 -9.7%
Q34 6,880 7,218 4.9%
Q36 5,444 5,874 7.9%
Q43 16,008 15368 -4.0%
Q44 28,143 28,139 0.0%
Q46 22,593 22,196 -1.8%
Q48 2,629 2,673 1.7%
Q50 3,225 4,439 37.6%
Q58 26,563 29,464 10.9%
Q64 10,200 10,253 0.5%

, Metropolitan Transportation Authority
24
Q65 18,724 20,685 10.5%
Q66 12,535 14,105 12.5%
Q76 5,818 5,711 -1.8%
Q88 10,803 10,695 -1.0%
Weekend Local & Limited Ridership Most local and limited bus routes in the study area saw percentage increases in Saturday and Sunday ridership from 2011 to 2014. Saturday ridership increased 4.5% and Sunday ridership increased 9.4% for all Northeast Queens local bus routes during this period. The largest percentage increases in Saturday ridership were on the Q50, Q65, and Q66, which increased 35.1%, 21.1%, and 19.3%, respectively. The Q1, Q36, and Q13 saw the largest percentage declines in ridership. The largest percentage increases on Sunday ridership were seen on the Q19, Q65, and Q25 routes. Those routes increased 42.1%, 39.8%, and 25.8% respectively. Only four local bus routes in Northeast Queens saw declines in Sunday ridership from 2011 to 2014. Ridership decreased 11.9% on the Q30, 4.3% on the Q1, 1.1% on the Q20, and 0.3% on the Q43. Table 8. Weekend Local & Limited 3-Year Ridership (2011 to 2014)
Route
2011 Average Saturday Ridership
2014 Average Saturday Ridership
Change from 2011 to 2014
2011 Average Sunday
Ridership
2014 Average Sunday
Ridership Change from 2011 to 2014
Q1 2,895 2,675 -7.6% 2,204 1,941 -11.9%
Q12 7,861 8,168 3.9% 6,555 6,848 4.5%
Q13 6,660 6,211 -6.7% 4,355 4,399 1.0%
Q15 3,134 3,084 -1.6% 1,917 1,949 1.7%
Q16 1,962 1,870 -4.7% 1,310 1,364 4.1%
Q17 12,609 11,934 -5.4% 10,478 10,170 -2.9%
Q19 1,445 1,691 17.1% 1,047 1,185 13.1%
Q20 7,497 8,081 7.8% 6,065 6,590 8.6%
Q25 11,303 13,359 18.2% 8,089 10,255 26.8%
Q27 13,455 13,731 2.1% 9,705 10,245 5.6%
Q28 5,772 5,802 0.5% 4,360 4,452 2.1%
Q30 3,981 4,004 0.6% 2,541 2,613 2.8%
Q31* -- 1,150 -- -- 756 --
Q36 3,423 3,166 -7.5% 2,407 2,266 -5.9%
Q43 8,012 8,209 2.5% 5,650 5,810 2.8%
Q44 20,119 20,044 -0.4% 17,346 18,024 3.9%
Q46 9,905 9,732 -1.7% 7,551 7,676 1.6%
Q48 2,215 2,330 5.2% 1,750 1,881 7.5%
Q50 2,043 2,760 35.1% 1,559 2,187 40.3%
Q58 21,392 22,717 6.2% 17,206 19,201 11.6%
Q64 3,747 4,018 7.2% 3,073 3,696 20.3%
Q65 9,058 10,970 21.1% 6,062 8,396 38.5%
Q66 7,806 9,314 19.3% 6,104 8,039 31.7%
Q88 5,320 5,534 4.0% 3,201 3,588 12.1%
*Q31 weekend service was restored in April 2014, data represents 9 month period from April to December 2014.

, Metropolitan Transportation Authority
25
Express Ridership Express buses in Northeast Queens carried almost 10,000 customers on an average weekday in 2014. Express bus weekday ridership in Northeast Queens increased two percent between 2011 and 2014. The QM8, QM6, and QM1 saw the largest percentage increases in ridership during this time. During the same period, citywide express bus ridership declined. The decline from just over 78,000 average citywide daily riders in 2011 to just over 74,000 average citywide daily riders in 2014 constitutes a 5% decline. The only decrease in weekday express bus ridership in Northeast Queens was on the QM7, which loss almost four percent of its customers. As in most areas of New York City, express bus service predominantly serves a weekday commuter ridership; however, four of the 11 express buses in the study area also provide weekend service: the QM2, QM4, QM5, and QM6. Large increases on Saturdays and Sundays were seen on all routes, except the QM4, which loss customers over the 3-year period. Table 9. Weekday Express 3-Year Ridership (2011 to 2014)
Route
2011 Average Weekday Ridership
2014 Average Weekday Ridership
2011 - 2014
Change
QM1 597 626 4.8%
QM2 1,916 1,922 0.3%
QM3 130 133 2.6%
QM4 809 813 0.5%
QM5 2,034 2,071 1.8%
QM6 1,050 1,115 6.1%
QM7 770 740 -3.9%
QM8 571 632 10.8%
QM20 1,115 1,120 0.5%
X68 591 599 1.4%
Table 10. Weekend Express 3-Year Ridership (2011 to 2014)
2011 Average Saturday Ridership
2014 Average Saturday Ridership
Change from 2011 to 2014
2011 Average Sunday
Ridership
2014 Average Sunday
Ridership Change from 2011 to 2014
QM2 361 417 15.6% 221 269 21.8%
QM4 148 145 -2.2% 104 99 -4.5%
QM5 287 376 31.0% 181 246 36.2%
QM6 232 267 15.2% 163 190 16.5%
1-Year Ridership Trend
Weekday Ridership From 2013 to 2014, weekday ridership on local buses in Northeast Queens decreased 0.6%. The largest percentage declines were seen on the Q76, Q48, and Q88. While most Northeast Queens routes lost ridership, a few routes increased ridership from 2013 to 2014. Weekday ridership on the Q50 increase 9.2% during this period, while ridership increased 5.3% on the Q19 and 3.9% on the Q66.

, Metropolitan Transportation Authority
26
Table 11. Weekday Local & Limited 1-Year Ridership (2013 to 2014)
Route
2013 Average
Weekday Ridership
2014 Average
Weekday Ridership
2013 - 2014
Change
Q1 4,718 4,709 -0.2%
Q12 11,185 10,815 -3.3%
Q13 8,899 8,706 -2.2%
Q15 5,799 5,738 -1.0%
Q16 4,153 4,021 -3.2%
Q17 17,985 17,530 -2.5%
Q19 2,933 3,088 5.3%
Q20 13,609 13,452 -1.2%
Q25 19,324 19,567 1.3%
Q26 1,464 1,438 -1.8%
Q27 25,014 24,935 -0.3%
Q28 10,218 9,905 -3.1%
Q30 10,205 10,155 -0.5%
Q31 5,881 5,709 -2.9%
Q34 7,054 7,218 2.3%
Q36 5,933 5,874 -1.0%
Q43 15,738 15368 -2.4%
Q44 28,689 28,139 -1.9%
Q46 22,737 22,196 -2.4%
Q48 2,790 2,673 -4.2%
Q50 4,063 4,439 9.2%
Q58 28,967 29,464 1.7%
Q64 10,361 10,253 -1.0%
Q65 20,227 20,685 2.3%
Q66 13,575 14,105 3.9%
Q76 5,975 5,711 -4.4%
Q88 11,078 10,695 -3.5%
Weekend Ridership Saturday ridership on local buses in Northeast Queens increased 0.1% and Sunday ridership increased 3.3% from 2013 to 2014. Similar to weekdays, weekend ridership increased the most on the Q50 and Q19. Saturday ridership increased 12.2% on the Q50 and 11% on the Q19. Sunday ridership on the Q50 increased 14.6% and 12.3% on the Q19. The Q30, Q13, and Q46 saw the largest decreases in percentage of Saturday ridership from 2013 to 2014. Sunday ridership decreased in percentage the most on the Q30, Q36, and Q13.

, Metropolitan Transportation Authority
27
Table 12. Weekend Local & Limited 1‐Year Ridership (2013 to 2014)*
Route
2013 Average Saturday Ridership
2014 Average Saturday Ridership
2013 ‐ 2014 Change
2013 Average Sunday Ridership
2014 Average Sunday Ridership
2013 ‐ 2014 Change
Q1 2,695 2,675 ‐0.7% 1,951 1,941 ‐0.5%
Q12 8,183 8,168 ‐0.2% 6,877 6,848 ‐0.4%
Q13 6,483 6,211 ‐4.2% 4,469 4,399 ‐1.6%
Q15 3,106 3,084 ‐0.7% 1,933 1,949 0.8%
Q16 1,889 1,870 ‐1.0% 1,338 1,364 2.0%
Q17 12,150 11,934 ‐1.8% 9,964 10,170 2.1%
Q19 1,523 1,691 11.0% 1,055 1,185 12.3%
Q20 8,123 8,081 ‐0.5% 6,456 6,590 2.1%
Q25 12,910 13,359 3.5% 9,437 10,255 8.7%
Q27 13,670 13,731 0.4% 10,071 10,245 1.7%
Q28 5,919 5,802 ‐2.0% 4,427 4,452 0.6%
Q30 4,220 4,004 ‐5.1% 2,769 2,613 ‐5.6%
Q36 3,222 3,166 ‐1.8% 2,359 2,266 ‐4.0%
Q43 8,190 8,209 0.2% 5,736 5,810 1.3%
Q44 20,120 20,044 ‐0.4% 17,149 18,024 5.1%
Q46 10,072 9,732 ‐3.4% 7,620 7,676 0.7%
Q48 2,268 2,330 2.7% 1,902 1,881 ‐1.1%
Q50 2,460 2,760 12.2% 1,908 2,187 14.6%
Q58 22,831 22,717 ‐0.5% 18,684 19,201 2.8%
Q64 4,052 4,018 ‐0.9% 3,597 3,696 2.7%
Q65 10,543 10,970 4.1% 7,846 8,396 7.0%
Q66 9,104 9,314 2.3% 7,336 8,039 9.6%
Q76 1,994 2,066 3.6% 1,358 1,403 3.3%
Q88 5,539 5,534 ‐0.1% 3,382 3,588 6.1%
* There is no weekend service on the Q26 and Q34. Weekend service on the Q31 was restored in April 2014.
Express Bus Ridership Weekday ridership on Northeast Queens express buses increased 0.5% from 2013 to 2014. The QM4, QM5, and QM8 had the largest percentage increases in ridership over the one‐year period, gaining 3.7%, 5.5%, and 3.1%, respectively. Of the four express bus routes operating on weekends, all saw increases in ridership. The most significant increase was seen on Sundays on the QM5, which gained 22.8% additional customers from 2013 to 2014. The largest increase in Saturday ridership was seen on the QM6.

, Metropolitan Transportation Authority
28
Table 13. Weekday Express 1‐Year Ridership (2013 to 2014)
Route 2013 Average
Weekday Ridership 2014 Average
Weekday Ridership 2013 ‐ 2014 Change
QM1 670 626 ‐6.5%
QM2 1,957 1,922 ‐1.8%
QM3 152 133 ‐12.5%
QM4 784 813 3.7%
QM5 1,963 2,071 5.5%
QM6 1,111 1,115 0.4%
QM7 737 740 0.4%
QM8 614 632 3.1%
QM20 1,148 1,120 ‐2.4%
X68 591 599 1.4%
Table 14. Weekend Express 1‐Year Ridership (2013 to 2014)
Route
2013 Average Saturday Ridership
2014 Average Saturday Ridership
2013 ‐ 2014 Change
2013 Average Sunday Ridership
2014 Average Sunday Ridership
2013 ‐ 2014 Change
QM2 395 417 5.6% 257 269 4.8%
QM4 133 145 9.0% 94 99 5.0%
QM5 354 376 6.2% 200 246 22.8%
QM6 242 267 10.2% 187 190 1.4%
Senior/Student Ridership On an average weekday in Northeast Queens, senior and disabled customers accounted for 8.3% of bus customers and Students accounted for 14.1% of bus customers. In comparison, 14.5% of Queens and 11.2% of citywide bus customers were senior and disabled, and 8.5% of customers in Queens and 11.4% of customers citywide were students. The Q13 had the largest share of senior and disabled customers at 12.9%, followed by the Q20 (11.8%), Q28 (11.1%), Q16 (10.9%), and Q34 (10.7%). The Q31 had the smallest share of senior and disabled customers, but the largest percentage of student customers at 34.2%. Other routes that had high percentages of student ridership were the Q76 (28.9%), Q88 (26.3%), and Q30 (21.6%). Combined seniors, disabled customers, and students made up almost 40% of Q31 customers, the highest of all Northeast Queens bus routes.
Table 15. Weekday Senior/Disabled and Student Ridership
2014 Senior and
Disabled 2014 Student 2014 Total
Route
Average Weekday Ridership
% of Total
Ridership
Average Weekday Ridership
% of Total
Ridership
Average Weekday Ridership
Q1 369 7.8% 528 11.2% 4,709
Q12 1,023 9.5% 725 6.7% 10,815
Q13 1,119 12.9% 623 7.2% 8,706
Q15 547 9.5% 474 8.3% 5,738
Q16 438 10.9% 348 8.7% 4,021
Q17 1,611 9.2% 2,514 14.3% 17,530

, Metropolitan Transportation Authority
29
Q19 245 7.9% 394 12.8% 3,088
Q20 1,582 11.8% 2,031 15.1% 13,452
Q25 1,395 7.1% 2,377 12.1% 19,567
Q26 98 6.8% 117 8.1% 1,438
Q27 1,913 7.7% 4,133 16.6% 24,935
Q28 1,102 11.1% 1,903 19.2% 9,905
Q30 581 5.7% 2,197 21.6% 10,155
Q31 299 5.2% 1,952 34.2% 5,709
Q34 776 10.7% 976 13.5% 7,218
Q36 478 8.1% 609 10.4% 5,874
Q43 1,301 8.5% 2,536 16.5% 15368
Q44 2,177 7.7% 4,171 14.8% 28,139
Q46 1,646 7.4% 2,329 10.5% 22,196
Q48 213 8.0% 141 5.3% 2,673
Q50 343 7.7% 403 9.1% 4,439
Q58 2,241 7.6% 3,786 12.8% 29,464
Q64 698 6.8% 595 5.8% 10,253
Q65 1,577 7.6% 2,226 10.8% 20,685
Q66 1,116 7.9% 2,021 14.3% 14,105
Q76 440 7.7% 1,648 28.9% 5,711
Q88 856 8.0% 2,809 26.3% 10,695
Bus Stop Usage Bus Stop Usage ridership data is estimated through Automated Fare Collection (AFC) data from MetroCard swipes to determine a rider’s point of entry (boardings) and exit (alightings) on buses. This information is then used to estimate overall ridership information along bus routes. Bus Time GPS records provide Automatic Vehicle Location (AVL) data in 30‐second intervals. By merging AFC data with Bus Time AVL data, and with the time of payment and position of that bus at the time of payment, the points of entry are estimated. Points of exit can be determined based on the next payment location when using a MetroCard swipe, when known. In other cases, riders are distributed to alighting locations based on observed boarding and alighting trends. Due to the availability of information, sometimes narrowing down the points of entry and exit will be more difficult. In these cases, designated points of entry and exit are assigned based on best estimate probabilities. Reviewing the estimations on an aggregated basis (e.g., monthly basis) yields more accurate information than on a single day basis. Cash payments and fare evasion are also included in determining ridership numbers based on observed data. Boardings and Alightings The boarding and alighting locations of Northeast Queens passengers have been estimated and the most significant stops are shown in the following figures. Boarding and alighting locations show an increasing quantity of ridership in the western section of Northeast Queens, with a clear relationship between bus use and other transit infrastructure (subway). Weekday AM bus boardings and alightings are shown in Figures 14 and 15. When considering overnight service, the stops near subways emerge as even more important to Northeast Queens customers. Overnight bus boardings and alightings maps are located in Appendix C: Additional Data.

, Metropolitan Transportation Authority
30
Figure 14. Local Weekday Bus Boardings (6AM to 9AM)
Figure 15. Local Weekday Bus Alightings (6AM to 9AM)

, Metropolitan Transportation Authority
31
The ten busiest bus stops and bus stops with greater than 3,000 boardings and alightings for an average weekday are presented in Table 16. The busiest bus stops are all located near subway stations. Eight of the ten busiest bus stops in Northeast Queens are located in Downtown Flushing. One stop is located in Jamaica and the remaining stop is in Kew Gardens, where the Q46 connects to the subway. Table 16. Ten Busiest Bus Stops in Northeast Queens
*These stops are located at terminals, therefore, all customers are alighting. Figure 16. Major Bus Stops (>3,000 boardings and alighting per day)
Stop Name Total Daily Boarding
Total Daily Alighting
Total Stop Utilization
Main St & Roosevelt Av 13,144 14,780 27,92339 Av & Main St 0* 16,982 16,98239 Av & 138 St 6,636 8,063 14,699Main St & 39 Av 6,529 5,769 12,298Kissena Bl & Main St 9,471 1,505 10,976Hillside Av & 179 St Subway 399 8,817 9,21641 Rd & Main St 4,236 4,805 9,041Queens Bl & 78 Cr 0* 8,885 8,885Roosevelt Av & Main St 7,600 884 8,484Kissena Bl & Sanford Av 3,027 5,309 8,336

, Metropolitan Transportation Authority
32
Express Bus Boardings
Express bus ridership (by boardings) is concentrated along Union Turnpike, 188th Street, 73rd Avenue, Jewel Avenue in the southern section of Northeast Queens, and in Beechhurst, Bay Terrace, and Whitestone neighborhoods in the northern section of the study area. Lower ridership (by boardings) is seen on corridors that are adjacent to the subway and Long Island Rail Road. Only boarding location data is included because of the Manhattan‐bound orientation of express bus service. Northeast Queens residents board express buses going to Manhattan, but passengers do not exit the bus until they reach Manhattan. Exceptions to this rule are allowed for special transfer locations such as Union Turnpike for transfers among the midtown QM1, QM5, and QM6 and the downtown QM7 and QM8 buses, or between the 3rd Avenue and 6th Avenue variations of these midtown buses. Figure 17. Express Bus Boardings in Northeast Queens
*QM20 data was not available for this map

, Metropolitan Transportation Authority
33
Origins and Destinations The data that have become available since the implementation of Bus Time have allowed the MTA to estimate the origins and destinations of bus passengers by capturing MetroCard swipe location details throughout the day. The data presented here represent the daily ridership for an average mid‐week weekday (Tuesday/Wednesday/Thursday) – or an average Saturday – from the period covering mid‐September to mid‐October 2013. The origin‐destination analysis can help to identify where Northeast Queens bus customers are traveling along a particular route. These data can also show which bus routes are being used in areas with multiple buses. Figure 18 shows the origins and destinations of bus customers through the visualization of the major inter‐ and intra‐neighborhood movements of Northeast Queens bus passengers. Neighborhood names and boundaries are consistent with the neighborhoods defined as “Neighborhood Tabulation Areas” by the Department of City Planning. Single bus trips (not complete path of a bus‐to‐bus transfer) are shown as movements to and from Northeast Queens neighborhoods. Any neighborhood links that had greater than 1,000 daily weekday passengers are presented on the map, with the line thickness indicating the importance of serving those two destinations. Figure 18. Origins and Destinations of Northeast Queens Bus Trips by Neighborhood
The underlying data that produced this visualization can be found in a standard Origin‐Destination matrix located in Appendix C: Additional Data.

, Metropolitan Transportation Authority
34
Trip Length (NYC Transit Authority Routes Only) Bus trips on Northeast Queens routes exhibit slightly longer trips than those in the rest of Queens. Weekday trips are 9.9% longer than trips made in other parts of Queens. The two sets of Queens routes were compared with a t‐test, and the average trip lengths are meaningfully different to a confidence interval greater than 90%.
Table 17. Weekday Average Trip Comparisons
Set Of Routes Weekday Average Trip Length
(Miles)
Queens Routes 2.81
Northeast Queens Routes 2.90
Non‐NE Queens Routes 2.64
Within the set of Northeast Queens NYCT bus routes there is a considerable amount of variance in the average trip length. The longest average trips are seen on the Q27 Limited, where trips are almost 5 miles long. The average trip length for Q1 customers is 4.1 miles and 3.71 miles for Q46 Limited customers, the second and third longest trips among bus routes in the study area. The Q20B and Q26 customers have the shortest average trip lengths on weekdays at 1.55 miles and 1.79 miles, respectively. These two routes are the only bus routes in Northeast Queens that have average trips less than two miles. The full table of weekday average trip length for Northeast Queens NYCT bus routes is located in Appendix C: Additional Data of this report.
Transfers
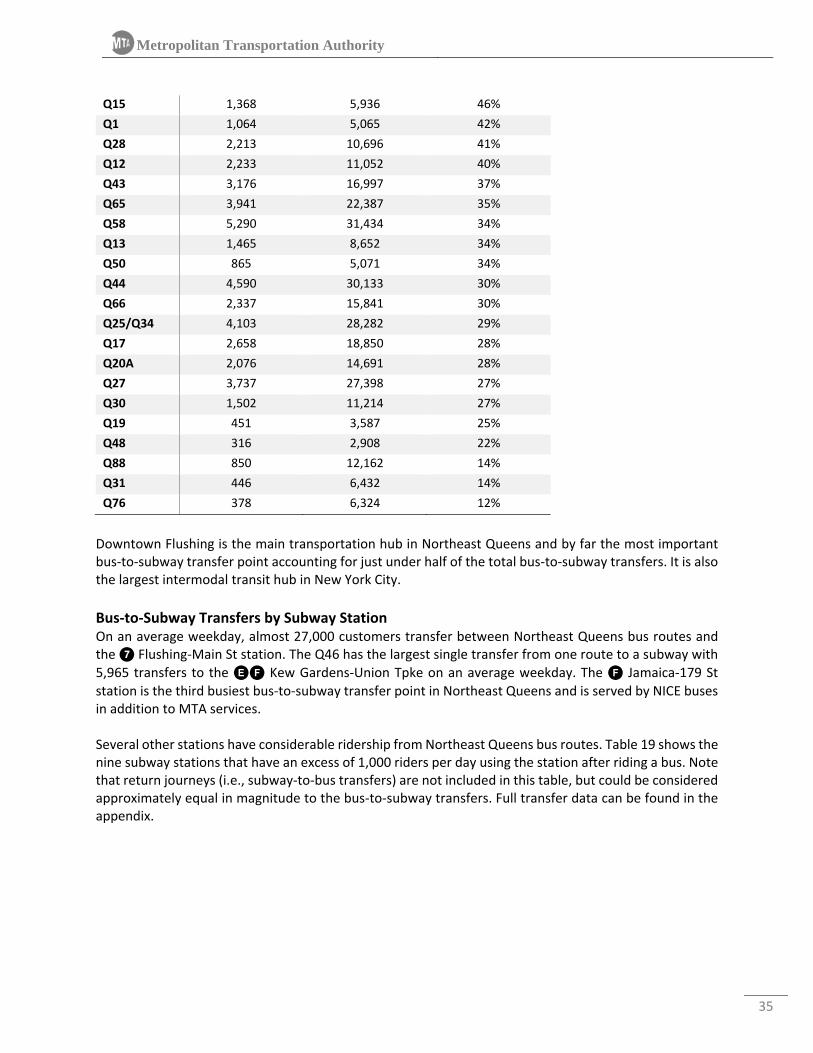
Bus‐to‐Subway Transfers by Route Of the 29 local bus routes in Northeast Queens, nine are specifically designated as subway “feeder” routes, where more than half of customers on these routes are primarily interested in getting to a subway for the remainder of their journey. The remaining routes, called “grid” routes, see fluctuating ridership along the route with customers boarding and alighting throughout the entire length of the route, but also serve subway stations as well. It is unsurprising that a significant number of bus trips are followed by a swipe into a subway station. On an average weekday in May, 58,300 bus customers transferred from Northeast Queens routes to a subway. Assuming that customers make round trips doubles this number, over a third (39.0%) of bus trips are also associated with a subway journey. The following table presents routes in Northeast Queens by the amount of passengers they deliver to subway stations for an additional journey. It also compares the number of transfers to total ridership. It is evident from this fraction that for some routes within Northeast Queens the most important function is feeding to the subway. For determining the number of bus trips that are associated with a subway trip, it was assumed that every bus‐to‐subway transfer generates a symmetrical subway‐to‐bus transfer as well. Table 18. Bus‐to‐Subway Weekday Transfers by Bus Route (May 2014)
Route Bus‐To‐Subway
Transfers Weekday Ridership Portion of Trips Subway Transfer
Q26 586 1,492 79%
Q64 3,982 10,943 73%
Q16 1,221 4,144 59%
Q46 5,963 23,507 51%
Q36 1,505 6,376 47%
, Metropolitan Transportation Authority
35
Q15 1,368 5,936 46%
Q1 1,064 5,065 42%
Q28 2,213 10,696 41%
Q12 2,233 11,052 40%
Q43 3,176 16,997 37%
Q65 3,941 22,387 35%
Q58 5,290 31,434 34%
Q13 1,465 8,652 34%
Q50 865 5,071 34%
Q44 4,590 30,133 30%
Q66 2,337 15,841 30%
Q25/Q34 4,103 28,282 29%
Q17 2,658 18,850 28%
Q20A 2,076 14,691 28%
Q27 3,737 27,398 27%
Q30 1,502 11,214 27%
Q19 451 3,587 25%
Q48 316 2,908 22%
Q88 850 12,162 14%
Q31 446 6,432 14%
Q76 378 6,324 12%
Downtown Flushing is the main transportation hub in Northeast Queens and by far the most important bus‐to‐subway transfer point accounting for just under half of the total bus‐to‐subway transfers. It is also the largest intermodal transit hub in New York City.
Bus‐to‐Subway Transfers by Subway Station On an average weekday, almost 27,000 customers transfer between Northeast Queens bus routes and the 7 Flushing‐Main St station. The Q46 has the largest single transfer from one route to a subway with
5,965 transfers to the EF Kew Gardens‐Union Tpke on an average weekday. The F Jamaica‐179 St
station is the third busiest bus‐to‐subway transfer point in Northeast Queens and is served by NICE buses in addition to MTA services. Several other stations have considerable ridership from Northeast Queens bus routes. Table 19 shows the nine subway stations that have an excess of 1,000 riders per day using the station after riding a bus. Note that return journeys (i.e., subway‐to‐bus transfers) are not included in this table, but could be considered approximately equal in magnitude to the bus‐to‐subway transfers. Full transfer data can be found in the appendix.

, Metropolitan Transportation Authority
36
Table 19. Bus‐to‐Subway Weekday Transfers by Station (May 2014)
Subway Station Northeast Queens Bus Routes Serving
Subway Station # Of Transfers
Flushing‐Main St (7) Q12, Q13, Q15, Q15A, Q16, Q17, Q19, Q20A/B, Q25, Q26, Q27, Q28, Q34, Q44,
Q48, Q50, Q58, Q65, Q66 26,919
Kew Gardens‐Union Turnpike (EF) Q46 5,965
Jamaica‐179 St (F) Q1, Q17, Q36, Q43, Q76 5,948
Forest Hills‐71 Av (EFMR) Q64 3,992
Grand Av‐Newtown (MR) Q58 3,722
Jamaica Center‐Parsons‐Archer (EJZ) Q20A/B, Q25, Q30, Q31, Q34, Q44 1,670
169 St (F) Q1, Q17, Q30, Q31, Q36, Q43 1,387
Sutphin Blvd‐Archer Av‐JFK Airport (EJZ) Q25, Q30, Q31, Q34, Q43 1,277
Northern Blvd (MR) Q66 1,220
Figure 19. Detailed Bus‐to‐Subway Transfers for Busiest Stations

, Metropolitan Transportation Authority
37
Figure 20. Bus‐to‐Subway Weekday Transfers for Northeast Queens Bus Routes (>500 transfers)

, Metropolitan Transportation Authority
38
Bus‐to‐Bus Transfers The 29 local bus routes in Northeast Queens give rise to the possibility of numerous bus‐to‐bus transfer opportunities. Most bus‐to‐bus transfers are from a local or limited bus to another local or limited bus. There are relatively few transfers from a local or limited bus to an express bus, or vice versa. The most significant bus‐to‐bus transfers are presented in Figure 21 and Table 20. The two largest single bus‐to‐bus transfers occur between the Q46 and Q27 at Union Turnpike and Springfield Boulevard and between the Q27 and Q43 at Hillside Avenue and Springfield Boulevard. In addition to these locations, a significant number of combined bus transfers occur in Downtown Flushing near Main Street, Kissena Boulevard, and Roosevelt Avenue. A fuller representation of bus‐to‐bus transfers is included in Appendix C: Additional Data of this report.
Figure 21. Bus‐to‐Bus Weekday Transfers in Northeast Queens (>400 transfers)

, Metropolitan Transportation Authority
39
Table 20. Highest Bus‐to‐Bus Transfers in Northeast Queens
From/To Bus Route
To/From Bus Route Location
Average Weekday Transfers
Q46 Q27 Springfield Bl Union Tpke 1709
Q44 Q20A/B * * 1081
Q27 Q43 Springfield Bl Hillside Ave 971
Q17 Q46 188 St Union Tpke 665
Q44 Q46 Main St Union Tpke 587
Q17 Q30 188 St Horace Harding Exp 557
Q17 Q88 188 St Horace Harding Exp 551
Q31 Q27 Utopia Pkwy 46 Ave 541
Q30 Q27 Springfield Bl Horace Harding Exp 540
Q88 Q30 Kissena Bl Horace Harding Exp 526
Q58 Q27 Main St Kissena Bl 494
Q27 Q88 Springfield Bl 73 Av 491
Q58 Q44 Main St Kissena Bl 478
Q30 Q46 Utopia Pkwy Union Tpke 476
Q17 Q65 Main St Roosevelt Ave 472
Q44 Q27 Main St Roosevelt Ave 430
Q58 Q88 Horace Harding Exp 108 St 428
Q66 Q44 Main St Roosevelt Ave 427
Q46 Q88 Springfield Bl Union Tpke 417
Q46 Q65 Union Tpke 164 St 412
*the Q44 and Q20A/B run along the same path for most of their routes in Queens
Multiple Transfers Customers that have two or more transfers are considered multiple transfer customers. This is often
referred to as a three‐legged transfer. The three routes involved in largest number of three‐legged
transfers are the Q46, Q27, and the Q43. The chart below shows all three‐legged trips in the study area
with more than 25 customers per weekday.
Table 21. Three‐Legged Transfers in Northeast Queens (>25 trips)
1st Leg 2nd Leg 3rd Leg Number Of Three‐Leg Trips
Q27 Q43 Jamaica‐179 St (F) 64
Q46 Q27 Q77 41
Q27 Q46 Kew Gardens‐Union Turnpike (E,F) 30
Q4 Q27 Q46 28
Q46 Q27 Q4 28
Q88 Q43 Jamaica‐179 St (F) 27
Q83 Q27 Q46 26
Q46 Q27 Q83 25
Q31 Q27 Q43 25

, Metropolitan Transportation Authority
40
Classifying Northeast Queens Bus Transfers After evaluating all transfer counts the nature of trips made within Northeast Queens can be inferred. Bus riders were broken down as transfers to Subway, transfers to other Northeast Queens buses, transfers to other buses, or single‐leg journey. Customers are generally split as: 30% single‐leg journey, 30% bus‐to‐bus transfer, 40% bus‐to‐subway transfer. Table 22. Northeast Queens Mode Transfers
Bus Customer Type Total Weekday
Ridership Percentage Of Customers
Total Local or Limited Bus‐to‐Bus Transfers 85,629 28.9%
Transfers to Northeast Queens Routes 44,780 15.1%
Transfers to other Local or Limited Bus Routes 40,575 13.7%
Transfer to Express Bus 274 0.1%
Total Bus‐Subway & Subway‐Bus Transfers ‐ Inferred 116,632 39.3%
Total Single Bus Trip Journeys ‐ Inferred 94,532 31.8%
Northeast Queens Unique Trips ‐ Inferred 297,000 100%
Figure 22. Northeast Queens Mode Transfers
Among Northeast Queens bus routes, there are routes that clearly serve as subway feeders, where more than half of customers on these routes were connecting to subways. Routes with the highest percentage of subway transfers are the Q26 (79%), Q64 (73%), Q16 (59%), and Q46 (51%). The route with the highest number of bus transfers is the Q76, with 60% of customers transferring to other buses. Other bus routes with more than half of weekday customers transferring to and from other buses are the Q88 (58%), Q31 (54%), Q27 (51%), and Q50 (50%). The routes with the largest percentage of bus customers remaining on a single bus are the Q66 (45%), Q25/Q34 (42%), and the Q48 (40%).
Table 23. Northeast Queens Transfers by Bus Route
Route
Bus‐To‐Subway Transfers
% Subway Transfer
Bus‐To‐Bus Transfers
% Bus Transfer Single Bus
% Single Bus
Average Weekday Ridership
Q1 2,128 42% 1837 36% 1,100 22% 5,065
Q12 4,466 40% 2784 25% 3,802 34% 11,052
Q13 2,930 34% 2802 32% 2,920 34% 8,652
Q15 2,736 46% 1371 23% 1,829 31% 5,936
Q16 2,442 59% 934 23% 768 19% 4,144
Q17 5,316 28% 8160 43% 5,374 29% 18,850
Q19 902 25% 1459 41% 1,226 34% 3,587

, Metropolitan Transportation Authority
41
Q20A 4,152 28% 6101 42% 4,438 30% 14,691
Q25/Q34 8,206 29% 8180 29% 11,896 42% 28,282
Q26 1,172 79% 186 12% 134 9% 1,492
Q27 7,474 27% 13892 51% 6,032 22% 27,398
Q28 4,426 41% 3077 29% 3,193 30% 10,696
Q30 3,004 27% 5467 49% 2,743 24% 11,214
Q31 892 14% 3485 54% 2,055 32% 6,432
Q36 3,010 47% 2107 33% 1,259 20% 6,376
Q43 6,352 37% 7170 42% 3,475 20% 16,997
Q44 9,180 30% 13759 46% 7,194 24% 30,133
Q46 11,926 51% 8925 38% 2,656 11% 23,507
Q48 632 22% 1117 38% 1,159 40% 2,908
Q50 1,730 34% 2513 50% 828 16% 5,071
Q58 10,580 34% 10695 34% 10,159 32% 31,434
Q64 7,964 73% 1274 12% 1,705 16% 10,943
Q65 7,882 35% 9415 42% 5,090 23% 22,387
Q66 4,674 30% 4095 26% 7,072 45% 15,841
Q76 756 12% 3783 60% 1,785 28% 6,324
Q88 1,700 14% 7067 58% 3,395 28% 12,162
Figure 23. Northeast Queens Transfers by Bus Route

, Metropolitan Transportation Authority
42
4. QUALITY OF SERVICE This section examines three areas that affect the quality of service for bus customers: performance, comfort + environment, and customer communication. If a bus is not performing well, it may indicate that existing service is inadequate. Performance is measured against scheduled times at timepoints and intervals between consecutive buses. Detailed performance data are available in Queens since March 2014 based on Bus Time, which provides AVL data in 30‐second intervals. The bus location data are compared to the schedule to assess performance. AVL data also provides running time and reliability data. Bus speed information is provided by Intelligent Vehicle Network (IVN) data. The comfort of customers and the environment while waiting for the bus and while on the bus are important indicators of the quality of service and important parts of customer experience. Three factors that affect comfort are the passenger environment, overcrowding, and bus stop furniture. Passenger environment surveys assess the on‐board conditions encountered by customers in terms of cleanliness, litter, and climate control. Overcrowding is measured using loading guidelines. The availability of customer amenities at bus stops, including shelters, seating, and signage is assessed based on inventories of bus stop facilities. The final measure of the quality of bus service in Northeast Queens is the availability of customer information and communication. Customer information is available through Guide‐a‐Ride canisters at bus stops and on Bus Time.
PERFORMANCE Wait Assessment Wait Assessment (WA) is the primary measure used to assess the timeliness of bus service. It measures actual headway between successive buses at time points compared to scheduled headways. This measures regularity of service to ensure riders have acceptable waits between successive buses. An observed headway interval is considered to be “passing” if it is within the scheduled headway +3 minutes during the peak, or the scheduled headway +5 minutes off‐peak. Table 24 shows a summary of Wait Assessment for spring 2014. It compares Weekday, Saturday, and Sunday service of those routes which serve Northeast Queens, to all Queens routes and all NYC routes. The table shows that WA performance in Northeast Queens is better than that of the rest of the borough and city. On average, routes serving Northeast Queens have 2‐3% better performance than the combined borough average, and 3‐5% better performance than the city average. Route specific information for each route is provided in Appendix C. Not all routes outperform their peers, though on a route‐by‐route basis, a strong majority of routes serving Northeast Queens are individually better than the system and borough average. This is especially true on weekdays when almost 90% of routes serving Northeast Queens have wait assessment performance surpassing Queens and city averages.

, Metropolitan Transportation Authority
43
Table 24. Wait Assessment
Route Weekday Saturday Sunday
5 Borough Average 79.2% 80.2% 81.4%
Queens Average 79.4% 81.4% 83.9%
Ne Queens Average 82.7% 83.5% 85.9%
# Beating Queens Avg. 22/25 11/21 10/21
# Beating City Avg. 23/25 13/21 15/21
% Beating Queens Avg. 88% 52% 48%
% Beating City Avg. 92% 62% 71%
On‐Time Performance On‐Time Performance (OTP) for buses is defined as being between 1 minute early and 5 minutes late to en‐route timepoints. An analysis of OTP was conducted, and shows similar results to that of Wait Assessment. Northeast Queens consistently outperforms total borough and city averages overall and on an individual route basis.
Table 25. On‐Time Performance
Route Weekday Saturday Sunday
5 Borough Average 65.9% 60.2% 64.0%
Queens Average 67.8% 63.3% 67.5%
Ne Queens Average 69.2% 66.1% 70.2%
# Beating Queens Avg. 20/25 12/21 13/21
# Beating City Avg. 21/25 16/21 18/21
% Beating Queens Avg. 80% 57% 62%
% Beating City Avg. 84% 76% 86%
While most Northeast Queens routes outperform those in the system, a few routes are under‐performing. The Q25 is in the bottom tier of performance for both weekday and weekend service. The Q17 and Q34 are the routes delivering the lowest performing weekday service. The Q44 delivers the lowest weekend performance. See Section 6: Recommendations for a discussion on next steps that the agencies will undertake to improve bus performance.
Peak Period Travel Performance Within Northeast Queens, bus routes maintain better performance than citywide and Queens averages. A strong majority (minimum of three‐quarters) of Northeast Queens routes have better performance than their city and borough peers.
Table 26. Peak Period Travel Performance
Weekday AM (6‐9) Weekday PM (4‐7)
On‐Time
Performance Wait
Assessment Not In Service*
On‐Time Performance
Wait Assessment
Not in Service*
5 Borough Average 70.5% 78.8% 2.4% 59.6% 72.9% 3.0%
Queens Average 70.1% 77.4% 4.1% 60.9% 72.6% 4.3%
Northeast Queens Average 74.9% 81.2% 2.5% 66.5% 76.4% 2.6%

, Metropolitan Transportation Authority
44
# Beating Queens Avg. 25 25 28 23 24 27
# Beating City Avg. 25 22 10 24 24 9
% Beating Queens Avg. 86% 86% 97% 79% 83% 93%
% Beating City Avg. 86% 76% 34% 83% 83% 31%
*“Not in Service” buses are not included in any performance measures used by MTA. Buses may be “Not in Service” due to mechanical problems or when the bus has finished its last trip for the day and is returning to its depot.
Table 27. Peak Period Travel Performance by Route
Weekday AM (6‐9) Weekday PM (4‐7)
Route On‐Time
Performance Wait
Assessment Not In Service*
On‐Time Performance
Wait Assessment
Not In Service*
Q1 75.9% 80.0% 2.8% 71.4% 84.9% 1.3%
Q12 83.9% 87.6% 1.3% 67.5% 74.6% 2.8%
Q13 87.7% 90.2% 0.8% 64.1% 74.4% 3.4%
Q15 89.7% 91.4% 0.3% 72.7% 78.0% 1.5%
Q15a 91.6% 91.2% 0.4% 76.8% 81.0% 2.5%
Q16 84.4% 85.6% 1.1% 71.6% 77.5% 1.1%
Q17 70.7% 76.8% 3.6% 49.5% 67.7% 4.4%
Q19 80.6% 85.8% 0.9% 51.5% 65.3% 3.0%
Q20a 81.8% 85.0% 0.7% 71.8% 79.6% 1.4%
Q20b 82.5% 86.0% 1.2% 75.0% 84.7% 1.1%
Q25 42.4% 68.8% 2.6% 49.5% 71.2% 3.0%
Q26 85.3% 85.6% 1.2% 85.1% 86.1% 0.9%
Q27 79.0% 82.1% 3.6% 72.3% 78.2% 2.6% Q28 85.4% 89.6% 1.5% 76.3% 82.2% 2.0% Q30 72.8% 78.3% 2.4% 65.4% 73.3% 4.0%
Q31 79.8% 82.2% 2.2% 69.2% 76.8% 1.9%
Q34 65.0% 77.1% 1.9% 61.2% 77.4% 1.3%
Q36 83.7% 84.4% 2.3% 77.9% 80.5% 1.4%
Q43 79.8% 80.4% 3.9% 73.9% 79.2% 2.8%
Q44 71.9% 78.9% 3.1% 69.2% 79.0% 2.3%
Q46 76.9% 78.3% 3.6% 72.4% 78.2% 3.3%
Q48 77.8% 87.9% 0.6% 64.0% 75.1% 1.3%
Q50 73.5% 83.0% 1.3% 69.3% 79.2% 1.3%
Q58 61.6% 82.2% 0.7% 58.7% 77.3% 1.6%
Q64 70.6% 77.8% 2.8% 57.7% 73.1% 6.1%
Q65 77.0% 81.9% 1.7% 76.4% 79.6% 1.5%
Q66 80.9% 84.0% 1.7% 60.8% 70.6% 3.2%
Q76 81.0% 82.3% 2.2% 67.5% 73.4% 3.4%
Q88 69.8% 74.9% 5.3% 64.9% 72.0% 3.8%

, Metropolitan Transportation Authority
45
Express Bus Performance The weekday performance of express buses was also evaluated through on‐time performance and wait assessment metrics. Northeast Queens express routes exhibit performance that is similar to the rest of the borough of Queens. These measures fall below the citywide performance average. Within the set of express buses serving Northeast Queens, the QM7 and QM8 exhibit on‐time performance that is ten percent better than other routes. Both of these routes travel to Queens without traversing the Queensboro Bridge, where congestion slows down the other buses. Table 28. Express Bus Weekday Performance
Route On‐Time
Performance Wait
Assessment
5 Borough Average 64.5% 78.9%
Queens Average 60.4% 77.0%
Northeast Queens Average 60.0% 76.2%
QM1 61% 81%
QM2 61% 78%
QM3 53% 60%
QM4 61% 74%
QM5 53% 73%
QM6 57% 74%
QM7 75% 80%
QM8 72% 81%
QM20 63% 77%
X68 55% 77%
The QM7 and QM8 exhibit higher overall OTP due to symmetric performance in both directions. When reviewing performance by direction a clear trend emerges, with eastbound performance overshadowing the OTP results. With the exception of the QM7 and QM8, eastbound OTP does not exceed about 50% for weekday express bus service.
Table 29. Express Bus Weekday Performance by Route by Direction
Direction Eastbound Westbound Total
Route On‐Time
Performance Wait
Assessment On‐Time
Performance Wait
Assessment On‐Time
Performance Wait
Assessment
QM1 16% 74% 70% 84% 51% 80%
QM2 46% 77% 68% 78% 58% 78%
QM20 32% 41% 76% 92% 49% 60%
QM3 25% 57% 69% 82% 54% 73%
QM4 33% 70% 57% 75% 49% 73%
QM5 28% 65% 63% 78% 53% 74%
QM6 74% 80% 75% 80% 74% 80%
QM7 73% 83% 70% 74% 73% 81%
QM8 35% 71% 70% 80% 59% 77%
X68 51% 76% 57% 77% 54% 77%

, Metropolitan Transportation Authority
46
Saturday and Sunday have fewer express bus routes offering service than weekdays. Weekend performance is better than weekday performance, and on weekends Northeast Queens performance is better than citywide and Queens averages.
Table 30. Express Bus Weekend Performance
SATURDAY SUNDAY
Route OTP WA OTP WA
5 Borough Average 61.1% 83.2% 69.8% 86.2%
Queens Average 59.6% 83.4% 72.5% 90.0%
Northeast Queens Average 64.7% 85.6% 72.5% 90.0%
QM2 63% 91% 75% 89%
QM4 76% 89% 84% 92%
QM5 59% 83% 70% 89%
QM6 66% 84% 65% 90%
Running Time The allocation of scheduled running time for each route can have performance implications if an insufficient amount of time is specified within the schedule. The utilization of Bus Time in the borough since March 2014 allows for more frequent updates to scheduled running times, as well as utilizing more current data and a greater quantity of data to more accurately determine travel time averages. Different times of day have different expected travel times through the road network, and therefore running times are specified for each route by direction, within half‐hour segments. Directional half‐hour segments are the smallest level at which running time changes can be made. To investigate the appropriateness of running times in Northeast Queens the total running times of buses were compared to their schedules. An ideal situation is one in which running times match those scheduled. An analysis of the Northeast Queens routes from spring 2014 shows that disparities exist between different times of day, with certain times seeing more excess running time per trip. This indicates that more running time should be allocated in the schedule. On average, every bus trip exceeded the scheduled running time by only 47 seconds, though natural variation in travel times means some trips were slower while others were faster. Compared to citywide data, Northeast Queens has actual running times that more closely reflect the scheduled running times. This finding is consistent with the OTP and WA results discussed previously.

, Metropolitan Transportation Authority
47
Figure 24. Running Time Accuracy ‐ Weekdays
A route‐level analysis of running time was conducted and it was found that disparities between routes exist. A priority for revising schedules to improve service performance and reliability may be to investigate in detail the routes with the least accurate allocation of running time in the particularly troublesome times of day. Some of the routes (e.g., Q25) that emerge as having actual running times greatly in excess of scheduled running times were those that also have notable on‐time performance issues. Figure 25. Running Time Accuracy by Route ‐ Weekdays
All buses have now been equipped with Bus Time for over a year, and improvement of allocated running times will be incorporated into future updates to schedules.
Express Bus Running Time A review of the Bus Time data for express buses indicates that there is too little running time scheduled for a majority of time periods. Within Northeast Queens 55% of weekday scheduled running time periods have scheduled running times that are less than the 15th percentile of actual running time. The QM7, QM8, and X68 have notably more realistic running times than other express routes. The improved availability of

, Metropolitan Transportation Authority
48
running time data through Bus Time will improve the allocation of scheduled running times to routes and should result in performance improvement. Table 31. Express Bus Running Time to Central Business Districts (CBDs)
Route Trip Segment
Average Run Time
Median Run Time
Average Schedule Run Time
Travel Time Gap
% Travel Time Gap
QM1 Union Tpk‐Main St ‐> 6 Av‐W 37 St 38.2 37.8 33.0 5.2 16%
QM2 Bell Bl‐23 Av ‐> 6 Av‐W 37 St 64.5 62.6 53.5 11.0 21%
QM3 Little Neck Py‐Horace Harding Exp ‐> 6 Av‐W
36 St 64.6 61.4 61.4 3.2 5%
QM4 164 St‐Horace Harding Exp ‐> 6 Av‐W 36 St 52.2 51.9 44.6 7.6 17%
QM5 260 St‐Union Tp ‐> 3 Av‐E 38 St 72.2 71.6 64.8 7.4 11%
QM5 260 St‐Union Tp ‐> 6 Av‐W 37 St 78.5 78.4 67.5 11.0 16%
QM6 North Shore Towers‐Bldg Ent‐> 6 Av‐W 37 St 71.1 71.5 63.6 7.5 12%
QM7 188 St‐64 Av ‐> Pearl St‐Frankfort St 56.2 55.1 53.3 2.9 5%
QM8 260 St‐Union Tp ‐> Pearl St‐Frankfort St 76.8 75.5 73.9 2.9 4%
QM20 Willets Pt Bl‐Francis Lewis Bl ‐> 6 Av‐W 35 St 49.6 49.2 50.3 ‐0.7 ‐1%
X68 Hillside Av‐268 St ‐> E 37 St‐3 Av 60.3 59.6 58.2 2.1 4%
Table 32. Express Bus Running Time Shortfalls
Route Instances Of Time‐Period Running Times Too Short
Number Of Time‐Period Instances In Data Set
% Of Time‐Periods With Running Times Too Short
QM1 22 38 58%
QM2 38 60 63%
QM3 2 6 33%
QM4 25 41 61%
QM5 44 63 70%
QM6 27 47 57%
QM7 0 17 0%
QM8 2 14 14%
QM20 24 41 59%
X68 3 16 19%
Express Total 187 343 55%
Road Reliability Road reliability is defined by the percentage of scheduled trips (observed at timepoints) that are in service and available to pick up customers. Occasionally, scheduled pickups cannot be made due to one of several reasons: the bus is full or otherwise unable to pick up passengers (headsign displays “Not In Service” or “Next Bus Please”), the bus was taken out of service due to a mechanical or equipment issue, or the scheduled bus was not available to pull out of the depot. Road reliability for Northeast Queens routes exhibits behavior almost identical to system‐wide performance. Almost 98% of all scheduled bus trips were made in Northeast Queens for all days of the week. Queens road reliability is lower than the New York City average, meaning that Northeast Queens has better performance than the borough overall as

, Metropolitan Transportation Authority
49
measured by this metric. Approximately 1 out of every 50 scheduled trips in Northeast Queens either have a “Not in Service” bus pass by the scheduled timepoints, or simply have no bus show up at all. Table 33 shows the portion of scheduled trips at timepoints that were not in service when expected. Table 33. Road Reliability
Route Weekday Saturday Sunday
5 Borough Average 2.3% 1.9% 1.9%
Queens Average 3.4% 3.3% 2.2%
NE Queens Average 2.2% 2.0% 1.9%
Bus Speeds Bus Speeds can be determined from a bus hardware data source, IVN data. IVN data provide a stream of information from equipped buses, including GPS and timestamps, as well as information on the state of the bus (e.g., speed, door status). Time intervals are irregular, but typically quite fine‐grained (e.g., 1 second). Unlike Bus Time, only one‐third of the bus fleet is equipped with IVN capabilities (model year 2008 and newer). The assignment of buses by depot to different routes means that data availability is not uniform for all routes. For this reason, IVN data are not presented unless a significant number of records for a day and route combination were available to provide meaningful conclusions. Furthermore, the ability to process and store these data was not available until May 2014. For mid‐May to mid‐June 2014, Northeast Queens average bus speeds were compared with other routes. Average speeds exceeded those of Queens for every time of day including morning and evening peak periods. Queens bus speeds exceeded those of the city average. Table 34 presents the average speed of buses by time of day in miles per hour. The average speeds of each route, when a statistically meaningful number of records were available, are presented in Appendix C. Table 34. Average Bus Speeds by Time of Day
Time Period 6 To 10 AM 10 AM To 3 PM 3 To 7 PM 7 PM To 12 AM 12 To 6 AM
5 Borough Average 8.2 7.5 7.6 9 11.5
Queens Average 8.6 8.1 7.9 9.6 11.9
NE Queens Average 9.1 8.5 8.3 10.1 12.2
Vision Zero In February 2015, NYCDOT released the Queens Pedestrian Safety Action Plan under the Vision Zero initiative. The report identifies priority areas, corridors, and intersections in the borough. The MTA is actively involved in this initiative to lower accidents in Queens. Flushing and Jamaica are two Vision Zero priority areas that contain a large number of buses. The Northeast Queens buses that operate on the Vision Zero Priority Corridors and Intersections are listed in Tables 35 and 36. Table 35. Vision Zero Priority Corridors
Street Name From To NE Queens Bus Routes
Union St 25 Rd Franklin Av Q16, Q20
Sanford Av Delong St Northern Blvd Q12
Kissena Blvd Parsons Blvd Main St Q17, Q25, Q34
Main St Northern Blvd Queens Blvd Q20, Q44
Hillside Av Myrtle Av Langdale St Q1, Q17, Q43, Q76, X68

, Metropolitan Transportation Authority
50
Roosevelt Av (East Leg) College Pt Blvd Northern Blvd Q48
Queens Blvd Queens Plz Jamaica Av Q60, X68
Bowne St Northern Blvd Rose Av Q65
Northern Blvd (East Leg) College Pt Blvd Glenwood St Q12, Q13, Q28, QM3
Parsons Blvd (North Leg) Rose Av 144 Pl Q25, Q34
Table 36. Vision Zero Priority Intersections
Intersection NE Queens Bus Routes
169 St/Av & Francis Lewis Blvd Q16, Q76
169 St/Homelawn St & Hillside Av Q1, Q2, Q3, Q17, Q30, Q31, Q36, Q43, Q76, Q77, X68
172 St & Hillside Av Q1, Q2, Q3, Q17, Q36, Q43, Q76, Q77, X68
188 St & 73 Av Q17, Q88, QM1, QM5, QM7, QM8
205 St & Hillside Av Q1, Q43, Q76, Q77, X68
Elder Av & Main St Q20, Q44
Hillside Av/166 St & Merrick Blvd Q1, Q2, Q3, Q17, Q36, Q43, Q76, Q77, X68
Kissena Blvd & 71 Av Q25, Q34
Main St & Booth Memorial Av Q20, Q44
Main St & Roosevelt Av Q17, Q20, Q25, Q27, Q34, Q44, Q48, Q65
Northern Blvd & 146 St Q13, Q28, QM3
Parsons Blvd & Hillside Av Q25, Q34, Q43, Q65, Q111, X68
Roosevelt Av & College Pt Blvd Q48
Sanford Av & Kissena Blvd Q17, Q25, Q27, Q34, Q65
Springfield Blvd & Hillside Av Q1, Q27, Q43, Q88, X68
Union St & 31 Rd Q20, Q44
Union St & 35 Av Q16, Q20, Q44
Union St & 39 Av Q13, Q16, Q28
Union St & Sanford Av Q65
Union St & Northern Blvd Q20, Q44
Union Tpke & Main St Q20, Q44, Q46, QM1, QM5, QM6, QM7, QM8
COMFORT + ENVIRONMENT Passenger Environment The MTA’s Passenger Environment Survey (PES) provides an assessment of the on‐board conditions encountered by passengers in terms of floor and seat cleanliness, litter, and climate control. Passing scores for climate control require that the average temperature of the front and the back of the bus is between 50°F and 78°F degrees, except when the ambient temperature is above 98°F in which case the temperature must maintain no less than a 20°F differential. Passing scores for litter require the bus to be essentially litter free with no opened or spilled food nor rolling bottles/cans. In order to be considered passing, floors and seats are required to be essentially dirt‐free (i.e., no sticky, wet spots or unusable seats), with allowances for irreparable “ground in” spots. Local buses in Northeast Queens have less litter and are generally cleaner than buses citywide. Climate scores are lower than buses in the rest of New York City. Express buses in Northeast Queens have less litter that express buses citywide. They are just as clean on the interior, but less clean on the exterior.
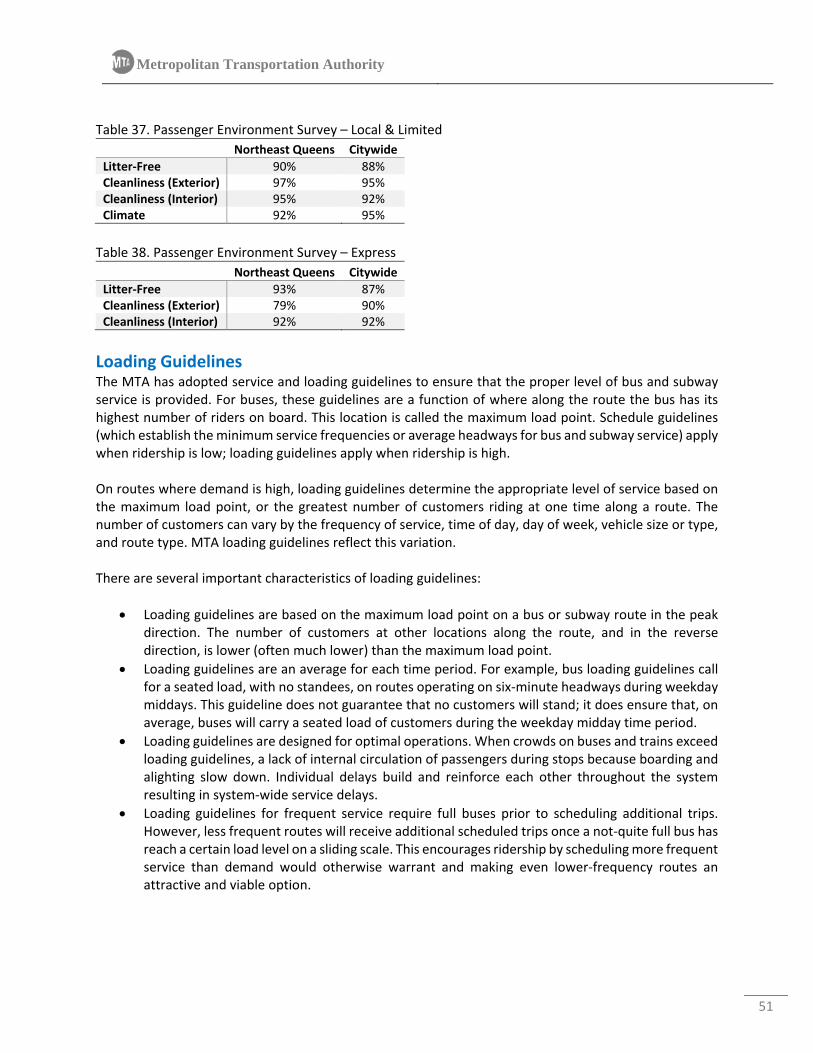
, Metropolitan Transportation Authority
51
Table 37. Passenger Environment Survey – Local & Limited
Northeast Queens Citywide
Litter‐Free 90% 88%Cleanliness (Exterior) 97% 95%Cleanliness (Interior) 95% 92%Climate 92% 95%
Table 38. Passenger Environment Survey – Express
Northeast Queens Citywide
Litter‐Free 93% 87%Cleanliness (Exterior) 79% 90%Cleanliness (Interior) 92% 92%
Loading Guidelines The MTA has adopted service and loading guidelines to ensure that the proper level of bus and subway service is provided. For buses, these guidelines are a function of where along the route the bus has its highest number of riders on board. This location is called the maximum load point. Schedule guidelines (which establish the minimum service frequencies or average headways for bus and subway service) apply when ridership is low; loading guidelines apply when ridership is high. On routes where demand is high, loading guidelines determine the appropriate level of service based on the maximum load point, or the greatest number of customers riding at one time along a route. The number of customers can vary by the frequency of service, time of day, day of week, vehicle size or type, and route type. MTA loading guidelines reflect this variation. There are several important characteristics of loading guidelines:
Loading guidelines are based on the maximum load point on a bus or subway route in the peak direction. The number of customers at other locations along the route, and in the reverse direction, is lower (often much lower) than the maximum load point.
Loading guidelines are an average for each time period. For example, bus loading guidelines call for a seated load, with no standees, on routes operating on six‐minute headways during weekday middays. This guideline does not guarantee that no customers will stand; it does ensure that, on average, buses will carry a seated load of customers during the weekday midday time period.
Loading guidelines are designed for optimal operations. When crowds on buses and trains exceed loading guidelines, a lack of internal circulation of passengers during stops because boarding and alighting slow down. Individual delays build and reinforce each other throughout the system resulting in system‐wide service delays.
Loading guidelines for frequent service require full buses prior to scheduling additional trips. However, less frequent routes will receive additional scheduled trips once a not‐quite full bus has reach a certain load level on a sliding scale. This encourages ridership by scheduling more frequent service than demand would otherwise warrant and making even lower‐frequency routes an attractive and viable option.

, Metropolitan Transportation Authority
52
Loading Guidelines for Local Bus Loading guidelines vary across route type, time of day/week and bus size. Guidelines outline the most common service intervals (headways) for standard and articulated buses, grid and feeder routes, and for peak periods, off‐ peak periods (includes middays, early evenings, and weekends), and late evening. During overnight periods, service frequency will generally be governed by the schedule guideline’s minimum frequency of 60 minutes. Average Peak Load Peak load is the number of passengers on a bus at its busiest point. MTA loading guidelines do not refer to individual buses. These guidelines refer to the peak number of passengers on a specific route, averaged over a given period of time (½ hour during the peak, one hour during off‐peak). Route Type Routes are characterized as grid or feeder service. Grid routes constitute most local bus routes. Grid routes operate through multiple neighborhoods with customers boarding and alighting throughout the length of the route. Feeder routes primarily carry customers from outlying areas to a subway station or major terminal, with most customers having a common origin or destination. Feeder routes are permitted to carry more customers per bus because there is less need for internal circulation due to the common origin or destination. Feeder routes in Northeast Queens include the Q1, Q13, Q15, Q15A, Q16, Q26, Q28, Q36, and Q64. Frequency of Service During peak hours, most bus service is scheduled so that all seats can be filled and some passengers will be standing at the route’s busiest point, i.e., the number of passengers exceeds the number of seats when the bus is most crowded. For example, the MTA will not add buses to a peak‐period grid route with 5‐minute headways until a 40‐seat bus has more than 54 peak‐point riders, on average. As bus frequency decreases, the allowable average peak load also decreases. Table 39. Current Loading Levels Compared to Loading Guidelines (NYCT Routes Only)
Route
Weekday Saturday Sunday
AM Peak Hour
Mid (1pm‐2pm)
PM Peak Hour
Eve (8pm‐9pm)
AM Peak Hour
Mid (1pm‐2pm)
PM Peak Hour
Eve (8pm‐9pm)
AM Peak Hour
Mid (1pm‐2pm)
PM Peak Hour
Eve (8pm‐9pm)
Q1 91% 54% 86% 68% 64% 64% 95% 61% 63% 51% 75% 58%
Q12 96% 94% 90% 99% 91% 97% 93% 95% 93% 81% 83% 80%
Q13 97% 78% 86% 87% 95% 80% 77% 89% 88% 86% 78% 76%
Q15 93% 68% 86% 84% 63% 83% 73% 90% 75% 93% 83% 78%
Q16 86% 76% 92% 80% 78% 58% 67% 40% 44% 53% 72% 74%
Q17 90% 69% 86% 99% 94% 99% 90% 91% 97% 88% 82% 83%
Q20* 90% 84% 88% 88% ‐‐ ‐‐ ‐‐ ‐‐ ‐‐ ‐‐ ‐‐ ‐‐
Q26 86% ‐‐ 80% 91% ‐‐ ‐‐ ‐‐ ‐‐ ‐‐ ‐‐ ‐‐ ‐‐
Q27 91% 96% 81% 87% 96% 95% 86% 96% 91% 82% 88% 91%
Q28 97% 93% 99% 73% 78% 76% 78% 75% 94% 82% 91% 69%
Q30 99% 83% 94% 95% 81% 82% 92% 62% 67% 81% 94% 65%
Q31* 91% 89% 89% 62% ‐‐ ‐‐ ‐‐ ‐‐ ‐‐ ‐‐ ‐‐ ‐‐
Q36 93% 79% 91% 89% 79% 82% 79% 73% 54% 93% 70% 40%

, Metropolitan Transportation Authority
53
Q43 97% 92% 91% 96% 97% 97% 97% 88% 90% 90% 79% 100%
Q44 92% 98% 91% 90% 94% 95% 100% 94% 95% 80% 86% 75%
Q46 93% 88% 93% 98% 98% 96% 98% 77% 86% 85% 87% 86%
Q48 71% 52% 72% 70% 79% 92% 67% 83% 44% 45% 33% 54%
Q58 89% 94% 86% 76% 87% 89% 89% 99% 88% 95% 91% 88%
Q76 60% 92% 97% 57% 60% 92% 97% 57% ‐‐ ‐‐ ‐‐ ‐‐
Q88 100% 87% 92% 81% 100% 87% 92% 81% 69% 82% 89% 97%
X68 97% ‐‐ 87% ‐‐ ‐‐ ‐‐ ‐‐ ‐‐ ‐‐ ‐‐ ‐‐ ‐‐ *Q20 Saturday and Sunday service is scheduled with the Q44. Q31 weekend service
Schedule Guidelines Schedule guidelines establish the minimum service frequencies for bus and subway service. This is intended to maintain basic mobility coverage throughout MTA’s service area. The minimum frequencies for bus and subway service vary by time of day and by day of week. In many cases, however, routes need to operate at shorter intervals than the guideline minimums in order to accommodate higher ridership levels. In these cases, loading guidelines match service to the number of riders using a particular route at a given time. Minimum Service Frequencies Local Bus
All Times except Late Nights: If service is provided, it should operate at least every 30 minutes.
Late Nights (1 a.m. – 5 a.m.): If service is provided, it should operate at least every 60 minutes. Express Bus
Weekday Peak Periods and Weekday Middays: If service is provided, it should operate at least every 30 minutes.
Weekday Evenings and Weekends: If service is provided, it should operate at least every 60 minutes.
Bus Stop Furniture Several furnishings enhance the comfort and environment at bus stops, including shelters, seating, and customer information in Guide‐a‐Ride canisters. MTA bus stops in the city are delineated by two types of signage. All NYCT bus stops have lollipop signs displaying the bus route numbers, bus destinations, and stop location. MTA Bus Company bus stops that are shared with NYCT have lollipop poles as well, but some bus stops served exclusively by MTA Bus Company routes have simple metal pan signs only displaying route numbers. Bus Shelters In Northeast Queens, 27.6% of bus stops have bus shelters, compared to 25.2% in all of Queens and 27.2% citywide. The Q50 and Q34 have the highest percentage of bus shelters per stop, with 44.6% and 44.3% of the respective stops enhanced with bus shelters. The route with the smallest percentage of shelters at bus stops is the Q19, for which less than 12% of bus stops have shelters. Bus Stop furniture is under the jurisdiction of NCYDOT, not the MTA. While the MTA supports the installation of bus shelters and benches as a way to improve customer comfort, community requests for additional locations should be transmitted to NYCDOT for consideration.

, Metropolitan Transportation Authority
54
Table 40. Bus Stop Shelters in Northeast Queens Bus Stop Shelters Number Of Shelters Number Of Bus Stops % of Bus Stops With Bus Shelter
Citywide 6,747 24,798 27.2%
All Queens Routes 2,065 8,195 25.2%
Study Area Routes 896 3,252 27.6%
CUSTOMER COMMUNICATION The last evaluation criteria for the quality of bus service is the availability of information for customers and the communication of this data. Three ways that the MTA shares bus schedule information with customers are Guide‐a‐Ride canisters at bus stops, Bus Time on phones and computers, and public timetable pamphlets with maps on buses and at www.mta.info. In partnership with NYCDOT, real‐time information displays have been established at selected bus stops throughout the city and additional locations are being studied.
Guide‐a‐Ride Guide‐a‐Ride canisters contain maps and schedules of the routes serving each stop to help customer navigation. All NYC Transit bus stops have Guide‐a‐Ride canisters and almost every MTA Bus Company stop has them as well. Guide‐a‐Ride canisters have been installed on NYCT bus routes for many years, but were installed on MTA Bus Company routes in the study area within the past few years. The MTA Bus Company is working to install canisters at the few remaining bus stops where canisters are absent. The information is updated whenever the bus schedule or bus route is changed.
Bus Time In addition to printed Guide‐a‐Ride maps and schedules, Bus Time offers bus riders advance information on approaching buses via the internet on computers, smartphones, and other web‐enabled devices, as well as via SMS message from cell phones. It uses Global Positioning System (GPS) hardware and wireless communications technology to track the real‐time location of buses. Bus Time has been available for all Queens buses since March 2014. This technology allows riders to see how far buses are from their stop for any given route, to predict wait times. It can also be used at home so that riders can choose to leave just in time to meet their bus at their stop. By taking advantage of Bus Time, riders can better decide which bus route to utilize when multiple options exist, especially in the event of service disruptions or incidents. Riders can also take advantage of broadcasted public service alerts through the MTA website and apps to learn about any incidents or delays affecting service.
Printed Customer Information Printed bus timetables and maps are available on buses and at the Customer Service Center at 3 Stone Street in Lower Manhattan.

, Metropolitan Transportation Authority
55
5. PUBLIC INPUT During the course of the Northeast Queens Bus Study, the MTA received public input from bus customers, local residents, and elected officials through several channels. MTA staff attended Public Transit/Transportation Committee meetings of Queens Community Boards 7, 8, 11 and 13, whose jurisdictions are part of the study area. Meetings were held between October 2014 and January 2015. These meetings covered ongoing issues related to bus service, and issues related specifically to this study. Follow‐up meetings were held in March and April of 2015 to discuss early findings and to gather additional comments. On Thursday, February 26, 2015, the MTA conducted a public workshop at Queensborough Community College to speak directly with community members and receive input on possible improvements to bus service in Northeast Queens. More than 100 community members participated in the workshop. MTA staff elicited travel patterns, feedback on problem locations, and suggestions for better service. Community members gathered around large maps to draw and label specific sites in need of improvement. MTA staff note takers received comments from individuals, and many individuals submitted additional written comments. In addition, elected officials elicited input from their constituents and transmitted this input to the MTA for consideration. Hundreds of comments and suggestions were submitted during the course of this study. The comments ranged from large‐scale, long‐term issues, such as a desire for a bus terminal in Flushing, to smaller, localized issues. Some of these broader issues are addressed on the following pages, while more specific issues are addressed in a Question‐and‐Answer section in Appendix A of this document. While all comments were evaluated and considered by the MTA, not all of these comments could be addressed within the scope of this report.

, Metropolitan Transportation Authority
56
Service Issues Local‐Limited Service Comments were received regarding bus routes that have both local‐ and limited‐stop spacing patterns of service, and regarding the allocation of buses to each kind of service. For some bus routes that only have local bus service, there were suggestions to add a limited‐stop component of service. There were also suggestions for some of the longer bus routes that limited‐stop spacing service be run for part of the route, and then local‐stop spacing service be run the remainder of the route. Limited‐stop bus service is determined by MTA Service Guidelines. Design guidelines for limited‐stop bus service are as follows: Limited‐stop routes typically take one of two forms: full‐length limited service or limited & short‐turn local service.
• Full‐length Limited Service: Limited bus stops are spread over an entire route. This service pattern caters to riders making longer trips (at least three miles) with destinations scattered throughout the route.
• Limited & Short‐turn Local Service: This service pattern divides a route into three zones—an outer
zone, an inner zone, and a Central Business District (CBD). Service along the route is shared between local and limited services, where all stops in the outer zone and most stops within the CBD are served by a limited route, and all stops in the inner zone and the CBD are served by the local route.
The MTA will consider the introduction of limited‐stop service on local bus routes where passenger loading guidelines support headways of six minutes or less, for a span of at least two hours. This would result in local and limited services, each operating every 12 minutes. The duration of six‐minute local service will dictate the span for limited‐stop service. For example, if service on a local bus route operates every six minutes during peak periods and every ten minutes during middays, then limited‐stop service would be considered for the peak period but not for the midday period. Similarly, limited‐stop service may be unidirectional or bidirectional during peak periods. While the span of six‐minute local service will identify candidate routes for limited‐stop service, further analysis is required to determine whether limited‐stop service is appropriate. The most significant factor is the boarding and alighting pattern of customers along the route; there must be a sufficient concentration of customers at a small number of stops, which would then be designated as stops on the limited stop route. Limited‐stop service works best with spacing of bus stops approximately every half‐mile. Exceptions to the above standard include:
• Routes that are exclusively limited, with parallel or alternate local services (e.g., Q44 Limited and the Q20A/Q20B Local).
• Feeder routes with simultaneous trip departures, one operating local and one operating limited,
despite the lack of six‐minute service frequencies The MTA is studying the concept and feasibility of limited‐zone bus service, a new service that has features of limited and express bus service. See Section 6: Recommendations for additional information about potential service changes on these routes and limited‐zone service. In Northeast Queens, the Q12 and

, Metropolitan Transportation Authority
57
Q88 are being considered for limited‐stop service. The Q12, Q17, Q27, Q43, Q46, and Q88 are being considered for limited‐zone bus service.
Select Bus Service Comments were received regarding bus routes that customers believe would benefit from the features of Select Bus Service. Specific requests were made for certain routes (e.g., Q46, Q27) and corridors (e.g., Horace Harding Expressway and Northern Boulevard) to be converted into SBS routes. Select Bus Service is a joint effort of the MTA and NYCDOT. The establishment of SBS routes is currently being guided by the corridors identified in the 2009 Bus Rapid Transit study which was prepared by the MTA, NYCDOT, and the New York State Department of Transportation. The study was conducted to identify corridors suitable for SBS treatment through a series of quantitative evaluations and incorporating public feedback and comments. The MTA and NYCDOT will continue to develop SBS routes that benefit existing bus riders, provide an attractive transit option to potential new customers, and are sensitive to the needs of local residents and businesses. New corridors are chosen based on ridership potential, transit need, geographic diversity, opportunities for bus priority treatments, and community support. Additional information on the selection of SBS routes and future potential SBS routes in Northeast Queens is available in Section 2: Bus Service and Schedule and Section 6: Recommendations in this report.
Bus Shuttles Suggestions were also made for short shuttle bus routes with high frequencies and specific purposes, such as crossing the Throgs Neck Bridge. Short shuttle bus routes are most useful when transporting customers back‐and‐forth between two high‐density cores. Unfortunately the physical makeup of Northeast Queens does not enable frequent shuttles to be operated with any real efficiency or effectiveness. Northeast Queens has few places that exist at a level of density sufficient to enable high ridership for these kinds of shuttles. The best candidate for a frequent service between two high‐density nodes in the study area is between Flushing and Jamaica. The MTA is working in conjunction with NYCDOT to implement SBS on the Flushing‐Jamaica corridor with the Q44 designated for SBS implementation in late 2015 and the Q25 Limited designated for SBS implementation at a later date.
Short‐turn Service Some comments indicated that short‐turn variations were less useful than buses that serve the entire length of the route. Some comments indicated that the locations of existing turnarounds for short‐turn service are poorly designed and cause more problems than the benefits created. Some comments desired short‐ turns to deviate from the main route and serve other nearby destinations. While most of the bus trips for a bus route operate the full length of the route, at certain times of the day, it is necessary for some buses to serve the busiest portion of the route and reach the maximum number of riders. By serving the busiest segments of a route, those buses can make additional trips within a shorter time period, thereby increasing the efficiency of a route without increasing operating costs. These trips, known as short‐turns, increases service to the areas of a route that have the highest ridership.

, Metropolitan Transportation Authority
58
The MTA evaluates routes to determine if a section should receive additional service in the form of a short‐turn service. Short‐turns on bus routes are not meant to provide service to areas that are not already served by the underlying route. That type of service is provided by service route “variants” or a “branch”. Short‐turns are reevaluated as needed over time to ensure that they are providing the best service for the route.
Multiple Routes that Operate on the Same Streets Comments were received that suggested that if more than one bus travels along a portion of a roadway together, that one of them should either be moved to a parallel street or run limited‐stop spacing service. There are three principal reasons why more than one bus route might operate on the same street. The first is that the street may be a high‐density corridor that has a large concentration of residential, commercial, and community facilities. In Northeast Queens, these corridors include Main Street, Kissena Boulevard, Parsons Boulevard, Hillside Avenue, and Northern Boulevard. Secondly, local and limited service usually operate in conjunction and provide two different types of service along the same route. Lastly, the street network in Northeast Queens is very complex with a limited number of streets that offer straight, direct access between neighborhoods, subway stations, and points of interests. Bus service is more reliable when operated in a straight line than when many turns exist along the route. Another consideration is that by placing multiple bus routes on one shared corridor, the wait time for a bus is significantly reduced for many customers who need to travel within that corridor. Splitting bus routes on different corridors would result in the need to install bus stops and eliminate on‐street parking for residences and businesses.
Separate Busy Bus Stops from Each Other and Less‐busy Stops Comments were received regarding the desire for bus stops that are currently located together to be separated and therefore to provide more room for each individual bus route to be served by its own dedicated stop. Several comments were received about the combination of stops for popular bus routes crowding out riders of other buses. It was stated that some buses will drive past a location because the bus operator believes that the waiting passengers are only waiting there for a different bus. Comments were received that at evening peak periods, especially at subway stations, there is not enough room on the sidewalk to accommodate all bus riders waiting for the various bus routes that all pick up in the same area. The MTA continues to evaluate the location of bus stops and the ridership at each stop. When a bus service increases in ridership and additional service is added to accommodate the additional passengers, the MTA evaluates the stops to look for ways to create a better passenger environment. While bus stop locations are requested by the MTA, the final determination on location and space allocation is made by NYCDOT. The MTA works closely with NYCDOT to determine what bus stops can be appropriately adjusted on a stop‐by‐stop basis. The MTA will continue to adjust bus stops as ridership patterns change.

, Metropolitan Transportation Authority
59
Schedule Issues More Service / More Buses / Increased Frequencies Many comments were received requesting increased frequencies of specific bus routes, as well as overall service increases. As with most public transit agencies, the MTA has service and loading guidelines to ensure the proper level of bus service is provided. Loading guidelines are described in Section 4: Quality of Service of this report.
Schedule of Buses on Nights and Weekends Comments were received regarding the hours operated on various routes, and the desire for both earlier and later trips for various routes. Comments were received regarding the minimum time between buses. Comments were received about the desire for lower headways on many routes. Comments were received regarding express buses operating on weekends with 60‐minute headways. Comments stated that the maximum headway for a bus to be useful is every 30 minutes, not every 60 minutes. Schedule guidelines establish the minimum service frequencies and maximum headways for service. This is intended to maintain basic mobility throughout the MTA’s service area. Schedule guidelines state that if local bus service is provided late at night (1 a.m. to 5 a.m.), it should operate at least every 60 minutes. Schedule guidelines for express bus service state that service should operate at least every 60 minutes during the span of time that service is provided. While more frequent service would be welcomed by many, oftentimes existing ridership does not justify additional trips to be added to a service. Additional information about schedule guidelines can be found in Section 4: Quality of Service of this report.
Express Bus Departure Times Comments were received regarding express buses that leave their stops in the morning earlier than the scheduled time. During the course of this study, the MTA examined the on‐time performance of express routes in Northeast Queens. It was found that some buses were indeed leaving early from pick‐up stops on their way to Manhattan. The MTA will continue to monitor bus performance and make adjustments as necessary to provide the best experience for our customers. Some of these stops are designated timepoints in the published public timetables. These official “timepoints” are assigned to selected bus stops to maintain proper spacing between buses. Bus operators are instructed not to depart these timepoints ahead of the published time. It should be noted that the bus stop times that are available through TripPlanner+ on the MTA’s website, or at the bus stop information panels, but are not listed in the published timetables pamphlets, are estimates. These estimates are calculated based on the official timepoints listed in the timetable pamphlets. The allotted travel times between bus timepoints are highly dependent on roadway congestion, which is not always consistent from one day to another. It would be infeasible for bus operators to know the estimated bus stop times for all stops made on a route, and only the specific timepoints listed in the public timetable pamphlets are given to bus operators. In order to make sure that you are able to catch your bus, please arrive at your stop at least five minutes before the estimated departure time. Additional information about wait assessment and on‐time performance for buses can be found in Section 4: Quality of Service of this report.

, Metropolitan Transportation Authority
60
Bus Bunching Comments were received regarding bus bunching on many of the routes in Northeast Queens. Many complaints were lodged about specific areas and specific routes that get bunched up. Bus bunching is caused by many factors including variations in traffic, the amount of time it takes for customers to load buses, building construction, utility repairs, traffic congestion, and unanticipated emergency or police activity. Each of these factors by themselves or in combination can lead to bus bunching on a route. When available, on‐street bus dispatchers are assigned to critical locations to monitor and adjust bus spacing as necessary. This may include holding a bus at a stop momentarily so that it will not immediately follow the bus that is directly ahead of that bus, or conversely the first bus may be directed to jump ahead and bypass the next several stops. In addition to on‐street supervision, the MTA deploys the new Bus Time technology to aid in the mitigation of these issues. Bus Time, which provides information for passengers based on the GPS location of the bus, provides essential information to MTA operations staff so that they can better adjust the timing and distribution of buses along the route. The system is new, and the MTA will continue to make more effective use of it to provide a better experience for all of our passengers.
Reliability Comments were received regarding the reliability of buses in Northeast Queens. Complaints were made about late buses, buses that never arrive, and buses that are slow and take too long to reach their destination. MTA uses three principal metrics for measuring reliability of its routes: on‐time performance, wait assessment, and road reliability. Generally, Northeast Queens bus routes perform better than the Queens and citywide averages for all three metrics. Detailed analysis of bus performance indicators by route are outlined in Section 4: Quality of Service of this report. Bus delays can be caused by a number of factors as noted above in Bus Bunching. Often congestion is the contributing factor to late buses. This is particularly true during the morning and evening peak periods and in congested Downtown Flushing and Downtown Jamaica. Bus delays can also be caused by mechanical issues and accidents. “Not in Service” is a display sign used when buses are running along city streets but are not available to pick up passengers. Buses may not be in service for several reasons, sometimes due to mechanical issues, returning to the depot at the end of the bus operator’s shift, or when the bus itself is transitioned from one route to serve a different route (this is known as “interlining”). In some instances, buses display “Next Bus Please” when they are delayed and have been informed by dispatchers to jump ahead and not accept any new passengers, but continue to discharge passengers when requested. This is usually done is conjunction when another bus is close by providing duplicative service. This action allows a bus to fill any excessive gaps in service between it and the preceding bus ahead of it.

, Metropolitan Transportation Authority
61
Bus Schedule Coordination with Subway and LIRR Comments were received regarding transfers that were missed where the customer saw the bus pulling away from the stop just as the passenger was attempting to transfer from the subway or the Long Island Railroad to the bus. The MTA adjusts schedules periodically, and attention is paid by staff scheduling buses to the ever‐changing subway and railroad schedules. Each mode of travel has different constraints on the system, and efforts are made to coordinate schedules to the extent possible. As an example, the Long Island Railroad trains that stop at Little Neck during the evening commute arrive in an erratic pattern. Some trains are scheduled 37 minutes behind the previous train, while some are scheduled 3 minutes behind the previous train. In order to ensure reliability along the entire Q36 route, buses are scheduled to leave the Little Neck station at even time intervals every 30 minutes. In order to provide timely service to passengers waiting further along the bus route and an even distribution of passengers on the buses, buses cannot be held for an extra 6 or 7 minutes until the next train arrives. Bus reliability starts with timely departures from the first stop. Additionally, holding a bus for too long at a bus stop will be an inconvenience to those customers who are already on the bus.
Bus Service To/From Schools Comments were received regarding the many groups of students who ride the city’s buses. Additional comments were received requesting additional buses at school dismissal times to alleviate overcrowding on buses clogged with many students all being released at the same time. The MTA continues to monitor ridership and crowding on buses and make adjustments over time. The MTA schedules extra trips on school days to alleviate overcrowding caused by high volumes of students requiring bus service at the time of dismissal. These dedicated extra trips operate on several routes in Northeast Queens, available for students and the general public. These extra trips originate near schools around dismissal times and continue making all stops along the normal service pattern for the remainder of the route. School dismissal times can change without advanced notice to the MTA, making it difficult to meet the student needs at various times.
Amenities and Facilities Issues Flushing Bus Terminal Many comments were received regarding Downtown Flushing, where many bus routes intersect at the terminus of the 7 train. In addition to suggestions for overall improvements in the location of transfers
and bus stops, specific requests were made for a bus terminal to be built in Downtown Flushing. As Northeast Queens and Downtown Flushing continue to grow, so does the need for improved transit in the area. The MTA continues to explore opportunities for an off‐street bus terminal in Downtown Flushing to help customers transferring to the subway and other bus routes. A bus terminal would also help improve bus operations. Available space is very constrained in Downtown Flushing. Opportunities are extremely limited for locations that both add convenience for customers and work within the traffic network. Additional information about the challenges related to establishing a bus terminal in Downtown Flushing is available in Section 6: Recommendations of this report.

, Metropolitan Transportation Authority
62
Bus Lanes Comments were received regarding the allocation of street space. Some suggestions were made for certain roads to be turned into bus‐only streets, while certain roads were suggested to receive dedicated bus‐only lanes. The MTA works closely with NYCDOT regarding the allocation of street space. NYCDOT owns and manages the public streets in New York City, and it carefully weighs the benefits of bus lanes for individual roads. There is no one‐size‐fits‐all approach to road space allocation, and what works in one place will not necessarily work in another. NYCDOT and the MTA look at the possibility of bus lanes as part of special projects, such as the implementation of Select Bus Service. In addition, some areas that are subject to redevelopment receive special attention to determine if bus lanes would be helpful and better allocate road space.
Bus Shelters Comments were received regarding bus shelters, especially the desire for bus shelters to be installed at specific locations. Comments were received about the desire from seniors for seating to be available at bus stops, as standing long periods while waiting for the bus is a hardship on them. Some suggestions were made that all bus stop should have bus shelters. Bus Stop furniture is under the jurisdiction of NYCDOT. While the MTA supports the installation of bus shelters and benches as a way to improve customer comfort, community requests for additional locations should be forwarded to NYCDOT for consideration. Additional information about Bus Shelters in Northeast Queens can be found in Section 4: Quality of Service of this report.
Bicycle Racks on Buses Comments were received suggesting that the MTA install bicycle racks on buses. Special mention was given to transportation infrastructure that do not allow bicycles and the nearby neighborhoods that would therefore benefit most from bicycle racks on buses. Bicyclists are not allowed to ride across the Whitestone Bridge or the Throgs Neck Bridge that span from Northeast Queens to the Bronx. Though buses do not currently have bicycle racks, folding bicycles are permitted aboard local and limited buses at all times. Please fold your bicycle before boarding and don’t block the aisle or doors. Folding bicycles are not allowed on express buses. All other bicycles are prohibited on buses. The MTA is conducting a one‐year pilot program for bicycle racks on the S53 and S93 bus routes that connect Port Richmond and the College of Staten Island to Bay Ridge, Brooklyn via the Verrazano‐Narrows Bridge. The Verrazano‐Narrows Bridge, like the two bridges in the study area, lacks any bicycle facilities and prohibits bicycles, leaving limited options to travel by bicycle from one borough to the other. Any expansion of bicycle racks on MTA buses will depend on the results of the evaluation of this pilot.
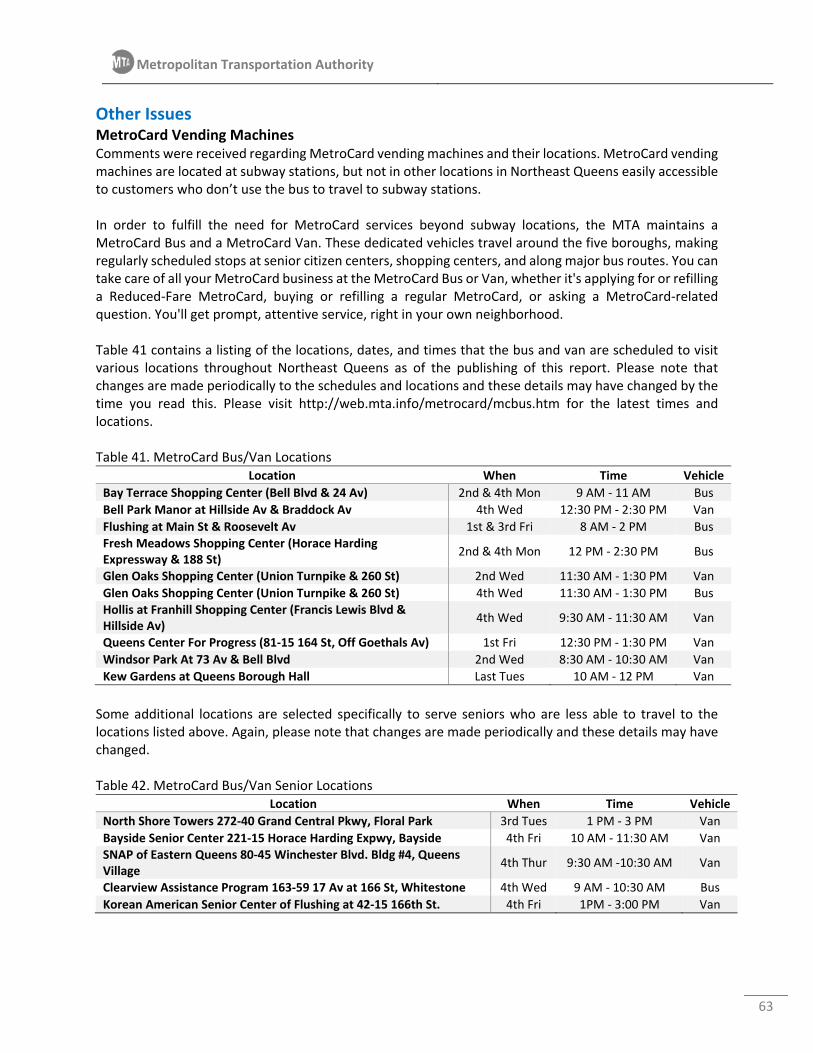
, Metropolitan Transportation Authority
63
Other Issues MetroCard Vending Machines Comments were received regarding MetroCard vending machines and their locations. MetroCard vending machines are located at subway stations, but not in other locations in Northeast Queens easily accessible to customers who don’t use the bus to travel to subway stations. In order to fulfill the need for MetroCard services beyond subway locations, the MTA maintains a MetroCard Bus and a MetroCard Van. These dedicated vehicles travel around the five boroughs, making regularly scheduled stops at senior citizen centers, shopping centers, and along major bus routes. You can take care of all your MetroCard business at the MetroCard Bus or Van, whether it's applying for or refilling a Reduced‐Fare MetroCard, buying or refilling a regular MetroCard, or asking a MetroCard‐related question. You'll get prompt, attentive service, right in your own neighborhood. Table 41 contains a listing of the locations, dates, and times that the bus and van are scheduled to visit various locations throughout Northeast Queens as of the publishing of this report. Please note that changes are made periodically to the schedules and locations and these details may have changed by the time you read this. Please visit http://web.mta.info/metrocard/mcbus.htm for the latest times and locations. Table 41. MetroCard Bus/Van Locations
Location When Time Vehicle
Bay Terrace Shopping Center (Bell Blvd & 24 Av) 2nd & 4th Mon 9 AM ‐ 11 AM Bus
Bell Park Manor at Hillside Av & Braddock Av 4th Wed 12:30 PM ‐ 2:30 PM Van
Flushing at Main St & Roosevelt Av 1st & 3rd Fri 8 AM ‐ 2 PM Bus Fresh Meadows Shopping Center (Horace Harding Expressway & 188 St)
2nd & 4th Mon 12 PM ‐ 2:30 PM Bus
Glen Oaks Shopping Center (Union Turnpike & 260 St) 2nd Wed 11:30 AM ‐ 1:30 PM Van
Glen Oaks Shopping Center (Union Turnpike & 260 St) 4th Wed 11:30 AM ‐ 1:30 PM Bus Hollis at Franhill Shopping Center (Francis Lewis Blvd & Hillside Av)
4th Wed 9:30 AM ‐ 11:30 AM Van
Queens Center For Progress (81‐15 164 St, Off Goethals Av) 1st Fri 12:30 PM ‐ 1:30 PM Van
Windsor Park At 73 Av & Bell Blvd 2nd Wed 8:30 AM ‐ 10:30 AM Van
Kew Gardens at Queens Borough Hall Last Tues 10 AM ‐ 12 PM Van
Some additional locations are selected specifically to serve seniors who are less able to travel to the locations listed above. Again, please note that changes are made periodically and these details may have changed. Table 42. MetroCard Bus/Van Senior Locations
Location When Time Vehicle
North Shore Towers 272‐40 Grand Central Pkwy, Floral Park 3rd Tues 1 PM ‐ 3 PM Van
Bayside Senior Center 221‐15 Horace Harding Expwy, Bayside 4th Fri 10 AM ‐ 11:30 AM Van SNAP of Eastern Queens 80‐45 Winchester Blvd. Bldg #4, Queens Village
4th Thur 9:30 AM ‐10:30 AM Van
Clearview Assistance Program 163‐59 17 Av at 166 St, Whitestone 4th Wed 9 AM ‐ 10:30 AM Bus
Korean American Senior Center of Flushing at 42‐15 166th St. 4th Fri 1PM ‐ 3:00 PM Van

, Metropolitan Transportation Authority
64
Customers in Northeast Queens also have other opportunities to purchase a MetroCard in their neighborhood. Pre‐valued Pay‐per‐Ride and Unlimited‐Ride MetroCards are available for purchase at participating neighborhood merchants (the $1 new card fee does not apply for cards purchased at these merchants). All Long Island Rail Road station ticket vending machines and staffed ticket windows sell pre‐valued $5.50 and $25 Pay‐per‐Ride MetroCards ($1 new card fee applies). Customers may also open an EasyPayXpress MetroCard on‐line account, which enables customers to replenish value or time on their MetroCard using a credit card or debit card.
Passengers with Disabilities Comments were received regarding customers with disabilities and their ability to access buses. All buses are ADA‐accessible to customers via lifts and ramps. In fact, New York City has the largest fleet of accessible buses in North America. In addition, 103 New York City subway stations & Staten Island Railway stations are accessible to people with disabilities, and all Port Washington branch LIRR stations in Northeast Queens, except for Flushing‐Main Street, have wheelchair access1. Bus stops are placed in locations that are accessible to persons with disabilities. When a bus stop becomes inaccessible due to vehicles blocking the bus stop or snow and ice preventing the bus from reaching the curb, bus operators will make sure to find ways to accommodate persons with disabilities to ensure that they are given the same access to transit services that all riders receive.
1 Northeast Queens LIRR stations Little Neck, Douglaston, Bayside, Auburndale, Broadway, and Murray Hill all provide wheelchair elevator and/or ramp access. Additionally, Penn Station, Woodside, Great Neck, Manhasset, Plandome and Port Washington also provide wheelchair elevator and/or ramp access. Mets‐Willets Point does not currently have wheelchair access. Flushing‐Main Street will soon be getting wheelchair access as part of an ongoing capital project at this station that involves millions of dollars of investment in Downtown Flushing by the MTA.

, Metropolitan Transportation Authority
65
6. RECOMMENDATIONS This section outlines the primary recommendations for service modifications in Northeast Queens. Some recommendations are already slated for implementation, or can be implemented within several months. Many of the recommendations require funding that is not available at this time, but when funding becomes available, these initiatives will be implemented where possible. Other recommendations will require further analysis and study.
SUMMARY OF CHANGES The following is a summary of the proposed service changes: Short‐term Recommendations
Modify the Q65 travel path in Flushing to provide more reliable service and to provide all‐day service on Parsons Boulevard alongside the part‐time Q26
Continue to schedule additional trips such as those on the Q12, Q13, Q28, and Q58 that were added for Summer 2015 as part of ongoing schedule changes
In conjunction with the initiation of Q44 SBS, create 24‐hour service on the Q20A
Analyze the feasibility of overnight and all‐day service on the Q13, Q30, and Q88
Continue to adjust running time on all routes to improve schedule adherence
Long‐term Recommendations
Implement a pilot program for limited‐zone bus service on one or more Northeast Queens bus route, possibly to include the Q12, Q17, Q27, Q43, Q46, and Q88
Analyze the feasibility of limited‐stop service on the Q12 and Q88 bus routes
Study alternatives to expand north‐south service throughout the study area
In addition to the two SBS routes along the Flushing‐Jamaica corridor, implement additional Select Bus Service along major transit corridors, possibly to include Hillside Avenue, Northern Boulevard, and Union Turnpike
Explore creation of a Downtown Flushing Bus Terminal in conjunction with new development and redevelopment occurring in the area
SHORT‐TERM RECOMMENDATIONS Service Change Route Modification Modification of Q65 Travel Path (MTA Bus Company) During the study period, input was received from the public regarding the travel path of the Q65 in the vicinity of Flushing Hospital, a Jewish community center, and a Hindu Temple. A suggestion was made to reroute the Q65 in Flushing from operation on Bowne Street and 45th Avenue instead onto Parsons Boulevard and Sanford Avenue. 45th Avenue and Bowne Street in this area are relatively narrow streets. The suggestion would allow the Q65 to operate on Parsons Boulevard and Sanford Avenue, which are wider streets. With wider streets and fewer turns, service will become faster and more reliable for all Q65 customers riding in this area. This portion of Parsons Boulevard is currently utilized only by the peak‐period Q26. This revision to the Q65 travel path would provide this area with all‐day and weekend bus service. This portion of Sanford Avenue is utilized by the Q26 and the Q12, as well as NICE bus routes N20 and N21. Some of the Q65

, Metropolitan Transportation Authority
66
customers will have a slightly longer walk of up to 1‐3 blocks (700‐1,000 feet) to the new bus stops on Parsons Boulevard. One motivation behind this community suggestion to remove the Q65 from Bowne Street and 45th Avenue is the prospect that NYCDOT could re‐evaluate parking on these narrow streets. 45th Avenue and Bowne Street have limited curbside parking on one side, possibly in order to provide adequate space for large vehicles traversing the area, including the Q65 bus. The community has expressed hope that additional curbside parking could be permitted along these streets for users and visitors of Flushing Hospital, the community center, and the temple. Even if the MTA follows through on the travel path revision of the Q65, it is up to NYCDOT to re‐evaluate parking along these streets and decide on appropriate parking strategies to accommodate the community and the various land uses in this area. Benefits: Reduction in the number of turning maneuvers thereby providing faster and more reliable service. Creates all‐day and all‐week service on this portion of Parsons Boulevard, which currently has peak‐period‐only service. Reduces the need for a wider travelway along the narrow 45th Avenue and Bowne Street, which potentially enables NYCDOT to introduce curbside parking along these streets, as requested by the community. Drawbacks: Up to 512 existing customers would have a longer walk of approximately 700 to 1,000 feet to access the Q65. Cost: Neutral Figure 26. Q65 Travel Path Modification in Flushing

, Metropolitan Transportation Authority
67
Schedule Changes Increase in Trips Bus passenger loads are estimated from AFC data and verified with manual checks to determine schedule trip changes. These normal, ridership‐driven service increases will reduce crowding throughout the entirety of certain routes and reduce wait time between buses. Changes in the number of scheduled trips since 2010 are listed in Section 2: Bus Service and Schedule of this report. Table 43 lists the proposed schedule changes that were implemented in the summer 2015 schedule update.
Table 43. Recommended Additional Trips
Route Time Additional Trips
Q12 Weekday +5.5%
Q12 Sunday +1.7%
Q13 Weekday +0.5%
Q28 Weekday +6.6%
Service Span Increases Q20A – 24 hour service (NYC Transit) In conjunction with the initiation of Select Bus Service on the Q44 route, the Q20A is being examined to operate at all times on weekdays and weekends. Currently, the Main Street corridor is served by the Q44 Limited, Q20A, and Q20B during the day. The Q20A/B routes cease operations during the overnight period and the Q44 makes all local stops during these hours. The new Q44 Select Bus Service will operate 24 hours a day, providing a faster trip for customers riding late night hours. To serve the local stops along the corridor, the Q20A would operate overnight as well, providing new 24‐hour service to 20th Avenue.
Additional Routes to be Studied for Span Increases (NYC Transit) Three additional routes are being studied to extend their weekday overnight service span to provide later service. These routes have relatively high ridership and have minimum duplication of existing overnight service, providing effective bus coverage across Northeast Queens. Also, all of these routes connect to subway stations that operate 24 hours. Funding for overnight service will need to be identified and allocated. Q13 The Q13 has a three hour gap in service from approximately 2 a.m. to 5 a.m. The Q13 would provide the only overnight service on Bell Boulevard in Bayside and Bay Terrace. The Q13 connects to the 7 Flushing‐
Main St subway station. Q30 The Q30 has a four and half hour gap in service from approximately 12:30 a.m. to 5 a.m. The Q30 would provide the only overnight service on Utopia Parkway and Horace Harding Expressway, east of 188th Street. The Q30 connects to the F 169 St station, EJZ Jamaica Center‐Parsons Archer station, and
EJZ Sutphin Blvd‐Archer Av. Prior to 2010, overnight service was provided on the Q30.
Q88 The Q88 has a six and half hour gap in service from approximately 11:30 a.m. to 6:00 a.m. The Q88 would provide the only overnight service on Horace Harding Expressway, west of Kissena Boulevard. The Q88 connects to the MR Woodhaven Blvd station.

, Metropolitan Transportation Authority
68
Running Time Modifications Running time is the amount of time scheduled for a bus to travel between two locations along a route. Variability in actual running times are a key indicator as to where problem areas might exist, and whether the schedule adequately reflects real road conditions. When scheduled running times are too short, buses will routinely arrive at stops and terminals late. When a bus begins to fall behind schedule, delays can be compounded by the increased loading times required for the additional passengers who have arrived after the scheduled stop time, who would normally just catch the subsequent bus. Insufficient running time can have a domino effect on later service if the bus arrives late to the final stop that it then leaves late for its next trip in the opposite direction. Conversely, when the scheduled running time is too long, travel time for passengers on board increases as the bus travels slowly to meet scheduled timepoints. Even worse, the bus may arrive and depart from the scheduled timepoints early, which means that someone who arrives the stop on time will have to wait until the next bus arrives. Adjustments to running times therefore can help improve performance for the adjusted trips, make later service more reliable, and decrease waiting and travel time for customers. Schedule planners can better track and correct these inaccuracies with the increased availability of data from Bus Time. To improve performance and schedule adherence, several modifications to scheduled running times have been implemented recently, and more will be implemented in the future. The adjustments are made to more closely match observed running times provided by Bus Time data. Running time modifications have been made on many routes this year, including:
Summer 2015: Q12, Q13, Q17, Q28, Q36 Fall 2015: Q15, Q16, Q17, Q20, Q26, Q31, Q36, Q43, Q44, Q46, Q48, Q76, Q88
LONG‐TERM RECOMMENDATIONS Service Changes Limited‐Zone Bus Service Currently, many routes operate local and limited service in which the local bus makes every stop and the limited bus makes stops every half mile or so along the entire route. The half‐mile limited‐stop spacing pattern typically serves high bus‐to‐bus transfer locations or shopping and institutional destinations. However, many bus routes in Northeast Queens are be considered as subway feeder routes. There is a subgroup of customers who are solely travelling from the outer portions of the route directly to the subway. These customers from the outer “zones” typically have long travel times to their subway connection. “Limited Zone” service combines features of limited and express service. Buses make limited stops along the outer parts of the route and then operate non‐stop to terminals near subway stations. This pattern of service is not currently provided by the MTA. If the number of customers destined for the subway on a particular route reaches a full load at the outer zone of the route, it may be possible to designate some trips as “limited‐zone” trips. These limited‐zone trips would bypass subsequent stops and run directly to the subway, and perhaps operate only during the peak hours. A limited‐zone service could replace regular limited service if it is determined that a route is a good candidate for this service.

, Metropolitan Transportation Authority
69
Some Northeast Queens bus routes with existing limited service that could possibly benefit from limited‐zone service are the Q17, Q27, Q43, and Q46. On average, Q27 Limited customers travel 4.91 miles on the bus, the longest trip length of all bus routes in the study area. Q46 Limited customers currently have an average trip of 3.71 miles, the third longest of all Northeast Queens bus routes. The MTA will conduct a detailed analysis of ridership patterns under the “Limited‐Zone” concept to see the impacts on ridership and travel time savings. The type of service recommended for each of these routes will depend on the number of customers benefitting from each option and the operating costs associated with them.
Figure 27. Stop Spacing Service Patterns
Limited Service Limited stop bus service has fewer stops than local service and provides a quicker trip for most bus customers along a route. Q88 (NYC Transit) The Q88 averages 11,000 weekday customers. The Q88 is also one of the longest bus routes in Northeast Queens. While the Q88 average morning and evening headways meet the guidelines for limited service, additional analysis of ridership is necessary to identify potential limited‐stop locations and the percentage of total Q88 customers that would be served by these stops. NYCT will conduct a full analysis of the potential to implement limited‐stop service on the Q88 during the next year. Q12 (NYC Transit) The Q12 is one of busiest routes in Northeast Queens that does not have limited‐stop service. Almost 11,000 customers use the bus on weekdays. While the Q12 average morning and evening headways meet the guidelines for limited‐stop service, additional analysis of ridership patterns is necessary to identify potential limited‐stop locations and the percentage of total Q12 customers that would be served by these stops. NYCT will conduct a full analysis of the potential to implement limited‐stop service on the Q12 during the next year.

, Metropolitan Transportation Authority
70
North‐South Bus Service Over the course of this study, the MTA identified areas in Northeast Queens that have gaps in north‐south bus service. We also received public input asking for additional bus service along north‐south corridors. While the western section of the study area can be traversed by the Q20, Q25, Q34, Q44, and Q65, the only bus routes providing full north‐south service in the central and eastern sections of Northeast Queens are the Q76 and Q36. The MTA is investigating ways to fill the gaps in service and provide better bus coverage throughout the study area, based on service coverage guidelines.
Select Bus Service New York City Department of Transportation and the MTA prepared a joint report in 2009 entitled Bus Rapid Transit Phase II: Future Corridors, which presented potential future Select Bus Service routes throughout the city. Under this study, the Flushing to Jamaica corridors of Main Street and Parsons/Kissena Boulevards were identified as good candidates for conversion to SBS. SBS service for these two corridors is currently in the planning stage. Q44 SBS Jamaica‐Flushing‐Bronx Zoo service is expected to be implemented in late 2015 and Q25 SBS at a later date. There are three additional potential SBS corridors that affect the study area and could impact transit service in Northeast Queens: Union Turnpike, Manhattan‐Northern Boulevard‐Flushing, and the Hillside Avenue corridors. Planning has not yet begun for these corridors as of the writing of this report, but the studies of these potential SBS corridors will follow soon after the implementation of the two planned SBS routes, as the agencies continue to roll out enhanced transit service throughout the city. Figure 28. Future BRT Corridors

, Metropolitan Transportation Authority
71
Downtown Flushing Bus Terminal Downtown Flushing has the highest volume of intermodal bus‐to‐rail transfers in North America. The area is a major transportation hub and is extremely congested. An off‐street bus terminal in or near Downtown Flushing would greatly improve the customer experience and bus operations. Twenty‐two bus routes serve the area and many of these routes terminate in Downtown Flushing. Flushing is an intermodal hub and there are many customers transferring from bus to bus in addition to those transferring from bus to subway in the area. Downtown Flushing has high pedestrian volumes and chronic vehicular congestion. This leads to overcrowded sidewalks and conflicts with vehicles turning through crosswalks. All buses in Flushing board curbside, and bus customers contribute to the volume of pedestrians on sidewalks. Bus shelters cannot easily be accommodated on these sidewalks because they would often exacerbate pedestrian overcrowding by occupying valuable sidewalk space. Currently, bus routes that terminate in Flushing generate empty buses that are sitting on local streets just waiting to begin the next scheduled trips. This limited curb space is highly valued as delivery vehicles, private automobiles, taxis, and delivery cabs all compete for the same space. New construction in the area reduces the already constrained curbside space, creating congestion, motivating delivery vehicles to occupy bus stops illegally, and causing bus delays by blocking buses from accessing their bus stops. A dedicated bus terminal would allow more convenient bus‐to‐bus transfers and return curb space to local businesses. The MTA is also exploring route design changes in Downtown Flushing that would decrease the number of bus routes terminating in the area, without affecting service to and from the area. The greatest challenge to this endeavor is the lack of suitable locations in Downtown Flushing, as most of the available lots are privately owned and already slated for development or redevelopment. A location that is large enough to accommodate a significant number of bus routes and that can bring efficiencies in bus operations has not yet been easy identified. Nevertheless, the MTA will continue to explore ways to pursue a bus terminal by working with our partner agencies to take steps to address this critical need in Downtown Flushing. Location aside, funding for the construction of a terminal will also be a significant challenge to identify. Throughout this process, the support of the public and local elected officials will be highly important in this endeavor.

, Metropolitan Transportation Authority
72
7. NEXT STEPS This study analyzed the current state of Northeast Queens bus service and outlines recommendations to
improve service. Some of the bus service and schedule changes proposed can be implemented in the short
term. Other recommendations require more detailed study and analysis which is anticipated to be
completed by the end of the year. The agency will reach out to the public for comments on any proposed
actions for implementation. Proposed service improvements will be implemented in the long term if they
are determined to improve service, be cost‐effective, and reasonably funded.

, Metropolitan Transportation Authority
A‐1
APPENDIX A – PUBLIC INPUT QUESTIONS AND ANSWERS New Bus Routes Q. Can the MTA create an Express Bus from North Shore Towers to Lower Manhattan? A. The QM6 currently serves North Shore Towers with service to Midtown Manhattan. Several areas in Northeast Queens are served by express buses to either Midtown or Lower Manhattan. Suggestions were made that North Shore Towers could be better served with an express bus service to Lower Manhattan. The MTA evaluated the suggested new route. While the route would add convenience for some customers, the overall performance of this route would not be within operating guidelines, as an insufficient market exists for this service to justify the creation of the route. Q. Can the MTA create an express bus from Bay Terrace to Lower Manhattan? A. The QM2 and QM20 currently serve Bay Terrace with service to Midtown Manhattan. Several areas in Northeast Queens are served by express buses to either Midtown or Lower Manhattan. Suggestions were made that Bay Terrace could be better served with an express bus service to Lower Manhattan. The MTA Bus Company has previously studied the possibility of establishing a route to operate between Bay Terrace and Lower Manhattan. While such a route may be feasible at some point in the future, additional funding will need to be found in order to establish this route. Q. Can the MTA create an express Bus route along Horace Harding Parkway? Parallel east‐west streets such as Northern Boulevard, Union Turnpike, and Hillside Avenue have express bus routes. A. Much of the design of new bus routes involves looking at areas covered by existing bus routes so as not to duplicate services unnecessarily, taking existing passengers away from one bus and providing them a newer bus route. Though an express bus does not run along Horace Harding Parkway, much of the area is served by express buses. The QM4 express bus terminates near Horace Harding Expressway on 164th Street. The QM1 and QM7 express buses terminate near Horace Harding Expressway on 188th Street. The QM5 and QM8 express buses run along Horace Harding Expressway from Springfield Boulevard to Little Neck Parkway. Q. Can the MTA create an express bus from College Point to Manhattan? A. College Point is singular among Northeast Queens neighborhoods in that it does not have any express bus service. Many residents of College Point take local or limited buses to Flushing and transfer to the 7 train. While it is not possible to serve every street with express bus service, the MTA looks for concentrations of commuters that would provide solid ridership for an express route. The MTA also looks for travel paths along the street grid that would enable smooth, reliable running of buses. Thus far, no travel path and set of stops has been found that would provide high enough ridership to justify the cost of an express bus in College Point. The MTA will continue to examine new possible routes as demographics shift and redevelopment continues. Q. Can the MTA create an express bus from Northeast Queens to Long Island City? A. While the MTA continues to evaluate and adjust the formerly Manhattan‐centric focus of express bus routes, local and limited bus routes provide better intraborough and interborough service. While not all origin‐destination pairings suggested will have a bus route established to serve them, the MTA will continue to find the best way to balance all forms of public transportation.

, Metropolitan Transportation Authority
A‐2
Q. Can the MTA create a new North‐South route along Springfield Boulevard and Bell Boulevard? A. While there is existing bus service on both of these streets, there is not a single route that covers the entire length of either boulevard. This study did identify some gaps in North‐South service in Northeast Queens. The MTA is investigating ways to fill these gaps in service and provide better bus coverage throughout the study area. The Springfield/Bell Boulevards corridor will be analyzed as part of those efforts. Q. Can the MTA create a new North‐South route along Douglaston Parkway? A. Douglaston Parkway is bordered by the Cross‐Island Parkway, Alley Pond Park, and Douglaston Golf Course in several sections. Due to this, the majority of development is located to the east of Douglaston Parkway. The MTA is investigating ways to fill the gaps in north‐south service and provide better bus coverage throughout the study area. This corridor will be analyzed further as part of those efforts.
Route Extensions + Adjustments Route Adjustments Q. Can the travel path for Q65 near Flushing Hospital be changed? A. Comments were received regarding the travel path of the Q65 bus in the area of Flushing Hospital, a Jewish community center, and a Hindu temple. The MTA evaluated the suggested changes to the route travel path. Further information on this specific service change is located in Section 6: Recommendations of this document. Q. Can the MTA move the Q15A off of 10th Avenue? A. As part of the 2010 Service Reductions, the Q14 was discontinued and the Q15 was split into the Q15 and Q15A. The Q15A serves areas previously served by the discontinued Q14 bus route, including 150th Street and 7th Avenue. To travel from Clintonville Street to 154th Street, the Q15A uses 10th Avenue. NYCT operates buses on many residential streets throughout New York City. 10th Avenue is wide enough to accommodate the Q15A. Q: Can the MTA keep the Q27 on the current detour that it’s on, since it’s getting me to my destination faster? A: The Q27 is on temporary detour until 2017 due to construction on 216th Street. We will continue to monitor the route’s performance and impacts along the route. Currently, there are no plans to make this temporary reroute permanent. Q. Can the MTA extend the Q34 to Francis Lewis Boulevard? A. Currently, the Q34 ends on Willets Point Boulevard at 149th Street. The community has suggested that a local bus service running along Willets Point Boulevard to Francis Lewis Boulevard would allow for additional transfers to the Q76 route. No local bus service is currently available on Willets Point Boulevard between this location and Francis Lewis Boulevard. The MTA evaluated the suggested extension to the route. The MTA believes that a route extension to Francis Lewis Boulevard would add reasonable local bus service coverage along Willets Point Boulevard (a corridor now only served by weekday express service, the QM20), but the number of additional riders and possible transfers that

, Metropolitan Transportation Authority
A‐3
might be established is difficult to quantify, and the MTA does not currently have the funding or resources needed to implement this extension. Q. Can the MTA extend the Q46 to North Shore Towers? A. The Q46 is a long route and operates almost the entire length of Union Turnpike from Queens to Nassau County. Extending the route to North Shore Towers would require an extension of approximately one mile in each direction on either branch. This would add almost two miles to each trip. Long Island Jewish Hospital is a large trip generator and has a dedicated bus terminal area near the main hospital entrance. We have also receive significant amounts of comments over the years in opposition to a possible Q46 extension to North Shore Towers.
Bus Stop Changes
Q. Can the MTA improve the conditions at bus stops at subway stations, particularly 169th Street Subway Station? A. The MTA will continue to evaluate the passenger environment and look for ways to improve the customer’s experience through better information, more comfortable surroundings, and an increased feeling of safety. Unfortunately, many of the conditions of the sidewalk along Hillside Avenue are due to the high number of buses running along the street during the evening rush hour. Buses arrive, discharge passengers, and load up new passengers. The dwell time for fare collection of so many transfers from the subway slows down the departure of the bus and therefore prohibits other buses from properly curbing to pick up passengers. The MTA continues to deploy new technologies to aid in the mitigation of these issues. BusTime, which provides information for passengers based on the GPS location of the bus, also provides essential information to MTA operations staff so that they can better adjust the timing and distribution of buses along the route. The system is new, and the MTA is just beginning to make changes that will ensure a better experience for all of our passengers.
Other Bus Service Requests Q: The bus route on my street is local, but can it be turned into a limited? A: The guidelines for limited service are listed in Section 5: Public Input of this document.
Q. Can the MTA make information clear regarding the numbering of bus routes? A. The MTA currently has 315 bus routes, by far the largest number in the United States. Almost a third of this number, consisting of 81 local and limited routes and 22 express routes, operate primarily in Queens. The sheer number of bus routes makes adding extra numbers problematic for customer understanding. Q. What is Bus Time and how does it work? A. Additional information about BusTime is located in Section 4: Quality of Service in this report. Also, please visit http://web.mta.info/nyct/MTA_BusTime.htm for more information and instructions on how to use its features.

, Metropolitan Transportation Authority
A‐4
Bus Stop Requests Q: A limited bus bypasses my stop, which is only served by the local bus. Can I the limited stop at my bus stop as well? A: Limited routes are able to move more rapidly along their travel paths than local buses precisely because they limit the number of stops that the bus makes. Stopping to pick up passengers over short distances is one of the factors leading to slow buses and reduced reliability. Therefore a balance must be struck between stop spacing and bus speed. Limited stop spacing is determined by ridership. Adding more stops to a limited route would cause the limited to act like a local and lose its value as a rapid bus line.
Other Bus Related Requests Q: Can the ticket vending machines used for Select Bus Service (SBS) also be made vend MetroCards as well? A: One of the advantages to SBS is faster boarding because of off‐board fare collection. These machines are dedicated to passengers boarding SBS buses. SBS would be slowed if passengers were held up from paying their fare due to other customers using the machines to buy or refill MetroCards.

, Metropolitan Transportation Authority
B‐1
APPENDIX B: ROUTE PROFILES Local/Limited Bus Routes Q1 Springfield Boulevard/Braddock/Hillside Avenues Q12 Sanford Avenue/Northern Boulevard Q13 Northern/Bell Boulevards Q15 150th Street Q15A 150th Street/10th Avenue Q16 Bayside Avenue/Willets Point Boulevard Q17 Kissena Boulevard/Horace Harding Expressway/188th Street Q19 Astoria Boulevard Q20A Main/Union Streets/20th Avenue Q20B Main/Union Streets/14th Avenue Q25 Kissena Boulevard/127th Street Q26 46th Avenue/Hollis Court Boulevard Q27 46th Avenue/Rocky Hill Road/Springfield Boulevard Q28 Northern Boulevard\32nd Avenue Q30 Utopia Parkway/Horace Harding Expressway Q31 Utopia Parkway/Bell Boulevard Q34 Kissena/Willets Point Boulevards Q36 Hillside/Jamaica Avenues/Little Neck Parkway Q43 Hillside Avenue Q44 Main Street/Cross Bronx Expressway Q46 Union Turnpike Q48 Roosevelt Avenue/Ditmars Boulevard/La Guardia Airport Q50 Co‐op City/Flushing Q58 Fresh Pond Road/Corona Avenue Q64 Jewel Avenue Q65 164th Street/College Point Boulevard Q66 Northern Boulevard Q76 Francis Lewis Boulevard Q88 Horace Harding Expressway/73rd Avenue/Springfield Boulevard
Express Bus Routes QM1 Fresh Meadows/Midtown QM2 Bay Terrace/Midtown QM3 Little Neck/Midtown QM4 Electchester/Midtown QM5 Glen Oaks/Midtown QM6 Lake Success/Midtown QM7 Fresh Meadows/Downtown QM8 Glen Oaks/Downtown QM20 Bay Terrace/Midtown via Clearview X68 Floral Park/Midtown

, Metropolitan Transportation Authority
B‐2
Q1 ‐ Springfield Blvd/Braddock/Hillside Avenues The Q1 operates between 165th Street Bus Terminal, Jamaica and Braddock Avenue/243rd Street, Bellerose or Jamaica Avenue/Springfield Boulevard (Queens Village LIRR station). Late nights, all trips serve both branches.
Neighborhoods Served: Queens Village, Oakland Gardens, Jamaica Estates, and Jamaica.
Service Details and Ridership:
Ridership History: Between 2009 and 2014, there was a 2.4 percent decrease in average weekday ridership, a 6.6 percent decrease in average Saturday ridership, and a 4.3 percent decrease in average Sunday ridership on the route.
Bus Stops: Below is a list of the five highest ridership bus stops by direction for the route on an average weekday.
Transfers: On an average weekday, the most popular Q1 bus to bus transfers were between the Q1 and the Q27 (166), Q43 (148), Q36 (51), Q88 (46), Q77 (45). There were 1,068 transfers between the Q1 and F train at Jamaica‐179th Street Station.
4,500
4,600
4,700
4,800
4,900
5,000
2009 2010 2011 2012 2013 2014
Average Weekday
2,500
2,600
2,700
2,800
2,900
3,000
2009 2010 2011 2012 2013 2014
Average Saturday
1,800
1,900
2,000
2,100
2,200
2,300
2009 2010 2011 2012 2013 2014
Average Sunday
Q1 – Service Details Weekday Saturday Sunday
Span 24 Hours 24 Hours 24 Hours
Frequency (in minutes)
Peak: AM ‐ 20/PM ‐ 15Off‐Peak: Noon ‐ 30/Eve ‐ 20
Overnight: 60
Day: 15Overnight: 60
Day: 18Overnight: 60
Average Daily Ridership (2014) 4,709 2,675 1,941
Q1 ‐ Eastbound Ons Offs
Hillside Av & 180th St 833 114
Hillside Av & 168th Pl 659 15
Hillside Av & Springfield Bl 84 451
Hillside Av & 182nd Pl 124 207
165th St & 165th St Terminal 275 0
Q1 ‐Westbound Ons Offs
Hillside Av & 179th St F Station 44 1,398
165th St & 165th St Terminal 0 464
Hillside Av & Springfield Bl 342 73
Hillside Av & 169th St 56 149
Hillside Av & 212th St 149 21

, Metropolitan Transportation Authority
B‐3
Q12 ‐ Sanford Avenue/Northern Boulevard The Q12 operates between the Flushing‐Main Street 7 Subway Station, Flushing and Northern Boulevard/ Glenwood Street, Little Neck. Neighborhoods Served: Little Neck, Douglaston, Bayside, Auburndale, and Flushing.
Service Details and Ridership:
Ridership History: Between 2009 and 2014, there was a 5.8 percent increase in average weekday ridership, a 12.4 percent increase in average Saturday ridership, and a 16.1 percent increase in average Sunday ridership.
Bus Stops: Below is a list of the five highest ridership bus stops by direction for the route on an average weekday.
Transfers: On an average weekday, the most popular bus to bus transfers were between the Q12 and the Q13 (211), Q44 (101), Q65 (89), Q58 (78), Q27 (77). There were 2,474 transfers between the Q12 and the 7 train at Flushing‐Main Street Station on an average weekday.
10,000
10,300
10,600
10,900
11,200
11,500
2009 2010 2011 2012 2013 2014
Average Weekday
7,000
7,300
7,600
7,900
8,200
8,500
2009 2010 2011 2012 2013 2014
Average Saturday
5,800
6,100
6,400
6,700
7,000
7,300
2009 2010 2011 2012 2013 2014
Average Sunday
Q12 – Service Details Weekday Saturday Sunday
Span 24 Hours 24 Hours 24 Hours
Frequency (in minutes)
Peak: AM ‐ 5/PM ‐ 6Off‐Peak: Noon ‐ 10/Eve ‐ 6
Overnight: 60
Day: 10Overnight: 60
Day: 10Overnight: 60
Average Daily Ridership (2014) 10,815 8,168 6,848
Q12 ‐ Eastbound Ons Offs
Roosevelt Av & Main St 3,888 0
Roosevelt Av & Layover 972 0
Sanford Av & 147th St 63 445
Sanford Av & 165th St 102 323
Sanford Av & Parsons Bl 52 343
Q12 ‐Westbound Ons Offs
Roosevelt Avenue & Union St 0 3,122
Roosevelt Avenue & Prince St 0 608
Sanford Avenue & 158th St 355 34
Northern Bl & Bell Bl 216 142
Sanford Av & 165th St 274 66

, Metropolitan Transportation Authority
B‐4
Q13 ‐ Northern/Bell Boulevards The Q13 operates between the Flushing‐Main Street 7 subway station in Flushing and Fort Road/Cross Island Parkway in Fort Totten.
Neighborhoods Served: Bay Terrace, Bayside, Auburndale, and Flushing.
Service Details and Ridership:
Ridership History: Between 2009 and 2014, there was a 2.6 percent increase in average weekday ridership, a 1.1 percent decrease in average Saturday ridership and a 5.6 percent increase in average Sunday ridership.
Bus Stops: Below is a list of the five highest ridership bus stops by direction for the route on an average weekday.
Transfers: On an average weekday, the most popular bus transfers for the route were between the Q13 and the Q28 (214), Q12 (173), Q27 (113), Q31 (104), and Q76 (94). There were 1,663 transfers between the Q13 and the 7 train at Flushing‐Main Street Station on an average weekday.
8,000
8,300
8,600
8,900
9,200
9,500
2009 2010 2011 2012 2013 2014
Average Weekday
6,000
6,300
6,600
6,900
7,200
7,500
2009 2010 2011 2012 2013 2014
Average Saturday
4,000
4,300
4,600
4,900
5,200
5,500
2009 2010 2011 2012 2013 2014
Average Sunday
Q13 – Service Details Weekday Saturday Sunday
Span 4:40AM – 2:33AM 5:10AM – 2:35AM 5:10AM – 2:35AM
Frequency (in minutes)
Peak: AM ‐ 9/PM ‐ 9Off‐Peak: Noon ‐ 12/Eve ‐ 9
Overnight: N/A
Day: 12Overnight: N/A
Day: 16Overnight: N/A
Average Daily Ridership (2014) 8,706 6,211 4,399
Q13 ‐ Eastbound Ons Offs
39th Av & 138th St 2,823 0
Northern Bl & Parsons Bl 165 426
Northern Bl & 147th St 107 203
Bell Bl & 42nd Av 177 203
Northern Bl & Murray St 67 247
Q13 ‐Westbound Ons Offs
39th Av & 138th St 0 2,573
Northern Bl & Parsons Bl 239 132
Bell Bl & 41st Av 177 183
Northern Bl & 147th St 235 102
Bell Bl & Northern Bl 226 102

, Metropolitan Transportation Authority
B‐5
Q15/Q15A ‐ 150 Street The Q15 operates between the Flushing‐Main Street 7 subway station in Flushing and 166th Street/Powell’s Cove Boulevard in Beechurst. The Q15A operates between Flushing‐Main Street 7 subway station in Flushing and 166th Street/Powell’s Cove Boulevard in Beechurst via Whitestone.
Neighborhoods Served: Beechhurst, Whitestone and Flushing.
Service Details and Ridership:
Ridership History: Between 2009 and 2014, average weekday ridership increased by 22.9 percent, average Saturday ridership increased by 20.6 percent, and average Sunday ridership increased by 22.3 percent.
Bus Stops: Below is a list of the five highest ridership bus stops by direction for the route on an average weekday.
Transfers: On an average weekday, the most popular bus transfers for the route were between the Q15/15A and the Q44 (73), Q25 (52), Q28 (49), Q58 (48), Q76 (44). There were 1,573 transfers between the Q15/15A and the 7 train at Flushing‐Main Street Station on an average weekday.
4,500
4,800
5,100
5,400
5,700
6,000
2009 2010 2011 2012 2013 2014
Average Weekday
2,400
2,700
3,000
3,300
3,600
3,900
2009 2010 2011 2012 2013 2014
Average Saturday
1,400
1,700
2,000
2,300
2,600
2,900
2009 2010 2011 2012 2013 2014
Average Sunday
Q15/15A – Service Details Weekday Saturday Sunday
Span 5:07AM – 12:53AM 4:58AM – 12:55AM 5:57AM – 1:15AM
Frequency(combined headway, in minutes)
Peak: AM ‐ 9/PM ‐ 9Off‐Peak: Noon ‐ 20/Eve ‐ 9
Overnight: N/A
Day: 18Overnight: N/A
Day: 26Overnight: N/A
Average Daily Ridership (2014) 5,738 3,084 1,949
Q15/15A ‐ Northbound Ons Offs
Roosevelt Av & Bowne St 910 130
Roosevelt Av & Main St 607 0
41st Av & Parsons Bl 45 230
150th St & Northern Bl 51 145
Cross Island Pky & 150th St 13 111
Q15/15A ‐ Southbound Ons Offs
Roosevelt Av & Union St 23 359
41st Av & Parsons Bl 75 20
Roosevelt Av & Bowne St 43 47
150th St Northern Bl 53 36
150th St & 17th Rd 77 5

, Metropolitan Transportation Authority
B‐6
Q16 ‐ Bayside Avenue/Willets Point Boulevard The Q16 operates between the Flushing‐Main Street 7 Station in Flushing and Fort Totten. In Whitestone, some Q16 buses operate via 26th Avenue and Utopia Parkway and others operate via Francis Lewis Boulevard and Willets Point Boulevard.
Neighborhoods Served: Bay Terrace, Beechhurst, and Flushing.
Service Details and Ridership:
Ridership History: Between 2009 and 2014, there was a 9.9 percent increase in average weekday ridership, a 12.7 percent increase in average Saturday ridership, and a 17.9 percent increase in average Sunday ridership.
Bus Stops: Below is a list of the five highest ridership bus stops by direction for the route on an average weekday.
Transfers: On an average weekday, the most popular bus transfers for the route were between the Q16 and the Q44 (67), Q76 (45), Q20B (39), Q17 (36), and Q66 (30). There were 1,382 transfers between the Q16 and the 7 train at Flushing‐Main Street Station on an average weekday.
3,600
3,800
4,000
4,200
2009 2010 2011 2012 2013 2014
Average Weekday
1,600
1,800
2,000
2,200
2009 2010 2011 2012 2013 2014
Average Saturday
1,000
1,200
1,400
1,600
2009 2010 2011 2012 2013 2014
Average Sunday
Q16 – Service Details Weekday Saturday Sunday
Span 4:38AM – 1:08AM 4:45AM – 1:12AM 4:45AM – 1:01AM
Frequency (in minutes)
Peak: AM ‐ 9/PM ‐ 11Off‐Peak: Noon ‐ 20/Eve ‐ 12
Overnight: N/A
Day: 20Overnight: N/A
Day: 25Overnight: N/A
Average Daily Ridership (2014) 4,021 1,870 1,364
Q16 ‐ Eastbound Ons Offs
39th Av & Union St 1,806 0
Union St & 35th Av 141 342
Union St & Bayside Av 62 155
29th Av & Francis Lewis Bl 12 151
Francis Lewis Bl & 27th Av 13 108
Q16 ‐Westbound Ons Offs
39th Av & Union St 0 2,080
Union St & Northern Bl 103 89
Union St & 35th Av 98 72
Bayside Av & Union St 113 46
29th Av & 171st St 127 20

, Metropolitan Transportation Authority
B‐7
Q17 ‐ Kissena Boulevard/Horace Harding Expressway/188 Street The Q17 operates between the Flushing‐Main Street 7 Station in Flushing and Archer Avenue/Merrick Boulevard in Jamaica. Local and limited‐stop service are provided on the route.
Neighborhoods Served: Jamaica, Jamaica Estates, Fresh Meadows, and Flushing.
Service Details and Ridership:
Ridership History: Between 2009 and 2014, there was a 6.4 percent decrease in average weekday ridership, a 4.8
percent decrease in average Saturday ridership, and a 0.8 percent increase in average Sunday ridership.
Bus Stops: Below is a list of the five highest ridership bus stops by direction for the route on an average weekday.
Transfers: On an average weekday, the most popular bus transfers for the route were between the Q17 and Q46 (365), Q30 (292), Q25 (275), Q88 (270), and Q65 (250). There were 1,935 transfers between the Q17 and the 7 train at Flushing‐Main Street Station and 670 transfers between the Q17 and F train at Jamaica‐179th Street Station on an average weekday.
17,000
17,500
18,000
18,500
19,000
19,500
2009 2010 2011 2012 2013 2014
Average Weekday
11,000
11,500
12,000
12,500
13,000
13,500
2009 2010 2011 2012 2013 2014
Average Saturday
9,000
9,500
10,000
10,500
11,000
11,500
2009 2010 2011 2012 2013 2014
Average Sunday
Q17 – Service Details Weekday Saturday Sunday
Span 24 Hours 24 Hours 24 Hours
Frequency(in minutes)
Peak: AM ‐ 8/PM ‐ 7Off‐Peak: Noon ‐ 6/Eve ‐ 6
Overnight: 40
Day: 7Overnight: 40
Day: 7Overnight: 40
Average Daily Ridership (2014) 17,530 11,934 10,170
Q17 ‐ Northbound Ons Offs 39th Av & Main St 0 4,416
188th St & Horace Harding Exp 682 321
Kissena Bl & Sanford Av 197 707
Horace Harding Exp & 164th St 529 301
Kissena Bl & Horace Harding Exp 478 261
Q17 ‐ Southbound Ons Offs
Kissena Bl & Main St 3,998 266
Main St & Roosevelt Av 2,055 0
Hillside Av & 179th St Subway 55 1,496
188th St & Horace Harding Exp 377 869
Kissena Bl & Sanford Av 485 502

, Metropolitan Transportation Authority
B‐8
Q19 – Astoria Boulevard The Q19 operates between Astoria and Flushing via Astoria Boulevard.
Neighborhoods Served: Astoria, East Elmhurst, and Flushing.
Service Details and Ridership:
Ridership History: Between 2009 and 2014, there was a 27.8 percent increase in average weekday ridership, a 39.1 percent increase in average Saturday ridership, and a 41.6 percent increase in average Sunday ridership on the route.
Bus Stops: Below is a list of the five highest ridership bus stops by direction for the route on an average weekday.
Transfers: On an average weekday, the most popular Q19 bus to bus transfers were between the Q19 and the M60‐SBS (134), Q27 (88), Q69 (75), Q44 (70), and Q25 (56). There were 473 transfers between the Q19 and the N and Q trains at Astoria Blvd Station, and 41 transfers between the Q19 and the 7 train at Flushing‐Main St Station on an average weekday.
2,000
2,300
2,600
2,900
3,200
2009 2010 2011 2012 2013 2014
Average Weekdays
1,000
1,300
1,600
1,900
2,200
2009 2010 2011 2012 2013 2014
Average Saturday
500
800
1,100
1,400
1,700
2009 2010 2011 2012 2013 2014
Average Sunday
Q19 – Service Details Weekday Saturday Sunday
Span 5:40AM – 8:00PM 5:50AM – 8:00PM 7:50AM – 8:30PM
Frequency (in minutes)
Peak: AM ‐ 20/PM ‐ 20Off‐Peak: Noon ‐ 20/Eve – N/A
Overnight: N/A
Day: 30Overnight: N/A
Day: 30Overnight: N/A
Average Daily Ridership (2014) 3,088 1,691 1,185
Q19 ‐ Eastbound Ons Offs
39th Av & Main St 0 748
Astoria Bl & 31st St 301 196
Northern Bl & Main St 37 190
Astoria Bl & 21st St 139 13
Astoria Bl & 37th St 88 39
Q19 ‐Westbound Ons Offs
Hoyt Av & 31st St 55 538
Roosevelt Av & Main St 528 0
Main St & Northern Bl 279 65
Astoria Bl & 31st Dr 98 88
Astoria Bl & 82nd St 67 80

, Metropolitan Transportation Authority
B‐9
Q20A/Q20B ‐ Main Street/Union Street/20 Avenue or 14 Avenue The Q20A and Q20B provide local service for the Q44 Limited. The routes operate between Archer Avenue/Merrick Boulevard in Jamaica and 15th Avenue/College Point Boulevard in College Point. In College Point, the Q20A operates via 20th Avenue and the Q20B operates via 14th Avenue. The Q20B does not operate on Saturday or Sunday.
Neighborhoods Served: Jamaica, Kew Gardens Hills, Flushing, and College Point.
Service Details and Ridership:
Ridership History: Between 2009 and 2014, there was a 1.8 decrease in average weekday ridership, a 7.4 percent decrease in average Saturday ridership and a 1.1 percent decrease in average Sunday ridership on the routes.
Bus Stops: Below is a list of the five highest ridership bus stops by direction for the route on an average weekday.
Transfers: On an average weekday, the most popular bus transfers were between the Q20A/B and the Q44 (524), Q46 (221), Q58 (146), Q27 (123), and Q65 (120). There were 1,883 transfers between the Q20A/B and the 7 train at Flushing‐Main Street Station and 189 transfers between the Q20A/B and the E, J, and Z trains at Sutphin Boulevard‐Archer Avenue‐JFK Airport Station.
13,000
13,400
13,800
14,200
14,600
15,000
2009 2010 2011 2012 2013 2014
Average Weekday
7,000
7,400
7,800
8,200
8,600
9,000
2009 2010 2011 2012 2013 2014
Average Saturday
6,000
6,400
6,800
7,200
7,600
8,000
2009 2010 2011 2012 2013 2014
Average Sunday
Q20A/Q20B – Service Details Weekday Saturday Sunday
Span 5:05AM – 10:55PM 6:40AM – 10:40PM 6:49AM – 11:15PM
Frequency(combined weekday headway, in minutes)
Peak: AM ‐ 9/PM ‐10Off‐Peak: Noon ‐ 12/Eve ‐ 12
Overnight: N/A
Day: 13Overnight: N/A
Day: 14Overnight: N/A
Average Daily Ridership (2014) 13,452 8,081 6,590
Q20A/Q20B ‐ Northbound Ons Offs
Main St & 39th Av 550 1,032
Main St & 38th Av 260 170
Main St & Kissena Bl 147 230
Main St & Northern Bl 143 214
Union St & 26th Av 35 294
Q20A/Q20B ‐ Southbound Ons Offs
Main St & Roosevelt Av 606 692
Main St & 41st Av 382 215
Main St & Horace Harding Exp 86 259
Archer Av & Sutphin Bl 44 244
Main St & Union Tpk 97 167

, Metropolitan Transportation Authority
B‐10
Q25 ‐ 127th Street/Kissena Boulevard/Parsons Boulevard The Q25 operates between Jamaica and College Point. Limited‐stop service is provided on the Q25 route. The Q25 travels primarily on Parsons Boulevard, Kissena Boulevard, Linden Place, and 127th Street.
Neighborhoods Served: College Point, Flushing, Kew Gardens Hills, Pomonock, and Jamaica.
Service Details and Ridership:
Ridership History: Between 2009 and 2014, there was a 17.6 percent increase in average weekday ridership, a 19.1 percent increase in average Saturday ridership, and a 25.4 percent increase in average Sunday ridership on the route.
Bus Stops: Below is a list of the five highest ridership bus stops by direction for the route on an average weekday.
Transfers: On an average weekday, the most popular Q25 bus to bus transfers were between the Q25 and the Q34 (278), Q27 (265), Q17 (258), Q65 (206), and Q46 (203). There were 3,447 transfers between the Q25 and the 7 train at Flushing‐Main St Station, 452 transfers between the Q25 and the F train at Parsons Blvd Station, and 429 transfers between the Q25 and the E, J, and Z trains at Jamaica Center‐Parsons‐Archer Station on an average weekday.
16,000
17,000
18,000
19,000
20,000
2009 2010 2011 2012 2013 2014
Average Weekday
10,000
11,000
12,000
13,000
14,000
2009 2010 2011 2012 2013 2014
Average Saturday
7,000
8,000
9,000
10,000
11,000
2009 2010 2011 2012 2013 2014
Average Sunday
Q25 – Service Details Weekday Saturday Sunday
Span 24 Hours 24 Hours 24 Hours
Frequency (combined Local and Limited during peak hours in peak direction of travel, in minutes)
Peak: AM ‐ 4/PM ‐ 4Off‐Peak: Noon ‐ 12/Eve ‐ 18
Overnight: 60
Day: 12Overnight: 60
Day: 16Overnight: 60
Average Daily Ridership (2014) 19,567 13,359 10,255
Q25 ‐ Northbound Ons Offs
Main St & Roosevelt Av 2,372 3,639
Archer Av & Bay H 1,265 48
Kissena Bl & Sanford Av 517 781
Sutphin Bl & 94th Av 1,225 0
Parsons Bl & 88th Av 925 252
Q25 ‐ Southbound Ons Offs
Main St & 40th Rd 2,026 2,442
Parsons Bl & Hillside Av 264 1,300
Parsons Bl & Jamaica Av 131 1,414
Jamaica Av & 153rd St 171 1,219
Kissena Bl & Jewel Av 428 511

, Metropolitan Transportation Authority
B‐11
Q26 ‐ 46 Avenue/Hollis Court Boulevard The Q26 operates between the Flushing‐Main Street 7 Station in Flushing and Francis Lewis Boulevard/Hollis Court
Boulevard in Fresh Meadows on weekdays during peak periods only. Neighborhoods Served: Fresh Meadows, Auburndale, and Flushing.
Service Details and Ridership:
Ridership History: Between 2009 and 2014, there was a 29.4 percent decrease in average weekday ridership on the route.
Bus Stops: Below is a list of the five highest ridership bus stops by direction for the route on an average weekday.
Transfers: On an average weekday, the most popular bus transfers for the route were between the Q26 and the Q27 (25), Q65 (12), Q44 (8), Q31 (8), and Q25 (8). There were 711 transfers between the Q26 and the 7 train at Flushing‐Main Street Station.
1,400
1,600
1,800
2,000
2,200
2,400
2009 2010 2011 2012 2013 2014
Average Weekday
Q26 – Service Details Weekday Saturday Sunday
Span 5:50AM – 8:53AM/3:17PM – 8:07PM N/A N/A
Frequency(in minutes)
Peak: AM ‐ 9/PM ‐ 15Off‐Peak: Noon ‐ N/A / Eve ‐ 24
Overnight: N/A
Day: N/AOvernight: N/A
Day: N/AOvernight: N/A
Average Daily Ridership (2014) 1,438 N/A N/A
Q26 ‐ Eastbound Ons Offs
Roosevelt Av & Bowne St 408 29
Roosevelt Av & Union St 180 0
Bowne St & 41st Av 20 84
Francis Lewis Bl & 58th Av 0 103
Hollis Court Bl & 56th Av 3 50
Q26 ‐Westbound Ons Offs
Hollis Court Bl & Francis Lewis Bl 113 0
46th Av & 163rd St 88 8
Hollis Court Bl & 56th Av 64 1
Hollis Court Bl & 47th Av 59 1
Bowne St & Sanford Av 41 13
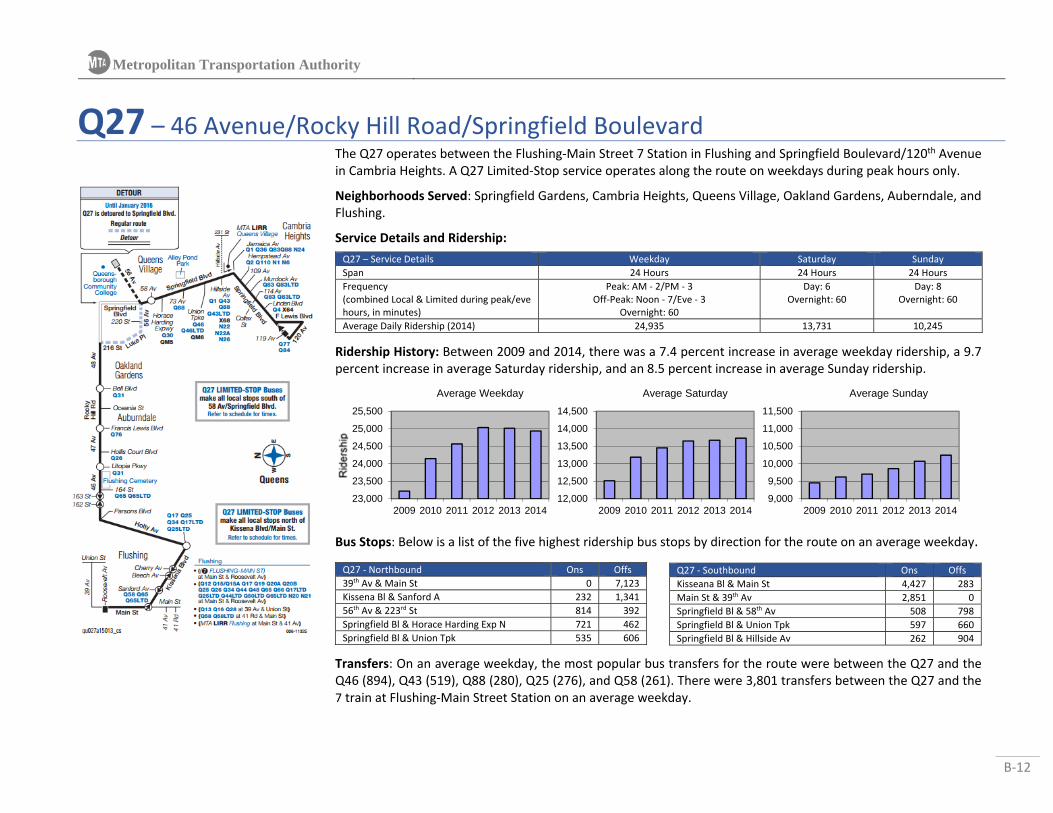
, Metropolitan Transportation Authority
B‐12
Q27 – 46 Avenue/Rocky Hill Road/Springfield Boulevard The Q27 operates between the Flushing‐Main Street 7 Station in Flushing and Springfield Boulevard/120th Avenue in Cambria Heights. A Q27 Limited‐Stop service operates along the route on weekdays during peak hours only.
Neighborhoods Served: Springfield Gardens, Cambria Heights, Queens Village, Oakland Gardens, Auberndale, and Flushing.
Service Details and Ridership:
Ridership History: Between 2009 and 2014, there was a 7.4 percent increase in average weekday ridership, a 9.7 percent increase in average Saturday ridership, and an 8.5 percent increase in average Sunday ridership.
Bus Stops: Below is a list of the five highest ridership bus stops by direction for the route on an average weekday.
Transfers: On an average weekday, the most popular bus transfers for the route were between the Q27 and the Q46 (894), Q43 (519), Q88 (280), Q25 (276), and Q58 (261). There were 3,801 transfers between the Q27 and the 7 train at Flushing‐Main Street Station on an average weekday.
23,000
23,500
24,000
24,500
25,000
25,500
2009 2010 2011 2012 2013 2014
Average Weekday
12,000
12,500
13,000
13,500
14,000
14,500
2009 2010 2011 2012 2013 2014
Average Saturday
9,000
9,500
10,000
10,500
11,000
11,500
2009 2010 2011 2012 2013 2014
Average Sunday
Q27 – Service Details Weekday Saturday Sunday
Span 24 Hours 24 Hours 24 Hours
Frequency(combined Local & Limited during peak/eve hours, in minutes)
Peak: AM ‐ 2/PM ‐ 3Off‐Peak: Noon ‐ 7/Eve ‐ 3
Overnight: 60
Day: 6Overnight: 60
Day: 8Overnight: 60
Average Daily Ridership (2014) 24,935 13,731 10,245
Q27 ‐ Northbound Ons Offs
39th Av & Main St 0 7,123
Kissena Bl & Sanford A 232 1,341
56th Av & 223rd St 814 392
Springfield Bl & Horace Harding Exp N 721 462
Springfield Bl & Union Tpk 535 606
Q27 ‐ Southbound Ons Offs
Kisseana Bl & Main St 4,427 283
Main St & 39th Av 2,851 0
Springfield Bl & 58th Av 508 798
Springfield Bl & Union Tpk 597 660
Springfield Bl & Hillside Av 262 904

, Metropolitan Transportation Authority
B‐13
Q28 ‐ Northern Boulevard/32 Avenue The Q28 operates between the Flushing‐Main Street 7 Station in Flushing and Bell Boulevard/23rd Avenue in Bay Terrace.
Neighborhoods Served: Bay Terrace, Auberndale, and Flushing.
Service Details and Ridership:
Ridership History: Between 2009 and 2014, there was a 1.6 percent decrease in average weekday ridership, a 5.4 percent increase in average Saturday ridership and a 4.9 percent increase in average Sunday ridership on the route.
Bus Stops: Below is a list of the five highest ridership bus stops by direction for the route on an average weekday.
Transfers: On an average weekday, the most popular bus transfers for the route were between the Q28 and the Q13 (229), Q25 (126), Q44 (124), Q76 (119), and Q65 (115). There were 2,480 transfers between the Q28 and the 7 train at Flushing‐Main Street 7 Station on an average weekday.
9,500
9,700
9,900
10,100
10,300
10,500
2009 2010 2011 2012 2013 2014
Average Weekday
5,000
5,200
5,400
5,600
5,800
6,000
2009 2010 2011 2012 2013 2014
Average Saturday
4,000
4,200
4,400
4,600
4,800
5,000
2009 2010 2011 2012 2013 2014
Average Sunday
Q28 – Service Details Weekday Saturday Sunday
Span 24 Hours 24 Hours 24 Hours
Frequency(in minutes)
Peak: AM ‐ 5/PM ‐ 8Off‐Peak: Noon ‐ 12/Eve ‐ 8
Overnight: 60
Day: 11Overnight: 60
Day: 12Overnight: 60
Average Daily Ridership (2014) 9,905 5,807 4,452
Q28 ‐ Eastbound Ons Offs
39th Av & 138th St 3,779 0
Northern Bl & Union St 541 600
Corporal Kennedy St & 32nd Av 26 508
23rd Av & Bell Bl 0 298
Francis Lewis Bl & 34th Av 51 219
Q28 ‐Westbound Ons Offs
39th Av & 139th St 0 4,670
Corporal Kennedy St & 32nd Av 625 25
Union St & Northern Bl 236 356
Northern Bl & 150th St 213 82
Northern Bl & 147th St 240 49

, Metropolitan Transportation Authority
B‐14
Q30 ‐ Utopia Parkway/Horace Harding Expressway The Q30 operates between Sutphin Boulevard/Archer Avenue in Jamaica and Horace Harding Expressway/Little Neck Parkway in Little Neck. Select trips on weekdays during peak, noon and evening hours operate between Jamaica LIRR Station and Queensborough Community College only.
Neighborhoods Served: Little Neck, Fresh Meadows, Utopia, Hillcrest, Jamaica Estates and Jamaica.
Service Details and Ridership:
Ridership History: Between 2009 and 2014, there was a 5.6 percent increase in average weekday ridership, a 10.4 percent increase in average Saturday ridership and an 11.9 percent increase in average Sunday ridership.
Bus Stops: Below is a list of the five highest ridership bus stops by direction for the route on an average weekday.
Transfers: On an average weekday, the most popular bus transfers for the route were between the Q30 and the Q17 (282), Q88 (282), Q27 (281), Q46 (239), and Q111 (129). There were 1,028 transfers between the Q30 and the 7 train at Flushing‐Main Street Station and 499 daily transfers between the Q30 and the E, J, and Z trains at Sutphin Boulevard‐Archer Avenue‐JFK Airport Station.
9,000
9,300
9,600
9,900
10,200
10,500
2009 2010 2011 2012 2013 2014
Average Weekday
3,000
3,300
3,600
3,900
4,200
4,500
2009 2010 2011 2012 2013 2014
Average Saturday
2,000
2,300
2,600
2,900
3,200
3,500
2009 2010 2011 2012 2013 2014
Average Sunday
Q30 – Service Details Weekday Saturday Sunday
Span 4:54AM – 12:30AM 4:56AM – 12:30AM 4:56AM – 12:30AM
Frequency(in minutes)
Peak: AM ‐ 15/PM ‐ 16Off‐Peak: Noon ‐ 16/Eve ‐ 12
Overnight: N/A
Day: 16Overnight: N/A
Day: 20Overnight: N/A
Average Daily Ridership (2014) 10,155 4,004 2,613
Q30 ‐ Eastbound Ons Offs
Archer Av & Sutphin Bl 1,700 0
Hillside Av & Homelawn St 1,042 268
56th Av & 223rd St 0 747
Horace Harding Exp & Springfield Bl 209 509
Archer Av & 158th St 563 140
Q30 ‐Westbound Ons Offs
169th St & Hillside Av 189 1,522
Jamaica Av & Parsons Bl 62 1,338
Horace Harding Exp & Springfield Bl 702 163
56th Av & 223rd St 832 0
Archer Av & Sutphin Pl 0 625

, Metropolitan Transportation Authority
B‐15
Q31 ‐ Utopia Parkway/Bell Boulevard The Q31 operates between Sutphin Boulevard/Archer Avenue in Jamaica and 27th Avenue/Francis Lewis Boulevard in Bayside. Weekend service on the route was discontinued in June 2010 and restored in April 2014.
Neighborhoods Served: Jamaica, Jamaica Estates, Hillcrest, Utopia, Auburndale, and Bayside.
Service Details and Ridership:
Ridership History: Between 2009 and 2014, there was an 8.3 percent decrease in average weekday ridership, a 20.1 percent decrease in average Saturday ridership and a 15.5 percent decrease in average Sunday ridership on the route. (Note: Average Saturday and Sunday ridership for 2014 only includes average for dates after 4/16/2014.)
Bus Stops: Below is a list of the five highest ridership bus stops by direction for the route on an average weekday.
Transfers: On an average weekday, the most popular bus transfers for the route were between the Q31 and the Q27 (323), Q46 (176), Q13 (139), Q31 (116), and Q12 (95). There were 403 transfers between the Q31 and the F train at 169th Street Station and 166 transfers between the Q31 and the E, J, and Z trains at Jamaica Center‐Parsons‐Archer Station on an average weekday.
5,000
5,300
5,600
5,900
6,200
6,500
2009 2010 2011 2012 2013 2014
Average Weekday
0
300
600
900
1,200
1,500
2009 2010 2011 2012 2013 2014
Average Saturday
0
300
600
900
1200
1500
2009 2010 2011 2012 2013 2014
Average Sunday
Q31 – Service Details Weekday Saturday Sunday
Span 5:40AM – 11:35PM 8:20AM – 8:00PM 9:10AM – 7:30PM
Frequency(in minutes)
Peak: AM ‐ 6/PM ‐ 13Off‐Peak: Noon ‐ 20/Eve ‐ 20
Overnight: N/A
Day: 35Overnight: N/A
Day: 35Overnight: N/A
Average Daily Ridership (2014) 5,709 1,150 756
Q31 ‐ Northbound Ons Offs
Hillside Av & Homelawn St 492 171
Archer Av & Sutphin Bl 619 0
Utopia Pky & Horace Harding Exp 224 230
Utopia Pky & Union St 160 156
Archer Av & 158th St 246 58
Q31 ‐ Southbound Ons Offs
169th St & Hillside Av 110 678
Jamaica Av & Parsons Bl 29 637
Utopia Pky & Horace Harding Exp 174 207
Archer Av & Sutphin Bl 0 351
Utopia Pky & Union Tpk 123 144

, Metropolitan Transportation Authority
B‐16
Q34 ‐ Willets Point Blvd/Kissena Blvd/Parsons Blvd The Q34 operates between Jamaica and Whitestone primarily via Parsons Boulevard, Kissena Boulevard, and
Willets Point Boulevard. The route operates on weekdays only.
Neighborhoods Served: Whitestone, Flushing, and Jamaica.
Service Details and Ridership:
Ridership History: Between 2009 and 2014, there was a 6.0 percent increase in average weekday ridership on the route.
Bus Stops: Below is a list of the five highest ridership bus stops by direction for the route on an average weekday.
Transfers: On an average weekday, the most popular Q34 bus to bus transfers were between the Q34 and the Q25 (269), Q17 (114), Q27 (103), Q46 (79), Q65 (73). There were 1,252 transfers between the Q34 and the 7 train at Flushing‐Main St Station, 163 transfers between the Q34 and the F train at Parsons Blvd Station, and 141 transfers between the Q34 and E, J, and Z trains at Jamaica Center‐Parsons‐Archer Station on an average weekday.
6,500
6,700
6,900
7,100
7,300
2009 2010 2011 2012 2013 2014
Average Weekday
Q34 – Service Details Weekday Saturday Sunday
Span 5:28AM – 9:17PM N/A N/A
Frequency (in minutes)
Peak: AM ‐ 10/PM ‐ 10Off‐Peak: Noon ‐ 12/Eve ‐ 15
Overnight: N/A
Day: N/AOvernight: N/A
Day: N/AOvernight: N/A
Average Daily Ridership (2014) 7,218 N/A N/A
Q34 ‐ Northbound Ons Offs
Main St & Roosevelt Av 753 1,324
Main St & Northern Bl 207 371
Union St & 26th Av 43 419
Kissena Bl & Sanford Av 109 310
Sutphin Bl & 94th St 409 0
Q34 ‐ Southbound Ons Offs
Main St & 40th Rd 633 1,022
Parsons Bl & Jamaica Av 52 485
Parsons Bl & Hillside Av 80 442
Jamaica Av & 153rd St 73 428
Main St & Northern Bl 303 79

, Metropolitan Transportation Authority
B‐17
Q36 ‐ Hillside/Jamaica Avenues The Q36 operates between the 165th Street Bus Terminal in Jamaica and Jamaica Avenue/257th Street in Floral Park or the Little Neck Station LIRR Station. Limited‐stop service is provided on weekdays during peak hours only between the 165th Street Bus Terminal in Jamaica and Jamaica Avenue/257th Street in Floral Park.
Neighborhoods Served: Floral Park, Queens Village, Jamaica Estates, and Jamaica.
Service Details and Ridership:
Ridership History: Between 2009 and 2014, there was a 4.4 percent increase in average weekday ridership, an 11.0 percent decrease in average Saturday ridership and an 11.9 percent decrease in average Sunday ridership on the route.
Bus Stops: Below is a list of the five highest ridership bus stops by direction for the route on an average weekday.
Transfers: On an average weekday, the most popular bus transfers for the route were between the Q36 and the Q27 (100), Q43 (98), Q110 (64), Q1 (54), and Q17 (48). There were 1,431 transfers between the Q36 and the F train at Jamaica‐179th Street Station on an average weekday.
5,000
5,200
5,400
5,600
5,800
6,000
2009 2010 2011 2012 2013 2014
Average Weekday
3,000
3,200
3,400
3,600
3,800
4,000
2009 2010 2011 2012 2013 2014
Average Saturday
2,000
2,200
2,400
2,600
2,800
3,000
2009 2010 2011 2012 2013 2014
Average Sunday
Q36 – Service Details Weekday Saturday Sunday
Span 24 Hours 24 Hours 24 Hours
Frequency(combined Local & Limited during peak hours, in minutes)
Peak: AM ‐ 5/PM ‐ 5Off‐Peak: Noon ‐ 17/Eve ‐ 12
Overnight: 60
Day: 16Overnight: 60
Day: 21Overnight: 60
Average Daily Ridership (2014) 5,874 3,166 2,266
Q36 ‐ Eastbound Ons Offs
Hillside Av & 180th St 790 113
Hillside Av & 168th Pl 824 22
165th St Terminal & 165th St Terminal, Bay 6 403 0
Hillside Av & 187th Pl 171 162
Hillside Av 212th St 40 287
Q36 ‐Westbound Ons Offs
Hillside Av & 179th St F Station 43 1,865
165th St & 165th St Terminal 0 547
Jamaica Av & Springfield Bl 251 87
Hillside Av & 212th St 210 38
Jamaica Av & 212th Pl 188 58

, Metropolitan Transportation Authority
B‐18
Q43 ‐ Hillside Avenue The Q43 operates between the Supthin Boulevard‐Archer Avenue E, J and Z Station and the LIRR Jamaica Station in Jamaica and Hillside Avenue/268th Street in Floral Park. Limited‐stop service is provided along the route on weekdays during peak and evening hours.
Neighborhoods Served: Floral Park, Queens Village, Jamaica Estates, Jamaica, and Kew Gardens.
Service Details and Ridership:
Ridership History: Between 2009 and 2014, there was a 5.1 percent decrease in average weekday ridership, a 6.3 percent increase in average Saturday ridership, and a 0.3 percent decrease in average Sunday ridership on the route.
Bus Stops: Below is a list of the five highest ridership bus stops by direction for the route on an average weekday.
Transfers: On an average weekday, the most popular bus transfers for the route were between the Q43 and the Q27 (453), Q111 (190), Q1 (184), Q77 (156), and the Q65 (153). There were 2,545 transfers between the Q43 and the F train at Jamaica‐179th Street Station.
15,300
15,500
15,700
15,900
16,100
16,300
2009 2010 2011 2012 2013 2014
Average Weekday
7,500
7,700
7,900
8,100
8,300
8,500
2009 2010 2011 2012 2013 2014
Average Saturday
5,500
5,700
5,900
6,100
6,300
6,500
2009 2010 2011 2012 2013 2014
Average Sunday
Q43 – Service Details Weekday Saturday Sunday
Span 24 Hours 24 Hours 24 Hours
Frequency(combined Local & Limited during peak and evening hours, in minutes)
Peak: AM ‐ 2/PM ‐ 3Off‐Peak: Noon ‐ 8/Eve ‐ 4
Overnight: 48
Day: 11Overnight: 48
Day: 14Overnight: 48
Average Daily Ridership (2014) 15,368 8,209 5,810
Q43 ‐ Eastbound Ons Offs
Hillside Av & 179th Pl 1,372 305
Archer Av & Sutphin Bl 1,295 0
Hillside Av & Parsons Bl 734 277
Hillside Av & Springfield Bl 337 576
Hillside Av & 231st St 98 750
Q43 ‐Westbound Ons Offs
Hillside Av & 179th St Subway 316 1,113
Sutphin Bl & Jamaica Av 0 889
Hillside Av & Springfield Bl 621 201
Hillside Av & Parsons Av 105 499
Hillside Av & Francis Lewis Bl 330 234

, Metropolitan Transportation Authority
B‐19
Q44 ‐ Main Street/Cross Bronx Service Road/Limited The Q44 Limited operates between Archer Avenue/Merrick Boulevard in Jamaica and Devoe Avenue/East 180th Street, Bronx Zoo in West Farms, Bronx. During late night and early morning periods, the Q44 makes all local stops between Jamaica and the Bronx. At other times, the Q44 makes only limited stops in Queens.
Neighborhoods Served: Jamaica, Kew Gardens, Kew Gardens Hills, Flushing, Whitestone, Unionport, Parkchester, and West Farms.
Service Details and Ridership:
Ridership History: Between 2009 and 2014, there was an 11.6 percent increase in average weekday ridership, a 10.7 percent increase in average Saturday ridership and a 13.2 percent increase in average Sunday ridership.
Bus Stops: Below is a list of the five highest ridership bus stops by direction for the route on an average weekday.
Transfers: On an average weekday, the most popular bus transfers for the route were between the Q44 and the Q20B (639), Q46 (350), Bx9 (314), Bx36 (277), and Q58 (272). There are 3,044 transfers between the Q44 and the 7 train at Flushing‐Main Street Station on an average weekday.
25,000
26,000
27,000
28,000
29,000
30,000
2009 2010 2011 2012 2013 2014
Average Weekday
17,000
18,000
19,000
20,000
21,000
22,000
2009 2010 2011 2012 2013 2014
Average Saturday
15,000
16,000
17,000
18,000
19,000
20,000
2009 2010 2011 2012 2013 2014
Average Sunday
Q44 – Service Details Weekday Saturday Sunday
Span 24 Hours 24 Hours 24 Hours
Frequency(in minutes)
Peak: AM ‐ 4/PM ‐ 5Off‐Peak: Noon ‐ 8/Eve ‐ 6
Overnight: 30
Day: 7Overnight: 30
Day: 8Overnight: 30
Average Daily Ridership (2014) 28,139 20,044 18,024
Q44 ‐ Northbound Ons Offs
Main St & 39th St 1,531 3,409
Hugh Grant Cir & Metropolitan Av 357 1,748
Archer Av & Sutphin Bl 1,361 86
Main St & Kissena Bl 533 893
Main St & 38th Av 971 428
Q44 ‐ Southbound Ons Offs
Main St & Roosevelt Av 2,260 2,322
Westchester Av & Virginia Av 1,691 340
Main St & 41st Av 1,171 800
E Tremont Av & Boston Rd 1,344 35
Main St & Horace Harding Exp N 328 959

, Metropolitan Transportation Authority
B‐20
Q46 ‐ Union Turnpike The Q46 operates between the Kew Gardens‐Union Turnpike E, F Station and Lakeville Road/Long Island Jewish Hospital in Lake Success or 260th Street/Little Neck Parkway in Glen Oaks. Limited‐stop service is provided on the route on weekdays during peak and evening hours.
Neighborhoods Served: Glen Oaks, Bellerose, Oakland Gardens, Fresh Meadows, Hillcrest, and Kew Gardens.
Service Details and Ridership:
Ridership History: Between 2009 and 2014, there was a 2.6 percent increase in average weekday ridership, a 1.5 percent decrease in average Saturday ridership and a 4.3 percent increase in average Sunday ridership on the route.
Bus Stops: Below is a list of the five highest ridership bus stops by direction for the route on an average weekday.
Transfers: On an average weekday, the most popular bus transfers for the route were between the Q46 and the Q27 (867), Q46 (757), Q17 (327), Q44 (291), and Q10 (263). There were 6,321 transfers between the Q46 and the E and F trains at Kew Gardens‐Union Turnpike Station.
21,500
21,800
22,100
22,400
22,700
23,000
2009 2010 2011 2012 2013 2014
Average Weekday
9,500
9,800
10,100
10,400
10,700
11,000
2009 2010 2011 2012 2013 2014
Average Saturday
7,000
7,300
7,600
7,900
8,200
8,500
2009 2010 2011 2012 2013 2014
Average Sunday
Q46 – Service Details Weekday Saturday Sunday
Span 24 Hours 24 Hours 24 Hours
Frequency(combined Local & Limited during peak and evening hours, in minutes)
Peak: AM ‐ 2/PM ‐ 2Off‐Peak: Noon ‐ 5/Eve ‐ 2
Overnight: 60
Day: 8Overnight: 60
Day: 11Overnight: 60
Average Daily Ridership (2014) 22,196 9,732 7,676
Q46 ‐ Eastbound Ons Offs
Queens Bl & 78th Av 6,697 0
Union Tpk & Queens Bl 1,902 851
Union Tpk & Springfield Bl 830 709
Union Tpk & Utopia Pky 325 1,193
Union Tpk & Parsons Bl 371 738
Q46 ‐Westbound Ons Offs
Queens Bl & 78th Cr 0 8,885
Union Tpk & Springfield Bl 515 828
Union Tpk & Utopia Pky 849 288
Union Tpk & Main St 575 481
Union Tpk & Parsons Bl 645 367

, Metropolitan Transportation Authority
B‐21
Q48 ‐ Roosevelt Avenue/Ditmars Boulevard/LaGuardia Airport The Q48 operates between Flushing‐Main Street 7 Subway Station/LIRR Flushing Station in Flushing and LaGuardia Airport, all terminals.
Neighborhoods Served: Flushing, Corona, and East Elmhurst.
Service Details and Ridership:
Ridership History: Between 2009 and 2014, there was a 2.7 percent decrease in average weekday ridership, a 7.6 percent increase in average Saturday ridership and a 10.9 percent increase in average Sunday ridership on the route.
Bus Stops: Below is a list of the five highest ridership bus stops by direction for the route on an average weekday.
Transfers: On an average weekday, the most popular bus transfers for the route were between the Q48 and the Q27 (72), Q44 (66), Q25 (53), Q65 (47), and the Q17 (42). There are 201 daily transfers between the Q48 at the 7 train at 111th Street Station on an average weekday.
2,500
2,600
2,700
2,800
2,900
3,000
2009 2010 2011 2012 2013 2014
Average Weekday
2,000
2,100
2,200
2,300
2,400
2,500
2009 2010 2011 2012 2013 2014
Average Saturday
1,500
1,600
1,700
1,800
1,900
2,000
2009 2010 2011 2012 2013 2014
Average Sunday
Q48 – Service Details Weekday Saturday Sunday
Span 4:30AM ‐ 1:49AM 4:30AM ‐ 1:49AM 4:31AM ‐ 12:16AM
Frequency(in minutes)
Peak: AM ‐ 15/PM ‐ 16Off‐Peak: Noon ‐ 20/Eve ‐ 17
Overnight: N/A
Day: 20Overnight: N/A
Day: 25Overnight: N/A
Average Daily Ridership (2014) 2,673 2,330 1,881
Q48 ‐ Eastbound Ons Offs
Roosevelt Av & 111th St 233 244
Roosevelt Av & Main St 6 780
108th St & 38th Av 107 34
108th St & Northern Bl 116 12
Roosevelt Av & 108th St 70 15
Q48 ‐Westbound Ons Offs
Roosevelt Av & Main St 612 0
Roosevelt Av & 111th St 115 241
LGA Internal Rd & Terminal B 102 239
Roosevelt Av & College Point Bl 284 15
Roosevelt Av & Mets‐Willets Point Station 256 18

, Metropolitan Transportation Authority
B‐22
Q50 ‐ Flushing/Pelham Bay/Coop City Limited The Q50 operates between Co‐Op City in the Bronx and Flushing. Limited‐stop service is exclusively operated on the route. The Q50 travels primarily on Main Street, Linden Place, Whitestone Expressway, and Bruckner Boulevard.
Neighborhoods Served: Flushing, College Point, Whitestone, Pelham Bay (Bronx), and Co‐op City (Bronx).
Service Details and Ridership:
Ridership History: Q50 service began was implemented in September 2010. Between 2010 and 2014, average weekday ridership increased by 353.4 percent, average Saturday ridership increased by 406.2 percent, and average Sunday ridership increased by 368.1 percent on the route.
Bus Stops: Below is a list of the five highest ridership bus stops by direction for the route on an average weekday.
Transfers: On an average weekday, the most popular Q50 bus to bus transfers were between the Q50 and the Bx12‐SBS (237), Q44 (120), Bx12 (86), Bx30 (74), and Q27 (72). There were 571 transfers between the Q50 and the 6 train at Pelham Bay Park Station, and 397 transfers between the Q50 and the 7 train at Flushing‐Main St Station on an average weekday.
-
1,000
2,000
3,000
4,000
5,000
2009 2010 2011 2012 2013 2014
Average Weekday
-
1,000
2,000
3,000
4,000
5,000
2009 2010 2011 2012 2013 2014
Average Saturday
-
1,000
2,000
3,000
4,000
5,000
2009 2010 2011 2012 2013 2014
Average Sunday
Q50 – Service Details Weekday Saturday Sunday
Span 4:25AM ‐ 1:15AM 5:05AM ‐ 1:05AM 5:05AM ‐ 1:05AM
Frequency (in minutes)
Peak: AM ‐ 15/PM ‐ 15Off‐Peak: Noon ‐ 30/Eve ‐ 30
Overnight: N/A
Day: 30Overnight: N/A
Day: 30Overnight: N/A
Average Daily Ridership (2014) 4,349 2,760 2,187
Q50 ‐ Northbound Ons Offs
Bruckner Bl & Wilkinson Av 529 503
Roosevelt Bl & Main St 749 0
Bruckner Bl & Tremont Av 154 165
Main St & Northern Bl 262 42
Baychester Av & IFO PC Richards 33 194
Q50 ‐ Southbound Ons Offs
39th Av & Main St 0 1,122
Bruckner Bl & Wilkinson Av 478 622
Bruckner Bl & Tremont Av 158 115
Edson Av & Bartow Av 182 67
Baychester Av & Darrow Pl 221 18

, Metropolitan Transportation Authority
B‐23
Q58 ‐ Fresh Pond Rd/Corona Av The Q58 operates between Ridgewood/Myrtle‐Wyckoff Avenues L and M Station in Ridgewood and Main Street/ 41st Road in Flushing. Limited‐stop service is provided along the route on weekdays, Saturday and Sunday. Limited‐stop service does not operate overnight.
Neighborhoods Served: Flushing, Elmhurst, Ridgewood, and Bushwick.
Service Details and Ridership:
Ridership History: Between 2009 and 2014, there was a 7.3 percent increase in average weekday ridership, a 4.9 percent increase in average Saturday ridership, and an 11.1 percent increase in average Sunday ridership.
Bus Stops: Below is a list of the five highest ridership bus stops by direction for the route on an average weekday.
Transfers: On an average weekday, the most popular bus transfers for the route were between the Q58 and the Q23 (306), Q53 (287), Q44 (255), Q59 (254), and the Q27 (254). There were 3,857 transfers between the Q58 and the M and R trains at Grand Avenue‐Newtown Station, and 542 transfers to the L and M trains at Myrtle‐Wyckoff Avenues Station on an average weekday.
26,000
27,000
28,000
29,000
30,000
2009 2010 2011 2012 2013 2014
Average Weekday
21,000
22,000
23,000
24,000
25,000
2009 2010 2011 2012 2013 2014
Average Saturday
17,000
18,000
19,000
20,000
21,000
2009 2010 2011 2012 2013 2014
Average Sunday
Q58 – Service Details Weekday Saturday Sunday
Span 24 Hours 24 Hours 24 Hours
Frequency (combined Local & Limited during peak, noon and evening hours on weekdays and day hours on Saturday and Sunday, in minutes)
Peak: AM ‐ 4/PM ‐ 4Off‐Peak: Noon ‐ 4/Eve ‐ 4
Overnight: 60
Day: 4Overnight: 60
Day: 5Overnight: 60
Average Daily Ridership (2014) 29,464 22,717 19,201
Q58 ‐ Eastbound Ons Offs
Broadway & Justice Av 2,139 3,531
41st Rd &Main St 0 4,805
Palmetto St & Myrtle Av 1,868 0
108th St & Horace Harding Exp 651 760
Corona Av & Junction Bl 464 906
Q58 ‐Westbound Ons Offs
Broadway & Queens Bl 3,097 2,806
41st Rd & Main St 4,236 0
Palmetto Av & St. Nicholas Av 0 1,901
Putnam Av & Fresh Pond Rd 238 1,182
Grand Av & 69th St 316 1,006

, Metropolitan Transportation Authority
B‐24
Q64 ‐ Jewel Avenue The Q64 operates between Electchester and Forest Hills primarily via Jewel Avenue.
Neighborhoods Served: Electchester, Kew Gardens Hills, and Forest Hills.
Service Details and Ridership:
Ridership History: Between 2009 and 2014, there was a 5.5 percent increase in average weekday ridership, a 10.7 percent increase in average Saturday ridership, and a 15.0 percent increase in average Sunday ridership on the route.
Bus Stops: Below is a list of the five highest ridership bus stops by direction for the route on an average weekday.
Transfers: On an average weekday, the most popular Q64 bus to bus transfers were between the Q64 and the Q44 (160), Q20B (118), Q25 (94), Q23 (93), and Q60 (89). There were 4,149 transfers between the Q64 and the E, F, M, and R trains at Forest Hills‐71 Av Station on an average weekday.
9,500
9,700
9,900
10,100
10,300
10,500
2009 2010 2011 2012 2013 2014
Average Weekday
3,500
3,700
3,900
4,100
4,300
4,500
2009 2010 2011 2012 2013 2014
Average Saturday
3,000
3,200
3,400
3,600
3,800
2009 2010 2011 2012 2013 2014
Average Sunday
Q64 ‐ Service Details Weekday Saturday Sunday
Span 24 Hours 24 Hours 24 Hours
Frequency (in minutes)
Peak: AM ‐ 4/PM ‐ 3Off‐Peak: Noon ‐ 10/Eve ‐ 6
Overnight: 30
Day: 13Overnight: 30
Day: 14Overnight: 30
Average Daily Ridership (2014) 10,253 4,018 3,696
Q64 ‐ Eastbound Ons Offs
Queens Bl & 70th Rd 4,107 75
Jewel Av & 108th St 776 489
Jewel Av & 164th St 0 966
Jewel Av & Kissena Bl 39 769
Jewel Av & Main St 110 595
Q64 ‐Westbound Ons Offs
108th St & Queens Bl 0 4,958
Jewel Av & 164th St 793 0
Jewel Av Kissena Bl 691 31
Jewel Av & Main St 541 110
Jewel Av & Parsons Bl 546 10

, Metropolitan Transportation Authority
B‐25
Q65 ‐ College Point Boulevard/164th Street The Q65 operates between Jamaica and College Point. Limited‐stop service is provided on the route. The Q65 travels primarily on Archer Avenue, Parsons Boulevard, 164th Street, and College Point Boulevard.
Neighborhoods Served: Jamaica, Jamaica Hills, Hillcrest, Kissena Park, Flushing, and College Point.
Service Details and Ridership:
Ridership History: Between 2009 and 2014, there was an 8.1 percent increase in average weekday ridership, a 25.2 percent increase in average Saturday ridership and a 39.7 percent increase in average Sunday ridership on the route.
Bus Stops: Below is a list of the five highest ridership bus stops by direction for the route on an average weekday.
Transfers: On an average weekday, the most popular Q65 bus to bus transfers were between the Q65 and the Q17 (241), Q27 (232), Q25 (220), Q46 (209), and Q88 (160). There were 3,285 transfers between the Q65 and 7 train at Flushing‐Main St Station, 398 transfers between the Q65 and the E, J, and Z trains at Jamaica Center‐Parsons‐Archer Station, 280 transfers between the Q65 and the F train at Parsons Blvd Station, and 61 transfers between the Q65 and E, J, and Z trains at Sutphin Blvd‐Archer Av‐JFK Airport Station on an average weekday.
18,500
19,100
19,700
20,300
20,900
21,500
2009 2010 2011 2012 2013 2014
Average Weekday
8,500
9,100
9,700
10,300
10,900
11,500
2009 2010 2011 2012 2013 2014
Average Saturday
5,500
6,100
6,700
7,300
7,900
8,500
2009 2010 2011 2012 2013 2014
Average Sunday
Q65 ‐ Service Details Weekday Saturday Sunday
Span 24 Hours 24 Hours 24 Hours
Frequency (in minutes)
Peak: AM ‐ 10/PM ‐ 10Off‐Peak: Noon ‐ 10/Eve ‐ 12
Overnight: 60
Day: 12Overnight: 60
Day: 19Overnight: 60
Average Daily Ridership (2014) 20,685 10,970 8,397
Q65 ‐ Northbound Ons Offs
Main St & Roodevelt Av 2,497 3,221
Sutphin Bl & 94th Av 1,476 0
Archer Av & Bay H 1,222 73
Kissena Bl & Sanford Av 487 753
Main St & Northern Bl 416 660
Q65 ‐ Southbound Ons Offs
Main St & Roosevelt Av 2,039 2,833
Parsons Bl & Jamaica Av 115 1,598
Jamaica Av & 153rd St 157 1,317
Parsons Bl & 88th Av 210 1,210
Kissena Bl & Main St 611 467

, Metropolitan Transportation Authority
B‐26
Q66 ‐ Northern Boulevard/Queens Plaza South The Q66 operates between Flushing and Long Island City primarily via Northern Boulevard. Select trips operate between Flushing and Woodside only.
Neighborhoods Served: Flushing, East Elmhurst, Woodside, Astoria, Corona, Jackson Heights, and Long Island City.
Service Details and Ridership:
Ridership History: Between 2009 and 2014, there was a 1.4 percent increase in average weekday ridership, a 0.7 percent increase in average Saturday ridership and a 12.5 percent increase in average Sunday ridership on the route.
Bus Stops: Below is a list of the five highest ridership bus stops by direction for the route on an average weekday.
Transfers: On an average weekday, the most popular Q66 bus to bus transfers were between the Q66 and the Q44 (264), Q27 (197), Q20B (132), Q23 (132), and Q25 (127). There were 1,296 transfers between the M and R trains at Northern Blvd Station, 307 transfers between the Q66 and F train at 21 St‐Queensbridge Station, 195 transfers between the Q66 and the 7 train at Flushing‐Main St 7 Station, and 179 transfers between the Q66 and N, Q, and 7 trains at Queensboro Plaza Station on an average weekday.
12,500
13,000
13,500
14,000
14,500
15,000
2009 2010 2011 2012 2013 2014
Average Weekday
7,500
8,000
8,500
9,000
9,500
10,000
2009 2010 2011 2012 2013 2014
Average Saturday
6,000
6,500
7,000
7,500
8,000
8,500
2009 2010 2011 2012 2013 2014
Average Sunday
Q66 ‐ Service Details Weekday Saturday Sunday
Span 24 Hours 24 Hours 24 Hours
Frequency (in minutes)
Peak: AM ‐ 5/PM ‐ 7Off‐Peak: Noon ‐ 11/Eve ‐ 11
Overnight: 30
Day: 13Overnight: 30
Day: 15Overnight: 30
Average Daily Ridership (2014) 14,105 9,314 8,039
Q66 ‐ Eastbound Ons Offs
39th Av & Main St 0 3,574
Northern Bl & 54th St 1241 162
Northern Bl & 82nd St 375 350
Northern Bl & 89th St 333 308
Queens Plaza N & 21st St 576 14
Q66 ‐Westbound Ons Offs
Roosevelt Av & Main St 2,085 0
21st St & 41st Av 350 1,311
Northern Bl & Broadway 206 971
Main St & Northern Bl 908 205
Northern Bl & 82nd St 397 393

, Metropolitan Transportation Authority
B‐27
Q76 ‐ Francis Lewis Boulevard The Q76 operates between Merrick Boulevard/165th Street Bus Terminal in Jamaica and 20th Avenue/131st Street in College Point. Saturday service was discontinued in June 2010 and restored in September 2012. Sunday service was introduced on the route in September 2012.
Neighborhoods Served: Jamaica, Jamaica Estates, Fresh Meadows, Beechhurst, and College Point.
Service Details and Ridership:
Ridership History: Between 2009 and 2014, there was a 0.7 percent increase in average weekday ridership, a 10.4 percent increase in average Saturday ridership. Sunday service was not provided in 2009.
Bus Stops: Below is a list of the five highest ridership bus stops by direction for the route on an average weekday.
Transfers: On an average weekday, the most popular bus transfers for the route were between the Q76 and the Q46 (227), Q77 (171), Q44 (148), Q28 (142), and Q76 (127). There were 407 transfers between the Q76 and the F train at the Jamaica‐179th Street Station on an average weekday.
5,000
5,500
6,000
6,500
7,000
7,500
2009 2010 2011 2012 2013 2014
Average Weekday
0
500
1,000
1,500
2,000
2,500
2009 2010 2011 2012 2013 2014
Average Saturday
0
500
1000
1500
2000
2500
2009 2010 2011 2012 2013 2014
Average Sunday
Q76 – Service Details Weekday Saturday Sunday
Span 5:00AM – 11:05PM 5:25AM – 10:25PM 6:25AM – 10:25PM
Frequency (in minutes)
Peak: AM ‐ 11/PM ‐ 14Off‐Peak: Noon ‐ 17/Eve ‐ 20
Overnight: N/A
Day: 30Overnight: N/A
Day: 30Overnight: N/A
Average Daily Ridership (2014) 5,711 2,066 1,403
Q76 ‐ Northbound Ons Offs
165th St Terminal & 165th St Terminal Bay 3 347 0
Hillside Av & 168th Pl 322 12
Francis Lewis Bl & Union Tpk 184 124
Hillside Av & 178th St 208 59
Hillside Av & 202nd St 117 121
Q76 ‐ Southbound Ons Offs
Hillside Av & 179th St Subway 39 752
165th St & 165th St Terminal 0 549
Francis Lewis Bl & Union Tpk 115 182
Francis Lewis Bl & Northern Bl 198 72
Francis Lewis Bl & Hillside Av 84 167

, Metropolitan Transportation Authority
B‐28
Q88 ‐ Horace Harding Expwy/73 Av/Springfield Blvd The Q88 operates between the Woodhaven Boulevard M and R Station in Elmhurst and Jamaica Avenue/
Springfield Boulevard, Queens Village LIRR Station, in Queens Village.
Neighborhoods Served: Queens Village, Oakland Gardens, Fresh Meadows, Utopia, and Elmhurst.
Service Details and Ridership:
Ridership History: Between 2009 and 2014, there was a 1.5 percent decrease in average weekday ridership, a 1.3 percent increase in average Saturday ridership, and a 13.2 percent increase in average Sunday ridership on the route.
Bus Stops: Below is a list of the five highest ridership bus stops by direction for the route on an average weekday.
Transfers: On an average weekday, the most popular bus transfers for the route were between the Q88 and the Q30 (307), Q17 (259), Q27 (225), Q58 (211), and Q46 (196). There were 779 transfers between the Q88 and the M and R trains at Woodhaven Boulevard Station.
10,000
10,300
10,600
10,900
11,200
11,500
2009 2010 2011 2012 2013 2014
Average Weekday
5,000
5,300
5,600
5,900
6,200
6,500
2009 2010 2011 2012 2013 2014
Average Saturday
2,500
2,800
3,100
3,400
3,700
4,000
2009 2010 2011 2012 2013 2014
Average Sunday
Q88 – Service Details Weekday Saturday Sunday
Span 5:35AM – 12:15AM 6:15AM – 11:15PM 8:30AM – 10:45PM
Frequency (in minutes)
Peak: AM – 3.5/PM ‐ 6Off‐Peak: Noon ‐ 11/Eve ‐ 15
Overnight: N/A
Day: 12Overnight: N/A
Day: 27Overnight: N/A
Average Daily Ridership (2014) 10,695 5,534 3,588
Q88 ‐ Eastbound Ons Offs
92nd St & 59th Av 2,381 0
Junction Bl & 59th Av 725 110
Horace Harding Exp & 164th St 223 380
Horace Harding Exp & Utopia Pky 65 496
Horace Harding Exp & Reeves Av 158 380
Q88 ‐Westbound Ons Offs
92nd St & 59th Av 0 2,945
Horace Harding Exp & Kissena Bl 609 332
Horace Harding Exp & Junction Bl 96 782
Horace Harding Exp & 108th St 198 418
Horace Harding Exp & Main St 358 216

, Metropolitan Transportation Authority
B‐29
QM1 ‐ Fresh Meadows/Midtown The QM1 is an express route that operates between Midtown and Fresh Meadows. The route operates on weekdays only. In Queens, the route makes stops primarily on Union Turnpike and 188th Street.
Neighborhoods Served: Kew Gardens Hills, Briarwood, Hillcrest, Jamaica Hills, Jamaica Estates, Fresh Meadows and Midtown Manhattan.
Service Details and Ridership:
Ridership History: Between 2009 and 2014, there was a 57.8 percent decrease in average weekday ridership on the route. To note, the QM1/1A was split in June 2010 into the QM1, QM5, QM6, QM7 and QM8.
Bus Stops: Below is a list of the five highest ridership bus stops by direction for the route on an average weekday.
Transfers: Transfers occur among the Union Turnpike express bus routes: the QM1, QM5, QM6, QM7, and QM8. These routes were previously all labeled QM1/1A. Customers sometimes board the first bus that they see and then transfer at a location along Union Turnpike traveled by the other routes.
400
800
1,200
1,600
2011 2012 2013 2014
Average Weekday
QM1 ‐ Service Details Weekday Saturday Sunday
Span 6:10AM ‐ 11:19PM N/A N/A
Frequency (in minutes)
Peak: AM ‐ 12/PM ‐ 15Off‐Peak: Noon ‐ 30/Eve ‐ 24
Overnight: N/A
Day: N/AOvernight: N/A
Day: N/AOvernight: N/A
Average Daily Ridership (2014) 626 N/A N/A
QM1 ‐ Eastbound Ons Offs
E 57th St & Lexington Av 33 8
188th St & 64th Av 0 39
Union Tpk & Utopia Pky 1 37
6th Av & W 37th St 36 0
3rd Av & E 44th St 31 0
QM1 ‐Westbound Ons Offs
188th St & 64th Av 90 0
E 34th St & Park Av 0 81
Union Tpk & 188th St 47 6
Union Tpk & Utopia Pky 45 1
188th St & 73rd Av 44 1

, Metropolitan Transportation Authority
B‐30
QM2 ‐ Bay Terrace/Midtown The QM2 is an express route that operates between Midtown Manhattan and Bay Terrace. In Queens, the QM2 travels primarily on Whitestone Expressway, Cross Island Parkway, 164th Street, and Bell Boulevard.
Neighborhoods Served: Bay Terrace, Beechhurst, Whitestone, Linden Hill and Midtown Manhattan.
Service Details and Ridership:
Ridership History: Between 2009 and 2014, there was a 0.1 percent increase in average weekday ridership, a 9.8 percent increase in average Saturday ridership, and an 18.0 percent increase in average Sunday ridership on the route.
Bus Stops: Below is a list of the five highest ridership bus stops by direction for the route on an average weekday.
Transfers: The QM2 has many transfers from the morning inbound buses to buses and subways headed downtown.
1,900
1,920
1,940
1,960
1,980
2,000
2009 2010 2011 2012 2013 2014
Average Weekday
340
360
380
400
420
440
2009 2010 2011 2012 2013 2014
Average Saturday
200
220
240
260
280
300
2009 2010 2011 2012 2013 2014
Average Sunday
QM2 ‐ Service Details Weekday Saturday Sunday
Span 5:45AM – 12:00AM 6:40AM ‐ 12:10AM 7:40AM ‐ 11:10PM
Frequency (in minutes)
Peak: AM ‐ 12/PM ‐ 15Off‐Peak: Noon ‐ 30/Eve ‐ 24
Overnight: N/A
Day: 60Overnight: N/A
Day: 60Overnight: N/A
Average Daily Ridership (2014) 1,922 417 269
QM2 ‐ Eastbound Ons Offs
E 57th St & Lexington Av 133 63
6th Av & W 35th St 150 0
Powells Cove Bl & 162nd St 1 131
14th Av & 147th St 0 110
160th St & Cross Island Pky 0 106
QM2 ‐Westbound Ons Offs
E. 34th St & Park Av 4 183
Powells Cove Bl & 162nd St 155 1
Cross Island Pky & 160th St 141 1
3rd Av & E 44th St 1 124
14th Av & 147th St 122 2

, Metropolitan Transportation Authority
B‐31
QM3 ‐ Little Neck/Midtown The QM3 is an express route that operates between Midtown Manhattan and Little Neck. The route operates on weekdays during peak hours in the peak direction of travel only. In Queens, the QM3 makes stops primarily on Northern Boulevard and Little Neck Parkway.
Neighborhoods Served: Little Neck, Douglaston, Bayside, Auburndale, Flushing and Midtown Manhattan.
Service Details and Ridership:
Ridership History: Between 2009 and 2014, there was a 4.0 percent increase in average weekday ridership on the route.
Bus Stops: Below is a list of the five highest ridership bus stops by direction for the route on an average weekday.
Transfers: The QM3 is an express route that is used primarily as a single‐seat ride and does not have a significant number of transfers.
120
130
140
150
160
2009 2010 2011 2012 2013 2014
Average Weekday
QM3 ‐ Service Details Weekday Saturday Sunday
Span 6:40AM ‐ 7:40AM/5:05PM ‐ 6:05PM N/A N/A
Frequency (in minutes)
Peak: AM ‐ 30/PM ‐ 30Off‐Peak: Noon ‐ N/A / Eve ‐ N/A
Overnight: N/A
Day: N/AOvernight: N/A
Day: N/AOvernight: N/A
Average Daily Ridership (2014) 133 N/A N/A
QM3 ‐ Eastbound Ons Offs
6th Av & W 48th St 10 0
E 57th St & Madison Av 10 0
6th Av & W 55th St 9 0
Northern Bl & 159th St 0 5
6th Av & W 44th St 5 0
QM3 ‐Westbound Ons Offs
E 34th St & Park Av 0 23
6th Av & W 41st St 0 14
6th Av & W 48th St 0 10
E 57th St & Madison Av 1 9
Northern Bl & 161st St 8 0

, Metropolitan Transportation Authority
B‐32
QM4 ‐ Electchester/Midtown The QM4 is an express route that operates between Midtown Manhattan and Electchester. Select trips operate via 3rd Avenue in Manhattan during peak periods. In Queens, the route makes stop along Jewel Avenue and 164th Street, primarily.
Neighborhoods Served: Kew Gardens Hills, Electchester, Pomonock and Midtown Manhattan.
Service Details and Ridership:
Ridership History: Between 2009 and 2014, there was a 19.1 percent decrease in average weekday ridership, a 6.4 percent decrease in average Saturday ridership, and a 1.4 percent decrease in average Sunday ridership on the route.
Bus Stops: Below is a list of the five highest ridership bus stops by direction for the route on an average weekday.
Transfers: The QM4 is an express route that is used primarily as a single‐seat ride and does not have a significant number of transfers.
750
800
850
900
950
1,000
1,050
2009 2010 2011 2012 2013 2014
Average Weekday
-
50
100
150
200
250
300
2009 2010 2011 2012 2013 2014
Average Saturday
-
50
100
150
200
250
300
2009 2010 2011 2012 2013 2014
Average Sunday
QM4 ‐ Service Details Weekday Saturday Sunday
Span 5:45AM – 11:50PM 7:10AM – 11:40PM 8:10AM – 10:40PM
Frequency (in minutes)
Peak: AM ‐ 20/PM ‐ 30Off‐Peak: Noon ‐ 60/Eve ‐ 60
Overnight: N/A
Day: 60Overnight: 60
Day: 60Overnight: 60
Average Daily Ridership (2014) 813 145 99
QM4 ‐ Eastbound Ons Offs
6th Av & W 36th St 55 0
164th St & Horace Harding Exp 0 40
E 57th St & 3rd Av 33 3
Jewel Av & Kissena Bl 0 33
6th Av & W. 48th St 30 0
QM4 ‐Westbound Ons Offs
E 34th St & Park Av 0 91
164th St & Horace Harding Exp 67 0
Jewel Av & Main St 60 3
164th St & 69th Av 63 0
Jewel Av & Parsons Bl 62 1

, Metropolitan Transportation Authority
B‐33
QM5 ‐ Glen Oaks/Midtown The QM5 is an express route that operates between Midtown Manhattan and Glen Oaks. During peak hours, select trips operate via 3rd Avenue in Manhattan. In Queens, the QM5 primarily makes stops along Union Turnpike, 73rd Avenue, Horace Harding Parkway, and Little Neck Parkway.
Neighborhoods Served: Kew Gardens Hills, Briarwood, Hillcrest, Jamaica Hills, Jamaica Estates, Fresh Meadows, Oakland Gardens, Douglaston, Glen Oaks and Midtown Manhattan.
Service Details and Ridership:
Ridership History: Service on this route was implemented in June. Between 2010 and 2014, average weekday ridership increased by 88.3 percent, average Saturday ridership increased by 165.1 percent, and average Sunday ridership increased by 157.1 percent on the route.
Bus Stops: Below is a list of the five highest ridership bus stops by direction for the route on an average weekday. Eastbound bus stop boarding and alighting data was not available for this route.
*dataset from ORCA reports from May 2014 missing some data
Transfers: Transfers occur among the Union Turnpike express bus routes: the QM1, QM5, QM6, QM7, and QM8. These routes were previously all labeled QM1/1A.
1,900
1,950
2,000
2,050
2,100
2011 2012 2013 2014
Average Weekday
-
100
200
300
400
500
2011 2012 2013 2014
Average Saturday
-
100
200
300
400
500
2011 2012 2013 2014
Average Sunday
QM5 ‐ Service Details Weekday Saturday Sunday
Span 5:30AM – 12:00AM 6:30AM – 12:00AM 7:30AM – 11:00PM
Frequency (in minutes)
Peak: AM ‐ 12/PM ‐ 12Off‐Peak: Noon ‐ 30/Eve ‐ 24
Overnight: N/A
Day: 60Overnight: 60
Day: 60Overnight: 60
Average Daily Ridership (2014) 2,071 376 246
QM5 ‐ Eastbound Ons Offs
N/A*
N/A*
N/A*
N/A*
N/A*
QM5 ‐Westbound Ons Offs
E 34th St & Park Av 0 240
W 34th St & 5th Av 0 127
3rd Av & E. 44th St 0 121
E 57th St & Lexington Av 0 117
Union Tpk & 188th St 62 36

, Metropolitan Transportation Authority
B‐34
QM6 ‐ Lake Success/Midtown The QM6 is an express route that operates between Midtown Manhattan and North Shore Towers in Lake Success. During peak hours, select trips operate via 3rd Avenue in Manhattan. In Queens, the QM6 primarily makes stops along Union Turnpike.
Neighborhoods Served: Kew Gardens Hills, Briarwood, Hillcrest, Jamaica Hills, Jamaica Estates, Oakland Gardens, Hollis Hills, Bellerose, Lake Success, and Midtown Manhattan.
Service Details and Ridership:
Ridership History: Service on this route was implemented in June 2010. Between 2010 and 2014, average weekday ridership increased by 123.9 percent, average Saturday ridership increased by 125.6 percent, and average Sunday ridership increased by 144.5 percent on the route.
Bus Stops: Below is a list of the five highest ridership bus stops by direction for the route on an average weekday. Eastbound bus stop boarding and alighting data was not available for this route.
*dataset from ORCA reports from May 2014 missing some data
Transfers: Transfers occur among the Union Turnpike express bus routes: the QM1, QM5, QM6, QM7, and QM8. These routes were previously all labeled QM1/1A.
900
1,200
2011 2012 2013 2014
Average Weekday
-
100
200
300
400
2011 2012 2013 2014
Average Saturday
-
100
200
300
400
2011 2012 2013 2014
Average Sunday
QM6 ‐ Service Details Weekday Saturday Sunday
Span 5:45AM – 12:30AM 7:00AM – 11:30PM 8:00AM – 10:30PM
Frequency (in minutes)
Peak: AM ‐ 15/PM ‐ 26Off‐Peak: Noon ‐ 60/Eve ‐ 40
Overnight: N/A
Day: 60Overnight: 60
Day: 60Overnight: 60
Average Daily Ridership (2014) 1,115 267 190
QM6 ‐ Eastbound Ons Offs
N/A*
N/A*
N/A*
N/A*
N/A*
QM6 ‐Westbound Ons Offs
E 34th St & Park Av 2 171
E 57th St & Lexington Av 0 96
W 34th St & 5th Av 3 83
Union Tpk & 188th St 39 27
E 34th St & 3rd Av 1 63

, Metropolitan Transportation Authority
B‐35
QM7 ‐ Fresh Meadows/Downtown The QM7 is an express route that operates between Downtown Manhattan and Fresh Meadows. The route operates on weekdays during peak hours and in the peak direction of travel only. In Queens, the QM7 makes stops primarily along Union Turnpike and 188th Street.
Neighborhoods Served: Kew Gardens Hills, Briarwood, Hillcrest, Jamaica Hills, Jamaica Estates, Fresh Meadows and Downtown Manhattan.
Service Details and Ridership:
Ridership History: Service on this route was implemented in June 2010. Between 2010 and 2014, average weekday ridership increased by 90.5 percent on the route.
Bus Stops: Below is a list of the five highest ridership bus stops by direction for the route on an average weekday.
Transfers: Transfers occur among the Union Turnpike express bus routes: the QM1, QM5, QM6, QM7, and QM8. These routes were previously all labeled QM1/1A.
-
200
400
600
800
1,000
2011 2012 2013 2014
Average Weekday
QM7 ‐ Service Details Weekday Saturday Sunday
Span 6:00AM ‐ 9:20AM/2:15PM ‐ 7:15PM N/A N/A
Frequency (in minutes)
Peak: AM ‐ 10/PM ‐ 24Off‐Peak: Noon ‐ N/A / Eve ‐ N/A
Overnight: N/A
Day: N/AOvernight: N/A
Day: N/AOvernight: N/A
Average Daily Ridership (2014) 740 N/A N/A
QM7 ‐ Eastbound Ons Offs
Church St & Vesey St 45 0
Park Row & Beeekman St 42 0
Frankfort St & Pearl St 40 1
188th St & 64th Av 0 38
Union Tpk & 150th St 0 30
QM7 ‐Westbound Ons Offs
Church St & Vesey St 0 129
Park Row & Beekman St 0 103
Union Tpk & 188th St 84 11
Union Tpk & Utopia Pky 85 3
188th St & 64th Av 71 0

, Metropolitan Transportation Authority
B‐36
QM8 ‐ Glen Oaks/Downtown The QM8 is an express route that operates between Downtown Manhattan and Glen Oaks. The route operates on weekdays during peak hours and in the peak direction of travel only. In Queens, the QM8 makes stops primarily along Union Turnpike, 73rd Avenue, Horace Harding Parkway and Little Neck Parkway.
Neighborhoods Served: Kew Gardens Hills, Briarwood, Hillcrest, Jamaica Hills, Jamaica Estates, Fresh Meadows, Oakland Gardens, Douglaston, Glen Oaks and Downtown Manhattan.
Service Details and Ridership:
Ridership History: Service on this route was implemented in June 2010. Between 2010 and 2014, average weekday ridership increased by 115.5 percent on the route.
Bus Stops: Below is a list of the five highest ridership bus stops by direction for the route on an average weekday. Eastbound bus stop boarding and alighting data was not available for this route.
*dataset from ORCA reports from May 2014 missing some data
Transfers: Transfers occur among the Union Turnpike express bus routes: the QM1, QM5, QM6, QM7, and QM8. These routes were previously all labeled QM1/1A.
-
200
400
600
800
1,000
2011 2012 2013 2014
Average Weekday
QM8 ‐ Service Details Weekday Saturday Sunday
Span 5:57AM ‐ 7:37AM/4:35PM ‐ 7:30PM N/A N/A
Frequency (in minutes)
Peak: AM ‐ 10/PM ‐ 20 Off‐Peak: Noon ‐ N/A / Eve ‐ N/A
Overnight: N/A
Day: N/AOvernight: N/A
Day: N/AOvernight: N/A
Average Daily Ridership (2014) 632 N/A N/A
QM8 ‐ Eastbound Ons Offs
N/A*
N/A*
N/A*
N/A*
N/A*
QM8 ‐Westbound Ons Offs
Park Row & Beekman St 20 49
Frankfort St & Pearl St 0 31
260th St & Union Tpk 18 0
260th St & 73rd Av 16 1
Church St & Vesey St 0 15

, Metropolitan Transportation Authority
B‐37
QM20 ‐ Bay Terrace/Midtown via Clearview The QM20 is an express route that operates between Downtown Manhattan and Bay Terrace. The route operates on weekdays only. In Queens, the QM20 travels primarily on the Whitestone Expressway, Utopia Parkway, Willets Point Boulevard, and 26th Avenue.
Neighborhoods Served: Bay Terrace, Whitestone, Linden Hill and Midtown Manhattan.
Service Details and Ridership:
Ridership History: Service on this route was implemented in September 2011. Between 2011 and 2014, average weekday ridership increased by 0.4 percent on the route.
Bus Stops: Below is a list of the five highest ridership bus stops by direction for the route on an average weekday. Westbound bus stop boarding and alighting data was not available for this route.
*dataset from ORCA reports from May 2014 missing some data
Transfers: The QM20 has many transfers from the morning inbound buses to buses and subways headed downtown.
-
300
600
900
1,200
1,500
2011 2012 2013 2014
Average Weekday
QM20 ‐ Service Details Weekday Saturday Sunday
Span 5:45AM – 11:30PM N/A N/A
Frequency (in minutes)
Peak: AM ‐ 9/PM ‐ 14Off‐Peak: Noon ‐ 60/Eve ‐ 40
Overnight: N/A
Day: N/AOvernight: N/A
Day: N/AOvernight: N/A
Average Daily Ridership (2014) 1,123 N/A N/A
QM20 ‐ Eastbound Ons Offs
Union St & 26th Av 0 194
E 57th St & Lexington Av 93 88
6th Av & W 35th St 174 0
211th St & 18th Av 0 63
6th Av & W 48th St 61 1
QM20 ‐Westbound Ons Offs
N/A*
N/A*
N/A*
N/A*
N/A*

, Metropolitan Transportation Authority
B‐38
X68 ‐ Floral Park/Midtown Manhattan The X68 operates between 268th Street/Hillside Avenue in Floral Park and Midtown Manhattan on weekdays during peak periods only. During the morning peak period, trips operate from Floral Park to either East 23rd Street/1st Avenue, East 57th Street/3rd Avenue, or East 23rd Street/1st Avenue via East 57th Street/3rd Avenue. During the afternoon peak period, trips operate from East 23rd Street/1st Avenue via East 57th Street/3rd Avenue to Floral Park.
Neighborhoods Served: Floral Park, Queens Village, Jamaica Estates, Jamaica, Kew Gardens, and Midtown Manhattan.
Service Details and Ridership:
Ridership History: Between 2009 and 2014, the route saw an 8.2 percent decrease in average weekday ridership.
Bus Stops: Below is a list of the five highest ridership bus stops by direction for the route on an average weekday.
Transfers: The X68 is an express route that is used primarily as a single‐seat ride and does not have a significant number of transfers.
0
250
500
750
1,000
2009 2010 2011 2012 2013 2014
Average Weekdays
X68 – Service Details Weekday Saturday Sunday
Span 6:20AM ‐ 10:20AM/4:10PM ‐ 8:15PM N/A N/A
Frequency (in minutes)
Peak: AM ‐ 15/PM ‐ 15Off‐Peak: Noon – N/A / Eve – N/A
Overnight: N/A
Day: N/AOvernight: N/A
Day: N/AOvernight: N/A
Average Daily Ridership (2014) 598 N/A N/A
X68 ‐ Eastbound Ons Offs
Madison Av & E 42nd St 58 0
Madison Av & E 33rd St 51 0
Madison Av & E 48th St 41 1
Hillside Av & Springfield Bl 0 36
Madison Av & E 54th St 35 1
X68 ‐Westbound Ons Offs
Hillside Av & 179th St Subway 12 40
E 42nd St & Park Av 0 52
E 34th St & Park Av 0 40
Queens Bl & 78th Av 35 1
Hillside Av & Little Neck Pky 36 0

, Metropolitan Transportation Authority
C‐1
APPENDIX C – ADDITIONAL DATA Table C‐1. On‐Time Performance and Wait Assessment by Route Table C‐2. Bus Speeds by Route and Time Period Table C‐3. Bus Shelters in Northeast Queens by Route Table C‐4. “Not in Service” Buses by Route Table C‐5. Bus to Subway Transfers: Stations with >100 Transfers Table C‐6. Bus To Bus Transfers with >225 Transfers Table C‐7. Average Trip Length – NYCT Buses only Table C‐8. Q12 Origin‐Destination Matrix Table C‐9. Q17 Origin‐Destination Matrix Table C‐10. Q27 Origin‐Destination Matrix Table C‐11. Q43 Origin‐Destination Matrix Table C‐12. Q46 Origin‐Destination Matrix Table C‐13. Q88 Origin‐Destination Matrix Table C‐14. Origin‐Destination Matrix for Northeast Queens Table C‐15. Average Ridership by Time of Day Figure C‐1. Overnight Bus Boarding Figure C‐2. Overnight Bus Alighting Figure C‐3. Q12 Origin‐Destination Web Figure C‐4. Q17 Origin‐Destination Web Figure C‐5. Q27 Origin‐Destination Web Figure C‐6. Q43 Origin‐Destination Web Figure C‐7. Q46 Origin‐Destination Web Figure C‐8. Q88 Origin‐Destination Web

, Metropolitan Transportation Authority
C‐2
Performance Table C‐1. On‐Time Performance and Wait Assessment by Route
WEEKDAY SATURDAY SUNDAY
Route OTP WA OTP WA OTP WA
5 Borough Average 65.9% 79.2% 60.2% 80.2% 64.0% 81.4%Queens Average 67.8% 79.4% 63.3% 81.4% 67.5% 83.9%Northeast Queens Average 72.4% 82.7% 67.5% 83.5% 71.7% 85.9%
Q1 76% 87% 74% 85% 77% 89%Q12 78% 87% 79% 91% 78% 91%Q13 76% 85% 71% 88% 68% 90%Q15 82% 89% 76% 95% 80% 97%Q15A 85% 89% 81% 92% 89% 97%Q16 79% 86% 75% 91% 73% 88%Q17 64% 77% 63% 80% 72% 85%Q17 LTD 60% 71% NA NA NA NAQ19 72% 83% 78% 94% 88% 95%Q20A 77% 85% 70% 82% 74% 87%Q20B 79% 88% NA NA NA NAQ25 51% 75% 56% 79% 64% 79%Q25 LTD 44% 69% NA NA NA NAQ26 85% 86% NA NA NA NAQ27 76% 85% 71% 84% 75% 87%Q27 LTD 76% 81% NA NA NA NAQ28 80% 89% 72% 93% 79% 93%Q30 73% 81% 74% 87% 76% 87%Q31 77% 84% 77% 92% 74% 90%Q34 64% 81% NA NA NA NAQ36 81% 89% 79% 92% 81% 93%Q36 LTD 80% 81% NA NA NA NAQ43 78% 84% 78% 88% 74% 83%Q43 LTD 82% 85% NA NA NA NAQ44 73% 87% 50% 73% 57% 83%Q44 LTD 72% 82% 59% 79% 61% 80%Q46 77% 84% 80% 89% 78% 88%Q48 72% 85% 71% 88% 72% 88%Q50 LTD 73% 85% 62% 83% 65% 85%Q58 65% 85% 61% 80% 64% 81%Q58 LTD 61% 81% 60% 81% 64% 80%Q64 69% 80% 78% 95% 78% 93%Q65 75% 83% 72% 84% 76% 87%Q65 LTD 81% 84% NA NA NA NAQ66 70% 81% 37% 66% 68% 83%Q76 75% 81% 73% 86% 79% 93%Q88 70% 78% 63% 77% 66% 77%

, Metropolitan Transportation Authority
C‐3
Table C‐2. Bus Speeds by Route and Time Period
Route Service Type Time Period
Avg. Speed (Mph) Route
Service Type Time Period
Avg. Speed (Mph)
Q1 Local Mid to 6am 12.8 Q36 Local 7pm to Mid 10.6Q1 Local 6am to 10am 11.3 Q36 LTD 6am to 10am 10.6Q1 Local 10am to 3pm 9.9 Q36 LTD 3pm to 7pm 10amQ1 Local 3pm to 7pm 8.6 Q43 Local Mid to 6am 12.9Q1 Local 7pm to Mid 9.9 Q43 Local 6am to 10am 11.7Q12 Local 6am to 10am 8.4 Q43 Local 10am to 3pm 10.6Q12 Local 10am to 3pm 8.7 Q43 Local 3pm to 7pm 8.7Q12 Local 3pm to 7pm 8.4 Q43 Local 7pm to Mid 10.9Q12 Local 7pm to Mid 9.1 Q43 LTD 6am to 10am 12.7Q13 Local 6am to 10am 8.6 Q43 LTD 3pm to 7pm 10.4Q13 Local 7pm to Mid 9.9 Q43 LTD 7pm to Mid 10.1Q16 Local 3pm to 7pm 11.2 Q44 Local Mid to 6am 12.9Q20A Local 6am to 10am 7.4 Q44 Local 7pm to Mid 11.5Q20A Local 10am to 3pm 6.5 Q44 LTD Mid to 6am 10.5Q20A Local 3pm to 7pm 6.5 Q44 LTD 6am to 10am 9.1Q20A Local 7pm to Mid 8.2 Q44 LTD 10am to 3pm 9Q20B Local 6am to 10am 7.2 Q44 LTD 3pm to 7pm 8.4Q20B Local 10am to 3pm 6.9 Q44 LTD 7pm to Mid 10.5Q20B Local 3pm to 7pm 6.2 Q46 Local Mid to 6am 16.4Q20B Local 7pm to Mid 8.5 Q46 Local 6am to 10am 12Q25 Local Mid to 6am 10.2 Q46 Local 10am to 3pm 11.4Q25 Local 6am to 10am 7.3 Q46 Local 3pm to 7pm 10.7Q25 Local 10am to 3pm 7.1 Q46 Local 7pm to Mid 13.3Q25 Local 3pm to 7pm 6.9 Q46 LTD 6am to 10am 13.2Q25 Local 7pm to Mid 8 Q46 LTD 3pm to 7pm 12.4Q25 LTD 6am to 10am 8.2 Q46 LTD 7pm to Mid 13.2Q25 LTD 3pm to 7pm 7.6 Q48 Local Mid to 6am 14.3Q26 Local 6am to 10am 8.9 Q48 Local 6am to 10am 11.6Q26 Local 3pm to 7pm 8.8 Q48 Local 3pm to 7pm 9.5Q27 Local Mid to 6am 13.6 Q58 Local Mid to 6am 10.5Q27 Local 6am to 10am 9 Q58 Local 6am to 10am 7.3Q27 Local 10am to 3pm 9.5 Q58 Local 10am to 3pm 6.8Q27 Local 3pm to 7pm 9.4 Q58 Local 3pm to 7pm 6.4Q27 Local 7pm to Mid 11.1 Q58 Local 7pm to Mid 8.6Q27 LTD 6am to 10am 10am Q58 LTD 6am to 10am 8.7Q27 LTD 3pm to 7pm 10.4 Q58 LTD 10am to 3pm 8.3Q27 LTD 7pm to Mid 11.1 Q58 LTD 3pm to 7pm 7.7Q28 Local Mid to 6am 12.6 Q65 Local Mid to 6am 10.5Q28 Local 6am to 10am 9.3 Q65 Local 6am to 10am 7.6Q28 Local 10am to 3pm 9 Q65 Local 10am to 3pm 7.2Q28 Local 3pm to 7pm 9.2 Q65 Local 3pm to 7pm 7.6Q28 Local 7pm to Mid 10.5 Q65 Local 7pm to Mid 8.9Q31 Local 6am to 10am 9.5 Q65 LTD 6am to 10am 8.3Q31 Local 10am to 3pm 8.6 Q65 LTD 3pm to 7pm 8Q31 Local 7pm to Mid 10.7 Q66 Local Mid to 6am 10.7Q32 Local 6am to 10am 6.3 Q66 Local 6am to 10am 8.2Q32 Local 10am to 3pm 5.8 Q66 Local 10am to 3pm 7.6Q32 Local 3pm to 7pm 5.5 Q66 Local 3pm to 7pm 7.8

, Metropolitan Transportation Authority
C‐4
Q32 Local 7pm to Mid 7.9 Q66 Local 7pm to Mid 8.5Q34 Local 6am to 10am 8.6 Q76 Local 6am to 10am 11.1Q34 Local 10am to 3pm 7 Q76 Local 10am to 3pm 10.5Q34 Local 3pm to 7pm 6.8 Q76 Local 3pm to 7pm 10.7Q34 Local 7pm to Mid 7.9 Q76 Local 7pm to Mid 12.2Q36 Local Mid to 6am 13.4 Q88 Local 6am to 10am 11.5Q36 Local 6am to 10am 9.9 Q88 Local 10am to 3pm 11.1Q36 Local 10am to 3pm 9.9 Q88 Local 3pm to 7pm 10.8Q36 Local 3pm to 7pm 9 Q88 Local 7pm to Mid 13.3
Table C‐3. Bus Shelters in Northeast Queens by Route Bus Stop Shelters
By Route Number Of Shelters
Number Of Bus Stops
Percent Of Bus Stops With Bus Shelter
Q12 19 84 22.6%Q13 25 94 26.6%Q15 11 62 17.7%Q15A 8 67 11.9%Q16 19 92 20.7%Q17 31 103 30.1%Q19 7 59 11.9%Q20A/B 43 144 29.9%Q25 37 113 32.7%Q26 7 54 13.0%Q27 28 150 18.7%Q28 20 75 26.7%Q30 26 115 22.6%Q31 17 124 13.7%Q34 43 97 44.3%Q36 23 137 16.8%Q42 29 98 29.6%Q44 47 139 33.8%Q46 40 114 35.1%Q48 9 55 16.4%Q50 25 56 44.6%Q58 36 115 31.3%Q64 10 36 27.8%Q65 29 111 26.1%Q66 32 83 38.6%Q76 27 129 20.9%Q88 32 130 24.6%QM1 19 47 40.4%QM2 21 57 36.8%QM3 21 55 38.2%QM4 15 53 28.3%QM5 29 94 30.9%QM6 26 69 37.7%QM7 19 49 38.8%QM8 29 94 30.9%QM20 23 57 40.4%X68 14 41 34.1%
Source: DOT Bus Stops with Active Shelters, October 2014

, Metropolitan Transportation Authority
C‐5
Table C‐4. “Not in Service” Buses by Route Route WEEKDAY SUNDAY SATURDAY
Q1 1.4% 2.8% 1.1% Q12 1.4% 0.4% 1.0% Q13 1.7% 3.1% 4.0% Q15 0.7% 0.1% 3.6% Q15A 1.0% 0.0% 3.7% Q16 1.4% 0.7% 3.9% Q17 3.1% 1.1% 1.0% Q19 1.0% 0.5% 0.1% Q20A 1.0% 0.3% 1.5% Q20B 0.9% Q25 2.5% 2.1% 1.0% Q26 0.9% Q27 2.4% 1.5% 0.8% Q28 1.8% 1.1% 0.4% Q30 2.5% 0.9% 0.8% Q31 2.0% 0.7% 0.3% Q34 1.9% Q36 1.3% 0.8% 0.4% Q43 2.2% 1.3% 0.4% Q44 2.4% 5.1% 5.7% Q46 2.4% 1.1% 0.4% Q48 1.1% 1.8% 3.1% Q50 1.1% 0.9% 0.2% Q58 0.9% 1.8% 1.6% Q64 4.0% 2.4% 0.2% Q65 1.5% 0.5% 1.0% Q66 1.9% 0.9% 2.9% Q76 2.4% 0.5% 1.2% Q88 3.6% 3.4% 1.5%

, Metropolitan Transportation Authority
C‐6
Ridership Figure C‐1. Overnight Bus Boarding
Figure C‐2. Overnight Bus Alighting

, Metropolitan Transportation Authority
C‐7
Table C‐5. Bus to Subway Transfers: Stations with >100 Transfers
Subway Station Weekday NE Queens Bus Route To Subway Transfers
Flushing‐Main St (7) 26,919 Kew Gardens‐Union Turnpike (E,F) 5,965 Jamaica‐179 St (F) 5,932 Forest Hills‐71 Av (E,F,M,R) 3,992 Grand Av‐Newtown (M,R) 3,722 Jamaica Center‐Parsons‐Archer (E,J,Z) 1,670 169 St (F) 1,387 Sutphin Blvd‐Archer Av‐JFK Airport (E,J,Z) 1,277 Northern Blvd (M,R) 1,220 Woodhaven Blvd (M,R) 831 Parsons Blvd (F) 782 Parkchester (6) 747 Myrtle‐Wyckoff Avs (L,M) 551 Pelham Bay Park (6) 481 Astoria Blvd (N,Q) 406 21 St‐Queensbridge (F) 260 Queens Plaza (E,M,R) 242 West Farms Sq‐East Tremont Av (2,5) 242 111 St (7) 230 Fresh Pond Rd (M) 210 East 180 St (2,5) 180 Sutphin Blvd (F) 170 Briarwood‐Van Wyck Blvd (E,F) 140 103 St‐Corona Plaza (7) 123
Table C‐6. Bus To Bus Transfers with >225 Transfers 1st Bus 2nd Bus Weekday Transfers Within NE Queens
Q46 Q27 961 TrueQ27 Q46 945 TrueQ44 Q20A 676 TrueQ27 Q43 589 TrueQ20A Q44 552 TrueQ43 Q27 513 TrueQ53 Q58 395 FalseQ17 Q46 387 TrueBX9 Q44 380 FalseQ23 Q58 367 FalseBX12 Q50 360 FalseQ46 Q17 359 TrueQ58 Q23 358 FalseQ44 Q46 352 TrueQ58 Q53 345 FalseQ44 Bx9 340 FalseQ31 Q27 338 TrueQ50 Bx12 338 FalseBX36 Q44 317 False

, Metropolitan Transportation Authority
C‐8
Q17 Q30 317 TrueQ46 Q10 316 FalseQ30 Q27 314 TrueQ17 Q88 313 TrueQ46 Q44 312 TrueQ88 Q30 306 TrueQ30 Q17 305 TrueQ88 Q17 303 TrueQ44 Bx36 302 FalseQ59 Q58 301 FalseQ17 Q25 300 TrueQ34 Q25 299 TrueQ10 Q46 297 FalseQ27 Q88 296 TrueQ44 Bx39 295 FalseQ17 Q65 288 TrueQ58 Q59 286 FalseQ27 Q58 285 TrueQ77 Q27 285 FalseQ30 Q88 283 TrueQ58 Q27 282 TrueQ58 Q44 282 TrueQ27 Q30 276 TrueQ27 Q25 275 TrueQ27 Q77 273 FalseQ44 Q58 273 TrueQ25 Q34 272 TrueQ30 Q46 271 TrueQ66 Q44 267 TrueQ25 Q17 265 TrueQ27 Q4 263 FalseQ25 Q27 260 TrueQ65 Q17 260 TrueQ27 Q31 259 TrueQ46 Q65 259 TrueQ58 Q88 259 TrueQ44 Q27 256 TrueQ88 Q27 254 TrueQ46 Q30 253 TrueQ60 Q58 251 FalseQ44 Bx22 243 FalseQ44 Q66 243 TrueQ46 Q88 243 TrueQ27 Q65 242 TrueQ58 Q60 242 FalseQ76 Q46 235 TrueQ4 Q27 233 FalseQ28 Q13 232 TrueQ43 Q111 232 FalseQ88 Q58 232 TrueQ25 Q65 232 TrueQ27 Q44 231 TrueQ65 Q27 227 True

, Metropolitan Transportation Authority
C‐9
Q46 Q20A 226 True
Origins and Destinations
Table C‐7. Average Trip Length – NYCT Buses only Route Weekday Average Trip Length
Q1 4.71 Q12 2.14 Q13 2.28 Q15 2.56 Q16 2.54 Q17 2.51 Q17LTD 3.46 Q20A 2.46 Q20B 1.55 Q26 1.79 Q27 3.17 Q27LTD 4.91 Q28 2.21 Q30 3.28 Q31 3.31 Q36 2.81 Q36LTD 2.48 Q43 2.58 Q43LTD 2.41 Q44 3.44 Q44LTD 3.64 Q46 2.70 Q46LTD 3.71 Q48 2.66 Q58 2.26 Q58LTD 2.44 Q76 3.30 Q88 3.42

, Metropolitan Transportation Authority
C‐10
Table C‐8. Q12 Origin‐Destination Matrix
Neighborhood Origin Or Destination
Auburn‐dale
Bayside‐Bayside Hills
Douglaston‐Little Neck
East Flushing Flushing
Murray Hill
Grand Total
Auburndale 18 136 91 92 701 25 1063
Bayside‐Bayside Hills 202 428 168 1157 174 2129
Douglaston‐Little Neck 76 110 660 108 954
East Flushing 85 1903 1988
Flushing 1297 182 1478
Murray Hill 82 82
Grand Total 18 339 594 455 5717 572 7695
Figure C‐3. Q12 Origin‐Destination Web

, Metropolitan Transportation Authority
C‐11
Table C‐9. Q17 Origin‐Destination Matrix
Neighborhood Origin or
Destination Auburn‐dale
Briarwood‐Jamaica Hills
East Flushing Flushing
Fresh Meadows‐Utopia
Jamaica Estates‐Hollis‐wood
Pomonok‐Flushing Heights‐Hillcrest
Queens‐boro Hill
Grand Total
Auburndale 13 28 82 713 40 117 202 1196
Briarwood‐Jamaica Hills
113 17 435 435 497 67 83 1647
East Flushing 23 770 59 113 151 1116
Flushing 3411 2433 2035 1184 2809 11873
Fresh Meadows‐Utopia
212 1542 326 353 2432
Jamaica Estates‐Holliswood
1086 269 502 1858
Pomonok‐Flushing Heights‐Hillcrest
60 81 142
Queensboro Hill 138 138
Grand Total 13 141 122 5329 3180 5391 1907 4319 20402
Figure C‐4. Q17 Origin‐Destination Web

, Metropolitan Transportation Authority
C‐12
Table C‐10. Q27 Origin‐Destination Matrix
Neighborhood Origin Or Destination Auburndale
Bayside‐Bayside Hills Bellerose
East Flushing Flushing
Oakland Gardens
Queens Village
Grand Total
Auburndale 30 130 19 163 1153 209 122 1826
Bayside‐Bayside Hills 300 88 480 4295 954 1232 7349
Bellerose 8 29 228 335 599 1199
East Flushing 165 2741 574 246 3726
Flushing 2521 5351 1849 9722
Oakland Gardens 927 3287 4214
Queens Village 2335 2335
Grand Total 30 430 115 837 10938 8351 9670 30371
Figure C‐5. Origin‐Destination Web